Zip Codes with the Highest Percentage of Population Employed in Agriculture, Fishing & Hunting in Hammond, LA
RELATED REPORTS & OPTIONS
Agriculture, Fishing & Hunting
Hammond
Compare Zip Codes
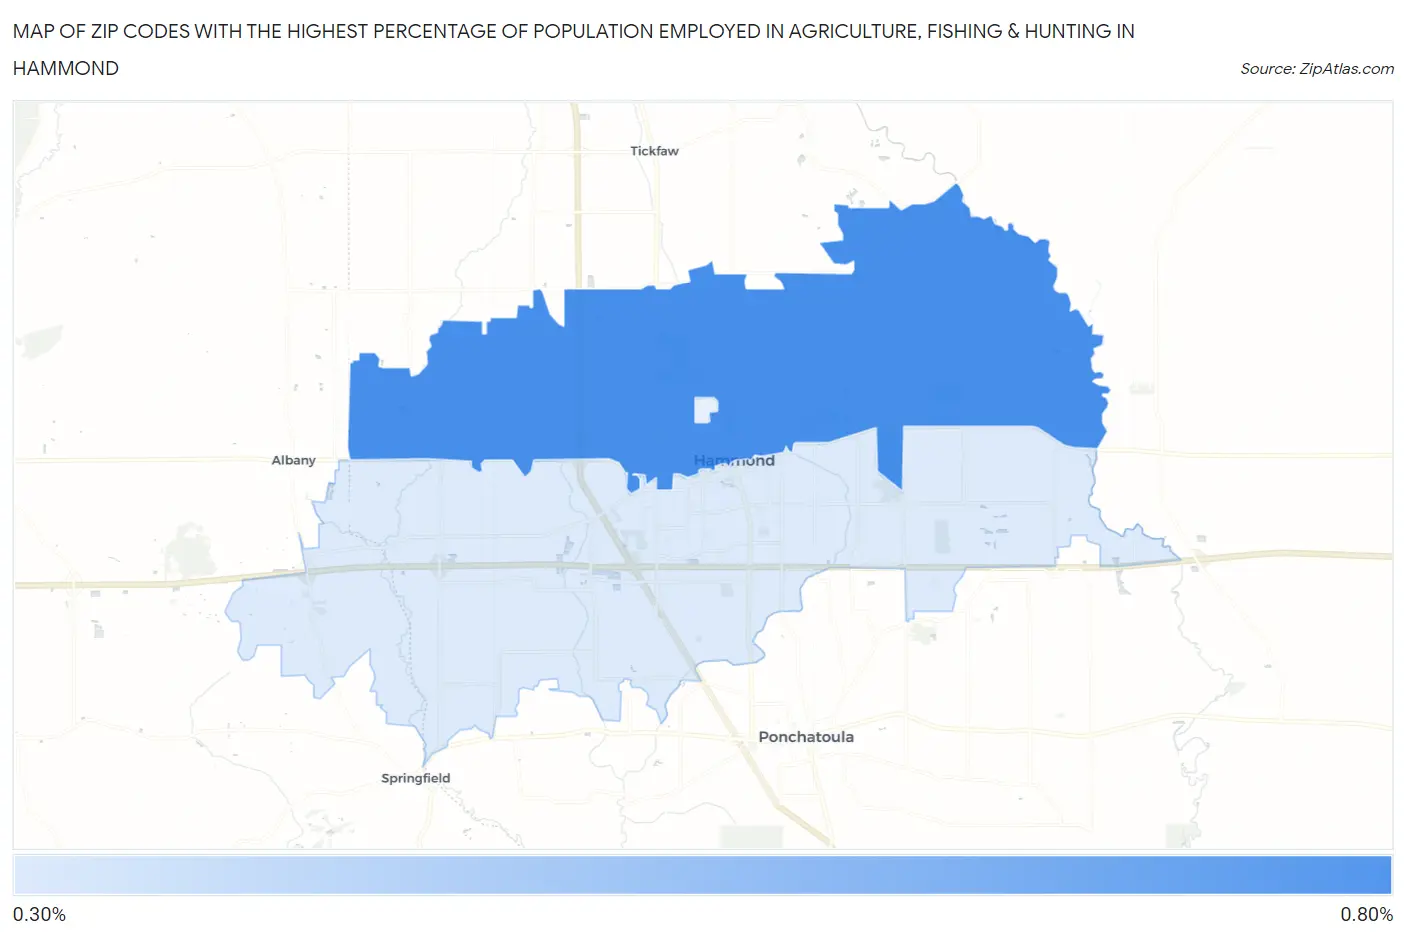
Map of Zip Codes with the Highest Percentage of Population Employed in Agriculture, Fishing & Hunting in Hammond
0.0%
0.80%
Zip Codes with the Highest Percentage of Population Employed in Agriculture, Fishing & Hunting in Hammond, LA
| Zip Code | % Employed | vs State | vs National | |
| 1. | 70401 | 0.67% | 1.0%(-0.335)#242 | 1.2%(-0.524)#17,992 |
| 2. | 70403 | 0.34% | 1.0%(-0.668)#293 | 1.2%(-0.857)#20,726 |
1
Common Questions
What are the Top Zip Codes with the Highest Percentage of Population Employed in Agriculture, Fishing & Hunting in Hammond, LA?
Top Zip Codes with the Highest Percentage of Population Employed in Agriculture, Fishing & Hunting in Hammond, LA are:
What zip code has the Highest Percentage of Population Employed in Agriculture, Fishing & Hunting in Hammond, LA?
70401 has the Highest Percentage of Population Employed in Agriculture, Fishing & Hunting in Hammond, LA with 0.67%.
What is the Percentage of Population Employed in Agriculture, Fishing & Hunting in Hammond, LA?
Percentage of Population Employed in Agriculture, Fishing & Hunting in Hammond is 0.89%.
What is the Percentage of Population Employed in Agriculture, Fishing & Hunting in Louisiana?
Percentage of Population Employed in Agriculture, Fishing & Hunting in Louisiana is 1.0%.
What is the Percentage of Population Employed in Agriculture, Fishing & Hunting in the United States?
Percentage of Population Employed in Agriculture, Fishing & Hunting in the United States is 1.2%.