Zip Codes with the Highest Percentage of Immigrants from Burma / Myanmar in Owensboro, KY
RELATED REPORTS & OPTIONS
Burma / Myanmar
Owensboro
Compare Zip Codes
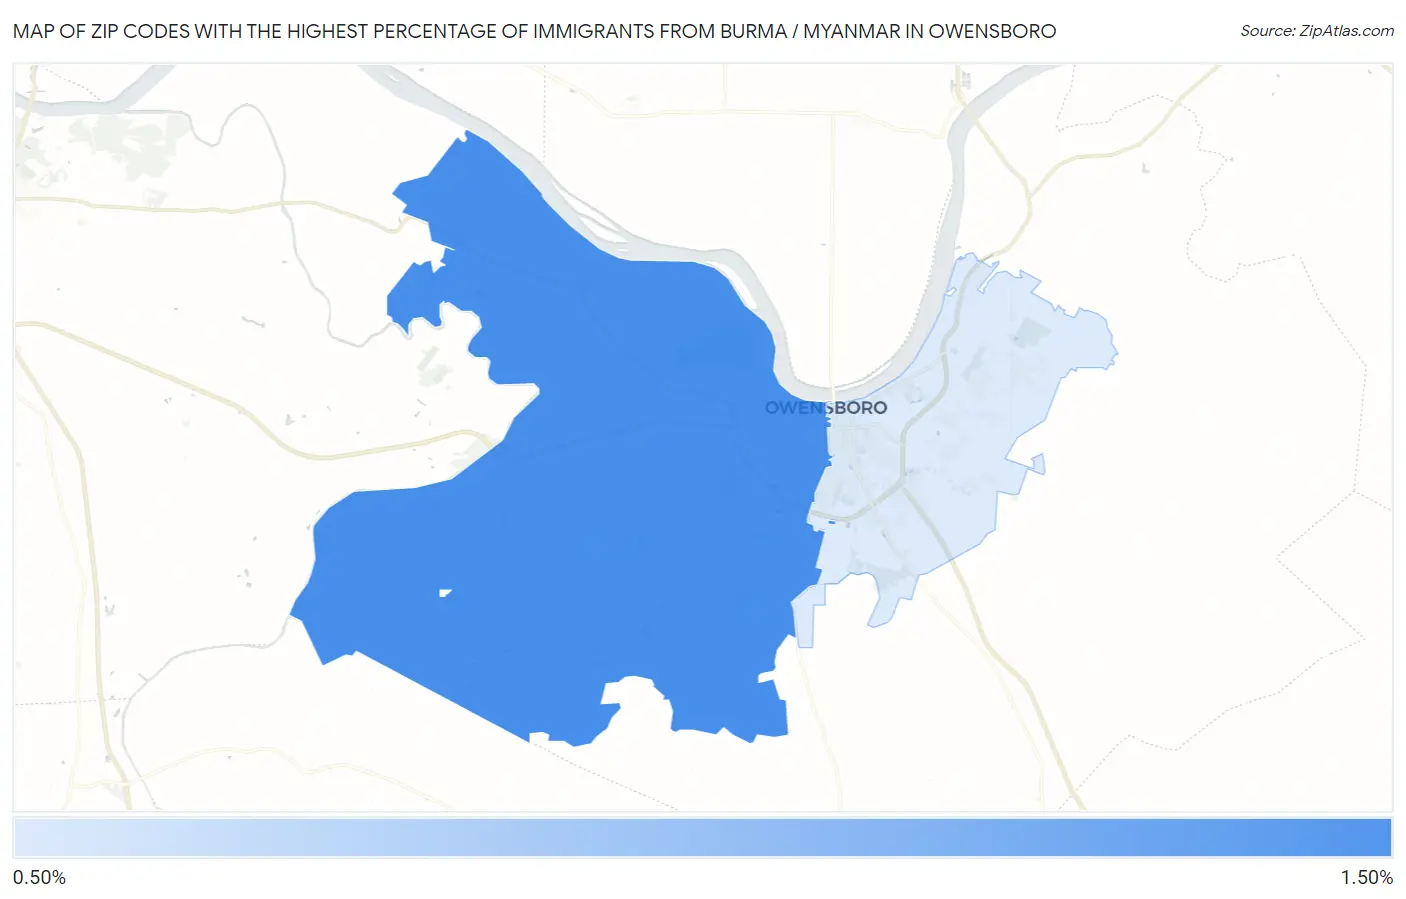
Map of Zip Codes with the Highest Percentage of Immigrants from Burma / Myanmar in Owensboro
0.50%
0.87%
Zip Codes with the Highest Percentage of Immigrants from Burma / Myanmar in Owensboro, KY
| Zip Code | Burma / Myanmar | vs State | vs National | |
| 1. | 42301 | 0.87% | 0.077%(+0.791)#15 | 0.047%(+0.821)#3,191 |
| 2. | 42303 | 0.50% | 0.077%(+0.425)#33 | 0.047%(+0.455)#5,579 |
1
Common Questions
What are the Top Zip Codes with the Highest Percentage of Immigrants from Burma / Myanmar in Owensboro, KY?
Top Zip Codes with the Highest Percentage of Immigrants from Burma / Myanmar in Owensboro, KY are:
What zip code has the Highest Percentage of Immigrants from Burma / Myanmar in Owensboro, KY?
42301 has the Highest Percentage of Immigrants from Burma / Myanmar in Owensboro, KY with 0.87%.
What is the Percentage of Immigrants from Burma / Myanmar in Owensboro, KY?
Percentage of Immigrants from Burma / Myanmar in Owensboro is 0.95%.
What is the Percentage of Immigrants from Burma / Myanmar in Kentucky?
Percentage of Immigrants from Burma / Myanmar in Kentucky is 0.077%.
What is the Percentage of Immigrants from Burma / Myanmar in the United States?
Percentage of Immigrants from Burma / Myanmar in the United States is 0.047%.