Zip Codes with the Highest Percentage of White / Caucasian Population in Louisville, KY
RELATED REPORTS & OPTIONS
White / Caucasian
Louisville
Compare Zip Codes
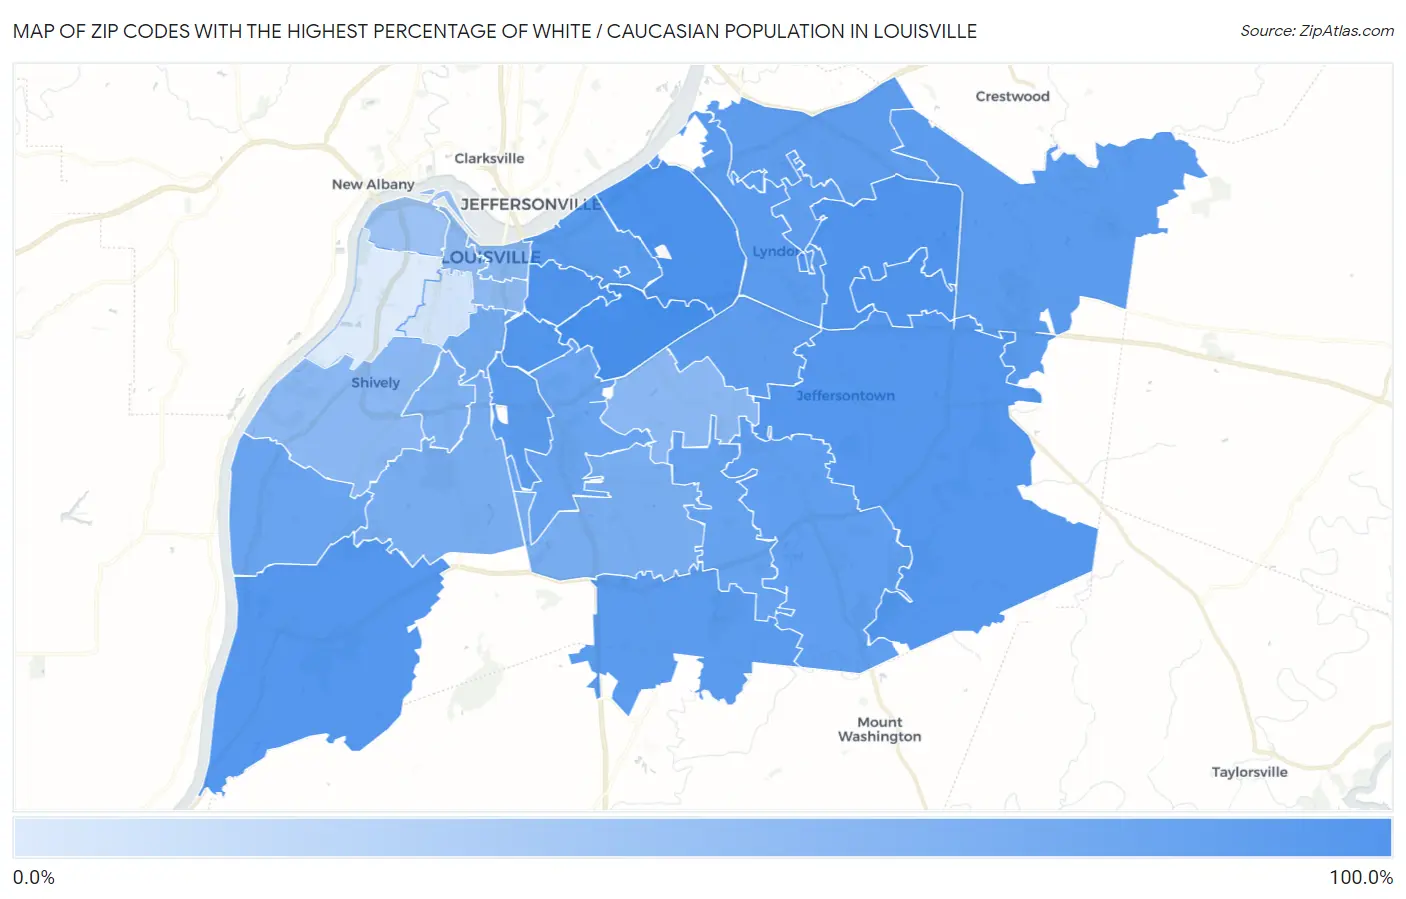
Map of Zip Codes with the Highest Percentage of White / Caucasian Population in Louisville
0.0%
100.0%
Zip Codes with the Highest Percentage of White / Caucasian Population in Louisville, KY
| Zip Code | White / Caucasian | vs State | vs National | |
| 1. | 40205 | 92.8% | 84.8%(+8.05)#511 | 65.9%(+26.9)#12,030 |
| 2. | 40207 | 89.8% | 84.8%(+5.00)#582 | 65.9%(+23.9)#15,096 |
| 3. | 40204 | 85.9% | 84.8%(+1.17)#642 | 65.9%(+20.1)#17,836 |
| 4. | 40223 | 85.7% | 84.8%(+0.955)#645 | 65.9%(+19.8)#17,975 |
| 5. | 40243 | 85.5% | 84.8%(+0.723)#650 | 65.9%(+19.6)#18,100 |
| 6. | 40217 | 83.9% | 84.8%(-0.869)#662 | 65.9%(+18.0)#19,004 |
| 7. | 40299 | 82.7% | 84.8%(-2.03)#676 | 65.9%(+16.9)#19,629 |
| 8. | 40272 | 81.9% | 84.8%(-2.87)#686 | 65.9%(+16.0)#20,061 |
| 9. | 40206 | 80.7% | 84.8%(-4.06)#690 | 65.9%(+14.8)#20,666 |
| 10. | 40280 | 79.8% | 84.8%(-4.95)#696 | 65.9%(+13.9)#21,083 |
| 11. | 40222 | 78.8% | 84.8%(-6.01)#702 | 65.9%(+12.9)#21,524 |
| 12. | 40245 | 78.5% | 84.8%(-6.30)#703 | 65.9%(+12.6)#21,660 |
| 13. | 40209 | 77.3% | 84.8%(-7.49)#706 | 65.9%(+11.4)#22,156 |
| 14. | 40229 | 76.9% | 84.8%(-7.85)#711 | 65.9%(+11.0)#22,301 |
| 15. | 40220 | 76.0% | 84.8%(-8.76)#715 | 65.9%(+10.1)#22,658 |
| 16. | 40241 | 75.8% | 84.8%(-9.02)#718 | 65.9%(+9.87)#22,774 |
| 17. | 40242 | 75.6% | 84.8%(-9.13)#719 | 65.9%(+9.76)#22,811 |
| 18. | 40291 | 73.1% | 84.8%(-11.7)#728 | 65.9%(+7.19)#23,743 |
| 19. | 40228 | 70.2% | 84.8%(-14.6)#733 | 65.9%(+4.27)#24,682 |
| 20. | 40213 | 67.3% | 84.8%(-17.5)#737 | 65.9%(+1.39)#25,492 |
| 21. | 40258 | 67.2% | 84.8%(-17.6)#738 | 65.9%(+1.33)#25,507 |
| 22. | 40208 | 61.2% | 84.8%(-23.6)#746 | 65.9%(-4.68)#27,023 |
| 23. | 40214 | 57.9% | 84.8%(-26.9)#749 | 65.9%(-7.97)#27,714 |
| 24. | 40219 | 57.4% | 84.8%(-27.3)#752 | 65.9%(-8.44)#27,813 |
| 25. | 40215 | 53.9% | 84.8%(-30.8)#753 | 65.9%(-11.9)#28,496 |
| 26. | 40202 | 48.0% | 84.8%(-36.8)#757 | 65.9%(-17.9)#29,470 |
| 27. | 40216 | 47.1% | 84.8%(-37.7)#758 | 65.9%(-18.8)#29,619 |
| 28. | 40218 | 46.7% | 84.8%(-38.0)#759 | 65.9%(-19.1)#29,667 |
| 29. | 40203 | 44.4% | 84.8%(-40.4)#760 | 65.9%(-21.5)#29,999 |
| 30. | 40212 | 37.1% | 84.8%(-47.7)#761 | 65.9%(-28.8)#30,860 |
| 31. | 40210 | 9.0% | 84.8%(-75.8)#764 | 65.9%(-56.9)#32,648 |
| 32. | 40211 | 4.1% | 84.8%(-80.7)#765 | 65.9%(-61.8)#32,840 |
1
Common Questions
What are the Top 10 Zip Codes with the Highest Percentage of White / Caucasian Population in Louisville, KY?
Top 10 Zip Codes with the Highest Percentage of White / Caucasian Population in Louisville, KY are:
What zip code has the Highest Percentage of White / Caucasian Population in Louisville, KY?
40205 has the Highest Percentage of White / Caucasian Population in Louisville, KY with 92.8%.
What is the Percentage of White / Caucasian Population in Louisville, KY?
Percentage of White / Caucasian Population in Louisville is 65.4%.
What is the Percentage of White / Caucasian Population in Kentucky?
Percentage of White / Caucasian Population in Kentucky is 84.8%.
What is the Percentage of White / Caucasian Population in the United States?
Percentage of White / Caucasian Population in the United States is 65.9%.