Zip Codes with the Highest Percentage of Renter-Occupied Units in Louisville, KY
RELATED REPORTS & OPTIONS
Highest Renter-Occupied
Louisville
Compare Zip Codes
Map of Zip Codes with the Highest Percentage of Renter-Occupied Units in Louisville
21.0%
100.0%
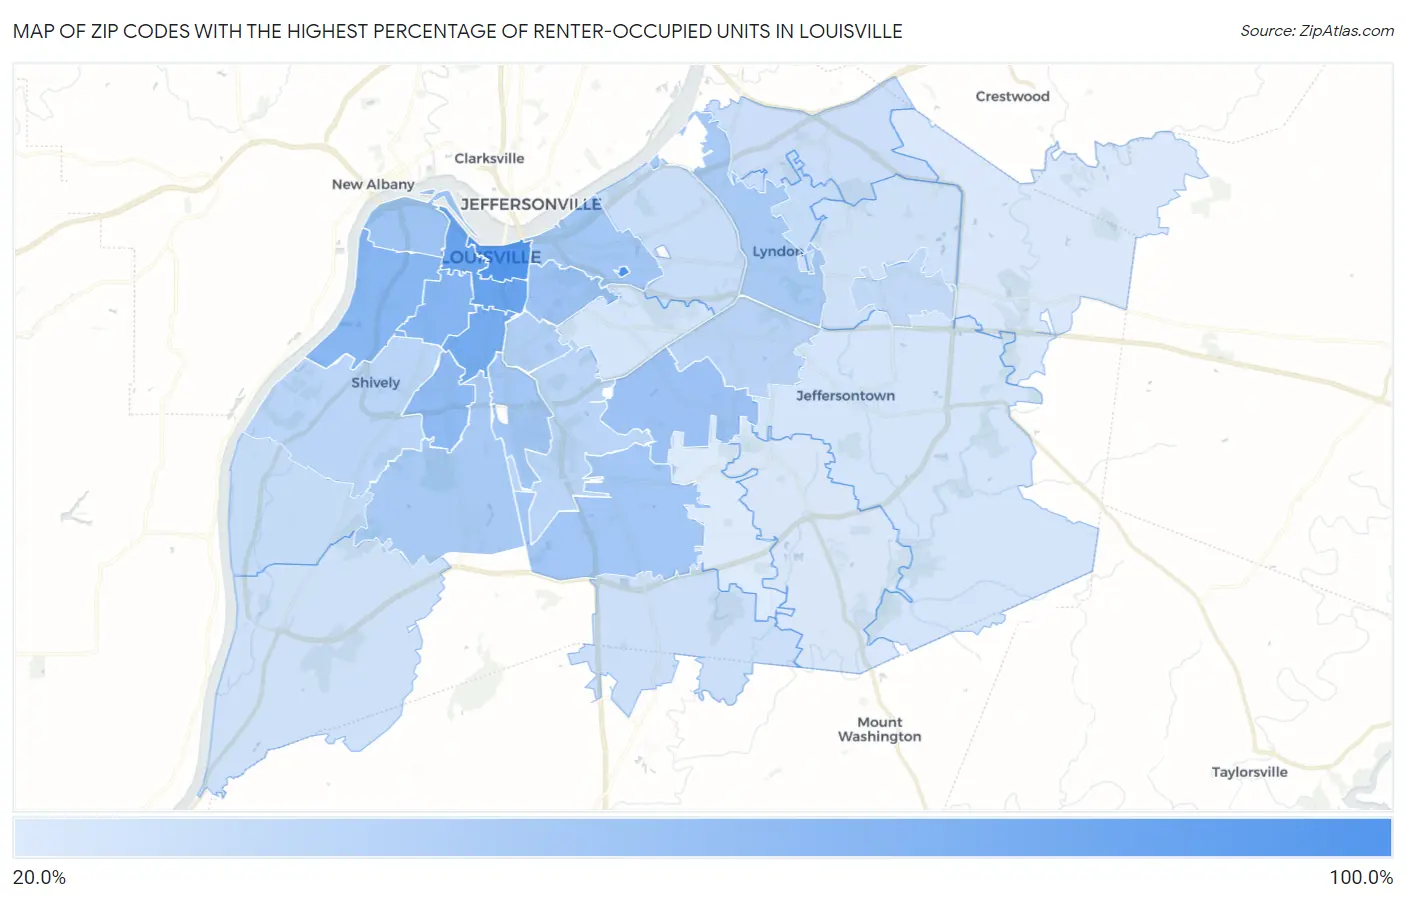
Zip Codes with the Highest Percentage of Renter-Occupied Units in Louisville, KY
| Zip Code | % Renter-Occupied | vs State | vs National | |
| 1. | 40280 | 100.0% | 31.9%(+68.1)#1 | 35.2%(+64.8)#151 |
| 2. | 40202 | 90.7% | 31.9%(+58.8)#8 | 35.2%(+55.5)#450 |
| 3. | 40203 | 77.5% | 31.9%(+45.6)#14 | 35.2%(+42.3)#761 |
| 4. | 40208 | 71.7% | 31.9%(+39.8)#18 | 35.2%(+36.5)#969 |
| 5. | 40210 | 62.8% | 31.9%(+31.0)#23 | 35.2%(+27.7)#1,562 |
| 6. | 40211 | 60.9% | 31.9%(+29.1)#26 | 35.2%(+25.7)#1,716 |
| 7. | 40215 | 57.5% | 31.9%(+25.7)#30 | 35.2%(+22.4)#2,044 |
| 8. | 40204 | 50.5% | 31.9%(+18.6)#46 | 35.2%(+15.3)#3,016 |
| 9. | 40218 | 49.9% | 31.9%(+18.0)#47 | 35.2%(+14.7)#3,111 |
| 10. | 40212 | 49.4% | 31.9%(+17.5)#48 | 35.2%(+14.2)#3,201 |
| 11. | 40219 | 47.3% | 31.9%(+15.4)#55 | 35.2%(+12.1)#3,585 |
| 12. | 40206 | 47.2% | 31.9%(+15.3)#57 | 35.2%(+12.0)#3,607 |
| 13. | 40209 | 46.2% | 31.9%(+14.4)#63 | 35.2%(+11.1)#3,778 |
| 14. | 40214 | 45.0% | 31.9%(+13.1)#67 | 35.2%(+9.81)#4,054 |
| 15. | 40222 | 44.4% | 31.9%(+12.5)#72 | 35.2%(+9.23)#4,213 |
| 16. | 40217 | 39.8% | 31.9%(+7.92)#93 | 35.2%(+4.62)#5,471 |
| 17. | 40220 | 36.9% | 31.9%(+5.06)#115 | 35.2%(+1.76)#6,509 |
| 18. | 40216 | 35.9% | 31.9%(+4.06)#126 | 35.2%(+0.762)#6,929 |
| 19. | 40213 | 35.5% | 31.9%(+3.65)#133 | 35.2%(+0.347)#7,102 |
| 20. | 40243 | 32.8% | 31.9%(+0.955)#167 | 35.2%(-2.35)#8,414 |
| 21. | 40242 | 31.1% | 31.9%(-0.759)#191 | 35.2%(-4.06)#9,371 |
| 22. | 40258 | 30.7% | 31.9%(-1.20)#194 | 35.2%(-4.50)#9,629 |
| 23. | 40207 | 30.2% | 31.9%(-1.67)#204 | 35.2%(-4.97)#9,921 |
| 24. | 40241 | 29.0% | 31.9%(-2.85)#222 | 35.2%(-6.15)#10,671 |
| 25. | 40229 | 27.4% | 31.9%(-4.49)#255 | 35.2%(-7.79)#11,831 |
| 26. | 40223 | 27.1% | 31.9%(-4.82)#267 | 35.2%(-8.12)#12,056 |
| 27. | 40272 | 27.0% | 31.9%(-4.91)#270 | 35.2%(-8.21)#12,124 |
| 28. | 40205 | 25.1% | 31.9%(-6.75)#300 | 35.2%(-10.1)#13,502 |
| 29. | 40299 | 24.4% | 31.9%(-7.47)#320 | 35.2%(-10.8)#14,156 |
| 30. | 40291 | 22.6% | 31.9%(-9.30)#357 | 35.2%(-12.6)#15,817 |
| 31. | 40245 | 21.8% | 31.9%(-10.1)#378 | 35.2%(-13.4)#16,563 |
| 32. | 40228 | 21.0% | 31.9%(-10.9)#393 | 35.2%(-14.2)#17,283 |
1
Common Questions
What are the Top 10 Zip Codes with the Highest Percentage of Renter-Occupied Units in Louisville, KY?
Top 10 Zip Codes with the Highest Percentage of Renter-Occupied Units in Louisville, KY are:
What zip code has the Highest Percentage of Renter-Occupied Units in Louisville, KY?
40280 has the Highest Percentage of Renter-Occupied Units in Louisville, KY with 100.0%.
What is the Percentage of Renter-Occupied Units in Louisville, KY?
Percentage of Renter-Occupied Units in Louisville is 39.6%.
What is the Percentage of Renter-Occupied Units in Kentucky?
Percentage of Renter-Occupied Units in Kentucky is 31.9%.
What is the Percentage of Renter-Occupied Units in the United States?
Percentage of Renter-Occupied Units in the United States is 35.2%.