Zip Codes with the Highest Percentage of Renter-Occupied Units in Overland Park, KS
RELATED REPORTS & OPTIONS
Highest Renter-Occupied
Overland Park
Compare Zip Codes
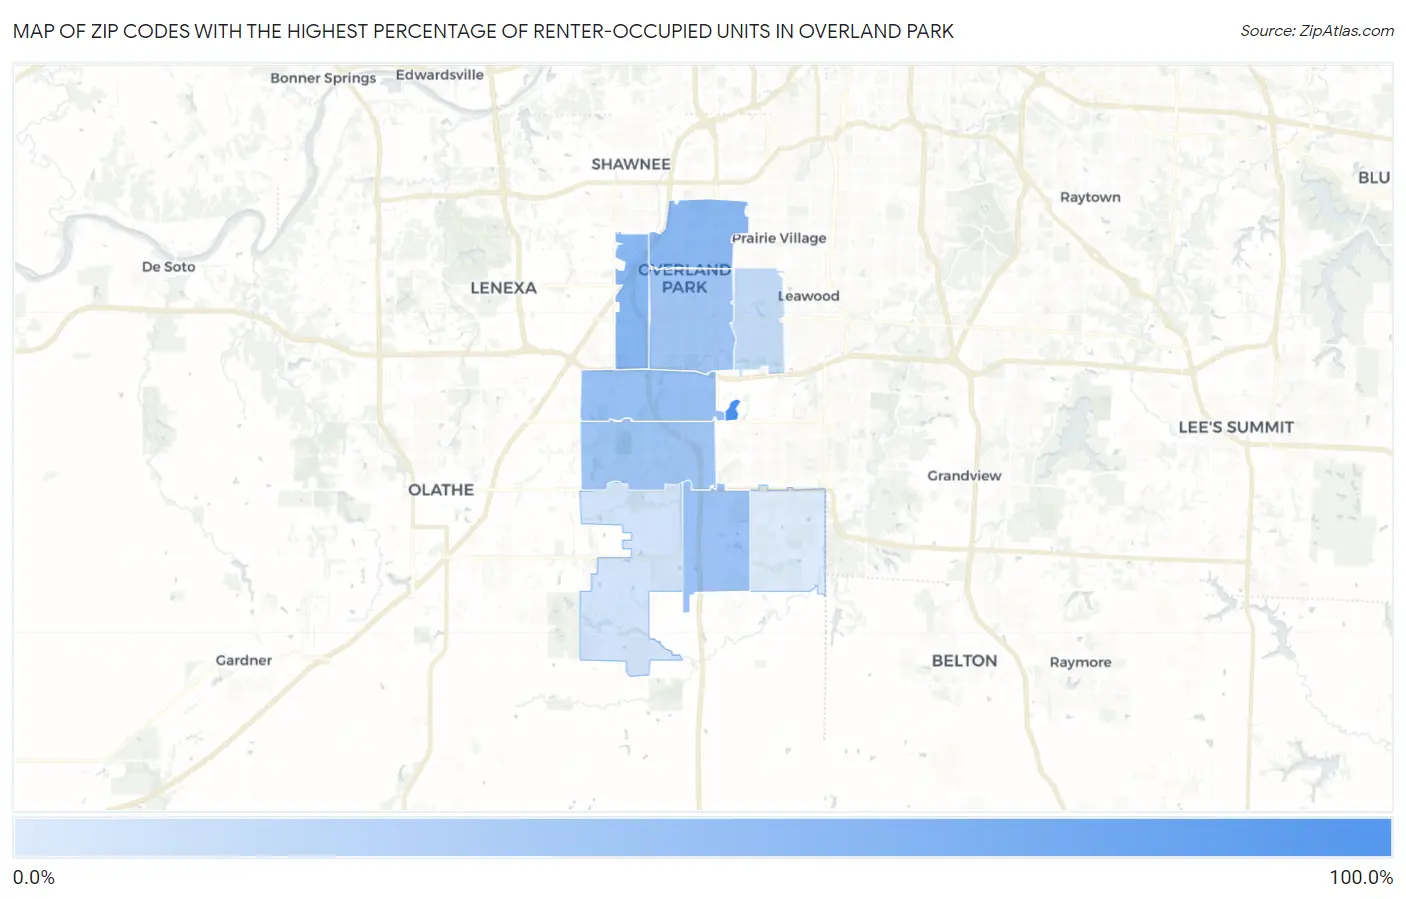
Map of Zip Codes with the Highest Percentage of Renter-Occupied Units in Overland Park
0.0%
100.0%
Zip Codes with the Highest Percentage of Renter-Occupied Units in Overland Park, KS
| Zip Code | % Renter-Occupied | vs State | vs National | |
| 1. | 66251 | 100.0% | 33.1%(+66.9)#3 | 35.2%(+64.8)#295 |
| 2. | 66214 | 54.3% | 33.1%(+21.2)#26 | 35.2%(+19.1)#2,429 |
| 3. | 66204 | 53.8% | 33.1%(+20.7)#27 | 35.2%(+18.6)#2,501 |
| 4. | 66210 | 45.7% | 33.1%(+12.6)#44 | 35.2%(+10.6)#3,898 |
| 5. | 66223 | 43.3% | 33.1%(+10.2)#49 | 35.2%(+8.15)#4,483 |
| 6. | 66213 | 41.6% | 33.1%(+8.43)#55 | 35.2%(+6.40)#4,939 |
| 7. | 66212 | 39.9% | 33.1%(+6.72)#64 | 35.2%(+4.69)#5,447 |
| 8. | 66207 | 22.5% | 33.1%(-10.6)#295 | 35.2%(-12.7)#15,861 |
| 9. | 66221 | 15.0% | 33.1%(-18.2)#493 | 35.2%(-20.2)#23,141 |
| 10. | 66224 | 10.3% | 33.1%(-22.9)#577 | 35.2%(-24.9)#27,103 |
1
Common Questions
What are the Top 5 Zip Codes with the Highest Percentage of Renter-Occupied Units in Overland Park, KS?
Top 5 Zip Codes with the Highest Percentage of Renter-Occupied Units in Overland Park, KS are:
What zip code has the Highest Percentage of Renter-Occupied Units in Overland Park, KS?
66251 has the Highest Percentage of Renter-Occupied Units in Overland Park, KS with 100.0%.
What is the Percentage of Renter-Occupied Units in Overland Park, KS?
Percentage of Renter-Occupied Units in Overland Park is 37.6%.
What is the Percentage of Renter-Occupied Units in Kansas?
Percentage of Renter-Occupied Units in Kansas is 33.1%.
What is the Percentage of Renter-Occupied Units in the United States?
Percentage of Renter-Occupied Units in the United States is 35.2%.