Whiteland, IN Map & Demographics
Whiteland Map
Whiteland Overview
$35,232
PER CAPITA INCOME
$96,131
AVG FAMILY INCOME
$85,351
AVG HOUSEHOLD INCOME
41.9%
WAGE / INCOME GAP [ % ]
58.1¢/ $1
WAGE / INCOME GAP [ $ ]
0.29
INEQUALITY / GINI INDEX
4,278
TOTAL POPULATION
2,315
MALE POPULATION
1,963
FEMALE POPULATION
117.93
MALES / 100 FEMALES
84.79
FEMALES / 100 MALES
41.3
MEDIAN AGE
3.4
AVG FAMILY SIZE
2.7
AVG HOUSEHOLD SIZE
2,607
LABOR FORCE [ PEOPLE ]
70.6%
PERCENT IN LABOR FORCE
5.4%
UNEMPLOYMENT RATE
Whiteland Zip Codes
Whiteland Area Codes
Income in Whiteland
Income Overview in Whiteland
Per Capita Income in Whiteland is $35,232, while median incomes of families and households are $96,131 and $85,351 respectively.
| Characteristic | Number | Measure |
| Per Capita Income | 4,278 | $35,232 |
| Median Family Income | 1,007 | $96,131 |
| Mean Family Income | 1,007 | $102,128 |
| Median Household Income | 1,592 | $85,351 |
| Mean Household Income | 1,592 | $88,880 |
| Income Deficit | 1,007 | $0 |
| Wage / Income Gap (%) | 4,278 | 41.88% |
| Wage / Income Gap ($) | 4,278 | 58.12¢ per $1 |
| Gini / Inequality Index | 4,278 | 0.29 |
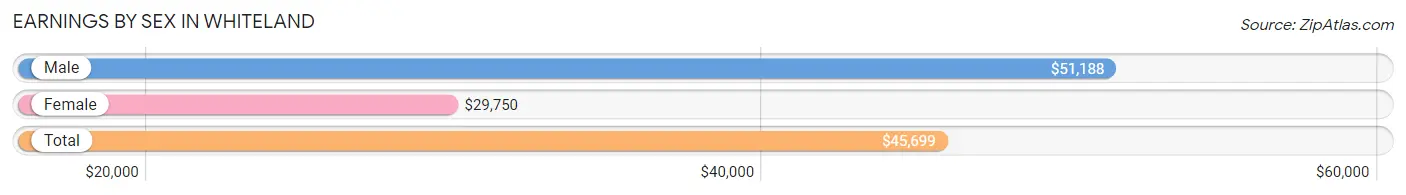
Earnings by Sex in Whiteland
Average Earnings in Whiteland are $45,699, $51,188 for men and $29,750 for women, a difference of 41.9%.
| Sex | Number | Average Earnings |
| Male | 1,425 (54.6%) | $51,188 |
| Female | 1,186 (45.4%) | $29,750 |
| Total | 2,611 (100.0%) | $45,699 |
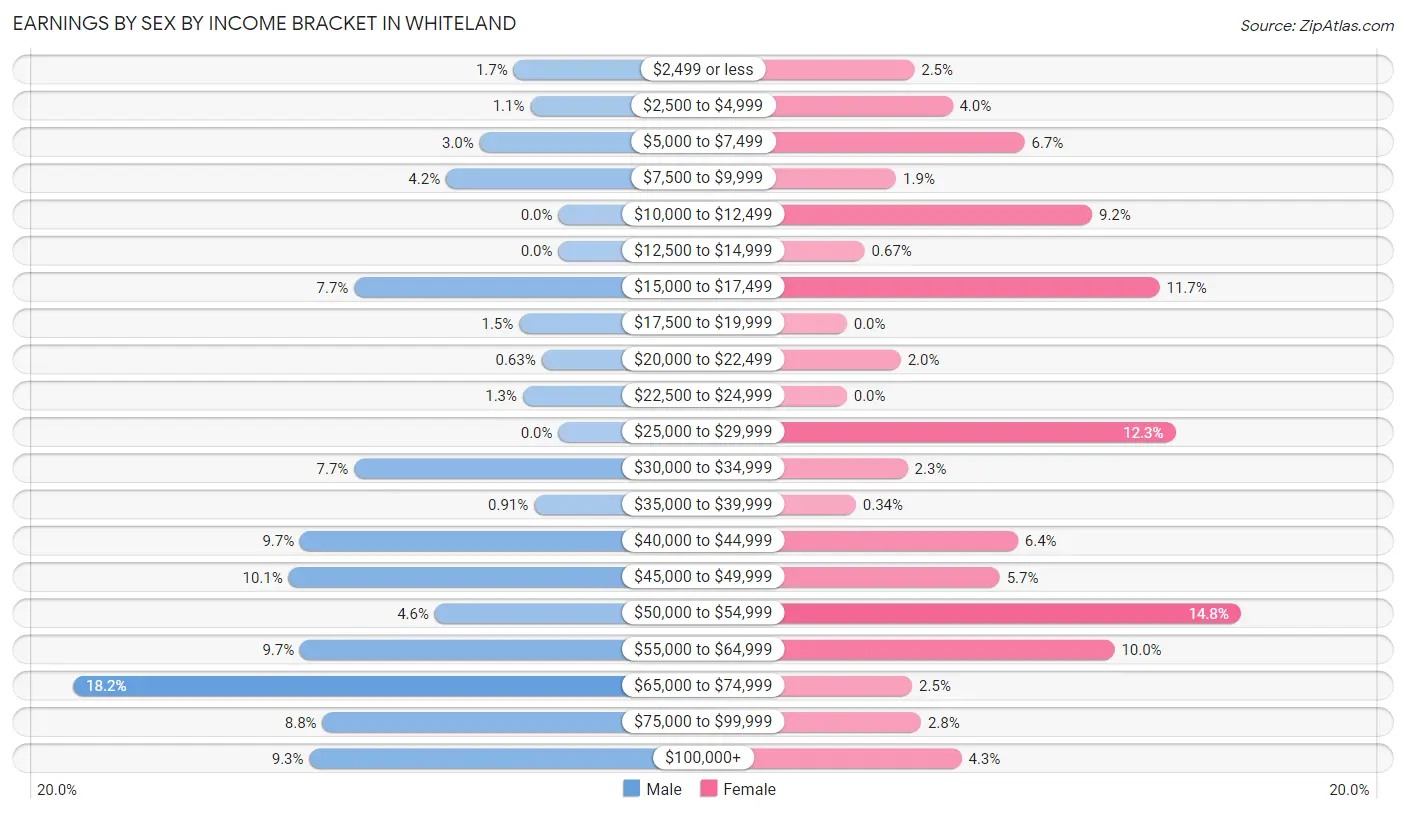
Earnings by Sex by Income Bracket in Whiteland
The most common earnings brackets in Whiteland are $65,000 to $74,999 for men (259 | 18.2%) and $50,000 to $54,999 for women (175 | 14.8%).
| Income | Male | Female |
| $2,499 or less | 24 (1.7%) | 30 (2.5%) |
| $2,500 to $4,999 | 15 (1.1%) | 47 (4.0%) |
| $5,000 to $7,499 | 42 (2.9%) | 79 (6.7%) |
| $7,500 to $9,999 | 60 (4.2%) | 22 (1.8%) |
| $10,000 to $12,499 | 0 (0.0%) | 109 (9.2%) |
| $12,500 to $14,999 | 0 (0.0%) | 8 (0.7%) |
| $15,000 to $17,499 | 109 (7.6%) | 139 (11.7%) |
| $17,500 to $19,999 | 21 (1.5%) | 0 (0.0%) |
| $20,000 to $22,499 | 9 (0.6%) | 24 (2.0%) |
| $22,500 to $24,999 | 19 (1.3%) | 0 (0.0%) |
| $25,000 to $29,999 | 0 (0.0%) | 146 (12.3%) |
| $30,000 to $34,999 | 109 (7.6%) | 27 (2.3%) |
| $35,000 to $39,999 | 13 (0.9%) | 4 (0.3%) |
| $40,000 to $44,999 | 138 (9.7%) | 76 (6.4%) |
| $45,000 to $49,999 | 144 (10.1%) | 68 (5.7%) |
| $50,000 to $54,999 | 66 (4.6%) | 175 (14.8%) |
| $55,000 to $64,999 | 138 (9.7%) | 119 (10.0%) |
| $65,000 to $74,999 | 259 (18.2%) | 29 (2.5%) |
| $75,000 to $99,999 | 126 (8.8%) | 33 (2.8%) |
| $100,000+ | 133 (9.3%) | 51 (4.3%) |
| Total | 1,425 (100.0%) | 1,186 (100.0%) |
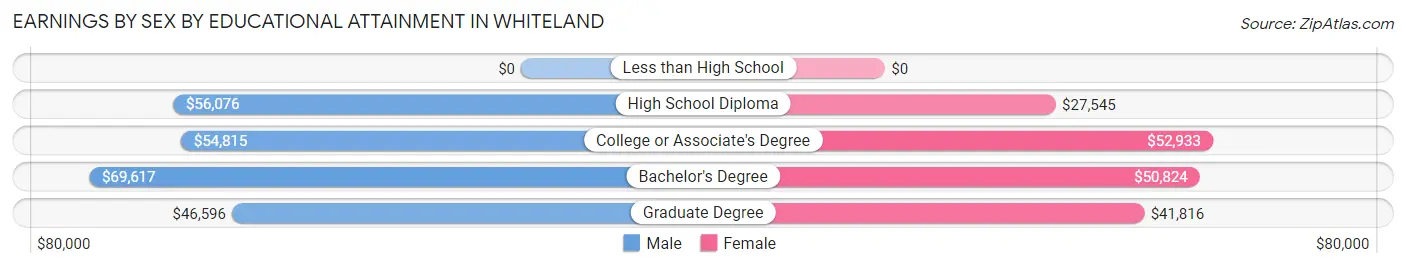
Earnings by Sex by Educational Attainment in Whiteland
Average earnings in Whiteland are $58,750 for men and $40,477 for women, a difference of 31.1%. Men with an educational attainment of bachelor's degree enjoy the highest average annual earnings of $69,617, while those with graduate degree education earn the least with $46,596. Women with an educational attainment of college or associate's degree earn the most with the average annual earnings of $52,933, while those with high school diploma education have the smallest earnings of $27,545.
| Educational Attainment | Male Income | Female Income |
| Less than High School | - | - |
| High School Diploma | $56,076 | $27,545 |
| College or Associate's Degree | $54,815 | $52,933 |
| Bachelor's Degree | $69,617 | $50,824 |
| Graduate Degree | $46,596 | $41,816 |
| Total | $58,750 | $40,477 |
Family Income in Whiteland
Family Income Brackets in Whiteland
According to the Whiteland family income data, there are 366 families falling into the $100,000 to $149,999 income range, which is the most common income bracket and makes up 36.3% of all families.
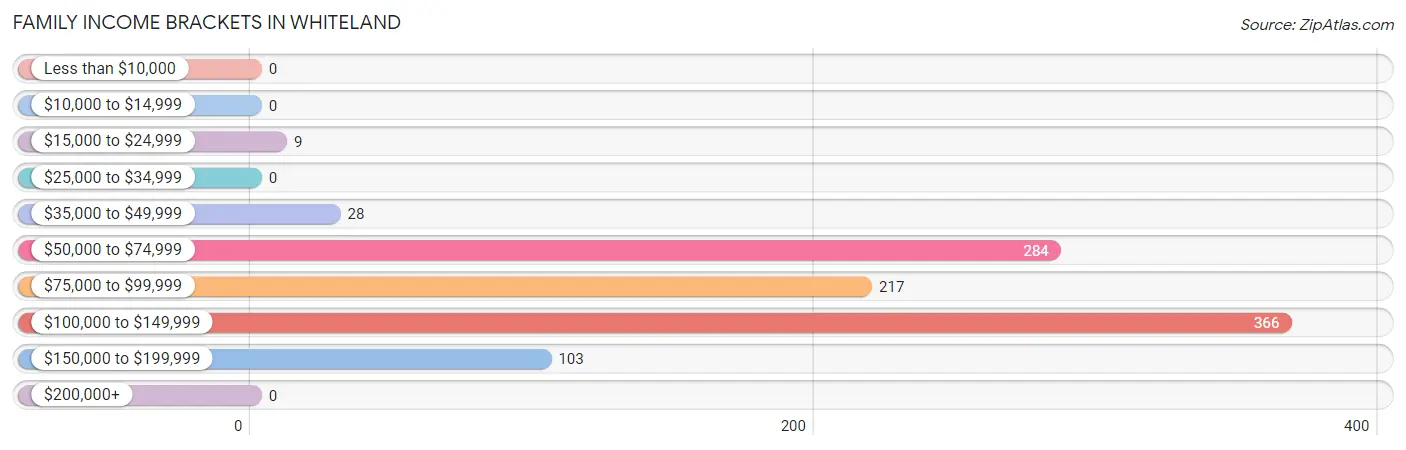
| Income Bracket | # Families | % Families |
| Less than $10,000 | 0 | 0.0% |
| $10,000 to $14,999 | 0 | 0.0% |
| $15,000 to $24,999 | 9 | 0.9% |
| $25,000 to $34,999 | 0 | 0.0% |
| $35,000 to $49,999 | 28 | 2.8% |
| $50,000 to $74,999 | 284 | 28.2% |
| $75,000 to $99,999 | 217 | 21.5% |
| $100,000 to $149,999 | 366 | 36.3% |
| $150,000 to $199,999 | 103 | 10.2% |
| $200,000+ | 0 | 0.0% |
Family Income by Famaliy Size in Whiteland
5-person families (65 | 6.5%) account for the highest median family income in Whiteland with $112,841 per family, while 2-person families (452 | 44.9%) have the highest median income of $50,860 per family member.
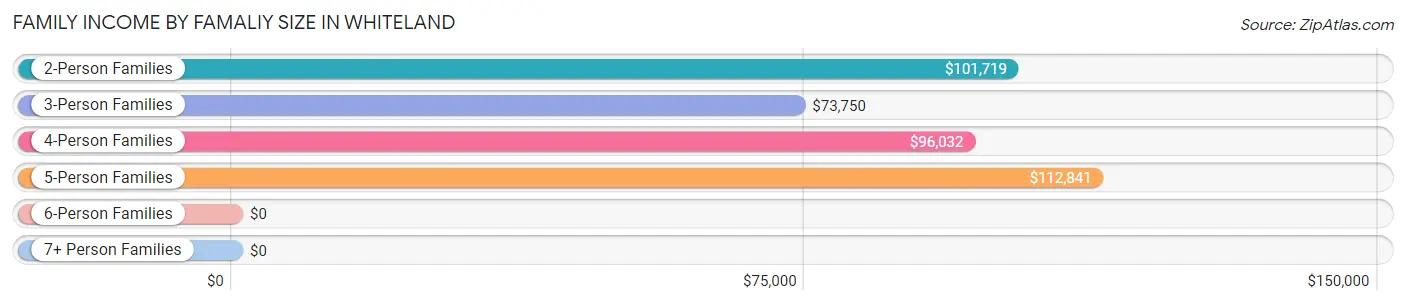
| Income Bracket | # Families | Median Income |
| 2-Person Families | 452 (44.9%) | $101,719 |
| 3-Person Families | 238 (23.6%) | $73,750 |
| 4-Person Families | 188 (18.7%) | $96,032 |
| 5-Person Families | 65 (6.5%) | $112,841 |
| 6-Person Families | 64 (6.4%) | $0 |
| 7+ Person Families | 0 (0.0%) | $0 |
| Total | 1,007 (100.0%) | $96,131 |
Family Income by Number of Earners in Whiteland
The median family income in Whiteland is $96,131, with families comprising 3+ earners (166) having the highest median family income of $135,195, while families with 1 earner (218) have the lowest median family income of $70,858, accounting for 16.5% and 21.6% of families, respectively.
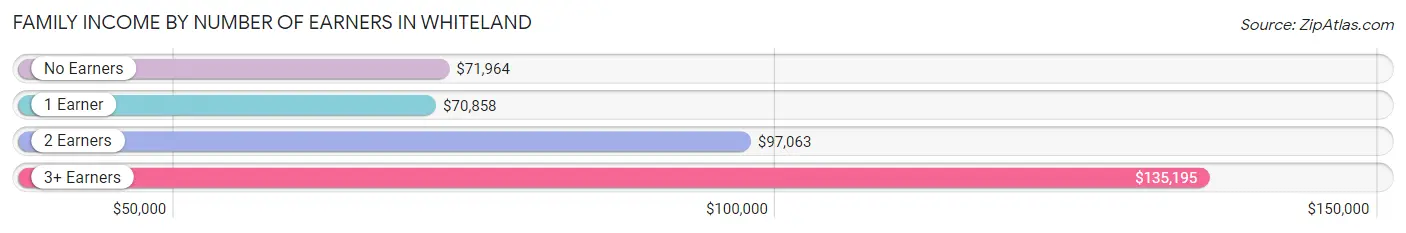
| Number of Earners | # Families | Median Income |
| No Earners | 117 (11.6%) | $71,964 |
| 1 Earner | 218 (21.6%) | $70,858 |
| 2 Earners | 506 (50.2%) | $97,063 |
| 3+ Earners | 166 (16.5%) | $135,195 |
| Total | 1,007 (100.0%) | $96,131 |
Household Income in Whiteland
Household Income Brackets in Whiteland
With 478 households falling in the category, the $100,000 to $149,999 income range is the most frequent in Whiteland, accounting for 30.0% of all households. In contrast, only 11 households (0.7%) fall into the $10,000 to $14,999 income bracket, making it the least populous group.
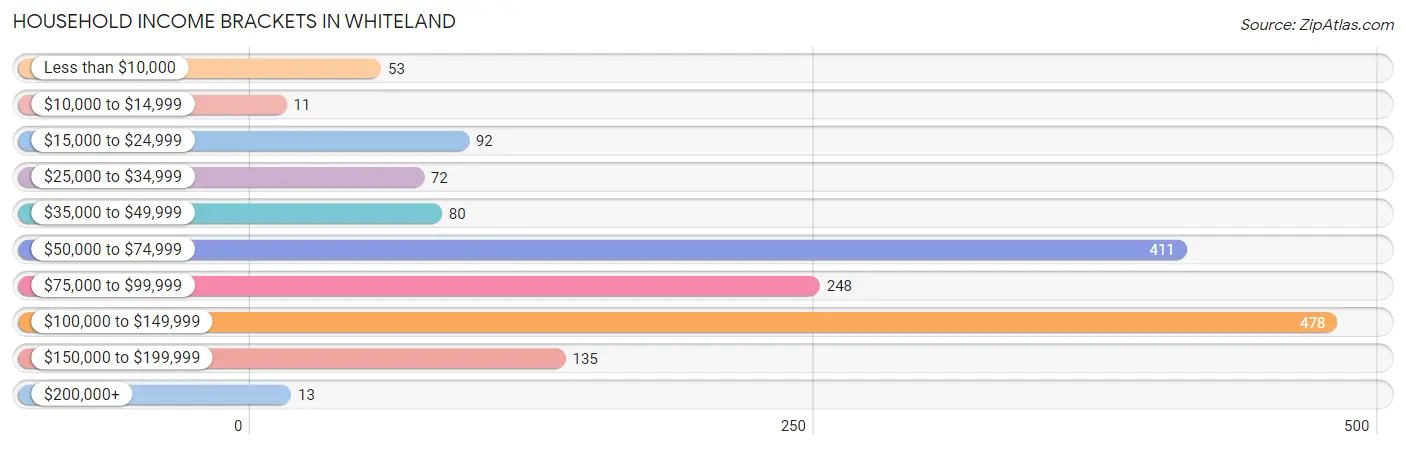
| Income Bracket | # Households | % Households |
| Less than $10,000 | 53 | 3.3% |
| $10,000 to $14,999 | 11 | 0.7% |
| $15,000 to $24,999 | 92 | 5.8% |
| $25,000 to $34,999 | 72 | 4.5% |
| $35,000 to $49,999 | 80 | 5.0% |
| $50,000 to $74,999 | 411 | 25.8% |
| $75,000 to $99,999 | 248 | 15.6% |
| $100,000 to $149,999 | 478 | 30.0% |
| $150,000 to $199,999 | 135 | 8.5% |
| $200,000+ | 13 | 0.8% |
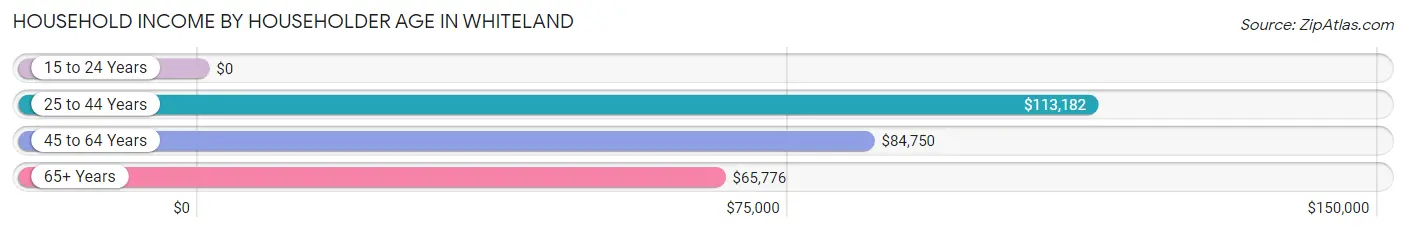
Household Income by Householder Age in Whiteland
The median household income in Whiteland is $85,351, with the highest median household income of $113,182 found in the 25 to 44 years age bracket for the primary householder. A total of 596 households (37.4%) fall into this category. Meanwhile, the 15 to 24 years age bracket for the primary householder has the lowest median household income of $0, with 52 households (3.3%) in this group.
| Income Bracket | # Households | Median Income |
| 15 to 24 Years | 52 (3.3%) | $0 |
| 25 to 44 Years | 596 (37.4%) | $113,182 |
| 45 to 64 Years | 524 (32.9%) | $84,750 |
| 65+ Years | 420 (26.4%) | $65,776 |
| Total | 1,592 (100.0%) | $85,351 |
Poverty in Whiteland
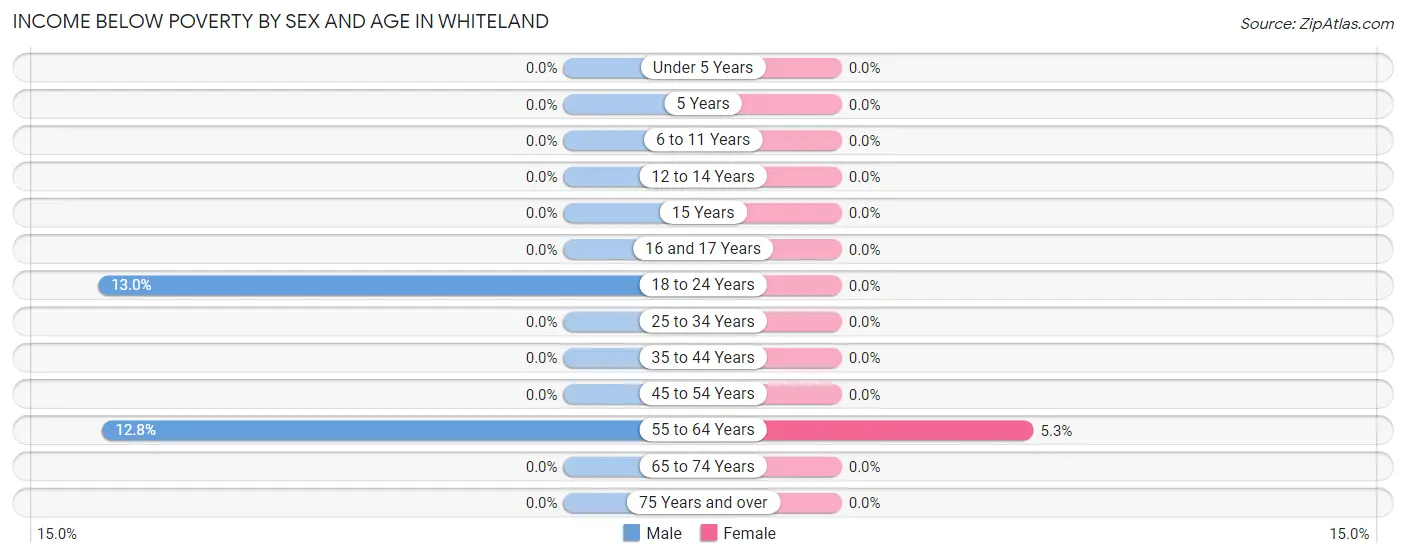
Income Below Poverty by Sex and Age in Whiteland
With 3.8% poverty level for males and 1.1% for females among the residents of Whiteland, 18 to 24 year old males and 55 to 64 year old females are the most vulnerable to poverty, with 36 males (13.0%) and 22 females (5.3%) in their respective age groups living below the poverty level.
| Age Bracket | Male | Female |
| Under 5 Years | 0 (0.0%) | 0 (0.0%) |
| 5 Years | 0 (0.0%) | 0 (0.0%) |
| 6 to 11 Years | 0 (0.0%) | 0 (0.0%) |
| 12 to 14 Years | 0 (0.0%) | 0 (0.0%) |
| 15 Years | 0 (0.0%) | 0 (0.0%) |
| 16 and 17 Years | 0 (0.0%) | 0 (0.0%) |
| 18 to 24 Years | 36 (13.0%) | 0 (0.0%) |
| 25 to 34 Years | 0 (0.0%) | 0 (0.0%) |
| 35 to 44 Years | 0 (0.0%) | 0 (0.0%) |
| 45 to 54 Years | 0 (0.0%) | 0 (0.0%) |
| 55 to 64 Years | 53 (12.8%) | 22 (5.3%) |
| 65 to 74 Years | 0 (0.0%) | 0 (0.0%) |
| 75 Years and over | 0 (0.0%) | 0 (0.0%) |
| Total | 89 (3.8%) | 22 (1.1%) |
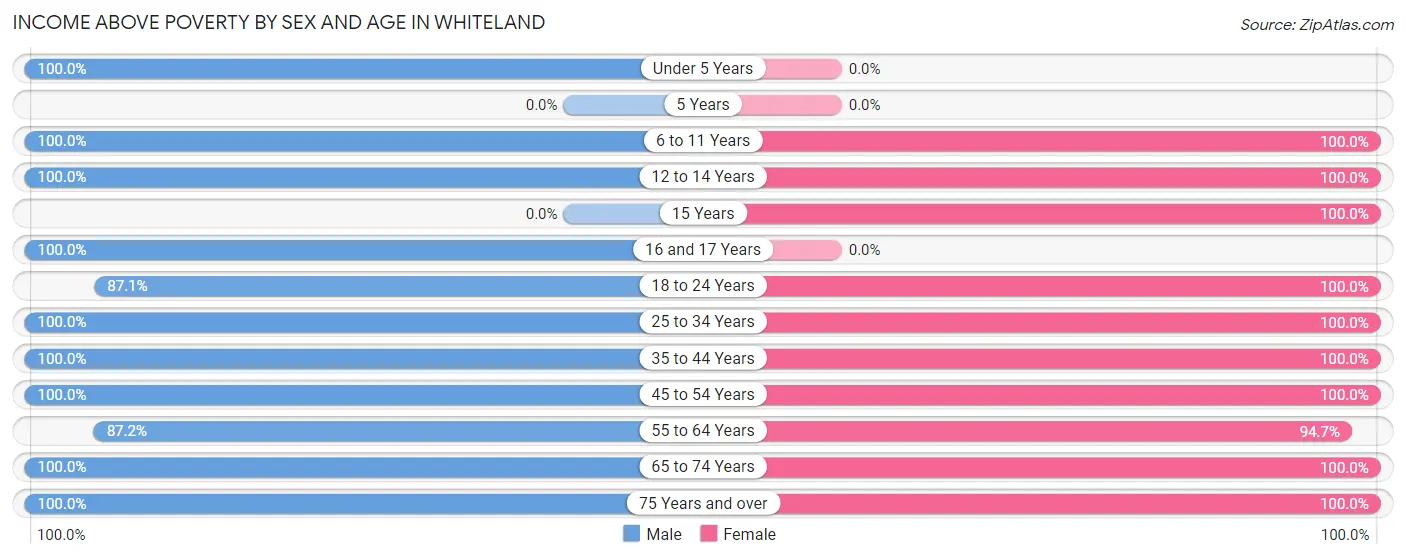
Income Above Poverty by Sex and Age in Whiteland
According to the poverty statistics in Whiteland, males aged under 5 years and females aged 6 to 11 years are the age groups that are most secure financially, with 100.0% of males and 100.0% of females in these age groups living above the poverty line.
| Age Bracket | Male | Female |
| Under 5 Years | 93 (100.0%) | 0 (0.0%) |
| 5 Years | 0 (0.0%) | 0 (0.0%) |
| 6 to 11 Years | 40 (100.0%) | 164 (100.0%) |
| 12 to 14 Years | 146 (100.0%) | 49 (100.0%) |
| 15 Years | 0 (0.0%) | 76 (100.0%) |
| 16 and 17 Years | 38 (100.0%) | 0 (0.0%) |
| 18 to 24 Years | 242 (87.1%) | 113 (100.0%) |
| 25 to 34 Years | 458 (100.0%) | 389 (100.0%) |
| 35 to 44 Years | 216 (100.0%) | 291 (100.0%) |
| 45 to 54 Years | 342 (100.0%) | 169 (100.0%) |
| 55 to 64 Years | 360 (87.2%) | 390 (94.7%) |
| 65 to 74 Years | 166 (100.0%) | 165 (100.0%) |
| 75 Years and over | 125 (100.0%) | 118 (100.0%) |
| Total | 2,226 (96.2%) | 1,924 (98.9%) |
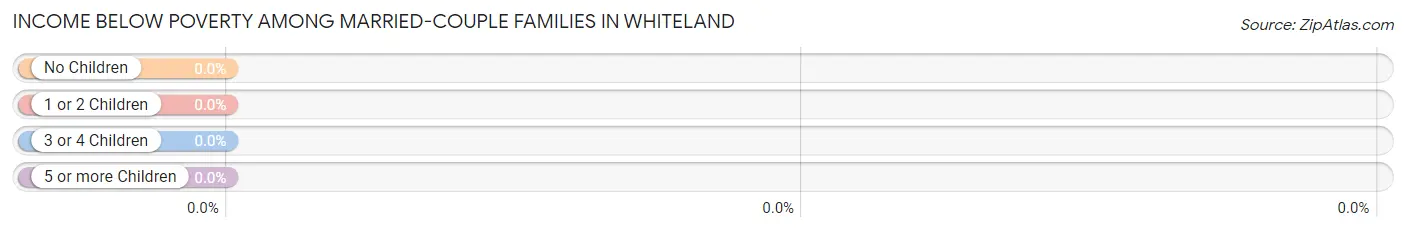
Income Below Poverty Among Married-Couple Families in Whiteland
| Children | Above Poverty | Below Poverty |
| No Children | 519 (100.0%) | 0 (0.0%) |
| 1 or 2 Children | 287 (100.0%) | 0 (0.0%) |
| 3 or 4 Children | 34 (100.0%) | 0 (0.0%) |
| 5 or more Children | 0 (0.0%) | 0 (0.0%) |
| Total | 840 (100.0%) | 0 (0.0%) |
Income Below Poverty Among Single-Parent Households in Whiteland
| Children | Single Father | Single Mother |
| No Children | 0 (0.0%) | 0 (0.0%) |
| 1 or 2 Children | 0 (0.0%) | 0 (0.0%) |
| 3 or 4 Children | 0 (0.0%) | 0 (0.0%) |
| 5 or more Children | 0 (0.0%) | 0 (0.0%) |
| Total | 0 (0.0%) | 0 (0.0%) |
Income Below Poverty Among Married-Couple vs Single-Parent Households in Whiteland
| Children | Married-Couple Families | Single-Parent Households |
| No Children | 0 (0.0%) | 0 (0.0%) |
| 1 or 2 Children | 0 (0.0%) | 0 (0.0%) |
| 3 or 4 Children | 0 (0.0%) | 0 (0.0%) |
| 5 or more Children | 0 (0.0%) | 0 (0.0%) |
| Total | 0 (0.0%) | 0 (0.0%) |
Race in Whiteland
The most populous races in Whiteland are White / Caucasian (4,202 | 98.2%), and Asian (76 | 1.8%).
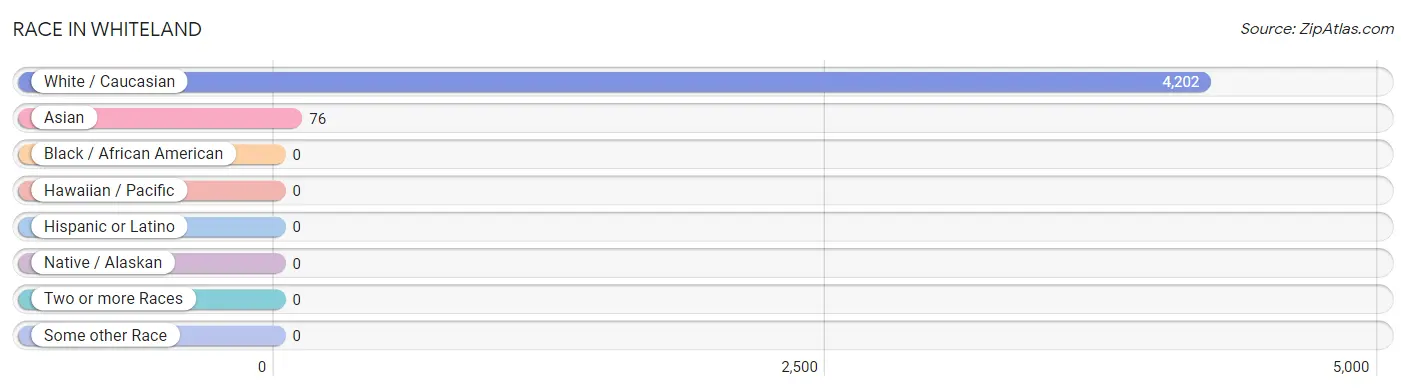
| Race | # Population | % Population |
| Asian | 76 | 1.8% |
| Black / African American | 0 | 0.0% |
| Hawaiian / Pacific | 0 | 0.0% |
| Hispanic or Latino | 0 | 0.0% |
| Native / Alaskan | 0 | 0.0% |
| White / Caucasian | 4,202 | 98.2% |
| Two or more Races | 0 | 0.0% |
| Some other Race | 0 | 0.0% |
| Total | 4,278 | 100.0% |
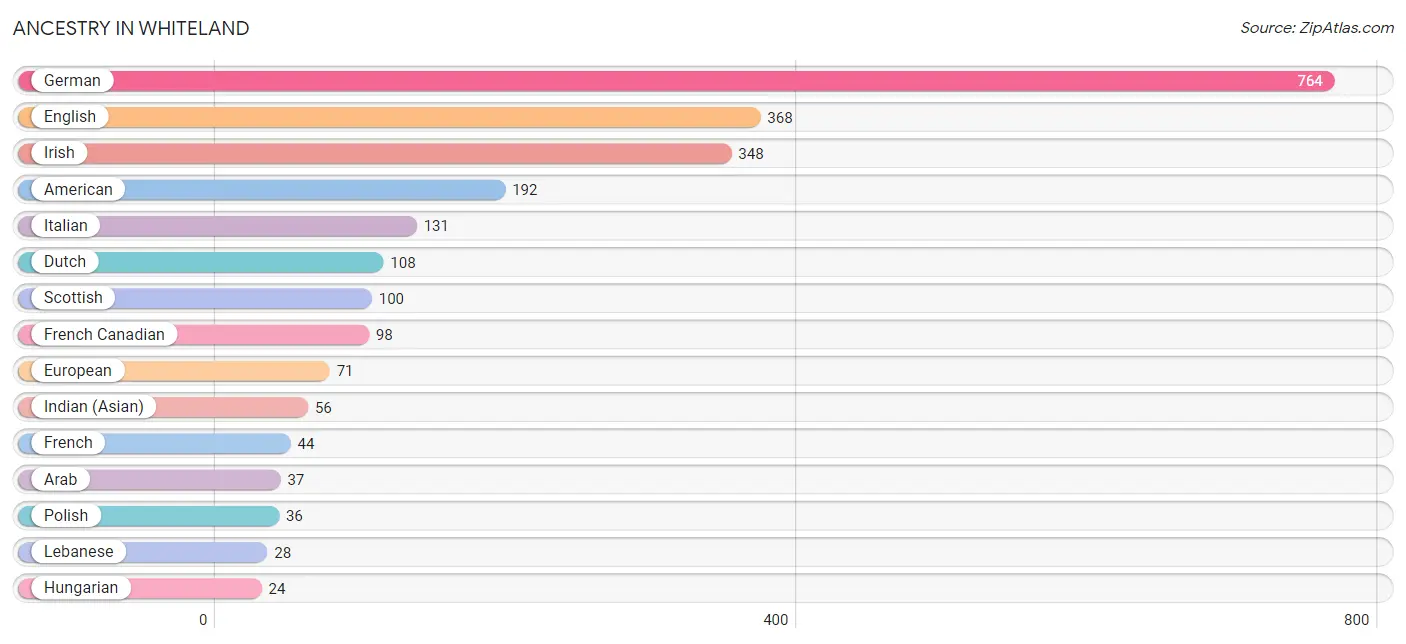
Ancestry in Whiteland
The most populous ancestries reported in Whiteland are German (764 | 17.9%), English (368 | 8.6%), Irish (348 | 8.1%), American (192 | 4.5%), and Italian (131 | 3.1%), together accounting for 42.1% of all Whiteland residents.
| Ancestry | # Population | % Population |
| American | 192 | 4.5% |
| Arab | 37 | 0.9% |
| Czech | 17 | 0.4% |
| Dutch | 108 | 2.5% |
| Eastern European | 16 | 0.4% |
| Egyptian | 9 | 0.2% |
| English | 368 | 8.6% |
| European | 71 | 1.7% |
| French | 44 | 1.0% |
| French Canadian | 98 | 2.3% |
| German | 764 | 17.9% |
| Hungarian | 24 | 0.6% |
| Indian (Asian) | 56 | 1.3% |
| Irish | 348 | 8.1% |
| Italian | 131 | 3.1% |
| Lebanese | 28 | 0.6% |
| Luxembourger | 17 | 0.4% |
| Norwegian | 6 | 0.1% |
| Polish | 36 | 0.8% |
| Scandinavian | 13 | 0.3% |
| Scotch-Irish | 24 | 0.6% |
| Scottish | 100 | 2.3% |
| Swiss | 8 | 0.2% |
| Thai | 20 | 0.5% |
| Welsh | 14 | 0.3% | View All 25 Rows |
Immigrants in Whiteland
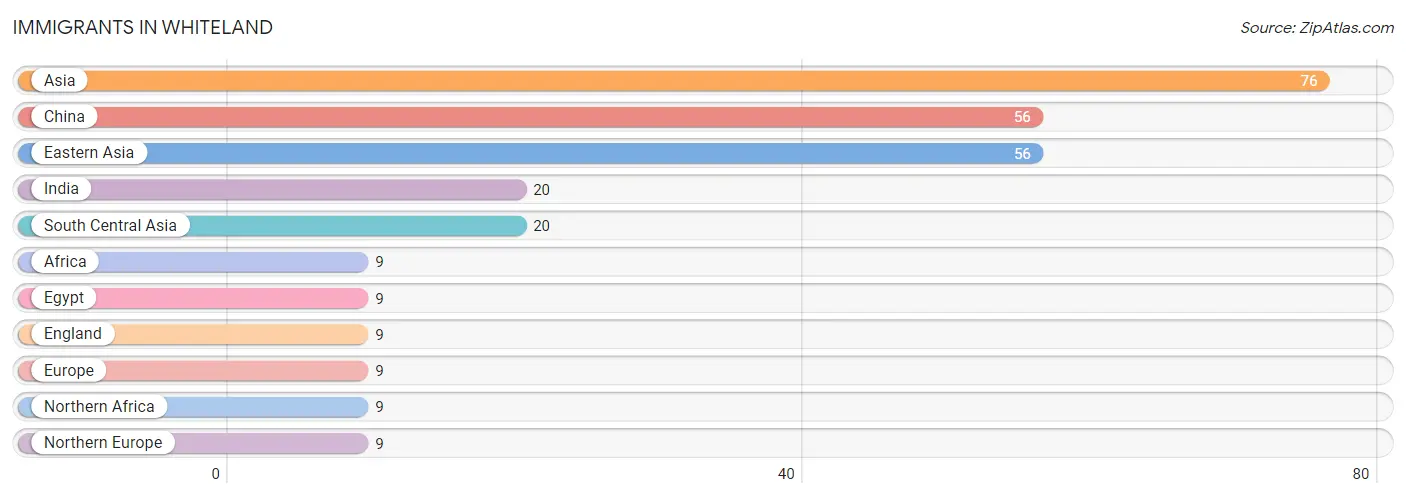
The most numerous immigrant groups reported in Whiteland came from Asia (76 | 1.8%), China (56 | 1.3%), Eastern Asia (56 | 1.3%), India (20 | 0.5%), and South Central Asia (20 | 0.5%), together accounting for 5.3% of all Whiteland residents.
| Immigration Origin | # Population | % Population |
| Africa | 9 | 0.2% |
| Asia | 76 | 1.8% |
| China | 56 | 1.3% |
| Eastern Asia | 56 | 1.3% |
| Egypt | 9 | 0.2% |
| England | 9 | 0.2% |
| Europe | 9 | 0.2% |
| India | 20 | 0.5% |
| Northern Africa | 9 | 0.2% |
| Northern Europe | 9 | 0.2% |
| South Central Asia | 20 | 0.5% | View All 11 Rows |
Sex and Age in Whiteland
Sex and Age in Whiteland
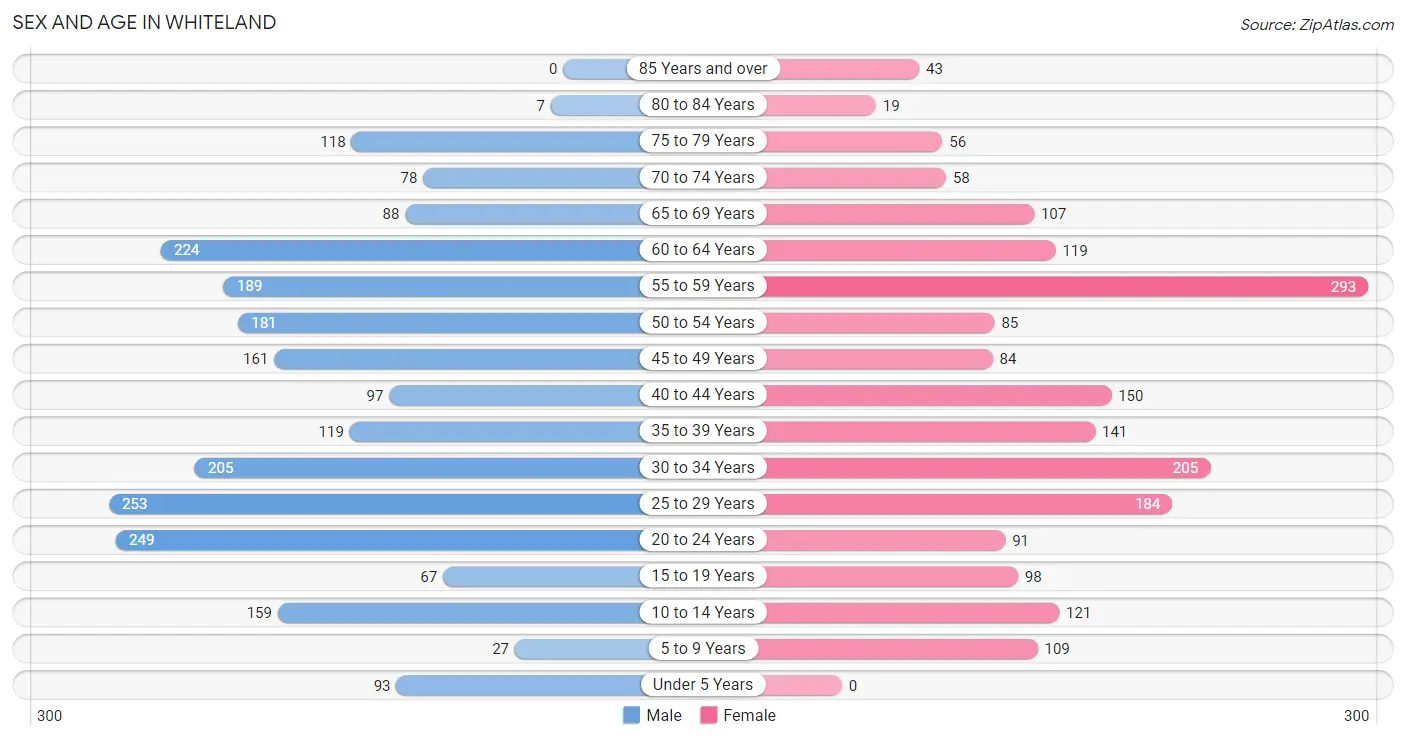
The most populous age groups in Whiteland are 25 to 29 Years (253 | 10.9%) for men and 55 to 59 Years (293 | 14.9%) for women.
| Age Bracket | Male | Female |
| Under 5 Years | 93 (4.0%) | 0 (0.0%) |
| 5 to 9 Years | 27 (1.2%) | 109 (5.6%) |
| 10 to 14 Years | 159 (6.9%) | 121 (6.2%) |
| 15 to 19 Years | 67 (2.9%) | 98 (5.0%) |
| 20 to 24 Years | 249 (10.8%) | 91 (4.6%) |
| 25 to 29 Years | 253 (10.9%) | 184 (9.4%) |
| 30 to 34 Years | 205 (8.9%) | 205 (10.4%) |
| 35 to 39 Years | 119 (5.1%) | 141 (7.2%) |
| 40 to 44 Years | 97 (4.2%) | 150 (7.6%) |
| 45 to 49 Years | 161 (7.0%) | 84 (4.3%) |
| 50 to 54 Years | 181 (7.8%) | 85 (4.3%) |
| 55 to 59 Years | 189 (8.2%) | 293 (14.9%) |
| 60 to 64 Years | 224 (9.7%) | 119 (6.1%) |
| 65 to 69 Years | 88 (3.8%) | 107 (5.4%) |
| 70 to 74 Years | 78 (3.4%) | 58 (2.9%) |
| 75 to 79 Years | 118 (5.1%) | 56 (2.9%) |
| 80 to 84 Years | 7 (0.3%) | 19 (1.0%) |
| 85 Years and over | 0 (0.0%) | 43 (2.2%) |
| Total | 2,315 (100.0%) | 1,963 (100.0%) |
Families and Households in Whiteland
Median Family Size in Whiteland
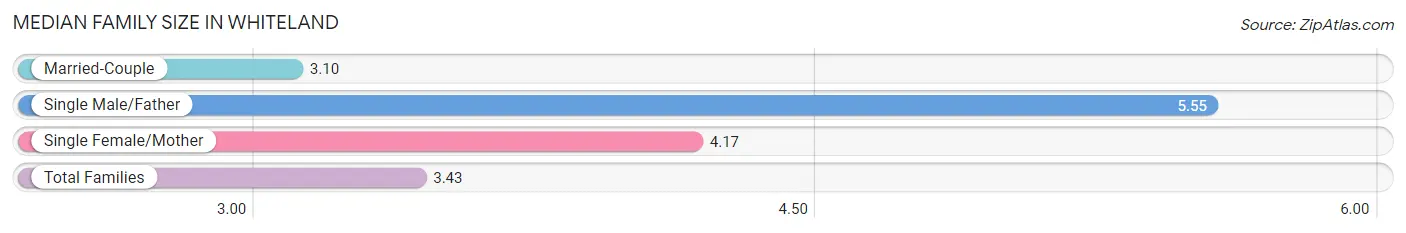
The median family size in Whiteland is 3.43 persons per family, with single male/father families (109 | 10.8%) accounting for the largest median family size of 5.55 persons per family. On the other hand, married-couple families (840 | 83.4%) represent the smallest median family size with 3.10 persons per family.
| Family Type | # Families | Family Size |
| Married-Couple | 840 (83.4%) | 3.10 |
| Single Male/Father | 109 (10.8%) | 5.55 |
| Single Female/Mother | 58 (5.8%) | 4.17 |
| Total Families | 1,007 (100.0%) | 3.43 |
Median Household Size in Whiteland
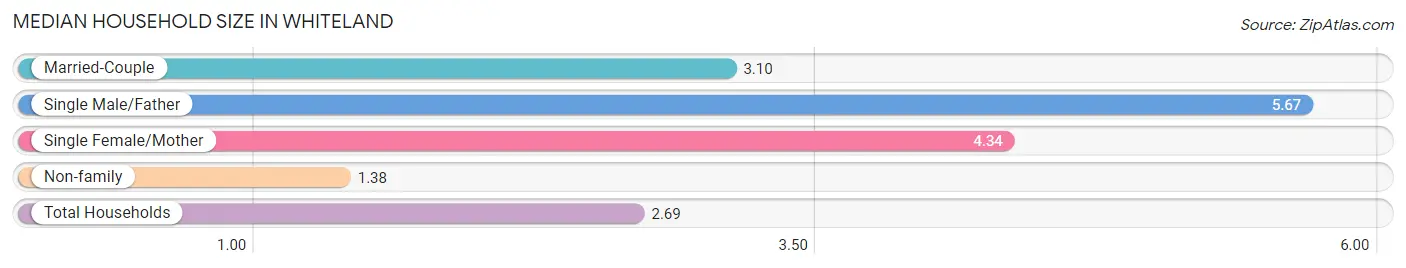
The median household size in Whiteland is 2.69 persons per household, with single male/father households (109 | 6.9%) accounting for the largest median household size of 5.67 persons per household. non-family households (585 | 36.7%) represent the smallest median household size with 1.38 persons per household.
| Household Type | # Households | Household Size |
| Married-Couple | 840 (52.8%) | 3.10 |
| Single Male/Father | 109 (6.9%) | 5.67 |
| Single Female/Mother | 58 (3.6%) | 4.34 |
| Non-family | 585 (36.7%) | 1.38 |
| Total Households | 1,592 (100.0%) | 2.69 |
Household Size by Marriage Status in Whiteland
Out of a total of 1,592 households in Whiteland, 1,007 (63.2%) are family households, while 585 (36.7%) are nonfamily households. The most numerous type of family households are 2-person households, comprising 439, and the most common type of nonfamily households are 1-person households, comprising 403.
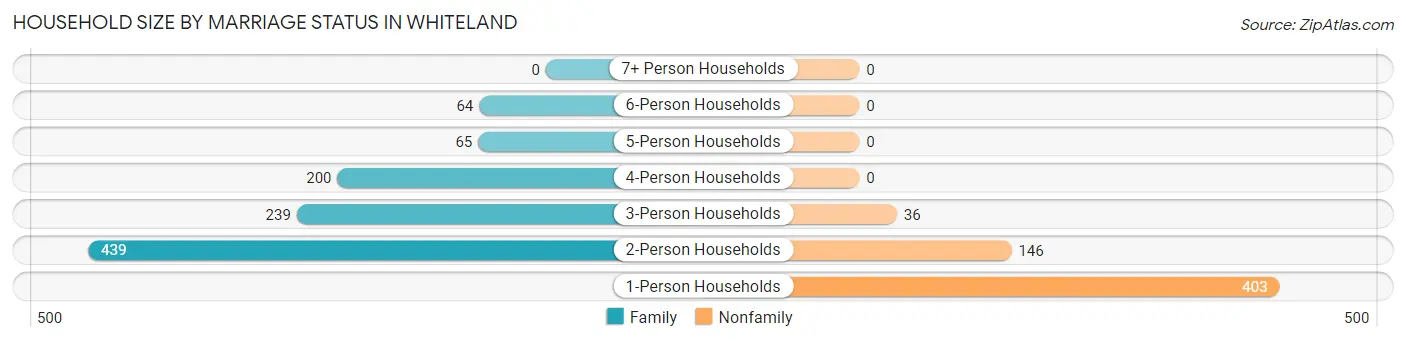
| Household Size | Family Households | Nonfamily Households |
| 1-Person Households | - | 403 (25.3%) |
| 2-Person Households | 439 (27.6%) | 146 (9.2%) |
| 3-Person Households | 239 (15.0%) | 36 (2.3%) |
| 4-Person Households | 200 (12.6%) | 0 (0.0%) |
| 5-Person Households | 65 (4.1%) | 0 (0.0%) |
| 6-Person Households | 64 (4.0%) | 0 (0.0%) |
| 7+ Person Households | 0 (0.0%) | 0 (0.0%) |
| Total | 1,007 (63.2%) | 585 (36.7%) |
Female Fertility in Whiteland
Fertility by Age in Whiteland
Average fertility rate in Whiteland is 6.0 births per 1,000 women. Women in the age bracket of 20 to 34 years have the highest fertility rate with 13.0 births per 1,000 women. Women in the age bracket of 20 to 34 years acount for 100.0% of all women with births.
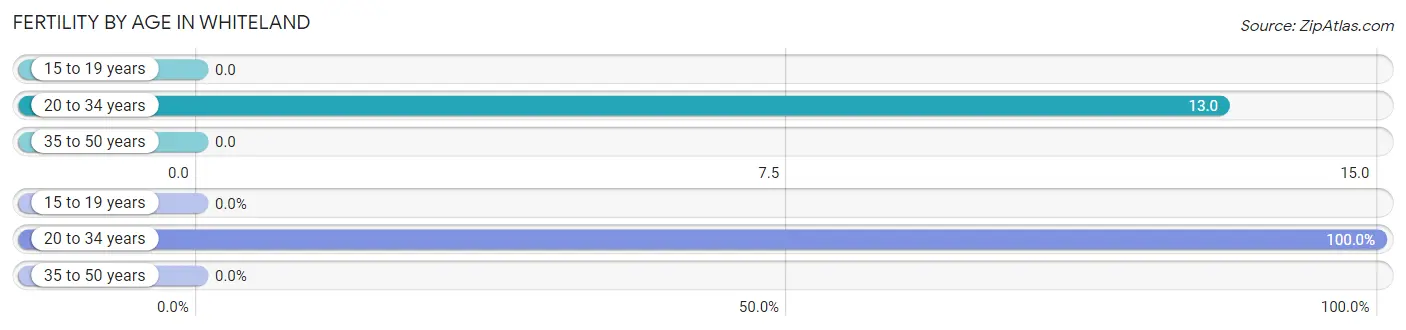
| Age Bracket | Women with Births | Births / 1,000 Women |
| 15 to 19 years | 0 (0.0%) | 0.0 |
| 20 to 34 years | 6 (100.0%) | 13.0 |
| 35 to 50 years | 0 (0.0%) | 0.0 |
| Total | 6 (100.0%) | 6.0 |
Fertility by Age by Marriage Status in Whiteland
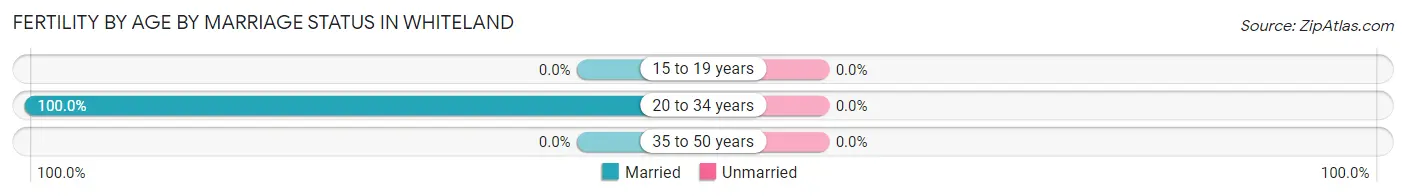
| Age Bracket | Married | Unmarried |
| 15 to 19 years | 0 (0.0%) | 0 (0.0%) |
| 20 to 34 years | 6 (100.0%) | 0 (0.0%) |
| 35 to 50 years | 0 (0.0%) | 0 (0.0%) |
| Total | 6 (100.0%) | 0 (0.0%) |
Fertility by Education in Whiteland
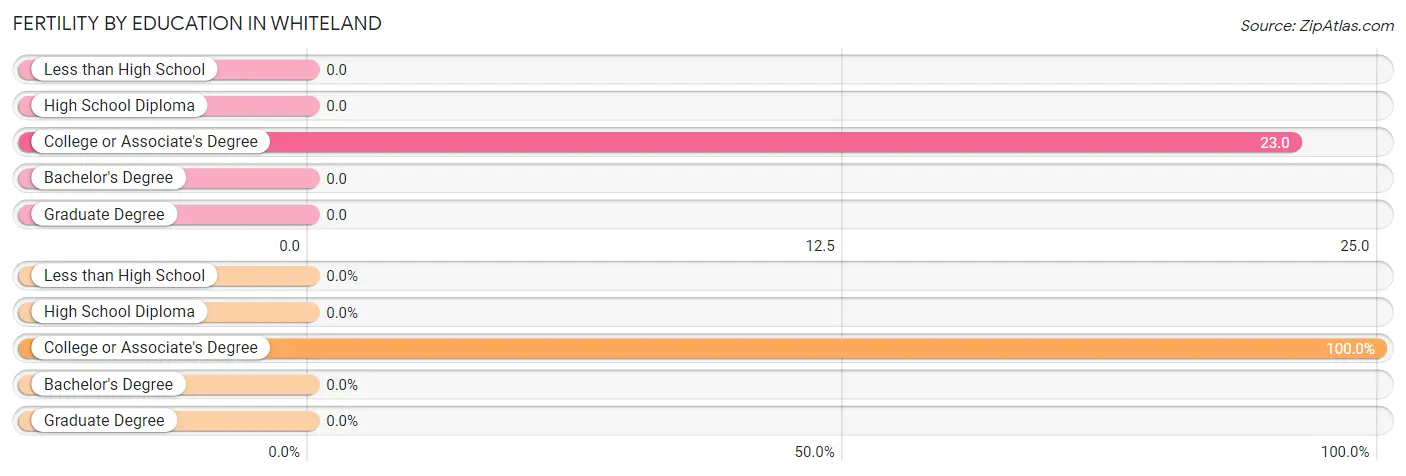
| Educational Attainment | Women with Births | Births / 1,000 Women |
| Less than High School | 0 (0.0%) | 0.0 |
| High School Diploma | 0 (0.0%) | 0.0 |
| College or Associate's Degree | 6 (100.0%) | 23.0 |
| Bachelor's Degree | 0 (0.0%) | 0.0 |
| Graduate Degree | 0 (0.0%) | 0.0 |
| Total | 6 (100.0%) | 6.0 |
Fertility by Education by Marriage Status in Whiteland
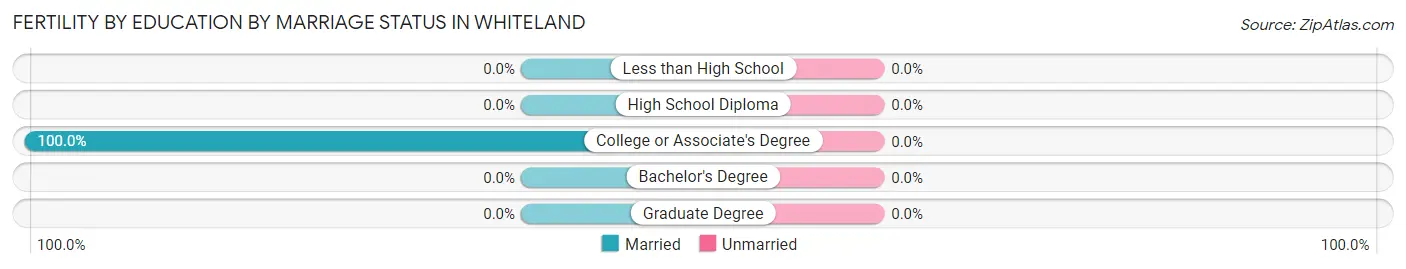
| Educational Attainment | Married | Unmarried |
| Less than High School | 0 (0.0%) | 0 (0.0%) |
| High School Diploma | 0 (0.0%) | 0 (0.0%) |
| College or Associate's Degree | 6 (100.0%) | 0 (0.0%) |
| Bachelor's Degree | 0 (0.0%) | 0 (0.0%) |
| Graduate Degree | 0 (0.0%) | 0 (0.0%) |
| Total | 6 (100.0%) | 0 (0.0%) |
Employment Characteristics in Whiteland
Employment by Class of Employer in Whiteland
Among the 2,469 employed individuals in Whiteland, private company employees (1,848 | 74.9%), self-employed (not incorporated) (217 | 8.8%), and local government employees (206 | 8.3%) make up the most common classes of employment.
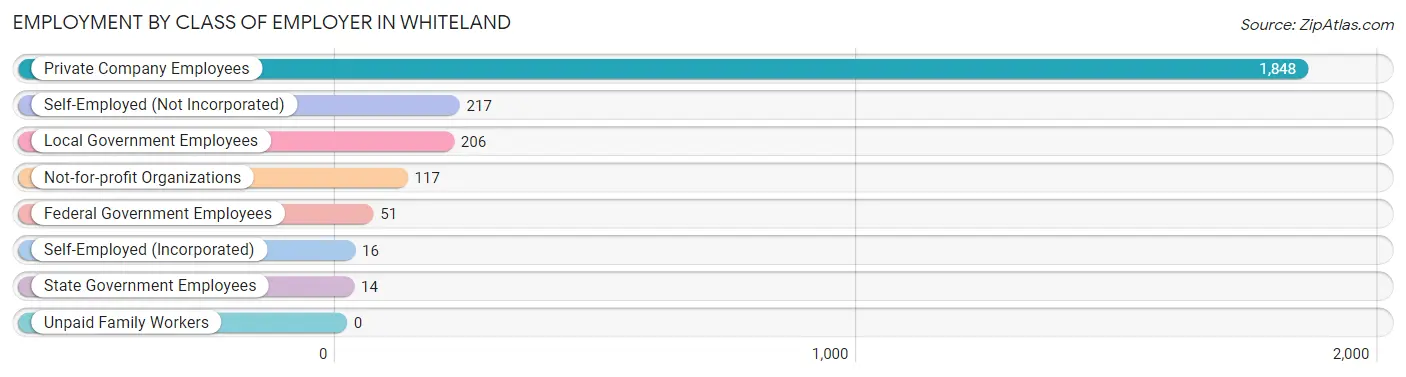
| Employer Class | # Employees | % Employees |
| Private Company Employees | 1,848 | 74.9% |
| Self-Employed (Incorporated) | 16 | 0.6% |
| Self-Employed (Not Incorporated) | 217 | 8.8% |
| Not-for-profit Organizations | 117 | 4.7% |
| Local Government Employees | 206 | 8.3% |
| State Government Employees | 14 | 0.6% |
| Federal Government Employees | 51 | 2.1% |
| Unpaid Family Workers | 0 | 0.0% |
| Total | 2,469 | 100.0% |
Employment Status by Age in Whiteland
According to the labor force statistics for Whiteland, out of the total population over 16 years of age (3,693), 70.6% or 2,607 individuals are in the labor force, with 5.4% or 141 of them unemployed. The age group with the highest labor force participation rate is 20 to 24 years, with 94.1% or 320 individuals in the labor force. Within the labor force, the 35 to 44 years age range has the highest percentage of unemployed individuals, with 21.5% or 91 of them being unemployed.
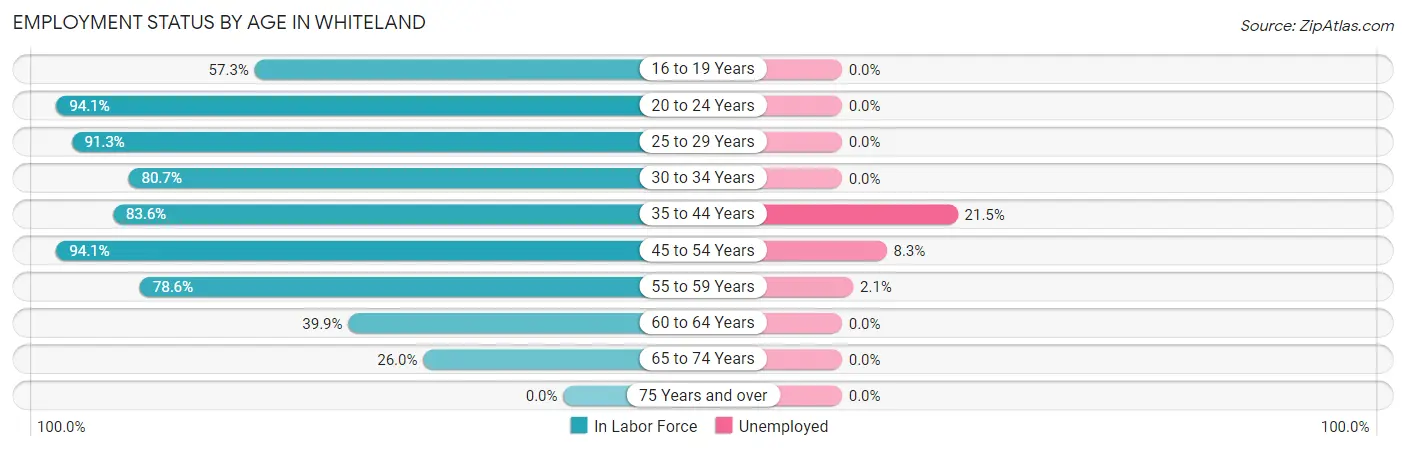
| Age Bracket | In Labor Force | Unemployed |
| 16 to 19 Years | 51 (57.3%) | 0 (0.0%) |
| 20 to 24 Years | 320 (94.1%) | 0 (0.0%) |
| 25 to 29 Years | 399 (91.3%) | 0 (0.0%) |
| 30 to 34 Years | 331 (80.7%) | 0 (0.0%) |
| 35 to 44 Years | 424 (83.6%) | 91 (21.5%) |
| 45 to 54 Years | 481 (94.1%) | 40 (8.3%) |
| 55 to 59 Years | 379 (78.6%) | 8 (2.1%) |
| 60 to 64 Years | 137 (39.9%) | 0 (0.0%) |
| 65 to 74 Years | 86 (26.0%) | 0 (0.0%) |
| 75 Years and over | 0 (0.0%) | 0 (0.0%) |
| Total | 2,607 (70.6%) | 141 (5.4%) |
Employment Status by Educational Attainment in Whiteland
According to labor force statistics for Whiteland, 80.0% of individuals (2,152) out of the total population between 25 and 64 years of age (2,690) are in the labor force, with 6.5% or 140 of them being unemployed. The group with the highest labor force participation rate are those with the educational attainment of college / associate degree, with 89.4% or 688 individuals in the labor force. Within the labor force, individuals with college / associate degree education have the highest percentage of unemployment, with 11.6% or 80 of them being unemployed.
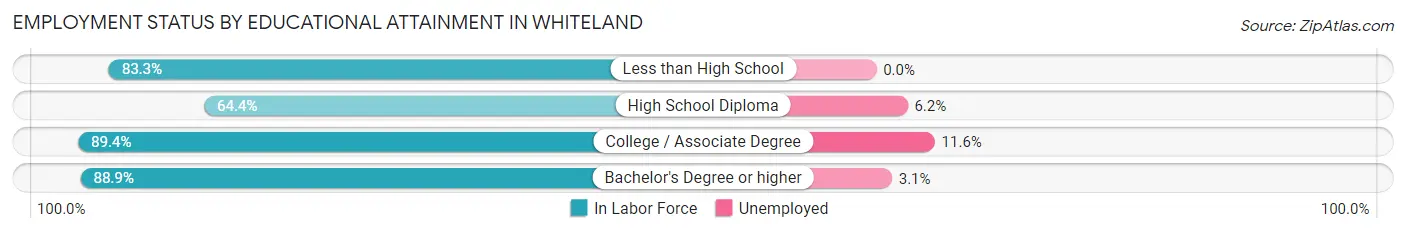
| Educational Attainment | In Labor Force | Unemployed |
| Less than High School | 160 (83.3%) | 0 (0.0%) |
| High School Diploma | 614 (64.4%) | 59 (6.2%) |
| College / Associate Degree | 688 (89.4%) | 89 (11.6%) |
| Bachelor's Degree or higher | 689 (88.9%) | 24 (3.1%) |
| Total | 2,152 (80.0%) | 175 (6.5%) |
Employment Occupations by Sex in Whiteland
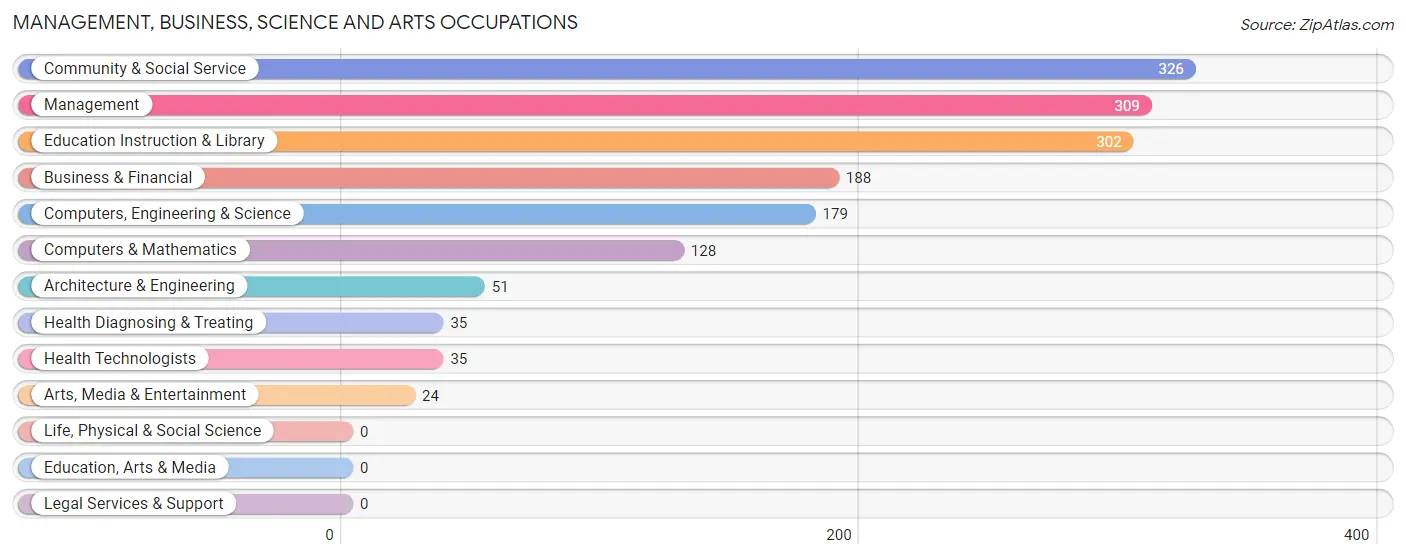
Management, Business, Science and Arts Occupations
The most common Management, Business, Science and Arts occupations in Whiteland are Community & Social Service (326 | 13.3%), Management (309 | 12.6%), Education Instruction & Library (302 | 12.3%), Business & Financial (188 | 7.6%), and Computers, Engineering & Science (179 | 7.3%).
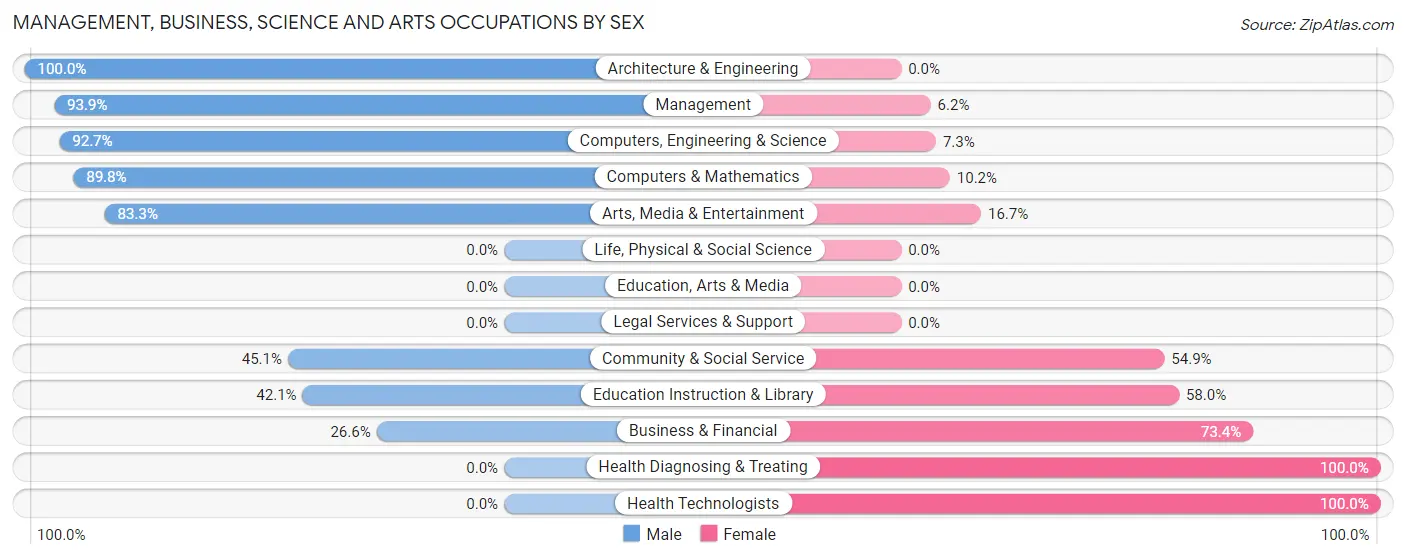
Management, Business, Science and Arts Occupations by Sex
Within the Management, Business, Science and Arts occupations in Whiteland, the most male-oriented occupations are Architecture & Engineering (100.0%), Management (93.9%), and Computers, Engineering & Science (92.7%), while the most female-oriented occupations are Health Diagnosing & Treating (100.0%), Health Technologists (100.0%), and Business & Financial (73.4%).
| Occupation | Male | Female |
| Management | 290 (93.9%) | 19 (6.1%) |
| Business & Financial | 50 (26.6%) | 138 (73.4%) |
| Computers, Engineering & Science | 166 (92.7%) | 13 (7.3%) |
| Computers & Mathematics | 115 (89.8%) | 13 (10.2%) |
| Architecture & Engineering | 51 (100.0%) | 0 (0.0%) |
| Life, Physical & Social Science | 0 (0.0%) | 0 (0.0%) |
| Community & Social Service | 147 (45.1%) | 179 (54.9%) |
| Education, Arts & Media | 0 (0.0%) | 0 (0.0%) |
| Legal Services & Support | 0 (0.0%) | 0 (0.0%) |
| Education Instruction & Library | 127 (42.0%) | 175 (58.0%) |
| Arts, Media & Entertainment | 20 (83.3%) | 4 (16.7%) |
| Health Diagnosing & Treating | 0 (0.0%) | 35 (100.0%) |
| Health Technologists | 0 (0.0%) | 35 (100.0%) |
| Total (Category) | 653 (63.0%) | 384 (37.0%) |
| Total (Overall) | 1,331 (54.1%) | 1,127 (45.9%) |
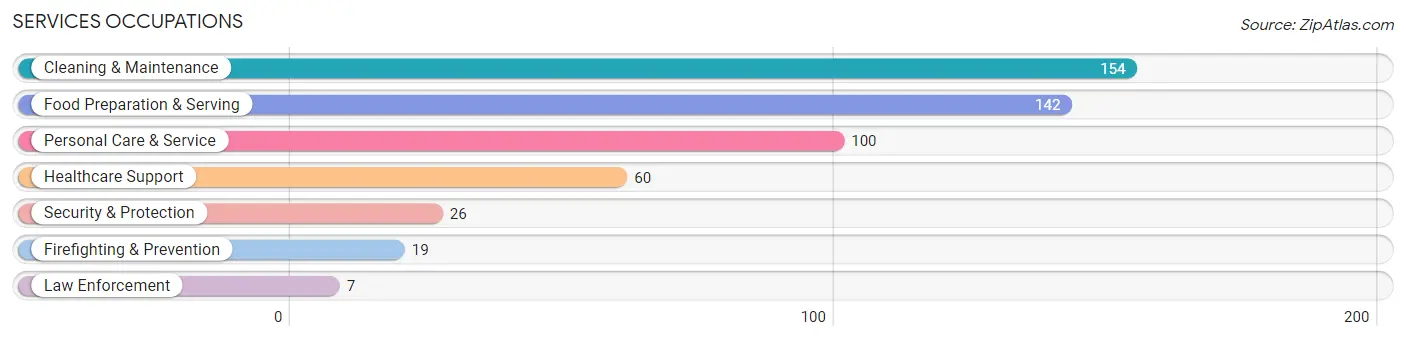
Services Occupations
The most common Services occupations in Whiteland are Cleaning & Maintenance (154 | 6.3%), Food Preparation & Serving (142 | 5.8%), Personal Care & Service (100 | 4.1%), Healthcare Support (60 | 2.4%), and Security & Protection (26 | 1.1%).
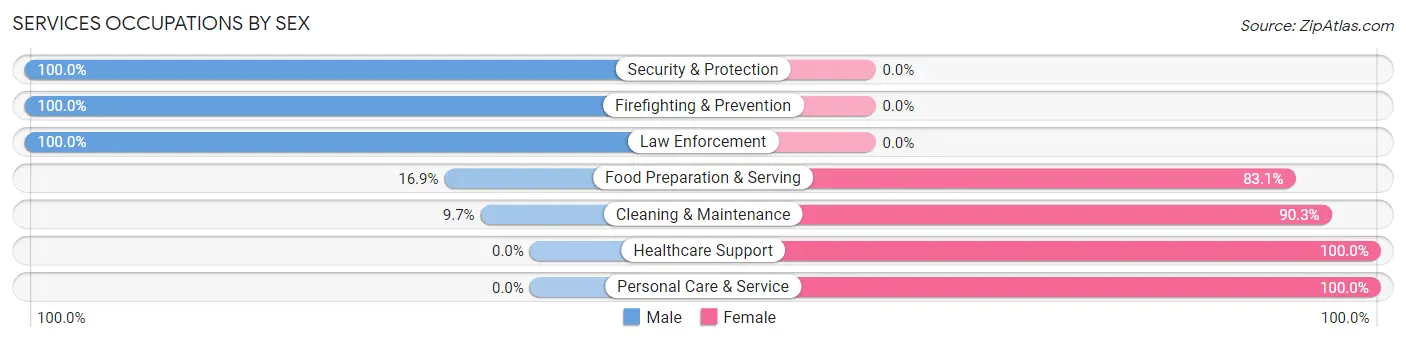
Services Occupations by Sex
Within the Services occupations in Whiteland, the most male-oriented occupations are Security & Protection (100.0%), Firefighting & Prevention (100.0%), and Law Enforcement (100.0%), while the most female-oriented occupations are Healthcare Support (100.0%), Personal Care & Service (100.0%), and Cleaning & Maintenance (90.3%).
| Occupation | Male | Female |
| Healthcare Support | 0 (0.0%) | 60 (100.0%) |
| Security & Protection | 26 (100.0%) | 0 (0.0%) |
| Firefighting & Prevention | 19 (100.0%) | 0 (0.0%) |
| Law Enforcement | 7 (100.0%) | 0 (0.0%) |
| Food Preparation & Serving | 24 (16.9%) | 118 (83.1%) |
| Cleaning & Maintenance | 15 (9.7%) | 139 (90.3%) |
| Personal Care & Service | 0 (0.0%) | 100 (100.0%) |
| Total (Category) | 65 (13.5%) | 417 (86.5%) |
| Total (Overall) | 1,331 (54.1%) | 1,127 (45.9%) |
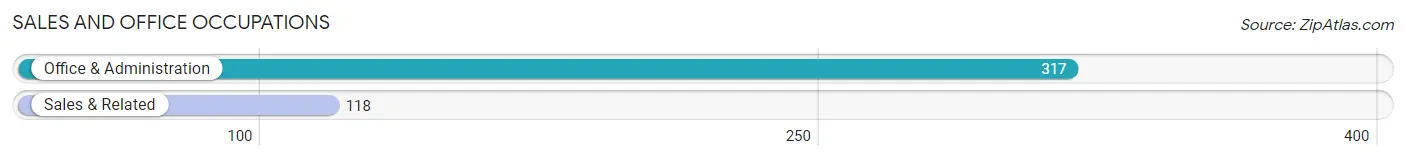
Sales and Office Occupations
The most common Sales and Office occupations in Whiteland are Office & Administration (317 | 12.9%), and Sales & Related (118 | 4.8%).
Sales and Office Occupations by Sex
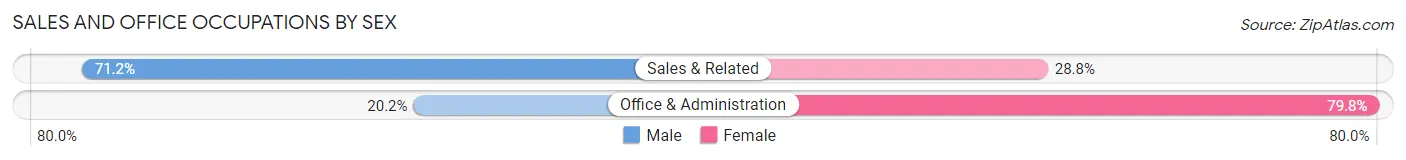
| Occupation | Male | Female |
| Sales & Related | 84 (71.2%) | 34 (28.8%) |
| Office & Administration | 64 (20.2%) | 253 (79.8%) |
| Total (Category) | 148 (34.0%) | 287 (66.0%) |
| Total (Overall) | 1,331 (54.1%) | 1,127 (45.9%) |
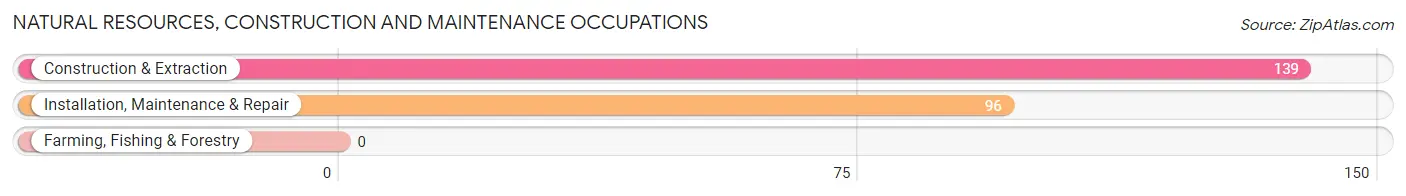
Natural Resources, Construction and Maintenance Occupations
The most common Natural Resources, Construction and Maintenance occupations in Whiteland are Construction & Extraction (139 | 5.7%), and Installation, Maintenance & Repair (96 | 3.9%).
Natural Resources, Construction and Maintenance Occupations by Sex
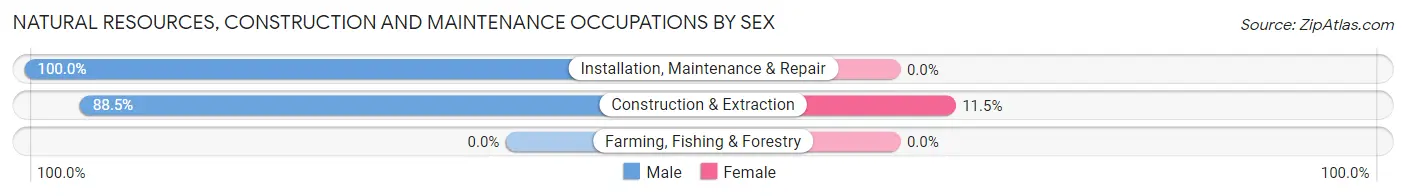
| Occupation | Male | Female |
| Farming, Fishing & Forestry | 0 (0.0%) | 0 (0.0%) |
| Construction & Extraction | 123 (88.5%) | 16 (11.5%) |
| Installation, Maintenance & Repair | 96 (100.0%) | 0 (0.0%) |
| Total (Category) | 219 (93.2%) | 16 (6.8%) |
| Total (Overall) | 1,331 (54.1%) | 1,127 (45.9%) |
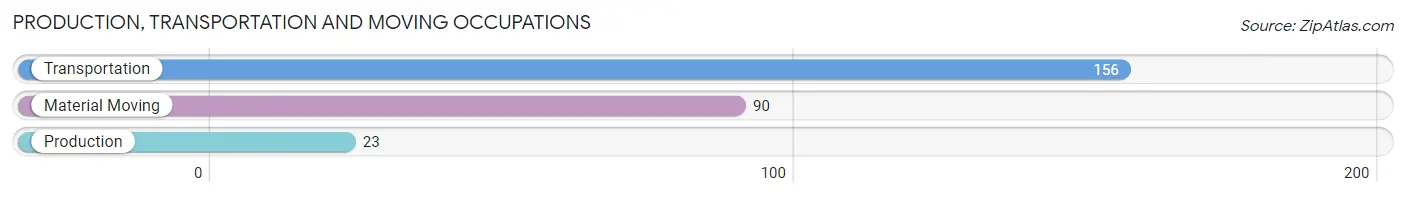
Production, Transportation and Moving Occupations
The most common Production, Transportation and Moving occupations in Whiteland are Transportation (156 | 6.4%), Material Moving (90 | 3.7%), and Production (23 | 0.9%).
Production, Transportation and Moving Occupations by Sex
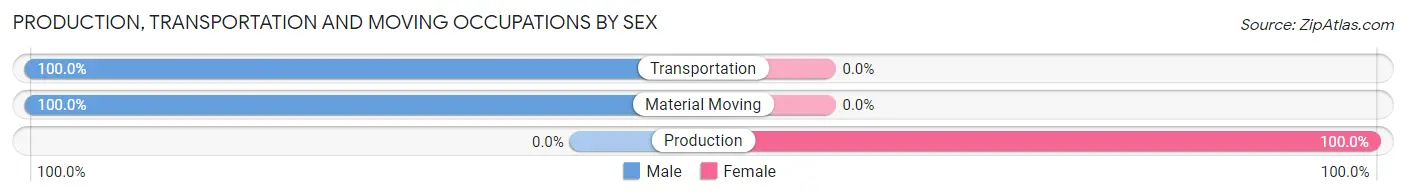
| Occupation | Male | Female |
| Production | 0 (0.0%) | 23 (100.0%) |
| Transportation | 156 (100.0%) | 0 (0.0%) |
| Material Moving | 90 (100.0%) | 0 (0.0%) |
| Total (Category) | 246 (91.4%) | 23 (8.6%) |
| Total (Overall) | 1,331 (54.1%) | 1,127 (45.9%) |
Employment Industries by Sex in Whiteland
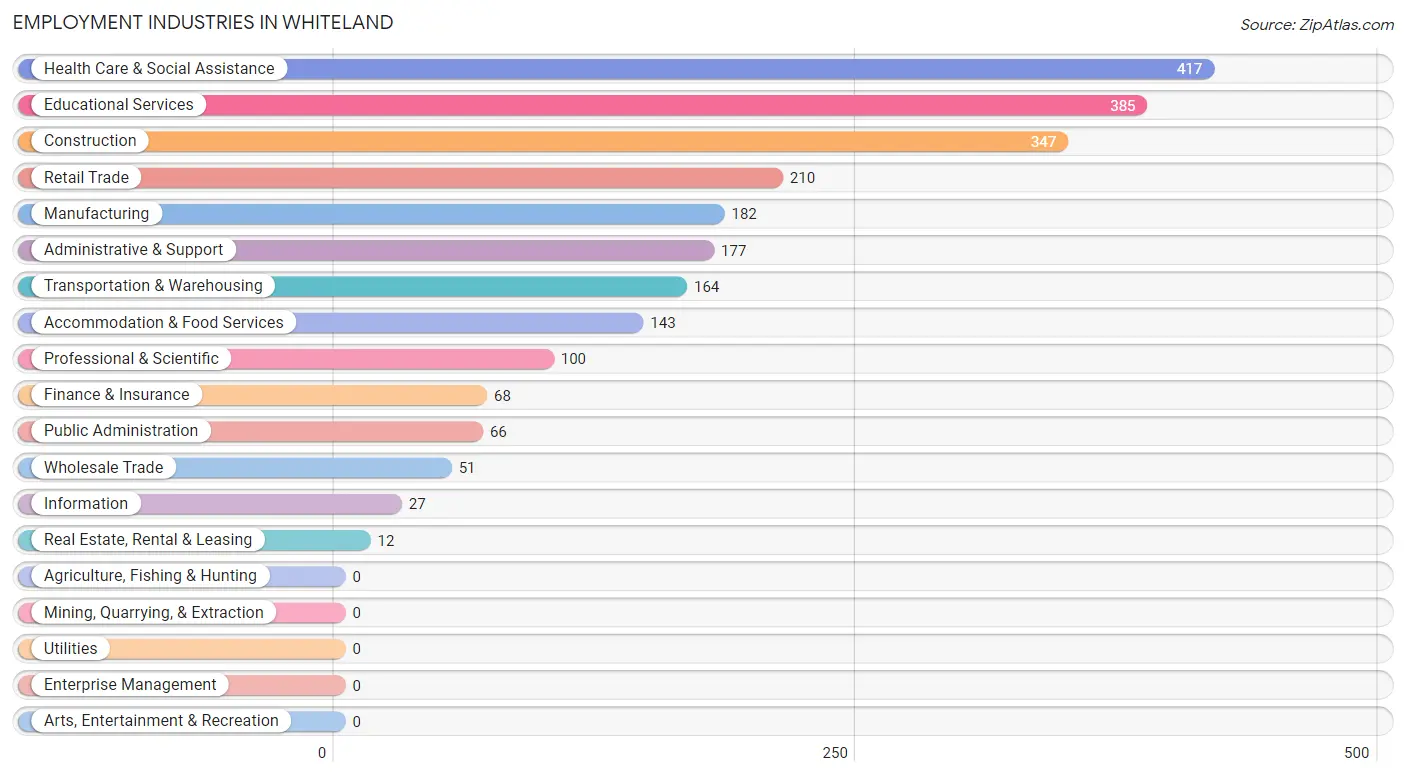
Employment Industries in Whiteland
The major employment industries in Whiteland include Health Care & Social Assistance (417 | 17.0%), Educational Services (385 | 15.7%), Construction (347 | 14.1%), Retail Trade (210 | 8.5%), and Manufacturing (182 | 7.4%).
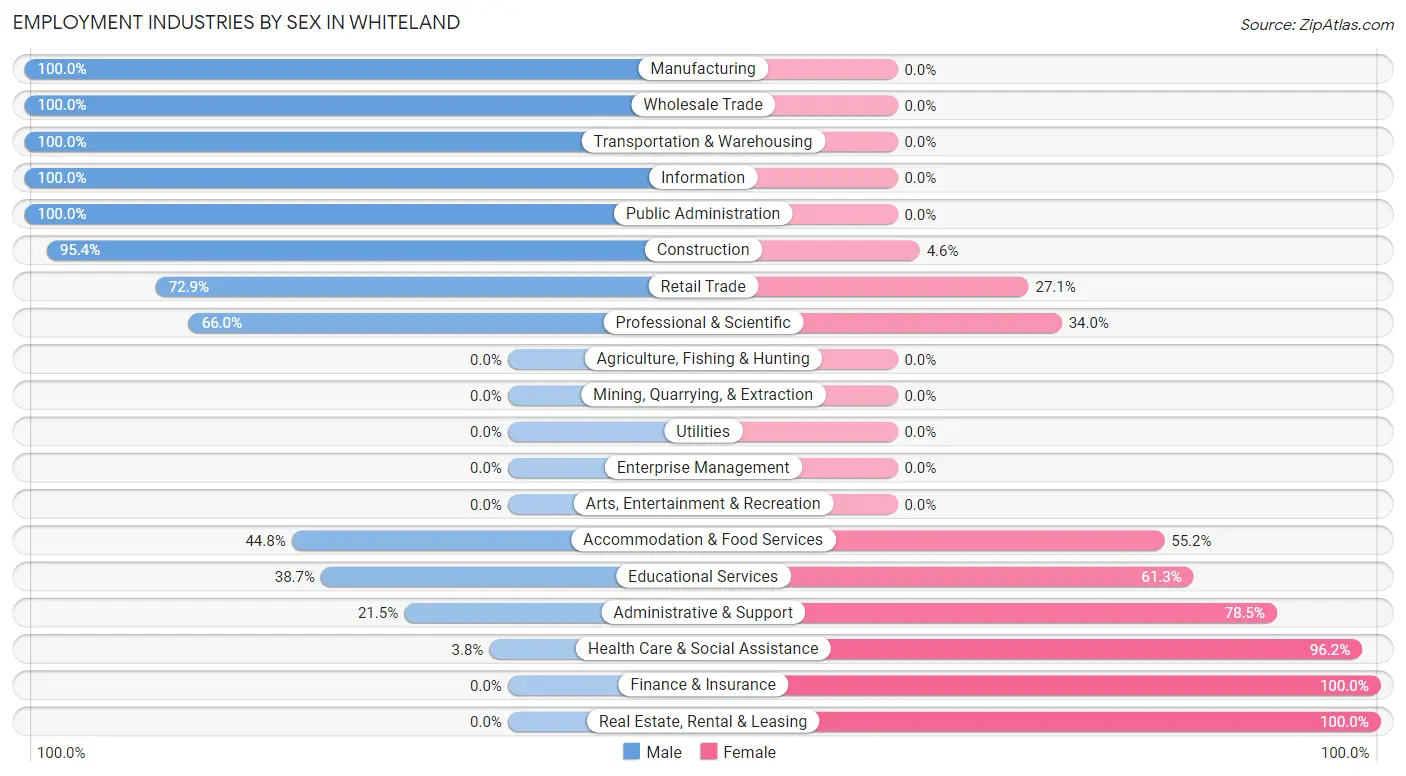
Employment Industries by Sex in Whiteland
The Whiteland industries that see more men than women are Manufacturing (100.0%), Wholesale Trade (100.0%), and Transportation & Warehousing (100.0%), whereas the industries that tend to have a higher number of women are Finance & Insurance (100.0%), Real Estate, Rental & Leasing (100.0%), and Health Care & Social Assistance (96.2%).
| Industry | Male | Female |
| Agriculture, Fishing & Hunting | 0 (0.0%) | 0 (0.0%) |
| Mining, Quarrying, & Extraction | 0 (0.0%) | 0 (0.0%) |
| Construction | 331 (95.4%) | 16 (4.6%) |
| Manufacturing | 182 (100.0%) | 0 (0.0%) |
| Wholesale Trade | 51 (100.0%) | 0 (0.0%) |
| Retail Trade | 153 (72.9%) | 57 (27.1%) |
| Transportation & Warehousing | 164 (100.0%) | 0 (0.0%) |
| Utilities | 0 (0.0%) | 0 (0.0%) |
| Information | 27 (100.0%) | 0 (0.0%) |
| Finance & Insurance | 0 (0.0%) | 68 (100.0%) |
| Real Estate, Rental & Leasing | 0 (0.0%) | 12 (100.0%) |
| Professional & Scientific | 66 (66.0%) | 34 (34.0%) |
| Enterprise Management | 0 (0.0%) | 0 (0.0%) |
| Administrative & Support | 38 (21.5%) | 139 (78.5%) |
| Educational Services | 149 (38.7%) | 236 (61.3%) |
| Health Care & Social Assistance | 16 (3.8%) | 401 (96.2%) |
| Arts, Entertainment & Recreation | 0 (0.0%) | 0 (0.0%) |
| Accommodation & Food Services | 64 (44.8%) | 79 (55.2%) |
| Public Administration | 66 (100.0%) | 0 (0.0%) |
| Total | 1,331 (54.1%) | 1,127 (45.9%) |
Education in Whiteland
School Enrollment in Whiteland
The most common levels of schooling among the 1,107 students in Whiteland are college / undergraduate (451 | 40.7%), middle school (253 | 22.9%), and elementary school (163 | 14.7%).
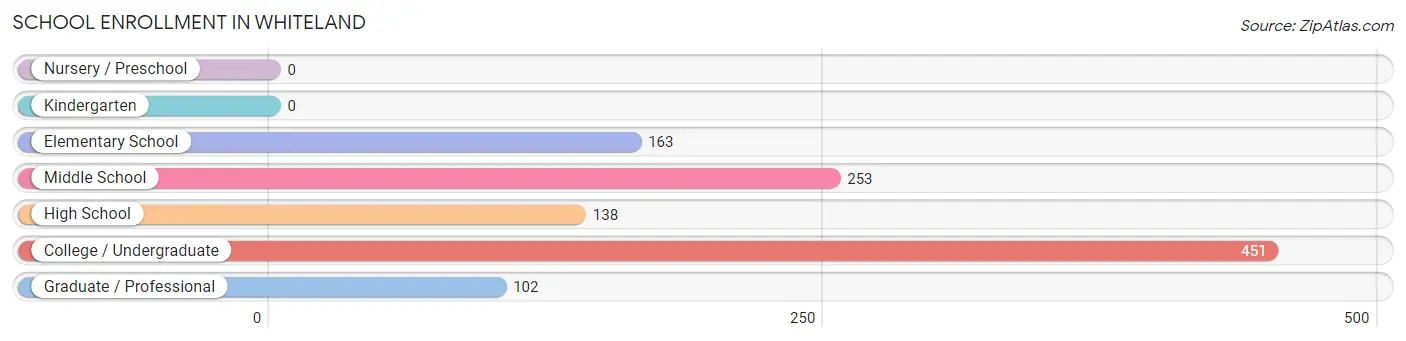
| School Level | # Students | % Students |
| Nursery / Preschool | 0 | 0.0% |
| Kindergarten | 0 | 0.0% |
| Elementary School | 163 | 14.7% |
| Middle School | 253 | 22.9% |
| High School | 138 | 12.5% |
| College / Undergraduate | 451 | 40.7% |
| Graduate / Professional | 102 | 9.2% |
| Total | 1,107 | 100.0% |
School Enrollment by Age by Funding Source in Whiteland
Out of a total of 1,107 students who are enrolled in schools in Whiteland, 43 (3.9%) attend a private institution, while the remaining 1,064 (96.1%) are enrolled in public schools. The age group of 25 to 34 year olds has the highest likelihood of being enrolled in private schools, with 31 (33.7% in the age bracket) enrolled. Conversely, the age group of 5 to 9 year old has the lowest likelihood of being enrolled in a private school, with 136 (100.0% in the age bracket) attending a public institution.
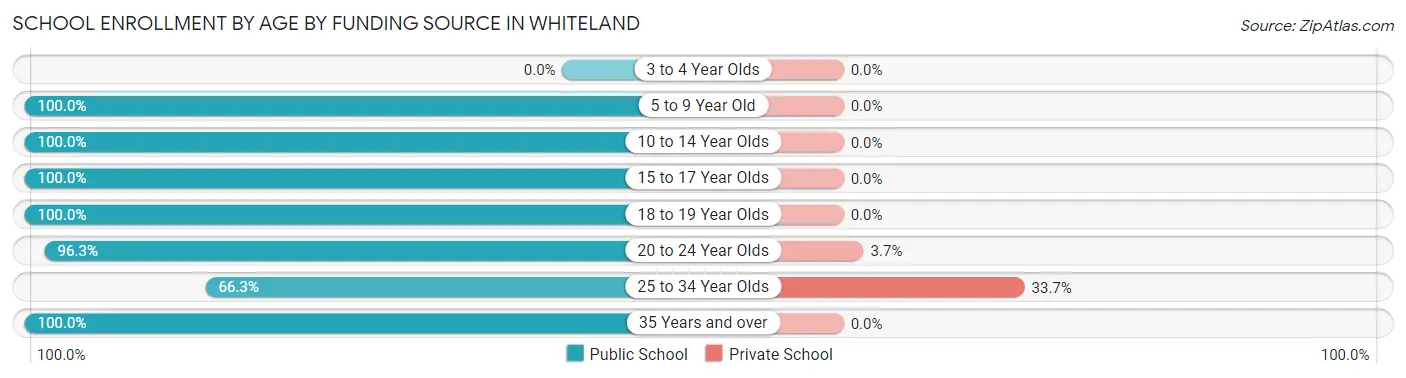
| Age Bracket | Public School | Private School |
| 3 to 4 Year Olds | 0 (0.0%) | 0 (0.0%) |
| 5 to 9 Year Old | 136 (100.0%) | 0 (0.0%) |
| 10 to 14 Year Olds | 280 (100.0%) | 0 (0.0%) |
| 15 to 17 Year Olds | 114 (100.0%) | 0 (0.0%) |
| 18 to 19 Year Olds | 46 (100.0%) | 0 (0.0%) |
| 20 to 24 Year Olds | 311 (96.3%) | 12 (3.7%) |
| 25 to 34 Year Olds | 61 (66.3%) | 31 (33.7%) |
| 35 Years and over | 116 (100.0%) | 0 (0.0%) |
| Total | 1,064 (96.1%) | 43 (3.9%) |
Educational Attainment by Field of Study in Whiteland
Education (217 | 21.6%), business (181 | 18.0%), liberal arts & history (155 | 15.4%), visual & performing arts (151 | 15.0%), and science & technology (114 | 11.3%) are the most common fields of study among 1,005 individuals in Whiteland who have obtained a bachelor's degree or higher.
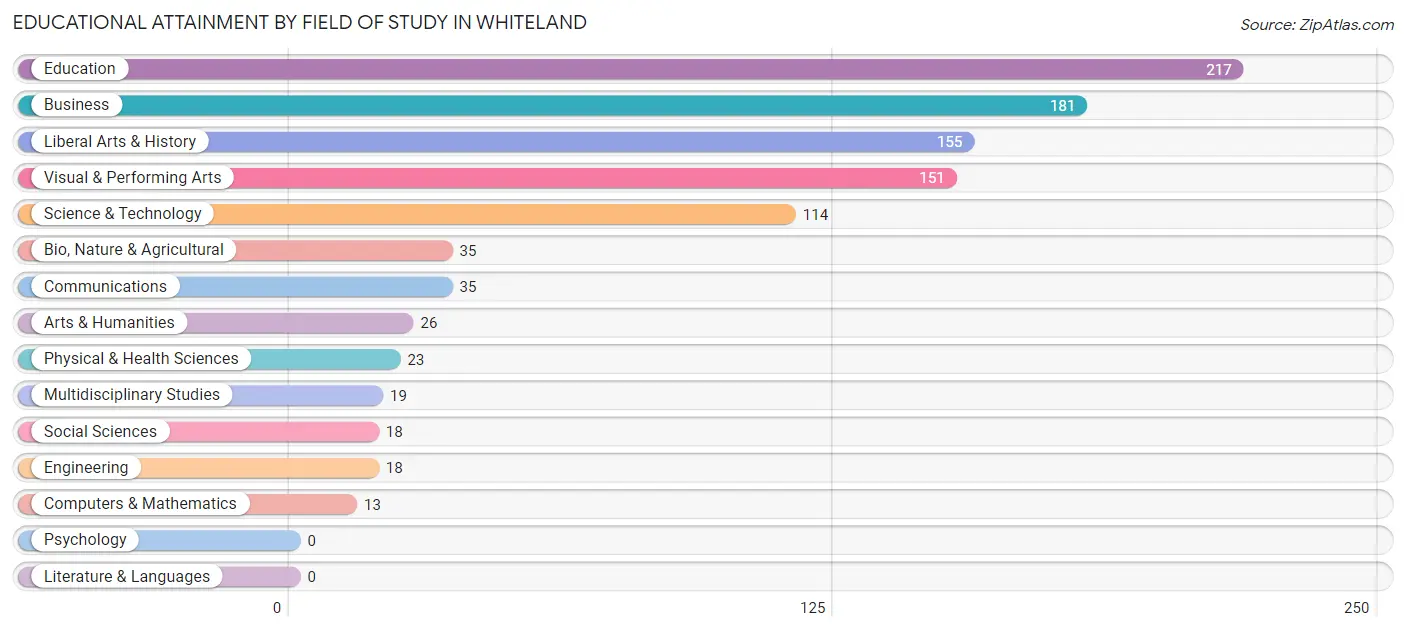
| Field of Study | # Graduates | % Graduates |
| Computers & Mathematics | 13 | 1.3% |
| Bio, Nature & Agricultural | 35 | 3.5% |
| Physical & Health Sciences | 23 | 2.3% |
| Psychology | 0 | 0.0% |
| Social Sciences | 18 | 1.8% |
| Engineering | 18 | 1.8% |
| Multidisciplinary Studies | 19 | 1.9% |
| Science & Technology | 114 | 11.3% |
| Business | 181 | 18.0% |
| Education | 217 | 21.6% |
| Literature & Languages | 0 | 0.0% |
| Liberal Arts & History | 155 | 15.4% |
| Visual & Performing Arts | 151 | 15.0% |
| Communications | 35 | 3.5% |
| Arts & Humanities | 26 | 2.6% |
| Total | 1,005 | 100.0% |
Transportation & Commute in Whiteland
Vehicle Availability by Sex in Whiteland
The most prevalent vehicle ownership categories in Whiteland are males with 2 vehicles (713, accounting for 53.1%) and females with 2 vehicles (470, making up 63.3%).
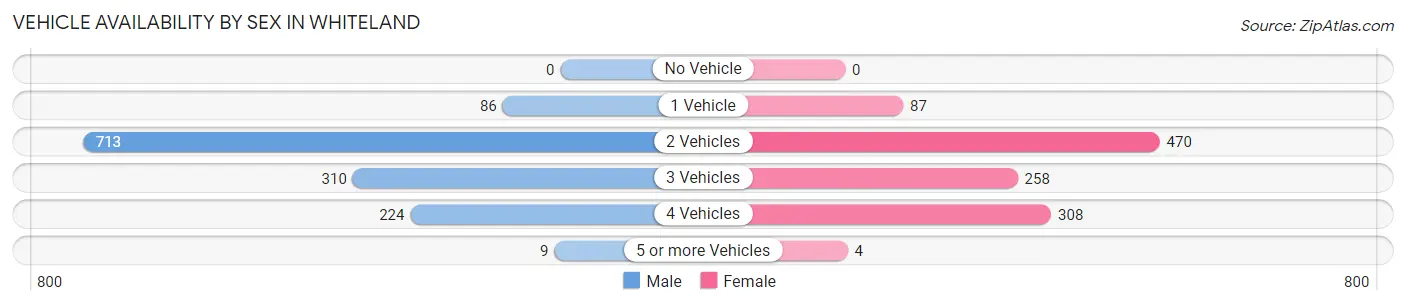
| Vehicles Available | Male | Female |
| No Vehicle | 0 (0.0%) | 0 (0.0%) |
| 1 Vehicle | 86 (6.4%) | 87 (7.7%) |
| 2 Vehicles | 713 (53.1%) | 470 (41.7%) |
| 3 Vehicles | 310 (23.1%) | 258 (22.9%) |
| 4 Vehicles | 224 (16.7%) | 308 (27.3%) |
| 5 or more Vehicles | 9 (0.7%) | 4 (0.4%) |
| Total | 1,342 (100.0%) | 1,127 (100.0%) |
Commute Time in Whiteland
The most frequently occuring commute durations in Whiteland are 10 to 14 minutes (386 commuters, 16.4%), 30 to 34 minutes (385 commuters, 16.4%), and 40 to 44 minutes (358 commuters, 15.2%).
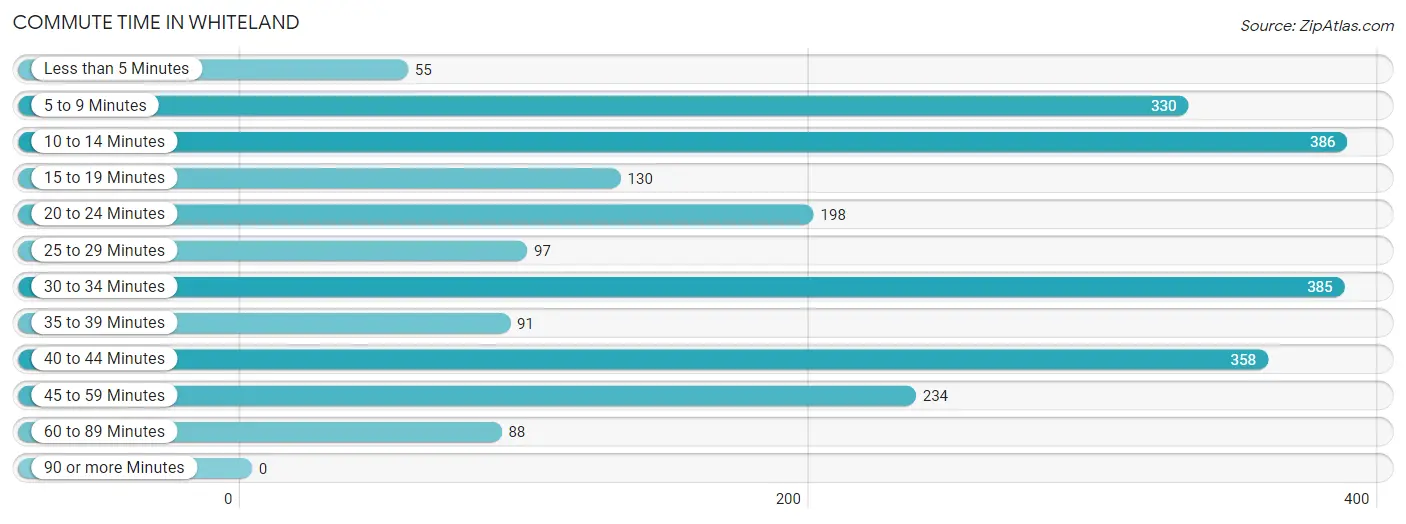
| Commute Time | # Commuters | % Commuters |
| Less than 5 Minutes | 55 | 2.3% |
| 5 to 9 Minutes | 330 | 14.0% |
| 10 to 14 Minutes | 386 | 16.4% |
| 15 to 19 Minutes | 130 | 5.5% |
| 20 to 24 Minutes | 198 | 8.4% |
| 25 to 29 Minutes | 97 | 4.1% |
| 30 to 34 Minutes | 385 | 16.4% |
| 35 to 39 Minutes | 91 | 3.9% |
| 40 to 44 Minutes | 358 | 15.2% |
| 45 to 59 Minutes | 234 | 10.0% |
| 60 to 89 Minutes | 88 | 3.7% |
| 90 or more Minutes | 0 | 0.0% |
Commute Time by Sex in Whiteland
The most common commute times in Whiteland are 30 to 34 minutes (322 commuters, 24.9%) for males and 40 to 44 minutes (282 commuters, 26.6%) for females.
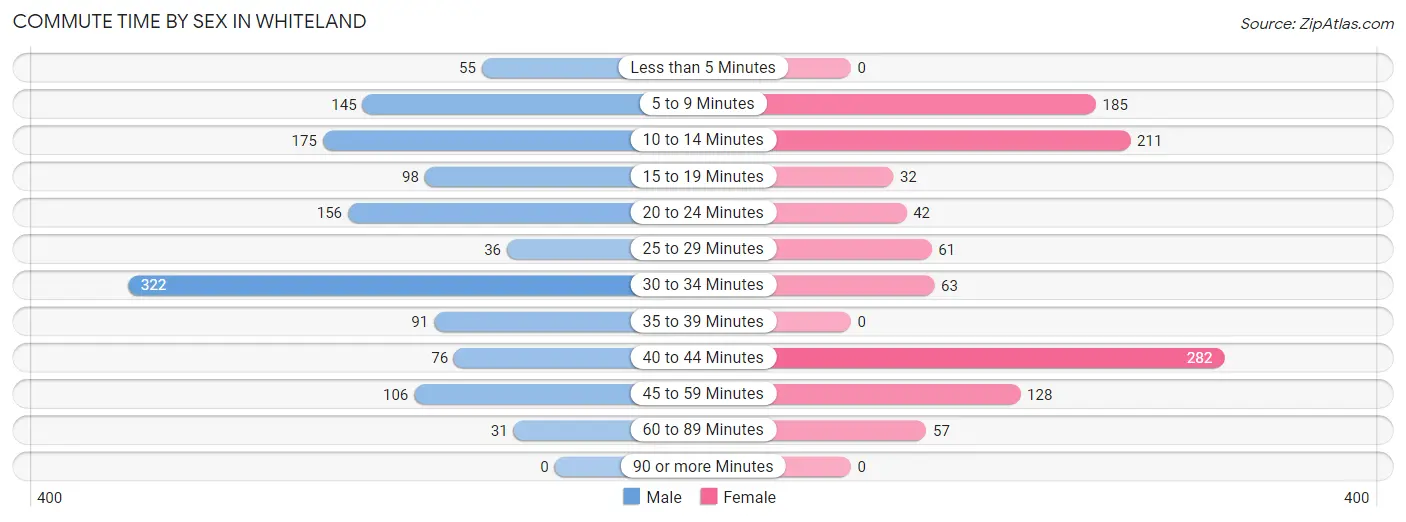
| Commute Time | Male | Female |
| Less than 5 Minutes | 55 (4.3%) | 0 (0.0%) |
| 5 to 9 Minutes | 145 (11.2%) | 185 (17.4%) |
| 10 to 14 Minutes | 175 (13.6%) | 211 (19.9%) |
| 15 to 19 Minutes | 98 (7.6%) | 32 (3.0%) |
| 20 to 24 Minutes | 156 (12.1%) | 42 (4.0%) |
| 25 to 29 Minutes | 36 (2.8%) | 61 (5.8%) |
| 30 to 34 Minutes | 322 (24.9%) | 63 (5.9%) |
| 35 to 39 Minutes | 91 (7.0%) | 0 (0.0%) |
| 40 to 44 Minutes | 76 (5.9%) | 282 (26.6%) |
| 45 to 59 Minutes | 106 (8.2%) | 128 (12.1%) |
| 60 to 89 Minutes | 31 (2.4%) | 57 (5.4%) |
| 90 or more Minutes | 0 (0.0%) | 0 (0.0%) |
Time of Departure to Work by Sex in Whiteland
The most frequent times of departure to work in Whiteland are 6:00 AM to 6:29 AM (271, 21.0%) for males and 7:00 AM to 7:29 AM (291, 27.4%) for females.
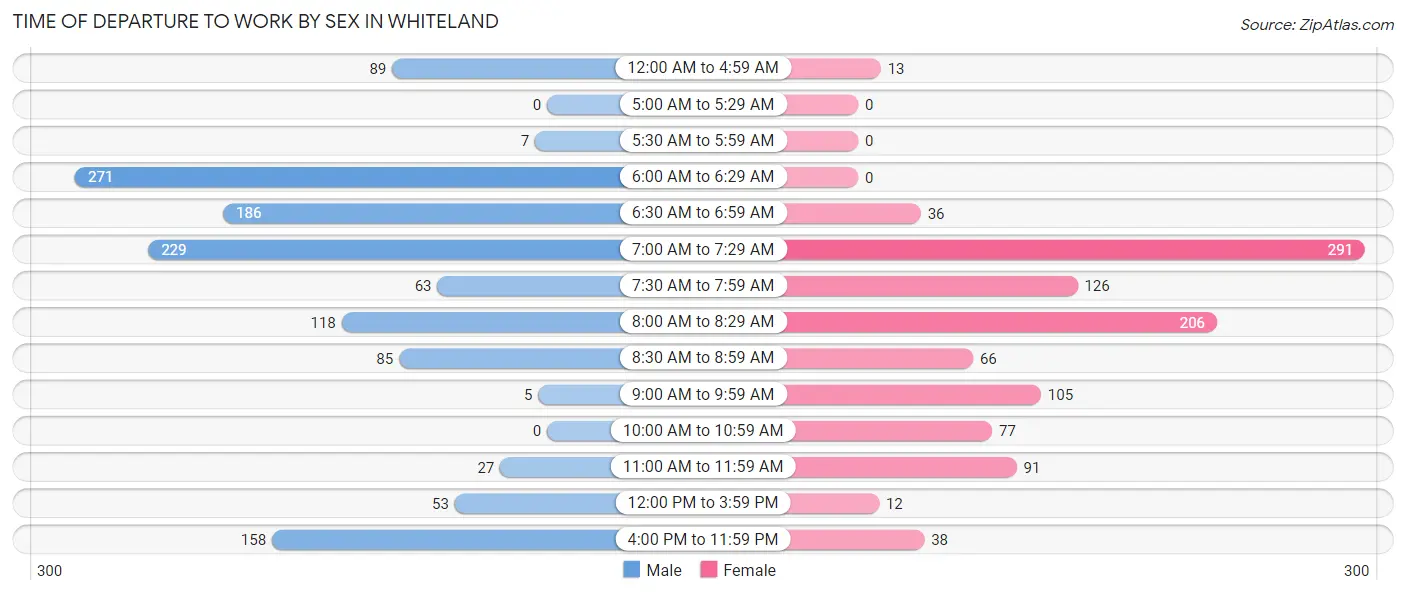
| Time of Departure | Male | Female |
| 12:00 AM to 4:59 AM | 89 (6.9%) | 13 (1.2%) |
| 5:00 AM to 5:29 AM | 0 (0.0%) | 0 (0.0%) |
| 5:30 AM to 5:59 AM | 7 (0.5%) | 0 (0.0%) |
| 6:00 AM to 6:29 AM | 271 (21.0%) | 0 (0.0%) |
| 6:30 AM to 6:59 AM | 186 (14.4%) | 36 (3.4%) |
| 7:00 AM to 7:29 AM | 229 (17.7%) | 291 (27.4%) |
| 7:30 AM to 7:59 AM | 63 (4.9%) | 126 (11.9%) |
| 8:00 AM to 8:29 AM | 118 (9.1%) | 206 (19.4%) |
| 8:30 AM to 8:59 AM | 85 (6.6%) | 66 (6.2%) |
| 9:00 AM to 9:59 AM | 5 (0.4%) | 105 (9.9%) |
| 10:00 AM to 10:59 AM | 0 (0.0%) | 77 (7.3%) |
| 11:00 AM to 11:59 AM | 27 (2.1%) | 91 (8.6%) |
| 12:00 PM to 3:59 PM | 53 (4.1%) | 12 (1.1%) |
| 4:00 PM to 11:59 PM | 158 (12.2%) | 38 (3.6%) |
| Total | 1,291 (100.0%) | 1,061 (100.0%) |
Housing Occupancy in Whiteland
Occupancy by Ownership in Whiteland
Of the total 1,592 dwellings in Whiteland, owner-occupied units account for 1,395 (87.6%), while renter-occupied units make up 197 (12.4%).
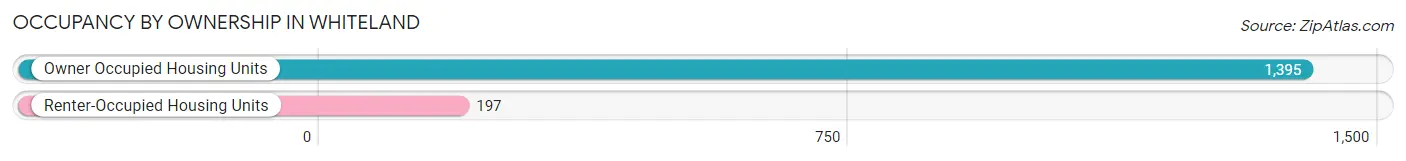
| Occupancy | # Housing Units | % Housing Units |
| Owner Occupied Housing Units | 1,395 | 87.6% |
| Renter-Occupied Housing Units | 197 | 12.4% |
| Total Occupied Housing Units | 1,592 | 100.0% |
Occupancy by Household Size in Whiteland
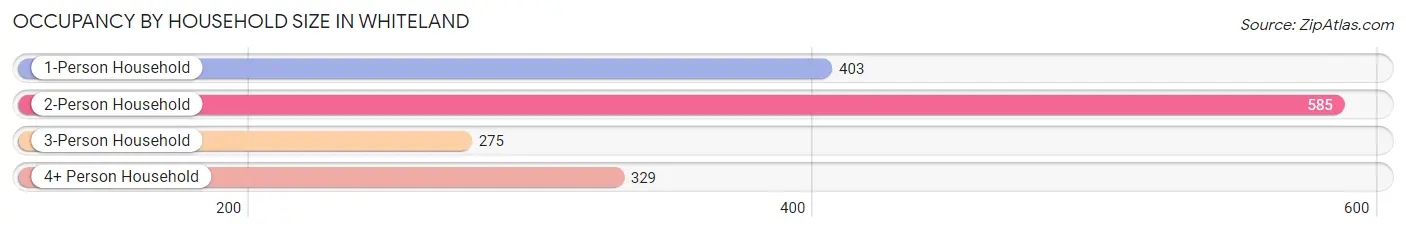
| Household Size | # Housing Units | % Housing Units |
| 1-Person Household | 403 | 25.3% |
| 2-Person Household | 585 | 36.7% |
| 3-Person Household | 275 | 17.3% |
| 4+ Person Household | 329 | 20.7% |
| Total Housing Units | 1,592 | 100.0% |
Occupancy by Ownership by Household Size in Whiteland
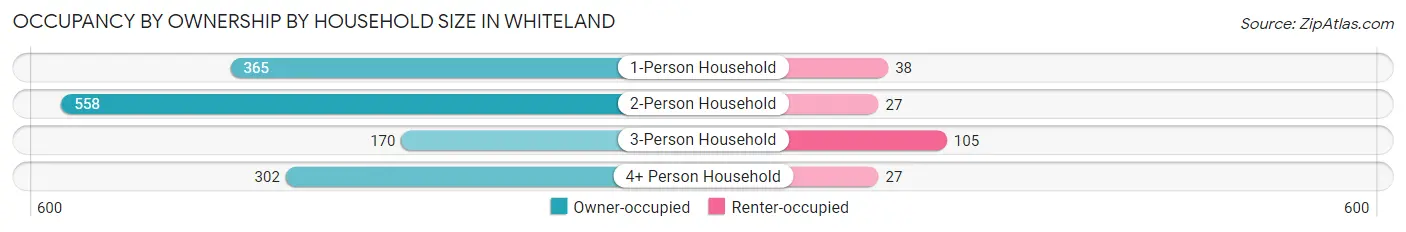
| Household Size | Owner-occupied | Renter-occupied |
| 1-Person Household | 365 (90.6%) | 38 (9.4%) |
| 2-Person Household | 558 (95.4%) | 27 (4.6%) |
| 3-Person Household | 170 (61.8%) | 105 (38.2%) |
| 4+ Person Household | 302 (91.8%) | 27 (8.2%) |
| Total Housing Units | 1,395 (87.6%) | 197 (12.4%) |
Occupancy by Educational Attainment in Whiteland
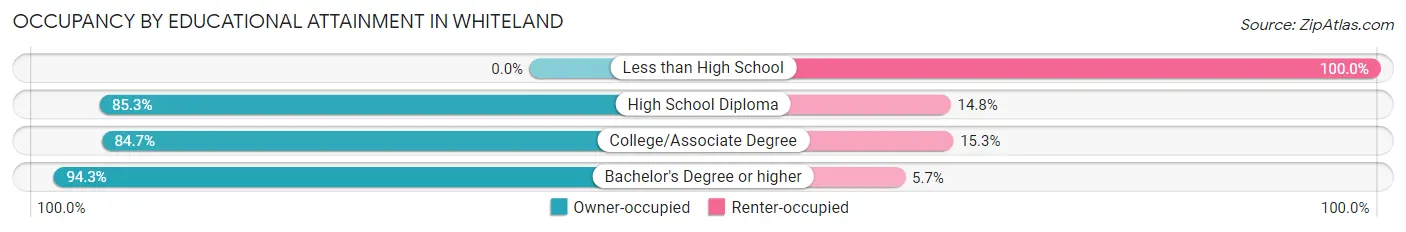
| Household Size | Owner-occupied | Renter-occupied |
| Less than High School | 0 (0.0%) | 10 (100.0%) |
| High School Diploma | 497 (85.3%) | 86 (14.7%) |
| College/Associate Degree | 388 (84.7%) | 70 (15.3%) |
| Bachelor's Degree or higher | 510 (94.3%) | 31 (5.7%) |
Occupancy by Age of Householder in Whiteland
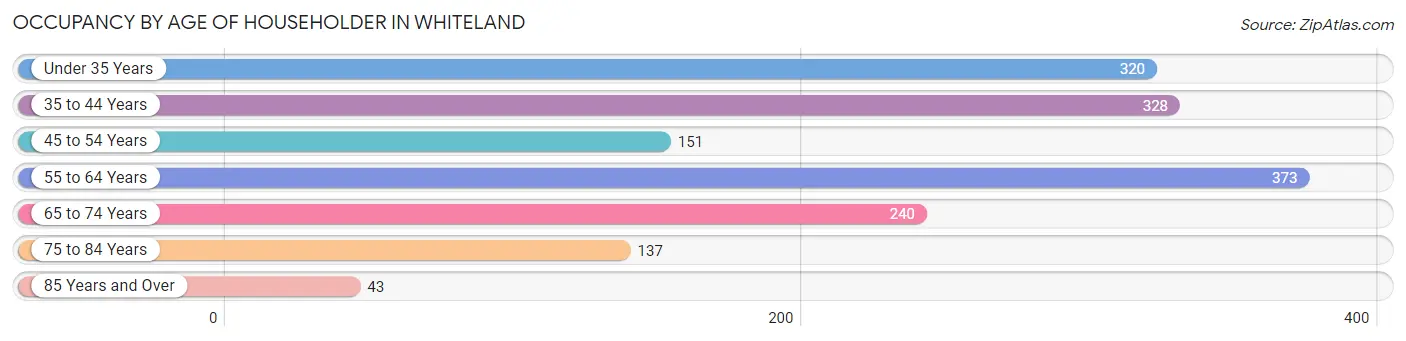
| Age Bracket | # Households | % Households |
| Under 35 Years | 320 | 20.1% |
| 35 to 44 Years | 328 | 20.6% |
| 45 to 54 Years | 151 | 9.5% |
| 55 to 64 Years | 373 | 23.4% |
| 65 to 74 Years | 240 | 15.1% |
| 75 to 84 Years | 137 | 8.6% |
| 85 Years and Over | 43 | 2.7% |
| Total | 1,592 | 100.0% |
Housing Finances in Whiteland
Median Income by Occupancy in Whiteland
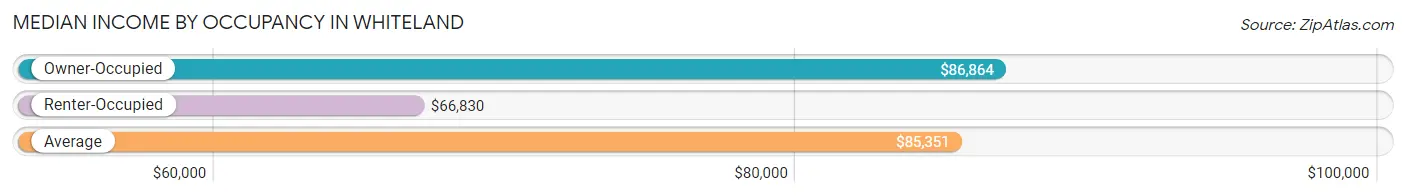
| Occupancy Type | # Households | Median Income |
| Owner-Occupied | 1,395 (87.6%) | $86,864 |
| Renter-Occupied | 197 (12.4%) | $66,830 |
| Average | 1,592 (100.0%) | $85,351 |
Occupancy by Householder Income Bracket in Whiteland
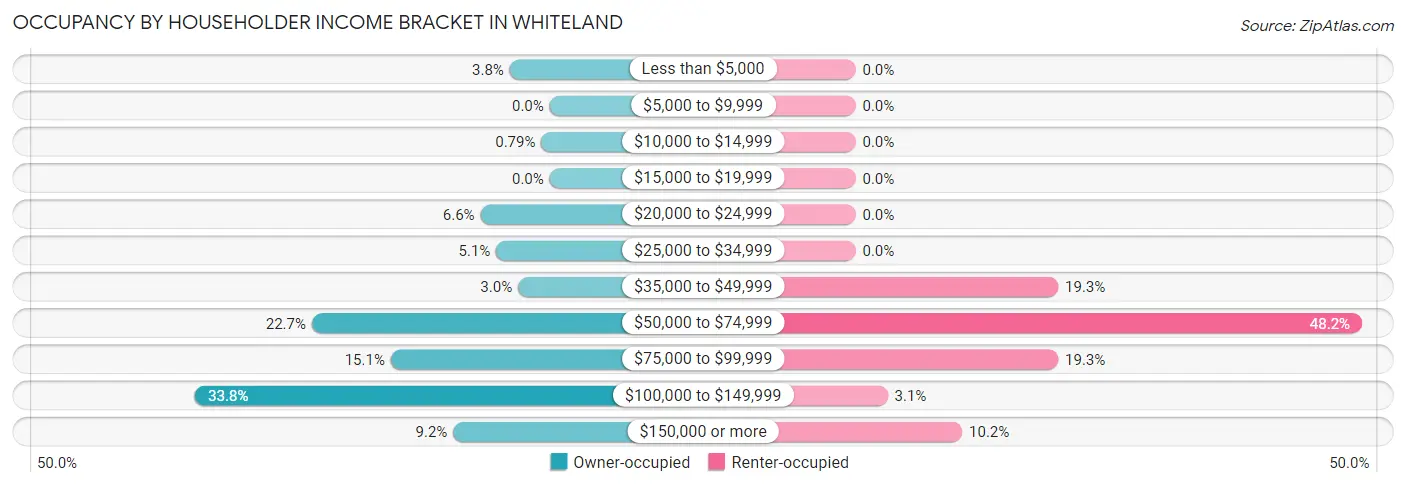
| Income Bracket | Owner-occupied | Renter-occupied |
| Less than $5,000 | 53 (3.8%) | 0 (0.0%) |
| $5,000 to $9,999 | 0 (0.0%) | 0 (0.0%) |
| $10,000 to $14,999 | 11 (0.8%) | 0 (0.0%) |
| $15,000 to $19,999 | 0 (0.0%) | 0 (0.0%) |
| $20,000 to $24,999 | 92 (6.6%) | 0 (0.0%) |
| $25,000 to $34,999 | 71 (5.1%) | 0 (0.0%) |
| $35,000 to $49,999 | 42 (3.0%) | 38 (19.3%) |
| $50,000 to $74,999 | 316 (22.7%) | 95 (48.2%) |
| $75,000 to $99,999 | 211 (15.1%) | 38 (19.3%) |
| $100,000 to $149,999 | 471 (33.8%) | 6 (3.0%) |
| $150,000 or more | 128 (9.2%) | 20 (10.2%) |
| Total | 1,395 (100.0%) | 197 (100.0%) |
Monthly Housing Cost Tiers in Whiteland
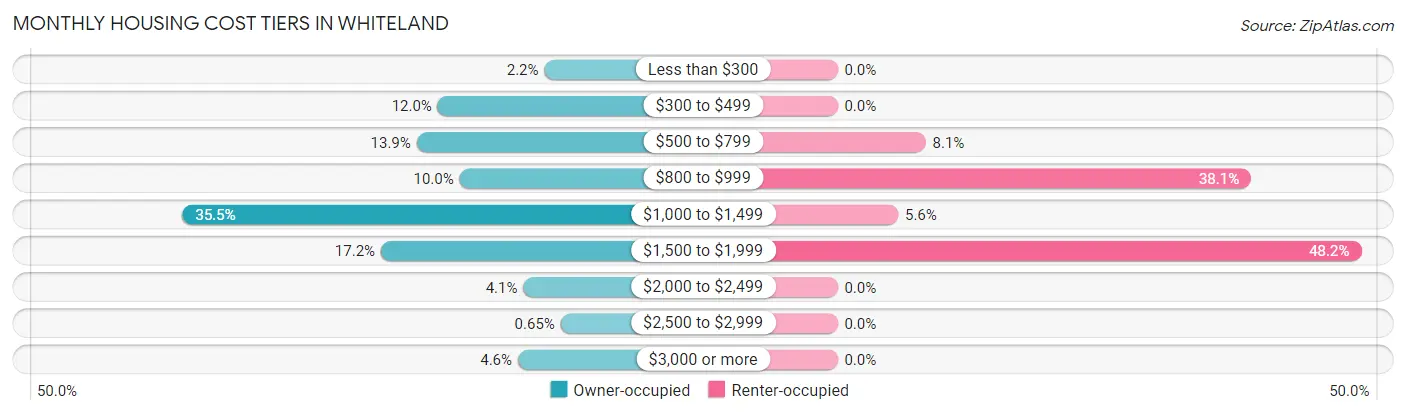
| Monthly Cost | Owner-occupied | Renter-occupied |
| Less than $300 | 30 (2.1%) | 0 (0.0%) |
| $300 to $499 | 167 (12.0%) | 0 (0.0%) |
| $500 to $799 | 194 (13.9%) | 16 (8.1%) |
| $800 to $999 | 139 (10.0%) | 75 (38.1%) |
| $1,000 to $1,499 | 495 (35.5%) | 11 (5.6%) |
| $1,500 to $1,999 | 240 (17.2%) | 95 (48.2%) |
| $2,000 to $2,499 | 57 (4.1%) | 0 (0.0%) |
| $2,500 to $2,999 | 9 (0.6%) | 0 (0.0%) |
| $3,000 or more | 64 (4.6%) | 0 (0.0%) |
| Total | 1,395 (100.0%) | 197 (100.0%) |
Physical Housing Characteristics in Whiteland
Housing Structures in Whiteland
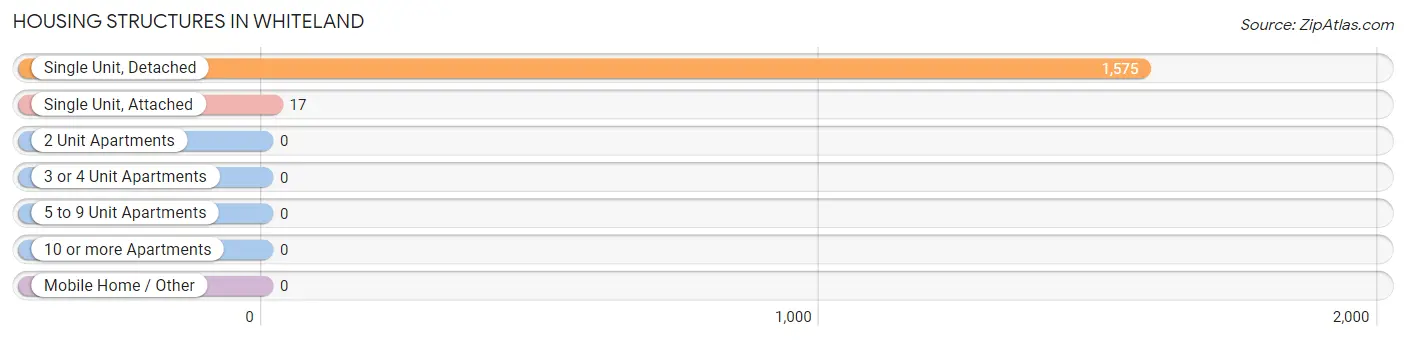
| Structure Type | # Housing Units | % Housing Units |
| Single Unit, Detached | 1,575 | 98.9% |
| Single Unit, Attached | 17 | 1.1% |
| 2 Unit Apartments | 0 | 0.0% |
| 3 or 4 Unit Apartments | 0 | 0.0% |
| 5 to 9 Unit Apartments | 0 | 0.0% |
| 10 or more Apartments | 0 | 0.0% |
| Mobile Home / Other | 0 | 0.0% |
| Total | 1,592 | 100.0% |
Housing Structures by Occupancy in Whiteland
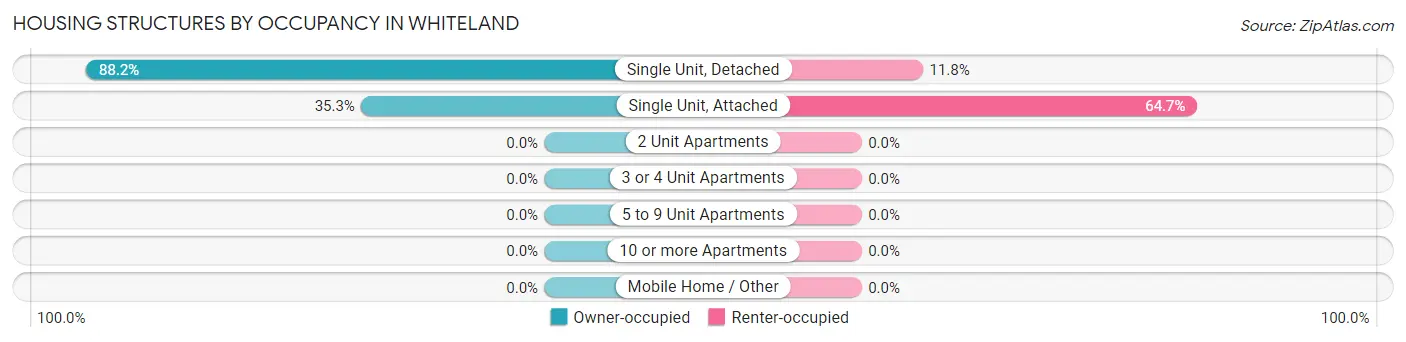
| Structure Type | Owner-occupied | Renter-occupied |
| Single Unit, Detached | 1,389 (88.2%) | 186 (11.8%) |
| Single Unit, Attached | 6 (35.3%) | 11 (64.7%) |
| 2 Unit Apartments | 0 (0.0%) | 0 (0.0%) |
| 3 or 4 Unit Apartments | 0 (0.0%) | 0 (0.0%) |
| 5 to 9 Unit Apartments | 0 (0.0%) | 0 (0.0%) |
| 10 or more Apartments | 0 (0.0%) | 0 (0.0%) |
| Mobile Home / Other | 0 (0.0%) | 0 (0.0%) |
| Total | 1,395 (87.6%) | 197 (12.4%) |
Housing Structures by Number of Rooms in Whiteland
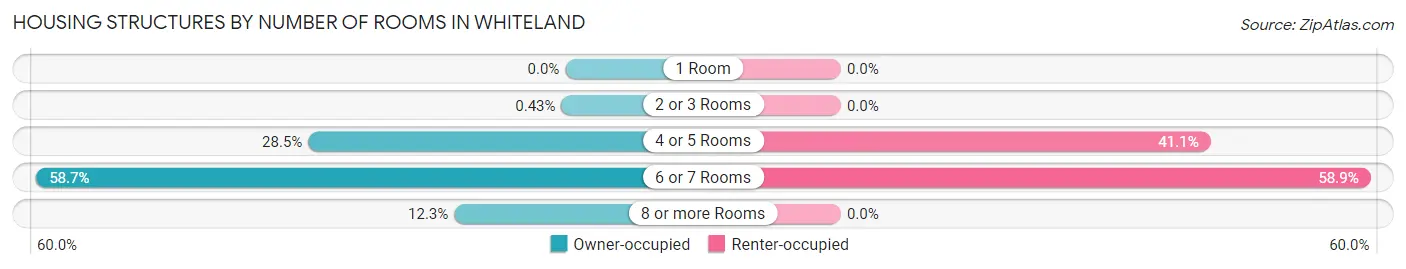
| Number of Rooms | Owner-occupied | Renter-occupied |
| 1 Room | 0 (0.0%) | 0 (0.0%) |
| 2 or 3 Rooms | 6 (0.4%) | 0 (0.0%) |
| 4 or 5 Rooms | 398 (28.5%) | 81 (41.1%) |
| 6 or 7 Rooms | 819 (58.7%) | 116 (58.9%) |
| 8 or more Rooms | 172 (12.3%) | 0 (0.0%) |
| Total | 1,395 (100.0%) | 197 (100.0%) |
Housing Structure by Heating Type in Whiteland
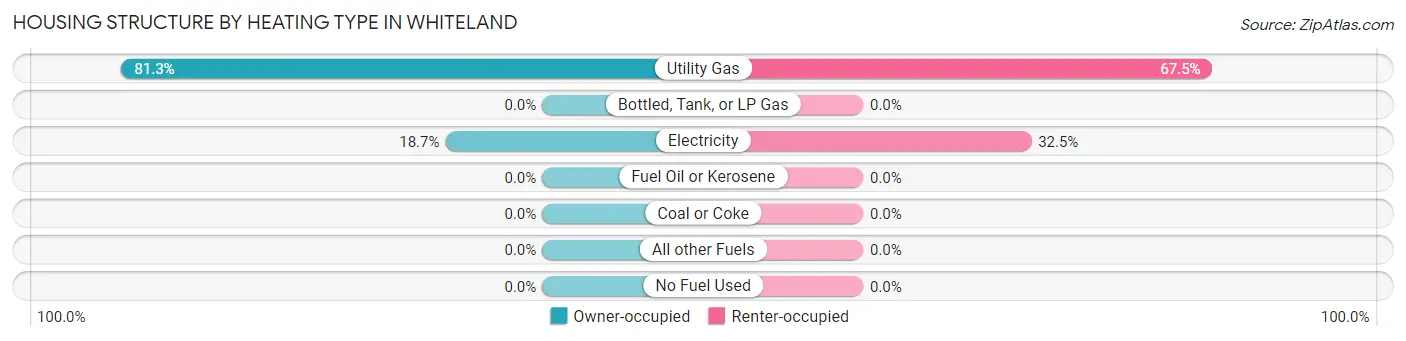
| Heating Type | Owner-occupied | Renter-occupied |
| Utility Gas | 1,134 (81.3%) | 133 (67.5%) |
| Bottled, Tank, or LP Gas | 0 (0.0%) | 0 (0.0%) |
| Electricity | 261 (18.7%) | 64 (32.5%) |
| Fuel Oil or Kerosene | 0 (0.0%) | 0 (0.0%) |
| Coal or Coke | 0 (0.0%) | 0 (0.0%) |
| All other Fuels | 0 (0.0%) | 0 (0.0%) |
| No Fuel Used | 0 (0.0%) | 0 (0.0%) |
| Total | 1,395 (100.0%) | 197 (100.0%) |
Household Vehicle Usage in Whiteland
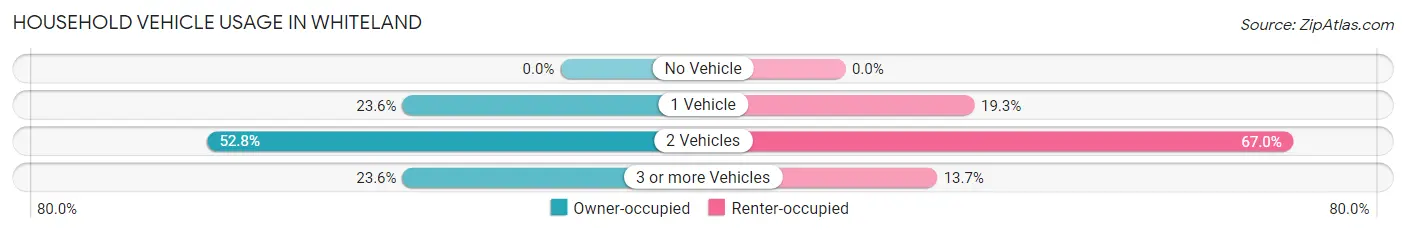
| Vehicles per Household | Owner-occupied | Renter-occupied |
| No Vehicle | 0 (0.0%) | 0 (0.0%) |
| 1 Vehicle | 329 (23.6%) | 38 (19.3%) |
| 2 Vehicles | 737 (52.8%) | 132 (67.0%) |
| 3 or more Vehicles | 329 (23.6%) | 27 (13.7%) |
| Total | 1,395 (100.0%) | 197 (100.0%) |
Real Estate & Mortgages in Whiteland
Real Estate and Mortgage Overview in Whiteland
| Characteristic | Without Mortgage | With Mortgage |
| Housing Units | 329 | 1,066 |
| Median Property Value | $173,500 | $174,600 |
| Median Household Income | $72,563 | $93 |
| Monthly Housing Costs | $448 | $64 |
| Real Estate Taxes | $1,465 | $0 |
Property Value by Mortgage Status in Whiteland
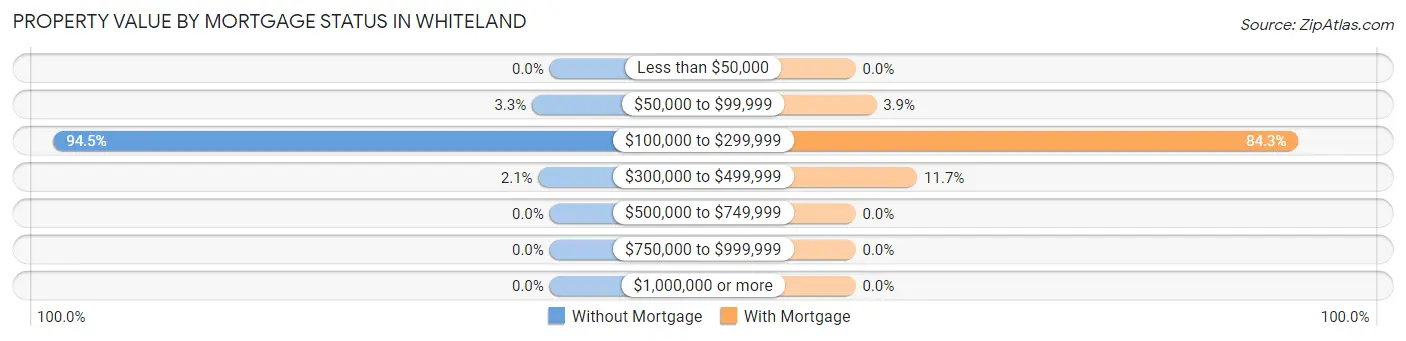
| Property Value | Without Mortgage | With Mortgage |
| Less than $50,000 | 0 (0.0%) | 0 (0.0%) |
| $50,000 to $99,999 | 11 (3.3%) | 42 (3.9%) |
| $100,000 to $299,999 | 311 (94.5%) | 899 (84.3%) |
| $300,000 to $499,999 | 7 (2.1%) | 125 (11.7%) |
| $500,000 to $749,999 | 0 (0.0%) | 0 (0.0%) |
| $750,000 to $999,999 | 0 (0.0%) | 0 (0.0%) |
| $1,000,000 or more | 0 (0.0%) | 0 (0.0%) |
| Total | 329 (100.0%) | 1,066 (100.0%) |
Household Income by Mortgage Status in Whiteland
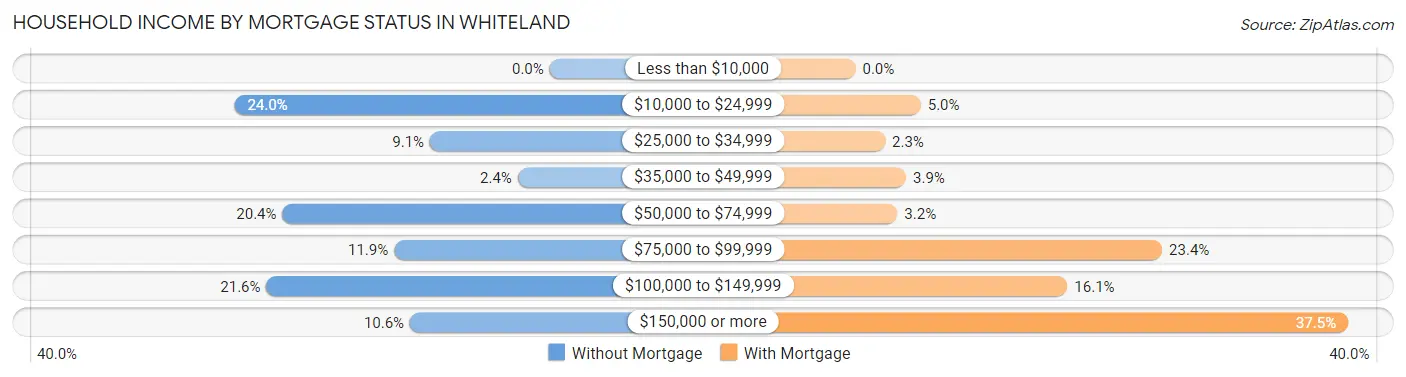
| Household Income | Without Mortgage | With Mortgage |
| Less than $10,000 | 0 (0.0%) | 0 (0.0%) |
| $10,000 to $24,999 | 79 (24.0%) | 53 (5.0%) |
| $25,000 to $34,999 | 30 (9.1%) | 24 (2.2%) |
| $35,000 to $49,999 | 8 (2.4%) | 41 (3.8%) |
| $50,000 to $74,999 | 67 (20.4%) | 34 (3.2%) |
| $75,000 to $99,999 | 39 (11.8%) | 249 (23.4%) |
| $100,000 to $149,999 | 71 (21.6%) | 172 (16.1%) |
| $150,000 or more | 35 (10.6%) | 400 (37.5%) |
| Total | 329 (100.0%) | 1,066 (100.0%) |
Property Value to Household Income Ratio in Whiteland
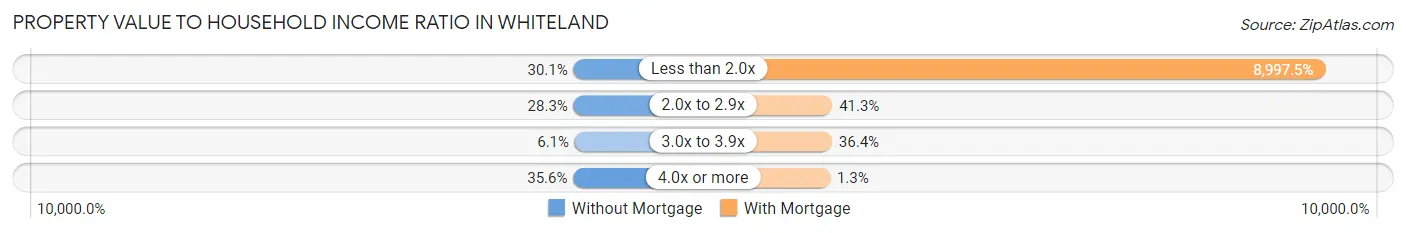
| Value-to-Income Ratio | Without Mortgage | With Mortgage |
| Less than 2.0x | 99 (30.1%) | 95,913 (8,997.5%) |
| 2.0x to 2.9x | 93 (28.3%) | 440 (41.3%) |
| 3.0x to 3.9x | 20 (6.1%) | 388 (36.4%) |
| 4.0x or more | 117 (35.6%) | 14 (1.3%) |
| Total | 329 (100.0%) | 1,066 (100.0%) |
Real Estate Taxes by Mortgage Status in Whiteland
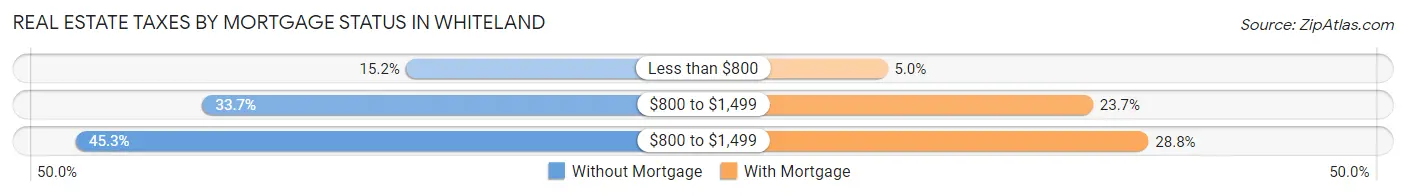
| Property Taxes | Without Mortgage | With Mortgage |
| Less than $800 | 50 (15.2%) | 53 (5.0%) |
| $800 to $1,499 | 111 (33.7%) | 253 (23.7%) |
| $800 to $1,499 | 149 (45.3%) | 307 (28.8%) |
| Total | 329 (100.0%) | 1,066 (100.0%) |
Health & Disability in Whiteland
Health Insurance Coverage by Age in Whiteland
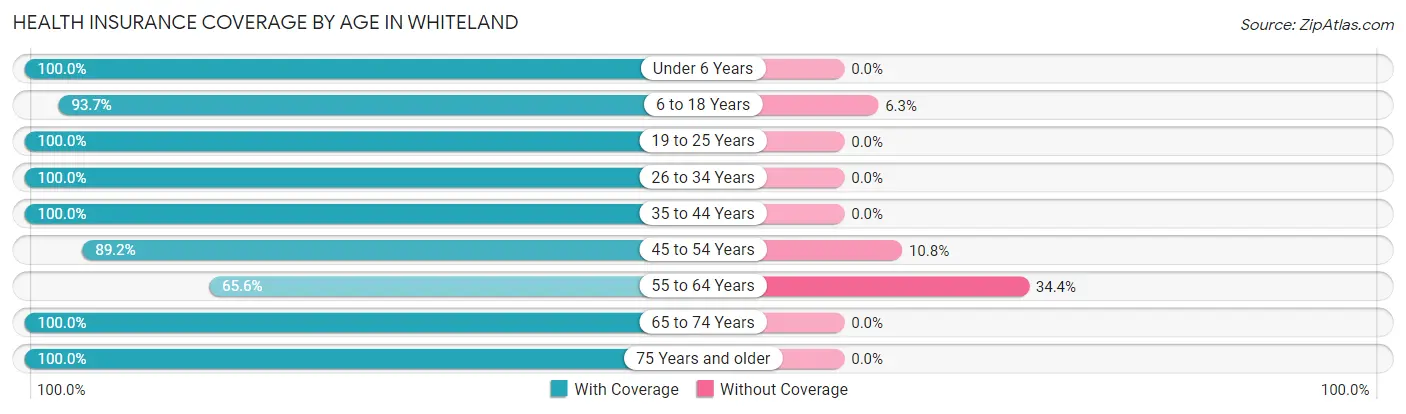
| Age Bracket | With Coverage | Without Coverage |
| Under 6 Years | 93 (100.0%) | 0 (0.0%) |
| 6 to 18 Years | 519 (93.7%) | 35 (6.3%) |
| 19 to 25 Years | 382 (100.0%) | 0 (0.0%) |
| 26 to 34 Years | 821 (100.0%) | 0 (0.0%) |
| 35 to 44 Years | 507 (100.0%) | 0 (0.0%) |
| 45 to 54 Years | 456 (89.2%) | 55 (10.8%) |
| 55 to 64 Years | 541 (65.6%) | 284 (34.4%) |
| 65 to 74 Years | 331 (100.0%) | 0 (0.0%) |
| 75 Years and older | 243 (100.0%) | 0 (0.0%) |
| Total | 3,893 (91.2%) | 374 (8.8%) |
Health Insurance Coverage by Citizenship Status in Whiteland
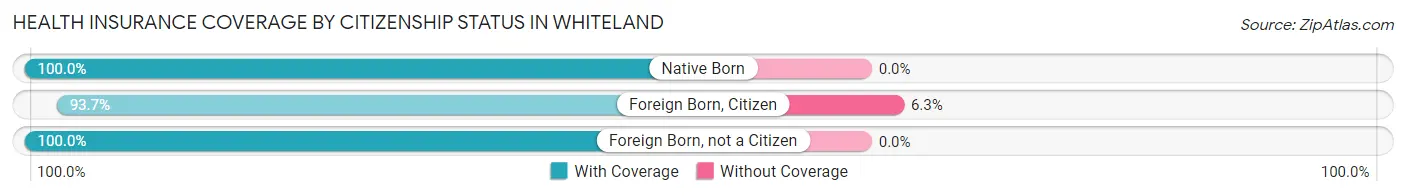
| Citizenship Status | With Coverage | Without Coverage |
| Native Born | 93 (100.0%) | 0 (0.0%) |
| Foreign Born, Citizen | 519 (93.7%) | 35 (6.3%) |
| Foreign Born, not a Citizen | 382 (100.0%) | 0 (0.0%) |
Health Insurance Coverage by Household Income in Whiteland
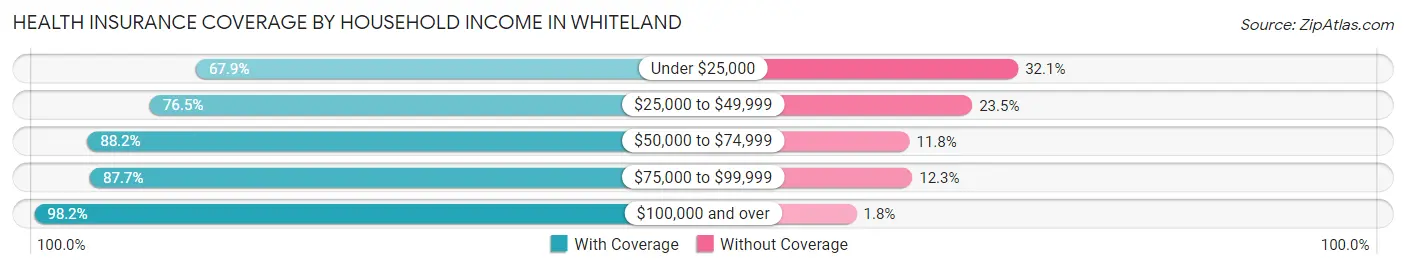
| Household Income | With Coverage | Without Coverage |
| Under $25,000 | 112 (67.9%) | 53 (32.1%) |
| $25,000 to $49,999 | 140 (76.5%) | 43 (23.5%) |
| $50,000 to $74,999 | 780 (88.2%) | 104 (11.8%) |
| $75,000 to $99,999 | 994 (87.7%) | 139 (12.3%) |
| $100,000 and over | 1,867 (98.2%) | 35 (1.8%) |
Public vs Private Health Insurance Coverage by Age in Whiteland
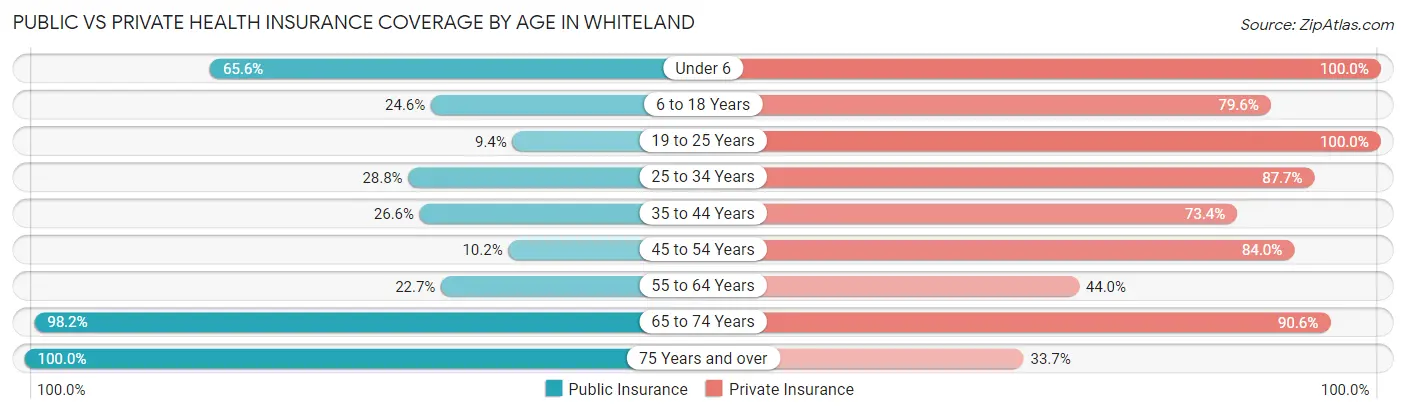
| Age Bracket | Public Insurance | Private Insurance |
| Under 6 | 61 (65.6%) | 93 (100.0%) |
| 6 to 18 Years | 136 (24.5%) | 441 (79.6%) |
| 19 to 25 Years | 36 (9.4%) | 382 (100.0%) |
| 25 to 34 Years | 236 (28.7%) | 720 (87.7%) |
| 35 to 44 Years | 135 (26.6%) | 372 (73.4%) |
| 45 to 54 Years | 52 (10.2%) | 429 (84.0%) |
| 55 to 64 Years | 187 (22.7%) | 363 (44.0%) |
| 65 to 74 Years | 325 (98.2%) | 300 (90.6%) |
| 75 Years and over | 243 (100.0%) | 82 (33.7%) |
| Total | 1,411 (33.1%) | 3,182 (74.6%) |
Disability Status by Sex by Age in Whiteland
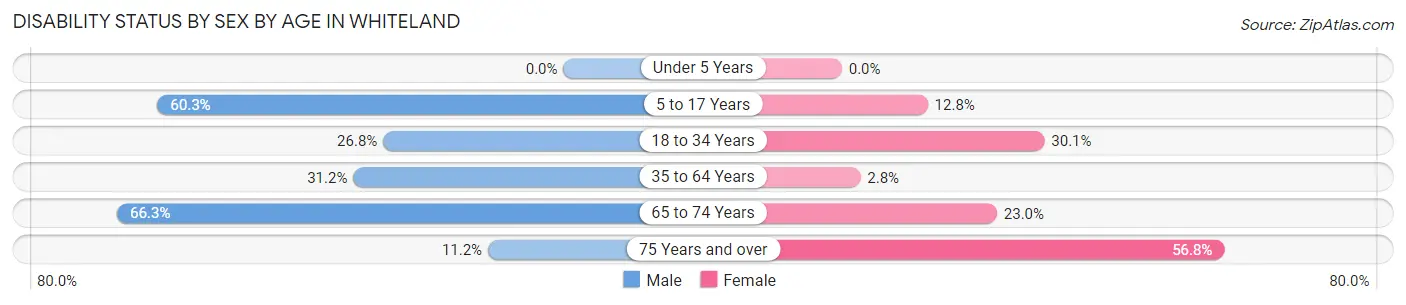
| Age Bracket | Male | Female |
| Under 5 Years | 0 (0.0%) | 0 (0.0%) |
| 5 to 17 Years | 135 (60.3%) | 39 (12.8%) |
| 18 to 34 Years | 194 (26.8%) | 151 (30.1%) |
| 35 to 64 Years | 303 (31.2%) | 24 (2.8%) |
| 65 to 74 Years | 110 (66.3%) | 38 (23.0%) |
| 75 Years and over | 14 (11.2%) | 67 (56.8%) |
Disability Class by Sex by Age in Whiteland
Disability Class: Hearing Difficulty
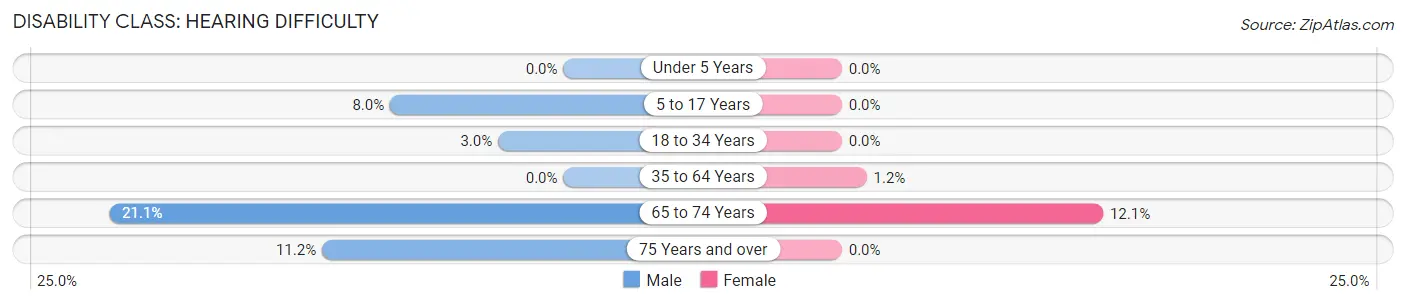
| Age Bracket | Male | Female |
| Under 5 Years | 0 (0.0%) | 0 (0.0%) |
| 5 to 17 Years | 18 (8.0%) | 0 (0.0%) |
| 18 to 34 Years | 22 (3.0%) | 0 (0.0%) |
| 35 to 64 Years | 0 (0.0%) | 10 (1.1%) |
| 65 to 74 Years | 35 (21.1%) | 20 (12.1%) |
| 75 Years and over | 14 (11.2%) | 0 (0.0%) |
Disability Class: Vision Difficulty
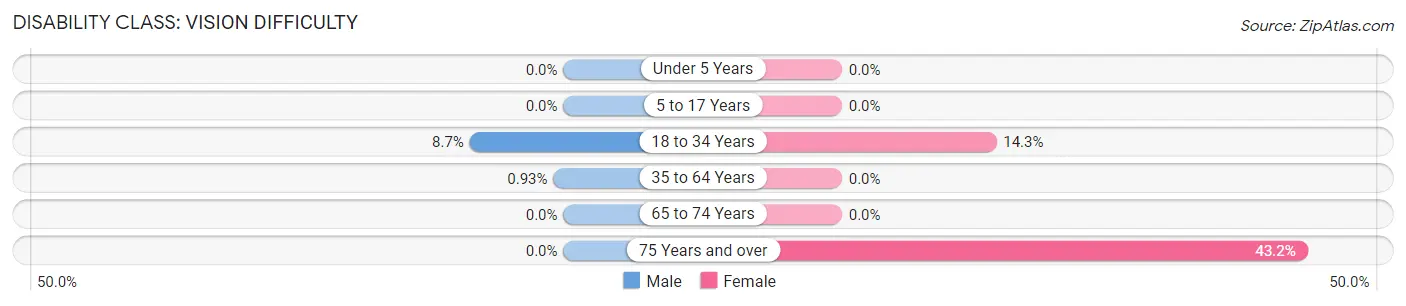
| Age Bracket | Male | Female |
| Under 5 Years | 0 (0.0%) | 0 (0.0%) |
| 5 to 17 Years | 0 (0.0%) | 0 (0.0%) |
| 18 to 34 Years | 63 (8.7%) | 72 (14.3%) |
| 35 to 64 Years | 9 (0.9%) | 0 (0.0%) |
| 65 to 74 Years | 0 (0.0%) | 0 (0.0%) |
| 75 Years and over | 0 (0.0%) | 51 (43.2%) |
Disability Class: Cognitive Difficulty
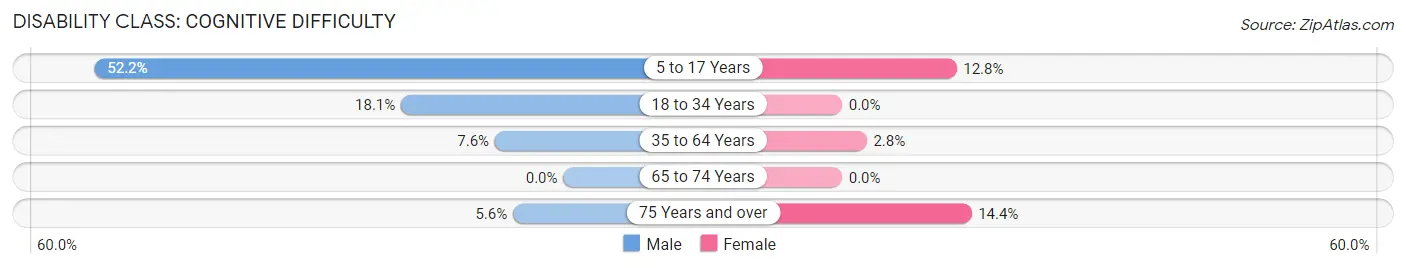
| Age Bracket | Male | Female |
| 5 to 17 Years | 117 (52.2%) | 39 (12.8%) |
| 18 to 34 Years | 131 (18.1%) | 0 (0.0%) |
| 35 to 64 Years | 74 (7.6%) | 24 (2.8%) |
| 65 to 74 Years | 0 (0.0%) | 0 (0.0%) |
| 75 Years and over | 7 (5.6%) | 17 (14.4%) |
Disability Class: Ambulatory Difficulty
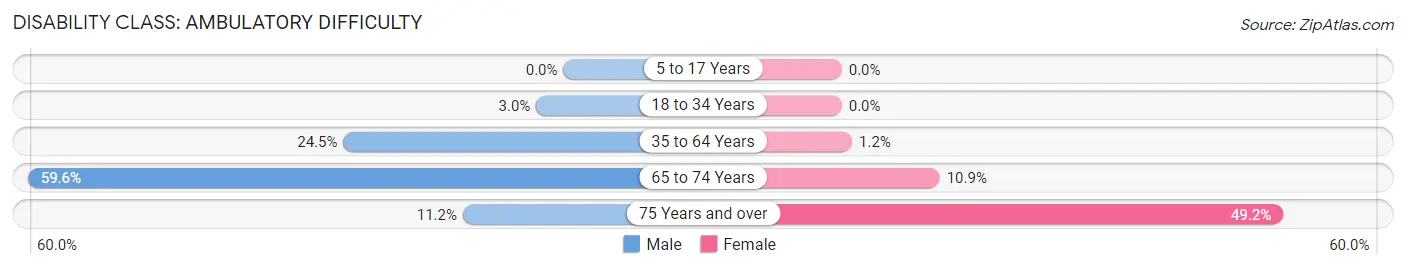
| Age Bracket | Male | Female |
| 5 to 17 Years | 0 (0.0%) | 0 (0.0%) |
| 18 to 34 Years | 22 (3.0%) | 0 (0.0%) |
| 35 to 64 Years | 238 (24.5%) | 10 (1.1%) |
| 65 to 74 Years | 99 (59.6%) | 18 (10.9%) |
| 75 Years and over | 14 (11.2%) | 58 (49.1%) |
Disability Class: Self-Care Difficulty
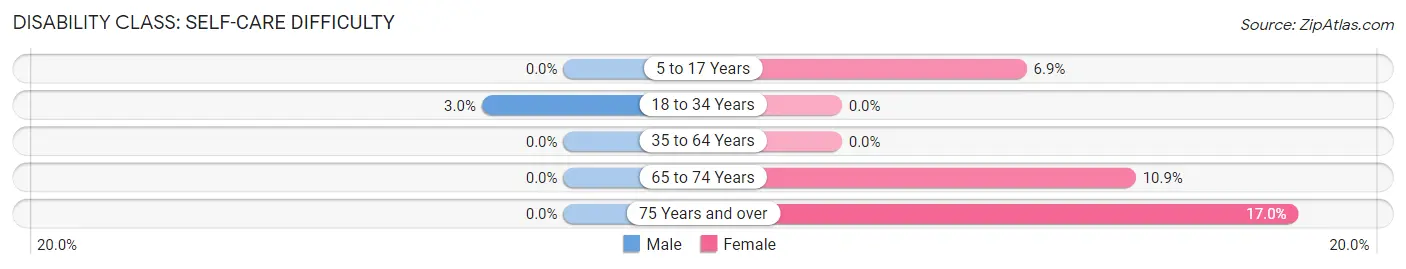
| Age Bracket | Male | Female |
| 5 to 17 Years | 0 (0.0%) | 21 (6.9%) |
| 18 to 34 Years | 22 (3.0%) | 0 (0.0%) |
| 35 to 64 Years | 0 (0.0%) | 0 (0.0%) |
| 65 to 74 Years | 0 (0.0%) | 18 (10.9%) |
| 75 Years and over | 0 (0.0%) | 20 (17.0%) |
Technology Access in Whiteland
Computing Device Access in Whiteland
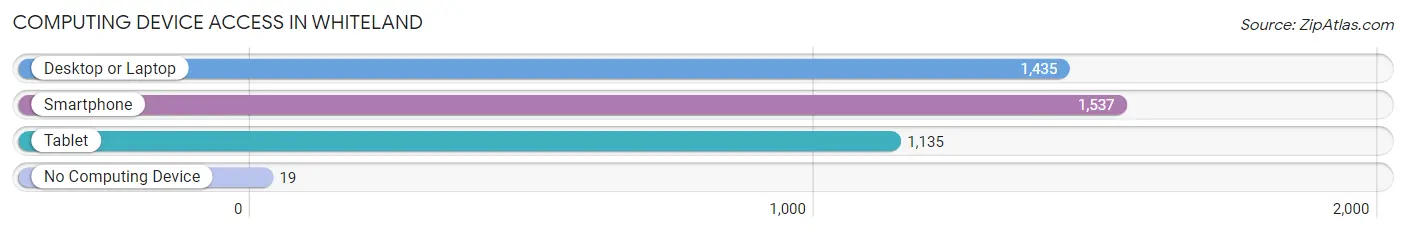
| Device Type | # Households | % Households |
| Desktop or Laptop | 1,435 | 90.1% |
| Smartphone | 1,537 | 96.6% |
| Tablet | 1,135 | 71.3% |
| No Computing Device | 19 | 1.2% |
| Total | 1,592 | 100.0% |
Internet Access in Whiteland
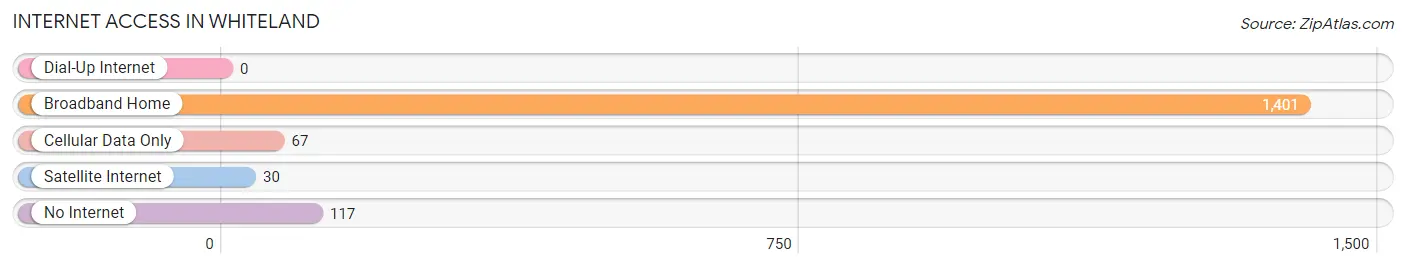
| Internet Type | # Households | % Households |
| Dial-Up Internet | 0 | 0.0% |
| Broadband Home | 1,401 | 88.0% |
| Cellular Data Only | 67 | 4.2% |
| Satellite Internet | 30 | 1.9% |
| No Internet | 117 | 7.3% |
| Total | 1,592 | 100.0% |
Whiteland Summary
Whiteland, Indiana is a small town located in Johnson County, Indiana, about 20 miles south of Indianapolis. The town was founded in 1851 and has a population of about 4,000 people. The town is known for its small-town charm and its close proximity to Indianapolis.
Geography
Whiteland is located in the central part of Johnson County, Indiana, about 20 miles south of Indianapolis. The town is situated on the east side of the White River, which runs through the town. The town is surrounded by farmland and is located in a rural area. The town is located in the Central Till Plains region of Indiana, which is characterized by flat terrain and rolling hills. The town is located in the Central Standard Time Zone.
Economy
Whiteland’s economy is largely based on agriculture and manufacturing. The town is home to several small businesses, including a grocery store, a hardware store, and a few restaurants. The town also has a few small industrial parks, which are home to several manufacturing companies. The town is also home to a few small technology companies.
Demographics
As of the 2010 census, the population of Whiteland was 4,099. The racial makeup of the town was 95.3% White, 0.7% African American, 0.3% Native American, 0.7% Asian, 0.1% Pacific Islander, 1.2% from other races, and 1.9% from two or more races. Hispanic or Latino of any race were 3.2% of the population.
The median income for a household in Whiteland was $45,938, and the median income for a family was $51,938. The per capita income for the town was $20,938. About 8.2% of families and 10.2% of the population were below the poverty line, including 14.2% of those under age 18 and 8.2% of those age 65 or over.
History
Whiteland was founded in 1851 by a group of settlers from Ohio. The town was originally called White’s Landing, after the first settler, William White. The town was renamed Whiteland in 1853. The town was originally a farming community, but it soon became a manufacturing center. The town was home to several factories, including a furniture factory, a canning factory, and a brick factory.
In the late 19th century, the town was home to several churches, a school, and a post office. The town was also home to a few stores and a hotel. The town was also home to a few small businesses, including a blacksmith shop and a livery stable.
In the early 20th century, the town was home to several small businesses, including a grocery store, a hardware store, and a few restaurants. The town was also home to a few small industrial parks, which were home to several manufacturing companies. The town was also home to a few small technology companies.
In the late 20th century, the town was home to several small businesses, including a grocery store, a hardware store, and a few restaurants. The town was also home to a few small industrial parks, which were home to several manufacturing companies. The town was also home to a few small technology companies.
Today, Whiteland is a small town with a population of about 4,000 people. The town is known for its small-town charm and its close proximity to Indianapolis. The town is home to several small businesses, including a grocery store, a hardware store, and a few restaurants. The town is also home to a few small industrial parks, which are home to several manufacturing companies. The town is also home to a few small technology companies.
Common Questions
What is Per Capita Income in Whiteland?
Per Capita income in Whiteland is $35,232.
What is the Median Family Income in Whiteland?
Median Family Income in Whiteland is $96,131.
What is the Median Household income in Whiteland?
Median Household Income in Whiteland is $85,351.
What is Income or Wage Gap in Whiteland?
Income or Wage Gap in Whiteland is 41.9%.
Women in Whiteland earn 58.1 cents for every dollar earned by a man.
What is Inequality or Gini Index in Whiteland?
Inequality or Gini Index in Whiteland is 0.29.
What is the Total Population of Whiteland?
Total Population of Whiteland is 4,278.
What is the Total Male Population of Whiteland?
Total Male Population of Whiteland is 2,315.
What is the Total Female Population of Whiteland?
Total Female Population of Whiteland is 1,963.
What is the Ratio of Males per 100 Females in Whiteland?
There are 117.93 Males per 100 Females in Whiteland.
What is the Ratio of Females per 100 Males in Whiteland?
There are 84.79 Females per 100 Males in Whiteland.
What is the Median Population Age in Whiteland?
Median Population Age in Whiteland is 41.3 Years.
What is the Average Family Size in Whiteland
Average Family Size in Whiteland is 3.4 People.
What is the Average Household Size in Whiteland
Average Household Size in Whiteland is 2.7 People.
How Large is the Labor Force in Whiteland?
There are 2,607 People in the Labor Forcein in Whiteland.
What is the Percentage of People in the Labor Force in Whiteland?
70.6% of People are in the Labor Force in Whiteland.
What is the Unemployment Rate in Whiteland?
Unemployment Rate in Whiteland is 5.4%.