Wheatland, IN Map & Demographics
Wheatland Map
Wheatland Overview
$23,076
PER CAPITA INCOME
$58,864
AVG FAMILY INCOME
$49,063
AVG HOUSEHOLD INCOME
19.8%
WAGE / INCOME GAP [ % ]
80.2¢/ $1
WAGE / INCOME GAP [ $ ]
0.37
INEQUALITY / GINI INDEX
402
TOTAL POPULATION
195
MALE POPULATION
207
FEMALE POPULATION
94.20
MALES / 100 FEMALES
106.15
FEMALES / 100 MALES
39.5
MEDIAN AGE
2.8
AVG FAMILY SIZE
2.3
AVG HOUSEHOLD SIZE
215
LABOR FORCE [ PEOPLE ]
67.0%
PERCENT IN LABOR FORCE
1.4%
UNEMPLOYMENT RATE
Wheatland Zip Codes
Wheatland Area Codes
Income in Wheatland
Income Overview in Wheatland
Per Capita Income in Wheatland is $23,076, while median incomes of families and households are $58,864 and $49,063 respectively.
| Characteristic | Number | Measure |
| Per Capita Income | 402 | $23,076 |
| Median Family Income | 116 | $58,864 |
| Mean Family Income | 116 | $63,725 |
| Median Household Income | 177 | $49,063 |
| Mean Household Income | 177 | $53,535 |
| Income Deficit | 116 | $0 |
| Wage / Income Gap (%) | 402 | 19.85% |
| Wage / Income Gap ($) | 402 | 80.15¢ per $1 |
| Gini / Inequality Index | 402 | 0.37 |
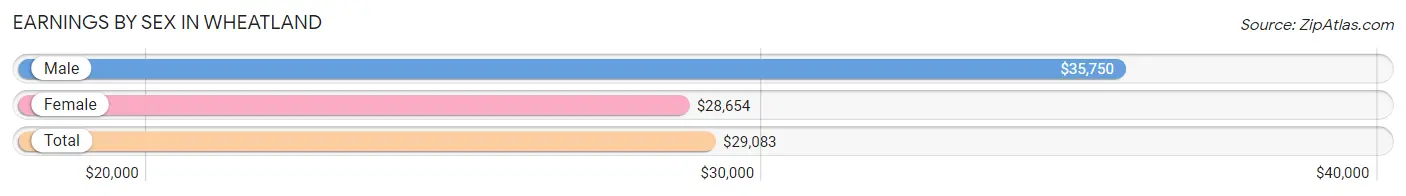
Earnings by Sex in Wheatland
Average Earnings in Wheatland are $29,083, $35,750 for men and $28,654 for women, a difference of 19.9%.
| Sex | Number | Average Earnings |
| Male | 109 (48.4%) | $35,750 |
| Female | 116 (51.6%) | $28,654 |
| Total | 225 (100.0%) | $29,083 |
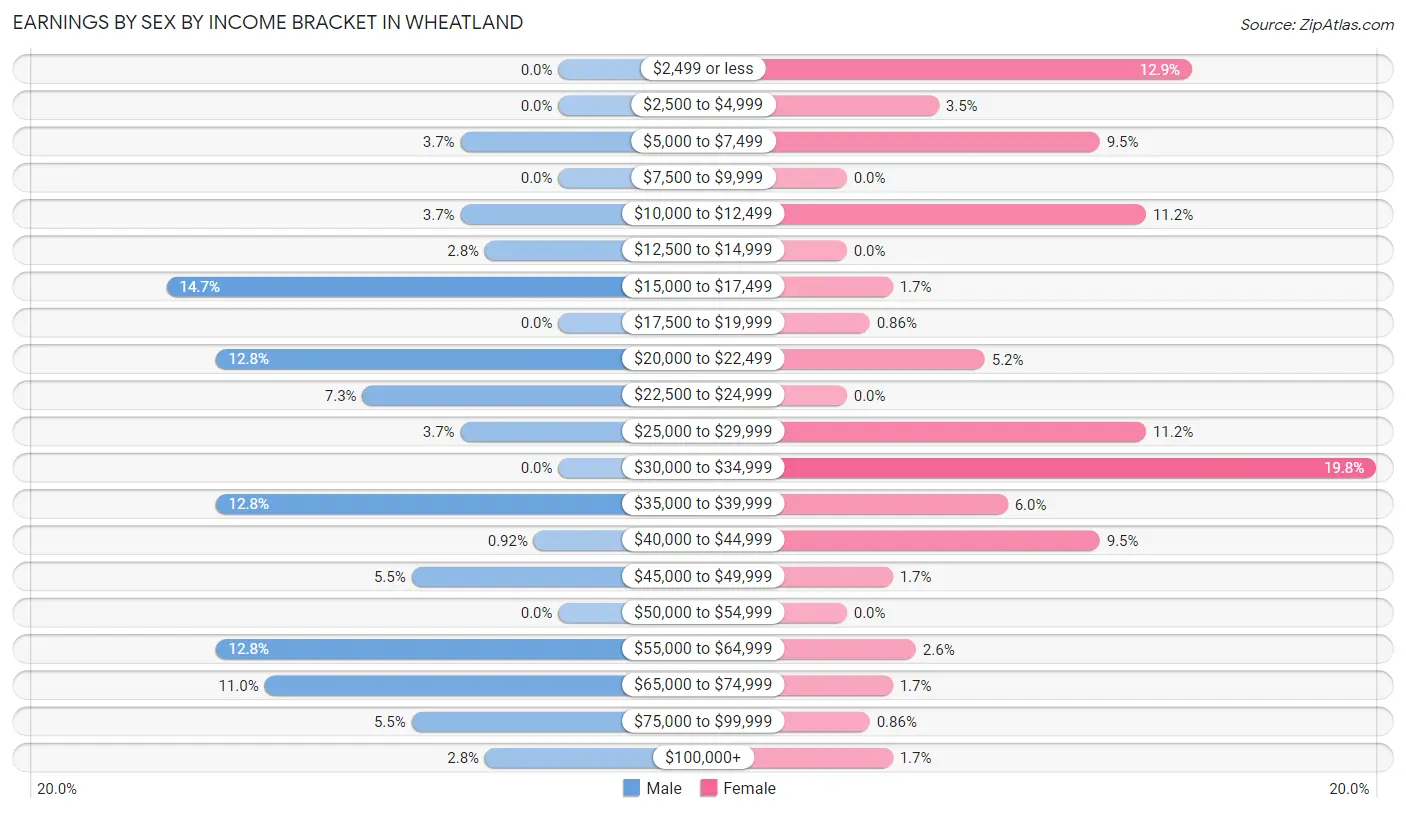
Earnings by Sex by Income Bracket in Wheatland
The most common earnings brackets in Wheatland are $15,000 to $17,499 for men (16 | 14.7%) and $30,000 to $34,999 for women (23 | 19.8%).
| Income | Male | Female |
| $2,499 or less | 0 (0.0%) | 15 (12.9%) |
| $2,500 to $4,999 | 0 (0.0%) | 4 (3.5%) |
| $5,000 to $7,499 | 4 (3.7%) | 11 (9.5%) |
| $7,500 to $9,999 | 0 (0.0%) | 0 (0.0%) |
| $10,000 to $12,499 | 4 (3.7%) | 13 (11.2%) |
| $12,500 to $14,999 | 3 (2.8%) | 0 (0.0%) |
| $15,000 to $17,499 | 16 (14.7%) | 2 (1.7%) |
| $17,500 to $19,999 | 0 (0.0%) | 1 (0.9%) |
| $20,000 to $22,499 | 14 (12.8%) | 6 (5.2%) |
| $22,500 to $24,999 | 8 (7.3%) | 0 (0.0%) |
| $25,000 to $29,999 | 4 (3.7%) | 13 (11.2%) |
| $30,000 to $34,999 | 0 (0.0%) | 23 (19.8%) |
| $35,000 to $39,999 | 14 (12.8%) | 7 (6.0%) |
| $40,000 to $44,999 | 1 (0.9%) | 11 (9.5%) |
| $45,000 to $49,999 | 6 (5.5%) | 2 (1.7%) |
| $50,000 to $54,999 | 0 (0.0%) | 0 (0.0%) |
| $55,000 to $64,999 | 14 (12.8%) | 3 (2.6%) |
| $65,000 to $74,999 | 12 (11.0%) | 2 (1.7%) |
| $75,000 to $99,999 | 6 (5.5%) | 1 (0.9%) |
| $100,000+ | 3 (2.8%) | 2 (1.7%) |
| Total | 109 (100.0%) | 116 (100.0%) |
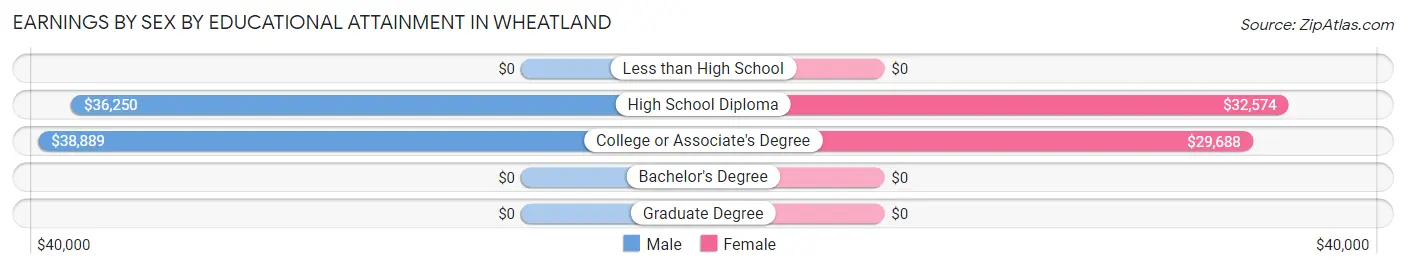
Earnings by Sex by Educational Attainment in Wheatland
Average earnings in Wheatland are $37,778 for men and $29,519 for women, a difference of 21.9%. Men with an educational attainment of college or associate's degree enjoy the highest average annual earnings of $38,889, while those with high school diploma education earn the least with $36,250. Women with an educational attainment of high school diploma earn the most with the average annual earnings of $32,574, while those with college or associate's degree education have the smallest earnings of $29,688.
| Educational Attainment | Male Income | Female Income |
| Less than High School | - | - |
| High School Diploma | $36,250 | $32,574 |
| College or Associate's Degree | $38,889 | $29,688 |
| Bachelor's Degree | - | - |
| Graduate Degree | - | - |
| Total | $37,778 | $29,519 |
Family Income in Wheatland
Family Income Brackets in Wheatland
According to the Wheatland family income data, there are 38 families falling into the $50,000 to $74,999 income range, which is the most common income bracket and makes up 32.8% of all families.
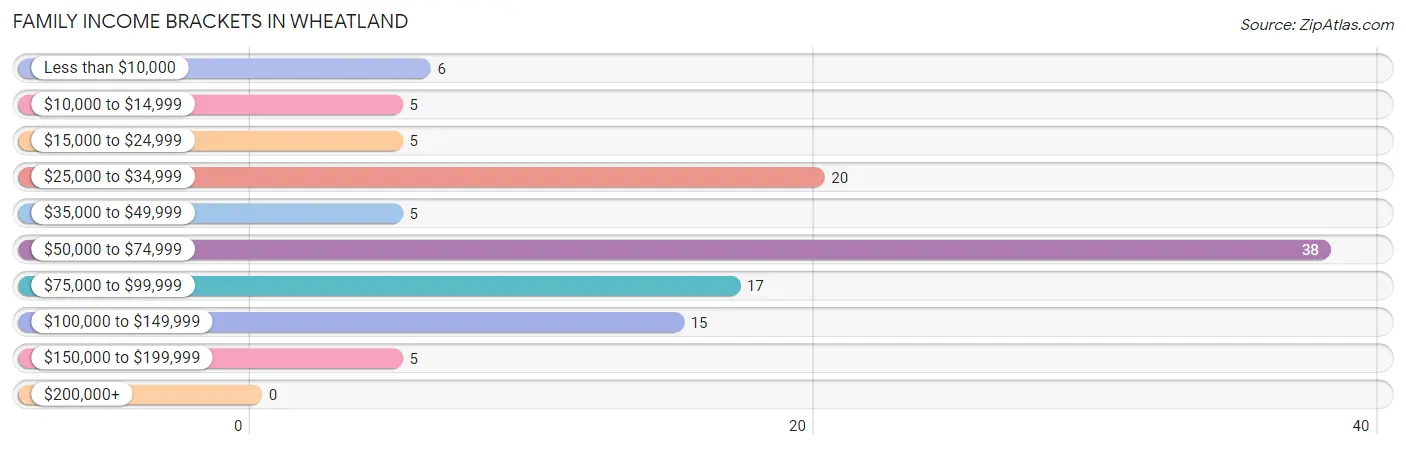
| Income Bracket | # Families | % Families |
| Less than $10,000 | 6 | 5.2% |
| $10,000 to $14,999 | 5 | 4.3% |
| $15,000 to $24,999 | 5 | 4.3% |
| $25,000 to $34,999 | 20 | 17.2% |
| $35,000 to $49,999 | 5 | 4.3% |
| $50,000 to $74,999 | 38 | 32.8% |
| $75,000 to $99,999 | 17 | 14.7% |
| $100,000 to $149,999 | 15 | 12.9% |
| $150,000 to $199,999 | 5 | 4.3% |
| $200,000+ | 0 | 0.0% |
Family Income by Famaliy Size in Wheatland
4-person families (22 | 19.0%) account for the highest median family income in Wheatland with $94,167 per family, while 2-person families (66 | 56.9%) have the highest median income of $26,875 per family member.
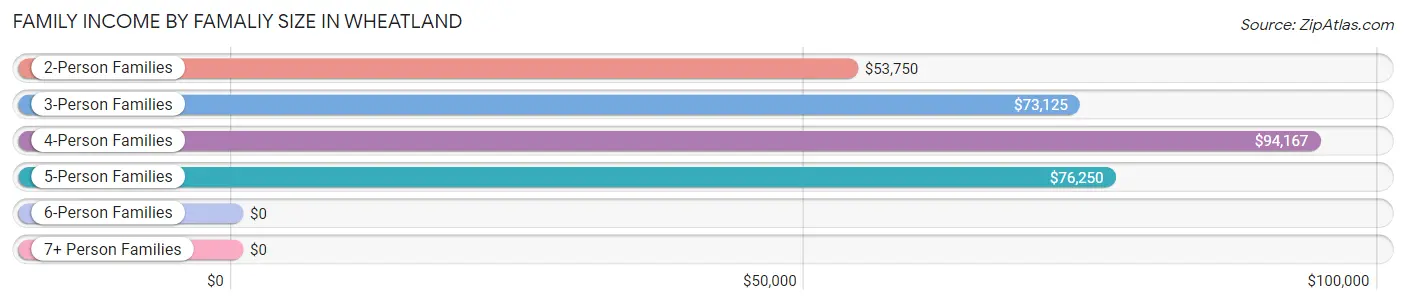
| Income Bracket | # Families | Median Income |
| 2-Person Families | 66 (56.9%) | $53,750 |
| 3-Person Families | 19 (16.4%) | $73,125 |
| 4-Person Families | 22 (19.0%) | $94,167 |
| 5-Person Families | 4 (3.5%) | $76,250 |
| 6-Person Families | 2 (1.7%) | $0 |
| 7+ Person Families | 3 (2.6%) | $0 |
| Total | 116 (100.0%) | $58,864 |
Family Income by Number of Earners in Wheatland
The median family income in Wheatland is $58,864, with families comprising 3+ earners (11) having the highest median family income of $73,542, while families with no earners (24) have the lowest median family income of $23,000, accounting for 9.5% and 20.7% of families, respectively.
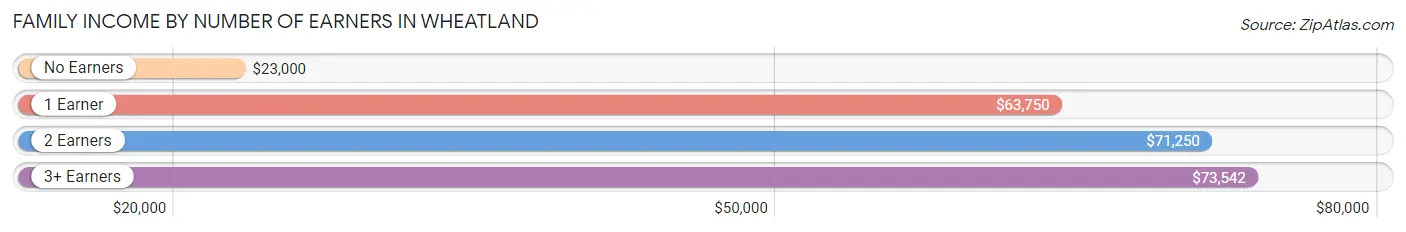
| Number of Earners | # Families | Median Income |
| No Earners | 24 (20.7%) | $23,000 |
| 1 Earner | 24 (20.7%) | $63,750 |
| 2 Earners | 57 (49.1%) | $71,250 |
| 3+ Earners | 11 (9.5%) | $73,542 |
| Total | 116 (100.0%) | $58,864 |
Household Income in Wheatland
Household Income Brackets in Wheatland
With 46 households falling in the category, the $50,000 to $74,999 income range is the most frequent in Wheatland, accounting for 26.0% of all households.
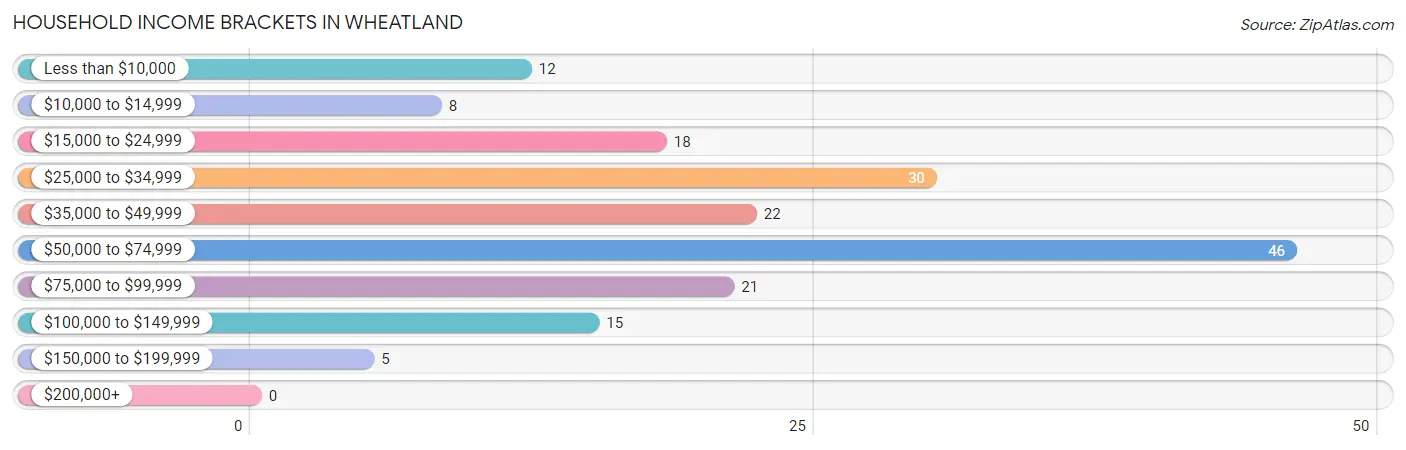
| Income Bracket | # Households | % Households |
| Less than $10,000 | 12 | 6.8% |
| $10,000 to $14,999 | 8 | 4.5% |
| $15,000 to $24,999 | 18 | 10.2% |
| $25,000 to $34,999 | 30 | 16.9% |
| $35,000 to $49,999 | 22 | 12.4% |
| $50,000 to $74,999 | 46 | 26.0% |
| $75,000 to $99,999 | 21 | 11.9% |
| $100,000 to $149,999 | 15 | 8.5% |
| $150,000 to $199,999 | 5 | 2.8% |
| $200,000+ | 0 | 0.0% |
Household Income by Householder Age in Wheatland
The median household income in Wheatland is $49,063, with the highest median household income of $88,125 found in the 25 to 44 years age bracket for the primary householder. A total of 49 households (27.7%) fall into this category. Meanwhile, the 15 to 24 years age bracket for the primary householder has the lowest median household income of $0, with 17 households (9.6%) in this group.
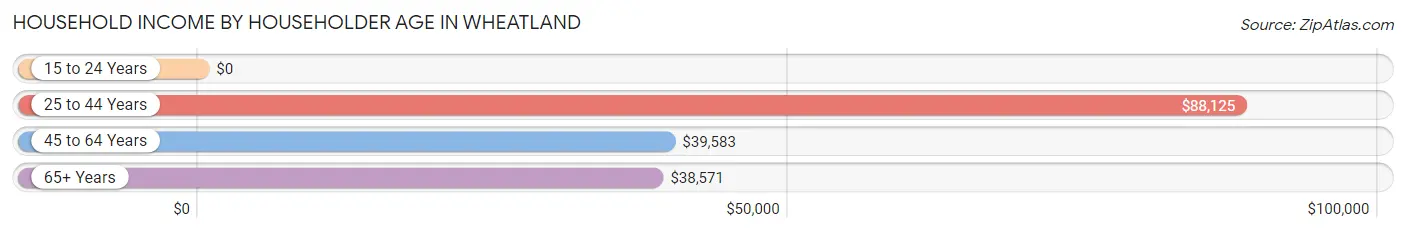
| Income Bracket | # Households | Median Income |
| 15 to 24 Years | 17 (9.6%) | $0 |
| 25 to 44 Years | 49 (27.7%) | $88,125 |
| 45 to 64 Years | 53 (29.9%) | $39,583 |
| 65+ Years | 58 (32.8%) | $38,571 |
| Total | 177 (100.0%) | $49,063 |
Poverty in Wheatland
Income Below Poverty by Sex and Age in Wheatland
With 10.3% poverty level for males and 12.6% for females among the residents of Wheatland, 65 to 74 year old males and 18 to 24 year old females are the most vulnerable to poverty, with 11 males (37.9%) and 9 females (36.0%) in their respective age groups living below the poverty level.
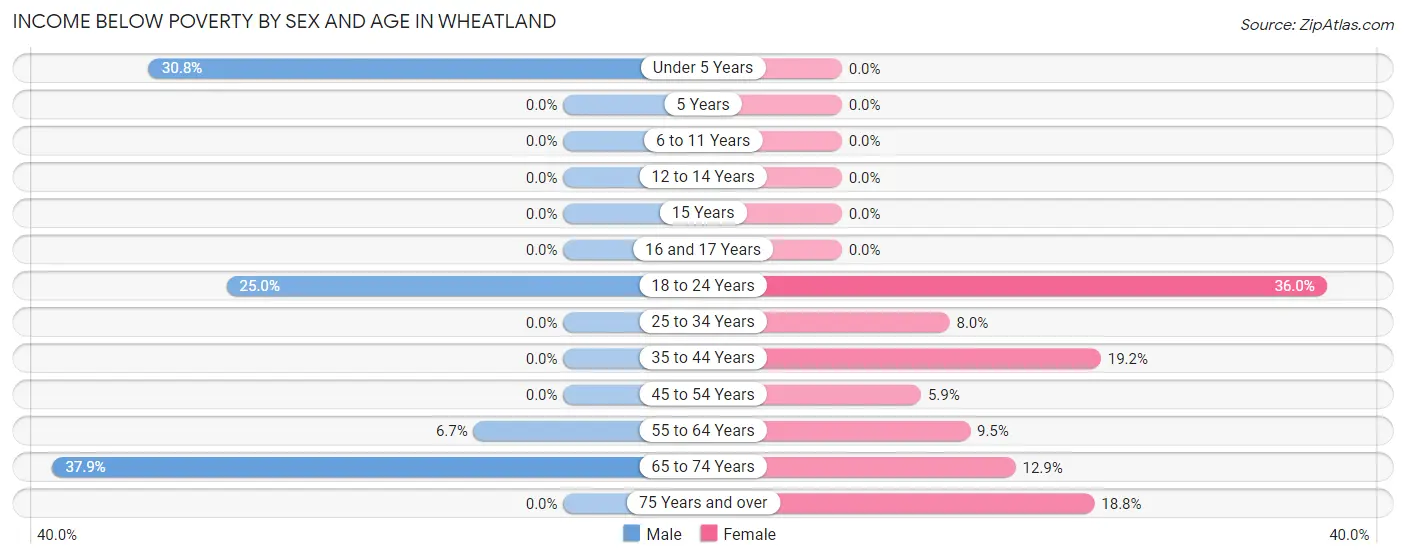
| Age Bracket | Male | Female |
| Under 5 Years | 4 (30.8%) | 0 (0.0%) |
| 5 Years | 0 (0.0%) | 0 (0.0%) |
| 6 to 11 Years | 0 (0.0%) | 0 (0.0%) |
| 12 to 14 Years | 0 (0.0%) | 0 (0.0%) |
| 15 Years | 0 (0.0%) | 0 (0.0%) |
| 16 and 17 Years | 0 (0.0%) | 0 (0.0%) |
| 18 to 24 Years | 3 (25.0%) | 9 (36.0%) |
| 25 to 34 Years | 0 (0.0%) | 2 (8.0%) |
| 35 to 44 Years | 0 (0.0%) | 5 (19.2%) |
| 45 to 54 Years | 0 (0.0%) | 1 (5.9%) |
| 55 to 64 Years | 2 (6.7%) | 2 (9.5%) |
| 65 to 74 Years | 11 (37.9%) | 4 (12.9%) |
| 75 Years and over | 0 (0.0%) | 3 (18.8%) |
| Total | 20 (10.3%) | 26 (12.6%) |
Income Above Poverty by Sex and Age in Wheatland
According to the poverty statistics in Wheatland, males aged 5 years and females aged under 5 years are the age groups that are most secure financially, with 100.0% of males and 100.0% of females in these age groups living above the poverty line.
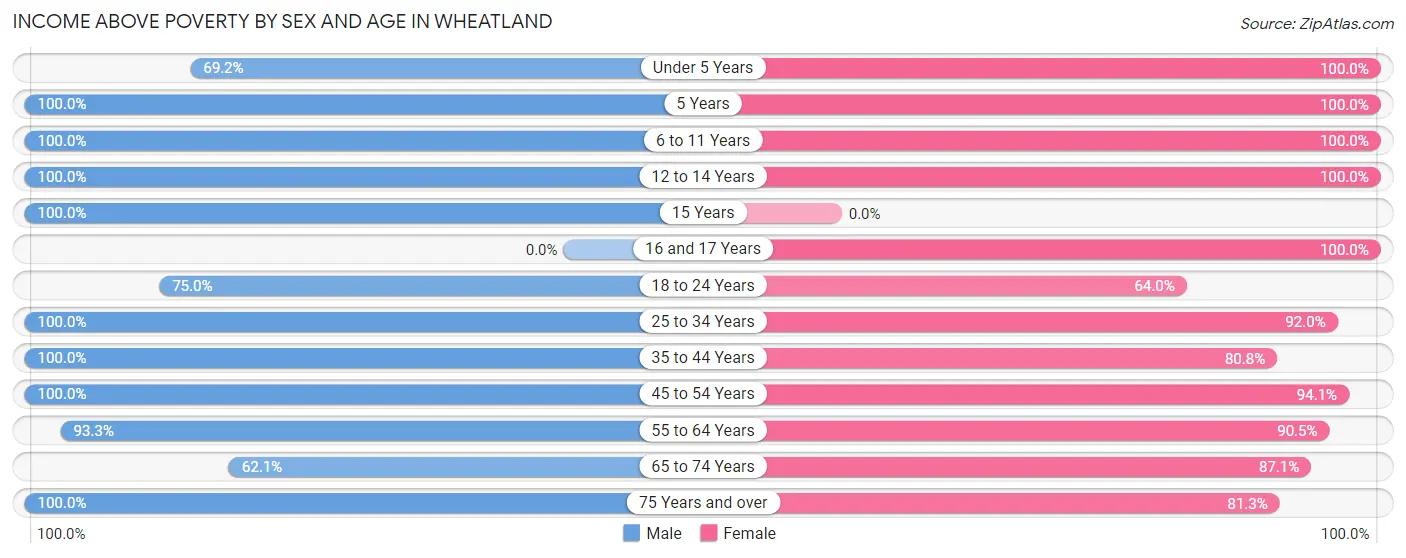
| Age Bracket | Male | Female |
| Under 5 Years | 9 (69.2%) | 8 (100.0%) |
| 5 Years | 1 (100.0%) | 2 (100.0%) |
| 6 to 11 Years | 6 (100.0%) | 24 (100.0%) |
| 12 to 14 Years | 13 (100.0%) | 5 (100.0%) |
| 15 Years | 9 (100.0%) | 0 (0.0%) |
| 16 and 17 Years | 0 (0.0%) | 7 (100.0%) |
| 18 to 24 Years | 9 (75.0%) | 16 (64.0%) |
| 25 to 34 Years | 15 (100.0%) | 23 (92.0%) |
| 35 to 44 Years | 37 (100.0%) | 21 (80.8%) |
| 45 to 54 Years | 21 (100.0%) | 16 (94.1%) |
| 55 to 64 Years | 28 (93.3%) | 19 (90.5%) |
| 65 to 74 Years | 18 (62.1%) | 27 (87.1%) |
| 75 Years and over | 9 (100.0%) | 13 (81.2%) |
| Total | 175 (89.7%) | 181 (87.4%) |
Income Below Poverty Among Married-Couple Families in Wheatland
The poverty statistics for married-couple families in Wheatland show that 4.0% or 4 of the total 100 families live below the poverty line. Families with no children have the highest poverty rate of 6.7%, comprising of 4 families. On the other hand, families with 1 or 2 children have the lowest poverty rate of 0.0%, which includes 0 families.
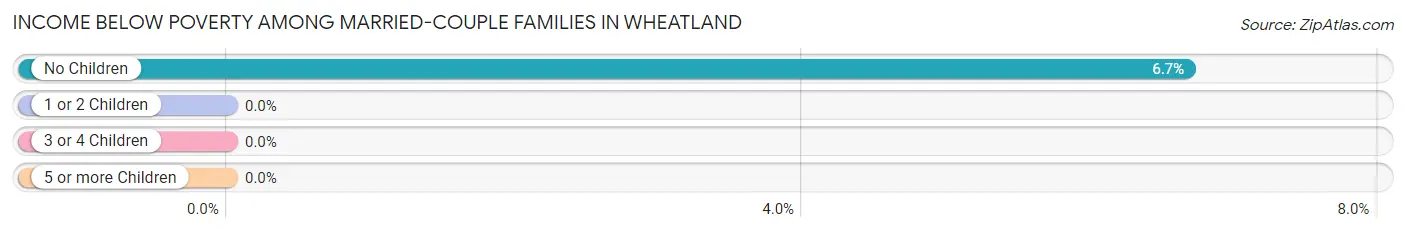
| Children | Above Poverty | Below Poverty |
| No Children | 56 (93.3%) | 4 (6.7%) |
| 1 or 2 Children | 33 (100.0%) | 0 (0.0%) |
| 3 or 4 Children | 4 (100.0%) | 0 (0.0%) |
| 5 or more Children | 3 (100.0%) | 0 (0.0%) |
| Total | 96 (96.0%) | 4 (4.0%) |
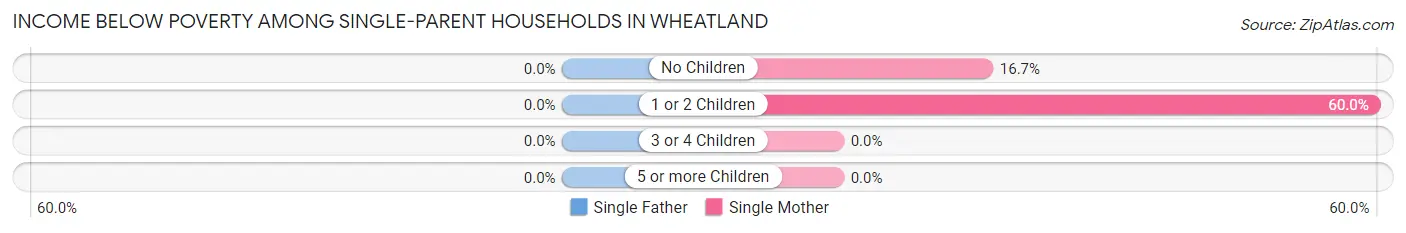
Income Below Poverty Among Single-Parent Households in Wheatland
| Children | Single Father | Single Mother |
| No Children | 0 (0.0%) | 1 (16.7%) |
| 1 or 2 Children | 0 (0.0%) | 6 (60.0%) |
| 3 or 4 Children | 0 (0.0%) | 0 (0.0%) |
| 5 or more Children | 0 (0.0%) | 0 (0.0%) |
| Total | 0 (0.0%) | 7 (43.8%) |
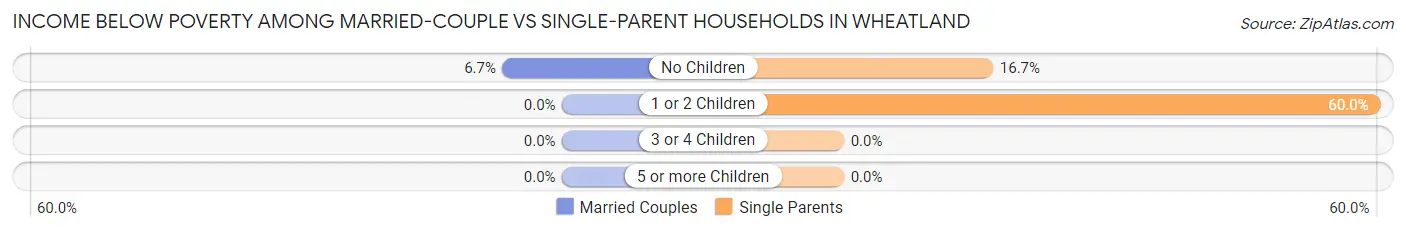
Income Below Poverty Among Married-Couple vs Single-Parent Households in Wheatland
The poverty data for Wheatland shows that 4 of the married-couple family households (4.0%) and 7 of the single-parent households (43.8%) are living below the poverty level. Within the married-couple family households, those with no children have the highest poverty rate, with 4 households (6.7%) falling below the poverty line. Among the single-parent households, those with 1 or 2 children have the highest poverty rate, with 6 household (60.0%) living below poverty.
| Children | Married-Couple Families | Single-Parent Households |
| No Children | 4 (6.7%) | 1 (16.7%) |
| 1 or 2 Children | 0 (0.0%) | 6 (60.0%) |
| 3 or 4 Children | 0 (0.0%) | 0 (0.0%) |
| 5 or more Children | 0 (0.0%) | 0 (0.0%) |
| Total | 4 (4.0%) | 7 (43.8%) |
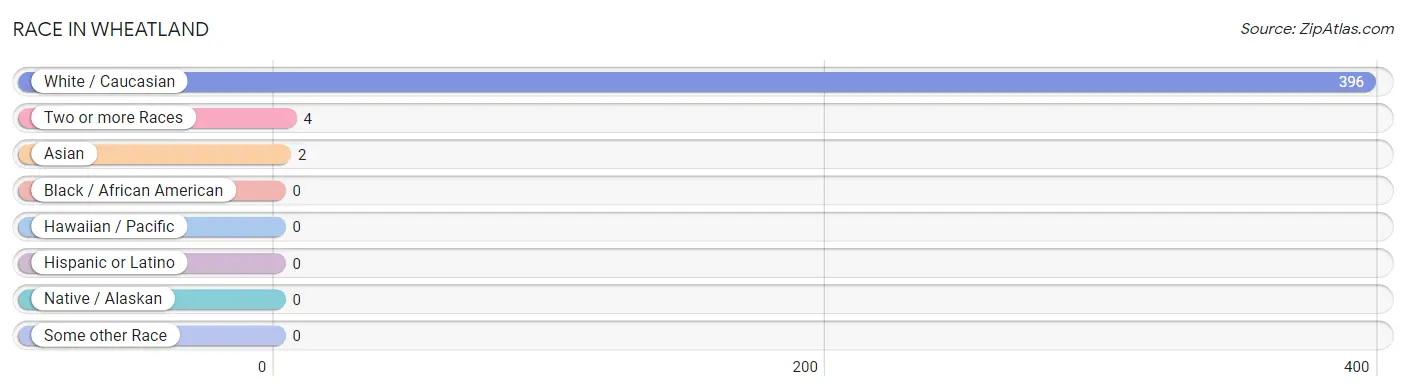
Race in Wheatland
The most populous races in Wheatland are White / Caucasian (396 | 98.5%), Two or more Races (4 | 1.0%), and Asian (2 | 0.5%).
| Race | # Population | % Population |
| Asian | 2 | 0.5% |
| Black / African American | 0 | 0.0% |
| Hawaiian / Pacific | 0 | 0.0% |
| Hispanic or Latino | 0 | 0.0% |
| Native / Alaskan | 0 | 0.0% |
| White / Caucasian | 396 | 98.5% |
| Two or more Races | 4 | 1.0% |
| Some other Race | 0 | 0.0% |
| Total | 402 | 100.0% |
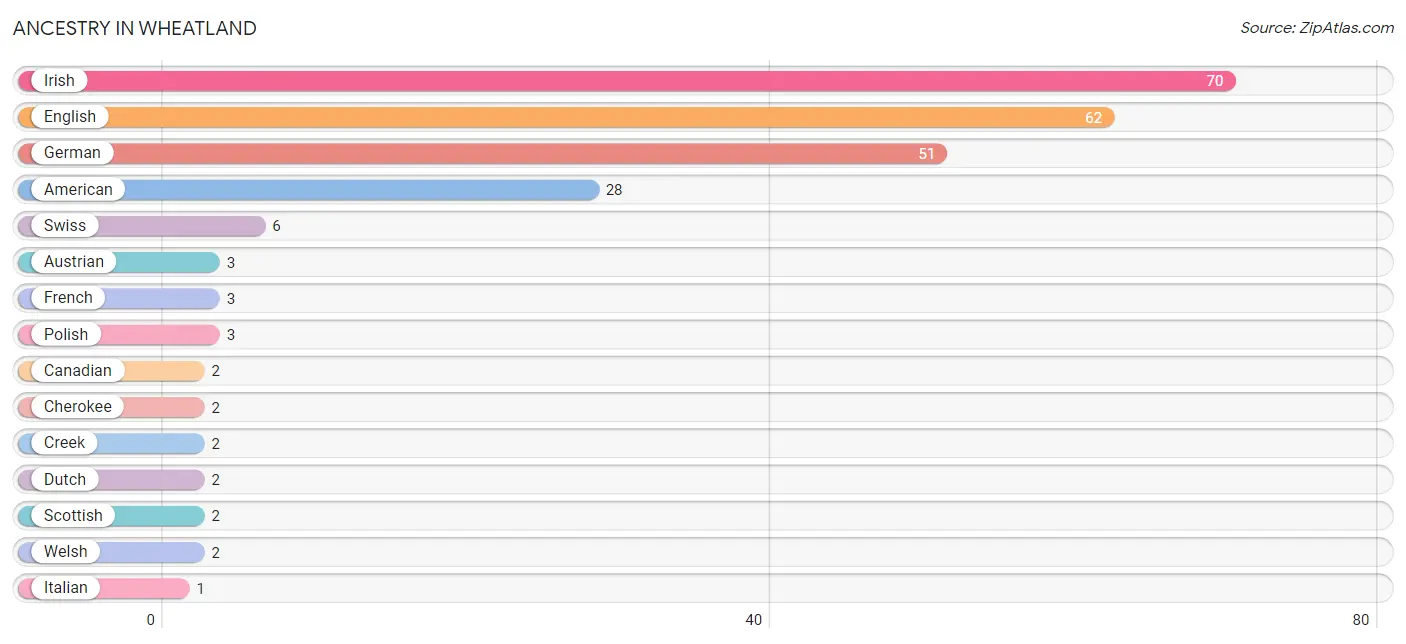
Ancestry in Wheatland
The most populous ancestries reported in Wheatland are Irish (70 | 17.4%), English (62 | 15.4%), German (51 | 12.7%), American (28 | 7.0%), and Swiss (6 | 1.5%), together accounting for 54.0% of all Wheatland residents.
| Ancestry | # Population | % Population |
| American | 28 | 7.0% |
| Austrian | 3 | 0.7% |
| Canadian | 2 | 0.5% |
| Cherokee | 2 | 0.5% |
| Creek | 2 | 0.5% |
| Dutch | 2 | 0.5% |
| English | 62 | 15.4% |
| French | 3 | 0.7% |
| German | 51 | 12.7% |
| Irish | 70 | 17.4% |
| Italian | 1 | 0.3% |
| Korean | 1 | 0.3% |
| Polish | 3 | 0.7% |
| Scottish | 2 | 0.5% |
| Swiss | 6 | 1.5% |
| Welsh | 2 | 0.5% | View All 16 Rows |
Immigrants in Wheatland
The most numerous immigrant groups reported in Wheatland came from , and Canada (2 | 0.5%), together accounting for 0.5% of all Wheatland residents.

| Immigration Origin | # Population | % Population |
| Canada | 2 | 0.5% | View All 1 Rows |
Sex and Age in Wheatland
Sex and Age in Wheatland
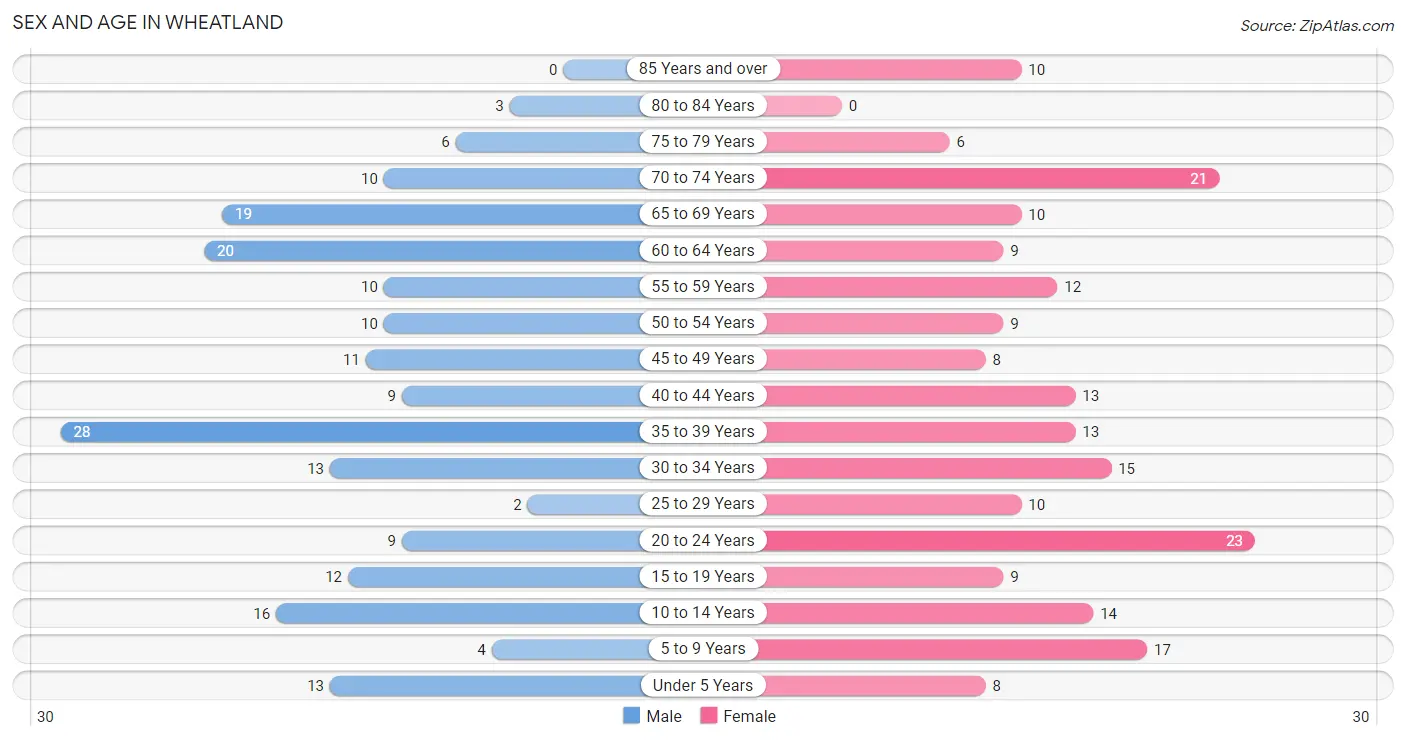
The most populous age groups in Wheatland are 35 to 39 Years (28 | 14.4%) for men and 20 to 24 Years (23 | 11.1%) for women.
| Age Bracket | Male | Female |
| Under 5 Years | 13 (6.7%) | 8 (3.9%) |
| 5 to 9 Years | 4 (2.1%) | 17 (8.2%) |
| 10 to 14 Years | 16 (8.2%) | 14 (6.8%) |
| 15 to 19 Years | 12 (6.1%) | 9 (4.3%) |
| 20 to 24 Years | 9 (4.6%) | 23 (11.1%) |
| 25 to 29 Years | 2 (1.0%) | 10 (4.8%) |
| 30 to 34 Years | 13 (6.7%) | 15 (7.2%) |
| 35 to 39 Years | 28 (14.4%) | 13 (6.3%) |
| 40 to 44 Years | 9 (4.6%) | 13 (6.3%) |
| 45 to 49 Years | 11 (5.6%) | 8 (3.9%) |
| 50 to 54 Years | 10 (5.1%) | 9 (4.3%) |
| 55 to 59 Years | 10 (5.1%) | 12 (5.8%) |
| 60 to 64 Years | 20 (10.3%) | 9 (4.3%) |
| 65 to 69 Years | 19 (9.7%) | 10 (4.8%) |
| 70 to 74 Years | 10 (5.1%) | 21 (10.1%) |
| 75 to 79 Years | 6 (3.1%) | 6 (2.9%) |
| 80 to 84 Years | 3 (1.5%) | 0 (0.0%) |
| 85 Years and over | 0 (0.0%) | 10 (4.8%) |
| Total | 195 (100.0%) | 207 (100.0%) |
Families and Households in Wheatland
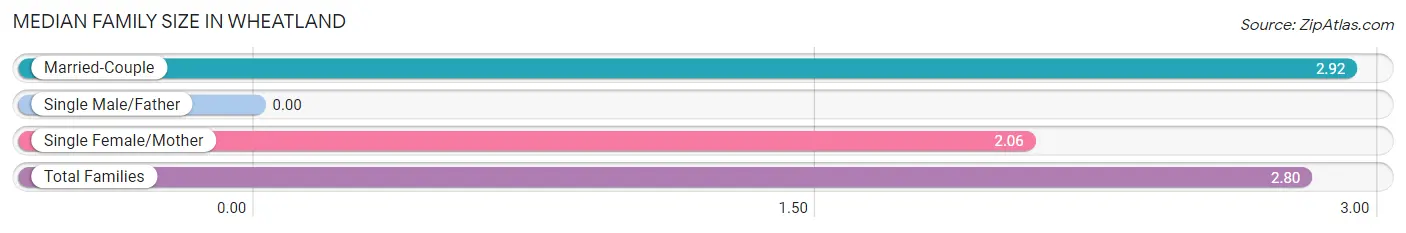
Median Family Size in Wheatland
| Family Type | # Families | Family Size |
| Married-Couple | 100 (86.2%) | 2.92 |
| Single Male/Father | 0 (0.0%) | - |
| Single Female/Mother | 16 (13.8%) | 2.06 |
| Total Families | 116 (100.0%) | 2.80 |
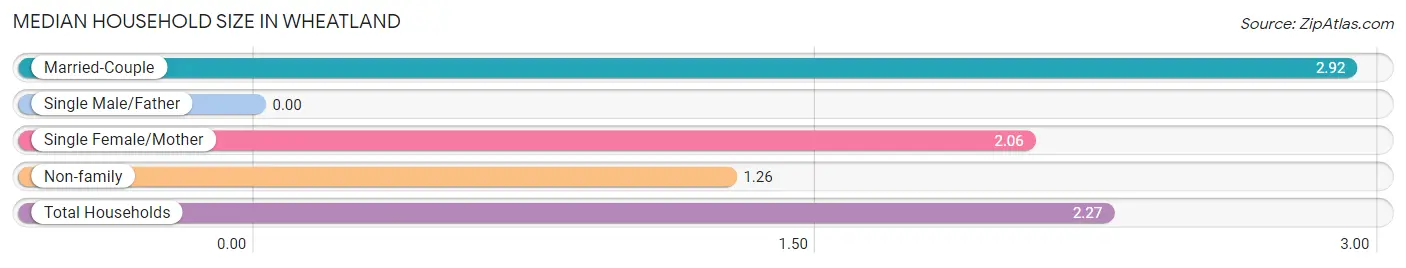
Median Household Size in Wheatland
| Household Type | # Households | Household Size |
| Married-Couple | 100 (56.5%) | 2.92 |
| Single Male/Father | 0 (0.0%) | - |
| Single Female/Mother | 16 (9.0%) | 2.06 |
| Non-family | 61 (34.5%) | 1.26 |
| Total Households | 177 (100.0%) | 2.27 |
Household Size by Marriage Status in Wheatland
Out of a total of 177 households in Wheatland, 116 (65.5%) are family households, while 61 (34.5%) are nonfamily households. The most numerous type of family households are 2-person households, comprising 66, and the most common type of nonfamily households are 1-person households, comprising 48.
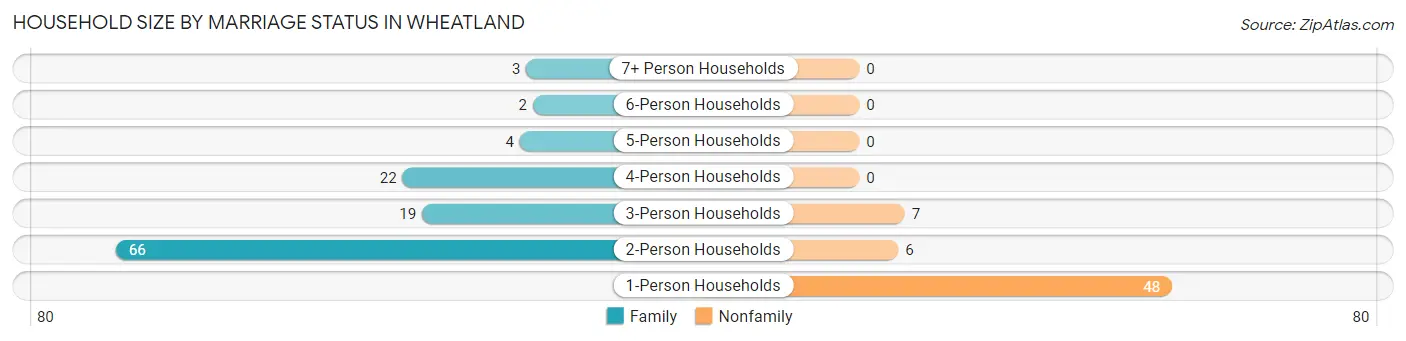
| Household Size | Family Households | Nonfamily Households |
| 1-Person Households | - | 48 (27.1%) |
| 2-Person Households | 66 (37.3%) | 6 (3.4%) |
| 3-Person Households | 19 (10.7%) | 7 (4.0%) |
| 4-Person Households | 22 (12.4%) | 0 (0.0%) |
| 5-Person Households | 4 (2.3%) | 0 (0.0%) |
| 6-Person Households | 2 (1.1%) | 0 (0.0%) |
| 7+ Person Households | 3 (1.7%) | 0 (0.0%) |
| Total | 116 (65.5%) | 61 (34.5%) |
Female Fertility in Wheatland
Fertility by Age in Wheatland
Average fertility rate in Wheatland is 163.0 births per 1,000 women. Women in the age bracket of 20 to 34 years have the highest fertility rate with 292.0 births per 1,000 women. Women in the age bracket of 20 to 34 years acount for 93.3% of all women with births.
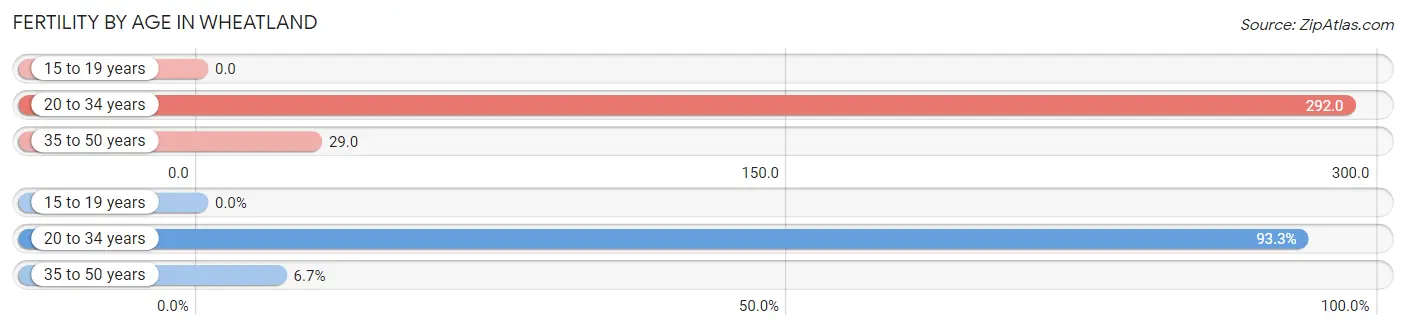
| Age Bracket | Women with Births | Births / 1,000 Women |
| 15 to 19 years | 0 (0.0%) | 0.0 |
| 20 to 34 years | 14 (93.3%) | 292.0 |
| 35 to 50 years | 1 (6.7%) | 29.0 |
| Total | 15 (100.0%) | 163.0 |
Fertility by Age by Marriage Status in Wheatland
60.0% of women with births (15) in Wheatland are married. The highest percentage of unmarried women with births falls into 20 to 34 years age bracket with 42.9% of them unmarried at the time of birth, while the lowest percentage of unmarried women with births belong to 35 to 50 years age bracket with 0.0% of them unmarried.
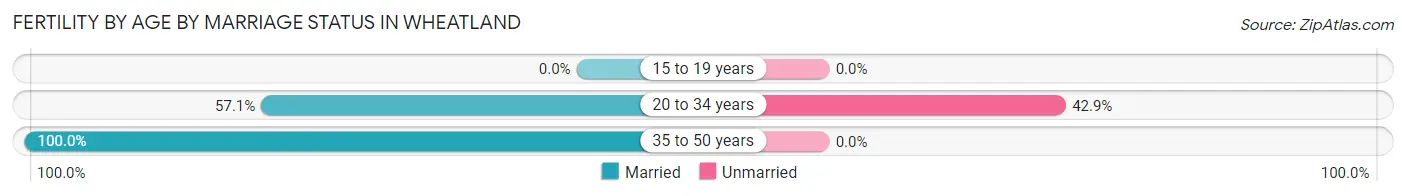
| Age Bracket | Married | Unmarried |
| 15 to 19 years | 0 (0.0%) | 0 (0.0%) |
| 20 to 34 years | 8 (57.1%) | 6 (42.9%) |
| 35 to 50 years | 1 (100.0%) | 0 (0.0%) |
| Total | 9 (60.0%) | 6 (40.0%) |
Fertility by Education in Wheatland
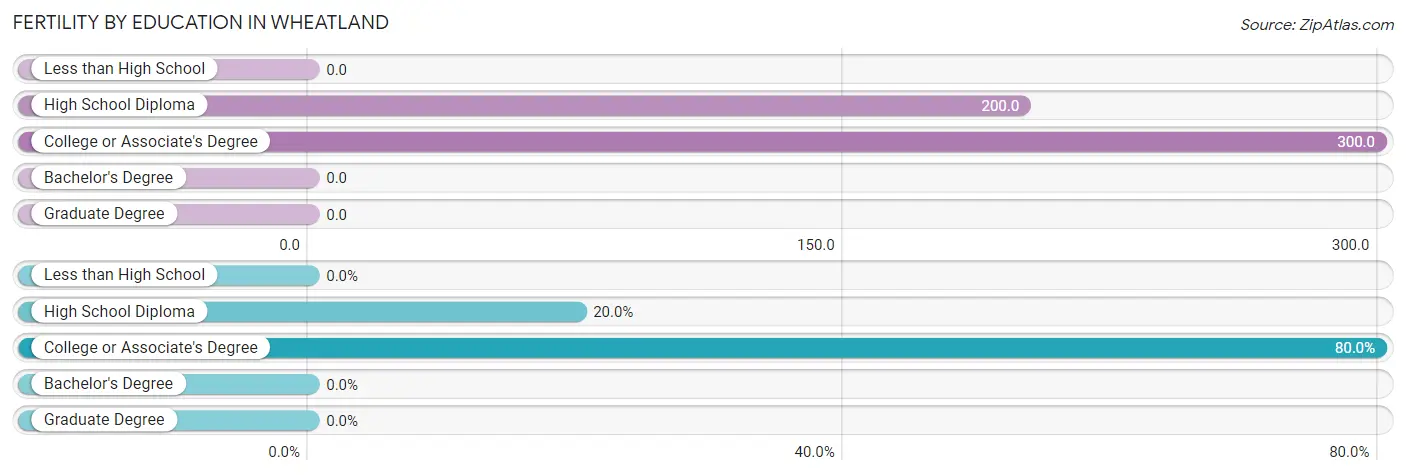
| Educational Attainment | Women with Births | Births / 1,000 Women |
| Less than High School | 0 (0.0%) | 0.0 |
| High School Diploma | 3 (20.0%) | 200.0 |
| College or Associate's Degree | 12 (80.0%) | 300.0 |
| Bachelor's Degree | 0 (0.0%) | 0.0 |
| Graduate Degree | 0 (0.0%) | 0.0 |
| Total | 15 (100.0%) | 163.0 |
Fertility by Education by Marriage Status in Wheatland
40.0% of women with births in Wheatland are unmarried. Women with the educational attainment of high school diploma are most likely to be married with 100.0% of them married at childbirth, while women with the educational attainment of college or associate's degree are least likely to be married with 50.0% of them unmarried at childbirth.
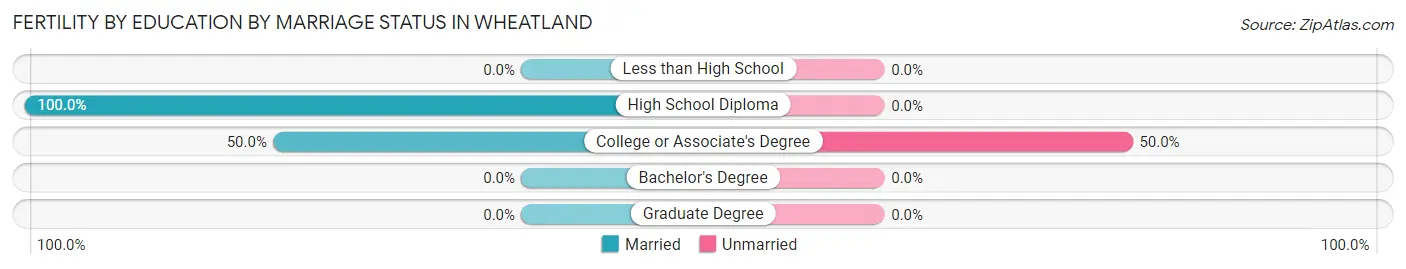
| Educational Attainment | Married | Unmarried |
| Less than High School | 0 (0.0%) | 0 (0.0%) |
| High School Diploma | 3 (100.0%) | 0 (0.0%) |
| College or Associate's Degree | 6 (50.0%) | 6 (50.0%) |
| Bachelor's Degree | 0 (0.0%) | 0 (0.0%) |
| Graduate Degree | 0 (0.0%) | 0 (0.0%) |
| Total | 9 (60.0%) | 6 (40.0%) |
Employment Characteristics in Wheatland
Employment by Class of Employer in Wheatland
Among the 206 employed individuals in Wheatland, private company employees (129 | 62.6%), not-for-profit organizations (30 | 14.6%), and self-employed (not incorporated) (25 | 12.1%) make up the most common classes of employment.
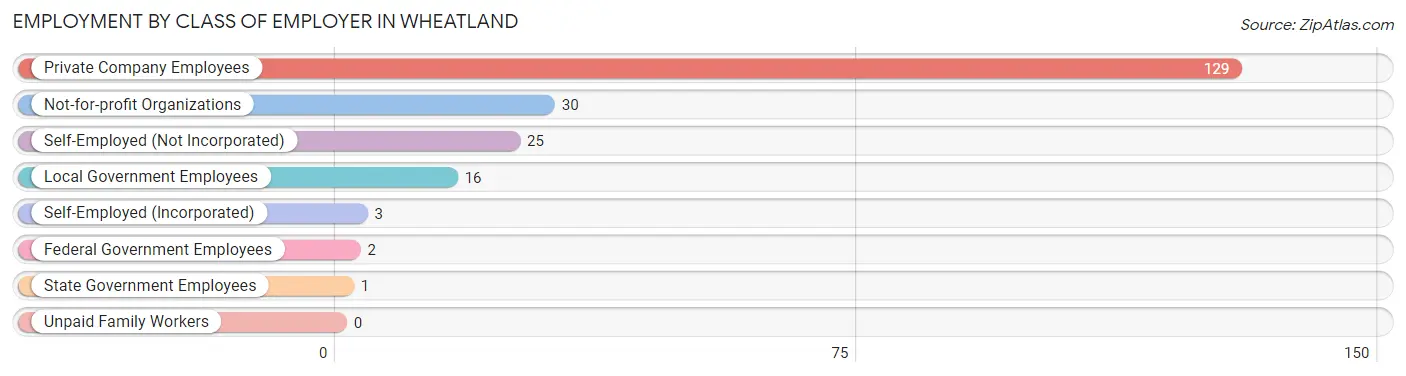
| Employer Class | # Employees | % Employees |
| Private Company Employees | 129 | 62.6% |
| Self-Employed (Incorporated) | 3 | 1.5% |
| Self-Employed (Not Incorporated) | 25 | 12.1% |
| Not-for-profit Organizations | 30 | 14.6% |
| Local Government Employees | 16 | 7.8% |
| State Government Employees | 1 | 0.5% |
| Federal Government Employees | 2 | 1.0% |
| Unpaid Family Workers | 0 | 0.0% |
| Total | 206 | 100.0% |
Employment Status by Age in Wheatland
According to the labor force statistics for Wheatland, out of the total population over 16 years of age (321), 67.0% or 215 individuals are in the labor force, with 1.4% or 3 of them unemployed. The age group with the highest labor force participation rate is 25 to 29 years, with 100.0% or 12 individuals in the labor force. Within the labor force, the 20 to 24 years age range has the highest percentage of unemployed individuals, with 3.8% or 1 of them being unemployed.
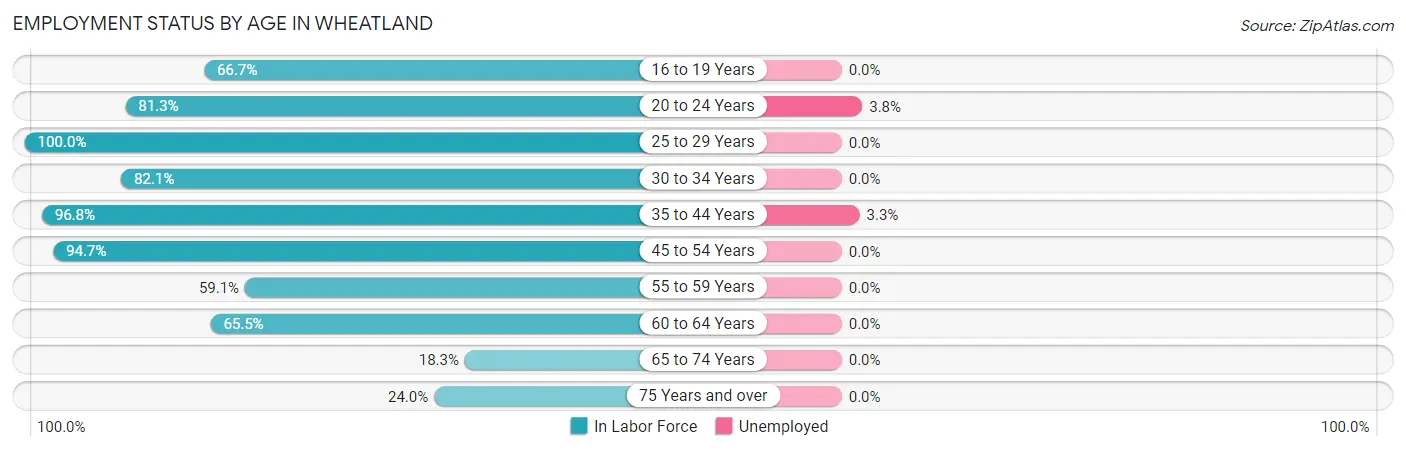
| Age Bracket | In Labor Force | Unemployed |
| 16 to 19 Years | 8 (66.7%) | 0 (0.0%) |
| 20 to 24 Years | 26 (81.3%) | 1 (3.8%) |
| 25 to 29 Years | 12 (100.0%) | 0 (0.0%) |
| 30 to 34 Years | 23 (82.1%) | 0 (0.0%) |
| 35 to 44 Years | 61 (96.8%) | 2 (3.3%) |
| 45 to 54 Years | 36 (94.7%) | 0 (0.0%) |
| 55 to 59 Years | 13 (59.1%) | 0 (0.0%) |
| 60 to 64 Years | 19 (65.5%) | 0 (0.0%) |
| 65 to 74 Years | 11 (18.3%) | 0 (0.0%) |
| 75 Years and over | 6 (24.0%) | 0 (0.0%) |
| Total | 215 (67.0%) | 3 (1.4%) |
Employment Status by Educational Attainment in Wheatland
According to labor force statistics for Wheatland, 85.4% of individuals (164) out of the total population between 25 and 64 years of age (192) are in the labor force, with 1.2% or 2 of them being unemployed. The group with the highest labor force participation rate are those with the educational attainment of high school diploma, with 94.4% or 84 individuals in the labor force. Within the labor force, individuals with high school diploma education have the highest percentage of unemployment, with 2.4% or 2 of them being unemployed.
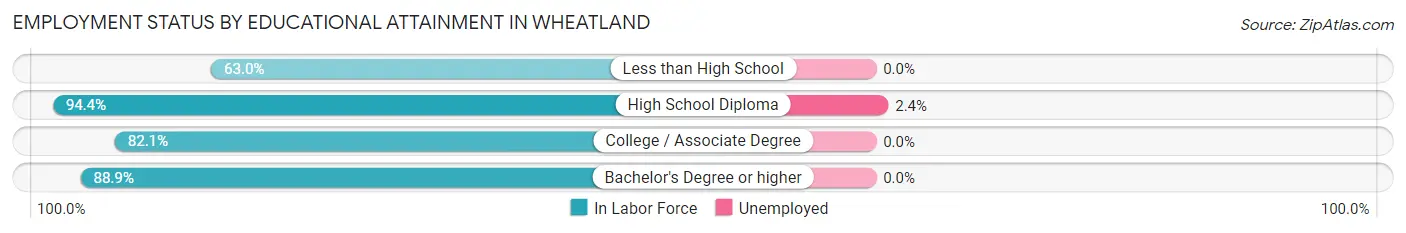
| Educational Attainment | In Labor Force | Unemployed |
| Less than High School | 17 (63.0%) | 0 (0.0%) |
| High School Diploma | 84 (94.4%) | 2 (2.4%) |
| College / Associate Degree | 55 (82.1%) | 0 (0.0%) |
| Bachelor's Degree or higher | 8 (88.9%) | 0 (0.0%) |
| Total | 164 (85.4%) | 2 (1.2%) |
Employment Occupations by Sex in Wheatland
Management, Business, Science and Arts Occupations
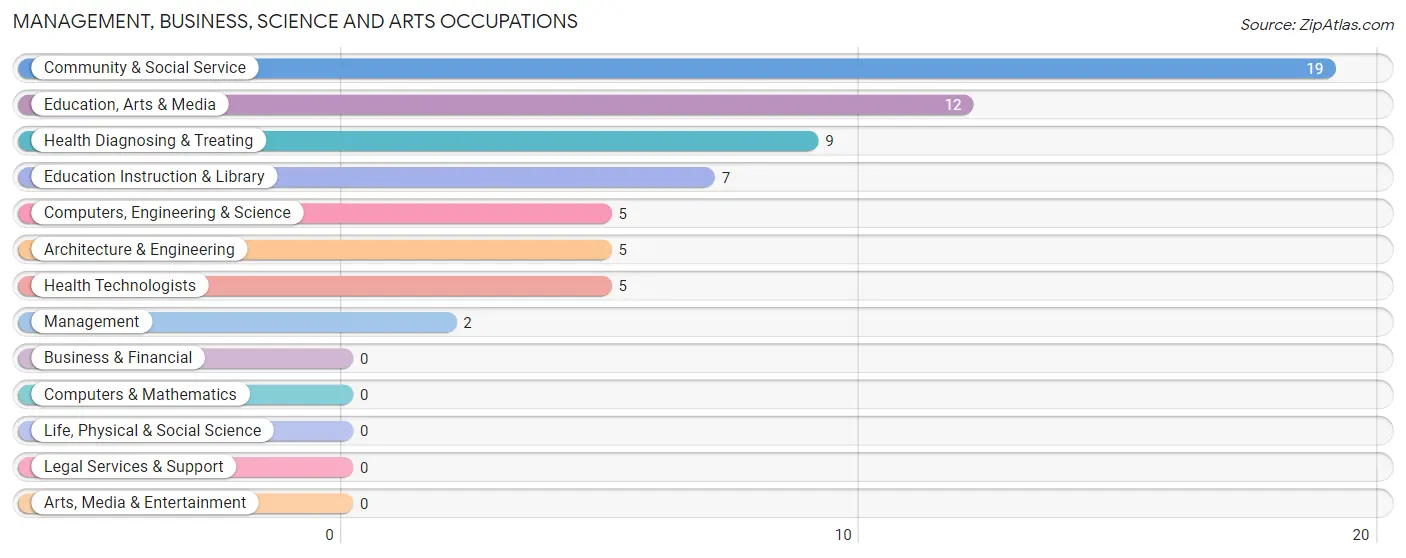
The most common Management, Business, Science and Arts occupations in Wheatland are Community & Social Service (19 | 9.0%), Education, Arts & Media (12 | 5.7%), Health Diagnosing & Treating (9 | 4.3%), Education Instruction & Library (7 | 3.3%), and Computers, Engineering & Science (5 | 2.4%).
Management, Business, Science and Arts Occupations by Sex
Within the Management, Business, Science and Arts occupations in Wheatland, the most male-oriented occupations are Education, Arts & Media (75.0%), Community & Social Service (52.6%), and Health Diagnosing & Treating (22.2%), while the most female-oriented occupations are Management (100.0%), Computers, Engineering & Science (100.0%), and Architecture & Engineering (100.0%).
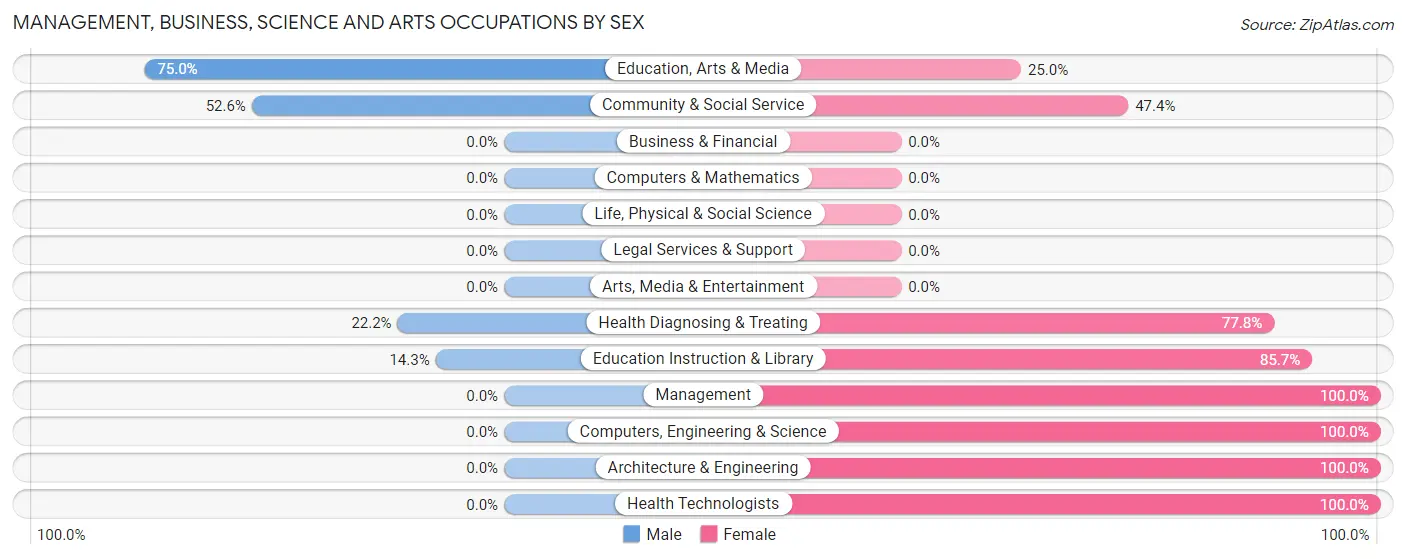
| Occupation | Male | Female |
| Management | 0 (0.0%) | 2 (100.0%) |
| Business & Financial | 0 (0.0%) | 0 (0.0%) |
| Computers, Engineering & Science | 0 (0.0%) | 5 (100.0%) |
| Computers & Mathematics | 0 (0.0%) | 0 (0.0%) |
| Architecture & Engineering | 0 (0.0%) | 5 (100.0%) |
| Life, Physical & Social Science | 0 (0.0%) | 0 (0.0%) |
| Community & Social Service | 10 (52.6%) | 9 (47.4%) |
| Education, Arts & Media | 9 (75.0%) | 3 (25.0%) |
| Legal Services & Support | 0 (0.0%) | 0 (0.0%) |
| Education Instruction & Library | 1 (14.3%) | 6 (85.7%) |
| Arts, Media & Entertainment | 0 (0.0%) | 0 (0.0%) |
| Health Diagnosing & Treating | 2 (22.2%) | 7 (77.8%) |
| Health Technologists | 0 (0.0%) | 5 (100.0%) |
| Total (Category) | 12 (34.3%) | 23 (65.7%) |
| Total (Overall) | 103 (48.6%) | 109 (51.4%) |
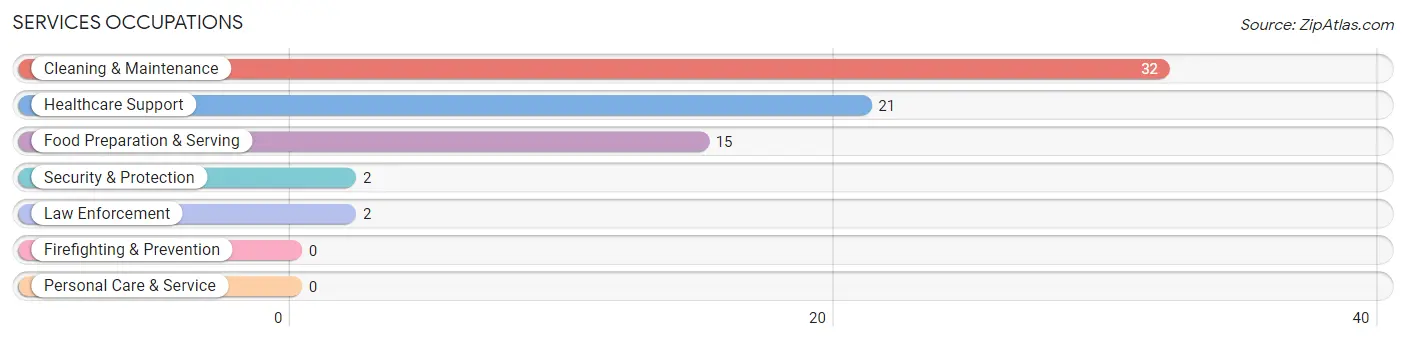
Services Occupations
The most common Services occupations in Wheatland are Cleaning & Maintenance (32 | 15.1%), Healthcare Support (21 | 9.9%), Food Preparation & Serving (15 | 7.1%), Security & Protection (2 | 0.9%), and Law Enforcement (2 | 0.9%).
Services Occupations by Sex
Within the Services occupations in Wheatland, the most male-oriented occupations are Security & Protection (50.0%), Law Enforcement (50.0%), and Food Preparation & Serving (40.0%), while the most female-oriented occupations are Healthcare Support (100.0%), Cleaning & Maintenance (78.1%), and Food Preparation & Serving (60.0%).
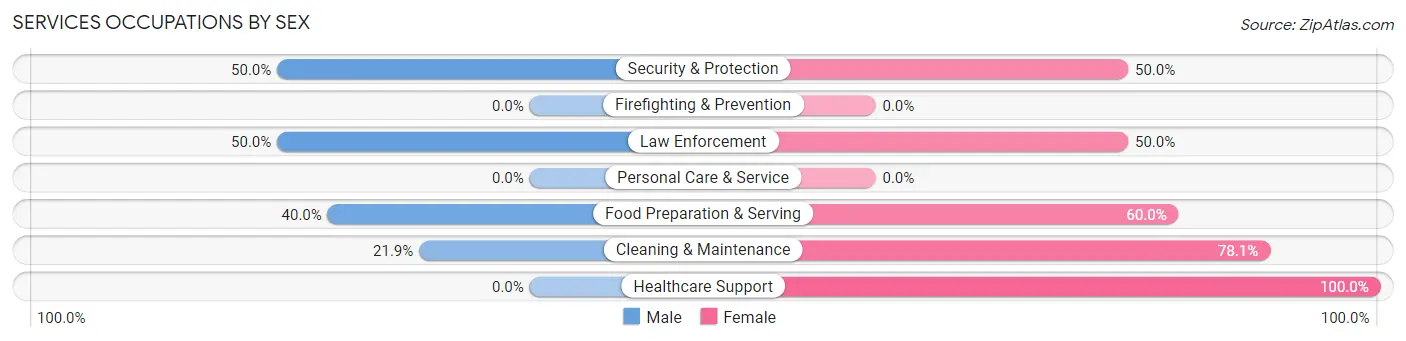
| Occupation | Male | Female |
| Healthcare Support | 0 (0.0%) | 21 (100.0%) |
| Security & Protection | 1 (50.0%) | 1 (50.0%) |
| Firefighting & Prevention | 0 (0.0%) | 0 (0.0%) |
| Law Enforcement | 1 (50.0%) | 1 (50.0%) |
| Food Preparation & Serving | 6 (40.0%) | 9 (60.0%) |
| Cleaning & Maintenance | 7 (21.9%) | 25 (78.1%) |
| Personal Care & Service | 0 (0.0%) | 0 (0.0%) |
| Total (Category) | 14 (20.0%) | 56 (80.0%) |
| Total (Overall) | 103 (48.6%) | 109 (51.4%) |
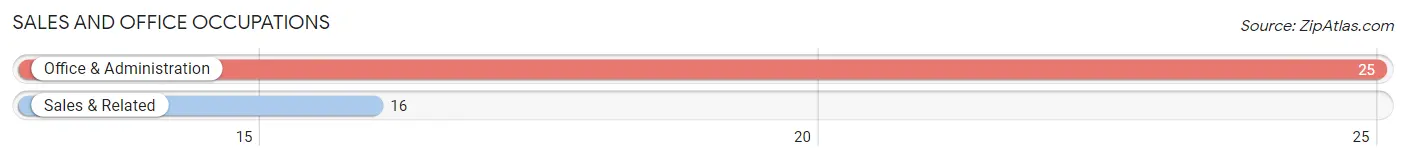
Sales and Office Occupations
The most common Sales and Office occupations in Wheatland are Office & Administration (25 | 11.8%), and Sales & Related (16 | 7.5%).
Sales and Office Occupations by Sex
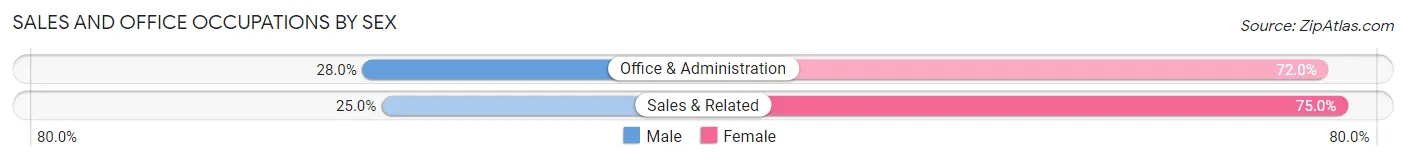
| Occupation | Male | Female |
| Sales & Related | 4 (25.0%) | 12 (75.0%) |
| Office & Administration | 7 (28.0%) | 18 (72.0%) |
| Total (Category) | 11 (26.8%) | 30 (73.2%) |
| Total (Overall) | 103 (48.6%) | 109 (51.4%) |
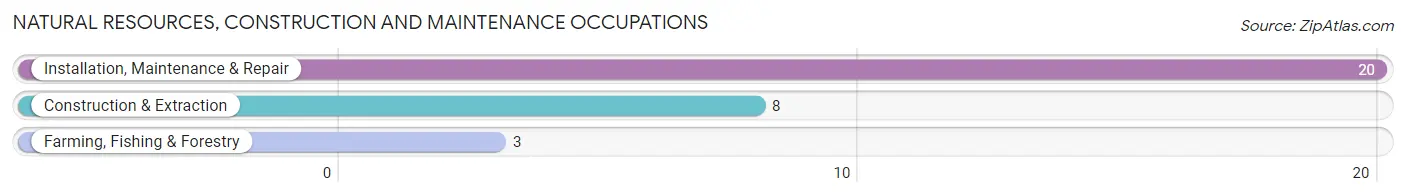
Natural Resources, Construction and Maintenance Occupations
The most common Natural Resources, Construction and Maintenance occupations in Wheatland are Installation, Maintenance & Repair (20 | 9.4%), Construction & Extraction (8 | 3.8%), and Farming, Fishing & Forestry (3 | 1.4%).
Natural Resources, Construction and Maintenance Occupations by Sex
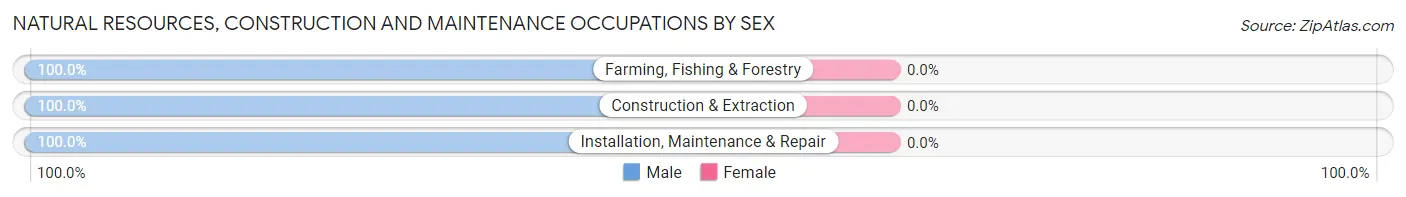
| Occupation | Male | Female |
| Farming, Fishing & Forestry | 3 (100.0%) | 0 (0.0%) |
| Construction & Extraction | 8 (100.0%) | 0 (0.0%) |
| Installation, Maintenance & Repair | 20 (100.0%) | 0 (0.0%) |
| Total (Category) | 31 (100.0%) | 0 (0.0%) |
| Total (Overall) | 103 (48.6%) | 109 (51.4%) |
Production, Transportation and Moving Occupations
The most common Production, Transportation and Moving occupations in Wheatland are Production (20 | 9.4%), Transportation (8 | 3.8%), and Material Moving (7 | 3.3%).
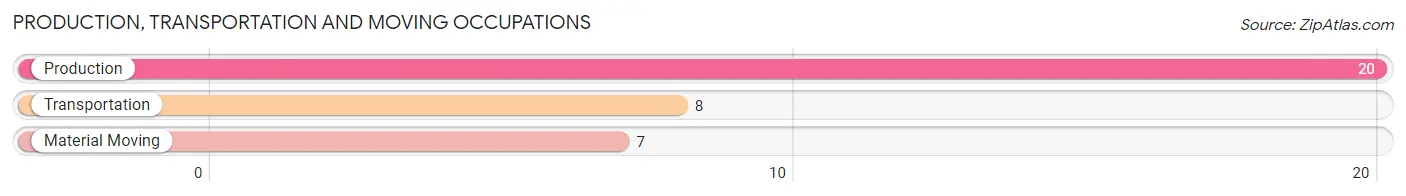
Production, Transportation and Moving Occupations by Sex
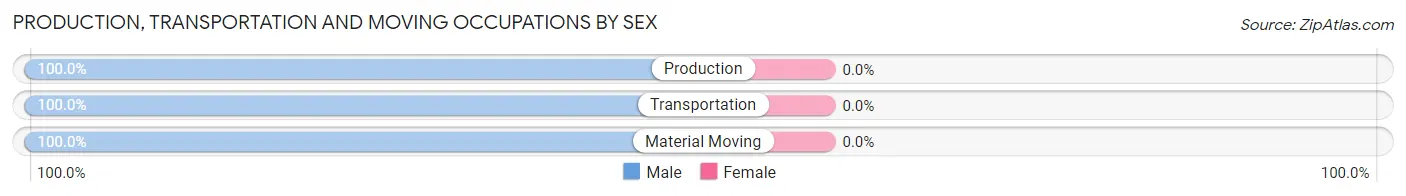
| Occupation | Male | Female |
| Production | 20 (100.0%) | 0 (0.0%) |
| Transportation | 8 (100.0%) | 0 (0.0%) |
| Material Moving | 7 (100.0%) | 0 (0.0%) |
| Total (Category) | 35 (100.0%) | 0 (0.0%) |
| Total (Overall) | 103 (48.6%) | 109 (51.4%) |
Employment Industries by Sex in Wheatland
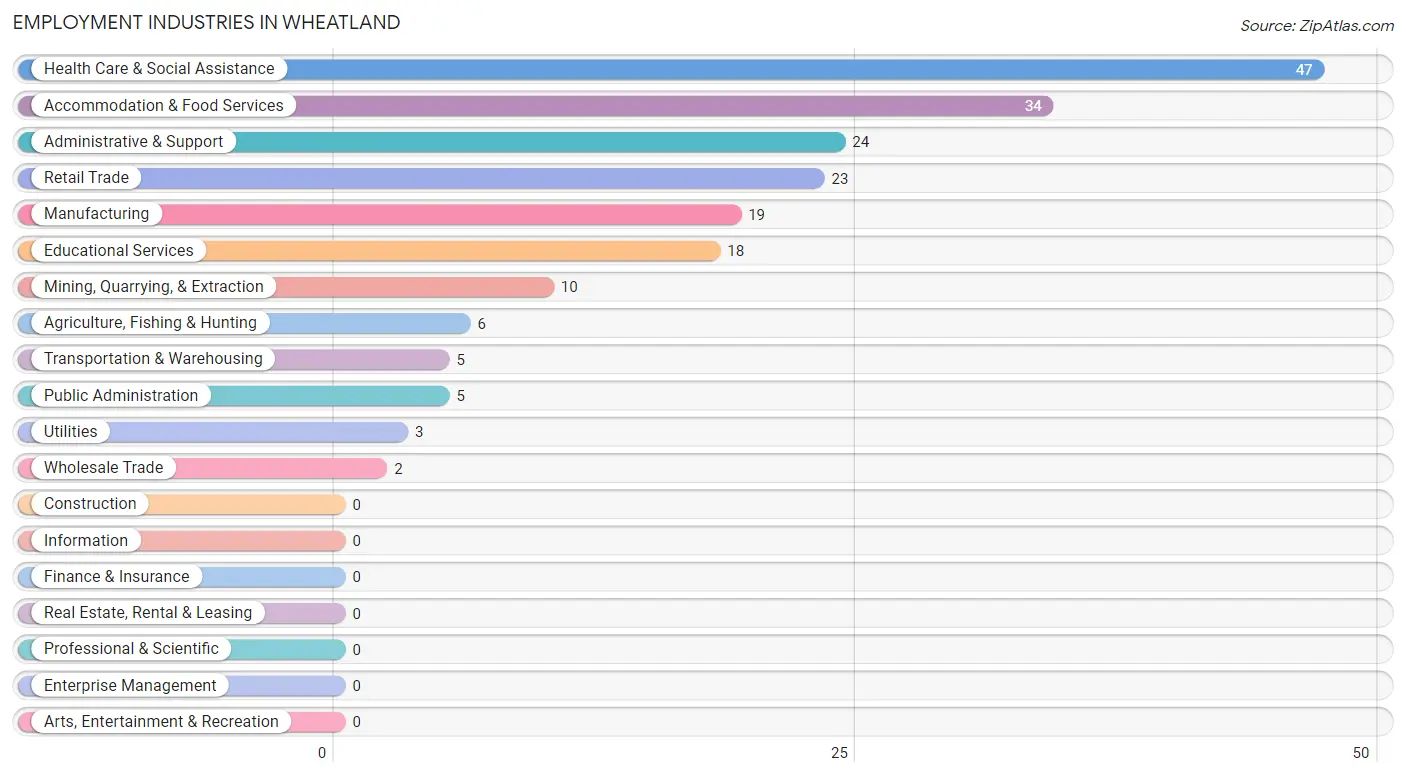
Employment Industries in Wheatland
The major employment industries in Wheatland include Health Care & Social Assistance (47 | 22.2%), Accommodation & Food Services (34 | 16.0%), Administrative & Support (24 | 11.3%), Retail Trade (23 | 10.8%), and Manufacturing (19 | 9.0%).
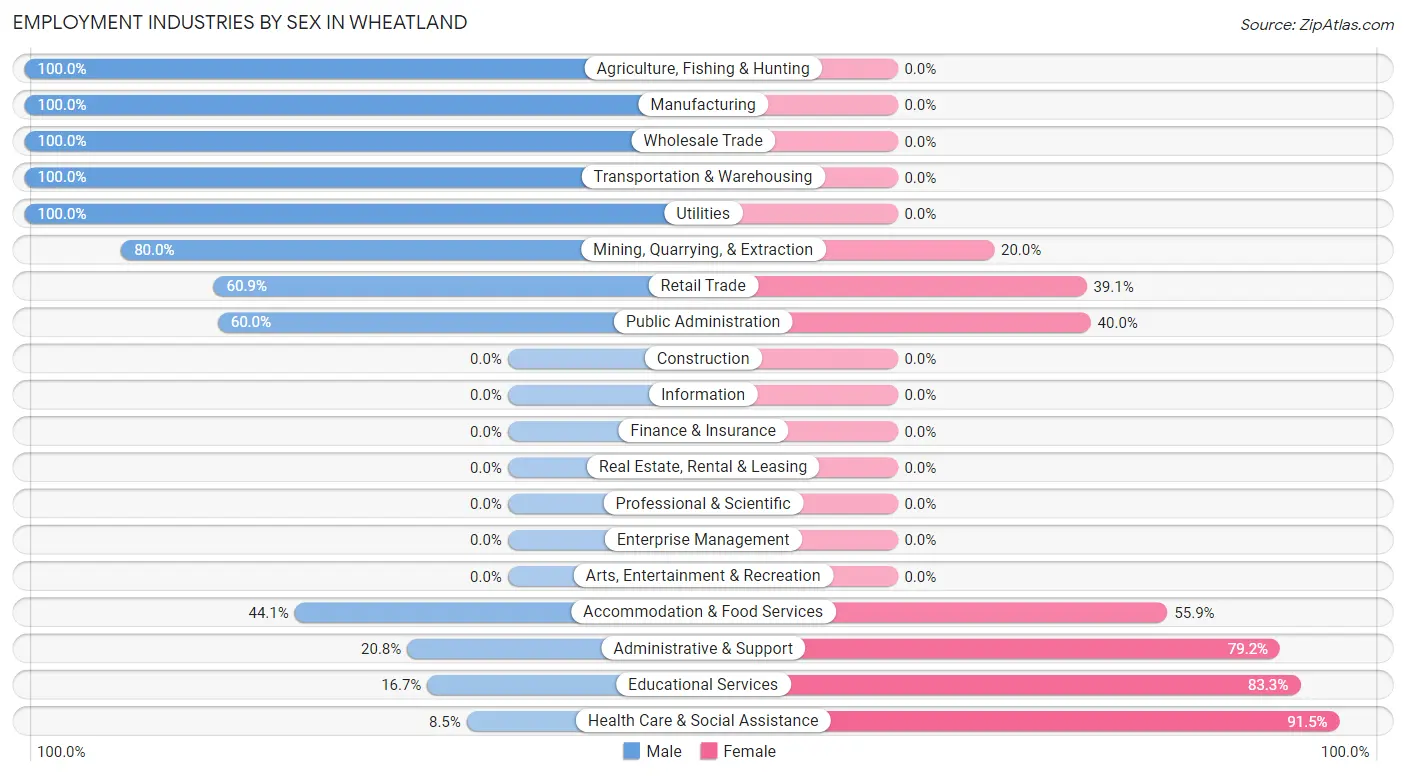
Employment Industries by Sex in Wheatland
The Wheatland industries that see more men than women are Agriculture, Fishing & Hunting (100.0%), Manufacturing (100.0%), and Wholesale Trade (100.0%), whereas the industries that tend to have a higher number of women are Health Care & Social Assistance (91.5%), Educational Services (83.3%), and Administrative & Support (79.2%).
| Industry | Male | Female |
| Agriculture, Fishing & Hunting | 6 (100.0%) | 0 (0.0%) |
| Mining, Quarrying, & Extraction | 8 (80.0%) | 2 (20.0%) |
| Construction | 0 (0.0%) | 0 (0.0%) |
| Manufacturing | 19 (100.0%) | 0 (0.0%) |
| Wholesale Trade | 2 (100.0%) | 0 (0.0%) |
| Retail Trade | 14 (60.9%) | 9 (39.1%) |
| Transportation & Warehousing | 5 (100.0%) | 0 (0.0%) |
| Utilities | 3 (100.0%) | 0 (0.0%) |
| Information | 0 (0.0%) | 0 (0.0%) |
| Finance & Insurance | 0 (0.0%) | 0 (0.0%) |
| Real Estate, Rental & Leasing | 0 (0.0%) | 0 (0.0%) |
| Professional & Scientific | 0 (0.0%) | 0 (0.0%) |
| Enterprise Management | 0 (0.0%) | 0 (0.0%) |
| Administrative & Support | 5 (20.8%) | 19 (79.2%) |
| Educational Services | 3 (16.7%) | 15 (83.3%) |
| Health Care & Social Assistance | 4 (8.5%) | 43 (91.5%) |
| Arts, Entertainment & Recreation | 0 (0.0%) | 0 (0.0%) |
| Accommodation & Food Services | 15 (44.1%) | 19 (55.9%) |
| Public Administration | 3 (60.0%) | 2 (40.0%) |
| Total | 103 (48.6%) | 109 (51.4%) |
Education in Wheatland
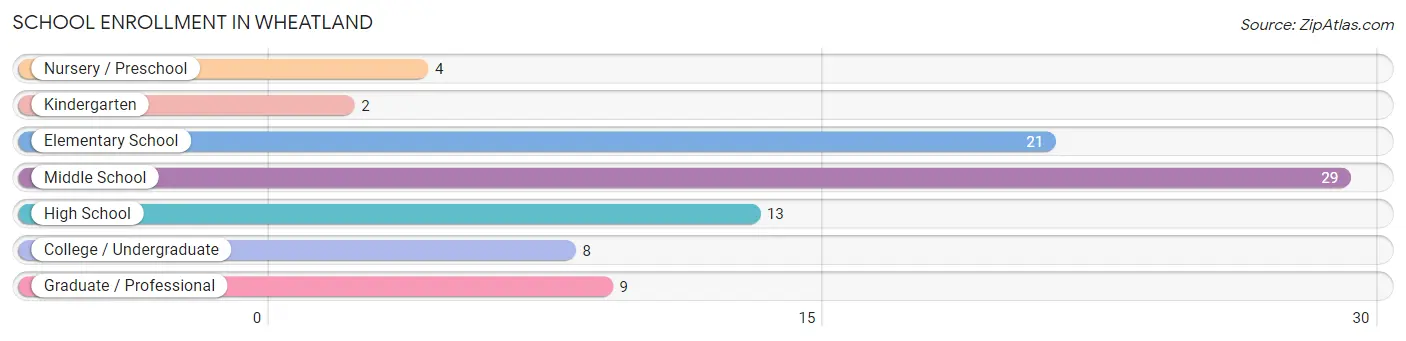
School Enrollment in Wheatland
The most common levels of schooling among the 86 students in Wheatland are middle school (29 | 33.7%), elementary school (21 | 24.4%), and high school (13 | 15.1%).
| School Level | # Students | % Students |
| Nursery / Preschool | 4 | 4.6% |
| Kindergarten | 2 | 2.3% |
| Elementary School | 21 | 24.4% |
| Middle School | 29 | 33.7% |
| High School | 13 | 15.1% |
| College / Undergraduate | 8 | 9.3% |
| Graduate / Professional | 9 | 10.5% |
| Total | 86 | 100.0% |
School Enrollment by Age by Funding Source in Wheatland
Out of a total of 86 students who are enrolled in schools in Wheatland, 12 (14.0%) attend a private institution, while the remaining 74 (86.0%) are enrolled in public schools. The age group of 20 to 24 year olds has the highest likelihood of being enrolled in private schools, with 9 (60.0% in the age bracket) enrolled. Conversely, the age group of 3 to 4 year olds has the lowest likelihood of being enrolled in a private school, with 2 (100.0% in the age bracket) attending a public institution.
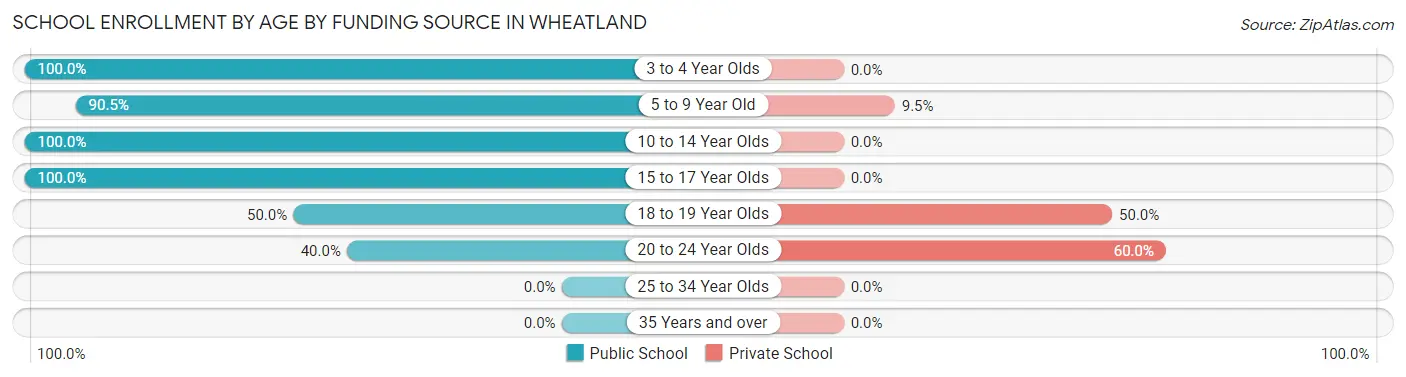
| Age Bracket | Public School | Private School |
| 3 to 4 Year Olds | 2 (100.0%) | 0 (0.0%) |
| 5 to 9 Year Old | 19 (90.5%) | 2 (9.5%) |
| 10 to 14 Year Olds | 30 (100.0%) | 0 (0.0%) |
| 15 to 17 Year Olds | 16 (100.0%) | 0 (0.0%) |
| 18 to 19 Year Olds | 1 (50.0%) | 1 (50.0%) |
| 20 to 24 Year Olds | 6 (40.0%) | 9 (60.0%) |
| 25 to 34 Year Olds | 0 (0.0%) | 0 (0.0%) |
| 35 Years and over | 0 (0.0%) | 0 (0.0%) |
| Total | 74 (86.0%) | 12 (14.0%) |
Educational Attainment by Field of Study in Wheatland
Liberal arts & history (5 | 38.5%), science & technology (3 | 23.1%), education (3 | 23.1%), business (1 | 7.7%), and arts & humanities (1 | 7.7%) are the most common fields of study among 13 individuals in Wheatland who have obtained a bachelor's degree or higher.
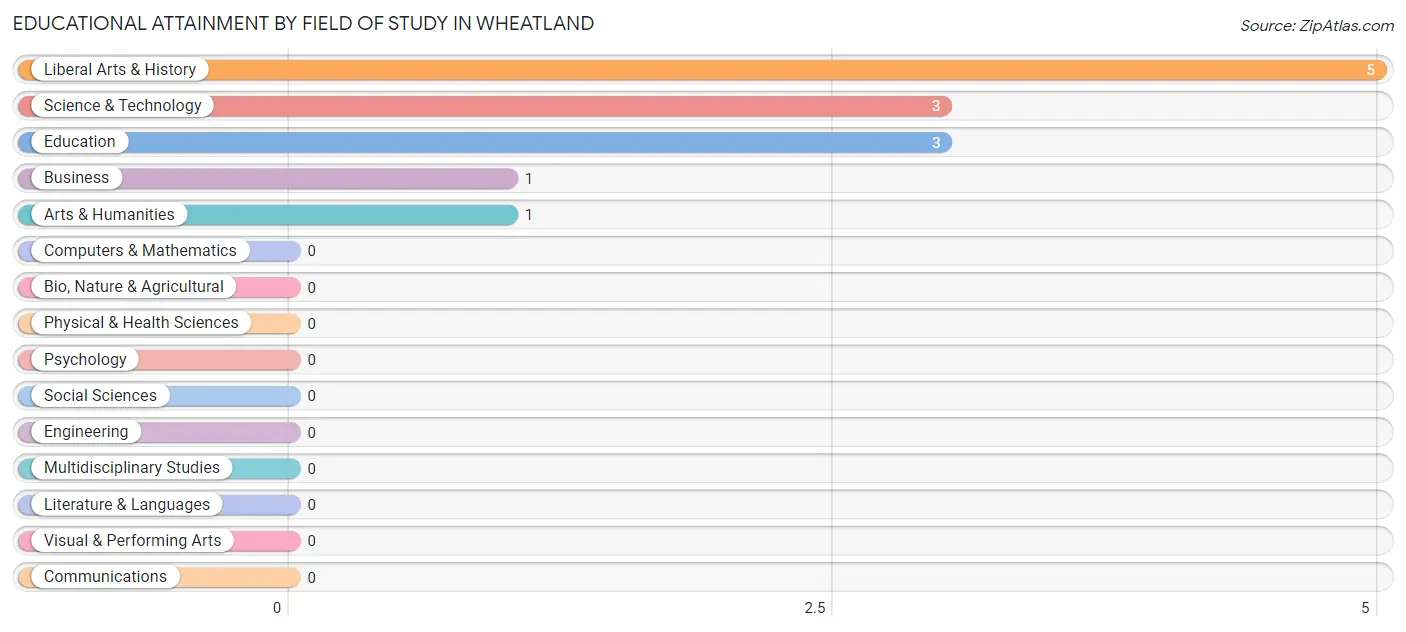
| Field of Study | # Graduates | % Graduates |
| Computers & Mathematics | 0 | 0.0% |
| Bio, Nature & Agricultural | 0 | 0.0% |
| Physical & Health Sciences | 0 | 0.0% |
| Psychology | 0 | 0.0% |
| Social Sciences | 0 | 0.0% |
| Engineering | 0 | 0.0% |
| Multidisciplinary Studies | 0 | 0.0% |
| Science & Technology | 3 | 23.1% |
| Business | 1 | 7.7% |
| Education | 3 | 23.1% |
| Literature & Languages | 0 | 0.0% |
| Liberal Arts & History | 5 | 38.5% |
| Visual & Performing Arts | 0 | 0.0% |
| Communications | 0 | 0.0% |
| Arts & Humanities | 1 | 7.7% |
| Total | 13 | 100.0% |
Transportation & Commute in Wheatland
Vehicle Availability by Sex in Wheatland
The most prevalent vehicle ownership categories in Wheatland are males with 2 vehicles (60, accounting for 58.3%) and females with 2 vehicles (59, making up 58.3%).
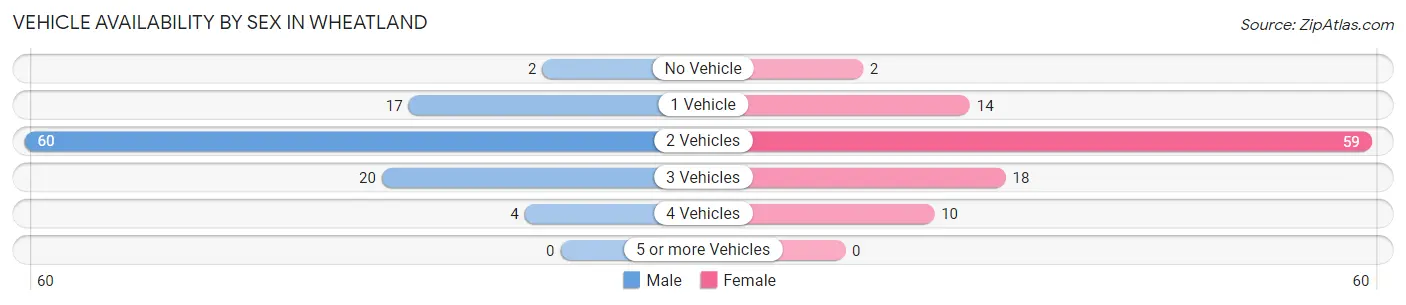
| Vehicles Available | Male | Female |
| No Vehicle | 2 (1.9%) | 2 (1.9%) |
| 1 Vehicle | 17 (16.5%) | 14 (13.6%) |
| 2 Vehicles | 60 (58.3%) | 59 (57.3%) |
| 3 Vehicles | 20 (19.4%) | 18 (17.5%) |
| 4 Vehicles | 4 (3.9%) | 10 (9.7%) |
| 5 or more Vehicles | 0 (0.0%) | 0 (0.0%) |
| Total | 103 (100.0%) | 103 (100.0%) |
Commute Time in Wheatland
The most frequently occuring commute durations in Wheatland are 15 to 19 minutes (66 commuters, 33.2%), 20 to 24 minutes (40 commuters, 20.1%), and 25 to 29 minutes (18 commuters, 9.0%).
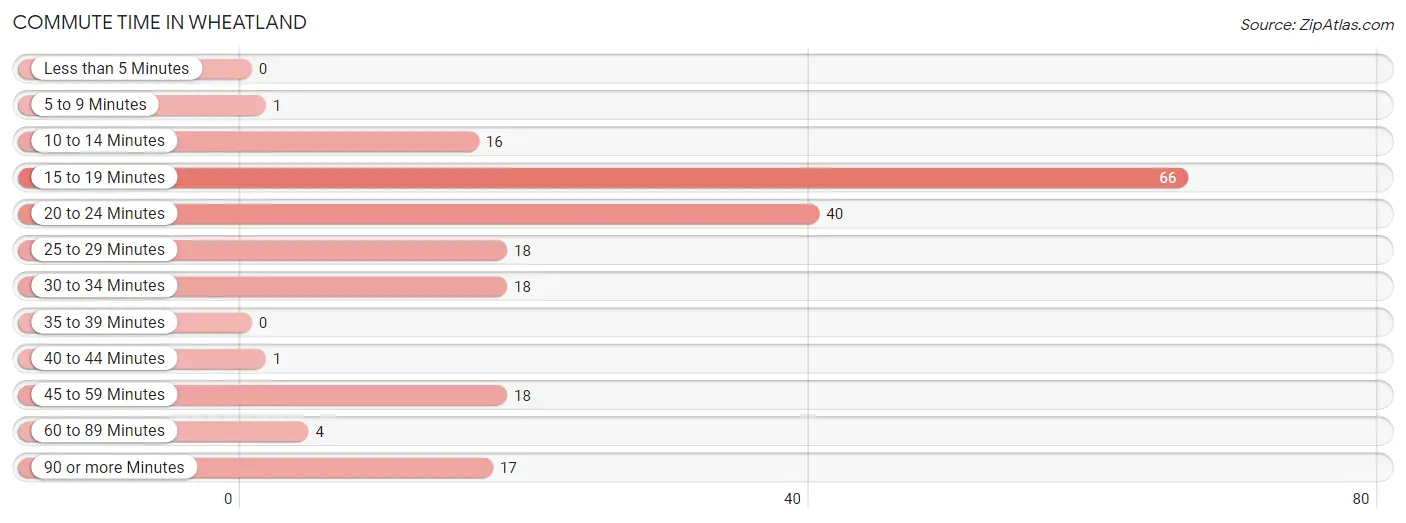
| Commute Time | # Commuters | % Commuters |
| Less than 5 Minutes | 0 | 0.0% |
| 5 to 9 Minutes | 1 | 0.5% |
| 10 to 14 Minutes | 16 | 8.0% |
| 15 to 19 Minutes | 66 | 33.2% |
| 20 to 24 Minutes | 40 | 20.1% |
| 25 to 29 Minutes | 18 | 9.0% |
| 30 to 34 Minutes | 18 | 9.0% |
| 35 to 39 Minutes | 0 | 0.0% |
| 40 to 44 Minutes | 1 | 0.5% |
| 45 to 59 Minutes | 18 | 9.0% |
| 60 to 89 Minutes | 4 | 2.0% |
| 90 or more Minutes | 17 | 8.5% |
Commute Time by Sex in Wheatland
The most common commute times in Wheatland are 15 to 19 minutes (44 commuters, 42.7%) for males and 20 to 24 minutes (31 commuters, 32.3%) for females.
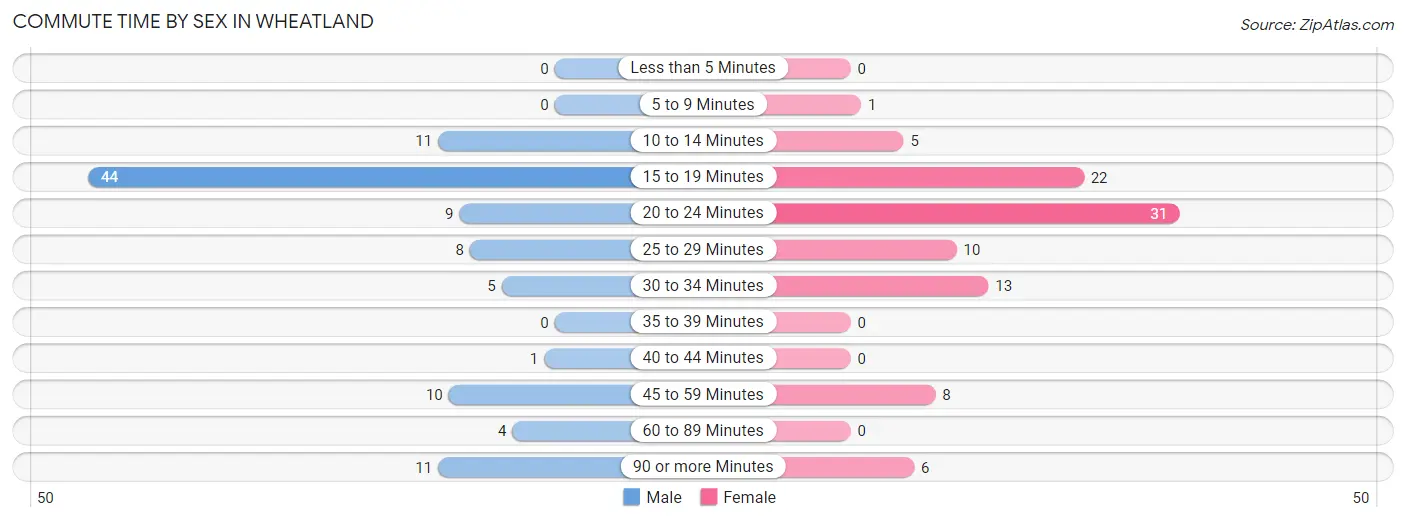
| Commute Time | Male | Female |
| Less than 5 Minutes | 0 (0.0%) | 0 (0.0%) |
| 5 to 9 Minutes | 0 (0.0%) | 1 (1.0%) |
| 10 to 14 Minutes | 11 (10.7%) | 5 (5.2%) |
| 15 to 19 Minutes | 44 (42.7%) | 22 (22.9%) |
| 20 to 24 Minutes | 9 (8.7%) | 31 (32.3%) |
| 25 to 29 Minutes | 8 (7.8%) | 10 (10.4%) |
| 30 to 34 Minutes | 5 (4.9%) | 13 (13.5%) |
| 35 to 39 Minutes | 0 (0.0%) | 0 (0.0%) |
| 40 to 44 Minutes | 1 (1.0%) | 0 (0.0%) |
| 45 to 59 Minutes | 10 (9.7%) | 8 (8.3%) |
| 60 to 89 Minutes | 4 (3.9%) | 0 (0.0%) |
| 90 or more Minutes | 11 (10.7%) | 6 (6.2%) |
Time of Departure to Work by Sex in Wheatland
The most frequent times of departure to work in Wheatland are 7:30 AM to 7:59 AM (36, 34.9%) for males and 7:30 AM to 7:59 AM (27, 28.1%) for females.
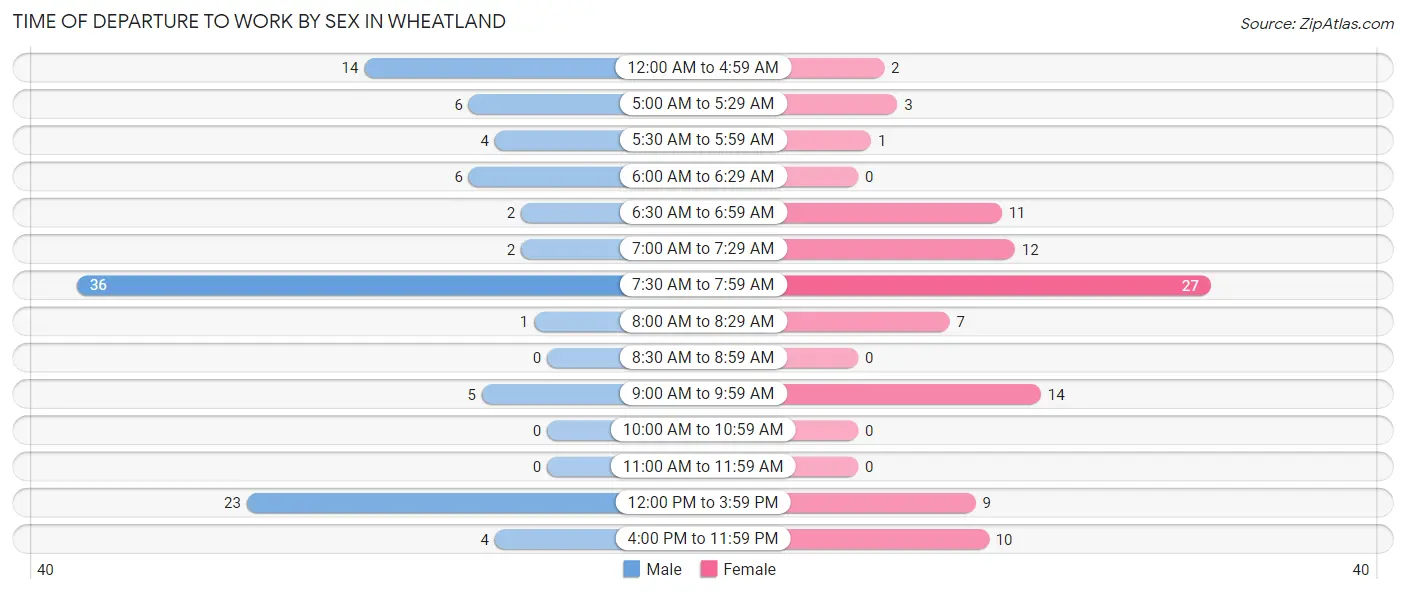
| Time of Departure | Male | Female |
| 12:00 AM to 4:59 AM | 14 (13.6%) | 2 (2.1%) |
| 5:00 AM to 5:29 AM | 6 (5.8%) | 3 (3.1%) |
| 5:30 AM to 5:59 AM | 4 (3.9%) | 1 (1.0%) |
| 6:00 AM to 6:29 AM | 6 (5.8%) | 0 (0.0%) |
| 6:30 AM to 6:59 AM | 2 (1.9%) | 11 (11.5%) |
| 7:00 AM to 7:29 AM | 2 (1.9%) | 12 (12.5%) |
| 7:30 AM to 7:59 AM | 36 (34.9%) | 27 (28.1%) |
| 8:00 AM to 8:29 AM | 1 (1.0%) | 7 (7.3%) |
| 8:30 AM to 8:59 AM | 0 (0.0%) | 0 (0.0%) |
| 9:00 AM to 9:59 AM | 5 (4.9%) | 14 (14.6%) |
| 10:00 AM to 10:59 AM | 0 (0.0%) | 0 (0.0%) |
| 11:00 AM to 11:59 AM | 0 (0.0%) | 0 (0.0%) |
| 12:00 PM to 3:59 PM | 23 (22.3%) | 9 (9.4%) |
| 4:00 PM to 11:59 PM | 4 (3.9%) | 10 (10.4%) |
| Total | 103 (100.0%) | 96 (100.0%) |
Housing Occupancy in Wheatland
Occupancy by Ownership in Wheatland
Of the total 177 dwellings in Wheatland, owner-occupied units account for 121 (68.4%), while renter-occupied units make up 56 (31.6%).
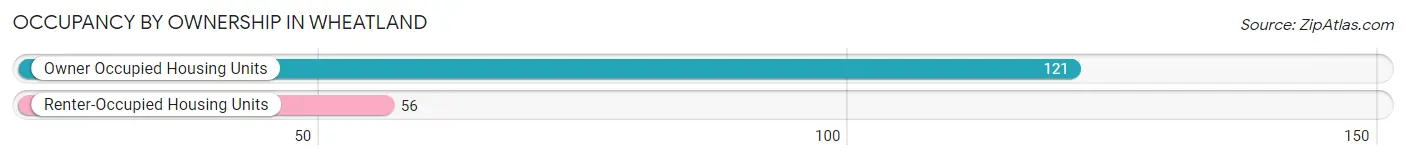
| Occupancy | # Housing Units | % Housing Units |
| Owner Occupied Housing Units | 121 | 68.4% |
| Renter-Occupied Housing Units | 56 | 31.6% |
| Total Occupied Housing Units | 177 | 100.0% |
Occupancy by Household Size in Wheatland
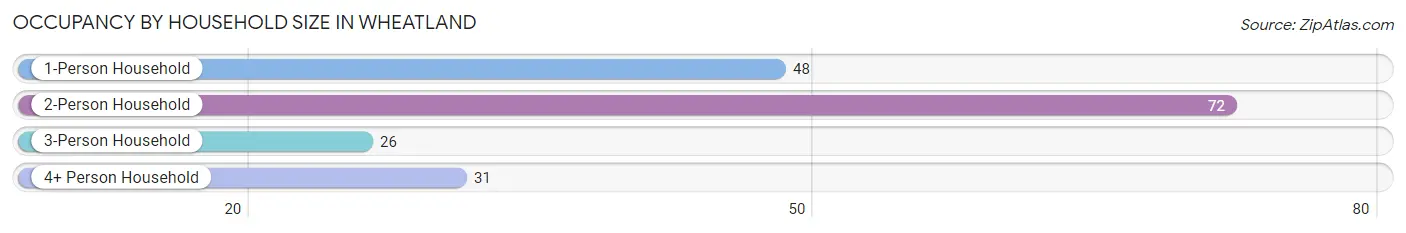
| Household Size | # Housing Units | % Housing Units |
| 1-Person Household | 48 | 27.1% |
| 2-Person Household | 72 | 40.7% |
| 3-Person Household | 26 | 14.7% |
| 4+ Person Household | 31 | 17.5% |
| Total Housing Units | 177 | 100.0% |
Occupancy by Ownership by Household Size in Wheatland
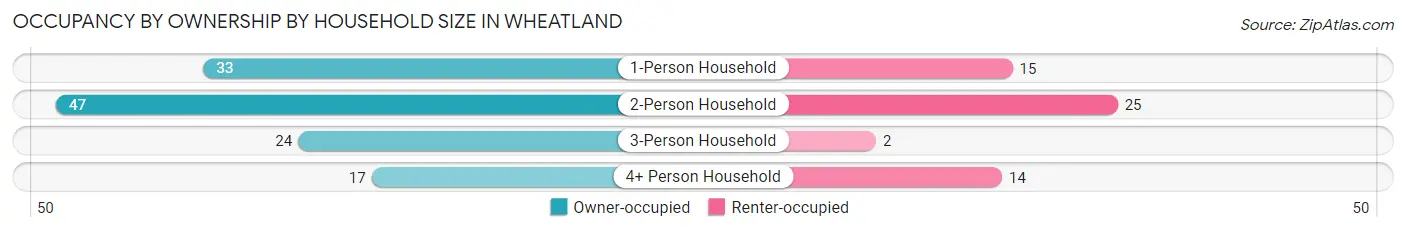
| Household Size | Owner-occupied | Renter-occupied |
| 1-Person Household | 33 (68.8%) | 15 (31.2%) |
| 2-Person Household | 47 (65.3%) | 25 (34.7%) |
| 3-Person Household | 24 (92.3%) | 2 (7.7%) |
| 4+ Person Household | 17 (54.8%) | 14 (45.2%) |
| Total Housing Units | 121 (68.4%) | 56 (31.6%) |
Occupancy by Educational Attainment in Wheatland
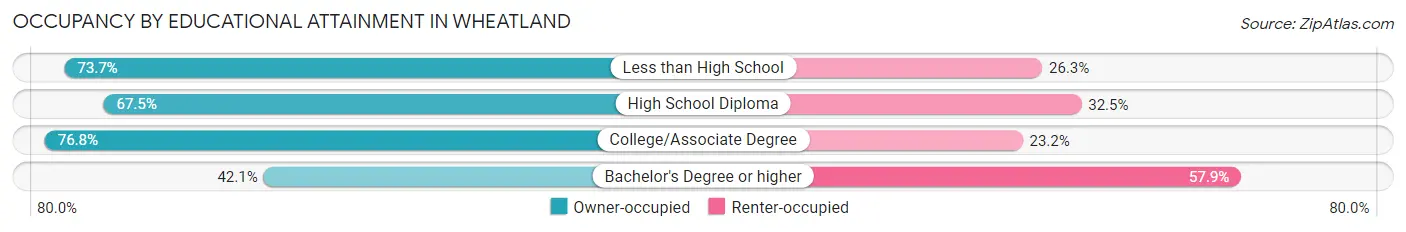
| Household Size | Owner-occupied | Renter-occupied |
| Less than High School | 14 (73.7%) | 5 (26.3%) |
| High School Diploma | 56 (67.5%) | 27 (32.5%) |
| College/Associate Degree | 43 (76.8%) | 13 (23.2%) |
| Bachelor's Degree or higher | 8 (42.1%) | 11 (57.9%) |
Occupancy by Age of Householder in Wheatland
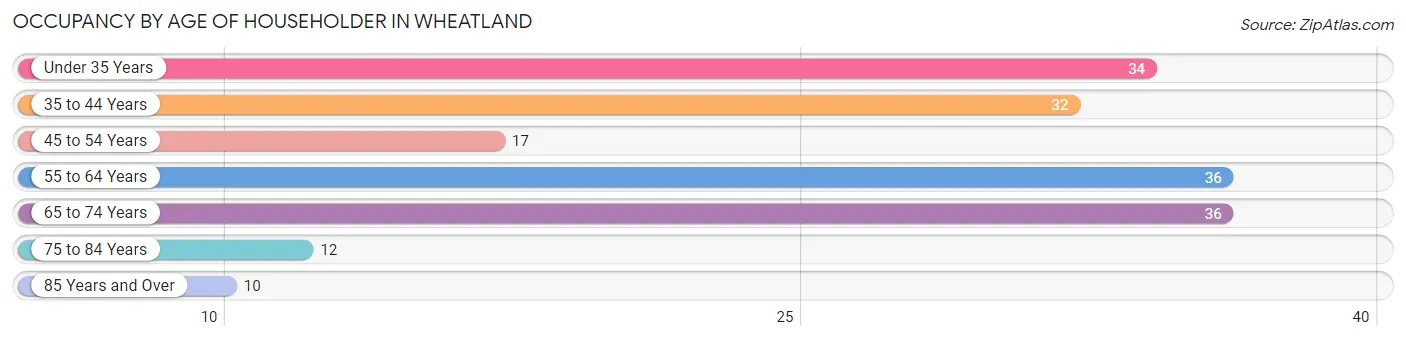
| Age Bracket | # Households | % Households |
| Under 35 Years | 34 | 19.2% |
| 35 to 44 Years | 32 | 18.1% |
| 45 to 54 Years | 17 | 9.6% |
| 55 to 64 Years | 36 | 20.3% |
| 65 to 74 Years | 36 | 20.3% |
| 75 to 84 Years | 12 | 6.8% |
| 85 Years and Over | 10 | 5.7% |
| Total | 177 | 100.0% |
Housing Finances in Wheatland
Median Income by Occupancy in Wheatland
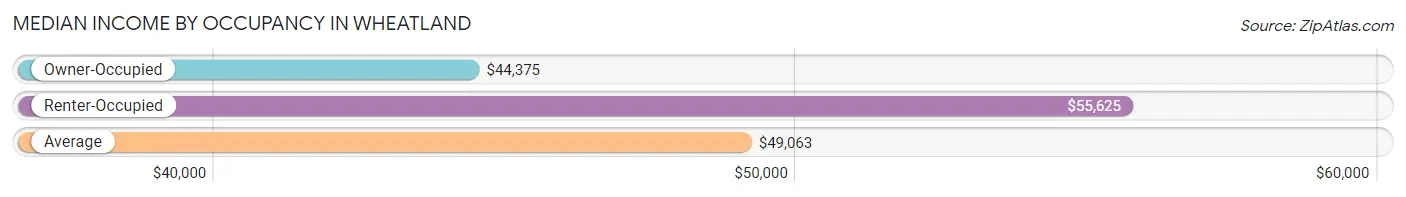
| Occupancy Type | # Households | Median Income |
| Owner-Occupied | 121 (68.4%) | $44,375 |
| Renter-Occupied | 56 (31.6%) | $55,625 |
| Average | 177 (100.0%) | $49,063 |
Occupancy by Householder Income Bracket in Wheatland
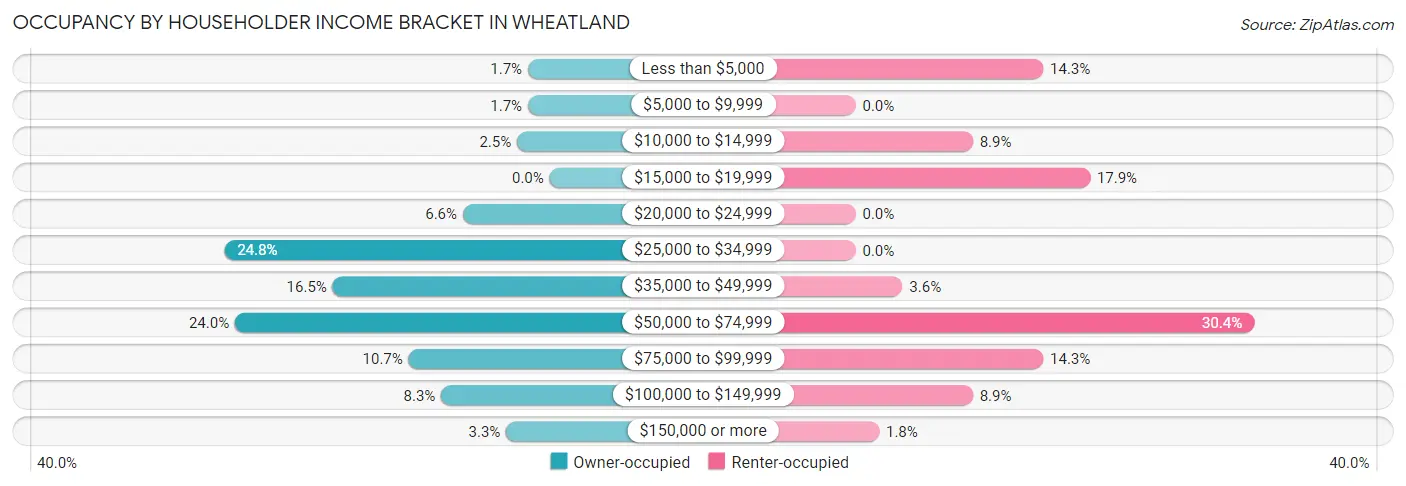
| Income Bracket | Owner-occupied | Renter-occupied |
| Less than $5,000 | 2 (1.7%) | 8 (14.3%) |
| $5,000 to $9,999 | 2 (1.7%) | 0 (0.0%) |
| $10,000 to $14,999 | 3 (2.5%) | 5 (8.9%) |
| $15,000 to $19,999 | 0 (0.0%) | 10 (17.9%) |
| $20,000 to $24,999 | 8 (6.6%) | 0 (0.0%) |
| $25,000 to $34,999 | 30 (24.8%) | 0 (0.0%) |
| $35,000 to $49,999 | 20 (16.5%) | 2 (3.6%) |
| $50,000 to $74,999 | 29 (24.0%) | 17 (30.4%) |
| $75,000 to $99,999 | 13 (10.7%) | 8 (14.3%) |
| $100,000 to $149,999 | 10 (8.3%) | 5 (8.9%) |
| $150,000 or more | 4 (3.3%) | 1 (1.8%) |
| Total | 121 (100.0%) | 56 (100.0%) |
Monthly Housing Cost Tiers in Wheatland
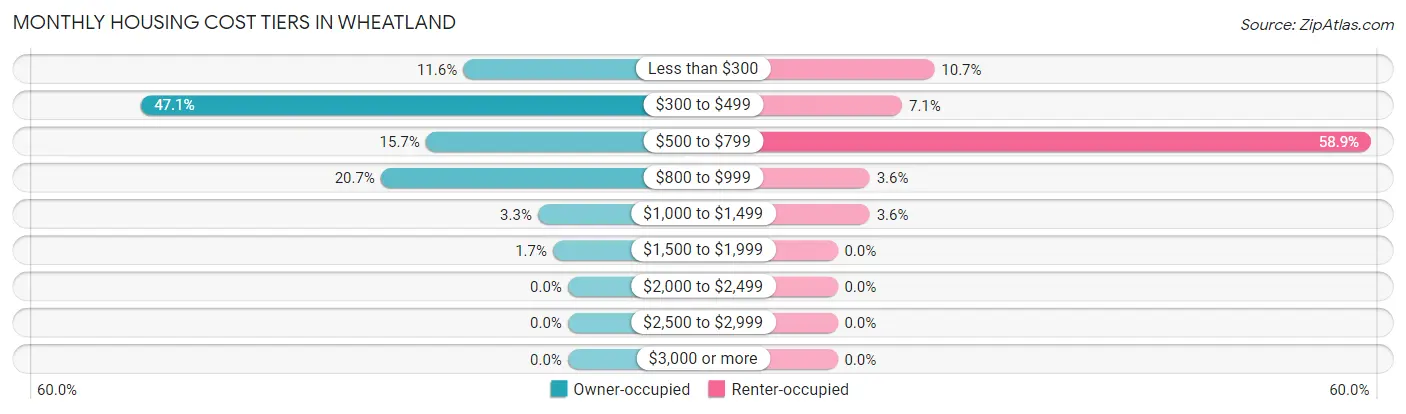
| Monthly Cost | Owner-occupied | Renter-occupied |
| Less than $300 | 14 (11.6%) | 6 (10.7%) |
| $300 to $499 | 57 (47.1%) | 4 (7.1%) |
| $500 to $799 | 19 (15.7%) | 33 (58.9%) |
| $800 to $999 | 25 (20.7%) | 2 (3.6%) |
| $1,000 to $1,499 | 4 (3.3%) | 2 (3.6%) |
| $1,500 to $1,999 | 2 (1.7%) | 0 (0.0%) |
| $2,000 to $2,499 | 0 (0.0%) | 0 (0.0%) |
| $2,500 to $2,999 | 0 (0.0%) | 0 (0.0%) |
| $3,000 or more | 0 (0.0%) | 0 (0.0%) |
| Total | 121 (100.0%) | 56 (100.0%) |
Physical Housing Characteristics in Wheatland
Housing Structures in Wheatland
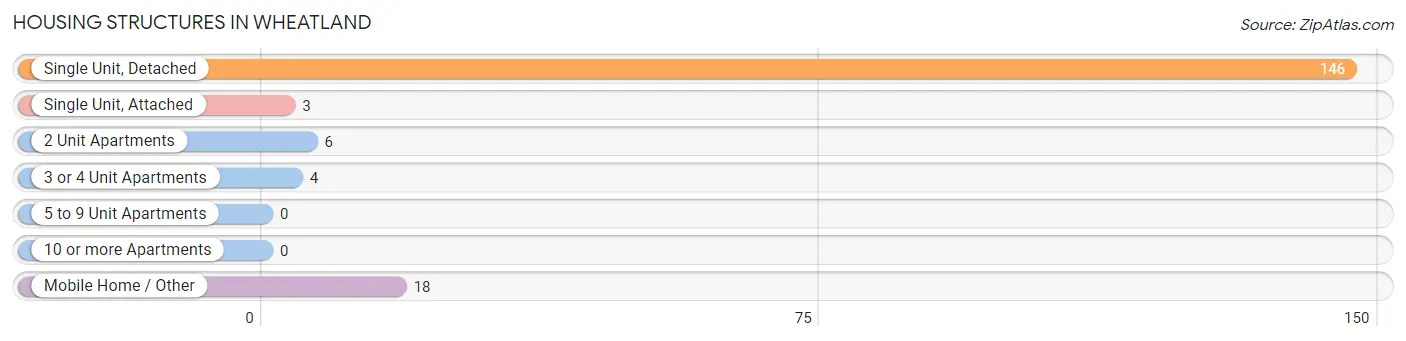
| Structure Type | # Housing Units | % Housing Units |
| Single Unit, Detached | 146 | 82.5% |
| Single Unit, Attached | 3 | 1.7% |
| 2 Unit Apartments | 6 | 3.4% |
| 3 or 4 Unit Apartments | 4 | 2.3% |
| 5 to 9 Unit Apartments | 0 | 0.0% |
| 10 or more Apartments | 0 | 0.0% |
| Mobile Home / Other | 18 | 10.2% |
| Total | 177 | 100.0% |
Housing Structures by Occupancy in Wheatland
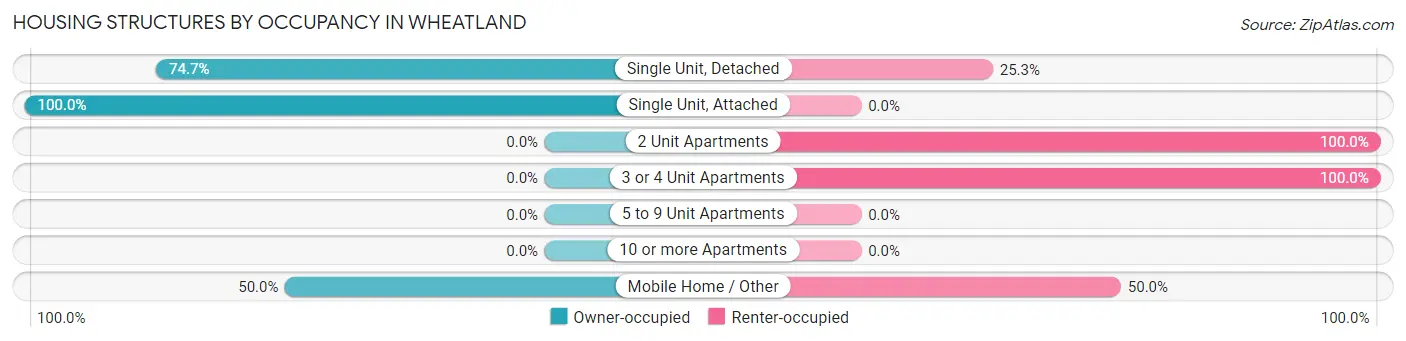
| Structure Type | Owner-occupied | Renter-occupied |
| Single Unit, Detached | 109 (74.7%) | 37 (25.3%) |
| Single Unit, Attached | 3 (100.0%) | 0 (0.0%) |
| 2 Unit Apartments | 0 (0.0%) | 6 (100.0%) |
| 3 or 4 Unit Apartments | 0 (0.0%) | 4 (100.0%) |
| 5 to 9 Unit Apartments | 0 (0.0%) | 0 (0.0%) |
| 10 or more Apartments | 0 (0.0%) | 0 (0.0%) |
| Mobile Home / Other | 9 (50.0%) | 9 (50.0%) |
| Total | 121 (68.4%) | 56 (31.6%) |
Housing Structures by Number of Rooms in Wheatland
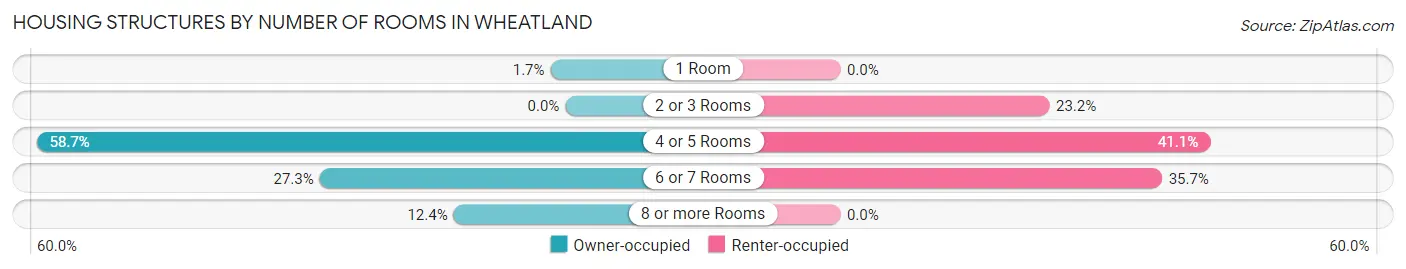
| Number of Rooms | Owner-occupied | Renter-occupied |
| 1 Room | 2 (1.7%) | 0 (0.0%) |
| 2 or 3 Rooms | 0 (0.0%) | 13 (23.2%) |
| 4 or 5 Rooms | 71 (58.7%) | 23 (41.1%) |
| 6 or 7 Rooms | 33 (27.3%) | 20 (35.7%) |
| 8 or more Rooms | 15 (12.4%) | 0 (0.0%) |
| Total | 121 (100.0%) | 56 (100.0%) |
Housing Structure by Heating Type in Wheatland
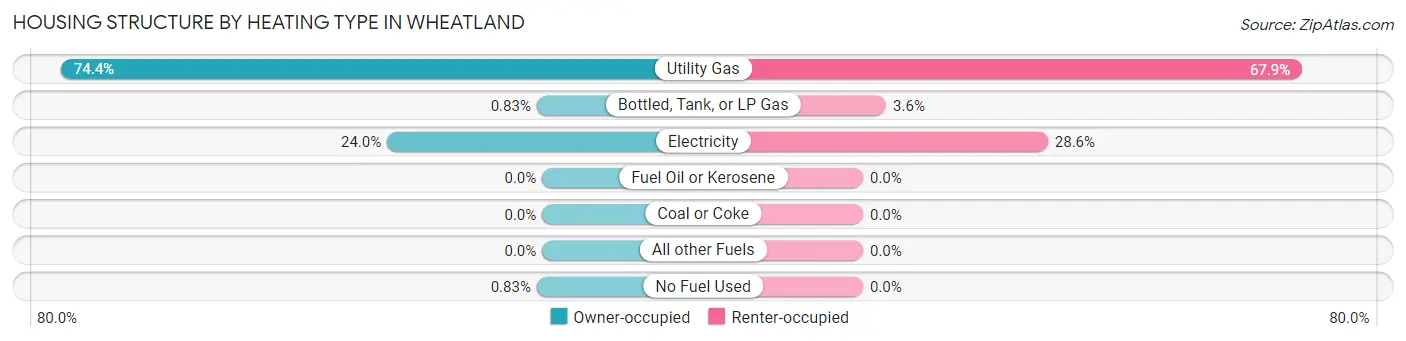
| Heating Type | Owner-occupied | Renter-occupied |
| Utility Gas | 90 (74.4%) | 38 (67.9%) |
| Bottled, Tank, or LP Gas | 1 (0.8%) | 2 (3.6%) |
| Electricity | 29 (24.0%) | 16 (28.6%) |
| Fuel Oil or Kerosene | 0 (0.0%) | 0 (0.0%) |
| Coal or Coke | 0 (0.0%) | 0 (0.0%) |
| All other Fuels | 0 (0.0%) | 0 (0.0%) |
| No Fuel Used | 1 (0.8%) | 0 (0.0%) |
| Total | 121 (100.0%) | 56 (100.0%) |
Household Vehicle Usage in Wheatland
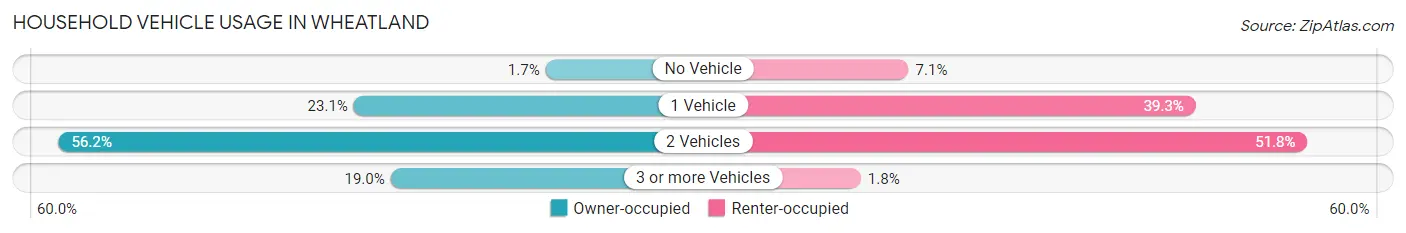
| Vehicles per Household | Owner-occupied | Renter-occupied |
| No Vehicle | 2 (1.7%) | 4 (7.1%) |
| 1 Vehicle | 28 (23.1%) | 22 (39.3%) |
| 2 Vehicles | 68 (56.2%) | 29 (51.8%) |
| 3 or more Vehicles | 23 (19.0%) | 1 (1.8%) |
| Total | 121 (100.0%) | 56 (100.0%) |
Real Estate & Mortgages in Wheatland
Real Estate and Mortgage Overview in Wheatland
| Characteristic | Without Mortgage | With Mortgage |
| Housing Units | 65 | 56 |
| Median Property Value | $43,600 | $75,000 |
| Median Household Income | $38,393 | $4 |
| Monthly Housing Costs | $389 | $0 |
| Real Estate Taxes | $455 | $6 |
Property Value by Mortgage Status in Wheatland
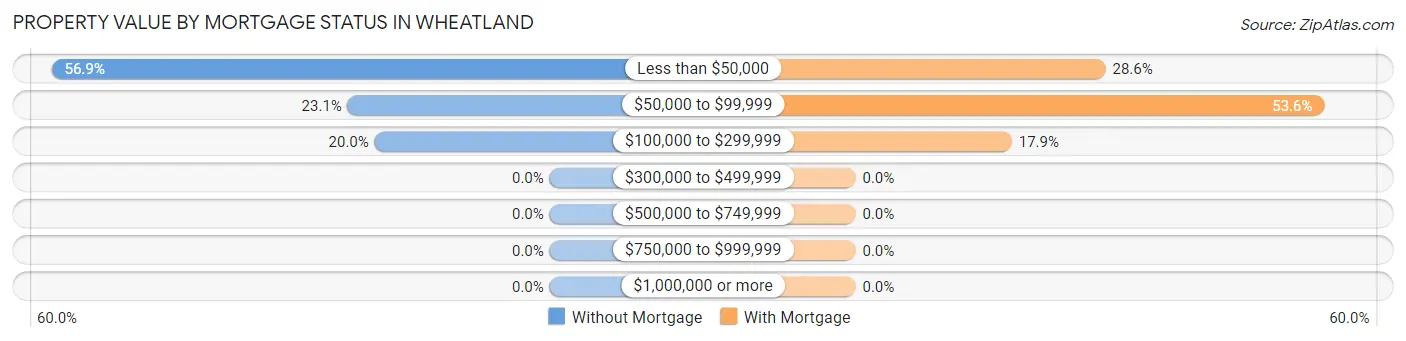
| Property Value | Without Mortgage | With Mortgage |
| Less than $50,000 | 37 (56.9%) | 16 (28.6%) |
| $50,000 to $99,999 | 15 (23.1%) | 30 (53.6%) |
| $100,000 to $299,999 | 13 (20.0%) | 10 (17.9%) |
| $300,000 to $499,999 | 0 (0.0%) | 0 (0.0%) |
| $500,000 to $749,999 | 0 (0.0%) | 0 (0.0%) |
| $750,000 to $999,999 | 0 (0.0%) | 0 (0.0%) |
| $1,000,000 or more | 0 (0.0%) | 0 (0.0%) |
| Total | 65 (100.0%) | 56 (100.0%) |
Household Income by Mortgage Status in Wheatland
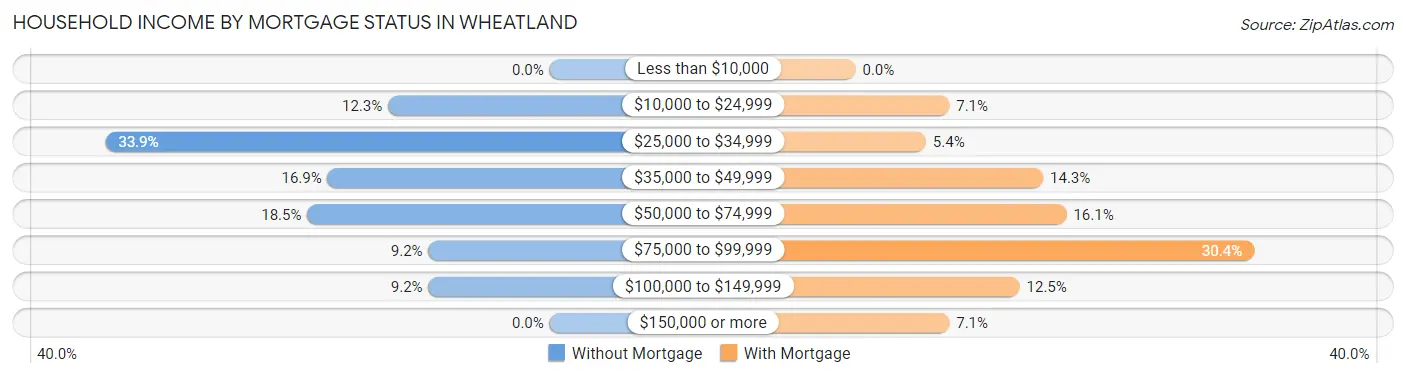
| Household Income | Without Mortgage | With Mortgage |
| Less than $10,000 | 0 (0.0%) | 0 (0.0%) |
| $10,000 to $24,999 | 8 (12.3%) | 4 (7.1%) |
| $25,000 to $34,999 | 22 (33.9%) | 3 (5.4%) |
| $35,000 to $49,999 | 11 (16.9%) | 8 (14.3%) |
| $50,000 to $74,999 | 12 (18.5%) | 9 (16.1%) |
| $75,000 to $99,999 | 6 (9.2%) | 17 (30.4%) |
| $100,000 to $149,999 | 6 (9.2%) | 7 (12.5%) |
| $150,000 or more | 0 (0.0%) | 4 (7.1%) |
| Total | 65 (100.0%) | 56 (100.0%) |
Property Value to Household Income Ratio in Wheatland
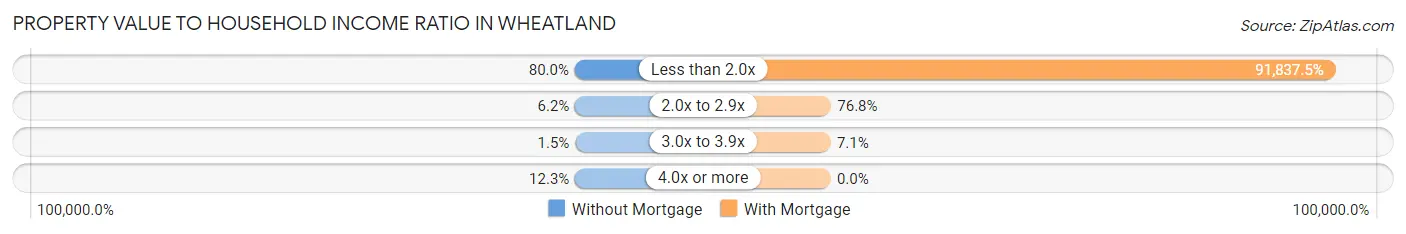
| Value-to-Income Ratio | Without Mortgage | With Mortgage |
| Less than 2.0x | 52 (80.0%) | 51,429 (91,837.5%) |
| 2.0x to 2.9x | 4 (6.1%) | 43 (76.8%) |
| 3.0x to 3.9x | 1 (1.5%) | 4 (7.1%) |
| 4.0x or more | 8 (12.3%) | 0 (0.0%) |
| Total | 65 (100.0%) | 56 (100.0%) |
Real Estate Taxes by Mortgage Status in Wheatland
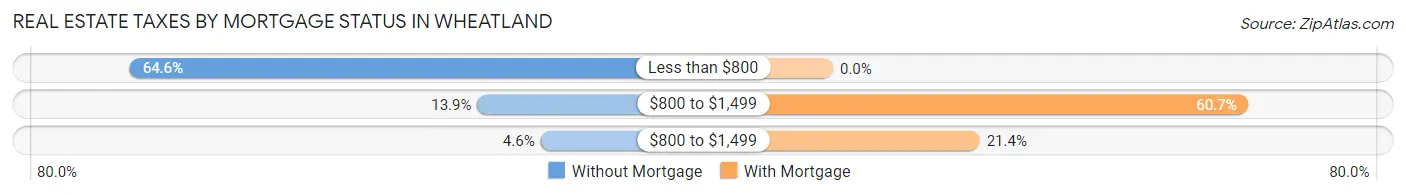
| Property Taxes | Without Mortgage | With Mortgage |
| Less than $800 | 42 (64.6%) | 0 (0.0%) |
| $800 to $1,499 | 9 (13.9%) | 34 (60.7%) |
| $800 to $1,499 | 3 (4.6%) | 12 (21.4%) |
| Total | 65 (100.0%) | 56 (100.0%) |
Health & Disability in Wheatland
Health Insurance Coverage by Age in Wheatland
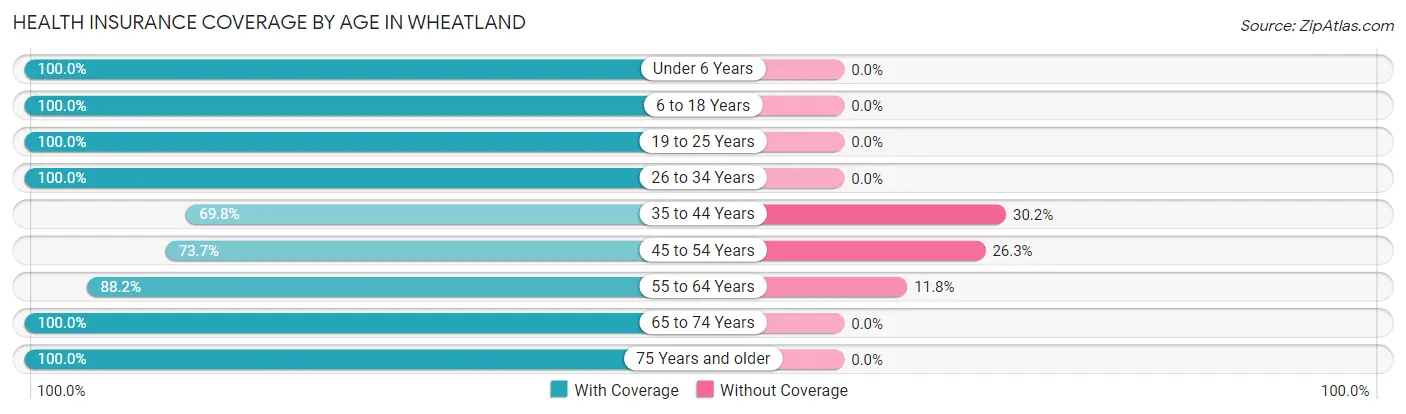
| Age Bracket | With Coverage | Without Coverage |
| Under 6 Years | 24 (100.0%) | 0 (0.0%) |
| 6 to 18 Years | 68 (100.0%) | 0 (0.0%) |
| 19 to 25 Years | 35 (100.0%) | 0 (0.0%) |
| 26 to 34 Years | 38 (100.0%) | 0 (0.0%) |
| 35 to 44 Years | 44 (69.8%) | 19 (30.2%) |
| 45 to 54 Years | 28 (73.7%) | 10 (26.3%) |
| 55 to 64 Years | 45 (88.2%) | 6 (11.8%) |
| 65 to 74 Years | 60 (100.0%) | 0 (0.0%) |
| 75 Years and older | 25 (100.0%) | 0 (0.0%) |
| Total | 367 (91.3%) | 35 (8.7%) |
Health Insurance Coverage by Citizenship Status in Wheatland
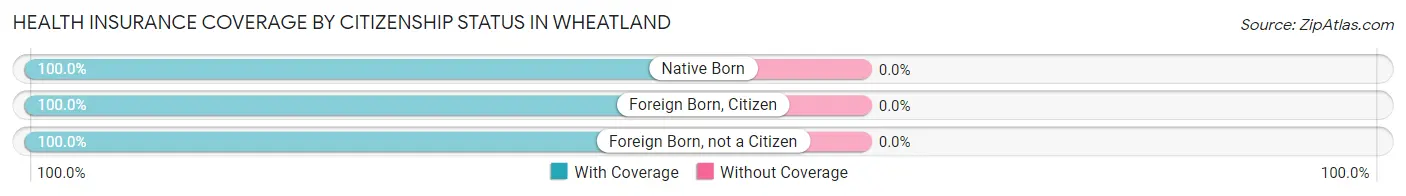
| Citizenship Status | With Coverage | Without Coverage |
| Native Born | 24 (100.0%) | 0 (0.0%) |
| Foreign Born, Citizen | 68 (100.0%) | 0 (0.0%) |
| Foreign Born, not a Citizen | 35 (100.0%) | 0 (0.0%) |
Health Insurance Coverage by Household Income in Wheatland
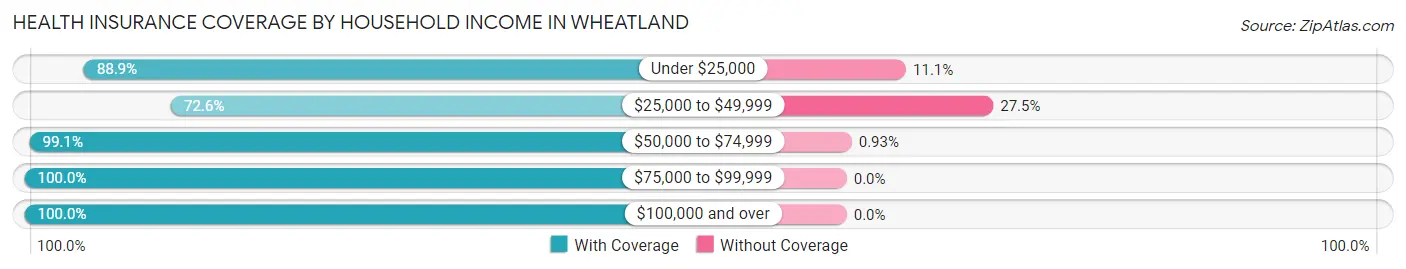
| Household Income | With Coverage | Without Coverage |
| Under $25,000 | 48 (88.9%) | 6 (11.1%) |
| $25,000 to $49,999 | 74 (72.6%) | 28 (27.5%) |
| $50,000 to $74,999 | 107 (99.1%) | 1 (0.9%) |
| $75,000 to $99,999 | 70 (100.0%) | 0 (0.0%) |
| $100,000 and over | 68 (100.0%) | 0 (0.0%) |
Public vs Private Health Insurance Coverage by Age in Wheatland
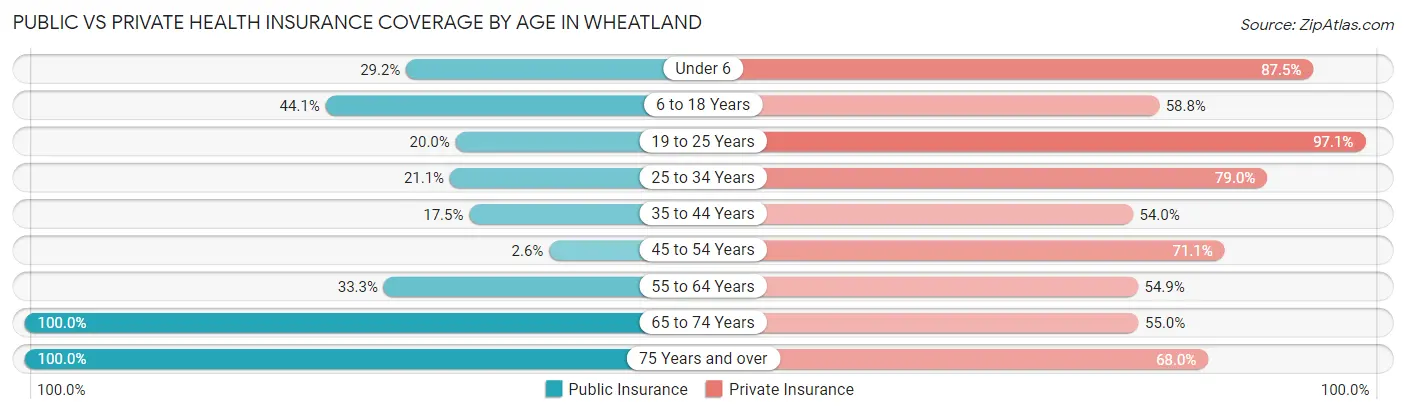
| Age Bracket | Public Insurance | Private Insurance |
| Under 6 | 7 (29.2%) | 21 (87.5%) |
| 6 to 18 Years | 30 (44.1%) | 40 (58.8%) |
| 19 to 25 Years | 7 (20.0%) | 34 (97.1%) |
| 25 to 34 Years | 8 (21.0%) | 30 (78.9%) |
| 35 to 44 Years | 11 (17.5%) | 34 (54.0%) |
| 45 to 54 Years | 1 (2.6%) | 27 (71.1%) |
| 55 to 64 Years | 17 (33.3%) | 28 (54.9%) |
| 65 to 74 Years | 60 (100.0%) | 33 (55.0%) |
| 75 Years and over | 25 (100.0%) | 17 (68.0%) |
| Total | 166 (41.3%) | 264 (65.7%) |
Disability Status by Sex by Age in Wheatland
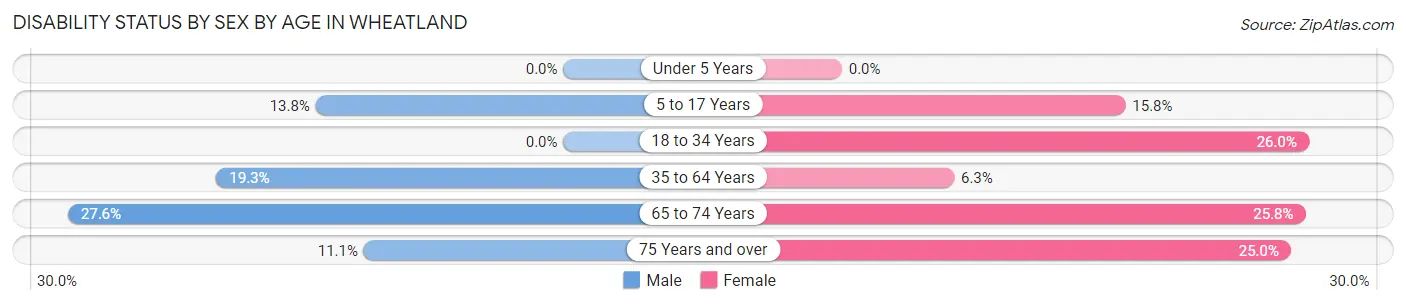
| Age Bracket | Male | Female |
| Under 5 Years | 0 (0.0%) | 0 (0.0%) |
| 5 to 17 Years | 4 (13.8%) | 6 (15.8%) |
| 18 to 34 Years | 0 (0.0%) | 13 (26.0%) |
| 35 to 64 Years | 17 (19.3%) | 4 (6.2%) |
| 65 to 74 Years | 8 (27.6%) | 8 (25.8%) |
| 75 Years and over | 1 (11.1%) | 4 (25.0%) |
Disability Class by Sex by Age in Wheatland
Disability Class: Hearing Difficulty
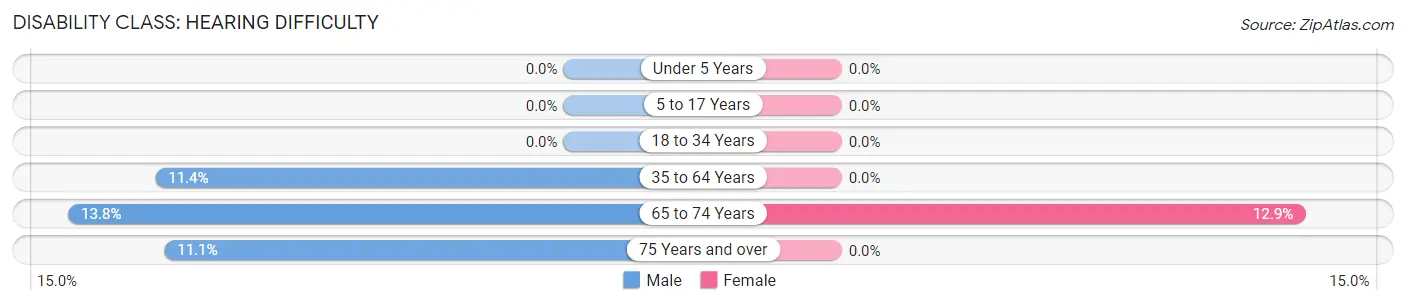
| Age Bracket | Male | Female |
| Under 5 Years | 0 (0.0%) | 0 (0.0%) |
| 5 to 17 Years | 0 (0.0%) | 0 (0.0%) |
| 18 to 34 Years | 0 (0.0%) | 0 (0.0%) |
| 35 to 64 Years | 10 (11.4%) | 0 (0.0%) |
| 65 to 74 Years | 4 (13.8%) | 4 (12.9%) |
| 75 Years and over | 1 (11.1%) | 0 (0.0%) |
Disability Class: Vision Difficulty
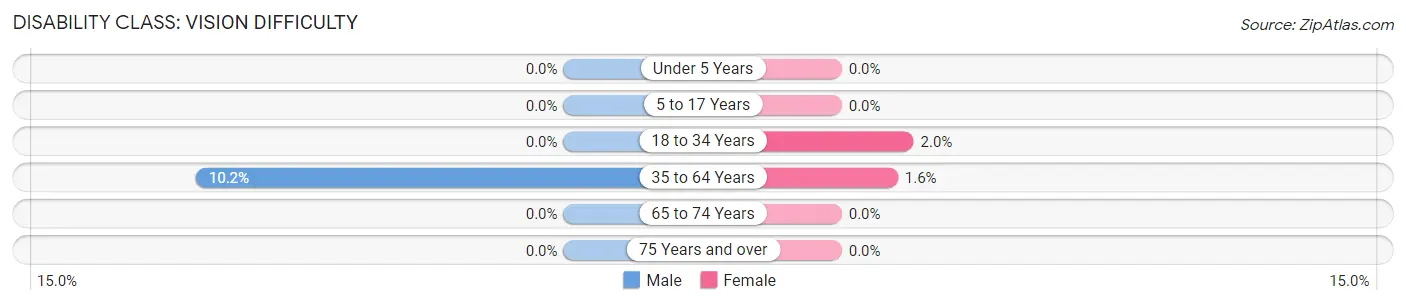
| Age Bracket | Male | Female |
| Under 5 Years | 0 (0.0%) | 0 (0.0%) |
| 5 to 17 Years | 0 (0.0%) | 0 (0.0%) |
| 18 to 34 Years | 0 (0.0%) | 1 (2.0%) |
| 35 to 64 Years | 9 (10.2%) | 1 (1.6%) |
| 65 to 74 Years | 0 (0.0%) | 0 (0.0%) |
| 75 Years and over | 0 (0.0%) | 0 (0.0%) |
Disability Class: Cognitive Difficulty
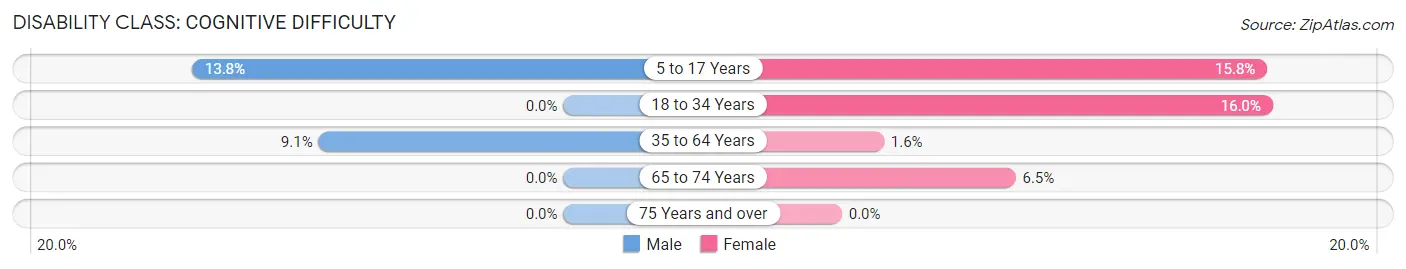
| Age Bracket | Male | Female |
| 5 to 17 Years | 4 (13.8%) | 6 (15.8%) |
| 18 to 34 Years | 0 (0.0%) | 8 (16.0%) |
| 35 to 64 Years | 8 (9.1%) | 1 (1.6%) |
| 65 to 74 Years | 0 (0.0%) | 2 (6.5%) |
| 75 Years and over | 0 (0.0%) | 0 (0.0%) |
Disability Class: Ambulatory Difficulty
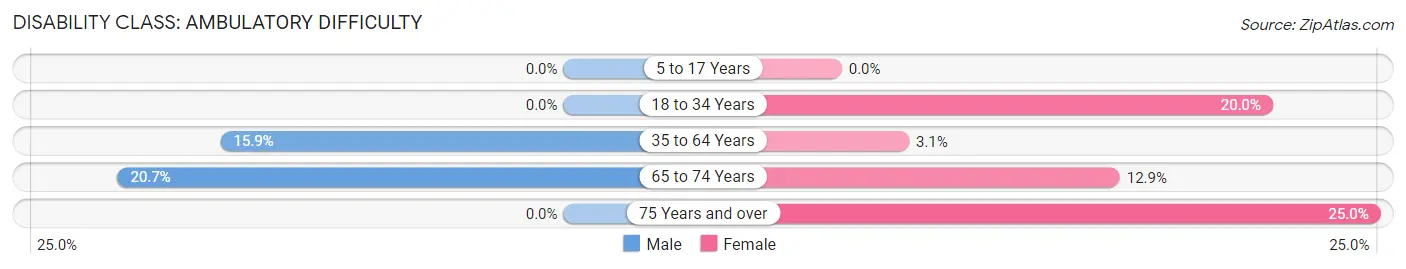
| Age Bracket | Male | Female |
| 5 to 17 Years | 0 (0.0%) | 0 (0.0%) |
| 18 to 34 Years | 0 (0.0%) | 10 (20.0%) |
| 35 to 64 Years | 14 (15.9%) | 2 (3.1%) |
| 65 to 74 Years | 6 (20.7%) | 4 (12.9%) |
| 75 Years and over | 0 (0.0%) | 4 (25.0%) |
Disability Class: Self-Care Difficulty
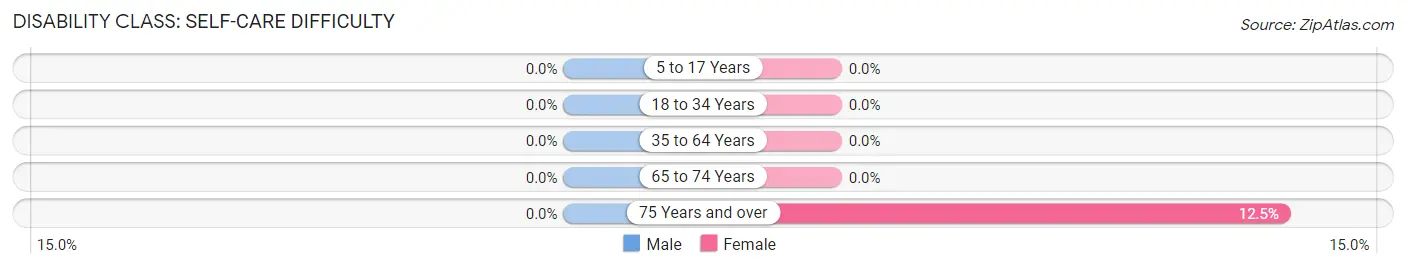
| Age Bracket | Male | Female |
| 5 to 17 Years | 0 (0.0%) | 0 (0.0%) |
| 18 to 34 Years | 0 (0.0%) | 0 (0.0%) |
| 35 to 64 Years | 0 (0.0%) | 0 (0.0%) |
| 65 to 74 Years | 0 (0.0%) | 0 (0.0%) |
| 75 Years and over | 0 (0.0%) | 2 (12.5%) |
Technology Access in Wheatland
Computing Device Access in Wheatland
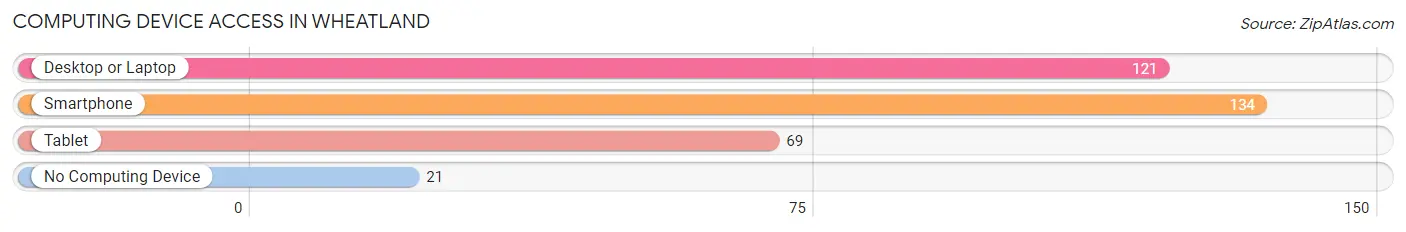
| Device Type | # Households | % Households |
| Desktop or Laptop | 121 | 68.4% |
| Smartphone | 134 | 75.7% |
| Tablet | 69 | 39.0% |
| No Computing Device | 21 | 11.9% |
| Total | 177 | 100.0% |
Internet Access in Wheatland
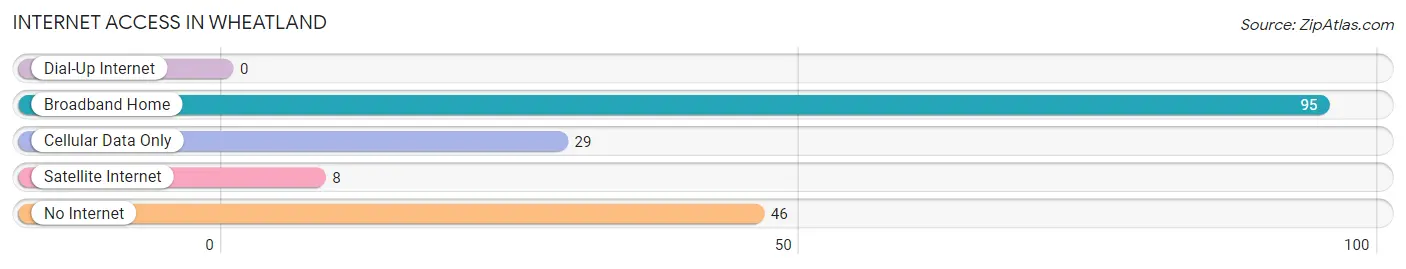
| Internet Type | # Households | % Households |
| Dial-Up Internet | 0 | 0.0% |
| Broadband Home | 95 | 53.7% |
| Cellular Data Only | 29 | 16.4% |
| Satellite Internet | 8 | 4.5% |
| No Internet | 46 | 26.0% |
| Total | 177 | 100.0% |
Wheatland Summary
Wheatland, Indiana is a small town located in the northwest corner of the state, in Jasper County. It is situated on the banks of the Kankakee River, and is surrounded by rolling hills and farmland. The town was founded in 1837, and has a population of just over 1,000 people.
Geography
Wheatland is located in the northwest corner of Indiana, in Jasper County. It is situated on the banks of the Kankakee River, and is surrounded by rolling hills and farmland. The town is located about 25 miles from the Illinois border, and is about an hour and a half drive from Chicago. The town is also close to the Indiana Dunes National Lakeshore, which is a popular tourist destination.
The town is located in a rural area, and is surrounded by small towns and villages. The nearest major city is Valparaiso, which is about 30 miles away. The town is also close to the Indiana Dunes State Park, which is a popular destination for outdoor recreation.
Economy
Wheatland is a small, rural town, and the economy is largely based on agriculture. The town is home to several farms, and the surrounding area is known for its production of corn, soybeans, and wheat. The town also has a few small businesses, including a grocery store, a hardware store, and a few restaurants.
The town is also home to a few manufacturing companies, including a plastics factory and a metal fabrication plant. The town is also home to a few small businesses, such as a bakery, a florist, and a few other retail stores.
Demographics
As of the 2010 census, the population of Wheatland was 1,072. The population is predominantly white, with a small percentage of African Americans and Hispanics. The median age of the population is 43.7 years, and the median household income is $45,000.
The town is home to a few churches, including the First Baptist Church, the United Methodist Church, and the Church of the Nazarene. The town also has a few schools, including a public elementary school and a private Christian school.
History
Wheatland was founded in 1837, and was originally known as “Wheatland Station”. The town was named after the abundance of wheat that was grown in the area. The town was originally a stop on the Michigan Central Railroad, and was a popular destination for travelers.
In the late 19th century, the town was home to a number of businesses, including a hotel, a general store, and a blacksmith shop. The town also had a post office, and a few churches.
In the early 20th century, the town began to decline, as the railroad stopped running through the town. The town was also affected by the Great Depression, and many of the businesses closed. The town was revitalized in the 1950s, when the Kankakee River was dammed, creating a lake. The lake became a popular destination for fishing and boating, and the town began to grow again.
Today, Wheatland is a small, rural town, and the economy is largely based on agriculture. The town is home to a few small businesses, and is a popular destination for outdoor recreation. The town is also home to a few churches, and a few schools.
Common Questions
What is Per Capita Income in Wheatland?
Per Capita income in Wheatland is $23,076.
What is the Median Family Income in Wheatland?
Median Family Income in Wheatland is $58,864.
What is the Median Household income in Wheatland?
Median Household Income in Wheatland is $49,063.
What is Income or Wage Gap in Wheatland?
Income or Wage Gap in Wheatland is 19.8%.
Women in Wheatland earn 80.2 cents for every dollar earned by a man.
What is Inequality or Gini Index in Wheatland?
Inequality or Gini Index in Wheatland is 0.37.
What is the Total Population of Wheatland?
Total Population of Wheatland is 402.
What is the Total Male Population of Wheatland?
Total Male Population of Wheatland is 195.
What is the Total Female Population of Wheatland?
Total Female Population of Wheatland is 207.
What is the Ratio of Males per 100 Females in Wheatland?
There are 94.20 Males per 100 Females in Wheatland.
What is the Ratio of Females per 100 Males in Wheatland?
There are 106.15 Females per 100 Males in Wheatland.
What is the Median Population Age in Wheatland?
Median Population Age in Wheatland is 39.5 Years.
What is the Average Family Size in Wheatland
Average Family Size in Wheatland is 2.8 People.
What is the Average Household Size in Wheatland
Average Household Size in Wheatland is 2.3 People.
How Large is the Labor Force in Wheatland?
There are 215 People in the Labor Forcein in Wheatland.
What is the Percentage of People in the Labor Force in Wheatland?
67.0% of People are in the Labor Force in Wheatland.
What is the Unemployment Rate in Wheatland?
Unemployment Rate in Wheatland is 1.4%.