Warsaw, IN Map & Demographics
Warsaw Map
Warsaw Overview
$29,741
PER CAPITA INCOME
$76,195
AVG FAMILY INCOME
$57,931
AVG HOUSEHOLD INCOME
43.6%
WAGE / INCOME GAP [ % ]
56.4¢/ $1
WAGE / INCOME GAP [ $ ]
$10,849
FAMILY INCOME DEFICIT
0.40
INEQUALITY / GINI INDEX
16,473
TOTAL POPULATION
8,122
MALE POPULATION
8,351
FEMALE POPULATION
97.26
MALES / 100 FEMALES
102.82
FEMALES / 100 MALES
33.1
MEDIAN AGE
3.0
AVG FAMILY SIZE
2.3
AVG HOUSEHOLD SIZE
8,761
LABOR FORCE [ PEOPLE ]
65.9%
PERCENT IN LABOR FORCE
3.2%
UNEMPLOYMENT RATE
Warsaw Area Codes
Income in Warsaw
Income Overview in Warsaw
Per Capita Income in Warsaw is $29,741, while median incomes of families and households are $76,195 and $57,931 respectively.
| Characteristic | Number | Measure |
| Per Capita Income | 16,473 | $29,741 |
| Median Family Income | 3,875 | $76,195 |
| Mean Family Income | 3,875 | $82,315 |
| Median Household Income | 6,967 | $57,931 |
| Mean Household Income | 6,967 | $68,613 |
| Income Deficit | 3,875 | $10,849 |
| Wage / Income Gap (%) | 16,473 | 43.60% |
| Wage / Income Gap ($) | 16,473 | 56.40¢ per $1 |
| Gini / Inequality Index | 16,473 | 0.40 |
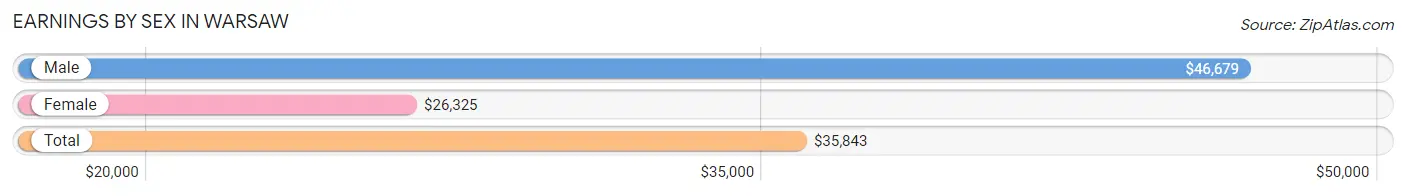
Earnings by Sex in Warsaw
Average Earnings in Warsaw are $35,843, $46,679 for men and $26,325 for women, a difference of 43.6%.
| Sex | Number | Average Earnings |
| Male | 5,042 (54.4%) | $46,679 |
| Female | 4,231 (45.6%) | $26,325 |
| Total | 9,273 (100.0%) | $35,843 |
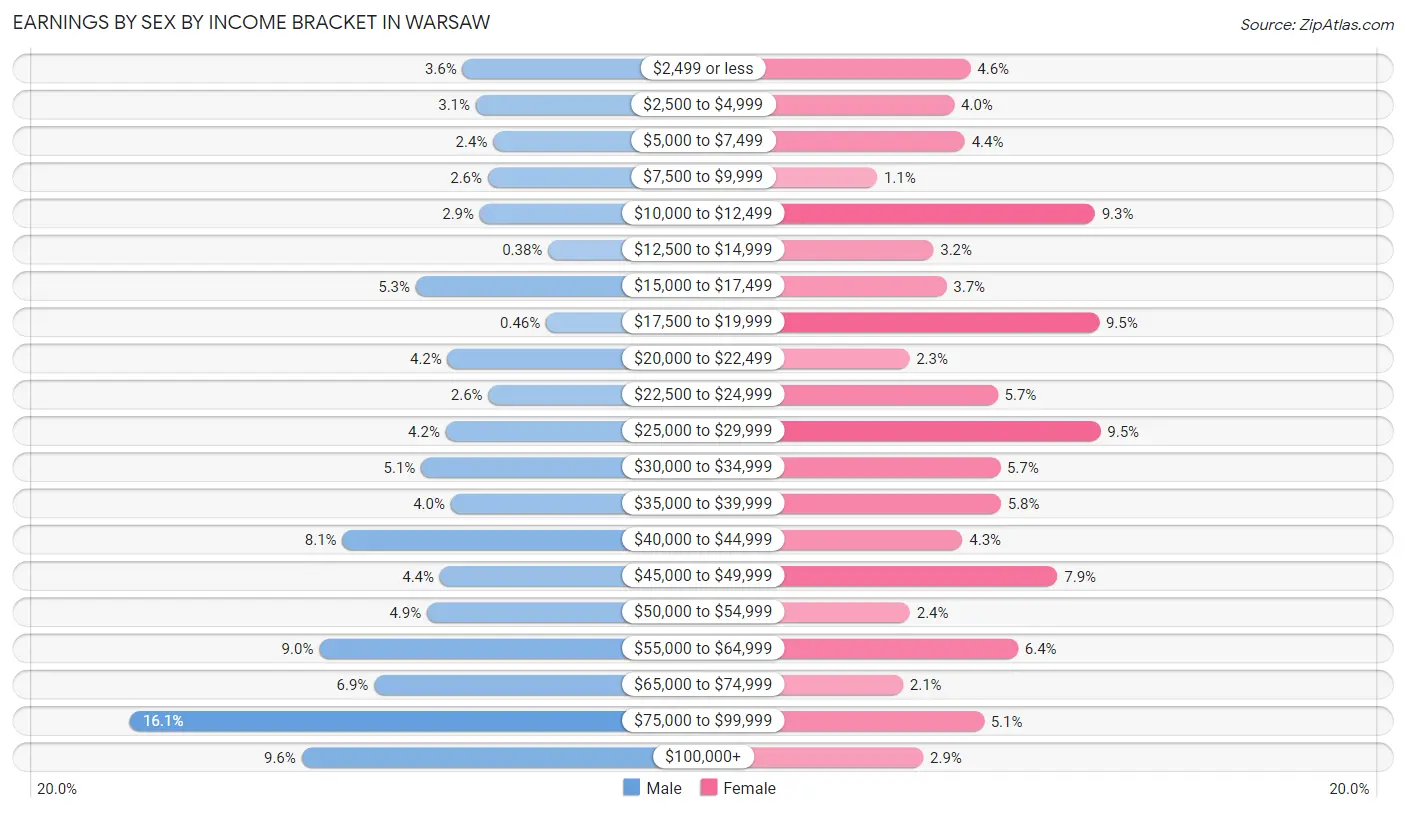
Earnings by Sex by Income Bracket in Warsaw
The most common earnings brackets in Warsaw are $75,000 to $99,999 for men (809 | 16.1%) and $25,000 to $29,999 for women (402 | 9.5%).
| Income | Male | Female |
| $2,499 or less | 181 (3.6%) | 196 (4.6%) |
| $2,500 to $4,999 | 156 (3.1%) | 170 (4.0%) |
| $5,000 to $7,499 | 123 (2.4%) | 187 (4.4%) |
| $7,500 to $9,999 | 133 (2.6%) | 48 (1.1%) |
| $10,000 to $12,499 | 148 (2.9%) | 393 (9.3%) |
| $12,500 to $14,999 | 19 (0.4%) | 137 (3.2%) |
| $15,000 to $17,499 | 269 (5.3%) | 158 (3.7%) |
| $17,500 to $19,999 | 23 (0.5%) | 400 (9.5%) |
| $20,000 to $22,499 | 209 (4.2%) | 99 (2.3%) |
| $22,500 to $24,999 | 132 (2.6%) | 239 (5.7%) |
| $25,000 to $29,999 | 213 (4.2%) | 402 (9.5%) |
| $30,000 to $34,999 | 259 (5.1%) | 243 (5.7%) |
| $35,000 to $39,999 | 203 (4.0%) | 244 (5.8%) |
| $40,000 to $44,999 | 408 (8.1%) | 183 (4.3%) |
| $45,000 to $49,999 | 224 (4.4%) | 334 (7.9%) |
| $50,000 to $54,999 | 248 (4.9%) | 100 (2.4%) |
| $55,000 to $64,999 | 452 (9.0%) | 271 (6.4%) |
| $65,000 to $74,999 | 348 (6.9%) | 89 (2.1%) |
| $75,000 to $99,999 | 809 (16.1%) | 217 (5.1%) |
| $100,000+ | 485 (9.6%) | 121 (2.9%) |
| Total | 5,042 (100.0%) | 4,231 (100.0%) |
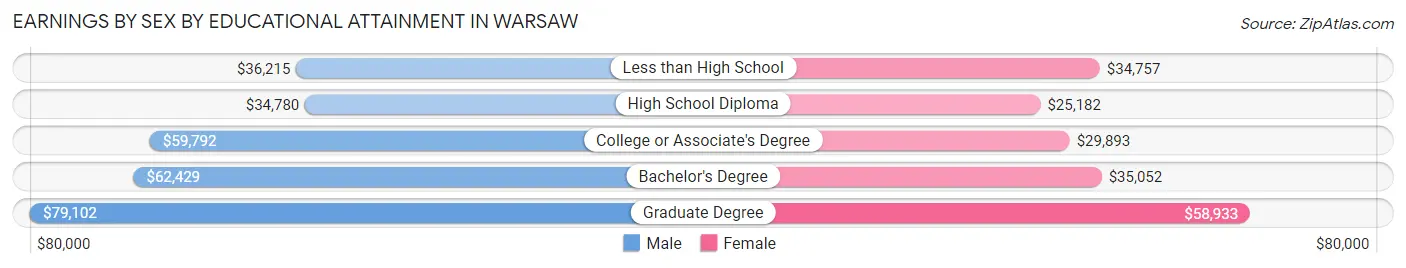
Earnings by Sex by Educational Attainment in Warsaw
Average earnings in Warsaw are $55,691 for men and $30,717 for women, a difference of 44.8%. Men with an educational attainment of graduate degree enjoy the highest average annual earnings of $79,102, while those with high school diploma education earn the least with $34,780. Women with an educational attainment of graduate degree earn the most with the average annual earnings of $58,933, while those with high school diploma education have the smallest earnings of $25,182.
| Educational Attainment | Male Income | Female Income |
| Less than High School | $36,215 | $34,757 |
| High School Diploma | $34,780 | $25,182 |
| College or Associate's Degree | $59,792 | $29,893 |
| Bachelor's Degree | $62,429 | $35,052 |
| Graduate Degree | $79,102 | $58,933 |
| Total | $55,691 | $30,717 |
Family Income in Warsaw
Family Income Brackets in Warsaw
According to the Warsaw family income data, there are 860 families falling into the $75,000 to $99,999 income range, which is the most common income bracket and makes up 22.2% of all families. Conversely, the less than $10,000 income bracket is the least frequent group with only 58 families (1.5%) belonging to this category.
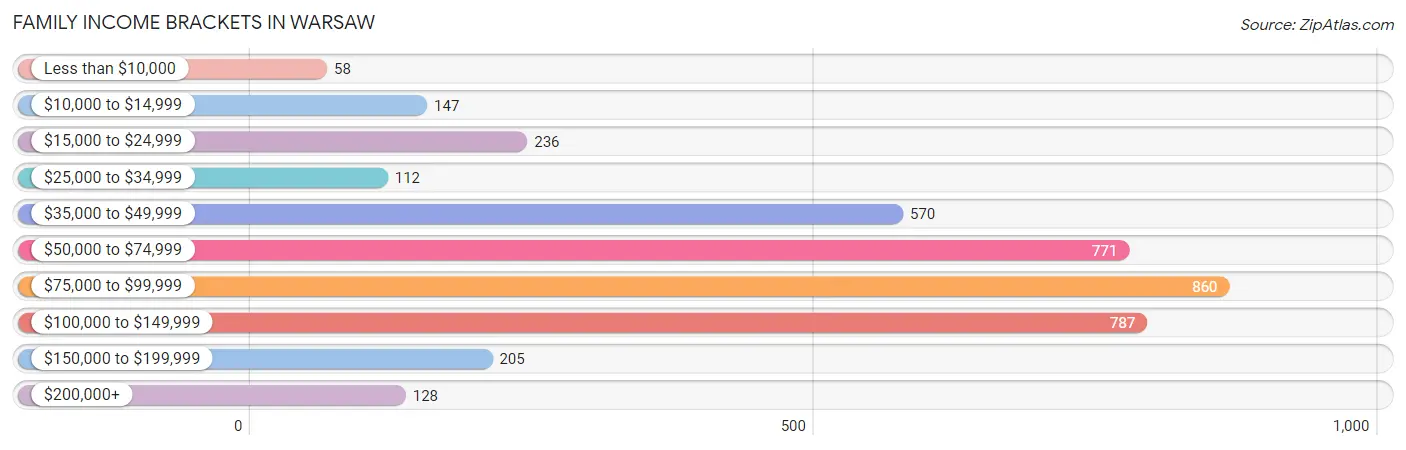
| Income Bracket | # Families | % Families |
| Less than $10,000 | 58 | 1.5% |
| $10,000 to $14,999 | 147 | 3.8% |
| $15,000 to $24,999 | 236 | 6.1% |
| $25,000 to $34,999 | 112 | 2.9% |
| $35,000 to $49,999 | 570 | 14.7% |
| $50,000 to $74,999 | 771 | 19.9% |
| $75,000 to $99,999 | 860 | 22.2% |
| $100,000 to $149,999 | 787 | 20.3% |
| $150,000 to $199,999 | 205 | 5.3% |
| $200,000+ | 128 | 3.3% |
Family Income by Famaliy Size in Warsaw
4-person families (590 | 15.2%) account for the highest median family income in Warsaw with $81,019 per family, while 2-person families (1,920 | 49.5%) have the highest median income of $35,533 per family member.
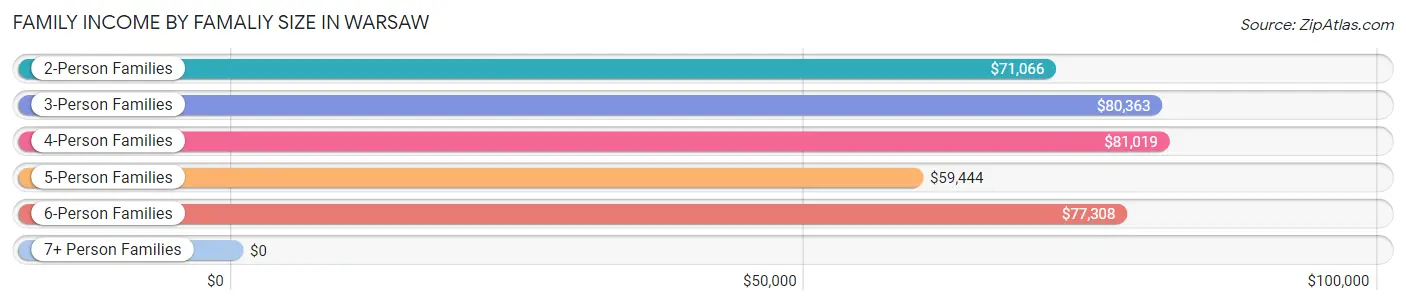
| Income Bracket | # Families | Median Income |
| 2-Person Families | 1,920 (49.5%) | $71,066 |
| 3-Person Families | 927 (23.9%) | $80,363 |
| 4-Person Families | 590 (15.2%) | $81,019 |
| 5-Person Families | 350 (9.0%) | $59,444 |
| 6-Person Families | 72 (1.9%) | $77,308 |
| 7+ Person Families | 16 (0.4%) | $0 |
| Total | 3,875 (100.0%) | $76,195 |
Family Income by Number of Earners in Warsaw
The median family income in Warsaw is $76,195, with families comprising 3+ earners (394) having the highest median family income of $92,750, while families with no earners (500) have the lowest median family income of $47,250, accounting for 10.2% and 12.9% of families, respectively.
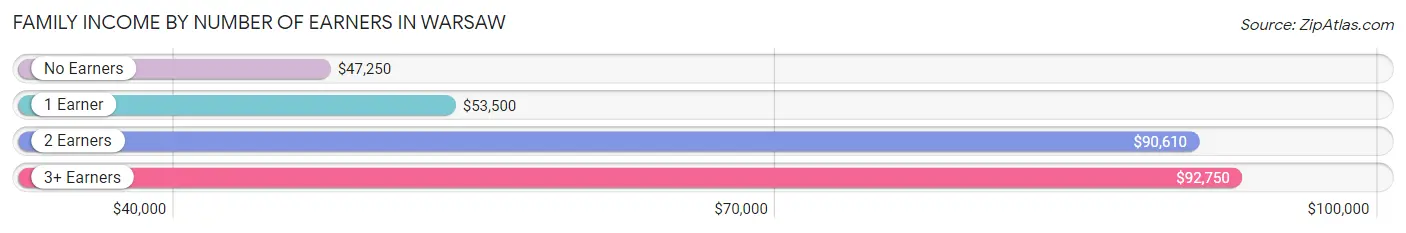
| Number of Earners | # Families | Median Income |
| No Earners | 500 (12.9%) | $47,250 |
| 1 Earner | 1,268 (32.7%) | $53,500 |
| 2 Earners | 1,713 (44.2%) | $90,610 |
| 3+ Earners | 394 (10.2%) | $92,750 |
| Total | 3,875 (100.0%) | $76,195 |
Household Income in Warsaw
Household Income Brackets in Warsaw
With 1,324 households falling in the category, the $75,000 to $99,999 income range is the most frequent in Warsaw, accounting for 19.0% of all households. In contrast, only 146 households (2.1%) fall into the $200,000+ income bracket, making it the least populous group.
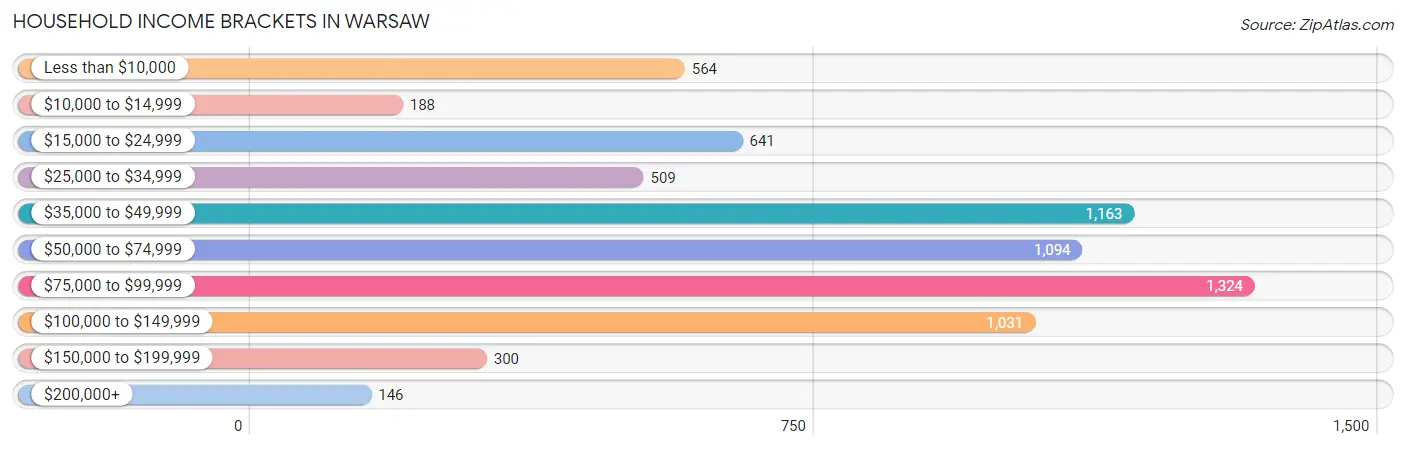
| Income Bracket | # Households | % Households |
| Less than $10,000 | 564 | 8.1% |
| $10,000 to $14,999 | 188 | 2.7% |
| $15,000 to $24,999 | 641 | 9.2% |
| $25,000 to $34,999 | 509 | 7.3% |
| $35,000 to $49,999 | 1,163 | 16.7% |
| $50,000 to $74,999 | 1,094 | 15.7% |
| $75,000 to $99,999 | 1,324 | 19.0% |
| $100,000 to $149,999 | 1,031 | 14.8% |
| $150,000 to $199,999 | 300 | 4.3% |
| $200,000+ | 146 | 2.1% |
Household Income by Householder Age in Warsaw
The median household income in Warsaw is $57,931, with the highest median household income of $75,833 found in the 25 to 44 years age bracket for the primary householder. A total of 2,732 households (39.2%) fall into this category. Meanwhile, the 15 to 24 years age bracket for the primary householder has the lowest median household income of $36,434, with 779 households (11.2%) in this group.
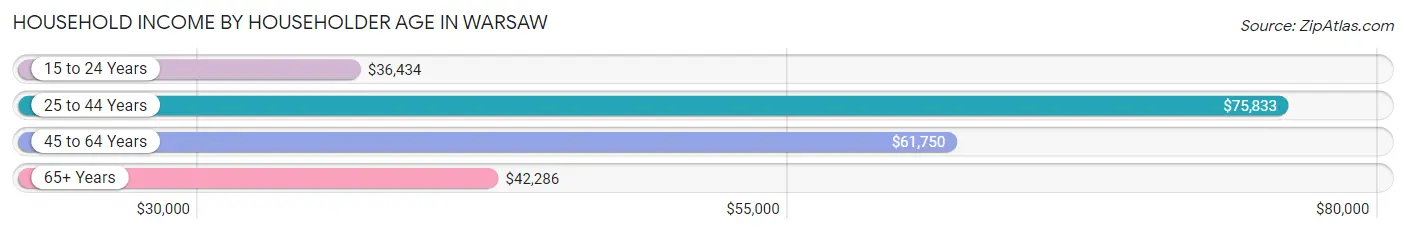
| Income Bracket | # Households | Median Income |
| 15 to 24 Years | 779 (11.2%) | $36,434 |
| 25 to 44 Years | 2,732 (39.2%) | $75,833 |
| 45 to 64 Years | 1,981 (28.4%) | $61,750 |
| 65+ Years | 1,475 (21.2%) | $42,286 |
| Total | 6,967 (100.0%) | $57,931 |
Poverty in Warsaw
Income Below Poverty by Sex and Age in Warsaw
With 9.9% poverty level for males and 19.0% for females among the residents of Warsaw, 15 year old males and 55 to 64 year old females are the most vulnerable to poverty, with 15 males (25.4%) and 350 females (30.4%) in their respective age groups living below the poverty level.
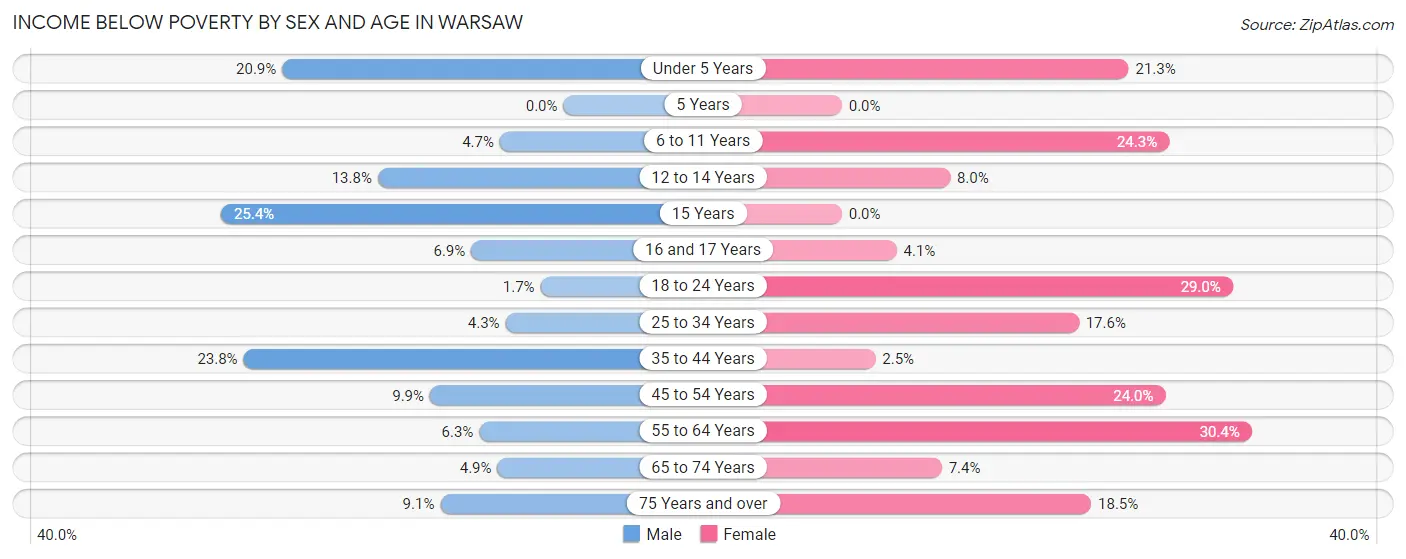
| Age Bracket | Male | Female |
| Under 5 Years | 114 (20.9%) | 139 (21.3%) |
| 5 Years | 0 (0.0%) | 0 (0.0%) |
| 6 to 11 Years | 24 (4.7%) | 155 (24.3%) |
| 12 to 14 Years | 55 (13.8%) | 11 (8.0%) |
| 15 Years | 15 (25.4%) | 0 (0.0%) |
| 16 and 17 Years | 15 (6.9%) | 18 (4.1%) |
| 18 to 24 Years | 17 (1.7%) | 247 (29.0%) |
| 25 to 34 Years | 55 (4.3%) | 244 (17.6%) |
| 35 to 44 Years | 318 (23.7%) | 18 (2.5%) |
| 45 to 54 Years | 54 (9.9%) | 227 (24.0%) |
| 55 to 64 Years | 52 (6.2%) | 350 (30.4%) |
| 65 to 74 Years | 42 (4.9%) | 44 (7.4%) |
| 75 Years and over | 17 (9.1%) | 97 (18.5%) |
| Total | 778 (9.9%) | 1,550 (19.0%) |
Income Above Poverty by Sex and Age in Warsaw
According to the poverty statistics in Warsaw, males aged 5 years and females aged 5 years are the age groups that are most secure financially, with 100.0% of males and 100.0% of females in these age groups living above the poverty line.
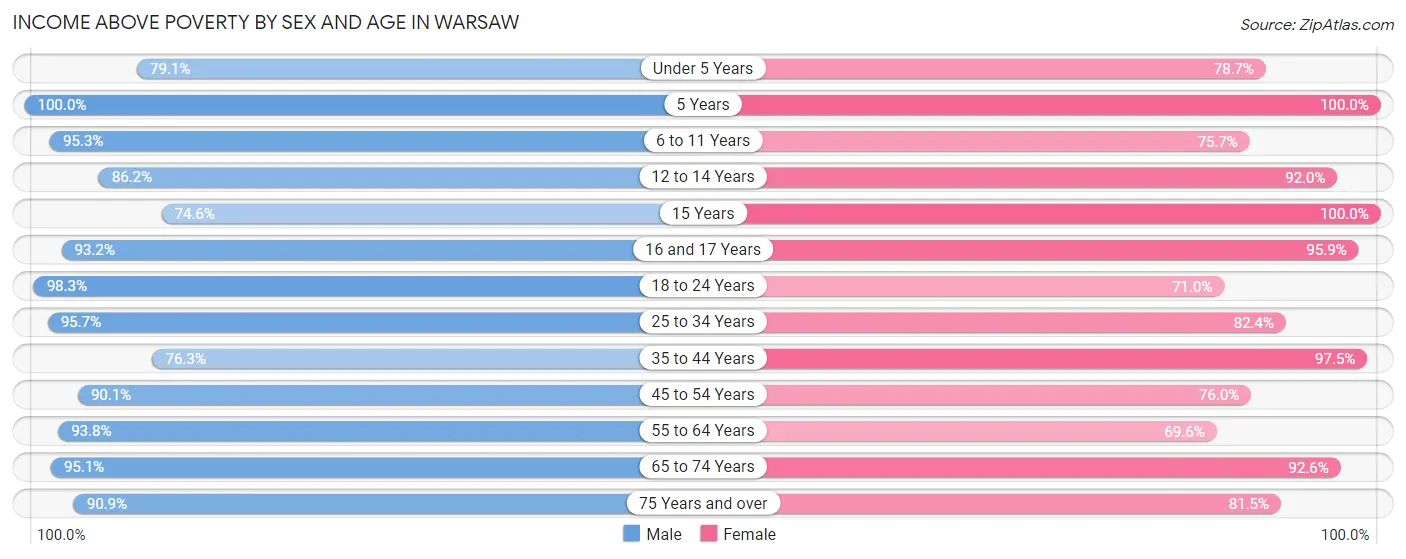
| Age Bracket | Male | Female |
| Under 5 Years | 432 (79.1%) | 514 (78.7%) |
| 5 Years | 82 (100.0%) | 86 (100.0%) |
| 6 to 11 Years | 485 (95.3%) | 483 (75.7%) |
| 12 to 14 Years | 344 (86.2%) | 126 (92.0%) |
| 15 Years | 44 (74.6%) | 51 (100.0%) |
| 16 and 17 Years | 204 (93.1%) | 424 (95.9%) |
| 18 to 24 Years | 983 (98.3%) | 604 (71.0%) |
| 25 to 34 Years | 1,225 (95.7%) | 1,143 (82.4%) |
| 35 to 44 Years | 1,021 (76.2%) | 704 (97.5%) |
| 45 to 54 Years | 491 (90.1%) | 718 (76.0%) |
| 55 to 64 Years | 780 (93.8%) | 800 (69.6%) |
| 65 to 74 Years | 816 (95.1%) | 549 (92.6%) |
| 75 Years and over | 169 (90.9%) | 427 (81.5%) |
| Total | 7,076 (90.1%) | 6,629 (81.0%) |
Income Below Poverty Among Married-Couple Families in Warsaw
The poverty statistics for married-couple families in Warsaw show that 5.8% or 150 of the total 2,588 families live below the poverty line. Families with 3 or 4 children have the highest poverty rate of 22.6%, comprising of 83 families. On the other hand, families with 5 or more children have the lowest poverty rate of 0.0%, which includes 0 families.
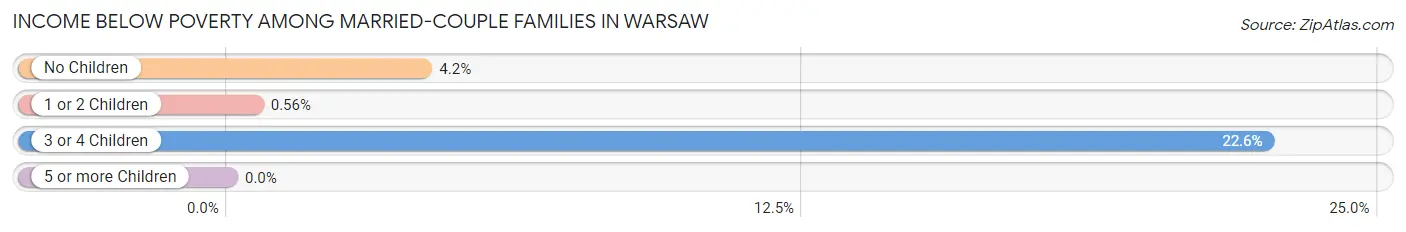
| Children | Above Poverty | Below Poverty |
| No Children | 1,426 (95.8%) | 63 (4.2%) |
| 1 or 2 Children | 711 (99.4%) | 4 (0.6%) |
| 3 or 4 Children | 285 (77.4%) | 83 (22.6%) |
| 5 or more Children | 16 (100.0%) | 0 (0.0%) |
| Total | 2,438 (94.2%) | 150 (5.8%) |
Income Below Poverty Among Single-Parent Households in Warsaw

| Children | Single Father | Single Mother |
| No Children | 0 (0.0%) | 15 (9.0%) |
| 1 or 2 Children | 0 (0.0%) | 152 (23.8%) |
| 3 or 4 Children | 0 (0.0%) | 39 (41.0%) |
| 5 or more Children | 0 (0.0%) | 0 (0.0%) |
| Total | 0 (0.0%) | 206 (22.9%) |
Income Below Poverty Among Married-Couple vs Single-Parent Households in Warsaw
The poverty data for Warsaw shows that 150 of the married-couple family households (5.8%) and 206 of the single-parent households (16.0%) are living below the poverty level. Within the married-couple family households, those with 3 or 4 children have the highest poverty rate, with 83 households (22.6%) falling below the poverty line. Among the single-parent households, those with 3 or 4 children have the highest poverty rate, with 39 household (34.8%) living below poverty.
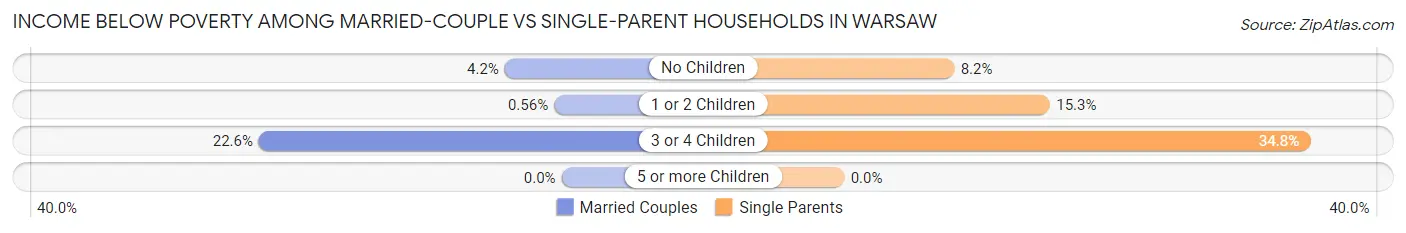
| Children | Married-Couple Families | Single-Parent Households |
| No Children | 63 (4.2%) | 15 (8.2%) |
| 1 or 2 Children | 4 (0.6%) | 152 (15.3%) |
| 3 or 4 Children | 83 (22.6%) | 39 (34.8%) |
| 5 or more Children | 0 (0.0%) | 0 (0.0%) |
| Total | 150 (5.8%) | 206 (16.0%) |
Race in Warsaw
The most populous races in Warsaw are White / Caucasian (13,298 | 80.7%), Hispanic or Latino (1,990 | 12.1%), and Two or more Races (1,383 | 8.4%).
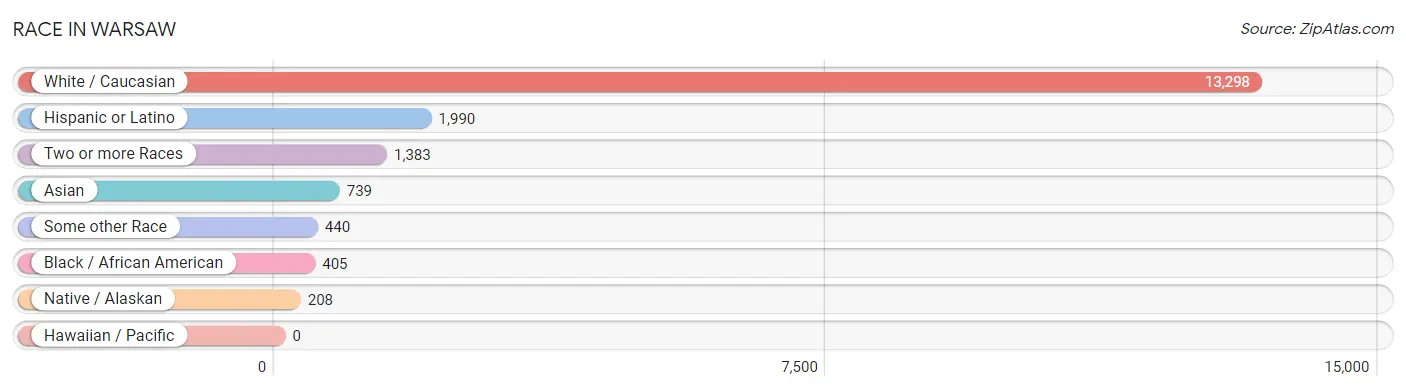
| Race | # Population | % Population |
| Asian | 739 | 4.5% |
| Black / African American | 405 | 2.5% |
| Hawaiian / Pacific | 0 | 0.0% |
| Hispanic or Latino | 1,990 | 12.1% |
| Native / Alaskan | 208 | 1.3% |
| White / Caucasian | 13,298 | 80.7% |
| Two or more Races | 1,383 | 8.4% |
| Some other Race | 440 | 2.7% |
| Total | 16,473 | 100.0% |
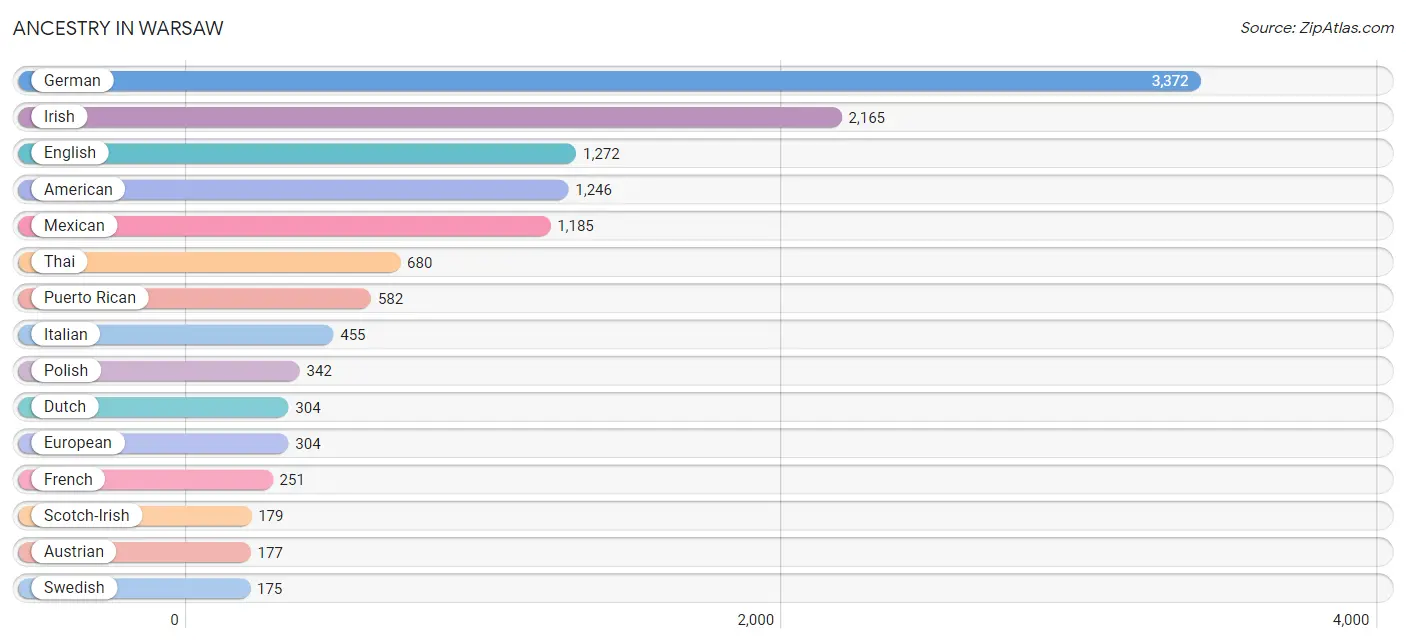
Ancestry in Warsaw
The most populous ancestries reported in Warsaw are German (3,372 | 20.5%), Irish (2,165 | 13.1%), English (1,272 | 7.7%), American (1,246 | 7.6%), and Mexican (1,185 | 7.2%), together accounting for 56.1% of all Warsaw residents.
| Ancestry | # Population | % Population |
| African | 18 | 0.1% |
| American | 1,246 | 7.6% |
| Apache | 19 | 0.1% |
| Arab | 11 | 0.1% |
| Australian | 72 | 0.4% |
| Austrian | 177 | 1.1% |
| Belgian | 22 | 0.1% |
| Bhutanese | 31 | 0.2% |
| Blackfeet | 3 | 0.0% |
| British | 151 | 0.9% |
| Burmese | 30 | 0.2% |
| Canadian | 27 | 0.2% |
| Central American | 52 | 0.3% |
| Cherokee | 17 | 0.1% |
| Chippewa | 5 | 0.0% |
| Choctaw | 17 | 0.1% |
| Colombian | 32 | 0.2% |
| Croatian | 37 | 0.2% |
| Czech | 108 | 0.7% |
| Danish | 15 | 0.1% |
| Dutch | 304 | 1.8% |
| Eastern European | 21 | 0.1% |
| English | 1,272 | 7.7% |
| Ethiopian | 37 | 0.2% |
| European | 304 | 1.8% |
| Filipino | 20 | 0.1% |
| Finnish | 28 | 0.2% |
| French | 251 | 1.5% |
| French Canadian | 30 | 0.2% |
| German | 3,372 | 20.5% |
| Guatemalan | 52 | 0.3% |
| Hungarian | 15 | 0.1% |
| Indian (Asian) | 42 | 0.3% |
| Irish | 2,165 | 13.1% |
| Italian | 455 | 2.8% |
| Jamaican | 80 | 0.5% |
| Korean | 6 | 0.0% |
| Latvian | 87 | 0.5% |
| Lebanese | 11 | 0.1% |
| Mexican | 1,185 | 7.2% |
| Native Hawaiian | 6 | 0.0% |
| Northern European | 18 | 0.1% |
| Norwegian | 53 | 0.3% |
| Pennsylvania German | 130 | 0.8% |
| Peruvian | 138 | 0.8% |
| Polish | 342 | 2.1% |
| Portuguese | 53 | 0.3% |
| Puerto Rican | 582 | 3.5% |
| Romanian | 48 | 0.3% |
| Scandinavian | 21 | 0.1% |
| Scotch-Irish | 179 | 1.1% |
| Scottish | 72 | 0.4% |
| Slavic | 14 | 0.1% |
| Slovak | 31 | 0.2% |
| South African | 5 | 0.0% |
| South American | 170 | 1.0% |
| Subsaharan African | 81 | 0.5% |
| Swedish | 175 | 1.1% |
| Swiss | 43 | 0.3% |
| Thai | 680 | 4.1% |
| Ukrainian | 19 | 0.1% |
| Welsh | 59 | 0.4% | View All 62 Rows |
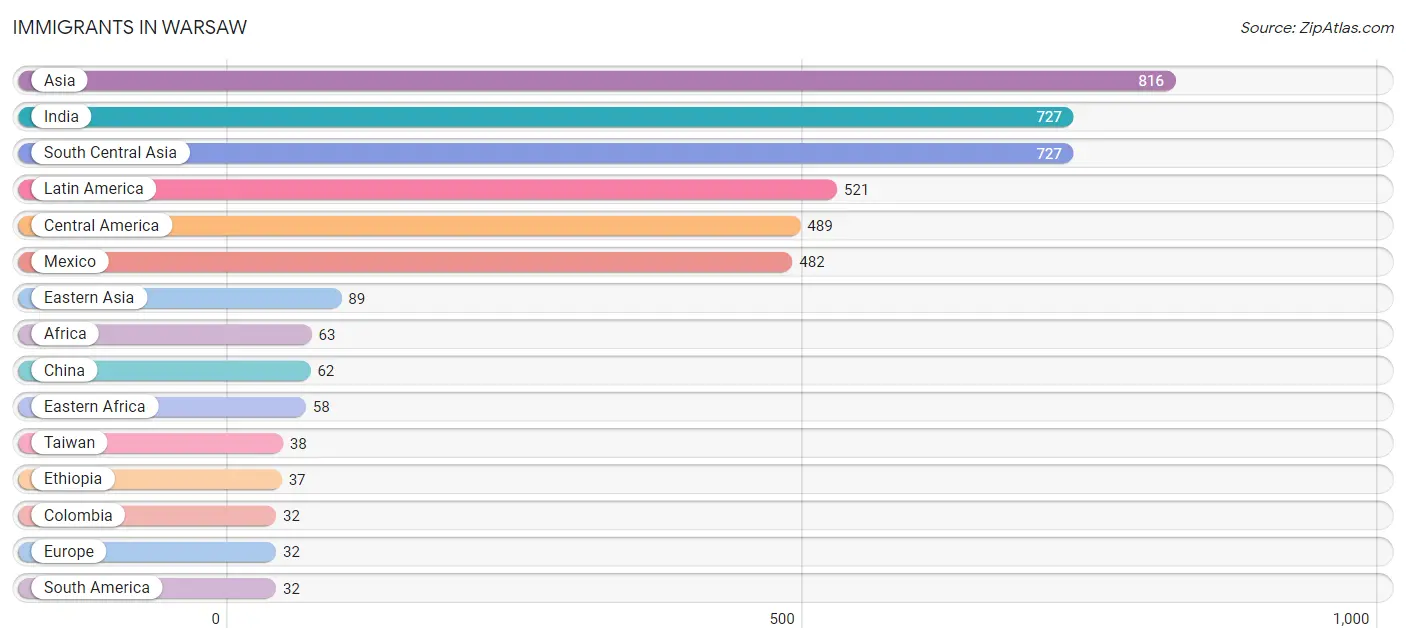
Immigrants in Warsaw
The most numerous immigrant groups reported in Warsaw came from Asia (816 | 5.0%), India (727 | 4.4%), South Central Asia (727 | 4.4%), Latin America (521 | 3.2%), and Central America (489 | 3.0%), together accounting for 19.9% of all Warsaw residents.
| Immigration Origin | # Population | % Population |
| Africa | 63 | 0.4% |
| Asia | 816 | 5.0% |
| Australia | 29 | 0.2% |
| Azores | 19 | 0.1% |
| Canada | 16 | 0.1% |
| Central America | 489 | 3.0% |
| China | 62 | 0.4% |
| Colombia | 32 | 0.2% |
| Eastern Africa | 58 | 0.4% |
| Eastern Asia | 89 | 0.5% |
| Ethiopia | 37 | 0.2% |
| Europe | 32 | 0.2% |
| Guatemala | 7 | 0.0% |
| India | 727 | 4.4% |
| Italy | 13 | 0.1% |
| Japan | 10 | 0.1% |
| Korea | 17 | 0.1% |
| Latin America | 521 | 3.2% |
| Mexico | 482 | 2.9% |
| Oceania | 29 | 0.2% |
| Portugal | 19 | 0.1% |
| South Africa | 5 | 0.0% |
| South America | 32 | 0.2% |
| South Central Asia | 727 | 4.4% |
| Southern Europe | 32 | 0.2% |
| Taiwan | 38 | 0.2% | View All 26 Rows |
Sex and Age in Warsaw
Sex and Age in Warsaw
The most populous age groups in Warsaw are 25 to 29 Years (824 | 10.2%) for men and 60 to 64 Years (799 | 9.6%) for women.
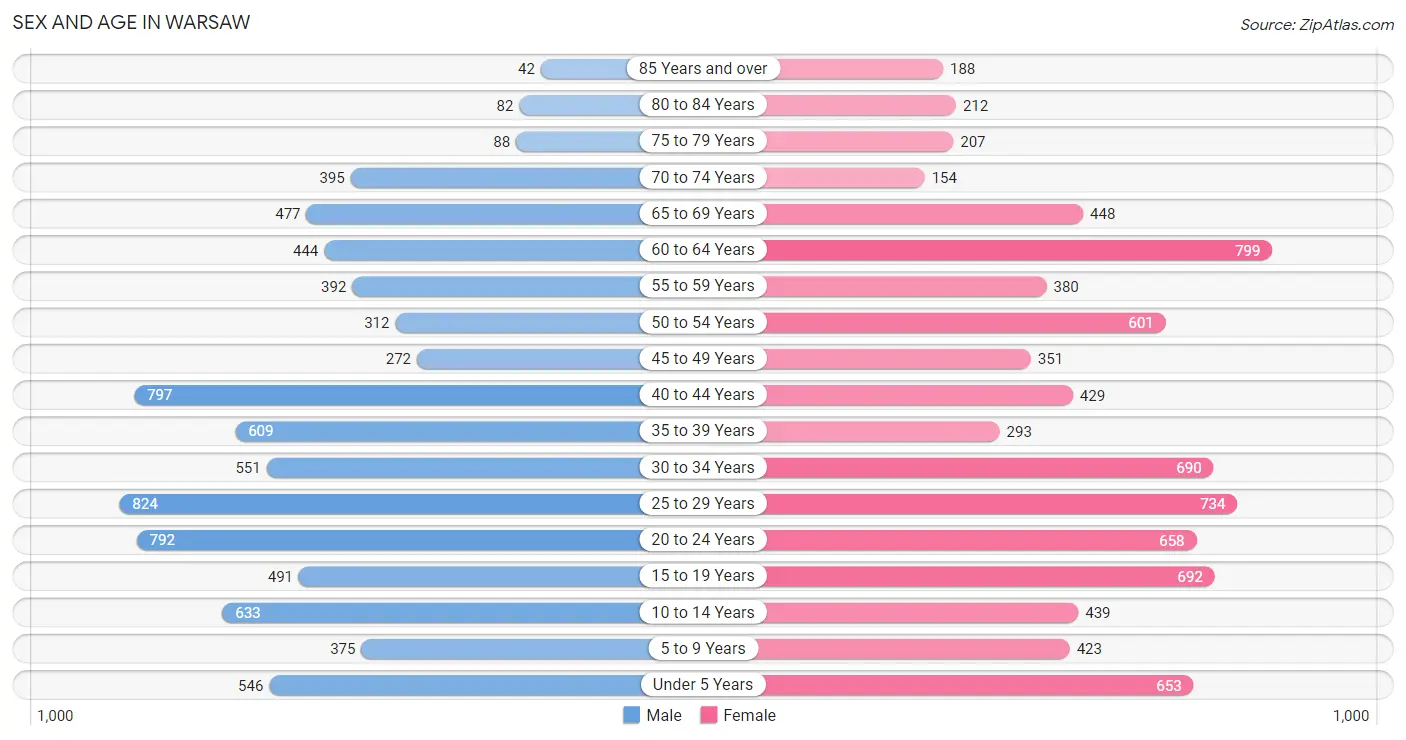
| Age Bracket | Male | Female |
| Under 5 Years | 546 (6.7%) | 653 (7.8%) |
| 5 to 9 Years | 375 (4.6%) | 423 (5.1%) |
| 10 to 14 Years | 633 (7.8%) | 439 (5.3%) |
| 15 to 19 Years | 491 (6.0%) | 692 (8.3%) |
| 20 to 24 Years | 792 (9.8%) | 658 (7.9%) |
| 25 to 29 Years | 824 (10.2%) | 734 (8.8%) |
| 30 to 34 Years | 551 (6.8%) | 690 (8.3%) |
| 35 to 39 Years | 609 (7.5%) | 293 (3.5%) |
| 40 to 44 Years | 797 (9.8%) | 429 (5.1%) |
| 45 to 49 Years | 272 (3.4%) | 351 (4.2%) |
| 50 to 54 Years | 312 (3.8%) | 601 (7.2%) |
| 55 to 59 Years | 392 (4.8%) | 380 (4.5%) |
| 60 to 64 Years | 444 (5.5%) | 799 (9.6%) |
| 65 to 69 Years | 477 (5.9%) | 448 (5.4%) |
| 70 to 74 Years | 395 (4.9%) | 154 (1.8%) |
| 75 to 79 Years | 88 (1.1%) | 207 (2.5%) |
| 80 to 84 Years | 82 (1.0%) | 212 (2.5%) |
| 85 Years and over | 42 (0.5%) | 188 (2.2%) |
| Total | 8,122 (100.0%) | 8,351 (100.0%) |
Families and Households in Warsaw
Median Family Size in Warsaw
The median family size in Warsaw is 2.97 persons per family, with single male/father families (388 | 10.0%) accounting for the largest median family size of 3.36 persons per family. On the other hand, single female/mother families (899 | 23.2%) represent the smallest median family size with 2.70 persons per family.
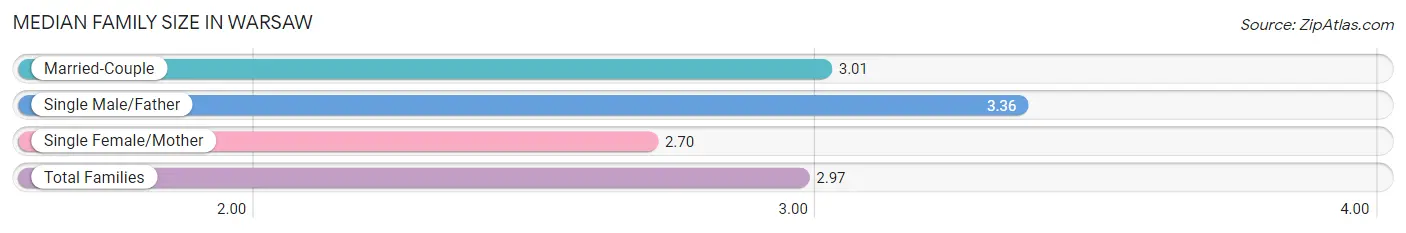
| Family Type | # Families | Family Size |
| Married-Couple | 2,588 (66.8%) | 3.01 |
| Single Male/Father | 388 (10.0%) | 3.36 |
| Single Female/Mother | 899 (23.2%) | 2.70 |
| Total Families | 3,875 (100.0%) | 2.97 |
Median Household Size in Warsaw
The median household size in Warsaw is 2.29 persons per household, with single male/father households (388 | 5.6%) accounting for the largest median household size of 4.25 persons per household. non-family households (3,092 | 44.4%) represent the smallest median household size with 1.25 persons per household.
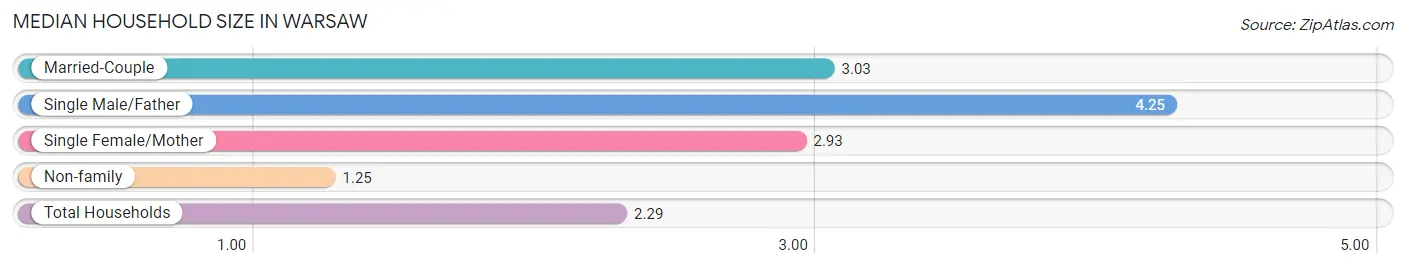
| Household Type | # Households | Household Size |
| Married-Couple | 2,588 (37.1%) | 3.03 |
| Single Male/Father | 388 (5.6%) | 4.25 |
| Single Female/Mother | 899 (12.9%) | 2.93 |
| Non-family | 3,092 (44.4%) | 1.25 |
| Total Households | 6,967 (100.0%) | 2.29 |
Household Size by Marriage Status in Warsaw
Out of a total of 6,967 households in Warsaw, 3,875 (55.6%) are family households, while 3,092 (44.4%) are nonfamily households. The most numerous type of family households are 2-person households, comprising 1,642, and the most common type of nonfamily households are 1-person households, comprising 2,358.
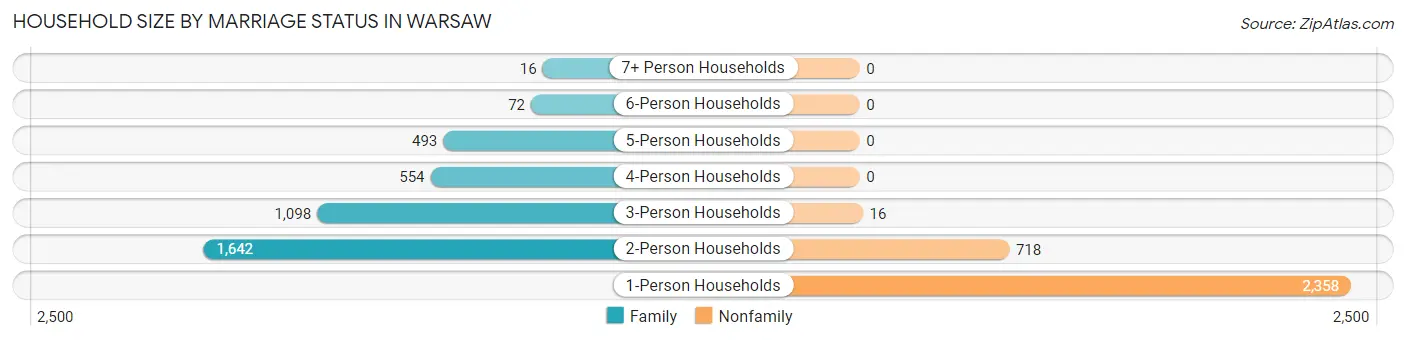
| Household Size | Family Households | Nonfamily Households |
| 1-Person Households | - | 2,358 (33.9%) |
| 2-Person Households | 1,642 (23.6%) | 718 (10.3%) |
| 3-Person Households | 1,098 (15.8%) | 16 (0.2%) |
| 4-Person Households | 554 (8.0%) | 0 (0.0%) |
| 5-Person Households | 493 (7.1%) | 0 (0.0%) |
| 6-Person Households | 72 (1.0%) | 0 (0.0%) |
| 7+ Person Households | 16 (0.2%) | 0 (0.0%) |
| Total | 3,875 (55.6%) | 3,092 (44.4%) |
Female Fertility in Warsaw
Fertility by Age in Warsaw
Average fertility rate in Warsaw is 53.0 births per 1,000 women. Women in the age bracket of 20 to 34 years have the highest fertility rate with 99.0 births per 1,000 women. Women in the age bracket of 20 to 34 years acount for 100.0% of all women with births.
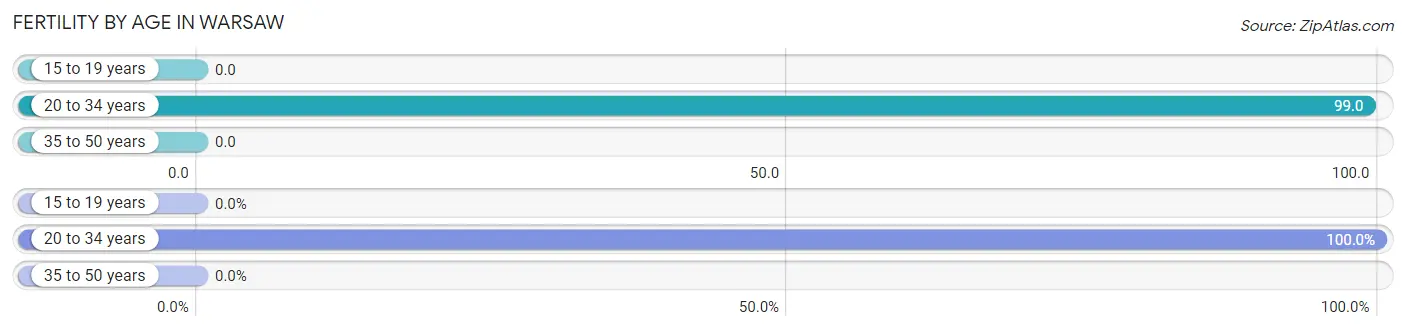
| Age Bracket | Women with Births | Births / 1,000 Women |
| 15 to 19 years | 0 (0.0%) | 0.0 |
| 20 to 34 years | 207 (100.0%) | 99.0 |
| 35 to 50 years | 0 (0.0%) | 0.0 |
| Total | 207 (100.0%) | 53.0 |
Fertility by Age by Marriage Status in Warsaw
90.8% of women with births (207) in Warsaw are married. The highest percentage of unmarried women with births falls into 20 to 34 years age bracket with 9.2% of them unmarried at the time of birth, while the lowest percentage of unmarried women with births belong to 20 to 34 years age bracket with 9.2% of them unmarried.
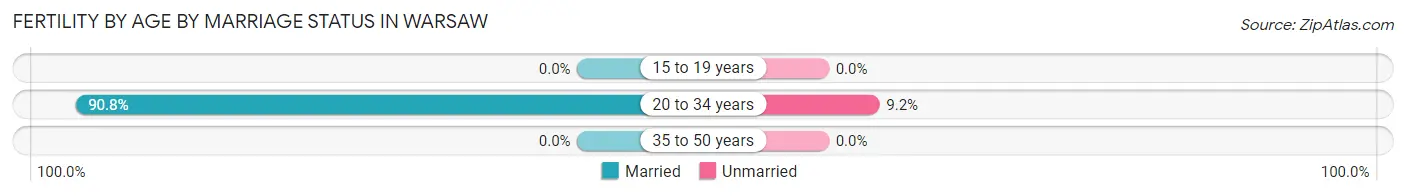
| Age Bracket | Married | Unmarried |
| 15 to 19 years | 0 (0.0%) | 0 (0.0%) |
| 20 to 34 years | 188 (90.8%) | 19 (9.2%) |
| 35 to 50 years | 0 (0.0%) | 0 (0.0%) |
| Total | 188 (90.8%) | 19 (9.2%) |
Fertility by Education in Warsaw
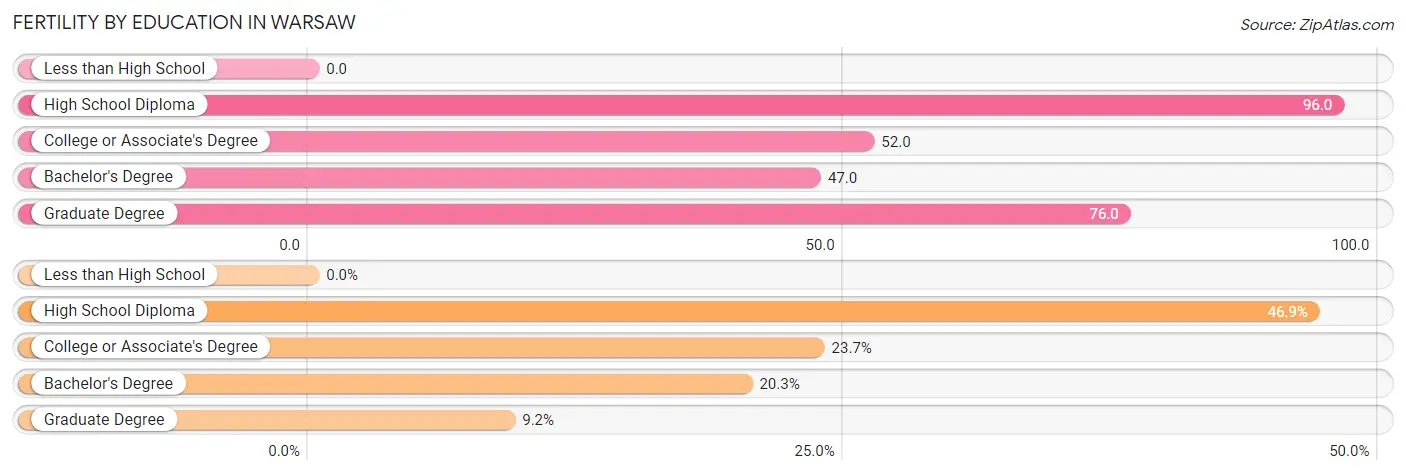
| Educational Attainment | Women with Births | Births / 1,000 Women |
| Less than High School | 0 (0.0%) | 0.0 |
| High School Diploma | 97 (46.9%) | 96.0 |
| College or Associate's Degree | 49 (23.7%) | 52.0 |
| Bachelor's Degree | 42 (20.3%) | 47.0 |
| Graduate Degree | 19 (9.2%) | 76.0 |
| Total | 207 (100.0%) | 53.0 |
Fertility by Education by Marriage Status in Warsaw
9.2% of women with births in Warsaw are unmarried. Women with the educational attainment of college or associate's degree are most likely to be married with 100.0% of them married at childbirth, while women with the educational attainment of high school diploma are least likely to be married with 19.6% of them unmarried at childbirth.
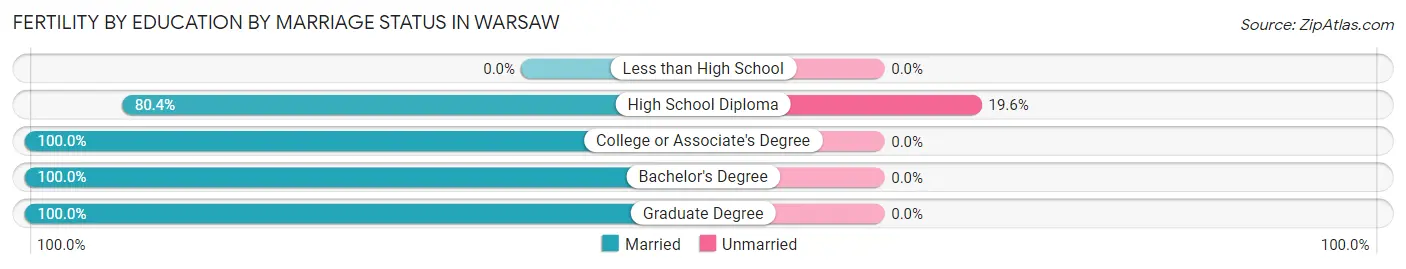
| Educational Attainment | Married | Unmarried |
| Less than High School | 0 (0.0%) | 0 (0.0%) |
| High School Diploma | 78 (80.4%) | 19 (19.6%) |
| College or Associate's Degree | 49 (100.0%) | 0 (0.0%) |
| Bachelor's Degree | 42 (100.0%) | 0 (0.0%) |
| Graduate Degree | 19 (100.0%) | 0 (0.0%) |
| Total | 188 (90.8%) | 19 (9.2%) |
Employment Characteristics in Warsaw
Employment by Class of Employer in Warsaw
Among the 8,240 employed individuals in Warsaw, private company employees (6,324 | 76.7%), not-for-profit organizations (725 | 8.8%), and self-employed (not incorporated) (492 | 6.0%) make up the most common classes of employment.
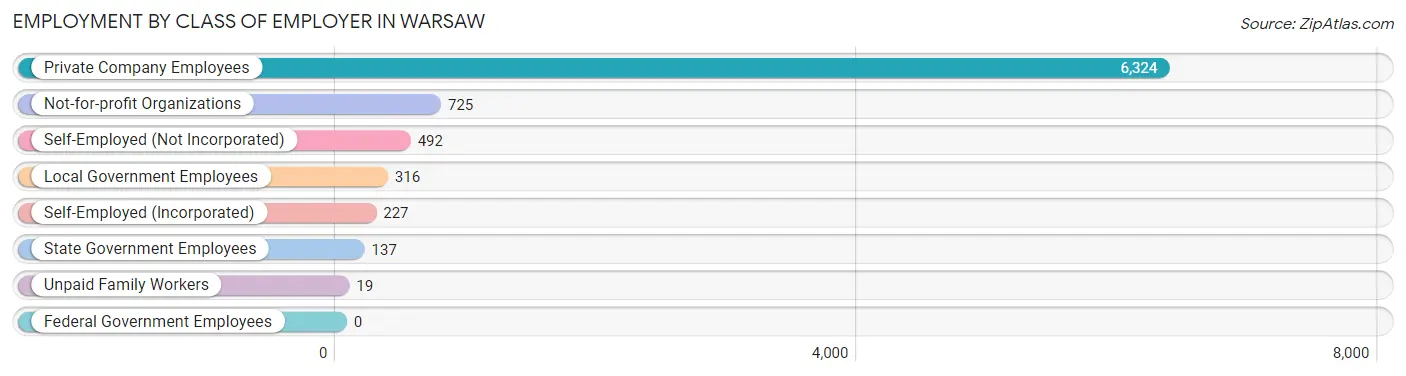
| Employer Class | # Employees | % Employees |
| Private Company Employees | 6,324 | 76.7% |
| Self-Employed (Incorporated) | 227 | 2.8% |
| Self-Employed (Not Incorporated) | 492 | 6.0% |
| Not-for-profit Organizations | 725 | 8.8% |
| Local Government Employees | 316 | 3.8% |
| State Government Employees | 137 | 1.7% |
| Federal Government Employees | 0 | 0.0% |
| Unpaid Family Workers | 19 | 0.2% |
| Total | 8,240 | 100.0% |
Employment Status by Age in Warsaw
According to the labor force statistics for Warsaw, out of the total population over 16 years of age (13,294), 65.9% or 8,761 individuals are in the labor force, with 3.2% or 280 of them unemployed. The age group with the highest labor force participation rate is 20 to 24 years, with 88.3% or 1,280 individuals in the labor force. Within the labor force, the 75 years and over age range has the highest percentage of unemployed individuals, with 51.7% or 15 of them being unemployed.
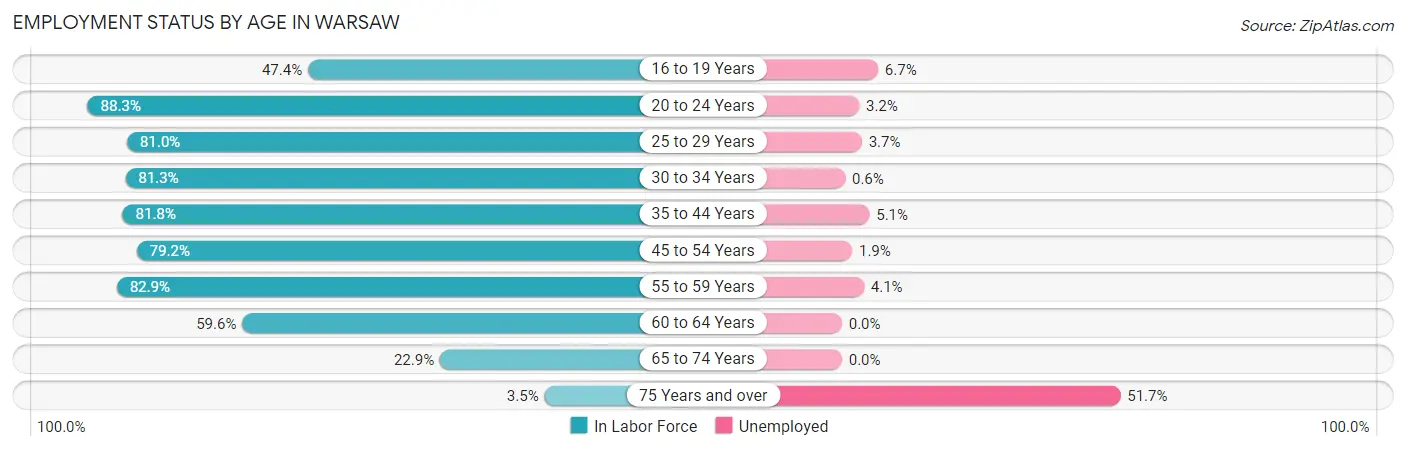
| Age Bracket | In Labor Force | Unemployed |
| 16 to 19 Years | 509 (47.4%) | 34 (6.7%) |
| 20 to 24 Years | 1,280 (88.3%) | 41 (3.2%) |
| 25 to 29 Years | 1,262 (81.0%) | 47 (3.7%) |
| 30 to 34 Years | 1,009 (81.3%) | 6 (0.6%) |
| 35 to 44 Years | 1,741 (81.8%) | 89 (5.1%) |
| 45 to 54 Years | 1,217 (79.2%) | 23 (1.9%) |
| 55 to 59 Years | 640 (82.9%) | 26 (4.1%) |
| 60 to 64 Years | 741 (59.6%) | 0 (0.0%) |
| 65 to 74 Years | 338 (22.9%) | 0 (0.0%) |
| 75 Years and over | 29 (3.5%) | 15 (51.7%) |
| Total | 8,761 (65.9%) | 280 (3.2%) |
Employment Status by Educational Attainment in Warsaw
According to labor force statistics for Warsaw, 78.0% of individuals (6,613) out of the total population between 25 and 64 years of age (8,478) are in the labor force, with 2.9% or 192 of them being unemployed. The group with the highest labor force participation rate are those with the educational attainment of bachelor's degree or higher, with 87.2% or 2,624 individuals in the labor force. Within the labor force, individuals with high school diploma education have the highest percentage of unemployment, with 7.4% or 108 of them being unemployed.
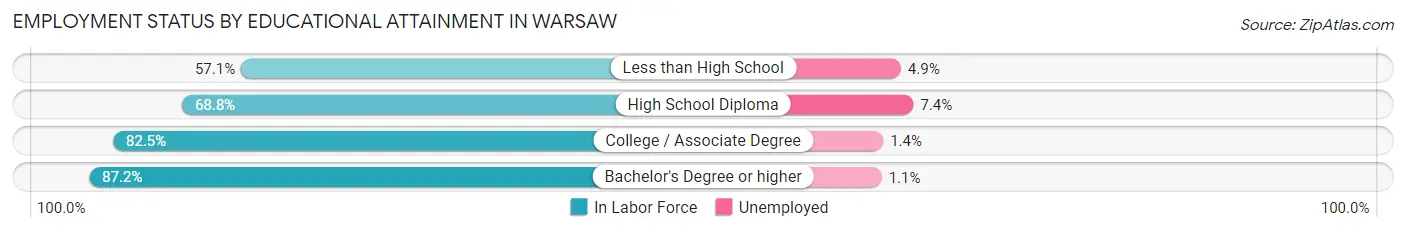
| Educational Attainment | In Labor Force | Unemployed |
| Less than High School | 534 (57.1%) | 46 (4.9%) |
| High School Diploma | 1,454 (68.8%) | 156 (7.4%) |
| College / Associate Degree | 1,996 (82.5%) | 34 (1.4%) |
| Bachelor's Degree or higher | 2,624 (87.2%) | 33 (1.1%) |
| Total | 6,613 (78.0%) | 246 (2.9%) |
Employment Occupations by Sex in Warsaw
Management, Business, Science and Arts Occupations
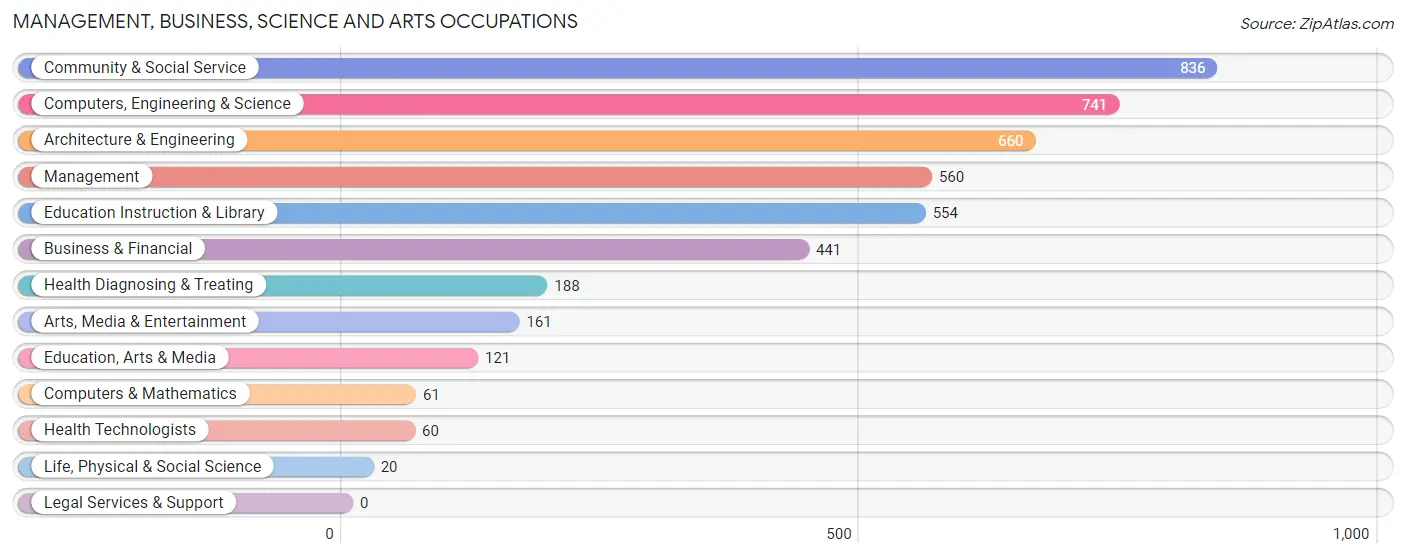
The most common Management, Business, Science and Arts occupations in Warsaw are Community & Social Service (836 | 9.9%), Computers, Engineering & Science (741 | 8.7%), Architecture & Engineering (660 | 7.8%), Management (560 | 6.6%), and Education Instruction & Library (554 | 6.5%).
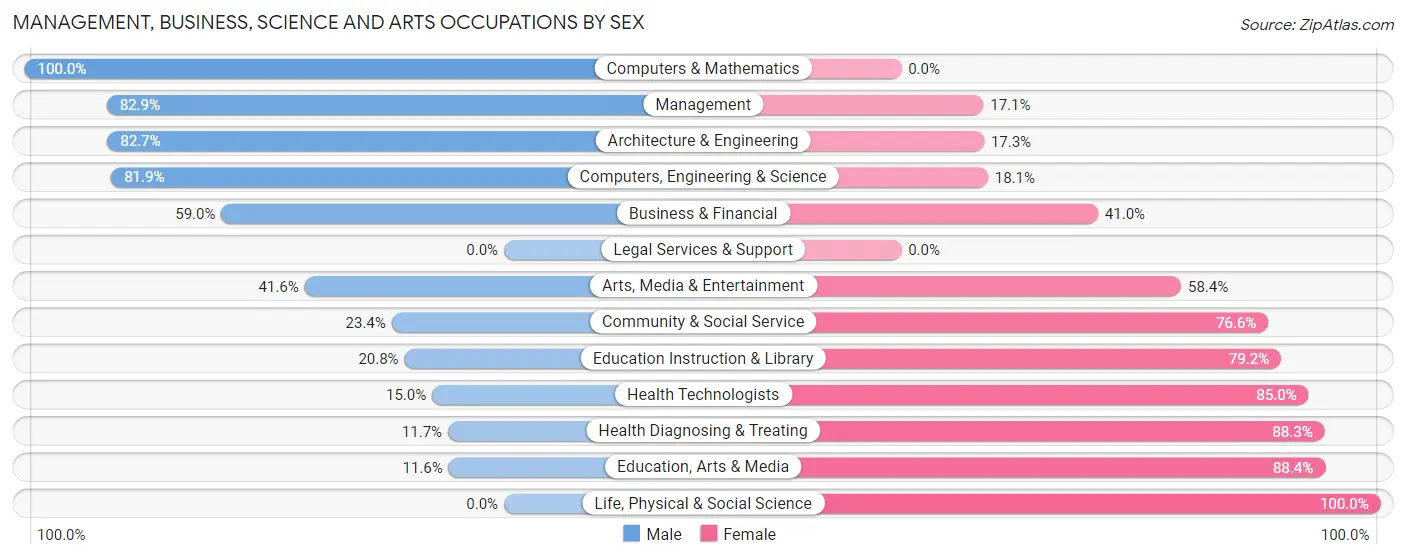
Management, Business, Science and Arts Occupations by Sex
Within the Management, Business, Science and Arts occupations in Warsaw, the most male-oriented occupations are Computers & Mathematics (100.0%), Management (82.9%), and Architecture & Engineering (82.7%), while the most female-oriented occupations are Life, Physical & Social Science (100.0%), Education, Arts & Media (88.4%), and Health Diagnosing & Treating (88.3%).
| Occupation | Male | Female |
| Management | 464 (82.9%) | 96 (17.1%) |
| Business & Financial | 260 (59.0%) | 181 (41.0%) |
| Computers, Engineering & Science | 607 (81.9%) | 134 (18.1%) |
| Computers & Mathematics | 61 (100.0%) | 0 (0.0%) |
| Architecture & Engineering | 546 (82.7%) | 114 (17.3%) |
| Life, Physical & Social Science | 0 (0.0%) | 20 (100.0%) |
| Community & Social Service | 196 (23.4%) | 640 (76.6%) |
| Education, Arts & Media | 14 (11.6%) | 107 (88.4%) |
| Legal Services & Support | 0 (0.0%) | 0 (0.0%) |
| Education Instruction & Library | 115 (20.8%) | 439 (79.2%) |
| Arts, Media & Entertainment | 67 (41.6%) | 94 (58.4%) |
| Health Diagnosing & Treating | 22 (11.7%) | 166 (88.3%) |
| Health Technologists | 9 (15.0%) | 51 (85.0%) |
| Total (Category) | 1,549 (56.0%) | 1,217 (44.0%) |
| Total (Overall) | 4,617 (54.4%) | 3,867 (45.6%) |
Services Occupations
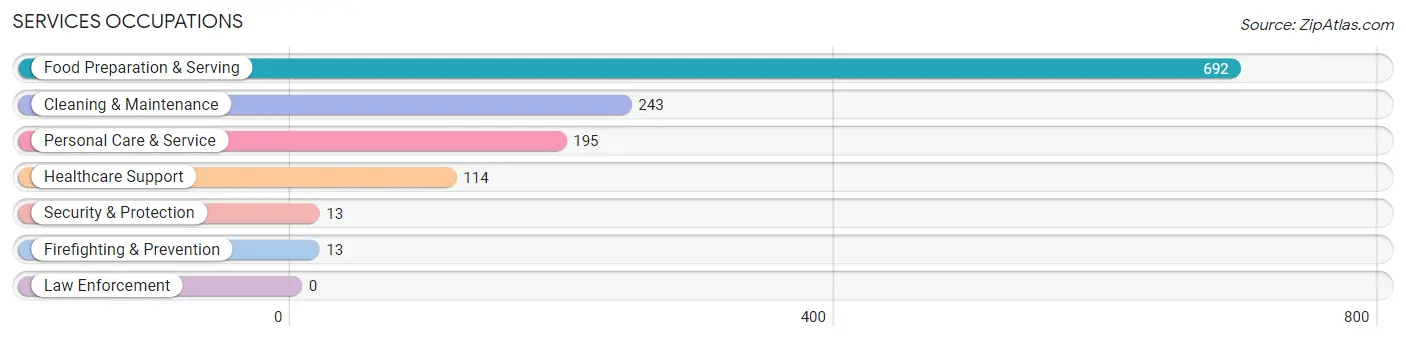
The most common Services occupations in Warsaw are Food Preparation & Serving (692 | 8.2%), Cleaning & Maintenance (243 | 2.9%), Personal Care & Service (195 | 2.3%), Healthcare Support (114 | 1.3%), and Security & Protection (13 | 0.2%).
Services Occupations by Sex
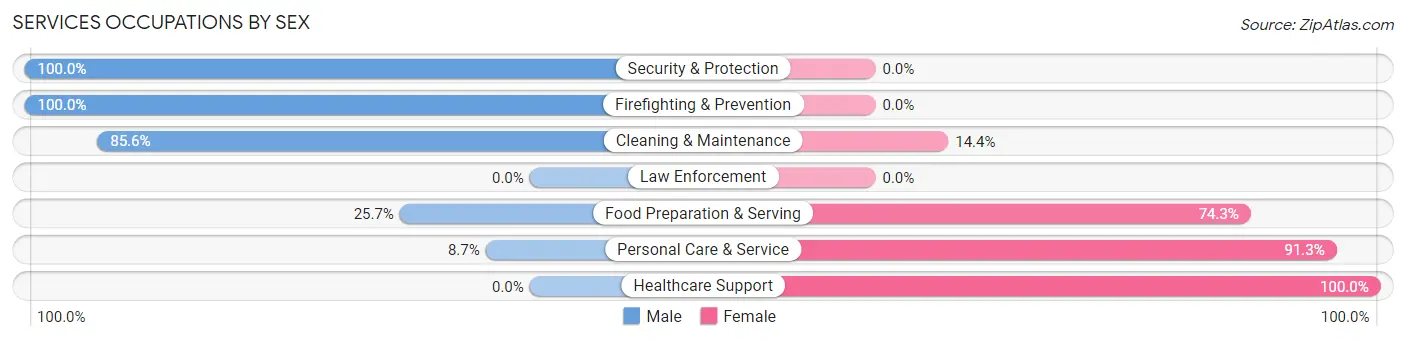
Within the Services occupations in Warsaw, the most male-oriented occupations are Security & Protection (100.0%), Firefighting & Prevention (100.0%), and Cleaning & Maintenance (85.6%), while the most female-oriented occupations are Healthcare Support (100.0%), Personal Care & Service (91.3%), and Food Preparation & Serving (74.3%).
| Occupation | Male | Female |
| Healthcare Support | 0 (0.0%) | 114 (100.0%) |
| Security & Protection | 13 (100.0%) | 0 (0.0%) |
| Firefighting & Prevention | 13 (100.0%) | 0 (0.0%) |
| Law Enforcement | 0 (0.0%) | 0 (0.0%) |
| Food Preparation & Serving | 178 (25.7%) | 514 (74.3%) |
| Cleaning & Maintenance | 208 (85.6%) | 35 (14.4%) |
| Personal Care & Service | 17 (8.7%) | 178 (91.3%) |
| Total (Category) | 416 (33.1%) | 841 (66.9%) |
| Total (Overall) | 4,617 (54.4%) | 3,867 (45.6%) |
Sales and Office Occupations
The most common Sales and Office occupations in Warsaw are Office & Administration (741 | 8.7%), and Sales & Related (488 | 5.8%).

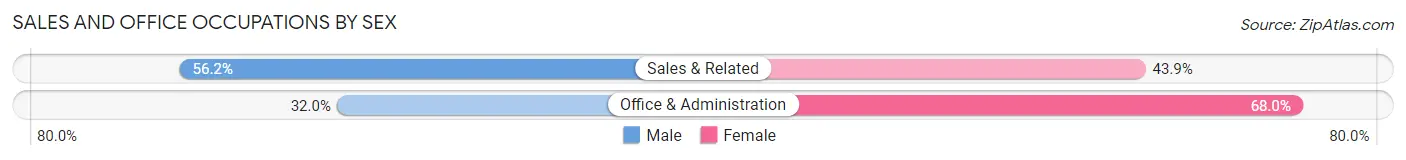
Sales and Office Occupations by Sex
| Occupation | Male | Female |
| Sales & Related | 274 (56.1%) | 214 (43.9%) |
| Office & Administration | 237 (32.0%) | 504 (68.0%) |
| Total (Category) | 511 (41.6%) | 718 (58.4%) |
| Total (Overall) | 4,617 (54.4%) | 3,867 (45.6%) |
Natural Resources, Construction and Maintenance Occupations
The most common Natural Resources, Construction and Maintenance occupations in Warsaw are Construction & Extraction (503 | 5.9%), and Installation, Maintenance & Repair (438 | 5.2%).
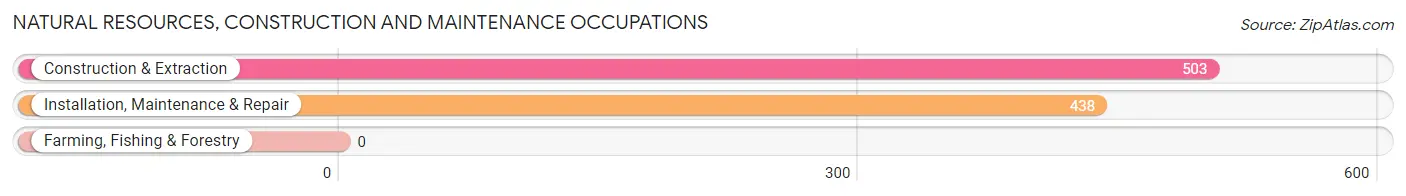
Natural Resources, Construction and Maintenance Occupations by Sex
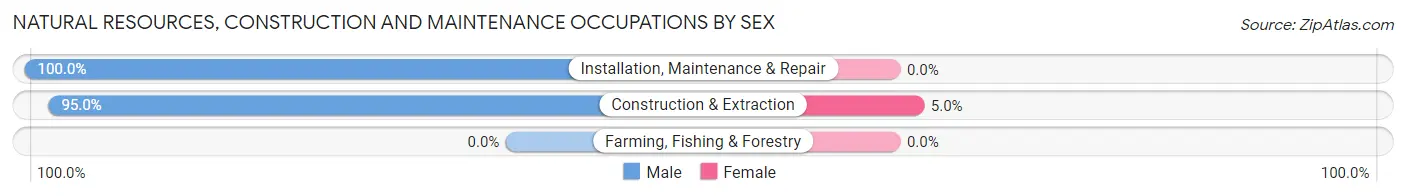
| Occupation | Male | Female |
| Farming, Fishing & Forestry | 0 (0.0%) | 0 (0.0%) |
| Construction & Extraction | 478 (95.0%) | 25 (5.0%) |
| Installation, Maintenance & Repair | 438 (100.0%) | 0 (0.0%) |
| Total (Category) | 916 (97.3%) | 25 (2.7%) |
| Total (Overall) | 4,617 (54.4%) | 3,867 (45.6%) |
Production, Transportation and Moving Occupations
The most common Production, Transportation and Moving occupations in Warsaw are Production (1,671 | 19.7%), Material Moving (462 | 5.4%), and Transportation (158 | 1.9%).
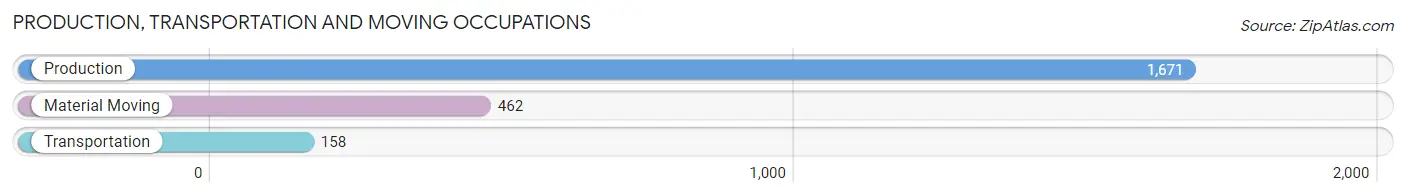
Production, Transportation and Moving Occupations by Sex
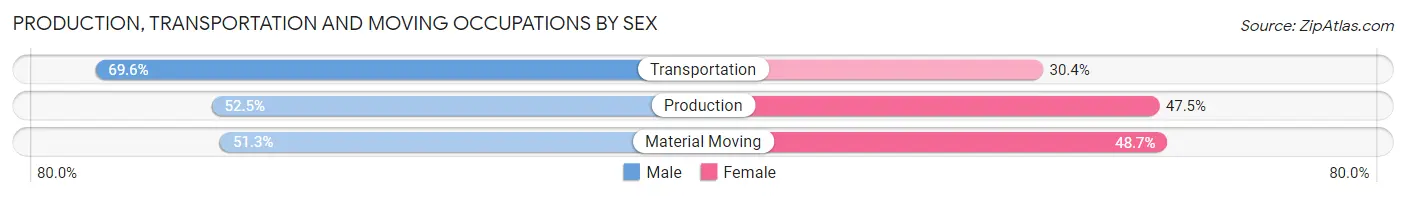
| Occupation | Male | Female |
| Production | 878 (52.5%) | 793 (47.5%) |
| Transportation | 110 (69.6%) | 48 (30.4%) |
| Material Moving | 237 (51.3%) | 225 (48.7%) |
| Total (Category) | 1,225 (53.5%) | 1,066 (46.5%) |
| Total (Overall) | 4,617 (54.4%) | 3,867 (45.6%) |
Employment Industries by Sex in Warsaw
Employment Industries in Warsaw
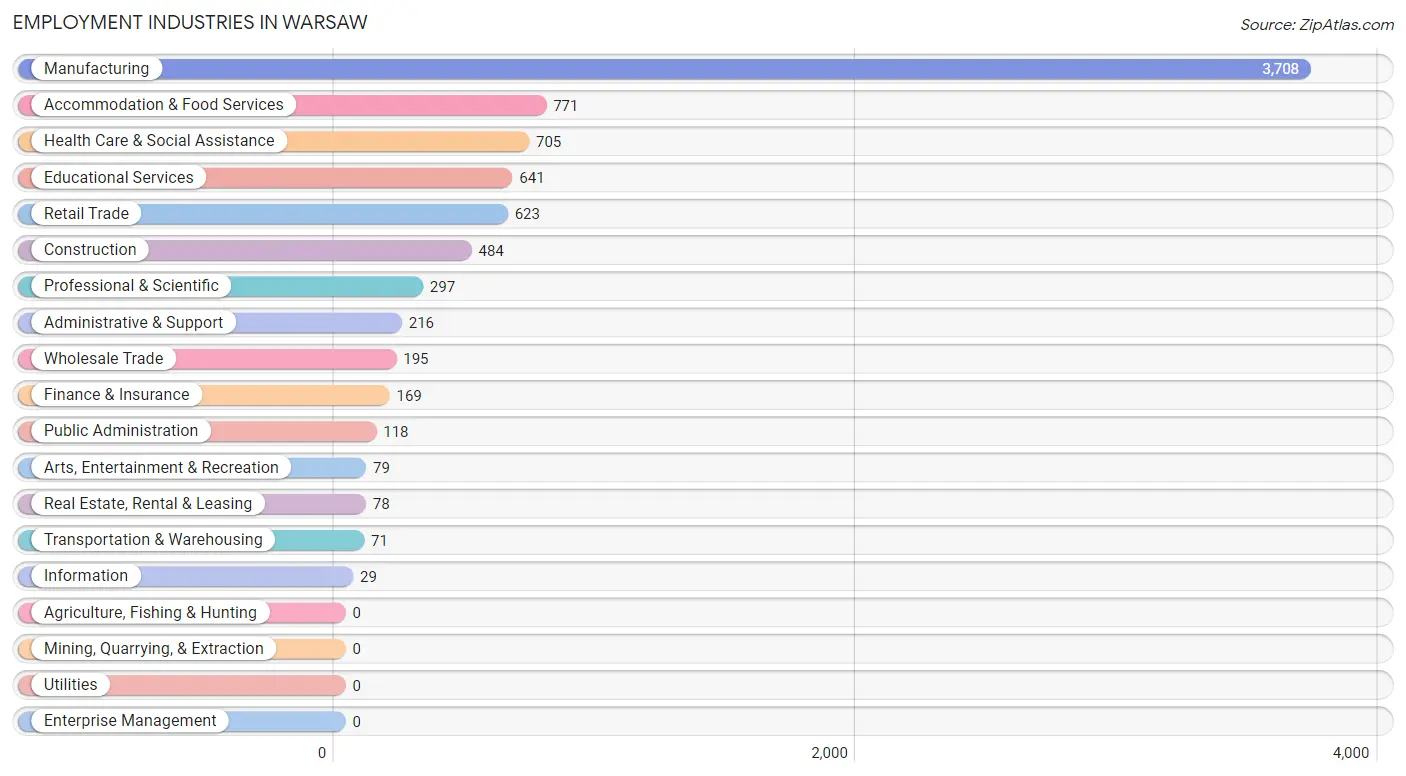
The major employment industries in Warsaw include Manufacturing (3,708 | 43.7%), Accommodation & Food Services (771 | 9.1%), Health Care & Social Assistance (705 | 8.3%), Educational Services (641 | 7.6%), and Retail Trade (623 | 7.3%).
Employment Industries by Sex in Warsaw
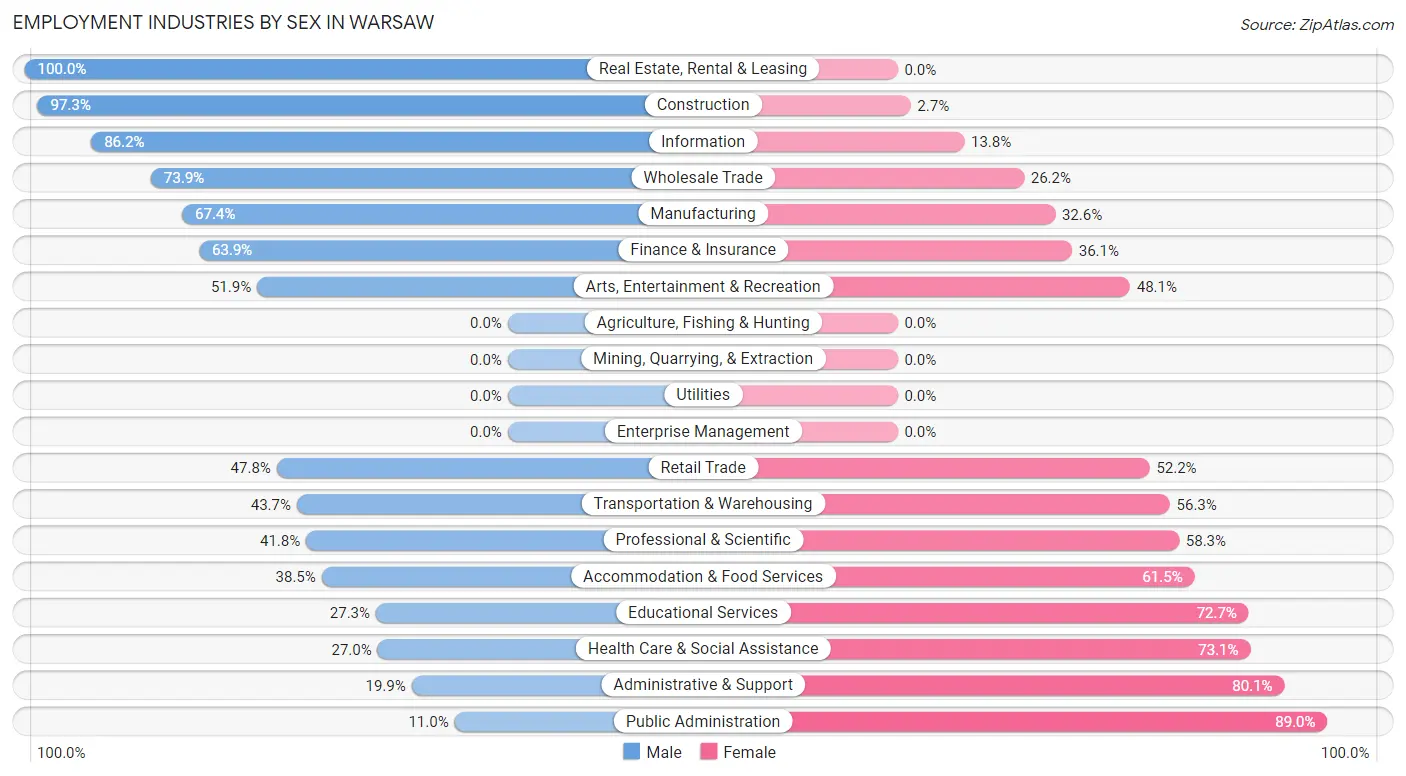
The Warsaw industries that see more men than women are Real Estate, Rental & Leasing (100.0%), Construction (97.3%), and Information (86.2%), whereas the industries that tend to have a higher number of women are Public Administration (89.0%), Administrative & Support (80.1%), and Health Care & Social Assistance (73.1%).
| Industry | Male | Female |
| Agriculture, Fishing & Hunting | 0 (0.0%) | 0 (0.0%) |
| Mining, Quarrying, & Extraction | 0 (0.0%) | 0 (0.0%) |
| Construction | 471 (97.3%) | 13 (2.7%) |
| Manufacturing | 2,499 (67.4%) | 1,209 (32.6%) |
| Wholesale Trade | 144 (73.9%) | 51 (26.2%) |
| Retail Trade | 298 (47.8%) | 325 (52.2%) |
| Transportation & Warehousing | 31 (43.7%) | 40 (56.3%) |
| Utilities | 0 (0.0%) | 0 (0.0%) |
| Information | 25 (86.2%) | 4 (13.8%) |
| Finance & Insurance | 108 (63.9%) | 61 (36.1%) |
| Real Estate, Rental & Leasing | 78 (100.0%) | 0 (0.0%) |
| Professional & Scientific | 124 (41.7%) | 173 (58.3%) |
| Enterprise Management | 0 (0.0%) | 0 (0.0%) |
| Administrative & Support | 43 (19.9%) | 173 (80.1%) |
| Educational Services | 175 (27.3%) | 466 (72.7%) |
| Health Care & Social Assistance | 190 (27.0%) | 515 (73.1%) |
| Arts, Entertainment & Recreation | 41 (51.9%) | 38 (48.1%) |
| Accommodation & Food Services | 297 (38.5%) | 474 (61.5%) |
| Public Administration | 13 (11.0%) | 105 (89.0%) |
| Total | 4,617 (54.4%) | 3,867 (45.6%) |
Education in Warsaw
School Enrollment in Warsaw
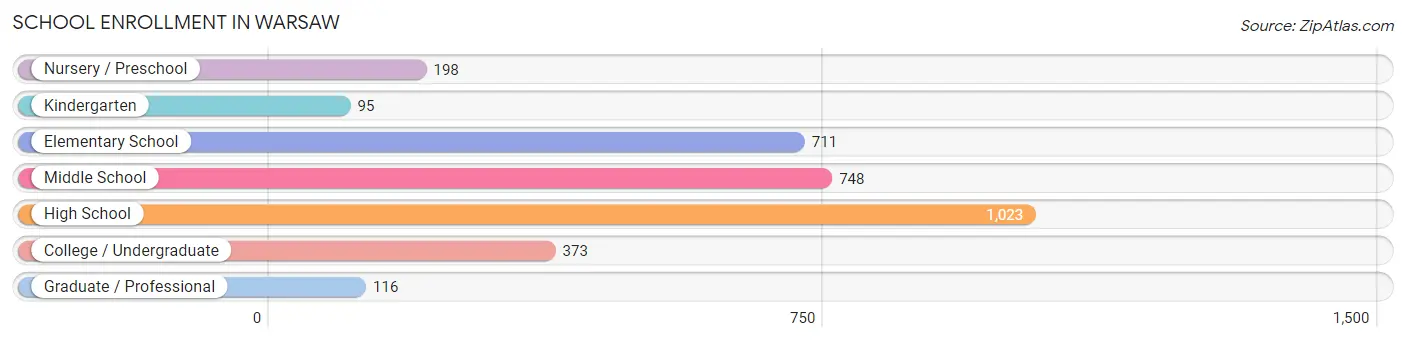
The most common levels of schooling among the 3,264 students in Warsaw are high school (1,023 | 31.3%), middle school (748 | 22.9%), and elementary school (711 | 21.8%).
| School Level | # Students | % Students |
| Nursery / Preschool | 198 | 6.1% |
| Kindergarten | 95 | 2.9% |
| Elementary School | 711 | 21.8% |
| Middle School | 748 | 22.9% |
| High School | 1,023 | 31.3% |
| College / Undergraduate | 373 | 11.4% |
| Graduate / Professional | 116 | 3.5% |
| Total | 3,264 | 100.0% |
School Enrollment by Age by Funding Source in Warsaw
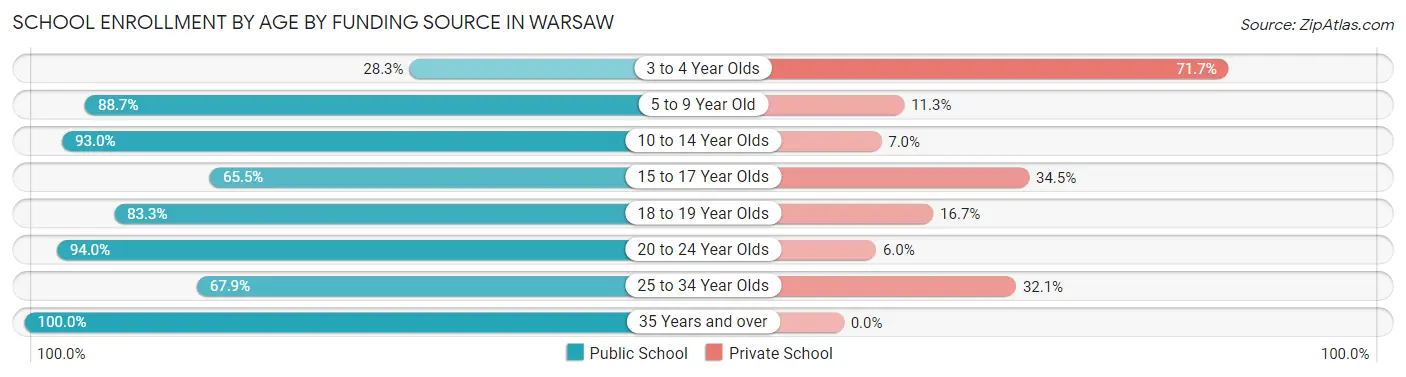
Out of a total of 3,264 students who are enrolled in schools in Warsaw, 607 (18.6%) attend a private institution, while the remaining 2,657 (81.4%) are enrolled in public schools. The age group of 3 to 4 year olds has the highest likelihood of being enrolled in private schools, with 86 (71.7% in the age bracket) enrolled. Conversely, the age group of 35 years and over has the lowest likelihood of being enrolled in a private school, with 52 (100.0% in the age bracket) attending a public institution.
| Age Bracket | Public School | Private School |
| 3 to 4 Year Olds | 34 (28.3%) | 86 (71.7%) |
| 5 to 9 Year Old | 629 (88.7%) | 80 (11.3%) |
| 10 to 14 Year Olds | 970 (93.0%) | 73 (7.0%) |
| 15 to 17 Year Olds | 493 (65.5%) | 260 (34.5%) |
| 18 to 19 Year Olds | 130 (83.3%) | 26 (16.7%) |
| 20 to 24 Year Olds | 203 (94.0%) | 13 (6.0%) |
| 25 to 34 Year Olds | 146 (67.9%) | 69 (32.1%) |
| 35 Years and over | 52 (100.0%) | 0 (0.0%) |
| Total | 2,657 (81.4%) | 607 (18.6%) |
Educational Attainment by Field of Study in Warsaw
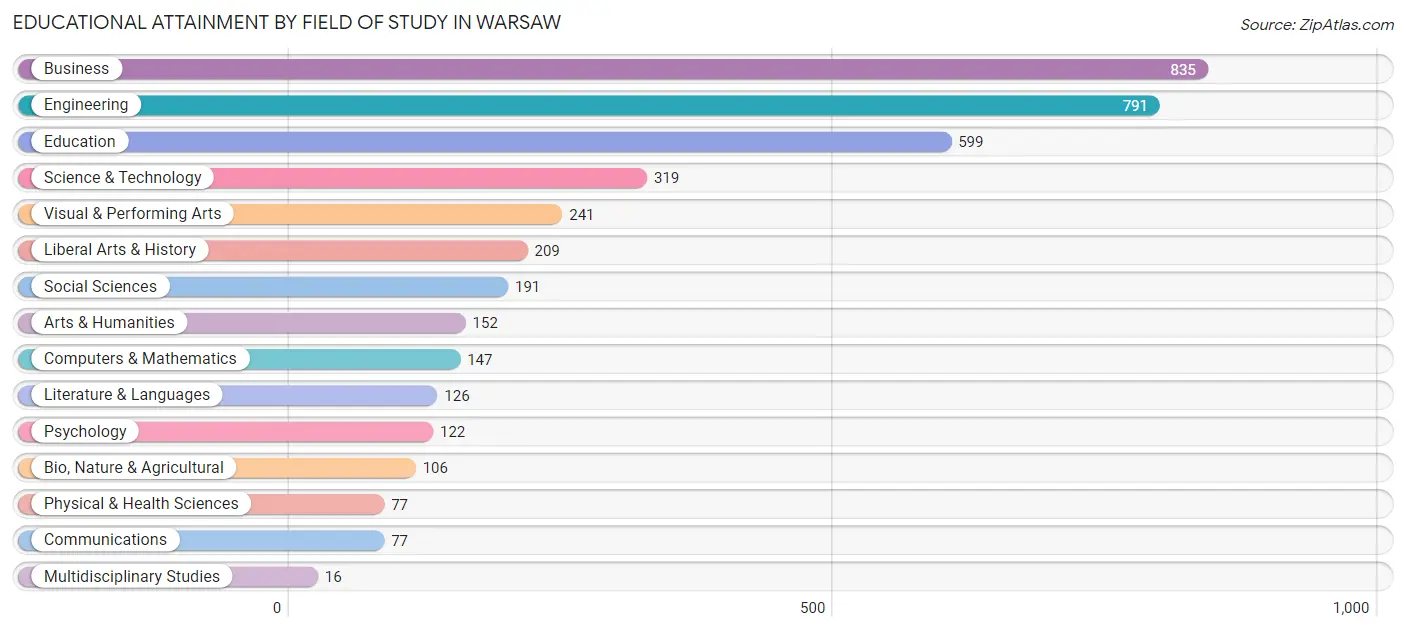
Business (835 | 20.8%), engineering (791 | 19.7%), education (599 | 14.9%), science & technology (319 | 8.0%), and visual & performing arts (241 | 6.0%) are the most common fields of study among 4,008 individuals in Warsaw who have obtained a bachelor's degree or higher.
| Field of Study | # Graduates | % Graduates |
| Computers & Mathematics | 147 | 3.7% |
| Bio, Nature & Agricultural | 106 | 2.6% |
| Physical & Health Sciences | 77 | 1.9% |
| Psychology | 122 | 3.0% |
| Social Sciences | 191 | 4.8% |
| Engineering | 791 | 19.7% |
| Multidisciplinary Studies | 16 | 0.4% |
| Science & Technology | 319 | 8.0% |
| Business | 835 | 20.8% |
| Education | 599 | 14.9% |
| Literature & Languages | 126 | 3.1% |
| Liberal Arts & History | 209 | 5.2% |
| Visual & Performing Arts | 241 | 6.0% |
| Communications | 77 | 1.9% |
| Arts & Humanities | 152 | 3.8% |
| Total | 4,008 | 100.0% |
Transportation & Commute in Warsaw
Vehicle Availability by Sex in Warsaw
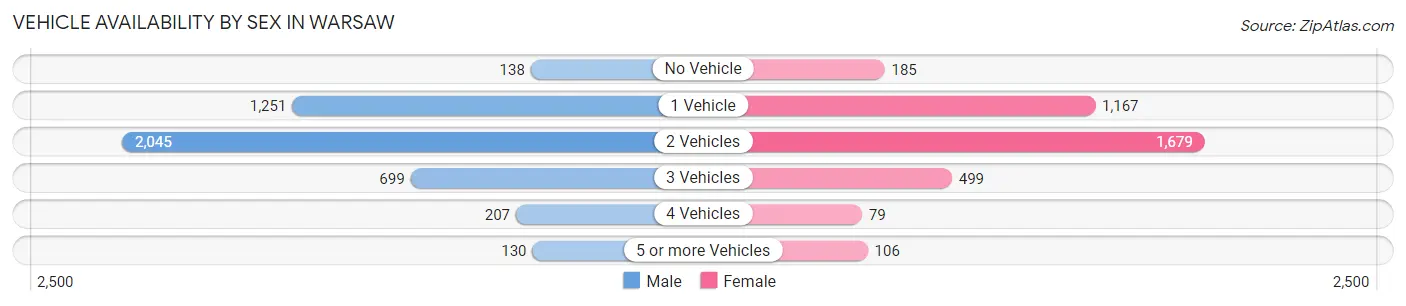
The most prevalent vehicle ownership categories in Warsaw are males with 2 vehicles (2,045, accounting for 45.8%) and females with 2 vehicles (1,679, making up 55.0%).
| Vehicles Available | Male | Female |
| No Vehicle | 138 (3.1%) | 185 (5.0%) |
| 1 Vehicle | 1,251 (28.0%) | 1,167 (31.4%) |
| 2 Vehicles | 2,045 (45.8%) | 1,679 (45.2%) |
| 3 Vehicles | 699 (15.6%) | 499 (13.4%) |
| 4 Vehicles | 207 (4.6%) | 79 (2.1%) |
| 5 or more Vehicles | 130 (2.9%) | 106 (2.9%) |
| Total | 4,470 (100.0%) | 3,715 (100.0%) |
Commute Time in Warsaw
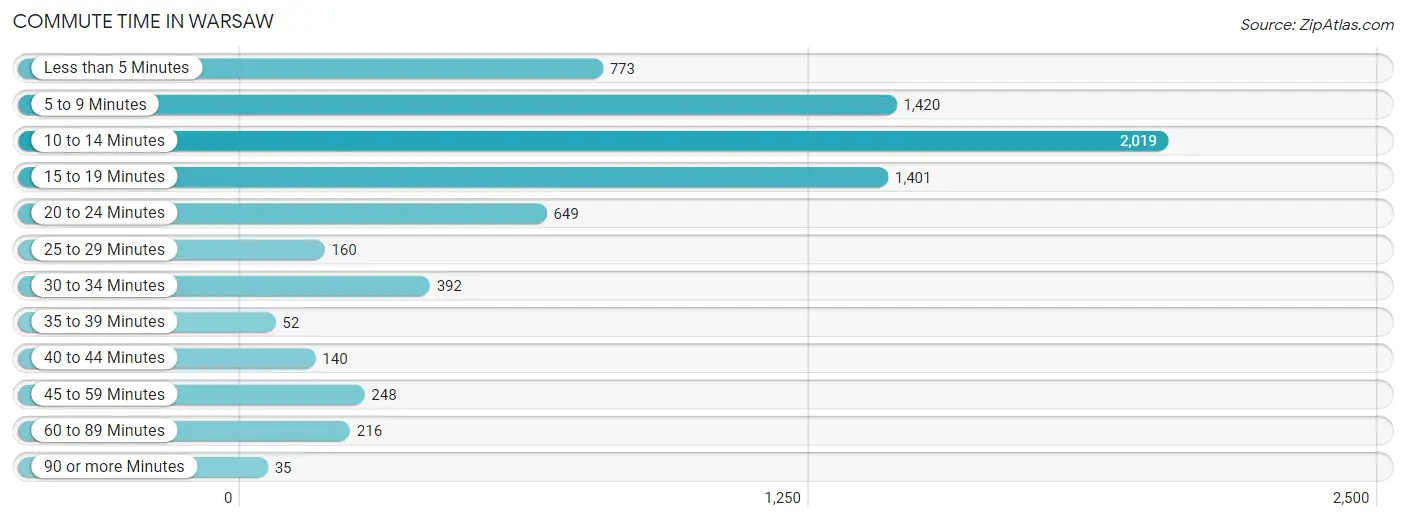
The most frequently occuring commute durations in Warsaw are 10 to 14 minutes (2,019 commuters, 26.9%), 5 to 9 minutes (1,420 commuters, 18.9%), and 15 to 19 minutes (1,401 commuters, 18.7%).
| Commute Time | # Commuters | % Commuters |
| Less than 5 Minutes | 773 | 10.3% |
| 5 to 9 Minutes | 1,420 | 18.9% |
| 10 to 14 Minutes | 2,019 | 26.9% |
| 15 to 19 Minutes | 1,401 | 18.7% |
| 20 to 24 Minutes | 649 | 8.6% |
| 25 to 29 Minutes | 160 | 2.1% |
| 30 to 34 Minutes | 392 | 5.2% |
| 35 to 39 Minutes | 52 | 0.7% |
| 40 to 44 Minutes | 140 | 1.9% |
| 45 to 59 Minutes | 248 | 3.3% |
| 60 to 89 Minutes | 216 | 2.9% |
| 90 or more Minutes | 35 | 0.5% |
Commute Time by Sex in Warsaw
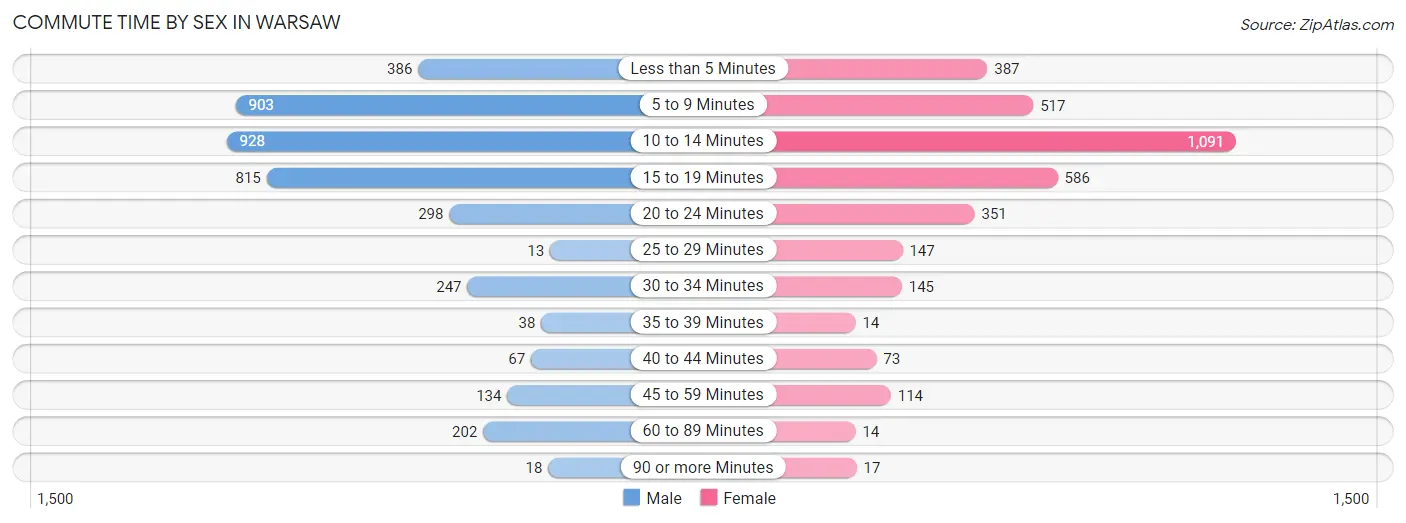
The most common commute times in Warsaw are 10 to 14 minutes (928 commuters, 22.9%) for males and 10 to 14 minutes (1,091 commuters, 31.6%) for females.
| Commute Time | Male | Female |
| Less than 5 Minutes | 386 (9.5%) | 387 (11.2%) |
| 5 to 9 Minutes | 903 (22.3%) | 517 (15.0%) |
| 10 to 14 Minutes | 928 (22.9%) | 1,091 (31.6%) |
| 15 to 19 Minutes | 815 (20.1%) | 586 (17.0%) |
| 20 to 24 Minutes | 298 (7.4%) | 351 (10.2%) |
| 25 to 29 Minutes | 13 (0.3%) | 147 (4.3%) |
| 30 to 34 Minutes | 247 (6.1%) | 145 (4.2%) |
| 35 to 39 Minutes | 38 (0.9%) | 14 (0.4%) |
| 40 to 44 Minutes | 67 (1.7%) | 73 (2.1%) |
| 45 to 59 Minutes | 134 (3.3%) | 114 (3.3%) |
| 60 to 89 Minutes | 202 (5.0%) | 14 (0.4%) |
| 90 or more Minutes | 18 (0.4%) | 17 (0.5%) |
Time of Departure to Work by Sex in Warsaw
The most frequent times of departure to work in Warsaw are 7:30 AM to 7:59 AM (616, 15.2%) for males and 7:00 AM to 7:29 AM (591, 17.1%) for females.
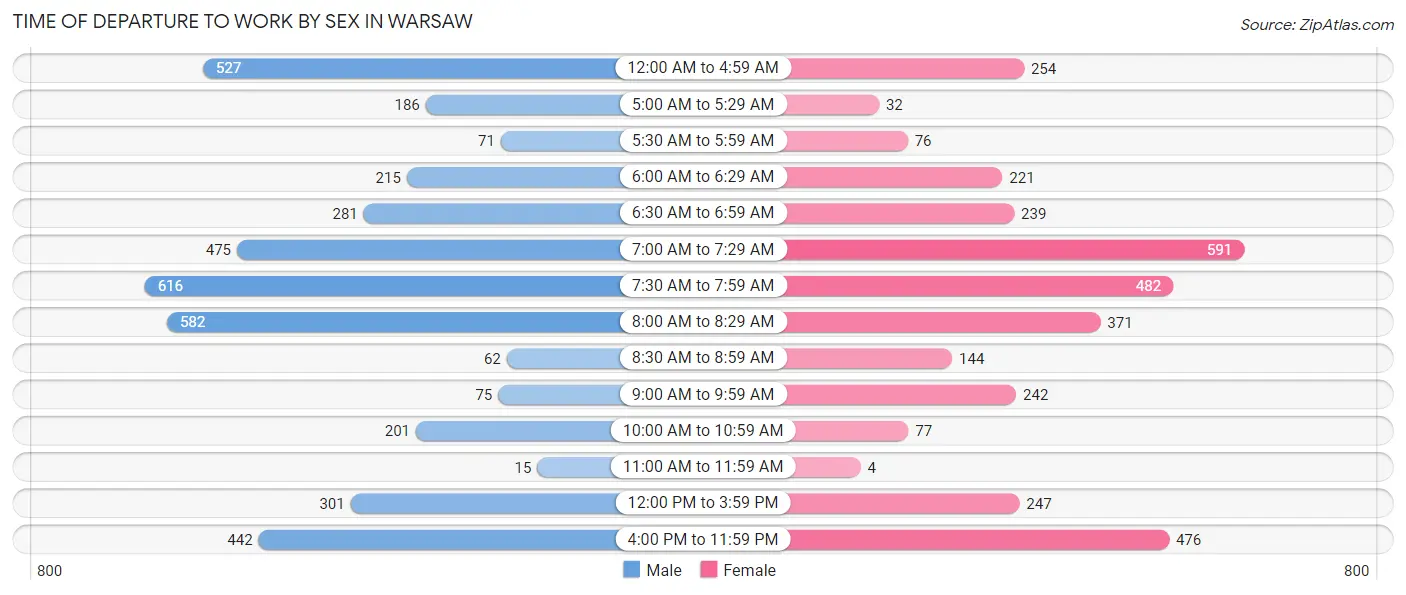
| Time of Departure | Male | Female |
| 12:00 AM to 4:59 AM | 527 (13.0%) | 254 (7.3%) |
| 5:00 AM to 5:29 AM | 186 (4.6%) | 32 (0.9%) |
| 5:30 AM to 5:59 AM | 71 (1.8%) | 76 (2.2%) |
| 6:00 AM to 6:29 AM | 215 (5.3%) | 221 (6.4%) |
| 6:30 AM to 6:59 AM | 281 (6.9%) | 239 (6.9%) |
| 7:00 AM to 7:29 AM | 475 (11.7%) | 591 (17.1%) |
| 7:30 AM to 7:59 AM | 616 (15.2%) | 482 (14.0%) |
| 8:00 AM to 8:29 AM | 582 (14.4%) | 371 (10.7%) |
| 8:30 AM to 8:59 AM | 62 (1.5%) | 144 (4.2%) |
| 9:00 AM to 9:59 AM | 75 (1.8%) | 242 (7.0%) |
| 10:00 AM to 10:59 AM | 201 (5.0%) | 77 (2.2%) |
| 11:00 AM to 11:59 AM | 15 (0.4%) | 4 (0.1%) |
| 12:00 PM to 3:59 PM | 301 (7.4%) | 247 (7.1%) |
| 4:00 PM to 11:59 PM | 442 (10.9%) | 476 (13.8%) |
| Total | 4,049 (100.0%) | 3,456 (100.0%) |
Housing Occupancy in Warsaw
Occupancy by Ownership in Warsaw
Of the total 6,967 dwellings in Warsaw, owner-occupied units account for 3,425 (49.2%), while renter-occupied units make up 3,542 (50.8%).
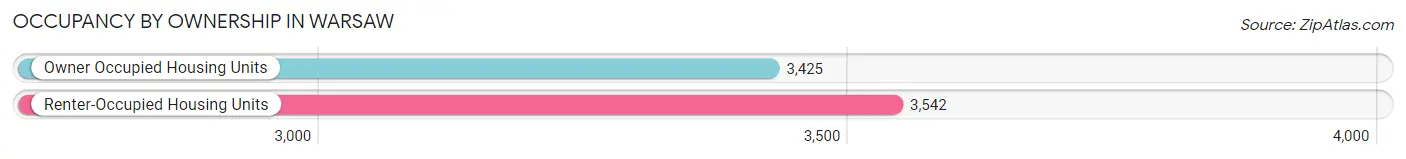
| Occupancy | # Housing Units | % Housing Units |
| Owner Occupied Housing Units | 3,425 | 49.2% |
| Renter-Occupied Housing Units | 3,542 | 50.8% |
| Total Occupied Housing Units | 6,967 | 100.0% |
Occupancy by Household Size in Warsaw
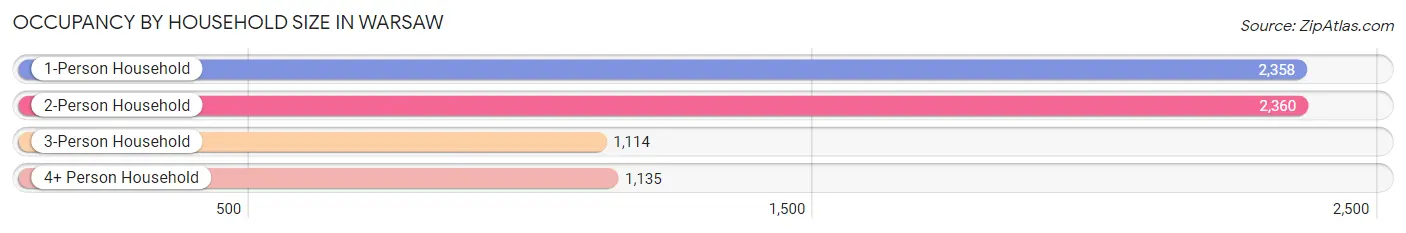
| Household Size | # Housing Units | % Housing Units |
| 1-Person Household | 2,358 | 33.9% |
| 2-Person Household | 2,360 | 33.9% |
| 3-Person Household | 1,114 | 16.0% |
| 4+ Person Household | 1,135 | 16.3% |
| Total Housing Units | 6,967 | 100.0% |
Occupancy by Ownership by Household Size in Warsaw
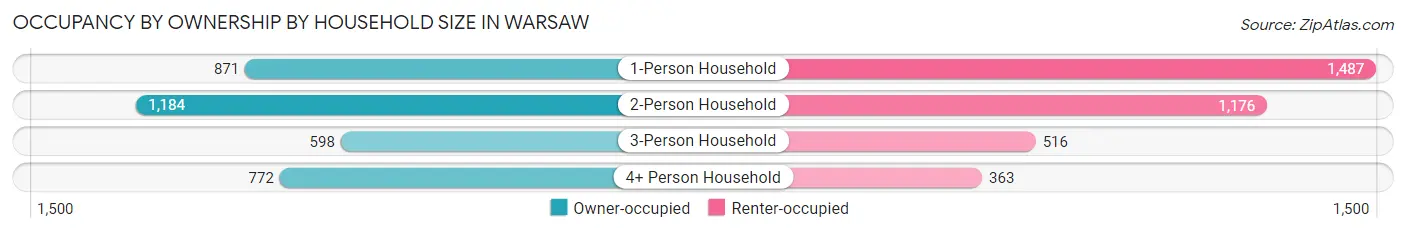
| Household Size | Owner-occupied | Renter-occupied |
| 1-Person Household | 871 (36.9%) | 1,487 (63.1%) |
| 2-Person Household | 1,184 (50.2%) | 1,176 (49.8%) |
| 3-Person Household | 598 (53.7%) | 516 (46.3%) |
| 4+ Person Household | 772 (68.0%) | 363 (32.0%) |
| Total Housing Units | 3,425 (49.2%) | 3,542 (50.8%) |
Occupancy by Educational Attainment in Warsaw
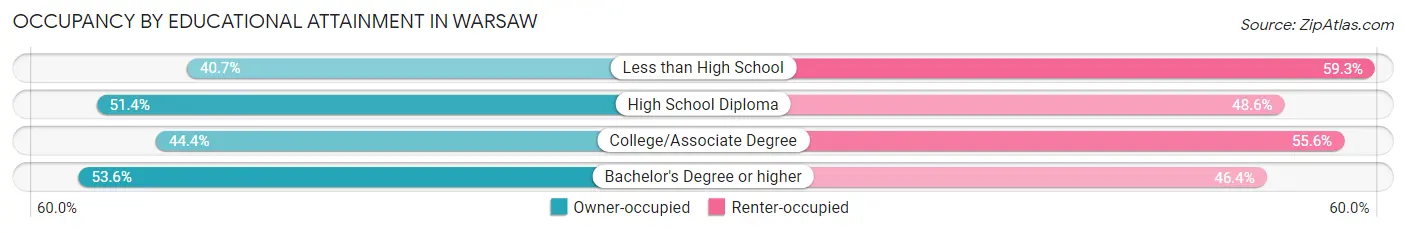
| Household Size | Owner-occupied | Renter-occupied |
| Less than High School | 340 (40.7%) | 496 (59.3%) |
| High School Diploma | 967 (51.4%) | 913 (48.6%) |
| College/Associate Degree | 767 (44.4%) | 962 (55.6%) |
| Bachelor's Degree or higher | 1,351 (53.6%) | 1,171 (46.4%) |
Occupancy by Age of Householder in Warsaw
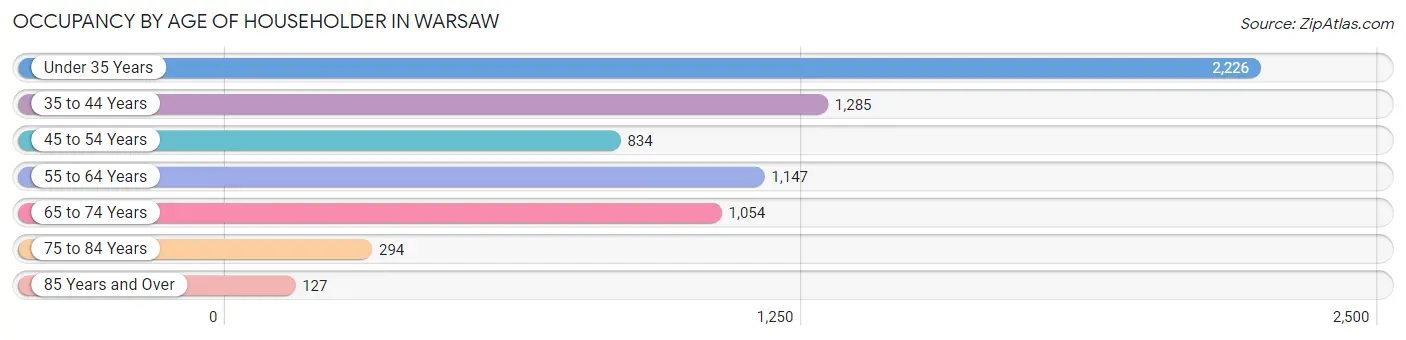
| Age Bracket | # Households | % Households |
| Under 35 Years | 2,226 | 32.0% |
| 35 to 44 Years | 1,285 | 18.4% |
| 45 to 54 Years | 834 | 12.0% |
| 55 to 64 Years | 1,147 | 16.5% |
| 65 to 74 Years | 1,054 | 15.1% |
| 75 to 84 Years | 294 | 4.2% |
| 85 Years and Over | 127 | 1.8% |
| Total | 6,967 | 100.0% |
Housing Finances in Warsaw
Median Income by Occupancy in Warsaw
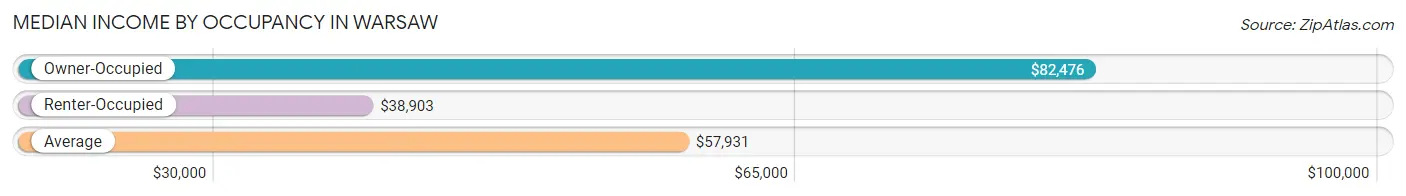
| Occupancy Type | # Households | Median Income |
| Owner-Occupied | 3,425 (49.2%) | $82,476 |
| Renter-Occupied | 3,542 (50.8%) | $38,903 |
| Average | 6,967 (100.0%) | $57,931 |
Occupancy by Householder Income Bracket in Warsaw
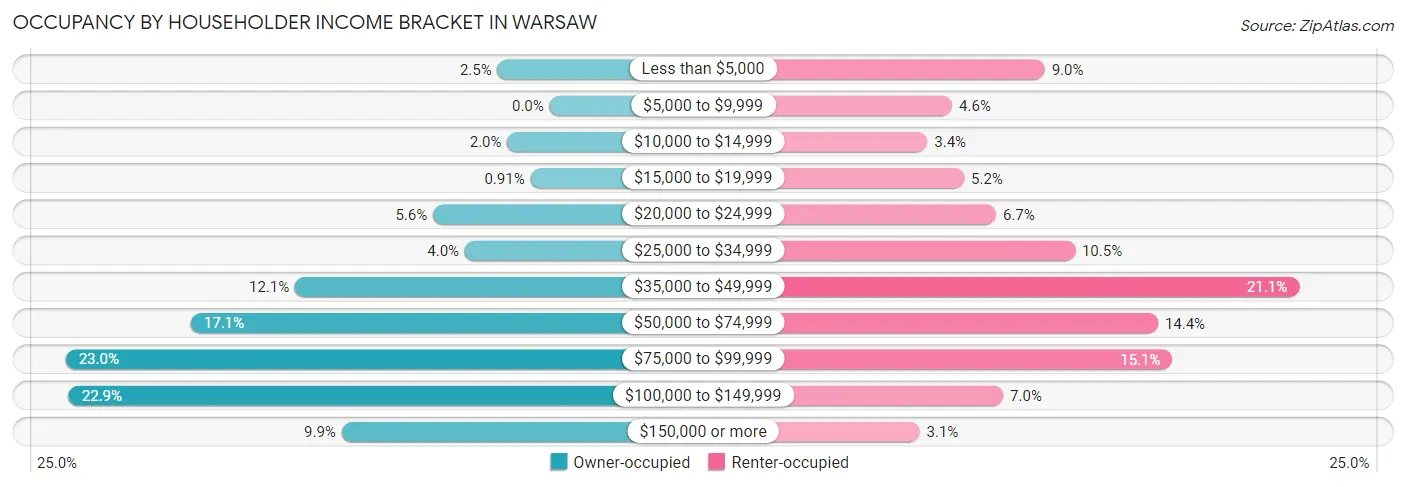
| Income Bracket | Owner-occupied | Renter-occupied |
| Less than $5,000 | 85 (2.5%) | 319 (9.0%) |
| $5,000 to $9,999 | 0 (0.0%) | 163 (4.6%) |
| $10,000 to $14,999 | 69 (2.0%) | 121 (3.4%) |
| $15,000 to $19,999 | 31 (0.9%) | 183 (5.2%) |
| $20,000 to $24,999 | 190 (5.6%) | 237 (6.7%) |
| $25,000 to $34,999 | 138 (4.0%) | 370 (10.4%) |
| $35,000 to $49,999 | 415 (12.1%) | 748 (21.1%) |
| $50,000 to $74,999 | 585 (17.1%) | 510 (14.4%) |
| $75,000 to $99,999 | 789 (23.0%) | 534 (15.1%) |
| $100,000 to $149,999 | 784 (22.9%) | 249 (7.0%) |
| $150,000 or more | 339 (9.9%) | 108 (3.0%) |
| Total | 3,425 (100.0%) | 3,542 (100.0%) |
Monthly Housing Cost Tiers in Warsaw
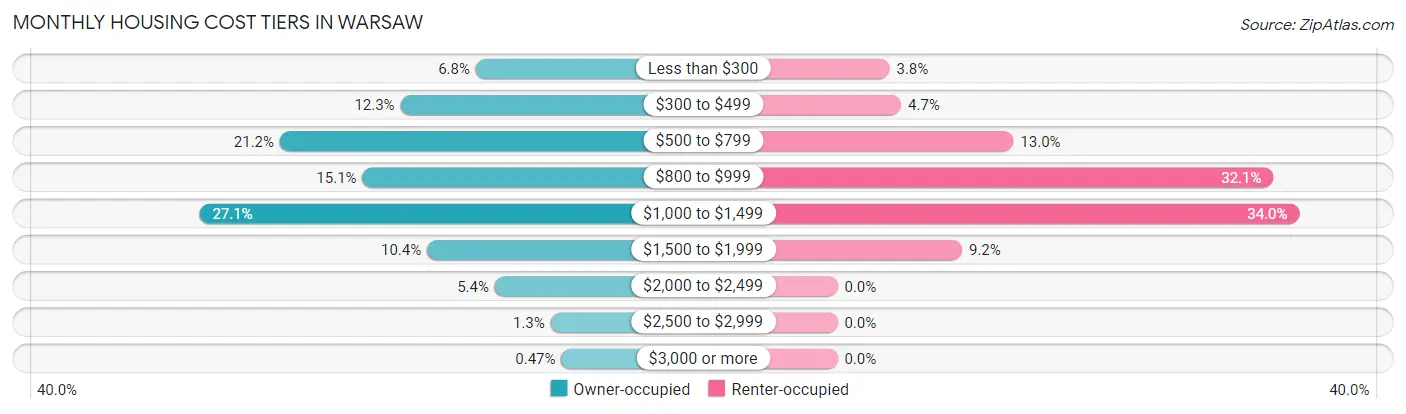
| Monthly Cost | Owner-occupied | Renter-occupied |
| Less than $300 | 232 (6.8%) | 136 (3.8%) |
| $300 to $499 | 422 (12.3%) | 166 (4.7%) |
| $500 to $799 | 726 (21.2%) | 459 (13.0%) |
| $800 to $999 | 518 (15.1%) | 1,137 (32.1%) |
| $1,000 to $1,499 | 929 (27.1%) | 1,205 (34.0%) |
| $1,500 to $1,999 | 355 (10.4%) | 325 (9.2%) |
| $2,000 to $2,499 | 184 (5.4%) | 0 (0.0%) |
| $2,500 to $2,999 | 43 (1.3%) | 0 (0.0%) |
| $3,000 or more | 16 (0.5%) | 0 (0.0%) |
| Total | 3,425 (100.0%) | 3,542 (100.0%) |
Physical Housing Characteristics in Warsaw
Housing Structures in Warsaw
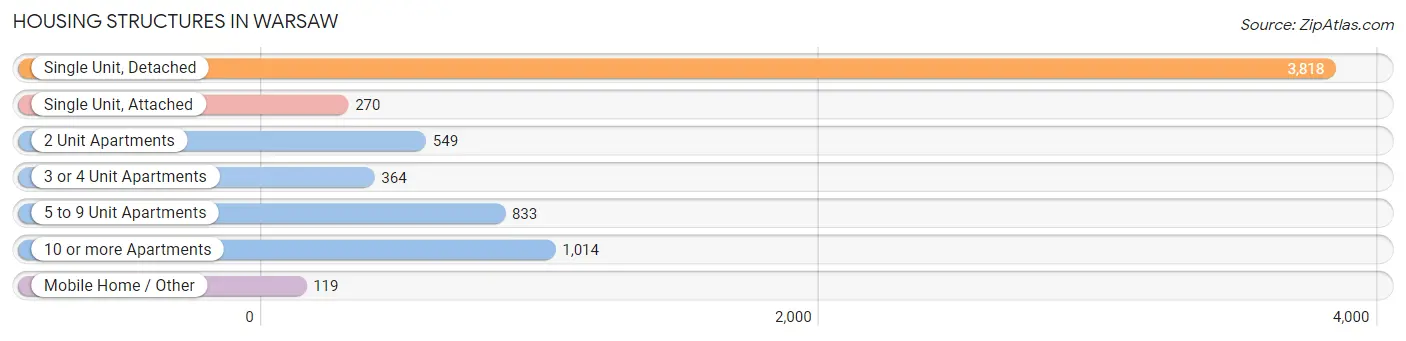
| Structure Type | # Housing Units | % Housing Units |
| Single Unit, Detached | 3,818 | 54.8% |
| Single Unit, Attached | 270 | 3.9% |
| 2 Unit Apartments | 549 | 7.9% |
| 3 or 4 Unit Apartments | 364 | 5.2% |
| 5 to 9 Unit Apartments | 833 | 12.0% |
| 10 or more Apartments | 1,014 | 14.5% |
| Mobile Home / Other | 119 | 1.7% |
| Total | 6,967 | 100.0% |
Housing Structures by Occupancy in Warsaw
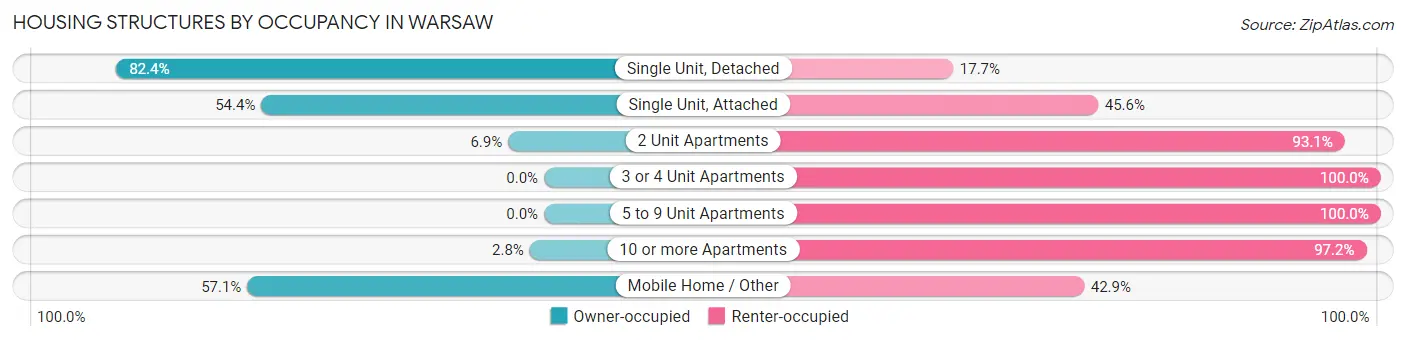
| Structure Type | Owner-occupied | Renter-occupied |
| Single Unit, Detached | 3,144 (82.4%) | 674 (17.6%) |
| Single Unit, Attached | 147 (54.4%) | 123 (45.6%) |
| 2 Unit Apartments | 38 (6.9%) | 511 (93.1%) |
| 3 or 4 Unit Apartments | 0 (0.0%) | 364 (100.0%) |
| 5 to 9 Unit Apartments | 0 (0.0%) | 833 (100.0%) |
| 10 or more Apartments | 28 (2.8%) | 986 (97.2%) |
| Mobile Home / Other | 68 (57.1%) | 51 (42.9%) |
| Total | 3,425 (49.2%) | 3,542 (50.8%) |
Housing Structures by Number of Rooms in Warsaw
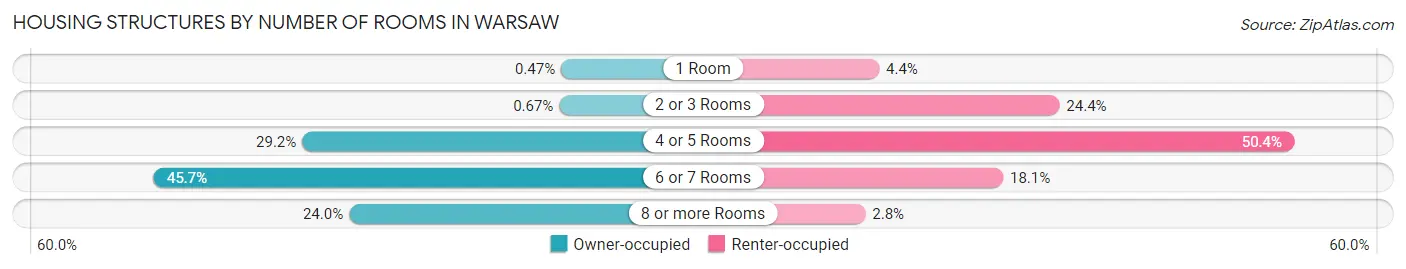
| Number of Rooms | Owner-occupied | Renter-occupied |
| 1 Room | 16 (0.5%) | 154 (4.3%) |
| 2 or 3 Rooms | 23 (0.7%) | 863 (24.4%) |
| 4 or 5 Rooms | 1,000 (29.2%) | 1,784 (50.4%) |
| 6 or 7 Rooms | 1,564 (45.7%) | 641 (18.1%) |
| 8 or more Rooms | 822 (24.0%) | 100 (2.8%) |
| Total | 3,425 (100.0%) | 3,542 (100.0%) |
Housing Structure by Heating Type in Warsaw
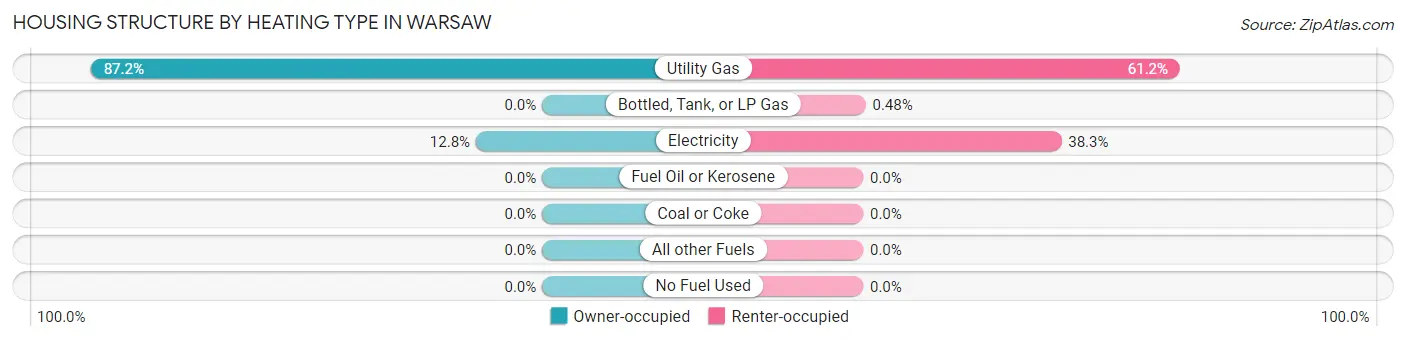
| Heating Type | Owner-occupied | Renter-occupied |
| Utility Gas | 2,987 (87.2%) | 2,168 (61.2%) |
| Bottled, Tank, or LP Gas | 0 (0.0%) | 17 (0.5%) |
| Electricity | 438 (12.8%) | 1,357 (38.3%) |
| Fuel Oil or Kerosene | 0 (0.0%) | 0 (0.0%) |
| Coal or Coke | 0 (0.0%) | 0 (0.0%) |
| All other Fuels | 0 (0.0%) | 0 (0.0%) |
| No Fuel Used | 0 (0.0%) | 0 (0.0%) |
| Total | 3,425 (100.0%) | 3,542 (100.0%) |
Household Vehicle Usage in Warsaw
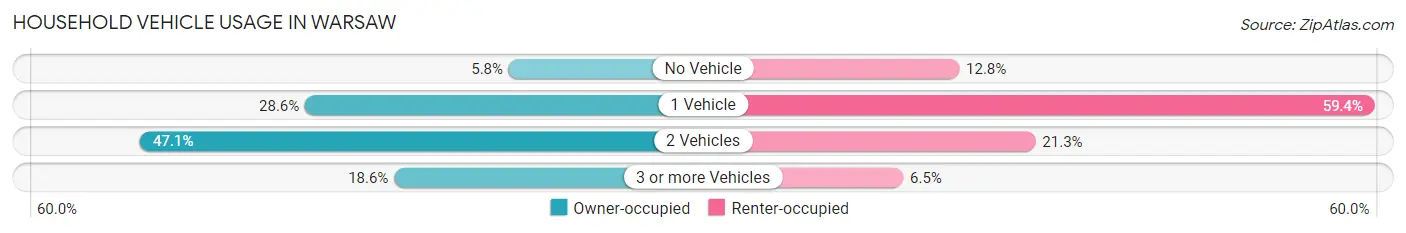
| Vehicles per Household | Owner-occupied | Renter-occupied |
| No Vehicle | 197 (5.8%) | 453 (12.8%) |
| 1 Vehicle | 979 (28.6%) | 2,102 (59.4%) |
| 2 Vehicles | 1,612 (47.1%) | 756 (21.3%) |
| 3 or more Vehicles | 637 (18.6%) | 231 (6.5%) |
| Total | 3,425 (100.0%) | 3,542 (100.0%) |
Real Estate & Mortgages in Warsaw
Real Estate and Mortgage Overview in Warsaw
| Characteristic | Without Mortgage | With Mortgage |
| Housing Units | 1,124 | 2,301 |
| Median Property Value | $141,800 | $170,200 |
| Median Household Income | $73,750 | $233 |
| Monthly Housing Costs | $449 | $16 |
| Real Estate Taxes | $1,233 | $160 |
Property Value by Mortgage Status in Warsaw
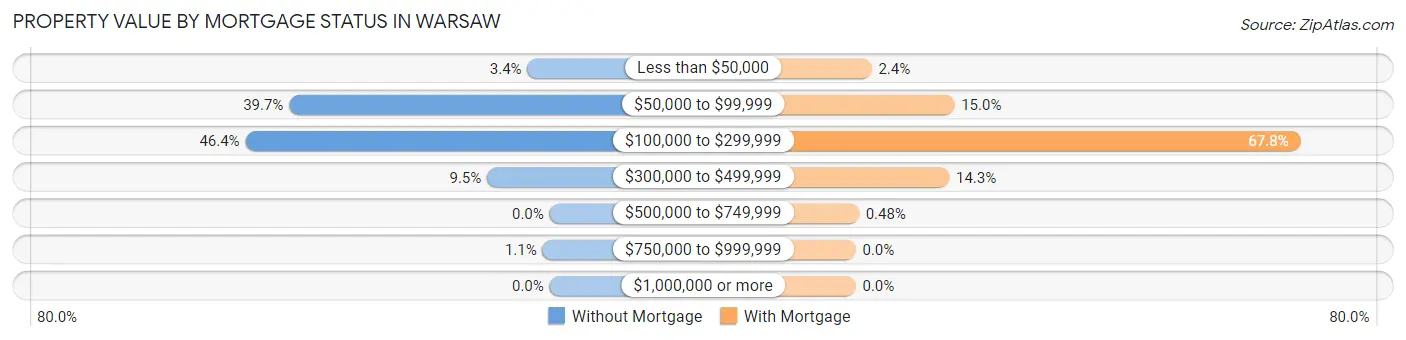
| Property Value | Without Mortgage | With Mortgage |
| Less than $50,000 | 38 (3.4%) | 56 (2.4%) |
| $50,000 to $99,999 | 446 (39.7%) | 346 (15.0%) |
| $100,000 to $299,999 | 521 (46.4%) | 1,560 (67.8%) |
| $300,000 to $499,999 | 107 (9.5%) | 328 (14.2%) |
| $500,000 to $749,999 | 0 (0.0%) | 11 (0.5%) |
| $750,000 to $999,999 | 12 (1.1%) | 0 (0.0%) |
| $1,000,000 or more | 0 (0.0%) | 0 (0.0%) |
| Total | 1,124 (100.0%) | 2,301 (100.0%) |
Household Income by Mortgage Status in Warsaw
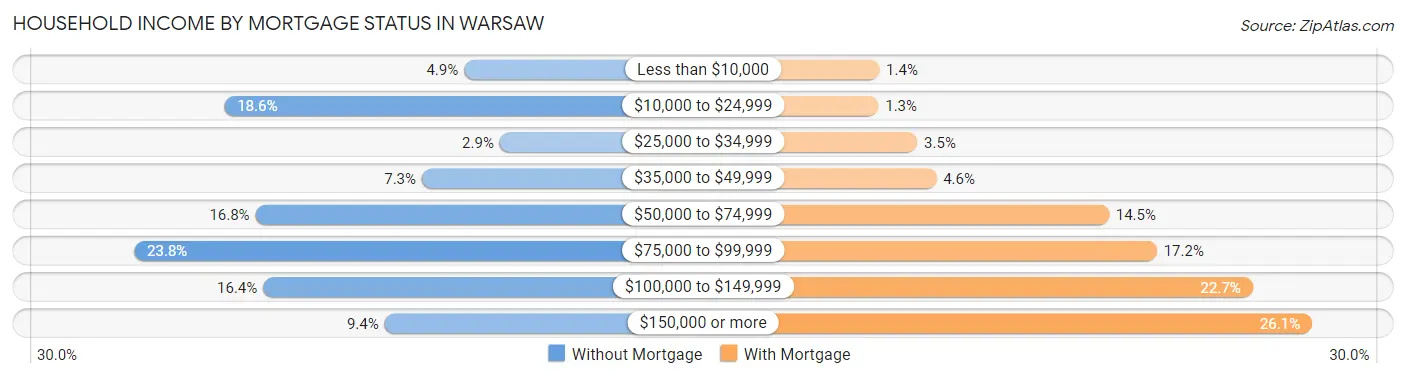
| Household Income | Without Mortgage | With Mortgage |
| Less than $10,000 | 55 (4.9%) | 31 (1.3%) |
| $10,000 to $24,999 | 209 (18.6%) | 30 (1.3%) |
| $25,000 to $34,999 | 32 (2.9%) | 81 (3.5%) |
| $35,000 to $49,999 | 82 (7.3%) | 106 (4.6%) |
| $50,000 to $74,999 | 189 (16.8%) | 333 (14.5%) |
| $75,000 to $99,999 | 267 (23.7%) | 396 (17.2%) |
| $100,000 to $149,999 | 184 (16.4%) | 522 (22.7%) |
| $150,000 or more | 106 (9.4%) | 600 (26.1%) |
| Total | 1,124 (100.0%) | 2,301 (100.0%) |
Property Value to Household Income Ratio in Warsaw
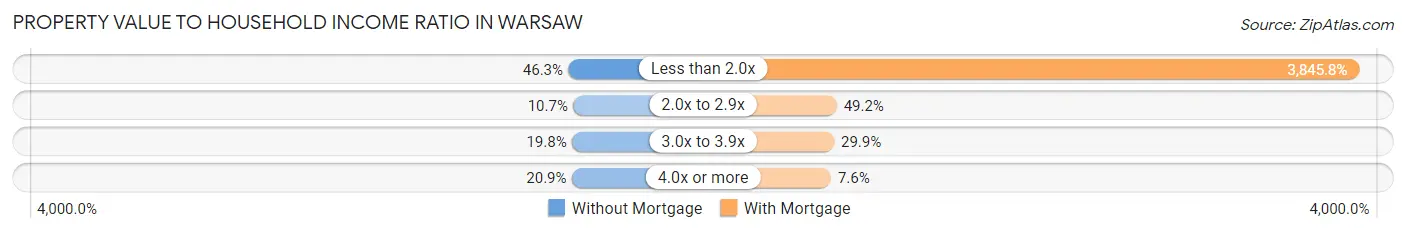
| Value-to-Income Ratio | Without Mortgage | With Mortgage |
| Less than 2.0x | 520 (46.3%) | 88,492 (3,845.8%) |
| 2.0x to 2.9x | 120 (10.7%) | 1,132 (49.2%) |
| 3.0x to 3.9x | 223 (19.8%) | 687 (29.9%) |
| 4.0x or more | 235 (20.9%) | 174 (7.6%) |
| Total | 1,124 (100.0%) | 2,301 (100.0%) |
Real Estate Taxes by Mortgage Status in Warsaw
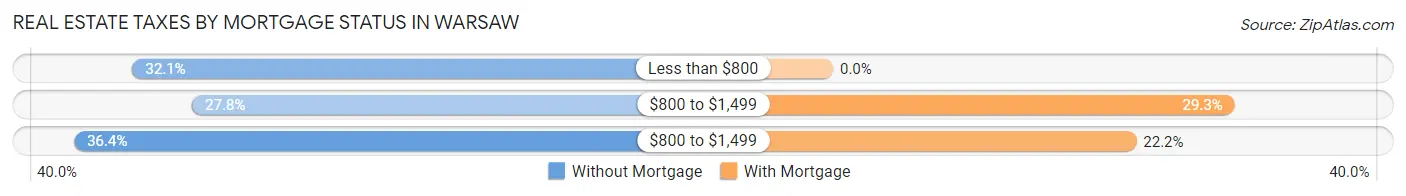
| Property Taxes | Without Mortgage | With Mortgage |
| Less than $800 | 361 (32.1%) | 0 (0.0%) |
| $800 to $1,499 | 312 (27.8%) | 675 (29.3%) |
| $800 to $1,499 | 409 (36.4%) | 510 (22.2%) |
| Total | 1,124 (100.0%) | 2,301 (100.0%) |
Health & Disability in Warsaw
Health Insurance Coverage by Age in Warsaw
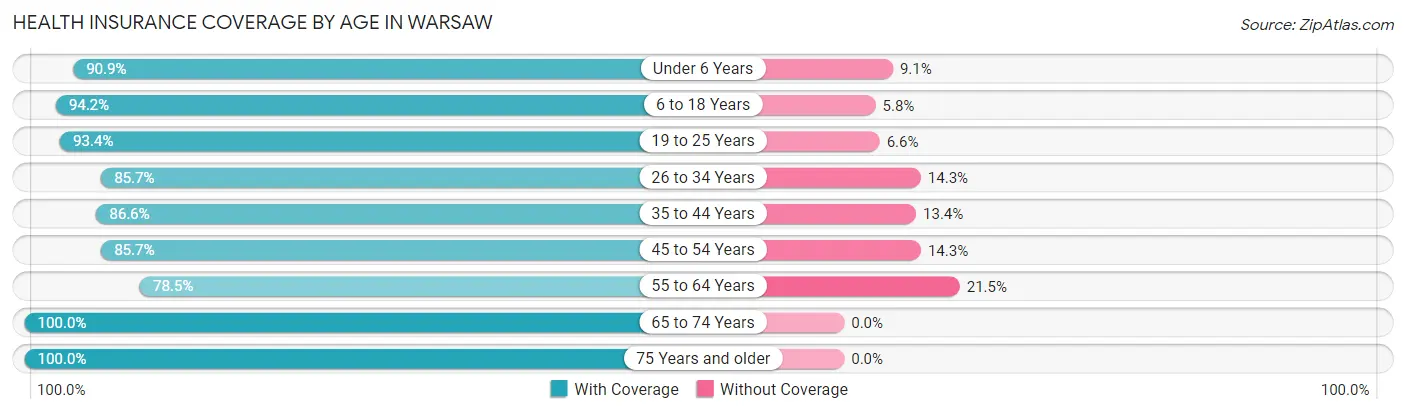
| Age Bracket | With Coverage | Without Coverage |
| Under 6 Years | 1,243 (90.9%) | 124 (9.1%) |
| 6 to 18 Years | 2,497 (94.2%) | 155 (5.8%) |
| 19 to 25 Years | 1,767 (93.4%) | 125 (6.6%) |
| 26 to 34 Years | 2,094 (85.7%) | 349 (14.3%) |
| 35 to 44 Years | 1,785 (86.6%) | 276 (13.4%) |
| 45 to 54 Years | 1,277 (85.7%) | 213 (14.3%) |
| 55 to 64 Years | 1,555 (78.5%) | 427 (21.5%) |
| 65 to 74 Years | 1,451 (100.0%) | 0 (0.0%) |
| 75 Years and older | 710 (100.0%) | 0 (0.0%) |
| Total | 14,379 (89.6%) | 1,669 (10.4%) |
Health Insurance Coverage by Citizenship Status in Warsaw
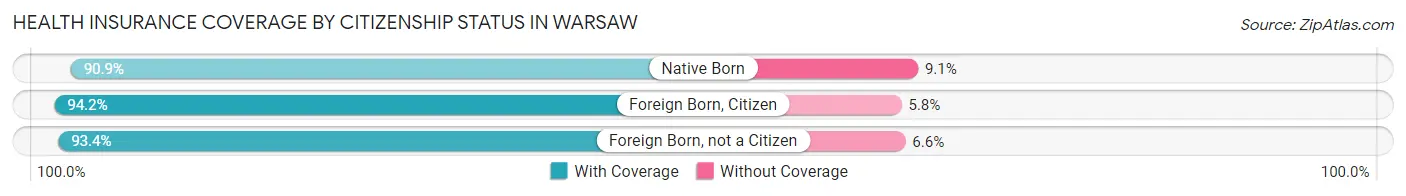
| Citizenship Status | With Coverage | Without Coverage |
| Native Born | 1,243 (90.9%) | 124 (9.1%) |
| Foreign Born, Citizen | 2,497 (94.2%) | 155 (5.8%) |
| Foreign Born, not a Citizen | 1,767 (93.4%) | 125 (6.6%) |
Health Insurance Coverage by Household Income in Warsaw
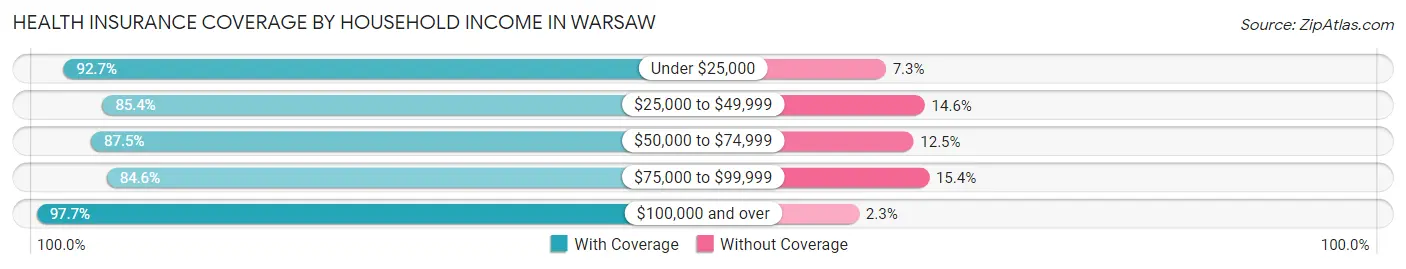
| Household Income | With Coverage | Without Coverage |
| Under $25,000 | 1,967 (92.7%) | 155 (7.3%) |
| $25,000 to $49,999 | 2,992 (85.4%) | 511 (14.6%) |
| $50,000 to $74,999 | 2,233 (87.5%) | 318 (12.5%) |
| $75,000 to $99,999 | 3,273 (84.6%) | 596 (15.4%) |
| $100,000 and over | 3,836 (97.7%) | 89 (2.3%) |
Public vs Private Health Insurance Coverage by Age in Warsaw
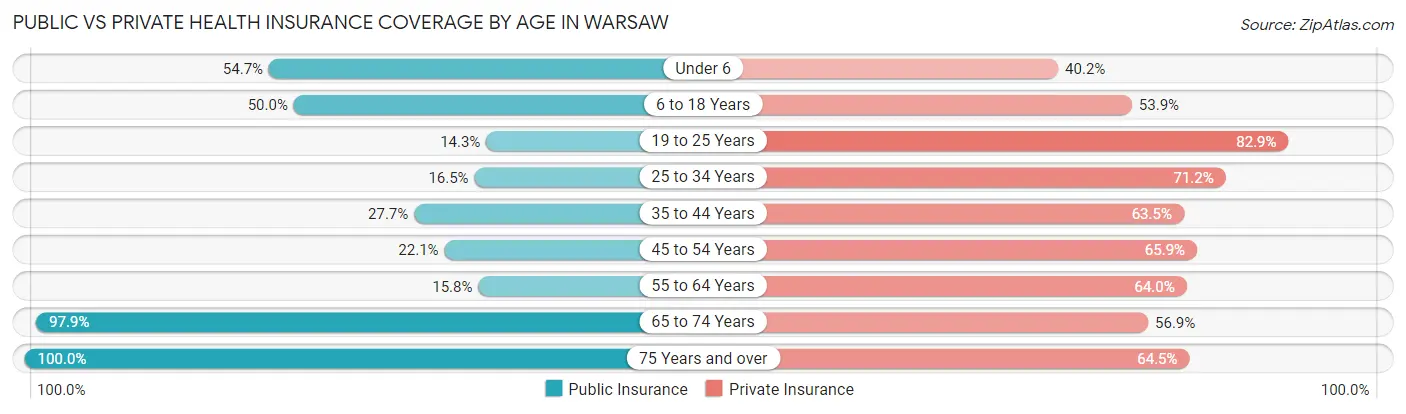
| Age Bracket | Public Insurance | Private Insurance |
| Under 6 | 747 (54.6%) | 549 (40.2%) |
| 6 to 18 Years | 1,327 (50.0%) | 1,428 (53.8%) |
| 19 to 25 Years | 271 (14.3%) | 1,568 (82.9%) |
| 25 to 34 Years | 403 (16.5%) | 1,740 (71.2%) |
| 35 to 44 Years | 571 (27.7%) | 1,308 (63.5%) |
| 45 to 54 Years | 329 (22.1%) | 982 (65.9%) |
| 55 to 64 Years | 313 (15.8%) | 1,268 (64.0%) |
| 65 to 74 Years | 1,420 (97.9%) | 825 (56.9%) |
| 75 Years and over | 710 (100.0%) | 458 (64.5%) |
| Total | 6,091 (38.0%) | 10,126 (63.1%) |
Disability Status by Sex by Age in Warsaw
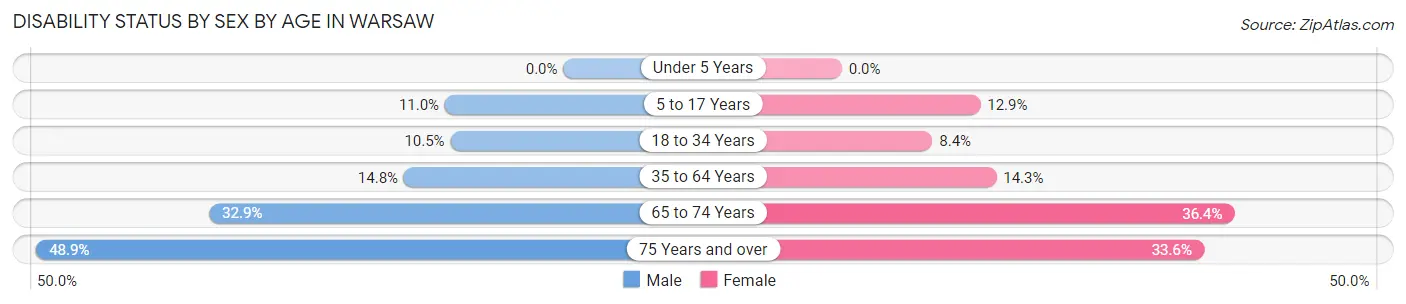
| Age Bracket | Male | Female |
| Under 5 Years | 0 (0.0%) | 0 (0.0%) |
| 5 to 17 Years | 141 (11.0%) | 174 (12.9%) |
| 18 to 34 Years | 239 (10.5%) | 188 (8.4%) |
| 35 to 64 Years | 402 (14.8%) | 404 (14.3%) |
| 65 to 74 Years | 282 (32.9%) | 216 (36.4%) |
| 75 Years and over | 91 (48.9%) | 176 (33.6%) |
Disability Class by Sex by Age in Warsaw
Disability Class: Hearing Difficulty
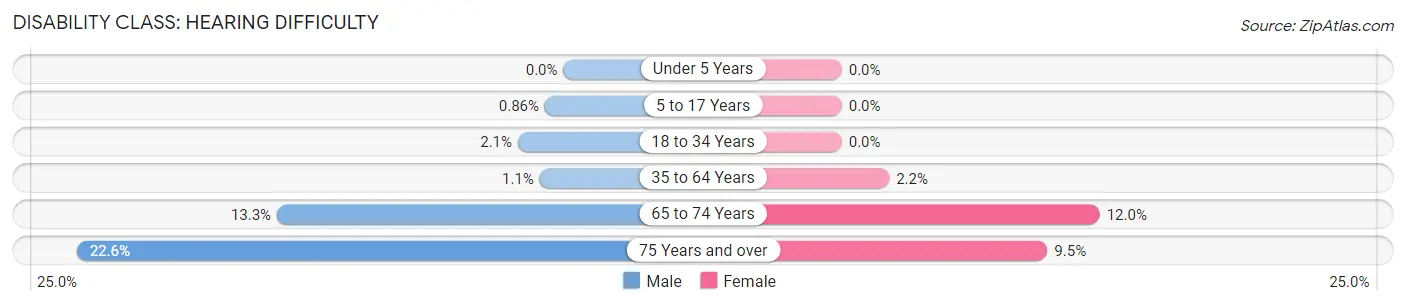
| Age Bracket | Male | Female |
| Under 5 Years | 0 (0.0%) | 0 (0.0%) |
| 5 to 17 Years | 11 (0.9%) | 0 (0.0%) |
| 18 to 34 Years | 48 (2.1%) | 0 (0.0%) |
| 35 to 64 Years | 30 (1.1%) | 62 (2.2%) |
| 65 to 74 Years | 114 (13.3%) | 71 (12.0%) |
| 75 Years and over | 42 (22.6%) | 50 (9.5%) |
Disability Class: Vision Difficulty
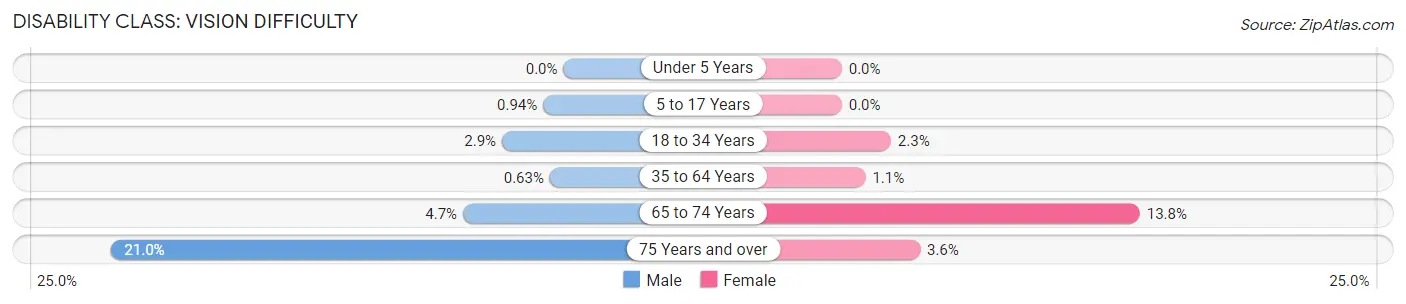
| Age Bracket | Male | Female |
| Under 5 Years | 0 (0.0%) | 0 (0.0%) |
| 5 to 17 Years | 12 (0.9%) | 0 (0.0%) |
| 18 to 34 Years | 65 (2.9%) | 51 (2.3%) |
| 35 to 64 Years | 17 (0.6%) | 31 (1.1%) |
| 65 to 74 Years | 40 (4.7%) | 82 (13.8%) |
| 75 Years and over | 39 (21.0%) | 19 (3.6%) |
Disability Class: Cognitive Difficulty
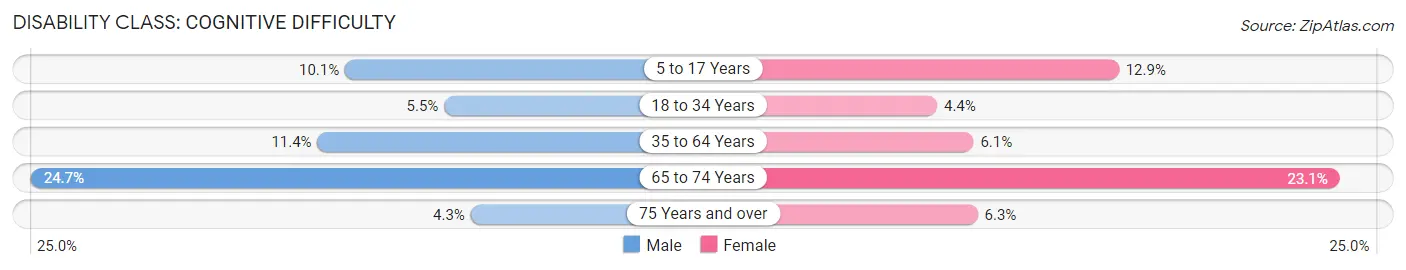
| Age Bracket | Male | Female |
| 5 to 17 Years | 130 (10.1%) | 174 (12.9%) |
| 18 to 34 Years | 126 (5.5%) | 99 (4.4%) |
| 35 to 64 Years | 310 (11.4%) | 172 (6.1%) |
| 65 to 74 Years | 212 (24.7%) | 137 (23.1%) |
| 75 Years and over | 8 (4.3%) | 33 (6.3%) |
Disability Class: Ambulatory Difficulty
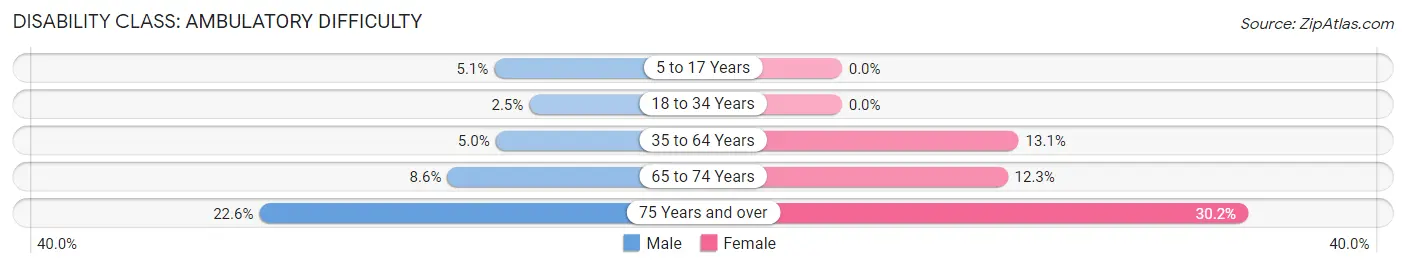
| Age Bracket | Male | Female |
| 5 to 17 Years | 66 (5.1%) | 0 (0.0%) |
| 18 to 34 Years | 58 (2.5%) | 0 (0.0%) |
| 35 to 64 Years | 137 (5.0%) | 370 (13.1%) |
| 65 to 74 Years | 74 (8.6%) | 73 (12.3%) |
| 75 Years and over | 42 (22.6%) | 158 (30.1%) |
Disability Class: Self-Care Difficulty
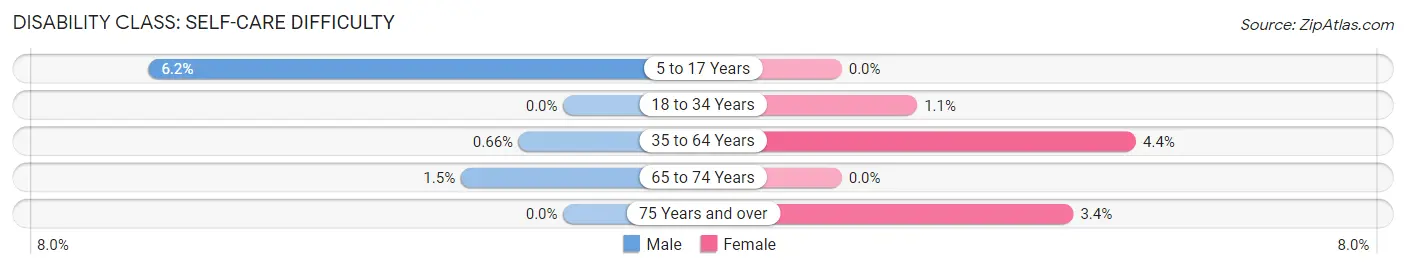
| Age Bracket | Male | Female |
| 5 to 17 Years | 79 (6.2%) | 0 (0.0%) |
| 18 to 34 Years | 0 (0.0%) | 25 (1.1%) |
| 35 to 64 Years | 18 (0.7%) | 123 (4.4%) |
| 65 to 74 Years | 13 (1.5%) | 0 (0.0%) |
| 75 Years and over | 0 (0.0%) | 18 (3.4%) |
Technology Access in Warsaw
Computing Device Access in Warsaw
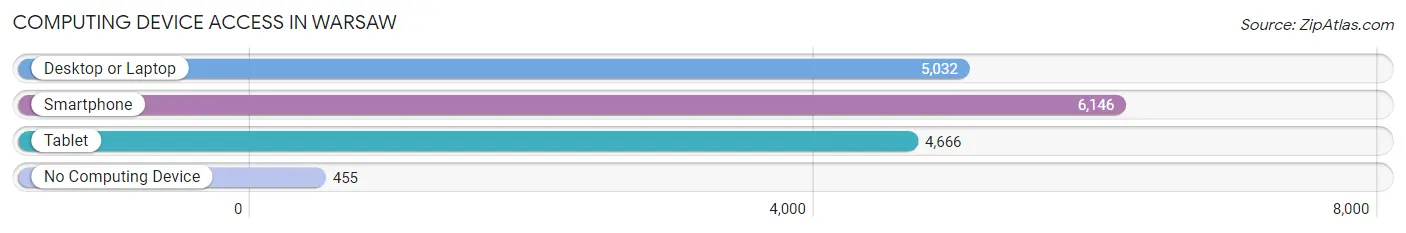
| Device Type | # Households | % Households |
| Desktop or Laptop | 5,032 | 72.2% |
| Smartphone | 6,146 | 88.2% |
| Tablet | 4,666 | 67.0% |
| No Computing Device | 455 | 6.5% |
| Total | 6,967 | 100.0% |
Internet Access in Warsaw
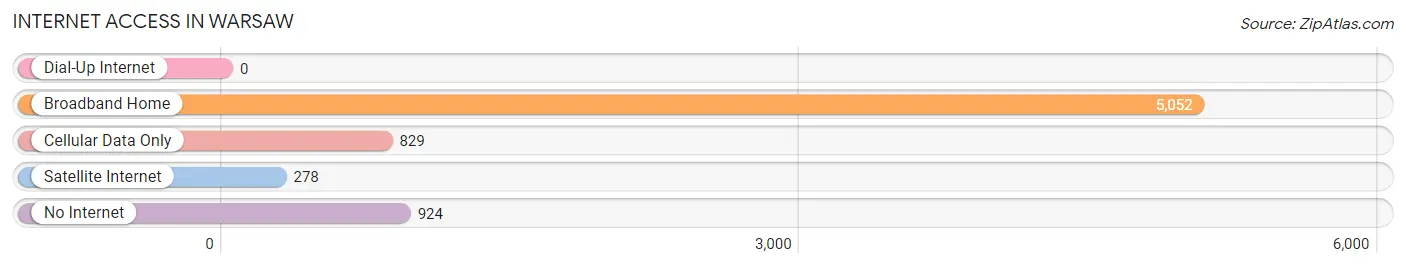
| Internet Type | # Households | % Households |
| Dial-Up Internet | 0 | 0.0% |
| Broadband Home | 5,052 | 72.5% |
| Cellular Data Only | 829 | 11.9% |
| Satellite Internet | 278 | 4.0% |
| No Internet | 924 | 13.3% |
| Total | 6,967 | 100.0% |
Warsaw Summary
Warsaw, Indiana is a city located in the northern part of the state, in Kosciusko County. It is the county seat and the largest city in the county. The city is located on the banks of the Tippecanoe River and is home to a population of over 13,000 people.
History
The area that is now Warsaw was first settled in 1836 by a group of settlers from Ohio. The settlement was originally called “Hog Hill”, but was later renamed “Warsaw” after the capital of Poland. The city was officially incorporated in 1854.
In the late 19th century, Warsaw was a major center for the production of furniture and other wood products. The city was also home to several large manufacturing companies, including the Warsaw Chair Company, the Warsaw Furniture Company, and the Warsaw Manufacturing Company.
In the early 20th century, Warsaw was a major center for the production of automobiles. The city was home to the Studebaker Corporation, which produced cars from 1902 to 1963. The city was also home to the Reo Motor Company, which produced cars from 1904 to 1936.
Geography
Warsaw is located in the northern part of Indiana, in Kosciusko County. The city is situated on the banks of the Tippecanoe River, and is surrounded by rolling hills and farmland. The city is located approximately 60 miles north of Indianapolis and 90 miles south of Chicago.
The climate in Warsaw is humid continental, with hot summers and cold winters. The average temperature in the summer is around 75 degrees Fahrenheit, and the average temperature in the winter is around 25 degrees Fahrenheit.
Economy
The economy of Warsaw is largely based on manufacturing and agriculture. The city is home to several large manufacturing companies, including Zimmer Biomet, a medical device manufacturer, and DePuy Synthes, a medical device manufacturer. The city is also home to several agricultural companies, including the Warsaw Grain Company and the Warsaw Feed Company.
The city is also home to several retail stores, including Walmart, Target, and Kohl’s. The city is also home to several restaurants, including Applebee’s, Olive Garden, and Red Lobster.
Demographics
As of the 2010 census, the population of Warsaw was 13,559. The racial makeup of the city was 94.3% White, 1.2% African American, 0.3% Native American, 0.7% Asian, 0.1% Pacific Islander, 1.7% from other races, and 1.9% from two or more races. Hispanic or Latino of any race were 4.2% of the population.
The median household income in Warsaw was $41,945, and the median family income was $50,945. The per capita income in the city was $20,945. About 11.2% of families and 14.2% of the population were below the poverty line, including 19.2% of those under age 18 and 8.2% of those age 65 or over.
Common Questions
What is Per Capita Income in Warsaw?
Per Capita income in Warsaw is $29,741.
What is the Median Family Income in Warsaw?
Median Family Income in Warsaw is $76,195.
What is the Median Household income in Warsaw?
Median Household Income in Warsaw is $57,931.
What is Income or Wage Gap in Warsaw?
Income or Wage Gap in Warsaw is 43.6%.
Women in Warsaw earn 56.4 cents for every dollar earned by a man.
What is Family Income Deficit in Warsaw?
Family Income Deficit in Warsaw is $10,849.
Families that are below poverty line in Warsaw earn $10,849 less on average than the poverty threshold level.
What is Inequality or Gini Index in Warsaw?
Inequality or Gini Index in Warsaw is 0.40.
What is the Total Population of Warsaw?
Total Population of Warsaw is 16,473.
What is the Total Male Population of Warsaw?
Total Male Population of Warsaw is 8,122.
What is the Total Female Population of Warsaw?
Total Female Population of Warsaw is 8,351.
What is the Ratio of Males per 100 Females in Warsaw?
There are 97.26 Males per 100 Females in Warsaw.
What is the Ratio of Females per 100 Males in Warsaw?
There are 102.82 Females per 100 Males in Warsaw.
What is the Median Population Age in Warsaw?
Median Population Age in Warsaw is 33.1 Years.
What is the Average Family Size in Warsaw
Average Family Size in Warsaw is 3.0 People.
What is the Average Household Size in Warsaw
Average Household Size in Warsaw is 2.3 People.
How Large is the Labor Force in Warsaw?
There are 8,761 People in the Labor Forcein in Warsaw.
What is the Percentage of People in the Labor Force in Warsaw?
65.9% of People are in the Labor Force in Warsaw.
What is the Unemployment Rate in Warsaw?
Unemployment Rate in Warsaw is 3.2%.