Walkerton, IN Map & Demographics
Walkerton Map
Walkerton Overview
$25,735
PER CAPITA INCOME
$66,484
AVG FAMILY INCOME
$58,553
AVG HOUSEHOLD INCOME
44.0%
WAGE / INCOME GAP [ % ]
56.0¢/ $1
WAGE / INCOME GAP [ $ ]
0.35
INEQUALITY / GINI INDEX
2,022
TOTAL POPULATION
887
MALE POPULATION
1,135
FEMALE POPULATION
78.15
MALES / 100 FEMALES
127.96
FEMALES / 100 MALES
34.4
MEDIAN AGE
3.2
AVG FAMILY SIZE
2.6
AVG HOUSEHOLD SIZE
961
LABOR FORCE [ PEOPLE ]
61.2%
PERCENT IN LABOR FORCE
4.0%
UNEMPLOYMENT RATE
Walkerton Zip Codes
Walkerton Area Codes
Income in Walkerton
Income Overview in Walkerton
Per Capita Income in Walkerton is $25,735, while median incomes of families and households are $66,484 and $58,553 respectively.
| Characteristic | Number | Measure |
| Per Capita Income | 2,022 | $25,735 |
| Median Family Income | 485 | $66,484 |
| Mean Family Income | 485 | $76,046 |
| Median Household Income | 754 | $58,553 |
| Mean Household Income | 754 | $66,055 |
| Income Deficit | 485 | $0 |
| Wage / Income Gap (%) | 2,022 | 43.98% |
| Wage / Income Gap ($) | 2,022 | 56.02¢ per $1 |
| Gini / Inequality Index | 2,022 | 0.35 |
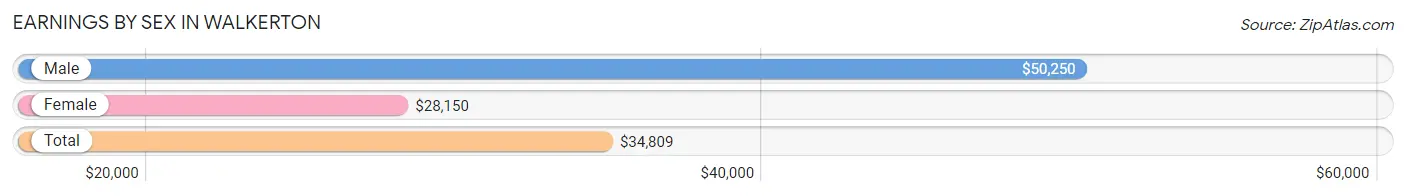
Earnings by Sex in Walkerton
Average Earnings in Walkerton are $34,809, $50,250 for men and $28,150 for women, a difference of 44.0%.
| Sex | Number | Average Earnings |
| Male | 480 (47.7%) | $50,250 |
| Female | 527 (52.3%) | $28,150 |
| Total | 1,007 (100.0%) | $34,809 |
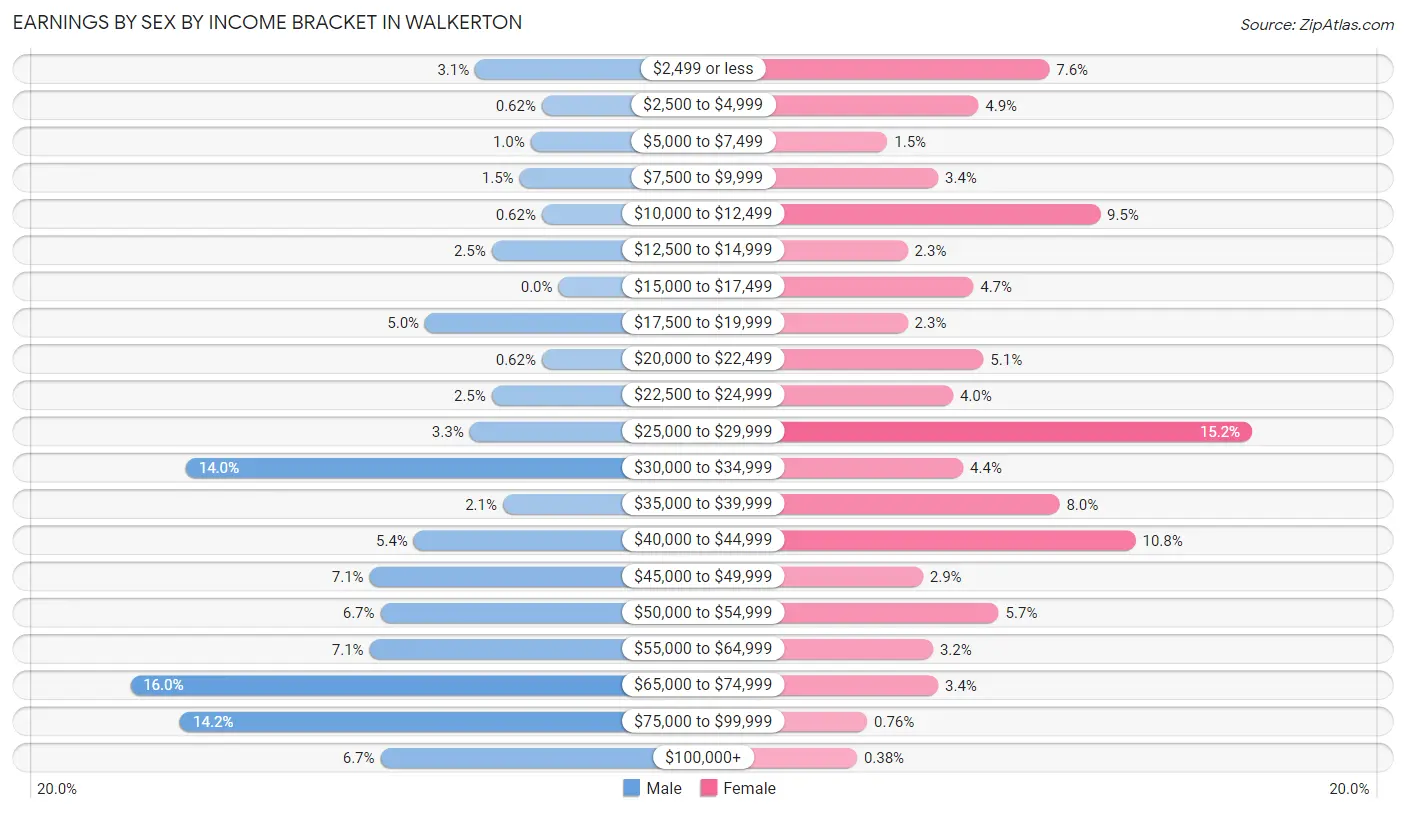
Earnings by Sex by Income Bracket in Walkerton
The most common earnings brackets in Walkerton are $65,000 to $74,999 for men (77 | 16.0%) and $25,000 to $29,999 for women (80 | 15.2%).
| Income | Male | Female |
| $2,499 or less | 15 (3.1%) | 40 (7.6%) |
| $2,500 to $4,999 | 3 (0.6%) | 26 (4.9%) |
| $5,000 to $7,499 | 5 (1.0%) | 8 (1.5%) |
| $7,500 to $9,999 | 7 (1.5%) | 18 (3.4%) |
| $10,000 to $12,499 | 3 (0.6%) | 50 (9.5%) |
| $12,500 to $14,999 | 12 (2.5%) | 12 (2.3%) |
| $15,000 to $17,499 | 0 (0.0%) | 25 (4.7%) |
| $17,500 to $19,999 | 24 (5.0%) | 12 (2.3%) |
| $20,000 to $22,499 | 3 (0.6%) | 27 (5.1%) |
| $22,500 to $24,999 | 12 (2.5%) | 21 (4.0%) |
| $25,000 to $29,999 | 16 (3.3%) | 80 (15.2%) |
| $30,000 to $34,999 | 67 (14.0%) | 23 (4.4%) |
| $35,000 to $39,999 | 10 (2.1%) | 42 (8.0%) |
| $40,000 to $44,999 | 26 (5.4%) | 57 (10.8%) |
| $45,000 to $49,999 | 34 (7.1%) | 15 (2.9%) |
| $50,000 to $54,999 | 32 (6.7%) | 30 (5.7%) |
| $55,000 to $64,999 | 34 (7.1%) | 17 (3.2%) |
| $65,000 to $74,999 | 77 (16.0%) | 18 (3.4%) |
| $75,000 to $99,999 | 68 (14.2%) | 4 (0.8%) |
| $100,000+ | 32 (6.7%) | 2 (0.4%) |
| Total | 480 (100.0%) | 527 (100.0%) |
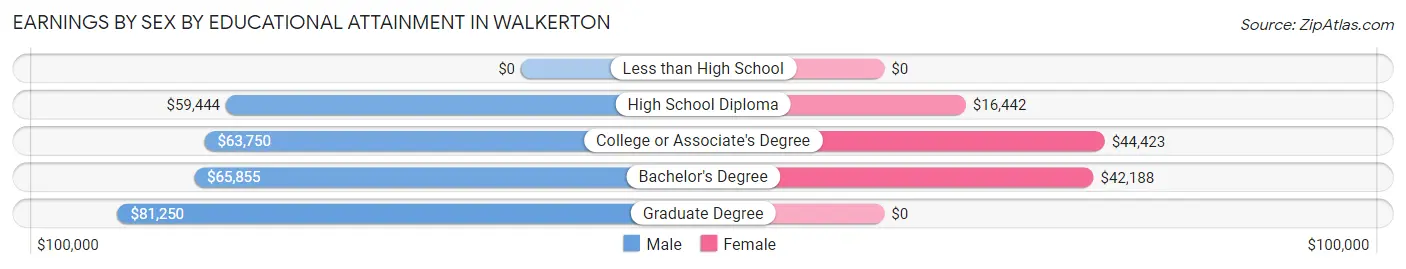
Earnings by Sex by Educational Attainment in Walkerton
Average earnings in Walkerton are $61,316 for men and $29,931 for women, a difference of 51.2%. Men with an educational attainment of graduate degree enjoy the highest average annual earnings of $81,250, while those with high school diploma education earn the least with $59,444. Women with an educational attainment of college or associate's degree earn the most with the average annual earnings of $44,423, while those with high school diploma education have the smallest earnings of $16,442.
| Educational Attainment | Male Income | Female Income |
| Less than High School | - | - |
| High School Diploma | $59,444 | $16,442 |
| College or Associate's Degree | $63,750 | $44,423 |
| Bachelor's Degree | $65,855 | $42,188 |
| Graduate Degree | $81,250 | $0 |
| Total | $61,316 | $29,931 |
Family Income in Walkerton
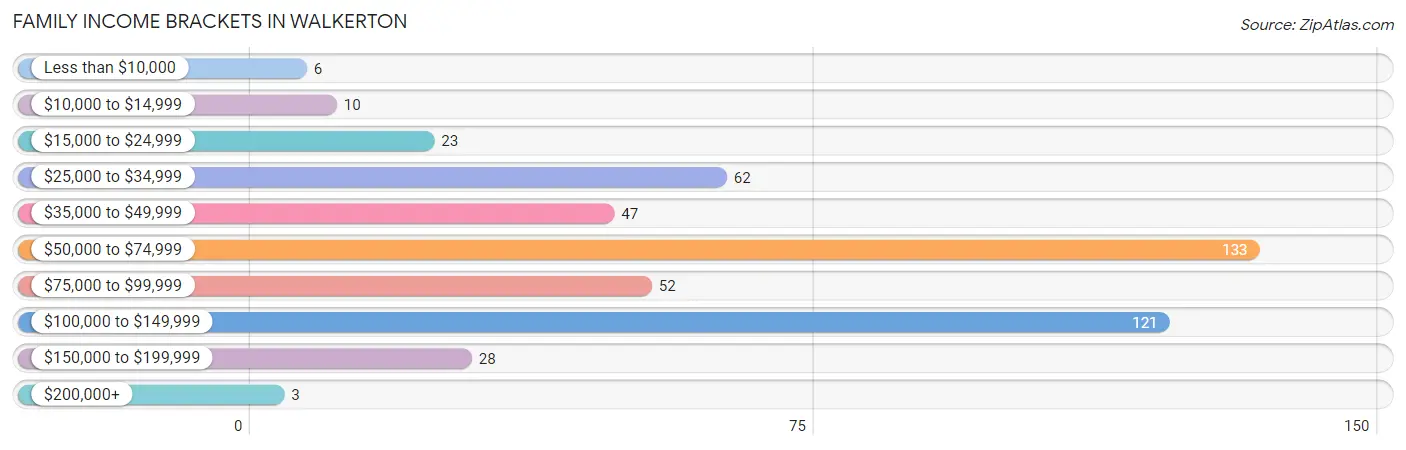
Family Income Brackets in Walkerton
According to the Walkerton family income data, there are 133 families falling into the $50,000 to $74,999 income range, which is the most common income bracket and makes up 27.4% of all families. Conversely, the $200,000+ income bracket is the least frequent group with only 3 families (0.6%) belonging to this category.
| Income Bracket | # Families | % Families |
| Less than $10,000 | 6 | 1.2% |
| $10,000 to $14,999 | 10 | 2.1% |
| $15,000 to $24,999 | 23 | 4.7% |
| $25,000 to $34,999 | 62 | 12.8% |
| $35,000 to $49,999 | 47 | 9.7% |
| $50,000 to $74,999 | 133 | 27.4% |
| $75,000 to $99,999 | 52 | 10.7% |
| $100,000 to $149,999 | 121 | 24.9% |
| $150,000 to $199,999 | 28 | 5.8% |
| $200,000+ | 3 | 0.6% |
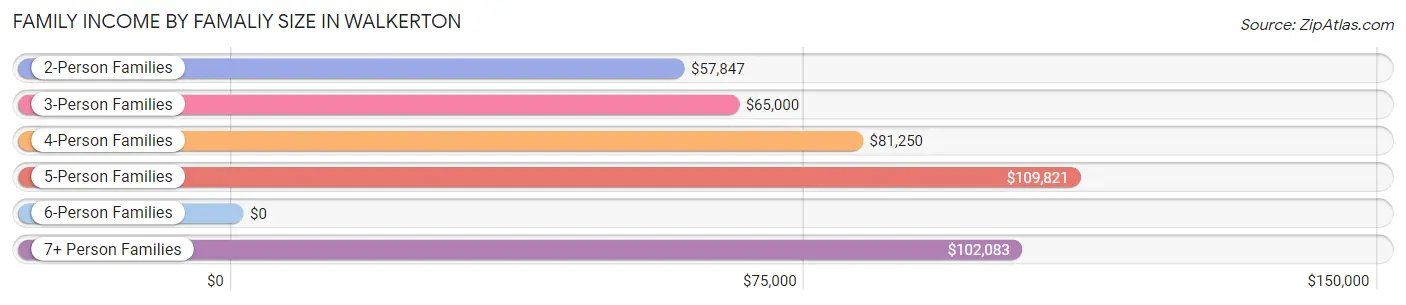
Family Income by Famaliy Size in Walkerton
5-person families (45 | 9.3%) account for the highest median family income in Walkerton with $109,821 per family, while 2-person families (213 | 43.9%) have the highest median income of $28,924 per family member.
| Income Bracket | # Families | Median Income |
| 2-Person Families | 213 (43.9%) | $57,847 |
| 3-Person Families | 126 (26.0%) | $65,000 |
| 4-Person Families | 79 (16.3%) | $81,250 |
| 5-Person Families | 45 (9.3%) | $109,821 |
| 6-Person Families | 11 (2.3%) | $0 |
| 7+ Person Families | 11 (2.3%) | $102,083 |
| Total | 485 (100.0%) | $66,484 |
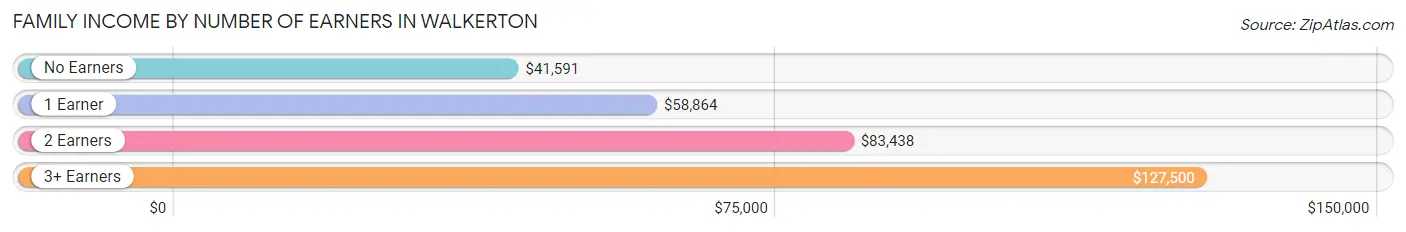
Family Income by Number of Earners in Walkerton
The median family income in Walkerton is $66,484, with families comprising 3+ earners (54) having the highest median family income of $127,500, while families with no earners (92) have the lowest median family income of $41,591, accounting for 11.1% and 19.0% of families, respectively.
| Number of Earners | # Families | Median Income |
| No Earners | 92 (19.0%) | $41,591 |
| 1 Earner | 186 (38.4%) | $58,864 |
| 2 Earners | 153 (31.6%) | $83,438 |
| 3+ Earners | 54 (11.1%) | $127,500 |
| Total | 485 (100.0%) | $66,484 |
Household Income in Walkerton
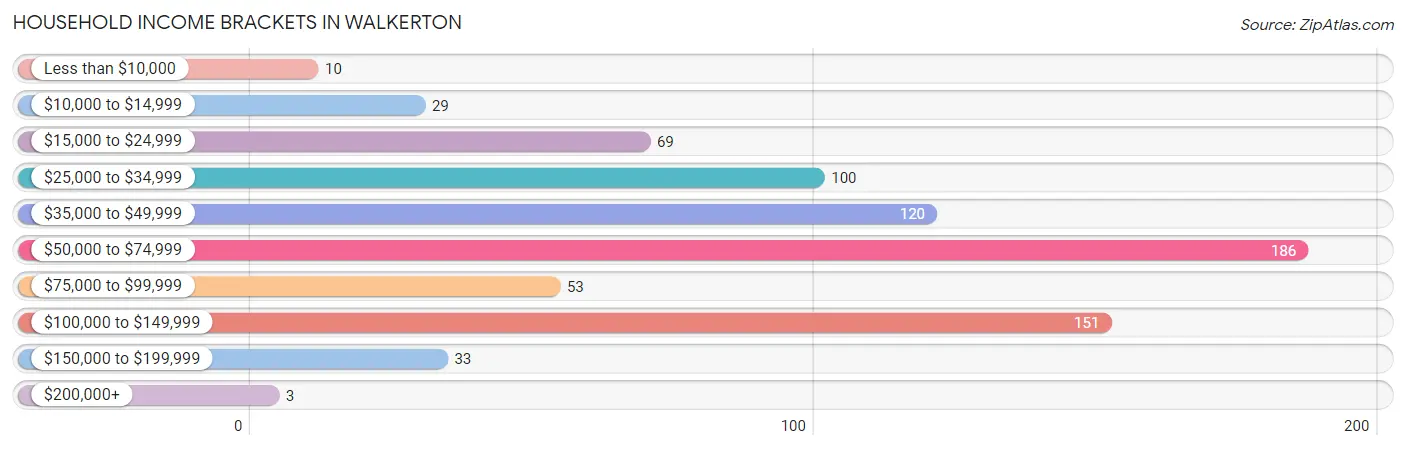
Household Income Brackets in Walkerton
With 186 households falling in the category, the $50,000 to $74,999 income range is the most frequent in Walkerton, accounting for 24.7% of all households. In contrast, only 3 households (0.4%) fall into the $200,000+ income bracket, making it the least populous group.
| Income Bracket | # Households | % Households |
| Less than $10,000 | 10 | 1.3% |
| $10,000 to $14,999 | 29 | 3.8% |
| $15,000 to $24,999 | 69 | 9.2% |
| $25,000 to $34,999 | 100 | 13.3% |
| $35,000 to $49,999 | 120 | 15.9% |
| $50,000 to $74,999 | 186 | 24.7% |
| $75,000 to $99,999 | 53 | 7.0% |
| $100,000 to $149,999 | 151 | 20.0% |
| $150,000 to $199,999 | 33 | 4.4% |
| $200,000+ | 3 | 0.4% |
Household Income by Householder Age in Walkerton
The median household income in Walkerton is $58,553, with the highest median household income of $74,688 found in the 25 to 44 years age bracket for the primary householder. A total of 223 households (29.6%) fall into this category. Meanwhile, the 65+ years age bracket for the primary householder has the lowest median household income of $38,068, with 209 households (27.7%) in this group.
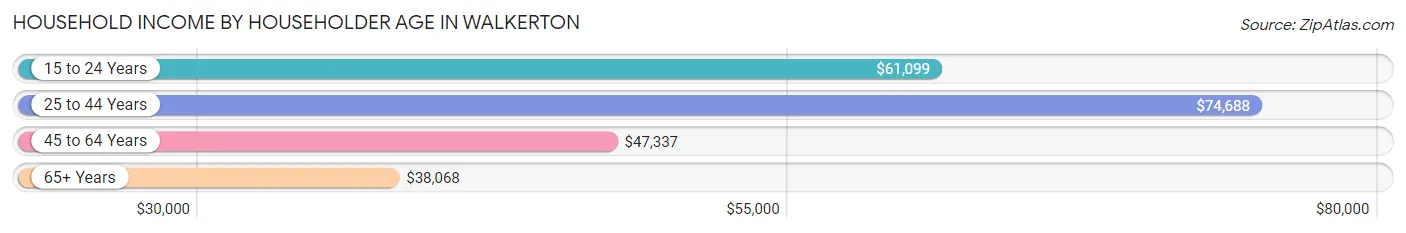
| Income Bracket | # Households | Median Income |
| 15 to 24 Years | 71 (9.4%) | $61,099 |
| 25 to 44 Years | 223 (29.6%) | $74,688 |
| 45 to 64 Years | 251 (33.3%) | $47,337 |
| 65+ Years | 209 (27.7%) | $38,068 |
| Total | 754 (100.0%) | $58,553 |
Poverty in Walkerton
Income Below Poverty by Sex and Age in Walkerton
With 4.0% poverty level for males and 6.3% for females among the residents of Walkerton, 12 to 14 year old males and 12 to 14 year old females are the most vulnerable to poverty, with 9 males (23.1%) and 4 females (26.7%) in their respective age groups living below the poverty level.
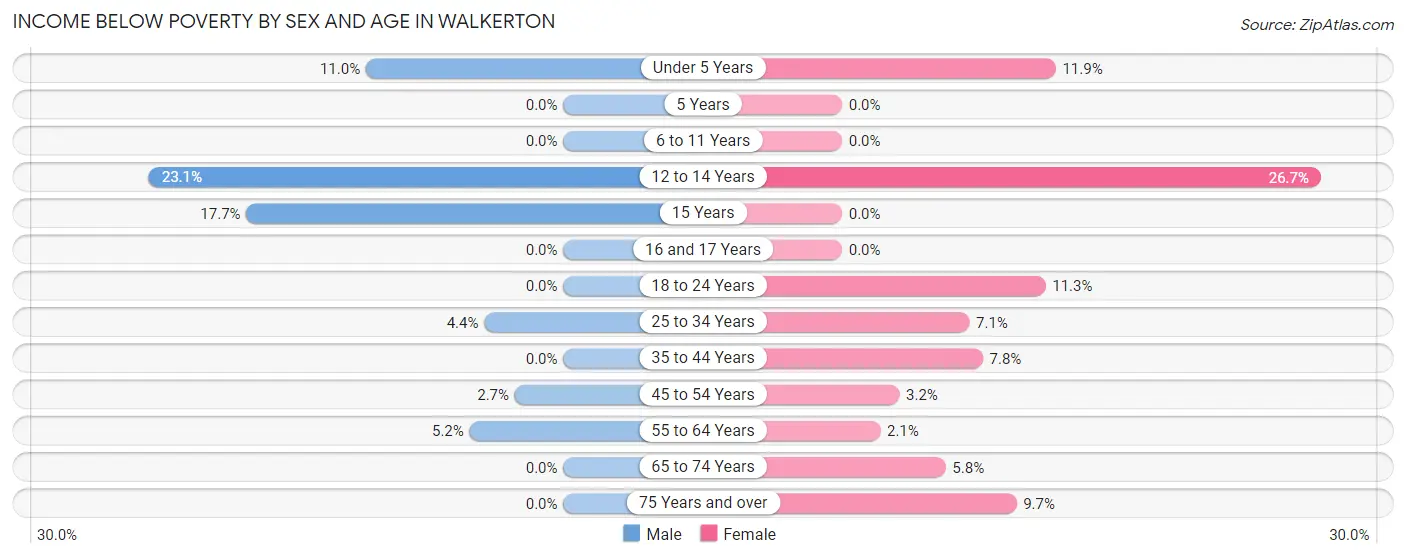
| Age Bracket | Male | Female |
| Under 5 Years | 10 (11.0%) | 10 (11.9%) |
| 5 Years | 0 (0.0%) | 0 (0.0%) |
| 6 to 11 Years | 0 (0.0%) | 0 (0.0%) |
| 12 to 14 Years | 9 (23.1%) | 4 (26.7%) |
| 15 Years | 3 (17.6%) | 0 (0.0%) |
| 16 and 17 Years | 0 (0.0%) | 0 (0.0%) |
| 18 to 24 Years | 0 (0.0%) | 17 (11.3%) |
| 25 to 34 Years | 4 (4.4%) | 10 (7.1%) |
| 35 to 44 Years | 0 (0.0%) | 8 (7.8%) |
| 45 to 54 Years | 3 (2.7%) | 3 (3.2%) |
| 55 to 64 Years | 6 (5.2%) | 3 (2.1%) |
| 65 to 74 Years | 0 (0.0%) | 3 (5.8%) |
| 75 Years and over | 0 (0.0%) | 10 (9.7%) |
| Total | 35 (4.0%) | 68 (6.3%) |
Income Above Poverty by Sex and Age in Walkerton
According to the poverty statistics in Walkerton, males aged 5 years and females aged 5 years are the age groups that are most secure financially, with 100.0% of males and 100.0% of females in these age groups living above the poverty line.
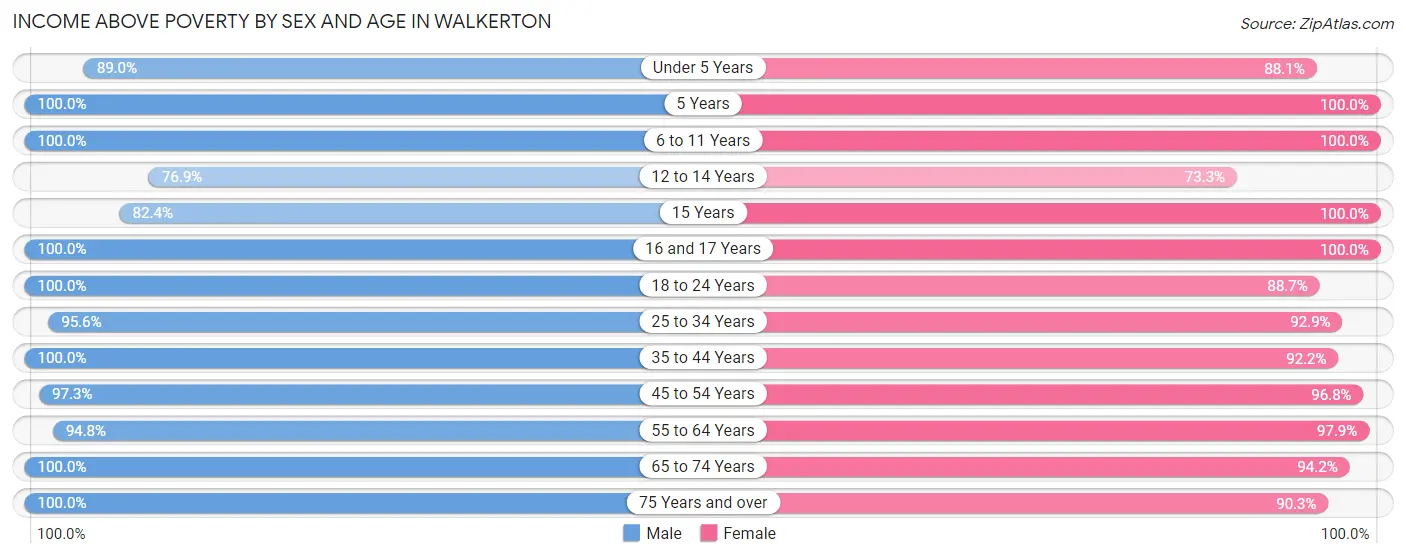
| Age Bracket | Male | Female |
| Under 5 Years | 81 (89.0%) | 74 (88.1%) |
| 5 Years | 8 (100.0%) | 21 (100.0%) |
| 6 to 11 Years | 58 (100.0%) | 106 (100.0%) |
| 12 to 14 Years | 30 (76.9%) | 11 (73.3%) |
| 15 Years | 14 (82.4%) | 12 (100.0%) |
| 16 and 17 Years | 33 (100.0%) | 55 (100.0%) |
| 18 to 24 Years | 105 (100.0%) | 133 (88.7%) |
| 25 to 34 Years | 87 (95.6%) | 131 (92.9%) |
| 35 to 44 Years | 92 (100.0%) | 94 (92.2%) |
| 45 to 54 Years | 108 (97.3%) | 91 (96.8%) |
| 55 to 64 Years | 109 (94.8%) | 138 (97.9%) |
| 65 to 74 Years | 81 (100.0%) | 49 (94.2%) |
| 75 Years and over | 42 (100.0%) | 93 (90.3%) |
| Total | 848 (96.0%) | 1,008 (93.7%) |
Income Below Poverty Among Married-Couple Families in Walkerton
The poverty statistics for married-couple families in Walkerton show that 0.9% or 3 of the total 316 families live below the poverty line. Families with no children have the highest poverty rate of 2.0%, comprising of 3 families. On the other hand, families with 1 or 2 children have the lowest poverty rate of 0.0%, which includes 0 families.
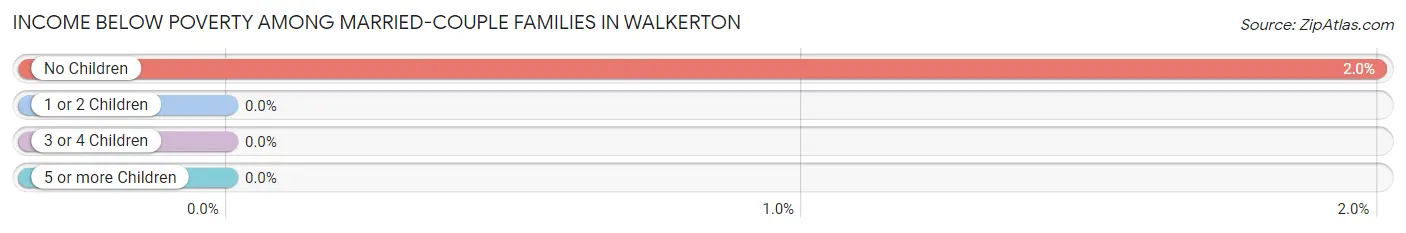
| Children | Above Poverty | Below Poverty |
| No Children | 147 (98.0%) | 3 (2.0%) |
| 1 or 2 Children | 119 (100.0%) | 0 (0.0%) |
| 3 or 4 Children | 39 (100.0%) | 0 (0.0%) |
| 5 or more Children | 8 (100.0%) | 0 (0.0%) |
| Total | 313 (99.1%) | 3 (0.9%) |
Income Below Poverty Among Single-Parent Households in Walkerton
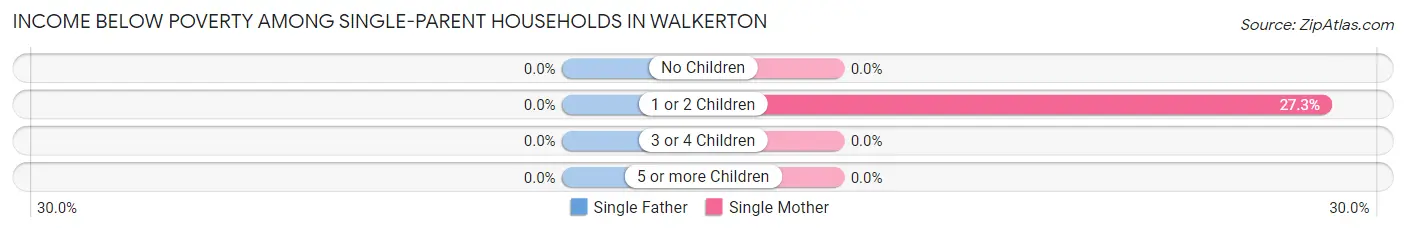
| Children | Single Father | Single Mother |
| No Children | 0 (0.0%) | 0 (0.0%) |
| 1 or 2 Children | 0 (0.0%) | 21 (27.3%) |
| 3 or 4 Children | 0 (0.0%) | 0 (0.0%) |
| 5 or more Children | 0 (0.0%) | 0 (0.0%) |
| Total | 0 (0.0%) | 21 (17.6%) |
Income Below Poverty Among Married-Couple vs Single-Parent Households in Walkerton
The poverty data for Walkerton shows that 3 of the married-couple family households (0.9%) and 21 of the single-parent households (12.4%) are living below the poverty level. Within the married-couple family households, those with no children have the highest poverty rate, with 3 households (2.0%) falling below the poverty line. Among the single-parent households, those with 1 or 2 children have the highest poverty rate, with 21 household (22.1%) living below poverty.
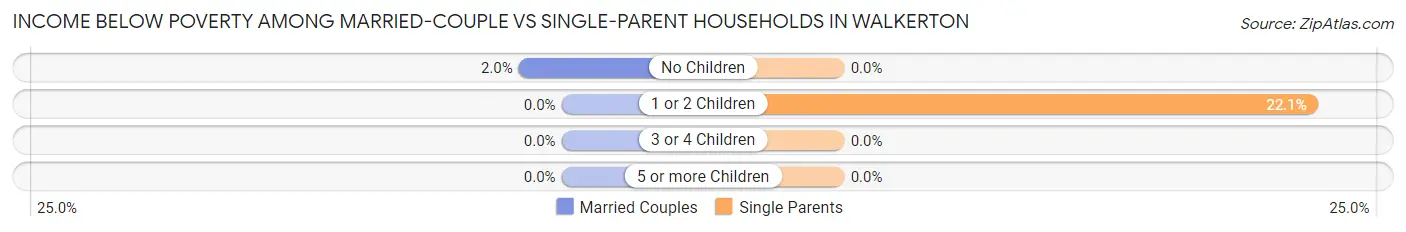
| Children | Married-Couple Families | Single-Parent Households |
| No Children | 3 (2.0%) | 0 (0.0%) |
| 1 or 2 Children | 0 (0.0%) | 21 (22.1%) |
| 3 or 4 Children | 0 (0.0%) | 0 (0.0%) |
| 5 or more Children | 0 (0.0%) | 0 (0.0%) |
| Total | 3 (0.9%) | 21 (12.4%) |
Race in Walkerton
The most populous races in Walkerton are White / Caucasian (1,938 | 95.9%), Hispanic or Latino (53 | 2.6%), and Two or more Races (53 | 2.6%).
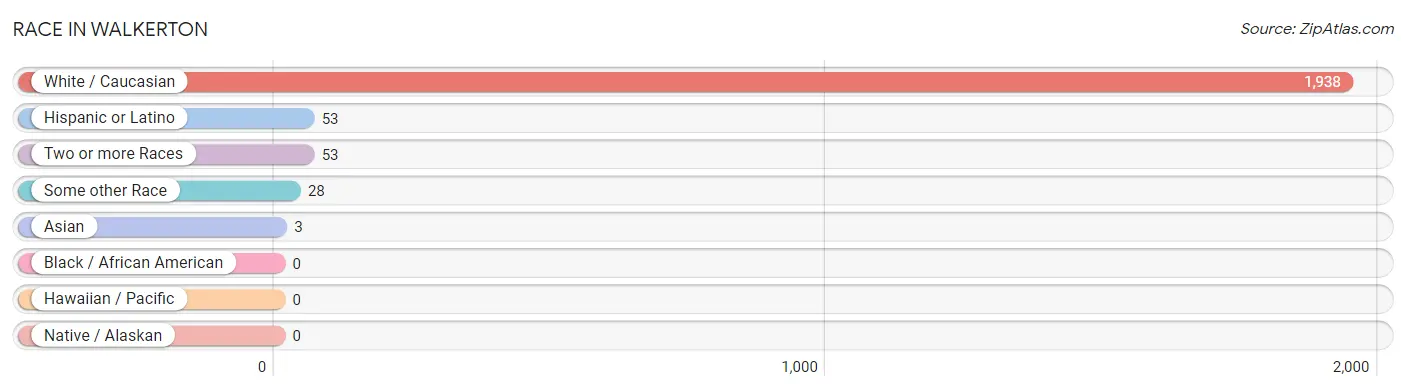
| Race | # Population | % Population |
| Asian | 3 | 0.2% |
| Black / African American | 0 | 0.0% |
| Hawaiian / Pacific | 0 | 0.0% |
| Hispanic or Latino | 53 | 2.6% |
| Native / Alaskan | 0 | 0.0% |
| White / Caucasian | 1,938 | 95.9% |
| Two or more Races | 53 | 2.6% |
| Some other Race | 28 | 1.4% |
| Total | 2,022 | 100.0% |
Ancestry in Walkerton
The most populous ancestries reported in Walkerton are German (527 | 26.1%), Irish (335 | 16.6%), English (163 | 8.1%), American (123 | 6.1%), and Polish (106 | 5.2%), together accounting for 62.0% of all Walkerton residents.
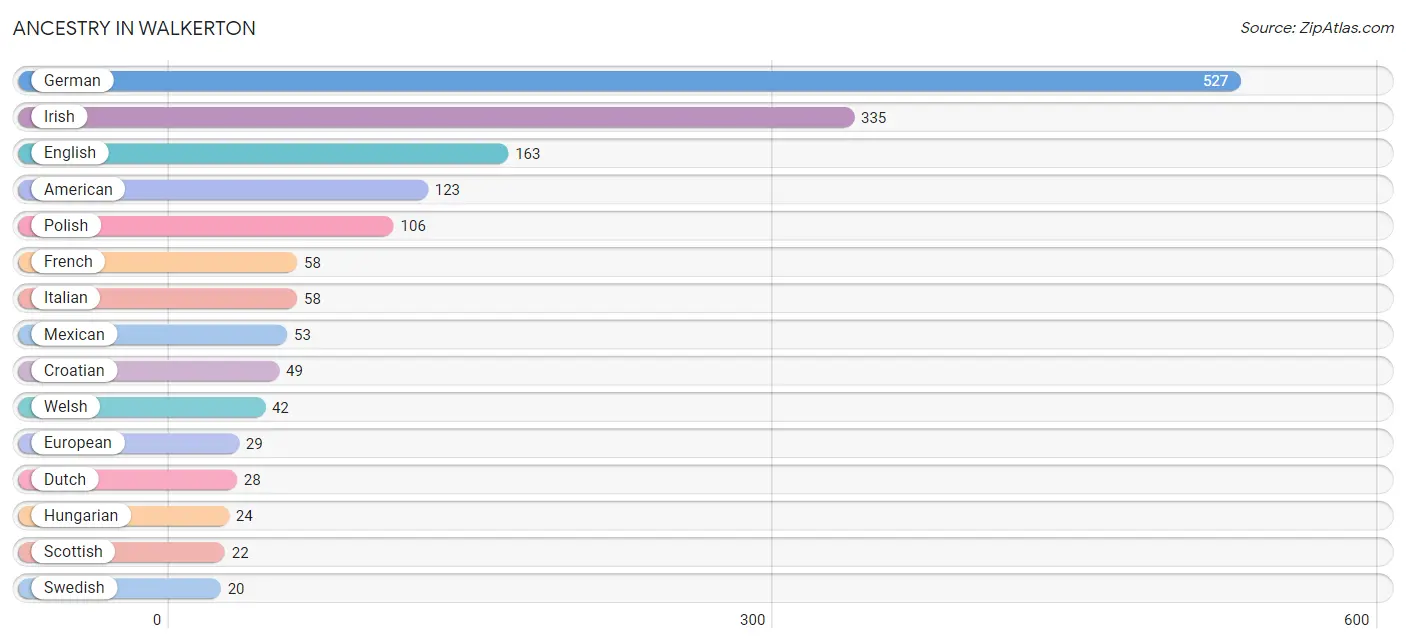
| Ancestry | # Population | % Population |
| American | 123 | 6.1% |
| Belgian | 9 | 0.4% |
| British | 3 | 0.2% |
| Canadian | 2 | 0.1% |
| Croatian | 49 | 2.4% |
| Dutch | 28 | 1.4% |
| English | 163 | 8.1% |
| European | 29 | 1.4% |
| French | 58 | 2.9% |
| German | 527 | 26.1% |
| Greek | 1 | 0.1% |
| Hungarian | 24 | 1.2% |
| Irish | 335 | 16.6% |
| Italian | 58 | 2.9% |
| Korean | 3 | 0.2% |
| Mexican | 53 | 2.6% |
| Norwegian | 15 | 0.7% |
| Pennsylvania German | 19 | 0.9% |
| Polish | 106 | 5.2% |
| Scandinavian | 8 | 0.4% |
| Scotch-Irish | 3 | 0.2% |
| Scottish | 22 | 1.1% |
| Slavic | 11 | 0.5% |
| Slovak | 3 | 0.2% |
| Swedish | 20 | 1.0% |
| Swiss | 5 | 0.3% |
| Welsh | 42 | 2.1% |
| Yugoslavian | 17 | 0.8% | View All 28 Rows |
Immigrants in Walkerton
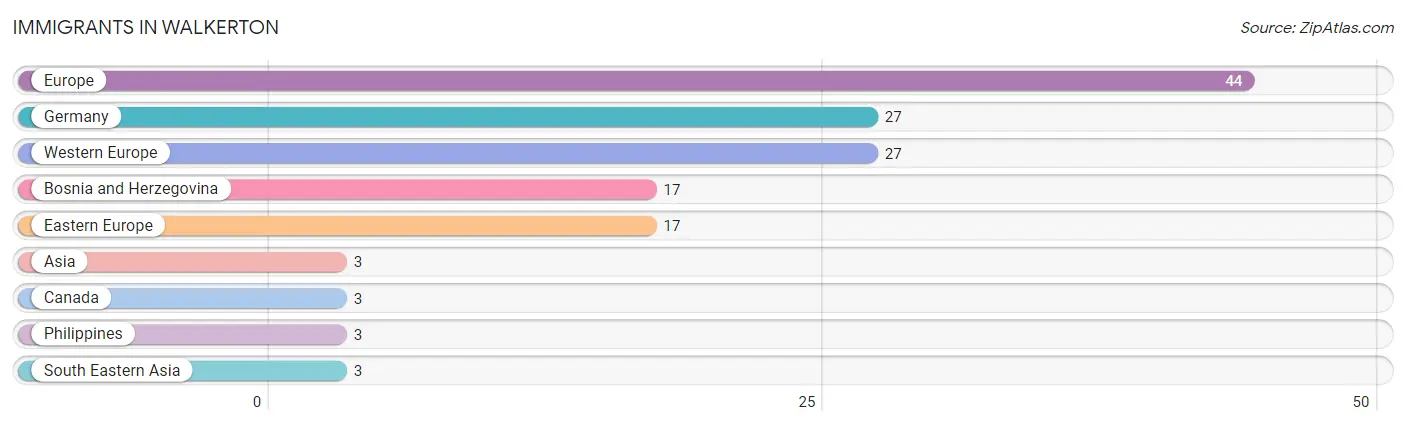
The most numerous immigrant groups reported in Walkerton came from Europe (44 | 2.2%), Germany (27 | 1.3%), Western Europe (27 | 1.3%), Bosnia and Herzegovina (17 | 0.8%), and Eastern Europe (17 | 0.8%), together accounting for 6.5% of all Walkerton residents.
| Immigration Origin | # Population | % Population |
| Asia | 3 | 0.2% |
| Bosnia and Herzegovina | 17 | 0.8% |
| Canada | 3 | 0.2% |
| Eastern Europe | 17 | 0.8% |
| Europe | 44 | 2.2% |
| Germany | 27 | 1.3% |
| Philippines | 3 | 0.2% |
| South Eastern Asia | 3 | 0.2% |
| Western Europe | 27 | 1.3% | View All 9 Rows |
Sex and Age in Walkerton
Sex and Age in Walkerton
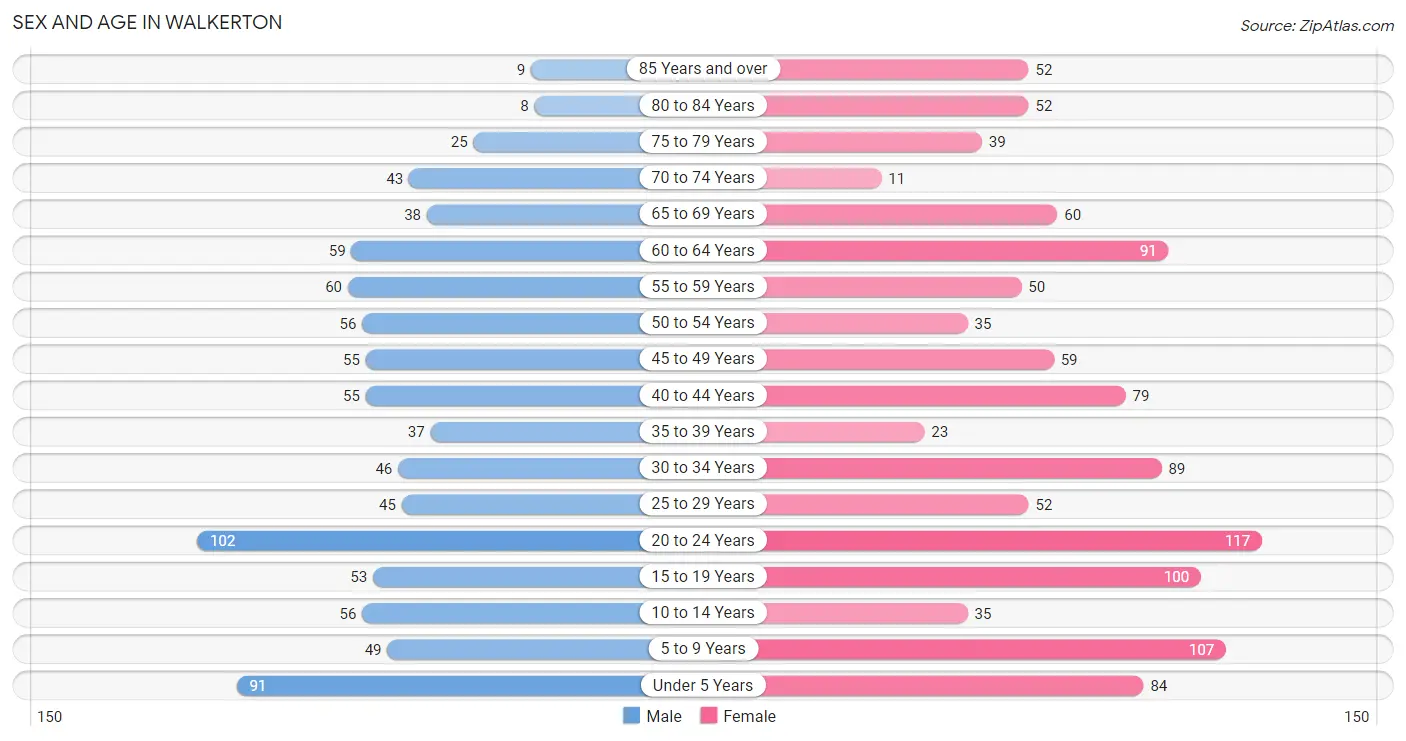
The most populous age groups in Walkerton are 20 to 24 Years (102 | 11.5%) for men and 20 to 24 Years (117 | 10.3%) for women.
| Age Bracket | Male | Female |
| Under 5 Years | 91 (10.3%) | 84 (7.4%) |
| 5 to 9 Years | 49 (5.5%) | 107 (9.4%) |
| 10 to 14 Years | 56 (6.3%) | 35 (3.1%) |
| 15 to 19 Years | 53 (6.0%) | 100 (8.8%) |
| 20 to 24 Years | 102 (11.5%) | 117 (10.3%) |
| 25 to 29 Years | 45 (5.1%) | 52 (4.6%) |
| 30 to 34 Years | 46 (5.2%) | 89 (7.8%) |
| 35 to 39 Years | 37 (4.2%) | 23 (2.0%) |
| 40 to 44 Years | 55 (6.2%) | 79 (7.0%) |
| 45 to 49 Years | 55 (6.2%) | 59 (5.2%) |
| 50 to 54 Years | 56 (6.3%) | 35 (3.1%) |
| 55 to 59 Years | 60 (6.8%) | 50 (4.4%) |
| 60 to 64 Years | 59 (6.7%) | 91 (8.0%) |
| 65 to 69 Years | 38 (4.3%) | 60 (5.3%) |
| 70 to 74 Years | 43 (4.9%) | 11 (1.0%) |
| 75 to 79 Years | 25 (2.8%) | 39 (3.4%) |
| 80 to 84 Years | 8 (0.9%) | 52 (4.6%) |
| 85 Years and over | 9 (1.0%) | 52 (4.6%) |
| Total | 887 (100.0%) | 1,135 (100.0%) |
Families and Households in Walkerton
Median Family Size in Walkerton
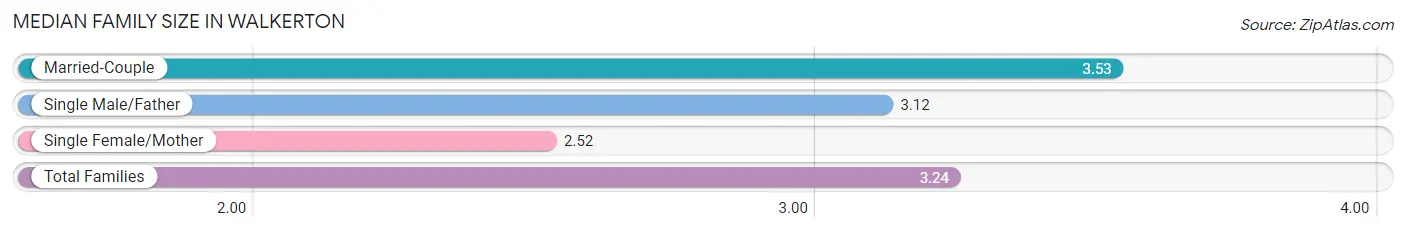
The median family size in Walkerton is 3.24 persons per family, with married-couple families (316 | 65.1%) accounting for the largest median family size of 3.53 persons per family. On the other hand, single female/mother families (119 | 24.5%) represent the smallest median family size with 2.52 persons per family.
| Family Type | # Families | Family Size |
| Married-Couple | 316 (65.1%) | 3.53 |
| Single Male/Father | 50 (10.3%) | 3.12 |
| Single Female/Mother | 119 (24.5%) | 2.52 |
| Total Families | 485 (100.0%) | 3.24 |
Median Household Size in Walkerton
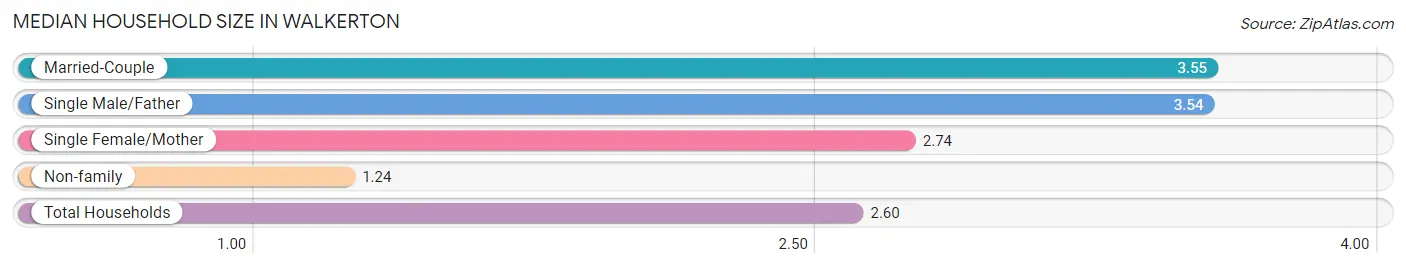
The median household size in Walkerton is 2.60 persons per household, with married-couple households (316 | 41.9%) accounting for the largest median household size of 3.55 persons per household. non-family households (269 | 35.7%) represent the smallest median household size with 1.24 persons per household.
| Household Type | # Households | Household Size |
| Married-Couple | 316 (41.9%) | 3.55 |
| Single Male/Father | 50 (6.6%) | 3.54 |
| Single Female/Mother | 119 (15.8%) | 2.74 |
| Non-family | 269 (35.7%) | 1.24 |
| Total Households | 754 (100.0%) | 2.60 |
Household Size by Marriage Status in Walkerton
Out of a total of 754 households in Walkerton, 485 (64.3%) are family households, while 269 (35.7%) are nonfamily households. The most numerous type of family households are 2-person households, comprising 209, and the most common type of nonfamily households are 1-person households, comprising 210.
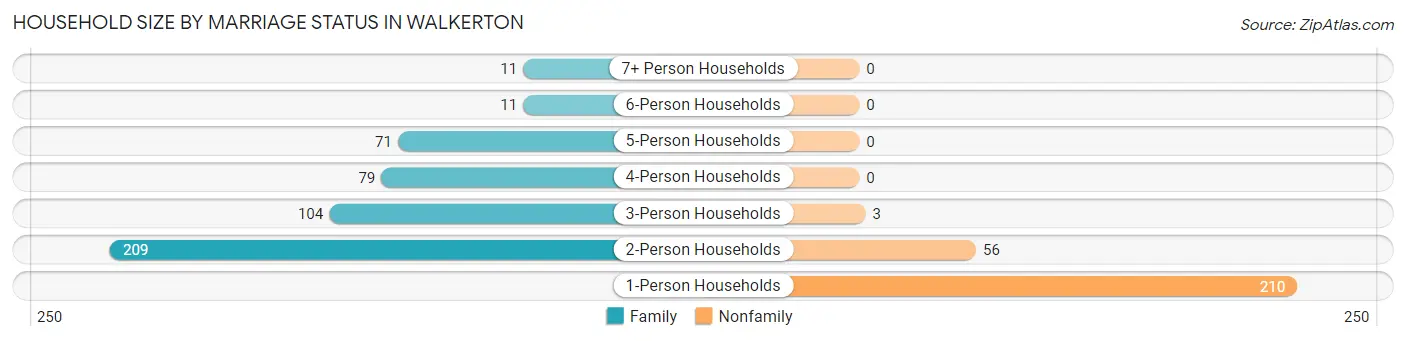
| Household Size | Family Households | Nonfamily Households |
| 1-Person Households | - | 210 (27.9%) |
| 2-Person Households | 209 (27.7%) | 56 (7.4%) |
| 3-Person Households | 104 (13.8%) | 3 (0.4%) |
| 4-Person Households | 79 (10.5%) | 0 (0.0%) |
| 5-Person Households | 71 (9.4%) | 0 (0.0%) |
| 6-Person Households | 11 (1.5%) | 0 (0.0%) |
| 7+ Person Households | 11 (1.5%) | 0 (0.0%) |
| Total | 485 (64.3%) | 269 (35.7%) |
Female Fertility in Walkerton
Fertility by Age in Walkerton
Average fertility rate in Walkerton is 34.0 births per 1,000 women. Women in the age bracket of 20 to 34 years have the highest fertility rate with 50.0 births per 1,000 women. Women in the age bracket of 20 to 34 years acount for 72.2% of all women with births.
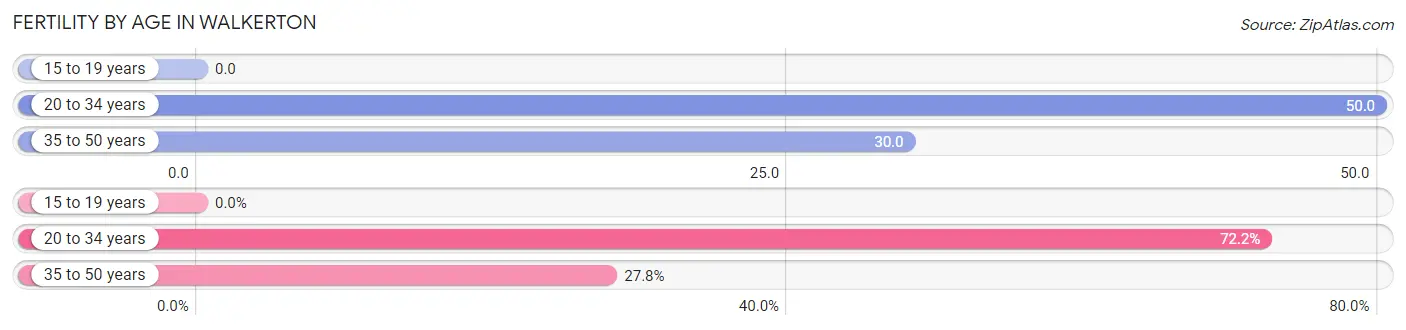
| Age Bracket | Women with Births | Births / 1,000 Women |
| 15 to 19 years | 0 (0.0%) | 0.0 |
| 20 to 34 years | 13 (72.2%) | 50.0 |
| 35 to 50 years | 5 (27.8%) | 30.0 |
| Total | 18 (100.0%) | 34.0 |
Fertility by Age by Marriage Status in Walkerton
16.7% of women with births (18) in Walkerton are married. The highest percentage of unmarried women with births falls into 35 to 50 years age bracket with 100.0% of them unmarried at the time of birth, while the lowest percentage of unmarried women with births belong to 20 to 34 years age bracket with 76.9% of them unmarried.
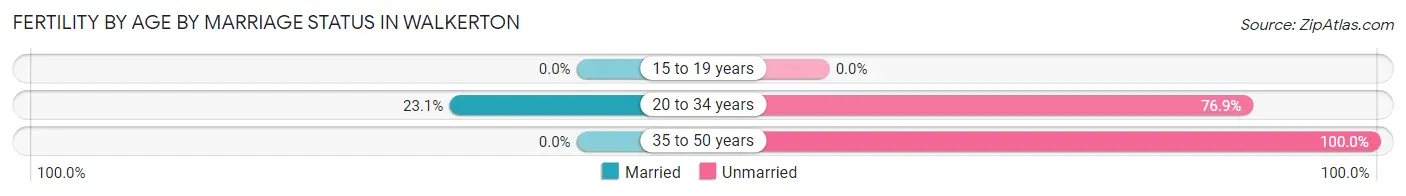
| Age Bracket | Married | Unmarried |
| 15 to 19 years | 0 (0.0%) | 0 (0.0%) |
| 20 to 34 years | 3 (23.1%) | 10 (76.9%) |
| 35 to 50 years | 0 (0.0%) | 5 (100.0%) |
| Total | 3 (16.7%) | 15 (83.3%) |
Fertility by Education in Walkerton
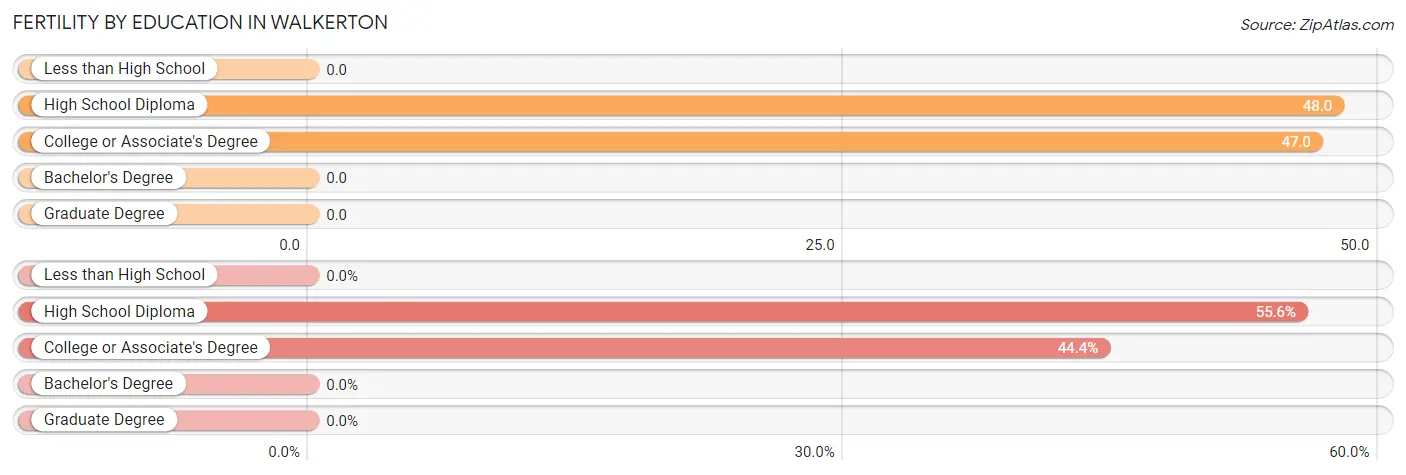
| Educational Attainment | Women with Births | Births / 1,000 Women |
| Less than High School | 0 (0.0%) | 0.0 |
| High School Diploma | 10 (55.6%) | 48.0 |
| College or Associate's Degree | 8 (44.4%) | 47.0 |
| Bachelor's Degree | 0 (0.0%) | 0.0 |
| Graduate Degree | 0 (0.0%) | 0.0 |
| Total | 18 (100.0%) | 34.0 |
Fertility by Education by Marriage Status in Walkerton
83.3% of women with births in Walkerton are unmarried. Women with the educational attainment of high school diploma are most likely to be married with 30.0% of them married at childbirth, while women with the educational attainment of college or associate's degree are least likely to be married with 100.0% of them unmarried at childbirth.
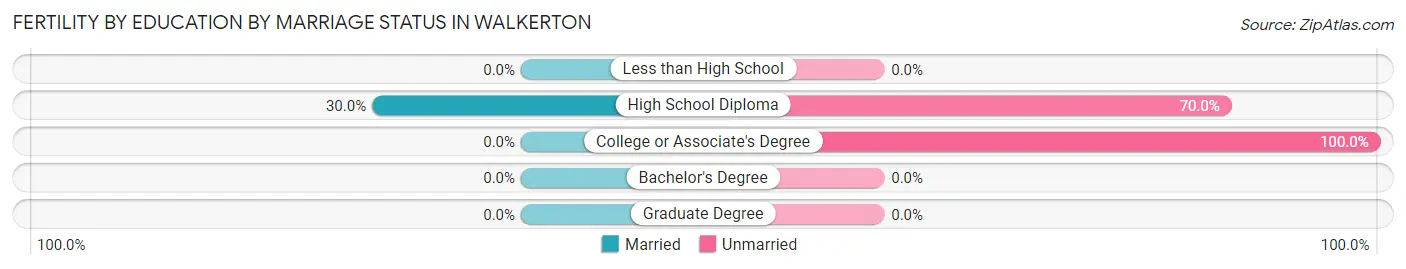
| Educational Attainment | Married | Unmarried |
| Less than High School | 0 (0.0%) | 0 (0.0%) |
| High School Diploma | 3 (30.0%) | 7 (70.0%) |
| College or Associate's Degree | 0 (0.0%) | 8 (100.0%) |
| Bachelor's Degree | 0 (0.0%) | 0 (0.0%) |
| Graduate Degree | 0 (0.0%) | 0 (0.0%) |
| Total | 3 (16.7%) | 15 (83.3%) |
Employment Characteristics in Walkerton
Employment by Class of Employer in Walkerton
Among the 907 employed individuals in Walkerton, private company employees (647 | 71.3%), local government employees (146 | 16.1%), and not-for-profit organizations (48 | 5.3%) make up the most common classes of employment.
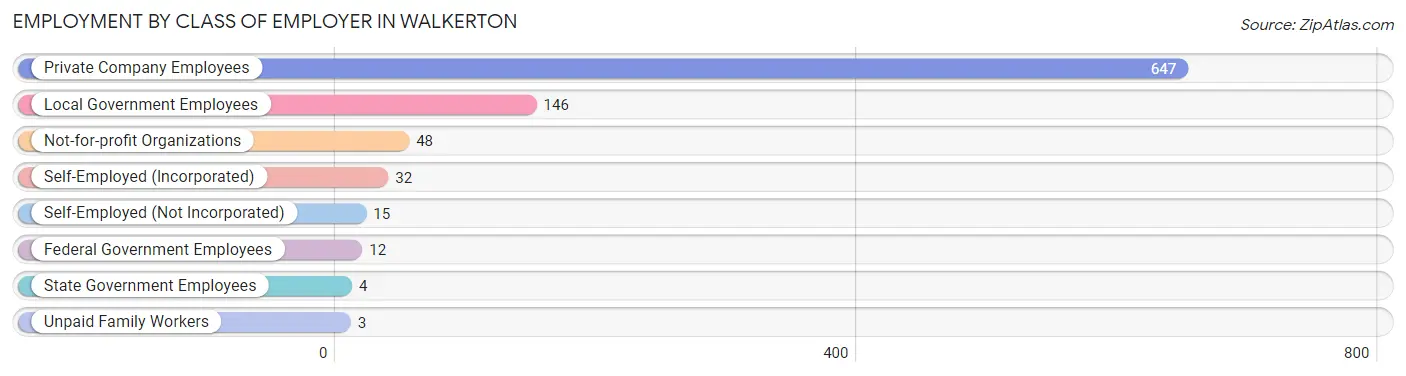
| Employer Class | # Employees | % Employees |
| Private Company Employees | 647 | 71.3% |
| Self-Employed (Incorporated) | 32 | 3.5% |
| Self-Employed (Not Incorporated) | 15 | 1.7% |
| Not-for-profit Organizations | 48 | 5.3% |
| Local Government Employees | 146 | 16.1% |
| State Government Employees | 4 | 0.4% |
| Federal Government Employees | 12 | 1.3% |
| Unpaid Family Workers | 3 | 0.3% |
| Total | 907 | 100.0% |
Employment Status by Age in Walkerton
According to the labor force statistics for Walkerton, out of the total population over 16 years of age (1,571), 61.2% or 961 individuals are in the labor force, with 4.0% or 38 of them unemployed. The age group with the highest labor force participation rate is 20 to 24 years, with 93.6% or 205 individuals in the labor force. Within the labor force, the 16 to 19 years age range has the highest percentage of unemployed individuals, with 44.7% or 17 of them being unemployed.
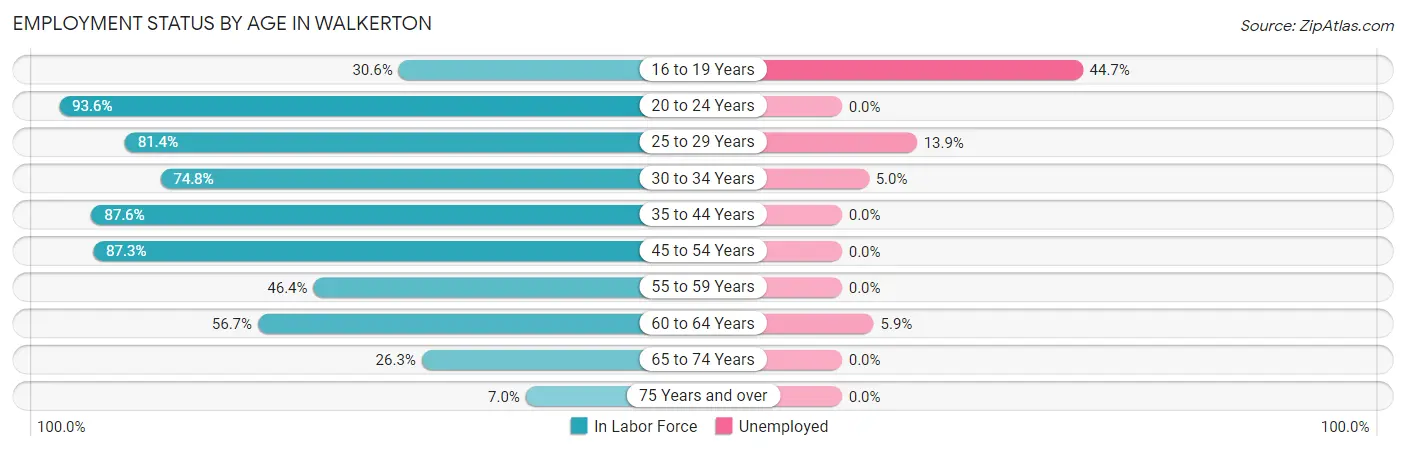
| Age Bracket | In Labor Force | Unemployed |
| 16 to 19 Years | 38 (30.6%) | 17 (44.7%) |
| 20 to 24 Years | 205 (93.6%) | 0 (0.0%) |
| 25 to 29 Years | 79 (81.4%) | 11 (13.9%) |
| 30 to 34 Years | 101 (74.8%) | 5 (5.0%) |
| 35 to 44 Years | 170 (87.6%) | 0 (0.0%) |
| 45 to 54 Years | 179 (87.3%) | 0 (0.0%) |
| 55 to 59 Years | 51 (46.4%) | 0 (0.0%) |
| 60 to 64 Years | 85 (56.7%) | 5 (5.9%) |
| 65 to 74 Years | 40 (26.3%) | 0 (0.0%) |
| 75 Years and over | 13 (7.0%) | 0 (0.0%) |
| Total | 961 (61.2%) | 38 (4.0%) |
Employment Status by Educational Attainment in Walkerton
According to labor force statistics for Walkerton, 74.6% of individuals (665) out of the total population between 25 and 64 years of age (891) are in the labor force, with 3.2% or 21 of them being unemployed. The group with the highest labor force participation rate are those with the educational attainment of college / associate degree, with 76.4% or 262 individuals in the labor force. Within the labor force, individuals with high school diploma education have the highest percentage of unemployment, with 4.3% or 11 of them being unemployed.
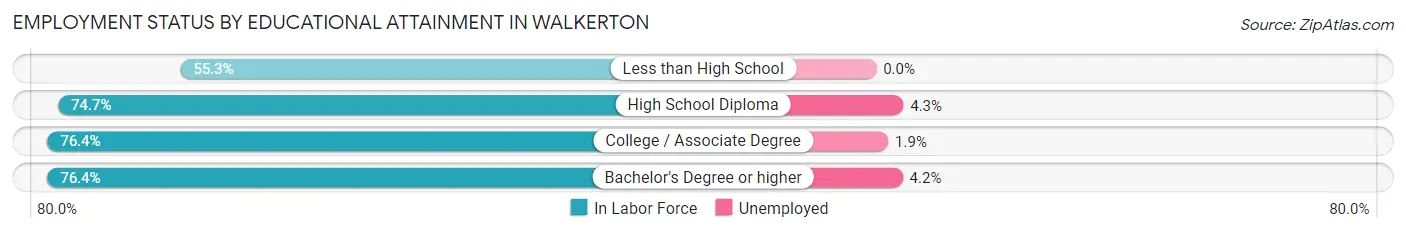
| Educational Attainment | In Labor Force | Unemployed |
| Less than High School | 26 (55.3%) | 0 (0.0%) |
| High School Diploma | 257 (74.7%) | 15 (4.3%) |
| College / Associate Degree | 262 (76.4%) | 7 (1.9%) |
| Bachelor's Degree or higher | 120 (76.4%) | 7 (4.2%) |
| Total | 665 (74.6%) | 29 (3.2%) |
Employment Occupations by Sex in Walkerton
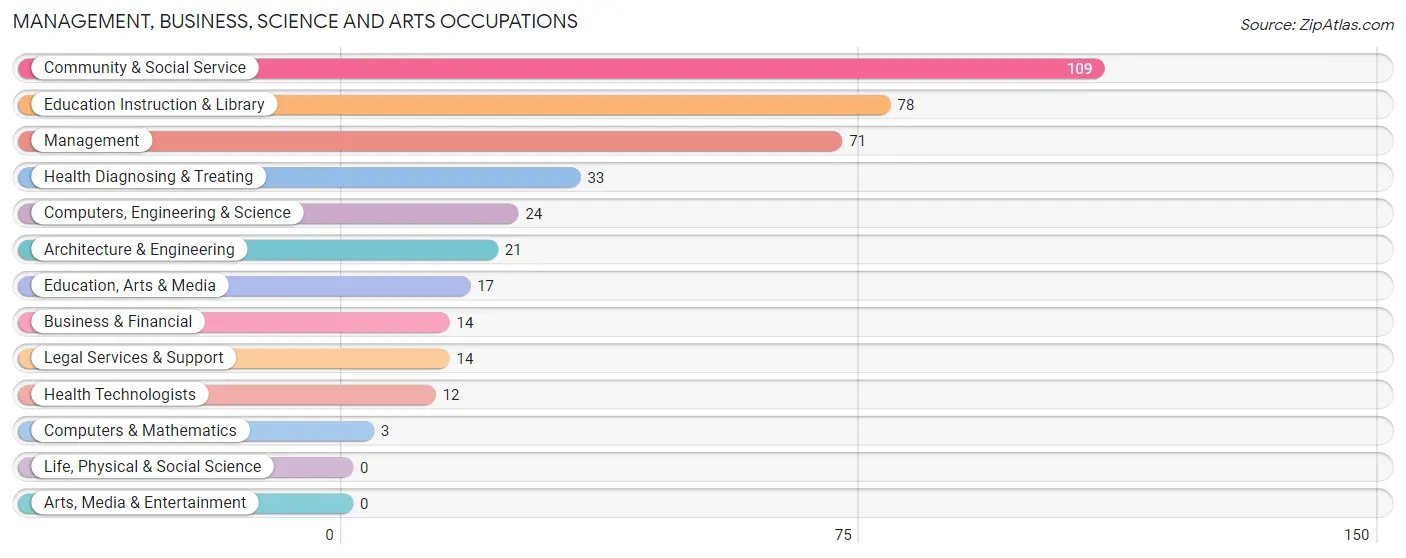
Management, Business, Science and Arts Occupations
The most common Management, Business, Science and Arts occupations in Walkerton are Community & Social Service (109 | 11.8%), Education Instruction & Library (78 | 8.5%), Management (71 | 7.7%), Health Diagnosing & Treating (33 | 3.6%), and Computers, Engineering & Science (24 | 2.6%).
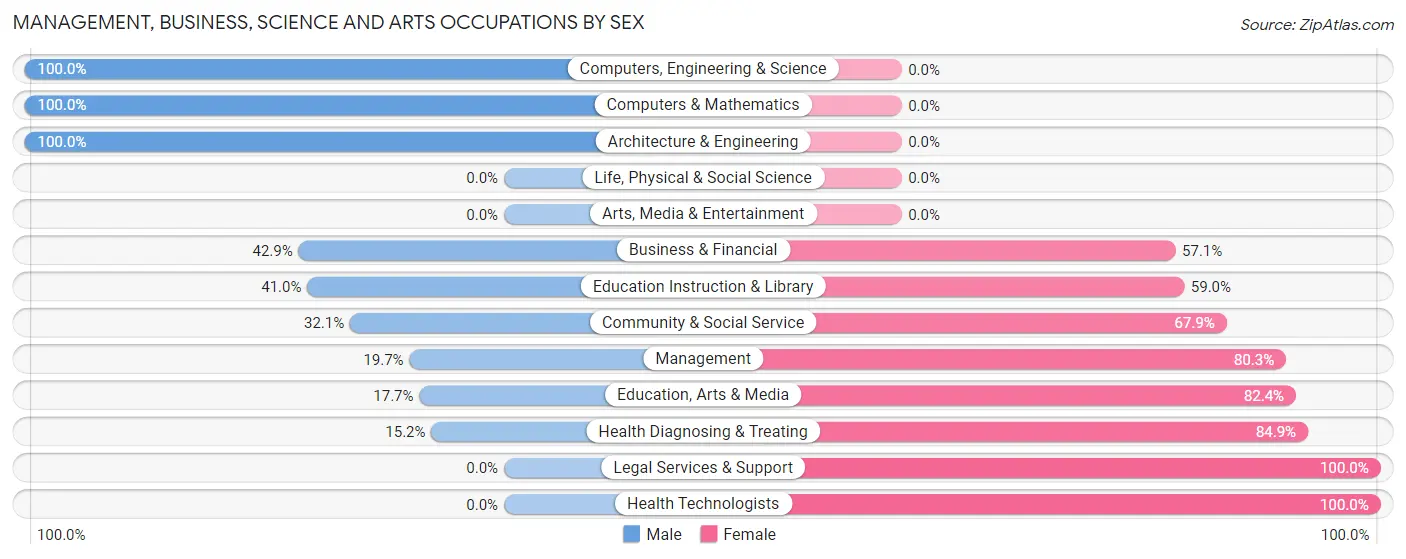
Management, Business, Science and Arts Occupations by Sex
Within the Management, Business, Science and Arts occupations in Walkerton, the most male-oriented occupations are Computers, Engineering & Science (100.0%), Computers & Mathematics (100.0%), and Architecture & Engineering (100.0%), while the most female-oriented occupations are Legal Services & Support (100.0%), Health Technologists (100.0%), and Health Diagnosing & Treating (84.9%).
| Occupation | Male | Female |
| Management | 14 (19.7%) | 57 (80.3%) |
| Business & Financial | 6 (42.9%) | 8 (57.1%) |
| Computers, Engineering & Science | 24 (100.0%) | 0 (0.0%) |
| Computers & Mathematics | 3 (100.0%) | 0 (0.0%) |
| Architecture & Engineering | 21 (100.0%) | 0 (0.0%) |
| Life, Physical & Social Science | 0 (0.0%) | 0 (0.0%) |
| Community & Social Service | 35 (32.1%) | 74 (67.9%) |
| Education, Arts & Media | 3 (17.6%) | 14 (82.4%) |
| Legal Services & Support | 0 (0.0%) | 14 (100.0%) |
| Education Instruction & Library | 32 (41.0%) | 46 (59.0%) |
| Arts, Media & Entertainment | 0 (0.0%) | 0 (0.0%) |
| Health Diagnosing & Treating | 5 (15.1%) | 28 (84.9%) |
| Health Technologists | 0 (0.0%) | 12 (100.0%) |
| Total (Category) | 84 (33.5%) | 167 (66.5%) |
| Total (Overall) | 463 (50.3%) | 458 (49.7%) |
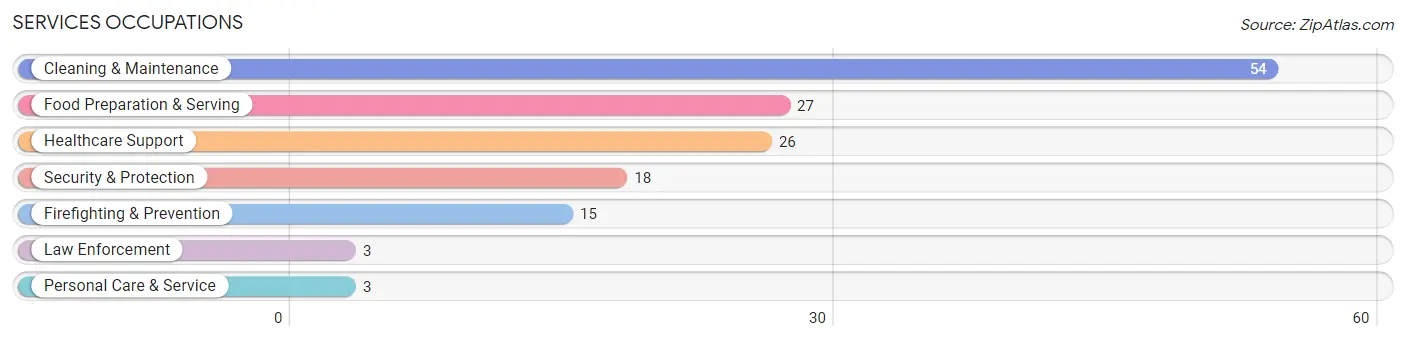
Services Occupations
The most common Services occupations in Walkerton are Cleaning & Maintenance (54 | 5.9%), Food Preparation & Serving (27 | 2.9%), Healthcare Support (26 | 2.8%), Security & Protection (18 | 1.9%), and Firefighting & Prevention (15 | 1.6%).
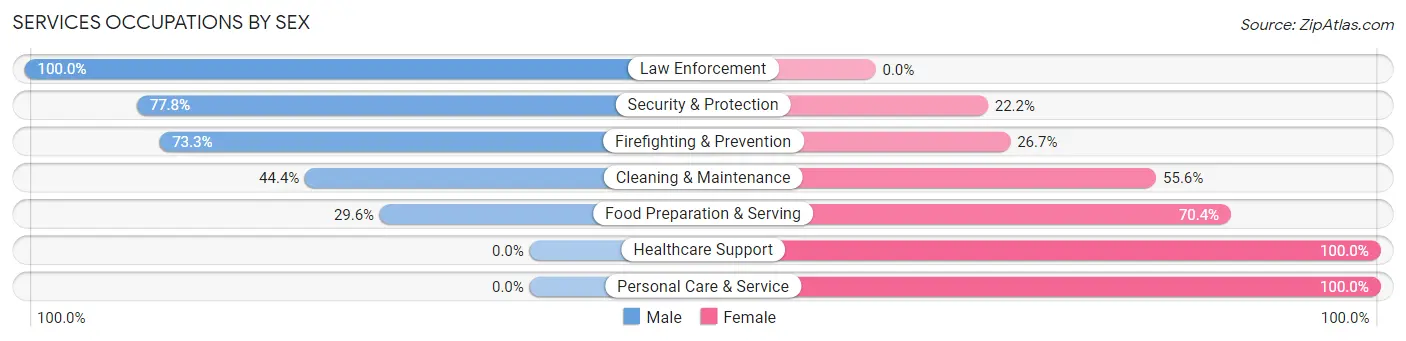
Services Occupations by Sex
Within the Services occupations in Walkerton, the most male-oriented occupations are Law Enforcement (100.0%), Security & Protection (77.8%), and Firefighting & Prevention (73.3%), while the most female-oriented occupations are Healthcare Support (100.0%), Personal Care & Service (100.0%), and Food Preparation & Serving (70.4%).
| Occupation | Male | Female |
| Healthcare Support | 0 (0.0%) | 26 (100.0%) |
| Security & Protection | 14 (77.8%) | 4 (22.2%) |
| Firefighting & Prevention | 11 (73.3%) | 4 (26.7%) |
| Law Enforcement | 3 (100.0%) | 0 (0.0%) |
| Food Preparation & Serving | 8 (29.6%) | 19 (70.4%) |
| Cleaning & Maintenance | 24 (44.4%) | 30 (55.6%) |
| Personal Care & Service | 0 (0.0%) | 3 (100.0%) |
| Total (Category) | 46 (35.9%) | 82 (64.1%) |
| Total (Overall) | 463 (50.3%) | 458 (49.7%) |
Sales and Office Occupations
The most common Sales and Office occupations in Walkerton are Office & Administration (71 | 7.7%), and Sales & Related (40 | 4.3%).
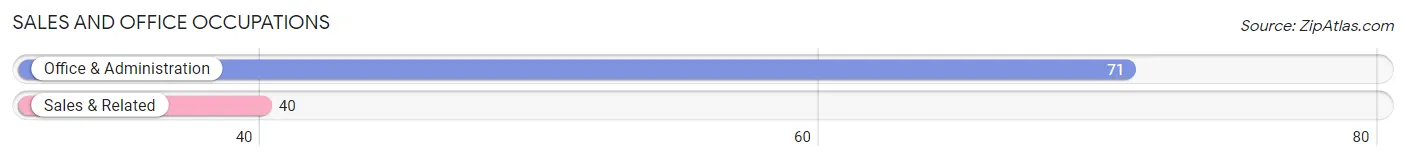
Sales and Office Occupations by Sex

| Occupation | Male | Female |
| Sales & Related | 7 (17.5%) | 33 (82.5%) |
| Office & Administration | 19 (26.8%) | 52 (73.2%) |
| Total (Category) | 26 (23.4%) | 85 (76.6%) |
| Total (Overall) | 463 (50.3%) | 458 (49.7%) |
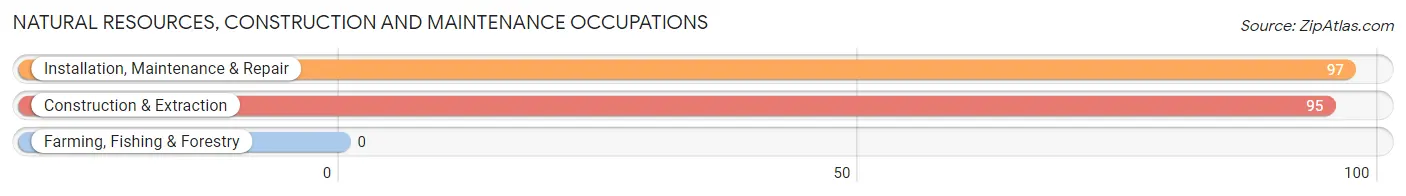
Natural Resources, Construction and Maintenance Occupations
The most common Natural Resources, Construction and Maintenance occupations in Walkerton are Installation, Maintenance & Repair (97 | 10.5%), and Construction & Extraction (95 | 10.3%).
Natural Resources, Construction and Maintenance Occupations by Sex
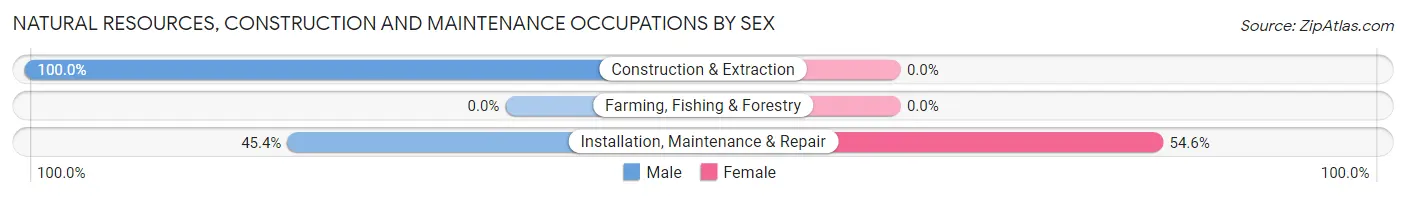
| Occupation | Male | Female |
| Farming, Fishing & Forestry | 0 (0.0%) | 0 (0.0%) |
| Construction & Extraction | 95 (100.0%) | 0 (0.0%) |
| Installation, Maintenance & Repair | 44 (45.4%) | 53 (54.6%) |
| Total (Category) | 139 (72.4%) | 53 (27.6%) |
| Total (Overall) | 463 (50.3%) | 458 (49.7%) |
Production, Transportation and Moving Occupations
The most common Production, Transportation and Moving occupations in Walkerton are Production (166 | 18.0%), Material Moving (43 | 4.7%), and Transportation (30 | 3.3%).
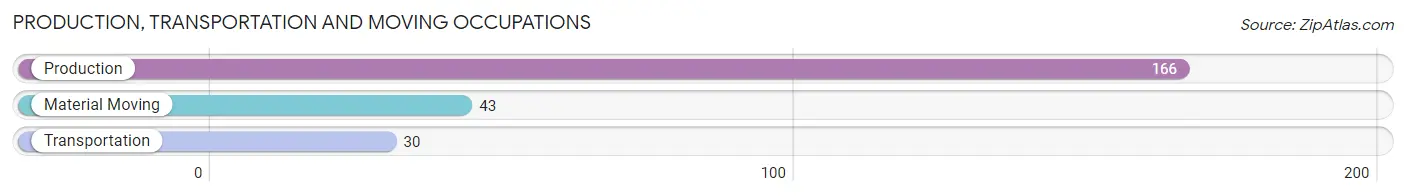
Production, Transportation and Moving Occupations by Sex
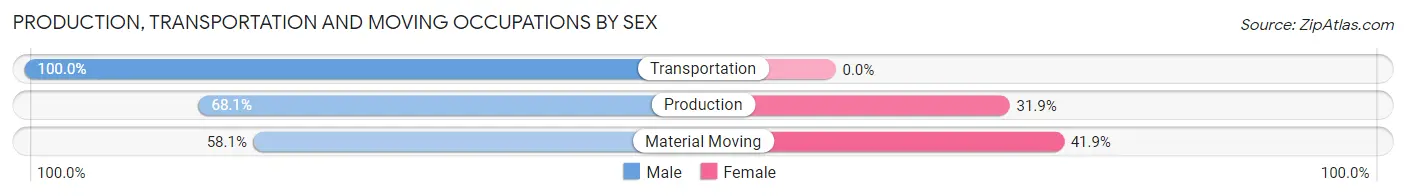
| Occupation | Male | Female |
| Production | 113 (68.1%) | 53 (31.9%) |
| Transportation | 30 (100.0%) | 0 (0.0%) |
| Material Moving | 25 (58.1%) | 18 (41.9%) |
| Total (Category) | 168 (70.3%) | 71 (29.7%) |
| Total (Overall) | 463 (50.3%) | 458 (49.7%) |
Employment Industries by Sex in Walkerton
Employment Industries in Walkerton
The major employment industries in Walkerton include Manufacturing (250 | 27.1%), Educational Services (99 | 10.7%), Health Care & Social Assistance (88 | 9.6%), Construction (83 | 9.0%), and Wholesale Trade (82 | 8.9%).

Employment Industries by Sex in Walkerton
The Walkerton industries that see more men than women are Construction (100.0%), Utilities (100.0%), and Real Estate, Rental & Leasing (100.0%), whereas the industries that tend to have a higher number of women are Agriculture, Fishing & Hunting (100.0%), Finance & Insurance (100.0%), and Health Care & Social Assistance (86.4%).
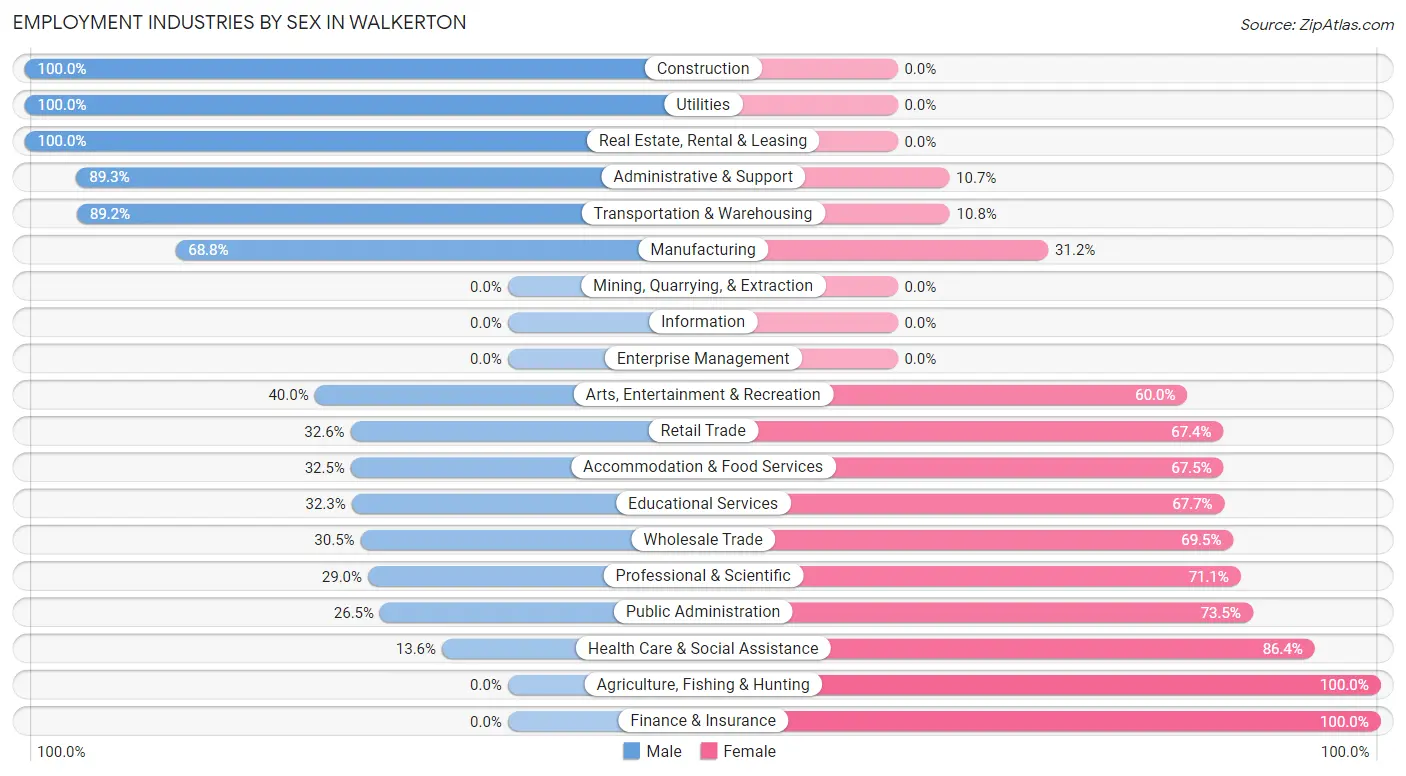
| Industry | Male | Female |
| Agriculture, Fishing & Hunting | 0 (0.0%) | 7 (100.0%) |
| Mining, Quarrying, & Extraction | 0 (0.0%) | 0 (0.0%) |
| Construction | 83 (100.0%) | 0 (0.0%) |
| Manufacturing | 172 (68.8%) | 78 (31.2%) |
| Wholesale Trade | 25 (30.5%) | 57 (69.5%) |
| Retail Trade | 14 (32.6%) | 29 (67.4%) |
| Transportation & Warehousing | 33 (89.2%) | 4 (10.8%) |
| Utilities | 4 (100.0%) | 0 (0.0%) |
| Information | 0 (0.0%) | 0 (0.0%) |
| Finance & Insurance | 0 (0.0%) | 24 (100.0%) |
| Real Estate, Rental & Leasing | 5 (100.0%) | 0 (0.0%) |
| Professional & Scientific | 11 (28.9%) | 27 (71.1%) |
| Enterprise Management | 0 (0.0%) | 0 (0.0%) |
| Administrative & Support | 25 (89.3%) | 3 (10.7%) |
| Educational Services | 32 (32.3%) | 67 (67.7%) |
| Health Care & Social Assistance | 12 (13.6%) | 76 (86.4%) |
| Arts, Entertainment & Recreation | 4 (40.0%) | 6 (60.0%) |
| Accommodation & Food Services | 13 (32.5%) | 27 (67.5%) |
| Public Administration | 18 (26.5%) | 50 (73.5%) |
| Total | 463 (50.3%) | 458 (49.7%) |
Education in Walkerton
School Enrollment in Walkerton
The most common levels of schooling among the 427 students in Walkerton are high school (126 | 29.5%), elementary school (91 | 21.3%), and college / undergraduate (73 | 17.1%).
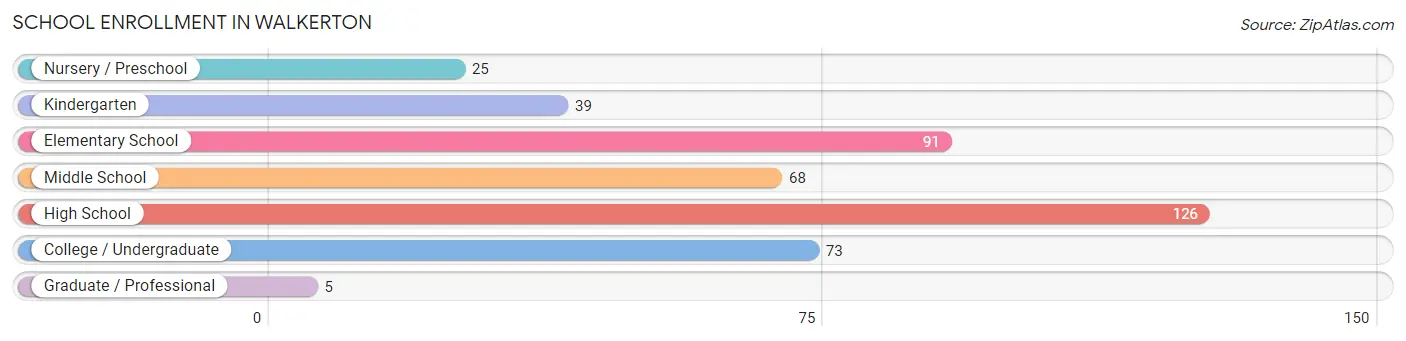
| School Level | # Students | % Students |
| Nursery / Preschool | 25 | 5.9% |
| Kindergarten | 39 | 9.1% |
| Elementary School | 91 | 21.3% |
| Middle School | 68 | 15.9% |
| High School | 126 | 29.5% |
| College / Undergraduate | 73 | 17.1% |
| Graduate / Professional | 5 | 1.2% |
| Total | 427 | 100.0% |
School Enrollment by Age by Funding Source in Walkerton
Out of a total of 427 students who are enrolled in schools in Walkerton, 48 (11.2%) attend a private institution, while the remaining 379 (88.8%) are enrolled in public schools. The age group of 35 years and over has the highest likelihood of being enrolled in private schools, with 8 (66.7% in the age bracket) enrolled. Conversely, the age group of 18 to 19 year olds has the lowest likelihood of being enrolled in a private school, with 36 (100.0% in the age bracket) attending a public institution.
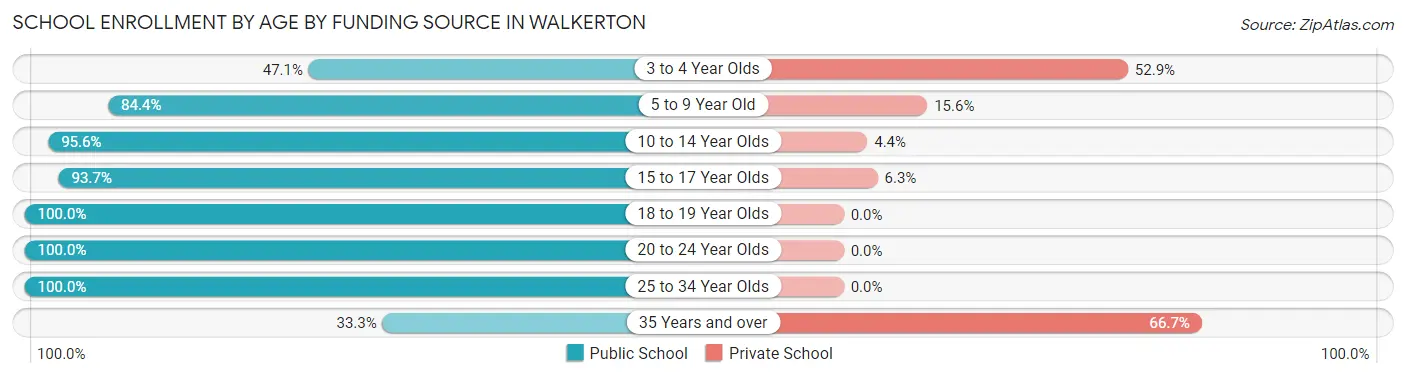
| Age Bracket | Public School | Private School |
| 3 to 4 Year Olds | 8 (47.1%) | 9 (52.9%) |
| 5 to 9 Year Old | 114 (84.4%) | 21 (15.6%) |
| 10 to 14 Year Olds | 87 (95.6%) | 4 (4.4%) |
| 15 to 17 Year Olds | 89 (93.7%) | 6 (6.3%) |
| 18 to 19 Year Olds | 36 (100.0%) | 0 (0.0%) |
| 20 to 24 Year Olds | 31 (100.0%) | 0 (0.0%) |
| 25 to 34 Year Olds | 10 (100.0%) | 0 (0.0%) |
| 35 Years and over | 4 (33.3%) | 8 (66.7%) |
| Total | 379 (88.8%) | 48 (11.2%) |
Educational Attainment by Field of Study in Walkerton
Education (89 | 36.8%), science & technology (26 | 10.7%), communications (21 | 8.7%), social sciences (19 | 7.9%), and liberal arts & history (19 | 7.9%) are the most common fields of study among 242 individuals in Walkerton who have obtained a bachelor's degree or higher.
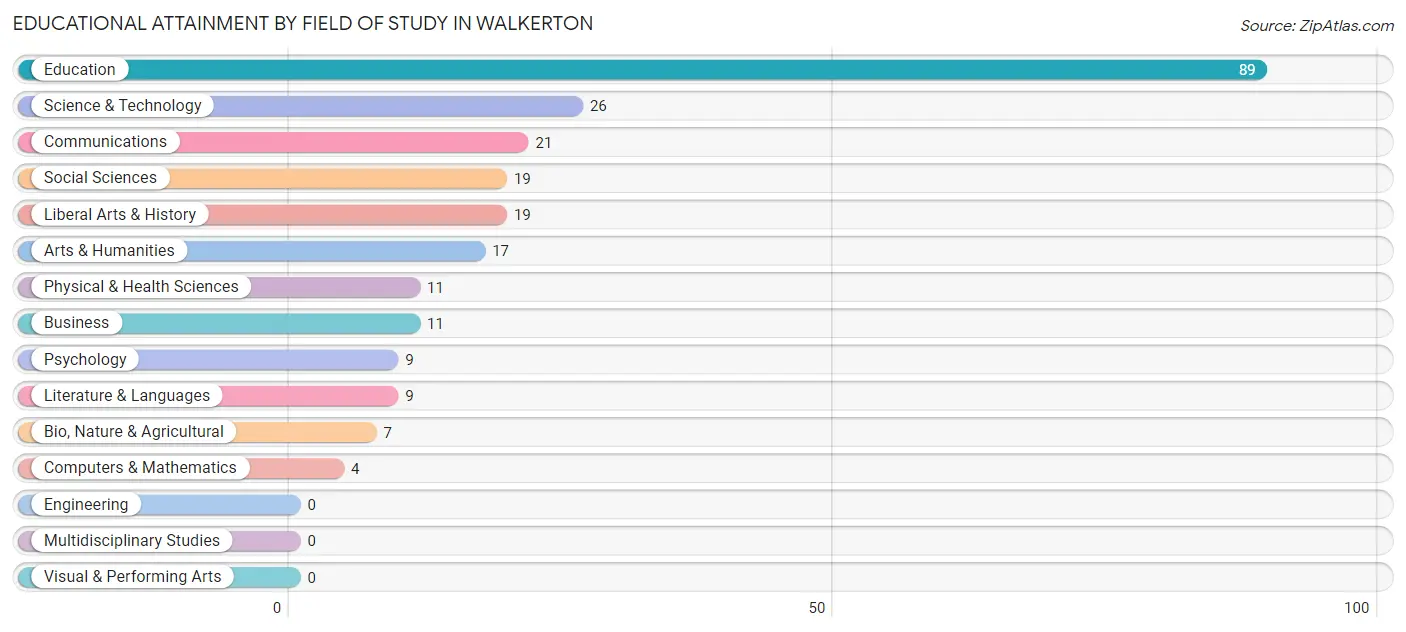
| Field of Study | # Graduates | % Graduates |
| Computers & Mathematics | 4 | 1.7% |
| Bio, Nature & Agricultural | 7 | 2.9% |
| Physical & Health Sciences | 11 | 4.5% |
| Psychology | 9 | 3.7% |
| Social Sciences | 19 | 7.9% |
| Engineering | 0 | 0.0% |
| Multidisciplinary Studies | 0 | 0.0% |
| Science & Technology | 26 | 10.7% |
| Business | 11 | 4.5% |
| Education | 89 | 36.8% |
| Literature & Languages | 9 | 3.7% |
| Liberal Arts & History | 19 | 7.9% |
| Visual & Performing Arts | 0 | 0.0% |
| Communications | 21 | 8.7% |
| Arts & Humanities | 17 | 7.0% |
| Total | 242 | 100.0% |
Transportation & Commute in Walkerton
Vehicle Availability by Sex in Walkerton
The most prevalent vehicle ownership categories in Walkerton are males with 2 vehicles (230, accounting for 49.5%) and females with 2 vehicles (180, making up 52.0%).
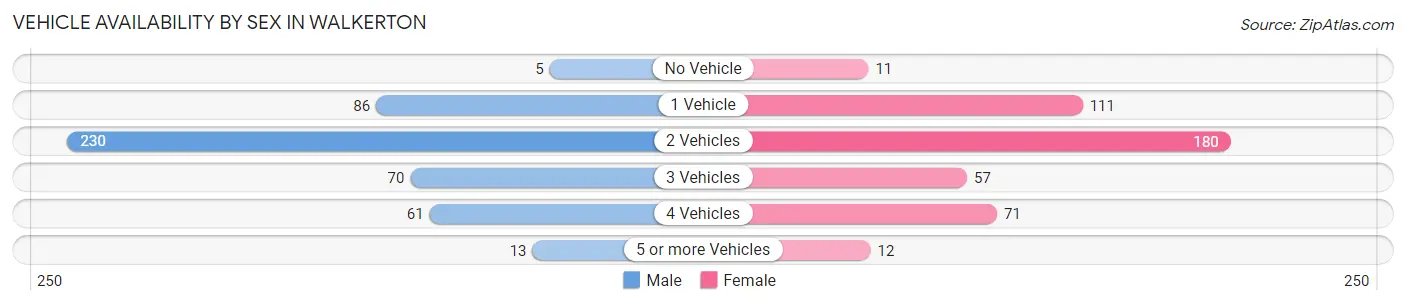
| Vehicles Available | Male | Female |
| No Vehicle | 5 (1.1%) | 11 (2.5%) |
| 1 Vehicle | 86 (18.5%) | 111 (25.1%) |
| 2 Vehicles | 230 (49.5%) | 180 (40.7%) |
| 3 Vehicles | 70 (15.0%) | 57 (12.9%) |
| 4 Vehicles | 61 (13.1%) | 71 (16.1%) |
| 5 or more Vehicles | 13 (2.8%) | 12 (2.7%) |
| Total | 465 (100.0%) | 442 (100.0%) |
Commute Time in Walkerton
The most frequently occuring commute durations in Walkerton are 5 to 9 minutes (182 commuters, 20.6%), 20 to 24 minutes (158 commuters, 17.9%), and 45 to 59 minutes (118 commuters, 13.4%).
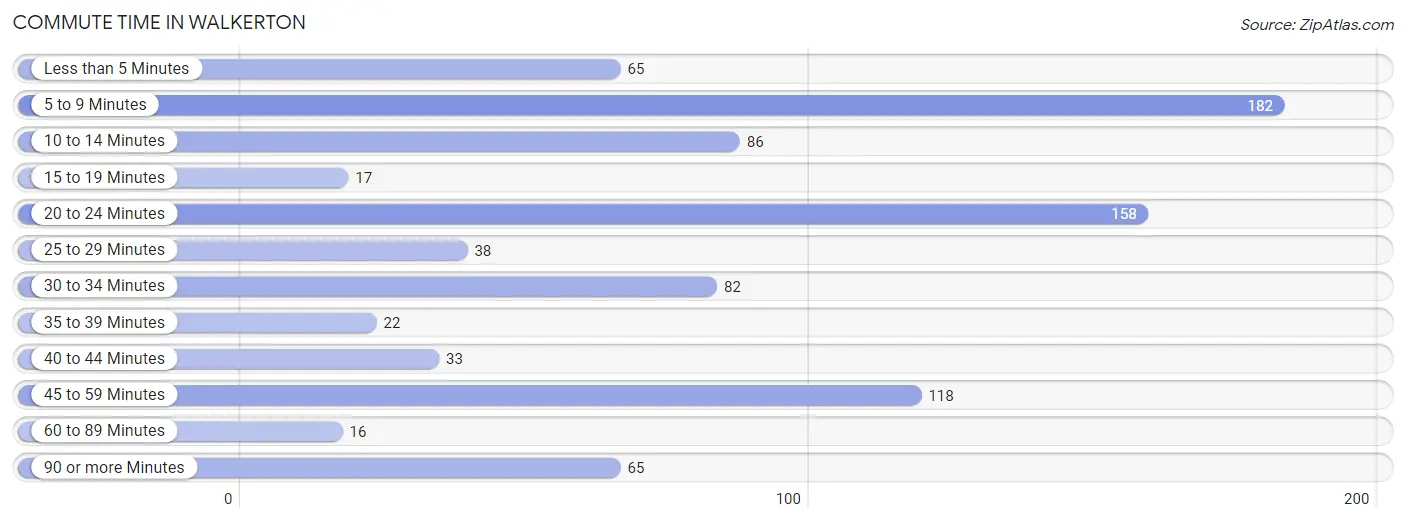
| Commute Time | # Commuters | % Commuters |
| Less than 5 Minutes | 65 | 7.4% |
| 5 to 9 Minutes | 182 | 20.6% |
| 10 to 14 Minutes | 86 | 9.8% |
| 15 to 19 Minutes | 17 | 1.9% |
| 20 to 24 Minutes | 158 | 17.9% |
| 25 to 29 Minutes | 38 | 4.3% |
| 30 to 34 Minutes | 82 | 9.3% |
| 35 to 39 Minutes | 22 | 2.5% |
| 40 to 44 Minutes | 33 | 3.7% |
| 45 to 59 Minutes | 118 | 13.4% |
| 60 to 89 Minutes | 16 | 1.8% |
| 90 or more Minutes | 65 | 7.4% |
Commute Time by Sex in Walkerton
The most common commute times in Walkerton are 45 to 59 minutes (98 commuters, 21.3%) for males and 5 to 9 minutes (92 commuters, 21.8%) for females.
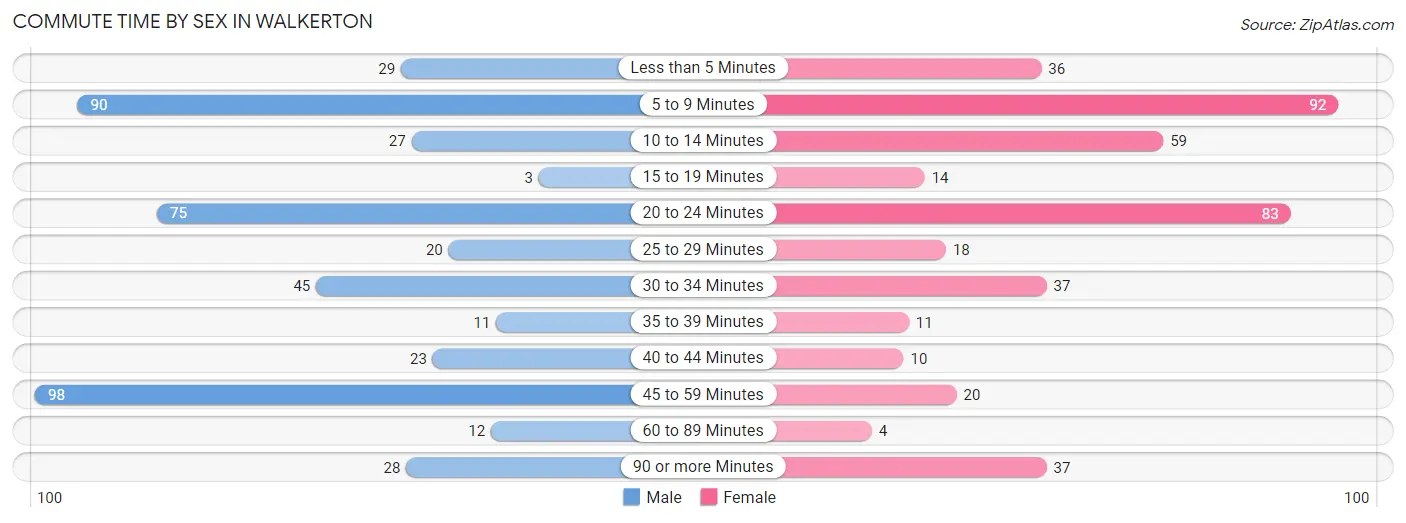
| Commute Time | Male | Female |
| Less than 5 Minutes | 29 (6.3%) | 36 (8.6%) |
| 5 to 9 Minutes | 90 (19.5%) | 92 (21.8%) |
| 10 to 14 Minutes | 27 (5.9%) | 59 (14.0%) |
| 15 to 19 Minutes | 3 (0.6%) | 14 (3.3%) |
| 20 to 24 Minutes | 75 (16.3%) | 83 (19.7%) |
| 25 to 29 Minutes | 20 (4.3%) | 18 (4.3%) |
| 30 to 34 Minutes | 45 (9.8%) | 37 (8.8%) |
| 35 to 39 Minutes | 11 (2.4%) | 11 (2.6%) |
| 40 to 44 Minutes | 23 (5.0%) | 10 (2.4%) |
| 45 to 59 Minutes | 98 (21.3%) | 20 (4.8%) |
| 60 to 89 Minutes | 12 (2.6%) | 4 (0.9%) |
| 90 or more Minutes | 28 (6.1%) | 37 (8.8%) |
Time of Departure to Work by Sex in Walkerton
The most frequent times of departure to work in Walkerton are 5:30 AM to 5:59 AM (103, 22.3%) for males and 7:30 AM to 7:59 AM (93, 22.1%) for females.
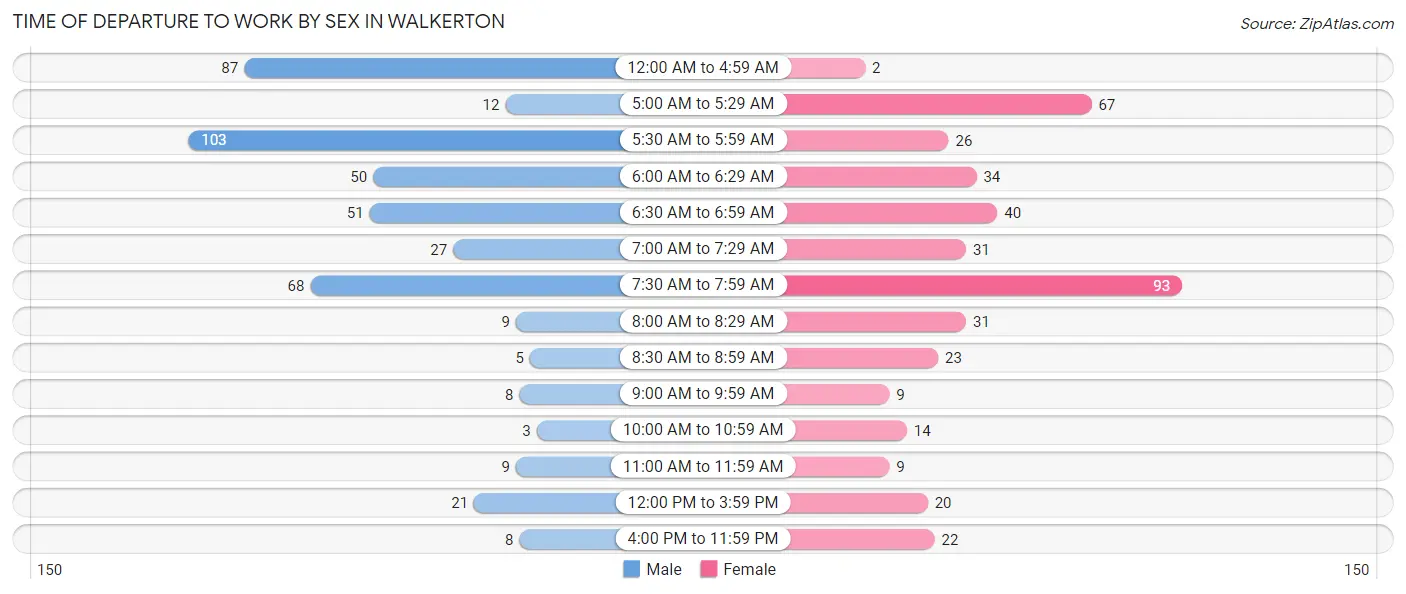
| Time of Departure | Male | Female |
| 12:00 AM to 4:59 AM | 87 (18.9%) | 2 (0.5%) |
| 5:00 AM to 5:29 AM | 12 (2.6%) | 67 (15.9%) |
| 5:30 AM to 5:59 AM | 103 (22.3%) | 26 (6.2%) |
| 6:00 AM to 6:29 AM | 50 (10.8%) | 34 (8.1%) |
| 6:30 AM to 6:59 AM | 51 (11.1%) | 40 (9.5%) |
| 7:00 AM to 7:29 AM | 27 (5.9%) | 31 (7.4%) |
| 7:30 AM to 7:59 AM | 68 (14.7%) | 93 (22.1%) |
| 8:00 AM to 8:29 AM | 9 (1.9%) | 31 (7.4%) |
| 8:30 AM to 8:59 AM | 5 (1.1%) | 23 (5.5%) |
| 9:00 AM to 9:59 AM | 8 (1.7%) | 9 (2.1%) |
| 10:00 AM to 10:59 AM | 3 (0.6%) | 14 (3.3%) |
| 11:00 AM to 11:59 AM | 9 (1.9%) | 9 (2.1%) |
| 12:00 PM to 3:59 PM | 21 (4.6%) | 20 (4.8%) |
| 4:00 PM to 11:59 PM | 8 (1.7%) | 22 (5.2%) |
| Total | 461 (100.0%) | 421 (100.0%) |
Housing Occupancy in Walkerton
Occupancy by Ownership in Walkerton
Of the total 754 dwellings in Walkerton, owner-occupied units account for 569 (75.5%), while renter-occupied units make up 185 (24.5%).
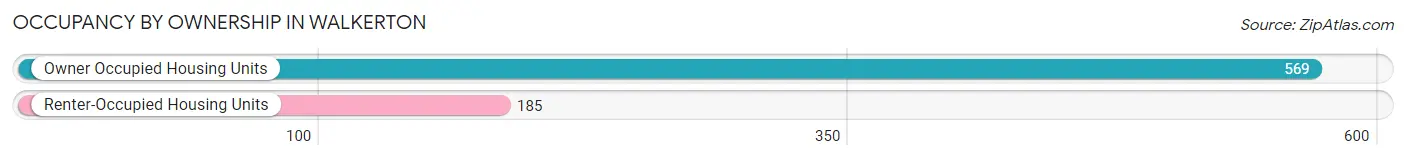
| Occupancy | # Housing Units | % Housing Units |
| Owner Occupied Housing Units | 569 | 75.5% |
| Renter-Occupied Housing Units | 185 | 24.5% |
| Total Occupied Housing Units | 754 | 100.0% |
Occupancy by Household Size in Walkerton
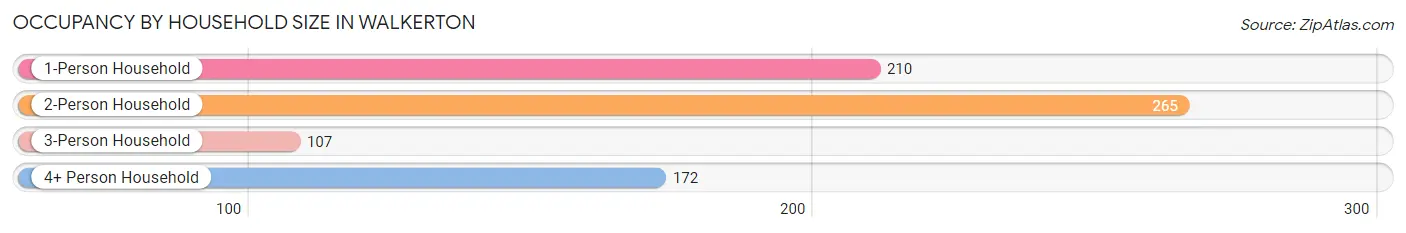
| Household Size | # Housing Units | % Housing Units |
| 1-Person Household | 210 | 27.9% |
| 2-Person Household | 265 | 35.1% |
| 3-Person Household | 107 | 14.2% |
| 4+ Person Household | 172 | 22.8% |
| Total Housing Units | 754 | 100.0% |
Occupancy by Ownership by Household Size in Walkerton
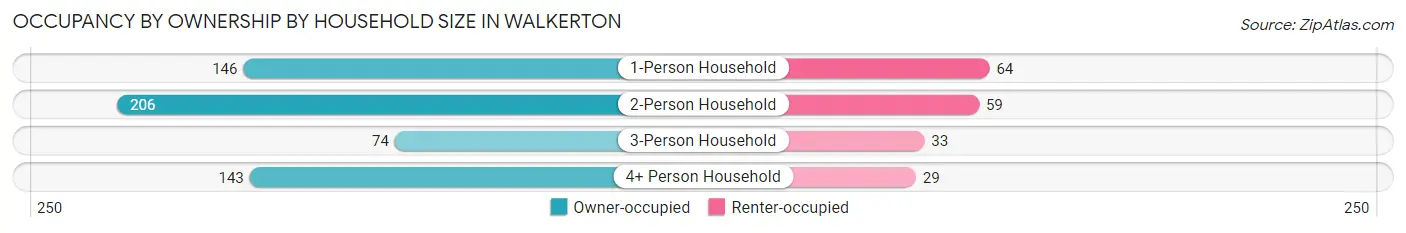
| Household Size | Owner-occupied | Renter-occupied |
| 1-Person Household | 146 (69.5%) | 64 (30.5%) |
| 2-Person Household | 206 (77.7%) | 59 (22.3%) |
| 3-Person Household | 74 (69.2%) | 33 (30.8%) |
| 4+ Person Household | 143 (83.1%) | 29 (16.9%) |
| Total Housing Units | 569 (75.5%) | 185 (24.5%) |
Occupancy by Educational Attainment in Walkerton
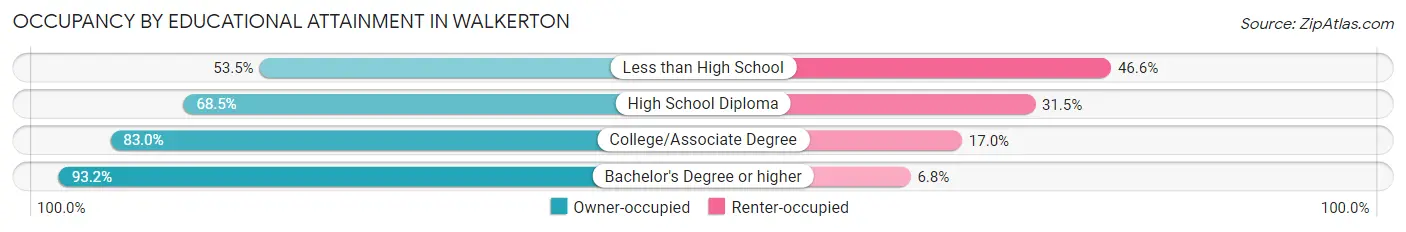
| Household Size | Owner-occupied | Renter-occupied |
| Less than High School | 31 (53.4%) | 27 (46.6%) |
| High School Diploma | 237 (68.5%) | 109 (31.5%) |
| College/Associate Degree | 205 (83.0%) | 42 (17.0%) |
| Bachelor's Degree or higher | 96 (93.2%) | 7 (6.8%) |
Occupancy by Age of Householder in Walkerton
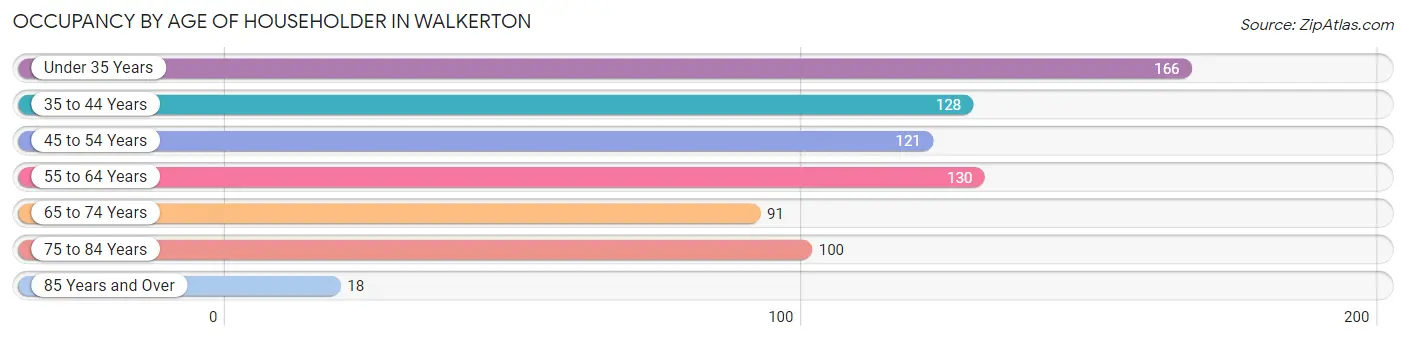
| Age Bracket | # Households | % Households |
| Under 35 Years | 166 | 22.0% |
| 35 to 44 Years | 128 | 17.0% |
| 45 to 54 Years | 121 | 16.1% |
| 55 to 64 Years | 130 | 17.2% |
| 65 to 74 Years | 91 | 12.1% |
| 75 to 84 Years | 100 | 13.3% |
| 85 Years and Over | 18 | 2.4% |
| Total | 754 | 100.0% |
Housing Finances in Walkerton
Median Income by Occupancy in Walkerton
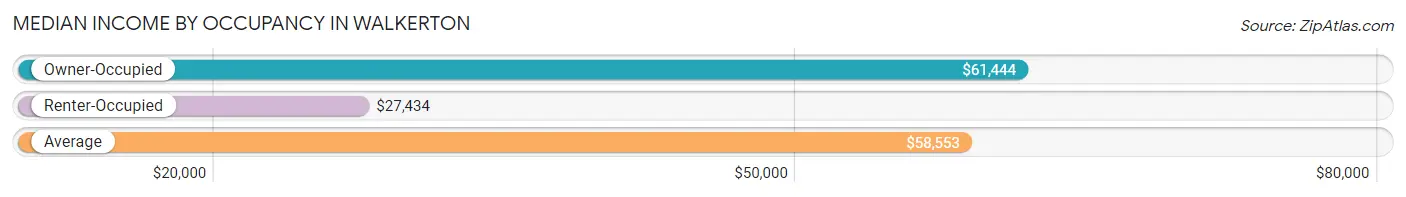
| Occupancy Type | # Households | Median Income |
| Owner-Occupied | 569 (75.5%) | $61,444 |
| Renter-Occupied | 185 (24.5%) | $27,434 |
| Average | 754 (100.0%) | $58,553 |
Occupancy by Householder Income Bracket in Walkerton
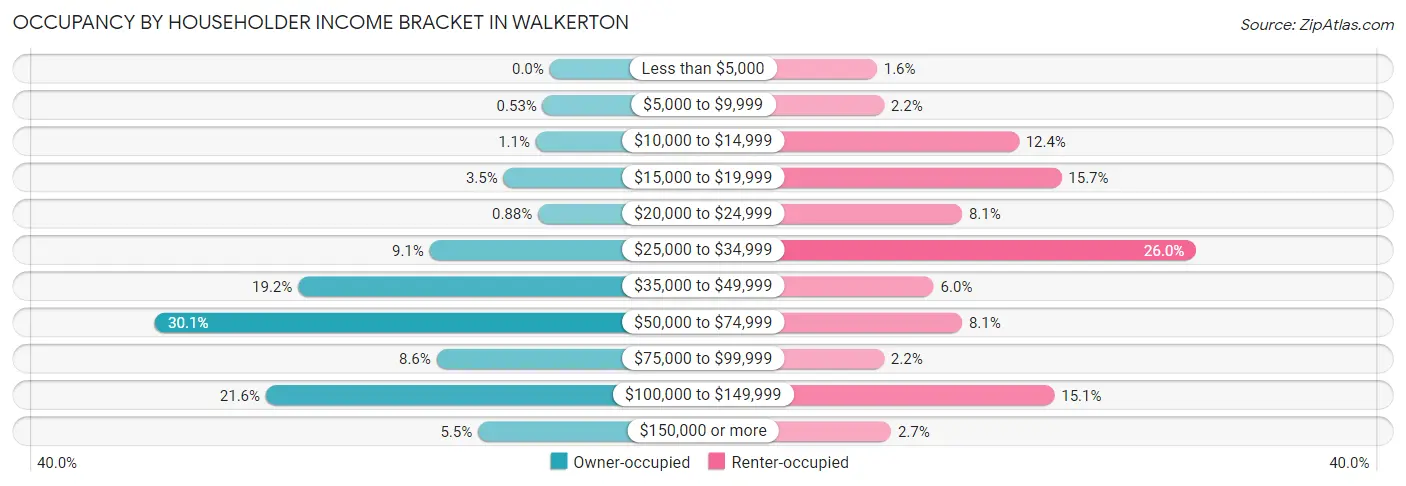
| Income Bracket | Owner-occupied | Renter-occupied |
| Less than $5,000 | 0 (0.0%) | 3 (1.6%) |
| $5,000 to $9,999 | 3 (0.5%) | 4 (2.2%) |
| $10,000 to $14,999 | 6 (1.1%) | 23 (12.4%) |
| $15,000 to $19,999 | 20 (3.5%) | 29 (15.7%) |
| $20,000 to $24,999 | 5 (0.9%) | 15 (8.1%) |
| $25,000 to $34,999 | 52 (9.1%) | 48 (26.0%) |
| $35,000 to $49,999 | 109 (19.2%) | 11 (5.9%) |
| $50,000 to $74,999 | 171 (30.0%) | 15 (8.1%) |
| $75,000 to $99,999 | 49 (8.6%) | 4 (2.2%) |
| $100,000 to $149,999 | 123 (21.6%) | 28 (15.1%) |
| $150,000 or more | 31 (5.4%) | 5 (2.7%) |
| Total | 569 (100.0%) | 185 (100.0%) |
Monthly Housing Cost Tiers in Walkerton
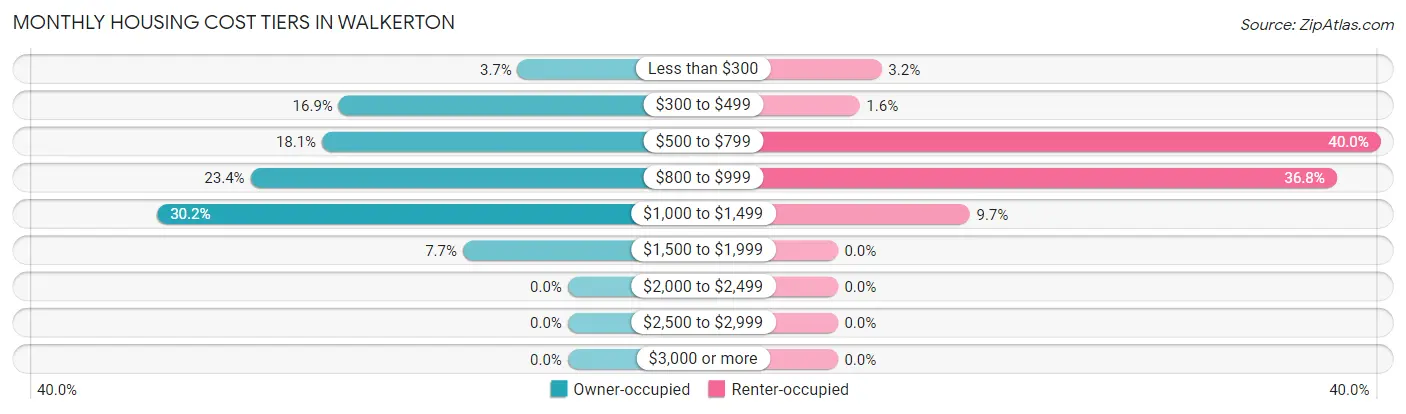
| Monthly Cost | Owner-occupied | Renter-occupied |
| Less than $300 | 21 (3.7%) | 6 (3.2%) |
| $300 to $499 | 96 (16.9%) | 3 (1.6%) |
| $500 to $799 | 103 (18.1%) | 74 (40.0%) |
| $800 to $999 | 133 (23.4%) | 68 (36.8%) |
| $1,000 to $1,499 | 172 (30.2%) | 18 (9.7%) |
| $1,500 to $1,999 | 44 (7.7%) | 0 (0.0%) |
| $2,000 to $2,499 | 0 (0.0%) | 0 (0.0%) |
| $2,500 to $2,999 | 0 (0.0%) | 0 (0.0%) |
| $3,000 or more | 0 (0.0%) | 0 (0.0%) |
| Total | 569 (100.0%) | 185 (100.0%) |
Physical Housing Characteristics in Walkerton
Housing Structures in Walkerton
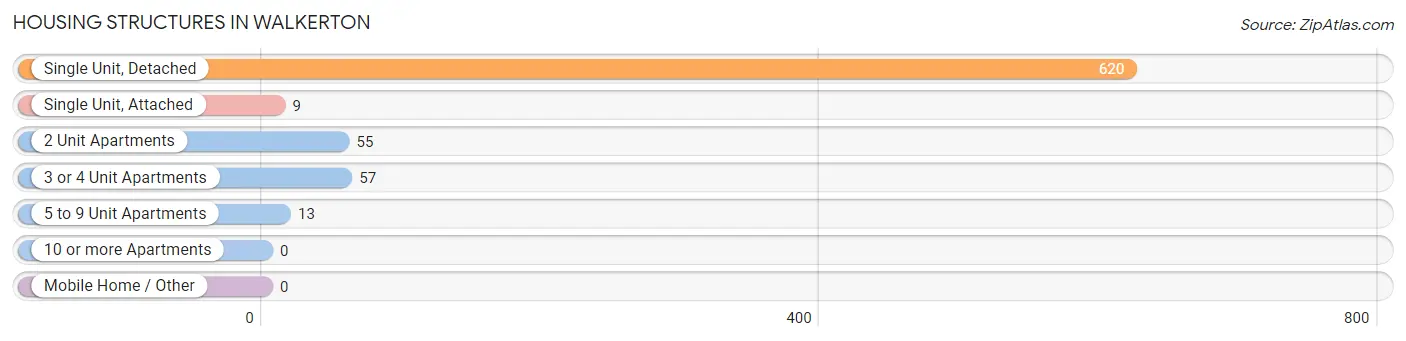
| Structure Type | # Housing Units | % Housing Units |
| Single Unit, Detached | 620 | 82.2% |
| Single Unit, Attached | 9 | 1.2% |
| 2 Unit Apartments | 55 | 7.3% |
| 3 or 4 Unit Apartments | 57 | 7.6% |
| 5 to 9 Unit Apartments | 13 | 1.7% |
| 10 or more Apartments | 0 | 0.0% |
| Mobile Home / Other | 0 | 0.0% |
| Total | 754 | 100.0% |
Housing Structures by Occupancy in Walkerton
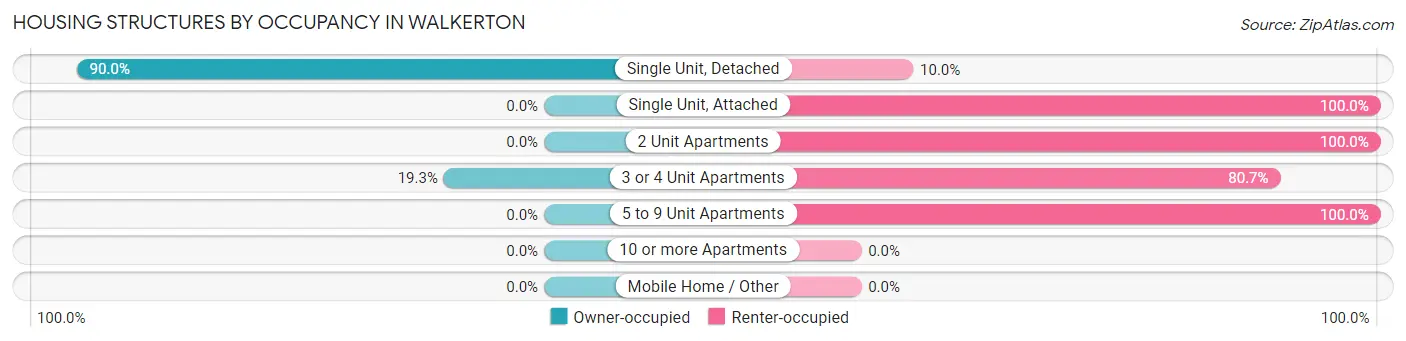
| Structure Type | Owner-occupied | Renter-occupied |
| Single Unit, Detached | 558 (90.0%) | 62 (10.0%) |
| Single Unit, Attached | 0 (0.0%) | 9 (100.0%) |
| 2 Unit Apartments | 0 (0.0%) | 55 (100.0%) |
| 3 or 4 Unit Apartments | 11 (19.3%) | 46 (80.7%) |
| 5 to 9 Unit Apartments | 0 (0.0%) | 13 (100.0%) |
| 10 or more Apartments | 0 (0.0%) | 0 (0.0%) |
| Mobile Home / Other | 0 (0.0%) | 0 (0.0%) |
| Total | 569 (75.5%) | 185 (24.5%) |
Housing Structures by Number of Rooms in Walkerton
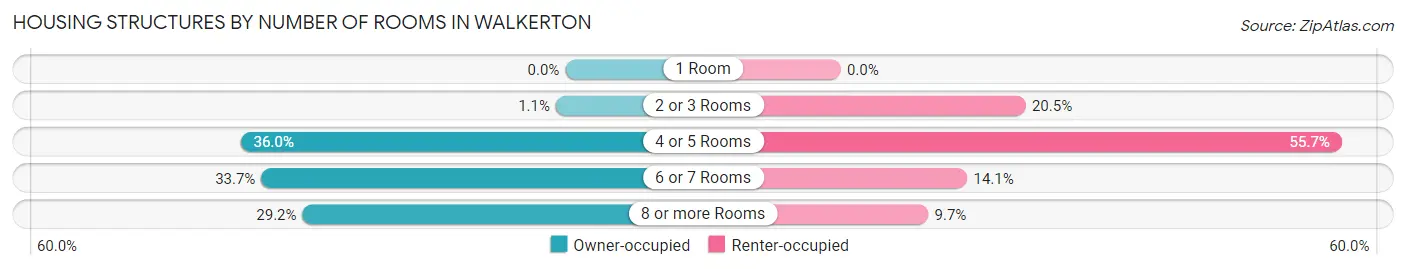
| Number of Rooms | Owner-occupied | Renter-occupied |
| 1 Room | 0 (0.0%) | 0 (0.0%) |
| 2 or 3 Rooms | 6 (1.1%) | 38 (20.5%) |
| 4 or 5 Rooms | 205 (36.0%) | 103 (55.7%) |
| 6 or 7 Rooms | 192 (33.7%) | 26 (14.1%) |
| 8 or more Rooms | 166 (29.2%) | 18 (9.7%) |
| Total | 569 (100.0%) | 185 (100.0%) |
Housing Structure by Heating Type in Walkerton
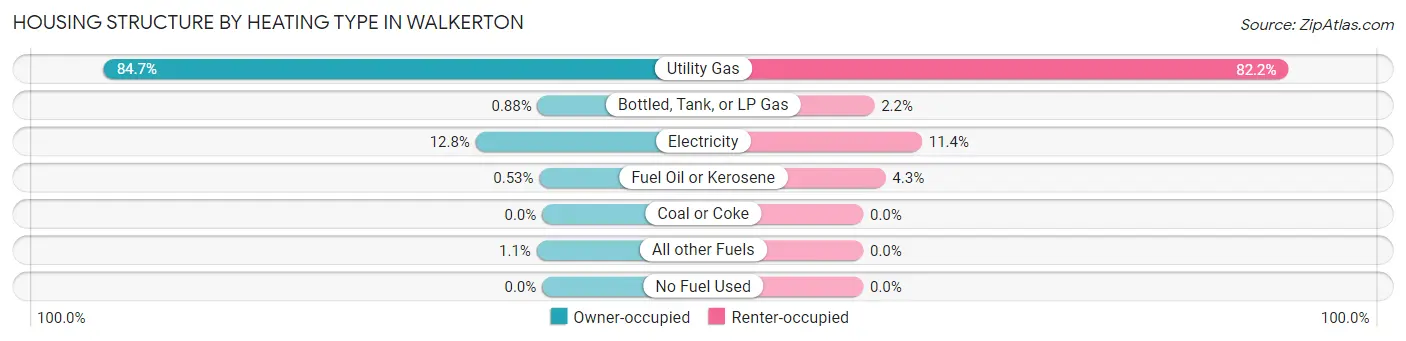
| Heating Type | Owner-occupied | Renter-occupied |
| Utility Gas | 482 (84.7%) | 152 (82.2%) |
| Bottled, Tank, or LP Gas | 5 (0.9%) | 4 (2.2%) |
| Electricity | 73 (12.8%) | 21 (11.4%) |
| Fuel Oil or Kerosene | 3 (0.5%) | 8 (4.3%) |
| Coal or Coke | 0 (0.0%) | 0 (0.0%) |
| All other Fuels | 6 (1.1%) | 0 (0.0%) |
| No Fuel Used | 0 (0.0%) | 0 (0.0%) |
| Total | 569 (100.0%) | 185 (100.0%) |
Household Vehicle Usage in Walkerton
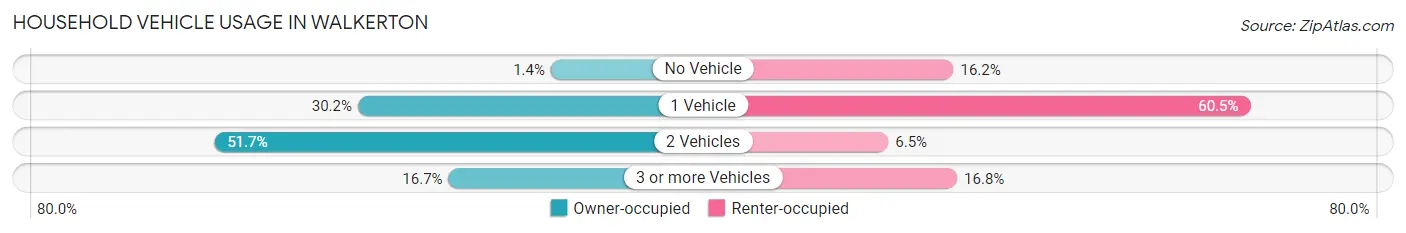
| Vehicles per Household | Owner-occupied | Renter-occupied |
| No Vehicle | 8 (1.4%) | 30 (16.2%) |
| 1 Vehicle | 172 (30.2%) | 112 (60.5%) |
| 2 Vehicles | 294 (51.7%) | 12 (6.5%) |
| 3 or more Vehicles | 95 (16.7%) | 31 (16.8%) |
| Total | 569 (100.0%) | 185 (100.0%) |
Real Estate & Mortgages in Walkerton
Real Estate and Mortgage Overview in Walkerton
| Characteristic | Without Mortgage | With Mortgage |
| Housing Units | 189 | 380 |
| Median Property Value | $120,500 | $126,400 |
| Median Household Income | $46,027 | $23 |
| Monthly Housing Costs | $462 | $0 |
| Real Estate Taxes | $1,326 | $0 |
Property Value by Mortgage Status in Walkerton
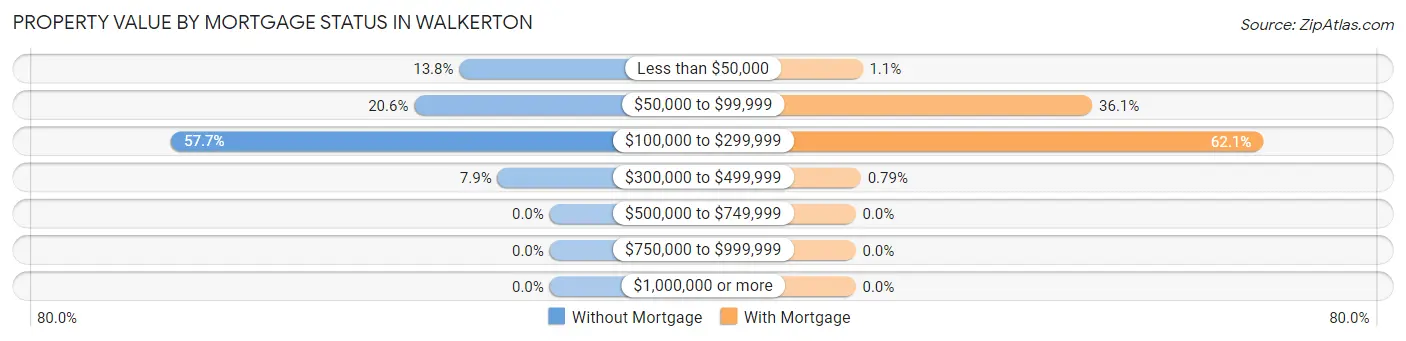
| Property Value | Without Mortgage | With Mortgage |
| Less than $50,000 | 26 (13.8%) | 4 (1.1%) |
| $50,000 to $99,999 | 39 (20.6%) | 137 (36.0%) |
| $100,000 to $299,999 | 109 (57.7%) | 236 (62.1%) |
| $300,000 to $499,999 | 15 (7.9%) | 3 (0.8%) |
| $500,000 to $749,999 | 0 (0.0%) | 0 (0.0%) |
| $750,000 to $999,999 | 0 (0.0%) | 0 (0.0%) |
| $1,000,000 or more | 0 (0.0%) | 0 (0.0%) |
| Total | 189 (100.0%) | 380 (100.0%) |
Household Income by Mortgage Status in Walkerton
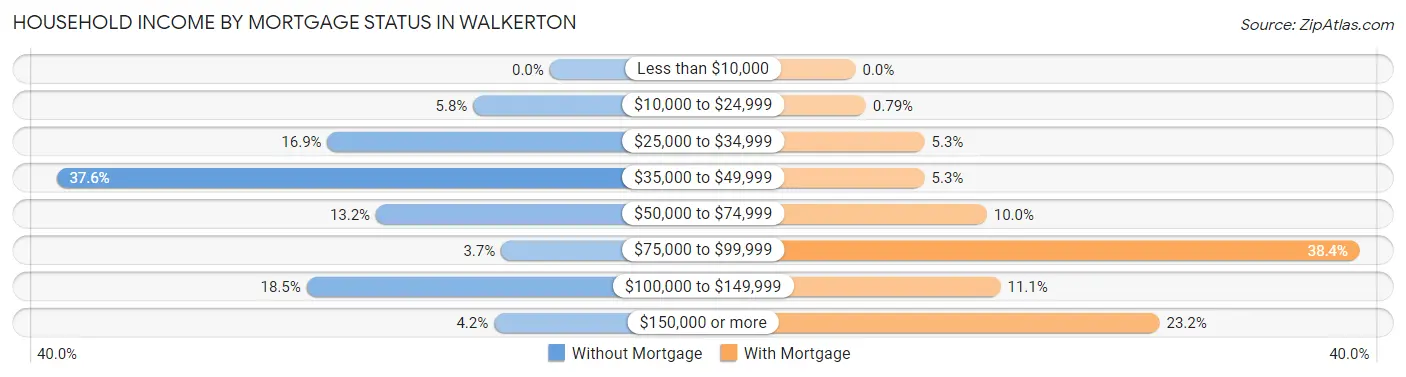
| Household Income | Without Mortgage | With Mortgage |
| Less than $10,000 | 0 (0.0%) | 0 (0.0%) |
| $10,000 to $24,999 | 11 (5.8%) | 3 (0.8%) |
| $25,000 to $34,999 | 32 (16.9%) | 20 (5.3%) |
| $35,000 to $49,999 | 71 (37.6%) | 20 (5.3%) |
| $50,000 to $74,999 | 25 (13.2%) | 38 (10.0%) |
| $75,000 to $99,999 | 7 (3.7%) | 146 (38.4%) |
| $100,000 to $149,999 | 35 (18.5%) | 42 (11.1%) |
| $150,000 or more | 8 (4.2%) | 88 (23.2%) |
| Total | 189 (100.0%) | 380 (100.0%) |
Property Value to Household Income Ratio in Walkerton
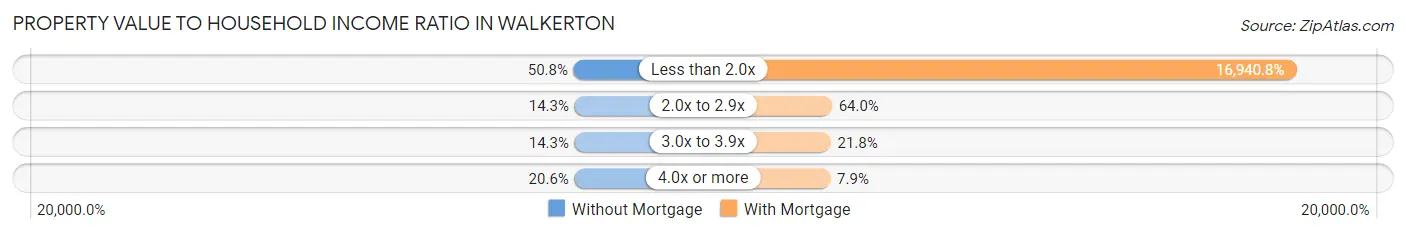
| Value-to-Income Ratio | Without Mortgage | With Mortgage |
| Less than 2.0x | 96 (50.8%) | 64,375 (16,940.8%) |
| 2.0x to 2.9x | 27 (14.3%) | 243 (63.9%) |
| 3.0x to 3.9x | 27 (14.3%) | 83 (21.8%) |
| 4.0x or more | 39 (20.6%) | 30 (7.9%) |
| Total | 189 (100.0%) | 380 (100.0%) |
Real Estate Taxes by Mortgage Status in Walkerton
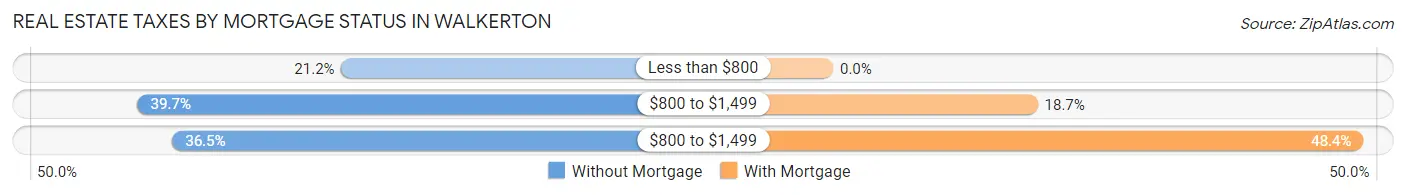
| Property Taxes | Without Mortgage | With Mortgage |
| Less than $800 | 40 (21.2%) | 0 (0.0%) |
| $800 to $1,499 | 75 (39.7%) | 71 (18.7%) |
| $800 to $1,499 | 69 (36.5%) | 184 (48.4%) |
| Total | 189 (100.0%) | 380 (100.0%) |
Health & Disability in Walkerton
Health Insurance Coverage by Age in Walkerton
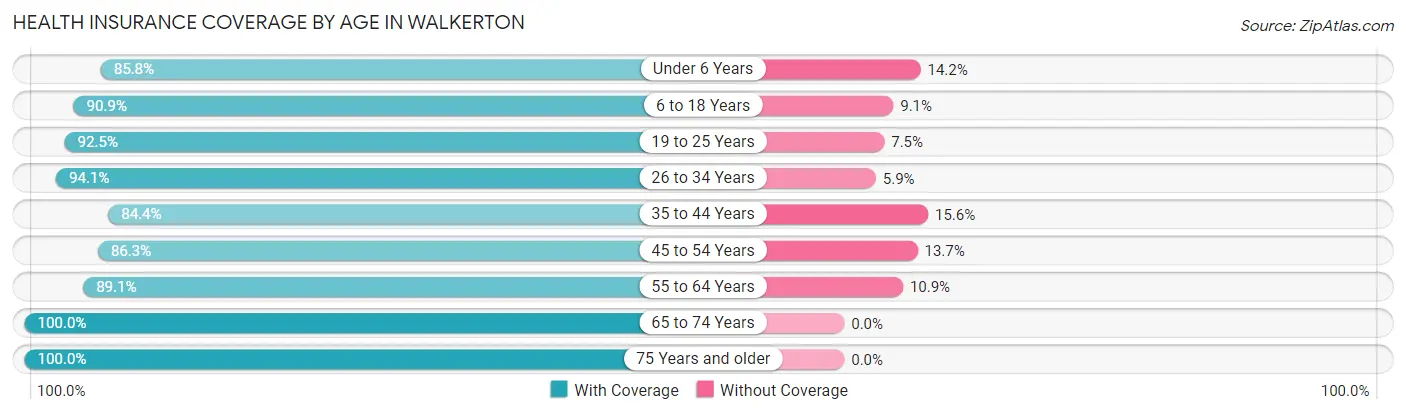
| Age Bracket | With Coverage | Without Coverage |
| Under 6 Years | 175 (85.8%) | 29 (14.2%) |
| 6 to 18 Years | 318 (90.9%) | 32 (9.1%) |
| 19 to 25 Years | 248 (92.5%) | 20 (7.5%) |
| 26 to 34 Years | 192 (94.1%) | 12 (5.9%) |
| 35 to 44 Years | 162 (84.4%) | 30 (15.6%) |
| 45 to 54 Years | 177 (86.3%) | 28 (13.7%) |
| 55 to 64 Years | 228 (89.1%) | 28 (10.9%) |
| 65 to 74 Years | 133 (100.0%) | 0 (0.0%) |
| 75 Years and older | 145 (100.0%) | 0 (0.0%) |
| Total | 1,778 (90.8%) | 179 (9.1%) |
Health Insurance Coverage by Citizenship Status in Walkerton
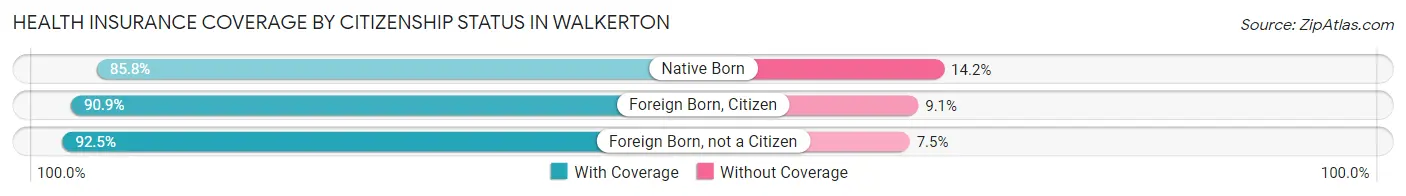
| Citizenship Status | With Coverage | Without Coverage |
| Native Born | 175 (85.8%) | 29 (14.2%) |
| Foreign Born, Citizen | 318 (90.9%) | 32 (9.1%) |
| Foreign Born, not a Citizen | 248 (92.5%) | 20 (7.5%) |
Health Insurance Coverage by Household Income in Walkerton
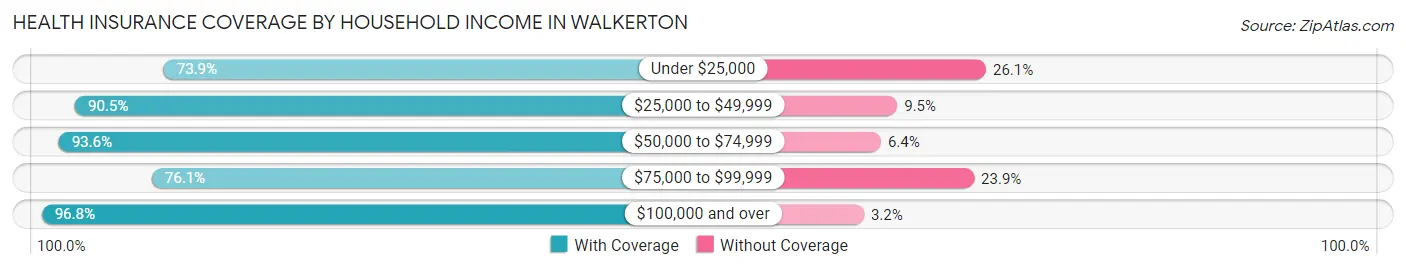
| Household Income | With Coverage | Without Coverage |
| Under $25,000 | 119 (73.9%) | 42 (26.1%) |
| $25,000 to $49,999 | 335 (90.5%) | 35 (9.5%) |
| $50,000 to $74,999 | 453 (93.6%) | 31 (6.4%) |
| $75,000 to $99,999 | 150 (76.1%) | 47 (23.9%) |
| $100,000 and over | 721 (96.8%) | 24 (3.2%) |
Public vs Private Health Insurance Coverage by Age in Walkerton
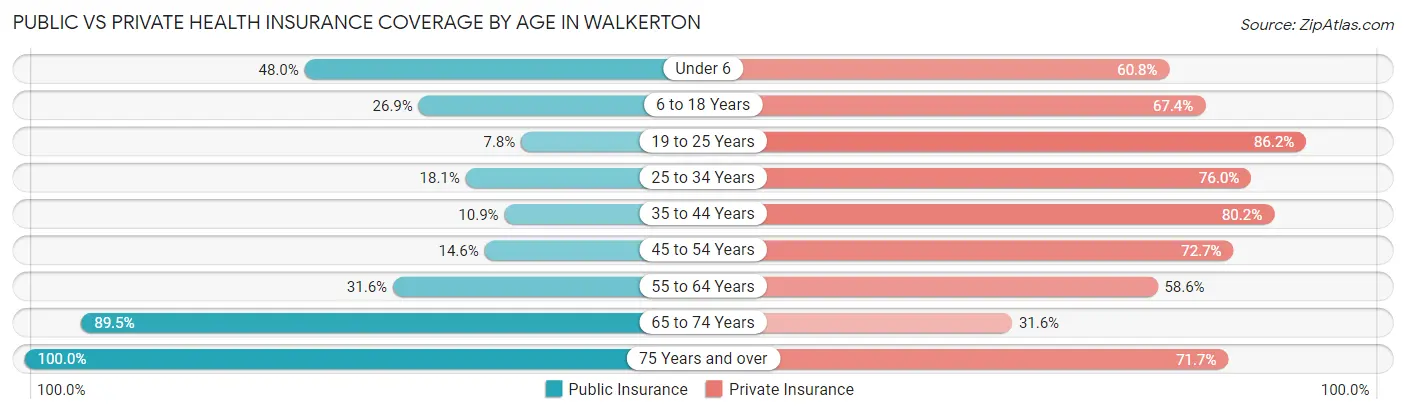
| Age Bracket | Public Insurance | Private Insurance |
| Under 6 | 98 (48.0%) | 124 (60.8%) |
| 6 to 18 Years | 94 (26.9%) | 236 (67.4%) |
| 19 to 25 Years | 21 (7.8%) | 231 (86.2%) |
| 25 to 34 Years | 37 (18.1%) | 155 (76.0%) |
| 35 to 44 Years | 21 (10.9%) | 154 (80.2%) |
| 45 to 54 Years | 30 (14.6%) | 149 (72.7%) |
| 55 to 64 Years | 81 (31.6%) | 150 (58.6%) |
| 65 to 74 Years | 119 (89.5%) | 42 (31.6%) |
| 75 Years and over | 145 (100.0%) | 104 (71.7%) |
| Total | 646 (33.0%) | 1,345 (68.7%) |
Disability Status by Sex by Age in Walkerton
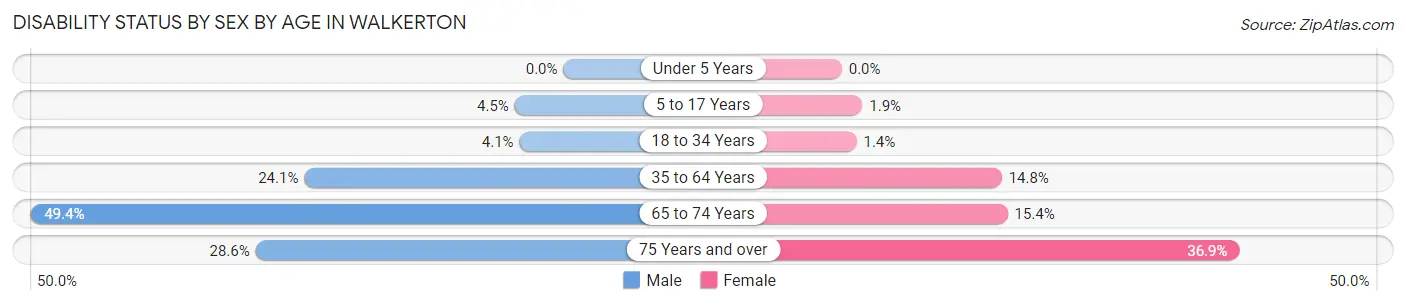
| Age Bracket | Male | Female |
| Under 5 Years | 0 (0.0%) | 0 (0.0%) |
| 5 to 17 Years | 7 (4.5%) | 4 (1.9%) |
| 18 to 34 Years | 8 (4.1%) | 4 (1.4%) |
| 35 to 64 Years | 76 (24.0%) | 50 (14.8%) |
| 65 to 74 Years | 40 (49.4%) | 8 (15.4%) |
| 75 Years and over | 12 (28.6%) | 38 (36.9%) |
Disability Class by Sex by Age in Walkerton
Disability Class: Hearing Difficulty
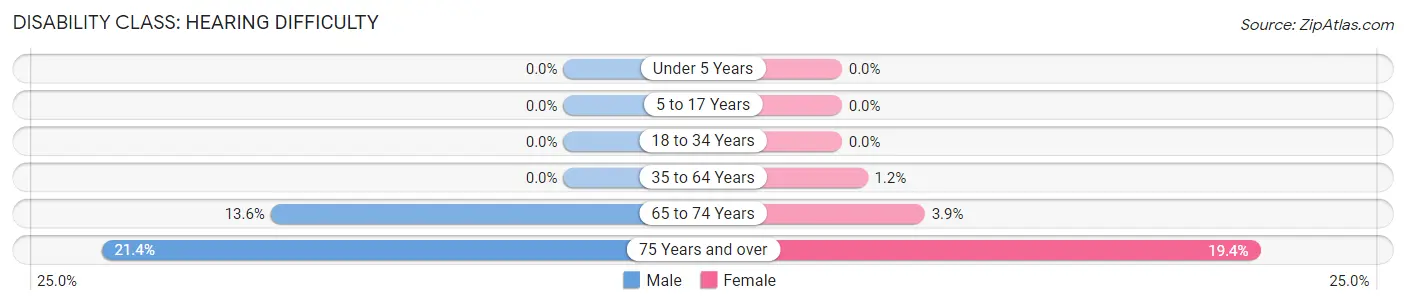
| Age Bracket | Male | Female |
| Under 5 Years | 0 (0.0%) | 0 (0.0%) |
| 5 to 17 Years | 0 (0.0%) | 0 (0.0%) |
| 18 to 34 Years | 0 (0.0%) | 0 (0.0%) |
| 35 to 64 Years | 0 (0.0%) | 4 (1.2%) |
| 65 to 74 Years | 11 (13.6%) | 2 (3.8%) |
| 75 Years and over | 9 (21.4%) | 20 (19.4%) |
Disability Class: Vision Difficulty
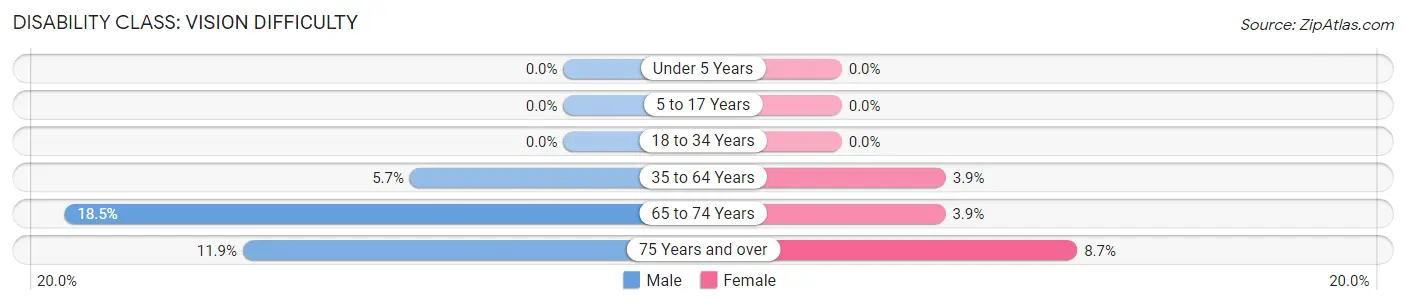
| Age Bracket | Male | Female |
| Under 5 Years | 0 (0.0%) | 0 (0.0%) |
| 5 to 17 Years | 0 (0.0%) | 0 (0.0%) |
| 18 to 34 Years | 0 (0.0%) | 0 (0.0%) |
| 35 to 64 Years | 18 (5.7%) | 13 (3.9%) |
| 65 to 74 Years | 15 (18.5%) | 2 (3.8%) |
| 75 Years and over | 5 (11.9%) | 9 (8.7%) |
Disability Class: Cognitive Difficulty
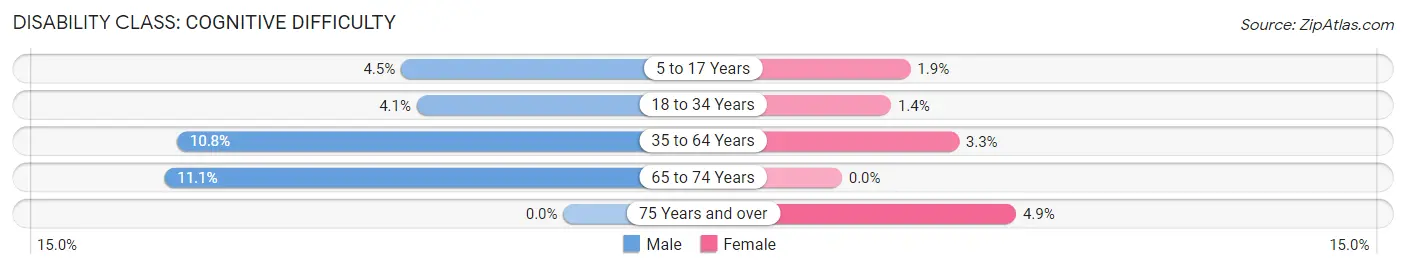
| Age Bracket | Male | Female |
| 5 to 17 Years | 7 (4.5%) | 4 (1.9%) |
| 18 to 34 Years | 8 (4.1%) | 4 (1.4%) |
| 35 to 64 Years | 34 (10.8%) | 11 (3.3%) |
| 65 to 74 Years | 9 (11.1%) | 0 (0.0%) |
| 75 Years and over | 0 (0.0%) | 5 (4.9%) |
Disability Class: Ambulatory Difficulty
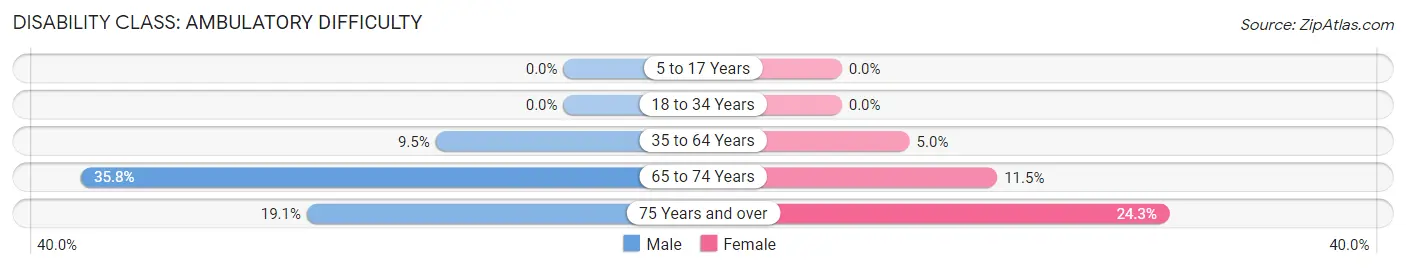
| Age Bracket | Male | Female |
| 5 to 17 Years | 0 (0.0%) | 0 (0.0%) |
| 18 to 34 Years | 0 (0.0%) | 0 (0.0%) |
| 35 to 64 Years | 30 (9.5%) | 17 (5.0%) |
| 65 to 74 Years | 29 (35.8%) | 6 (11.5%) |
| 75 Years and over | 8 (19.1%) | 25 (24.3%) |
Disability Class: Self-Care Difficulty
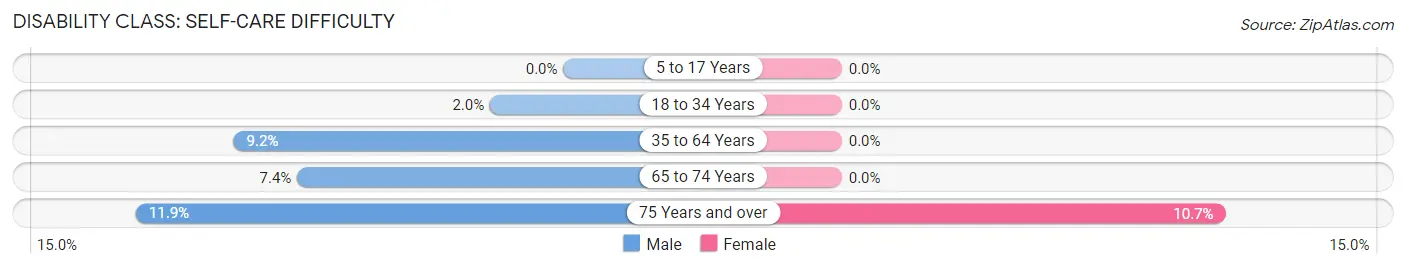
| Age Bracket | Male | Female |
| 5 to 17 Years | 0 (0.0%) | 0 (0.0%) |
| 18 to 34 Years | 4 (2.0%) | 0 (0.0%) |
| 35 to 64 Years | 29 (9.2%) | 0 (0.0%) |
| 65 to 74 Years | 6 (7.4%) | 0 (0.0%) |
| 75 Years and over | 5 (11.9%) | 11 (10.7%) |
Technology Access in Walkerton
Computing Device Access in Walkerton
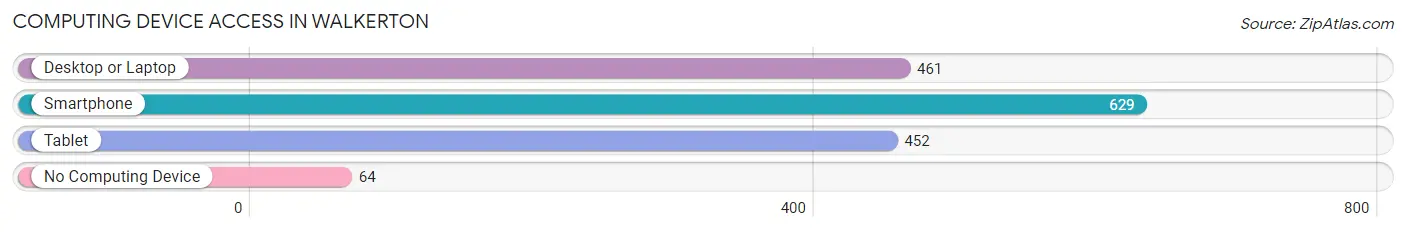
| Device Type | # Households | % Households |
| Desktop or Laptop | 461 | 61.1% |
| Smartphone | 629 | 83.4% |
| Tablet | 452 | 60.0% |
| No Computing Device | 64 | 8.5% |
| Total | 754 | 100.0% |
Internet Access in Walkerton
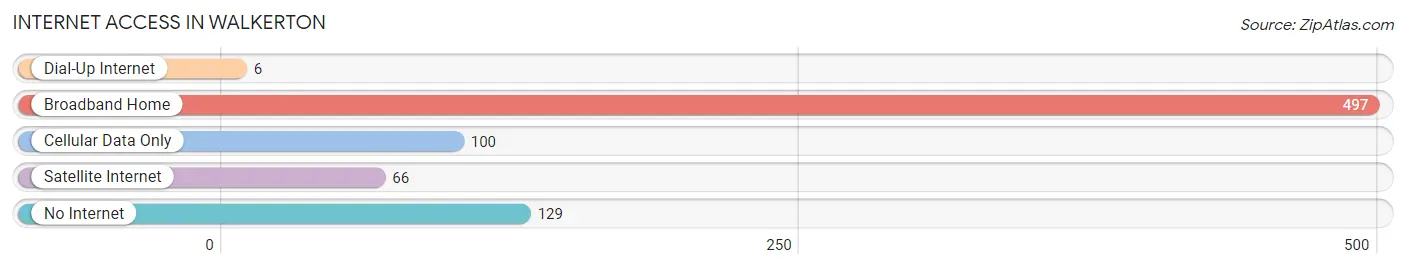
| Internet Type | # Households | % Households |
| Dial-Up Internet | 6 | 0.8% |
| Broadband Home | 497 | 65.9% |
| Cellular Data Only | 100 | 13.3% |
| Satellite Internet | 66 | 8.7% |
| No Internet | 129 | 17.1% |
| Total | 754 | 100.0% |
Walkerton Summary
Walkerton, Indiana is a small town located in St. Joseph County, in the northern part of the state. It is situated on the banks of the Yellow River, and is home to a population of approximately 2,500 people. The town was founded in 1836, and has a rich history of industry, agriculture, and culture.
Geography
Walkerton is located in the northern part of St. Joseph County, in the state of Indiana. It is situated on the banks of the Yellow River, and is surrounded by rolling hills and farmland. The town is located approximately 25 miles south of South Bend, and is about an hour and a half drive from Chicago. The town is also close to the Indiana-Michigan border, and is within a few hours drive of Detroit and other major cities in the Midwest.
The town is divided into two sections, the north and south sides. The north side is home to the majority of the town’s businesses, while the south side is mostly residential. The town is also home to a number of parks and recreational areas, including the Yellow River Park, which offers a variety of outdoor activities.
Economy
Walkerton’s economy is largely based on agriculture and manufacturing. The town is home to a number of agricultural businesses, including dairy farms, grain elevators, and feed mills. The town is also home to a number of manufacturing businesses, including a steel mill, a paper mill, and a plastics factory.
The town is also home to a number of small businesses, including restaurants, retail stores, and service providers. The town is also home to a number of professional services, including doctors, lawyers, and accountants.
Demographics
As of the 2010 census, the population of Walkerton was 2,521. The town is predominantly white, with a small African American population. The median household income in the town is $41,000, and the median age is 38.
The town is home to a number of churches, including the First United Methodist Church, the First Presbyterian Church, and the St. Joseph Catholic Church. The town is also home to a number of schools, including Walkerton Elementary School, Walkerton Middle School, and Walkerton High School.
Conclusion
Walkerton, Indiana is a small town located in St. Joseph County, in the northern part of the state. It is situated on the banks of the Yellow River, and is home to a population of approximately 2,500 people. The town was founded in 1836, and has a rich history of industry, agriculture, and culture. The town’s economy is largely based on agriculture and manufacturing, and the town is home to a number of small businesses, churches, and schools. The town is predominantly white, with a small African American population, and the median household income is $41,000.
Common Questions
What is Per Capita Income in Walkerton?
Per Capita income in Walkerton is $25,735.
What is the Median Family Income in Walkerton?
Median Family Income in Walkerton is $66,484.
What is the Median Household income in Walkerton?
Median Household Income in Walkerton is $58,553.
What is Income or Wage Gap in Walkerton?
Income or Wage Gap in Walkerton is 44.0%.
Women in Walkerton earn 56.0 cents for every dollar earned by a man.
What is Inequality or Gini Index in Walkerton?
Inequality or Gini Index in Walkerton is 0.35.
What is the Total Population of Walkerton?
Total Population of Walkerton is 2,022.
What is the Total Male Population of Walkerton?
Total Male Population of Walkerton is 887.
What is the Total Female Population of Walkerton?
Total Female Population of Walkerton is 1,135.
What is the Ratio of Males per 100 Females in Walkerton?
There are 78.15 Males per 100 Females in Walkerton.
What is the Ratio of Females per 100 Males in Walkerton?
There are 127.96 Females per 100 Males in Walkerton.
What is the Median Population Age in Walkerton?
Median Population Age in Walkerton is 34.4 Years.
What is the Average Family Size in Walkerton
Average Family Size in Walkerton is 3.2 People.
What is the Average Household Size in Walkerton
Average Household Size in Walkerton is 2.6 People.
How Large is the Labor Force in Walkerton?
There are 961 People in the Labor Forcein in Walkerton.
What is the Percentage of People in the Labor Force in Walkerton?
61.2% of People are in the Labor Force in Walkerton.
What is the Unemployment Rate in Walkerton?
Unemployment Rate in Walkerton is 4.0%.