Vallonia, IN Map & Demographics
Vallonia Map
Vallonia Overview
$37,185
PER CAPITA INCOME
$79,856
AVG FAMILY INCOME
$78,702
AVG HOUSEHOLD INCOME
1.2%
WAGE / INCOME GAP [ % ]
98.8¢/ $1
WAGE / INCOME GAP [ $ ]
0.27
INEQUALITY / GINI INDEX
354
TOTAL POPULATION
168
MALE POPULATION
186
FEMALE POPULATION
90.32
MALES / 100 FEMALES
110.71
FEMALES / 100 MALES
41.0
MEDIAN AGE
2.8
AVG FAMILY SIZE
2.5
AVG HOUSEHOLD SIZE
263
LABOR FORCE [ PEOPLE ]
82.2%
PERCENT IN LABOR FORCE
6.5%
UNEMPLOYMENT RATE
Vallonia Zip Codes
Income in Vallonia
Income Overview in Vallonia
Per Capita Income in Vallonia is $37,185, while median incomes of families and households are $79,856 and $78,702 respectively.
| Characteristic | Number | Measure |
| Per Capita Income | 354 | $37,185 |
| Median Family Income | 119 | $79,856 |
| Mean Family Income | 119 | $94,518 |
| Median Household Income | 143 | $78,702 |
| Mean Household Income | 143 | $86,301 |
| Income Deficit | 119 | $0 |
| Wage / Income Gap (%) | 354 | 1.20% |
| Wage / Income Gap ($) | 354 | 98.80¢ per $1 |
| Gini / Inequality Index | 354 | 0.27 |
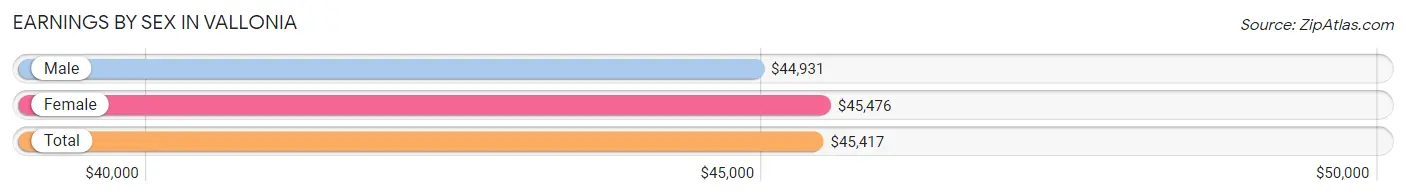
Earnings by Sex in Vallonia
Average Earnings in Vallonia are $45,417, $44,931 for men and $45,476 for women, a difference of 1.2%.
| Sex | Number | Average Earnings |
| Male | 121 (45.7%) | $44,931 |
| Female | 144 (54.3%) | $45,476 |
| Total | 265 (100.0%) | $45,417 |
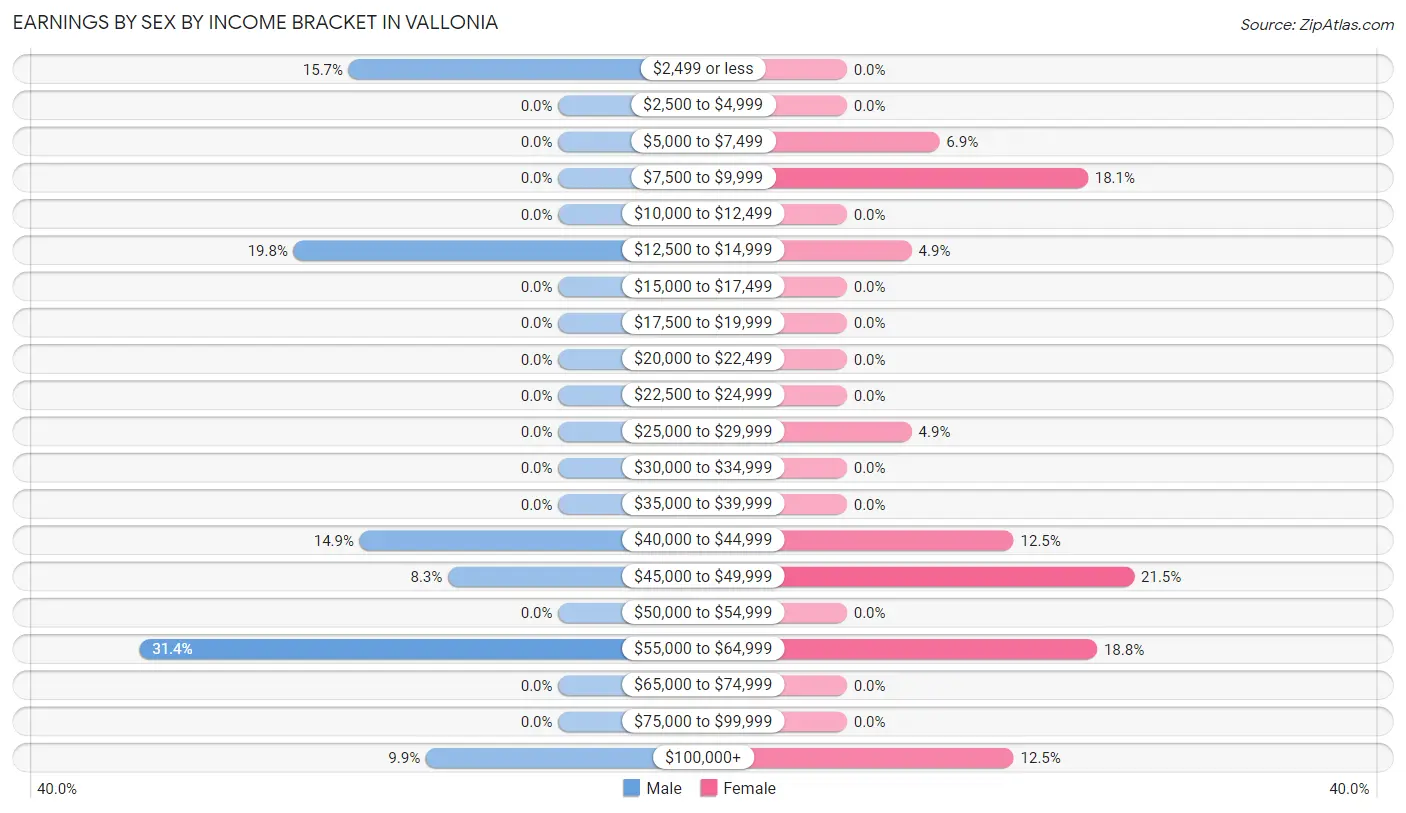
Earnings by Sex by Income Bracket in Vallonia
The most common earnings brackets in Vallonia are $55,000 to $64,999 for men (38 | 31.4%) and $45,000 to $49,999 for women (31 | 21.5%).
| Income | Male | Female |
| $2,499 or less | 19 (15.7%) | 0 (0.0%) |
| $2,500 to $4,999 | 0 (0.0%) | 0 (0.0%) |
| $5,000 to $7,499 | 0 (0.0%) | 10 (6.9%) |
| $7,500 to $9,999 | 0 (0.0%) | 26 (18.1%) |
| $10,000 to $12,499 | 0 (0.0%) | 0 (0.0%) |
| $12,500 to $14,999 | 24 (19.8%) | 7 (4.9%) |
| $15,000 to $17,499 | 0 (0.0%) | 0 (0.0%) |
| $17,500 to $19,999 | 0 (0.0%) | 0 (0.0%) |
| $20,000 to $22,499 | 0 (0.0%) | 0 (0.0%) |
| $22,500 to $24,999 | 0 (0.0%) | 0 (0.0%) |
| $25,000 to $29,999 | 0 (0.0%) | 7 (4.9%) |
| $30,000 to $34,999 | 0 (0.0%) | 0 (0.0%) |
| $35,000 to $39,999 | 0 (0.0%) | 0 (0.0%) |
| $40,000 to $44,999 | 18 (14.9%) | 18 (12.5%) |
| $45,000 to $49,999 | 10 (8.3%) | 31 (21.5%) |
| $50,000 to $54,999 | 0 (0.0%) | 0 (0.0%) |
| $55,000 to $64,999 | 38 (31.4%) | 27 (18.8%) |
| $65,000 to $74,999 | 0 (0.0%) | 0 (0.0%) |
| $75,000 to $99,999 | 0 (0.0%) | 0 (0.0%) |
| $100,000+ | 12 (9.9%) | 18 (12.5%) |
| Total | 121 (100.0%) | 144 (100.0%) |
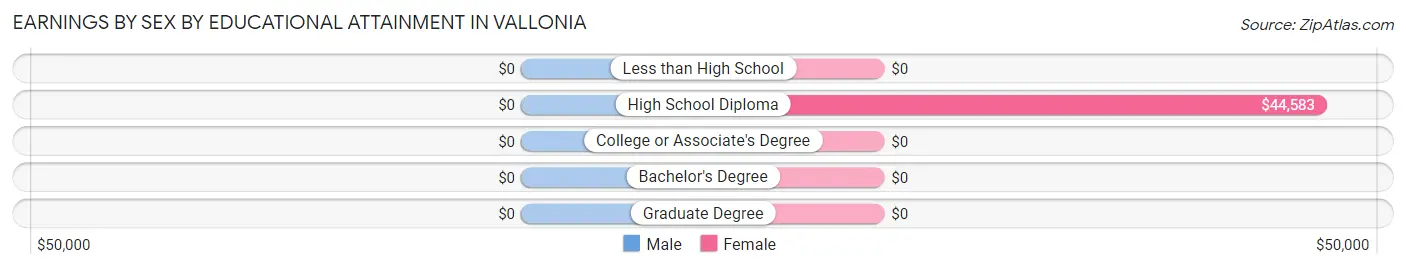
Earnings by Sex by Educational Attainment in Vallonia
| Educational Attainment | Male Income | Female Income |
| Less than High School | - | - |
| High School Diploma | - | - |
| College or Associate's Degree | - | - |
| Bachelor's Degree | - | - |
| Graduate Degree | - | - |
| Total | $55,139 | $45,476 |
Family Income in Vallonia
Family Income Brackets in Vallonia
According to the Vallonia family income data, there are 61 families falling into the $75,000 to $99,999 income range, which is the most common income bracket and makes up 51.3% of all families.
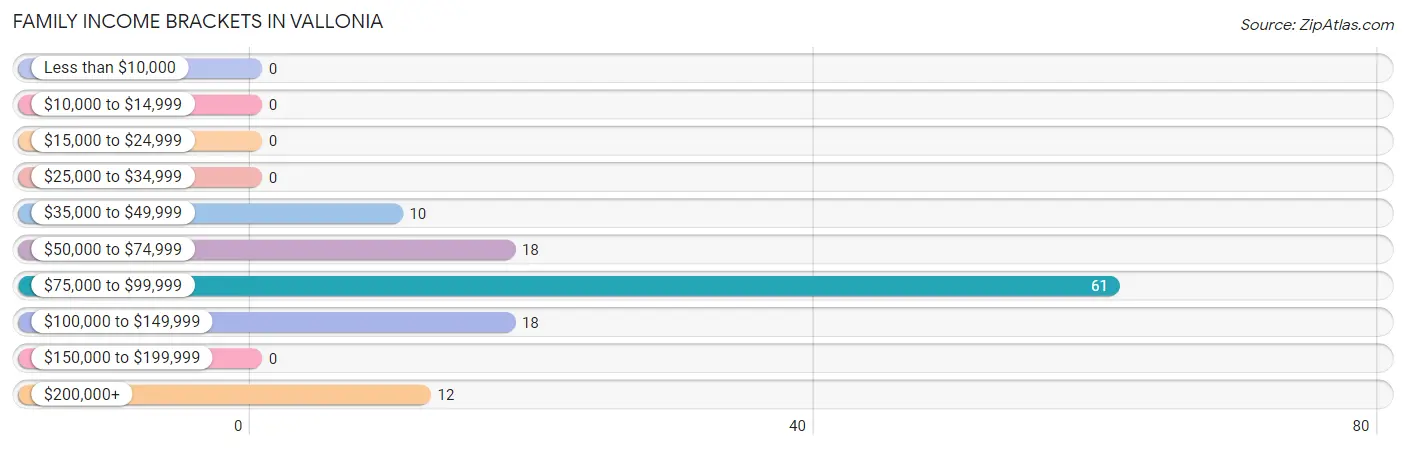
| Income Bracket | # Families | % Families |
| Less than $10,000 | 0 | 0.0% |
| $10,000 to $14,999 | 0 | 0.0% |
| $15,000 to $24,999 | 0 | 0.0% |
| $25,000 to $34,999 | 0 | 0.0% |
| $35,000 to $49,999 | 10 | 8.4% |
| $50,000 to $74,999 | 18 | 15.1% |
| $75,000 to $99,999 | 61 | 51.3% |
| $100,000 to $149,999 | 18 | 15.1% |
| $150,000 to $199,999 | 0 | 0.0% |
| $200,000+ | 12 | 10.1% |
Family Income by Famaliy Size in Vallonia
2-person families (63 | 52.9%) account for the highest median family income in Vallonia with $76,250 per family, while 2-person families (63 | 52.9%) have the highest median income of $38,125 per family member.
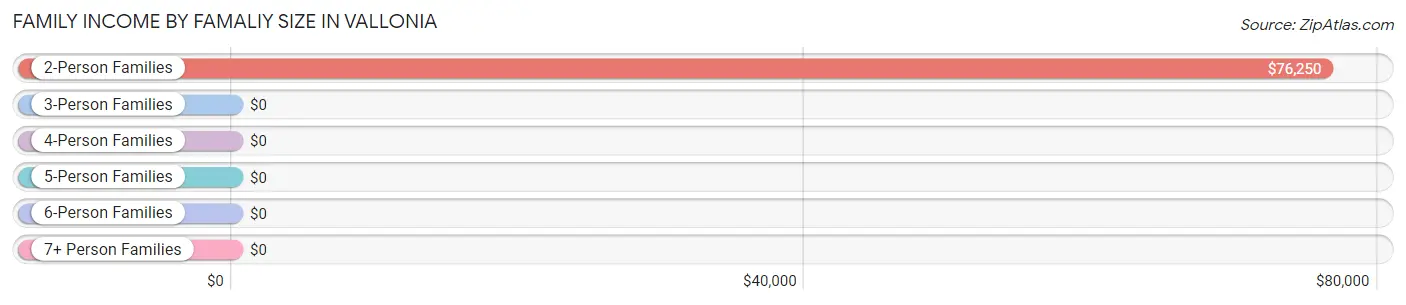
| Income Bracket | # Families | Median Income |
| 2-Person Families | 63 (52.9%) | $76,250 |
| 3-Person Families | 30 (25.2%) | $0 |
| 4-Person Families | 26 (21.8%) | $0 |
| 5-Person Families | 0 (0.0%) | $0 |
| 6-Person Families | 0 (0.0%) | $0 |
| 7+ Person Families | 0 (0.0%) | $0 |
| Total | 119 (100.0%) | $79,856 |
Family Income by Number of Earners in Vallonia
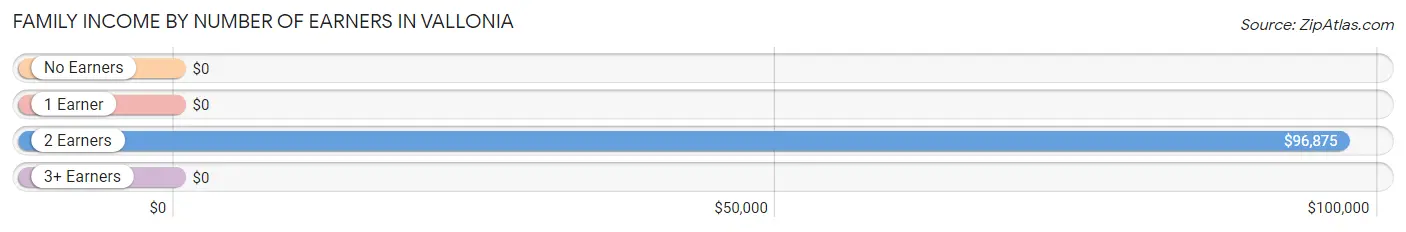
| Number of Earners | # Families | Median Income |
| No Earners | 9 (7.6%) | $0 |
| 1 Earner | 19 (16.0%) | $0 |
| 2 Earners | 65 (54.6%) | $96,875 |
| 3+ Earners | 26 (21.8%) | $0 |
| Total | 119 (100.0%) | $79,856 |
Household Income in Vallonia
Household Income Brackets in Vallonia
With 61 households falling in the category, the $75,000 to $99,999 income range is the most frequent in Vallonia, accounting for 42.7% of all households.
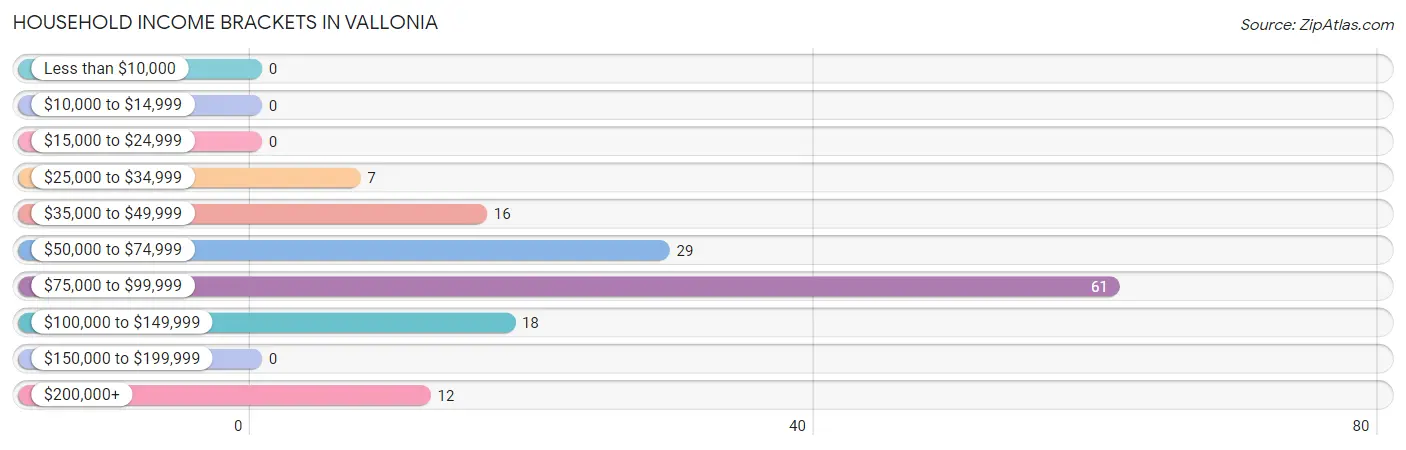
| Income Bracket | # Households | % Households |
| Less than $10,000 | 0 | 0.0% |
| $10,000 to $14,999 | 0 | 0.0% |
| $15,000 to $24,999 | 0 | 0.0% |
| $25,000 to $34,999 | 7 | 4.9% |
| $35,000 to $49,999 | 16 | 11.2% |
| $50,000 to $74,999 | 29 | 20.3% |
| $75,000 to $99,999 | 61 | 42.7% |
| $100,000 to $149,999 | 18 | 12.6% |
| $150,000 to $199,999 | 0 | 0.0% |
| $200,000+ | 12 | 8.4% |
Household Income by Householder Age in Vallonia
The median household income in Vallonia is $78,702, with the highest median household income of $96,125 found in the 45 to 64 years age bracket for the primary householder. A total of 71 households (49.6%) fall into this category.
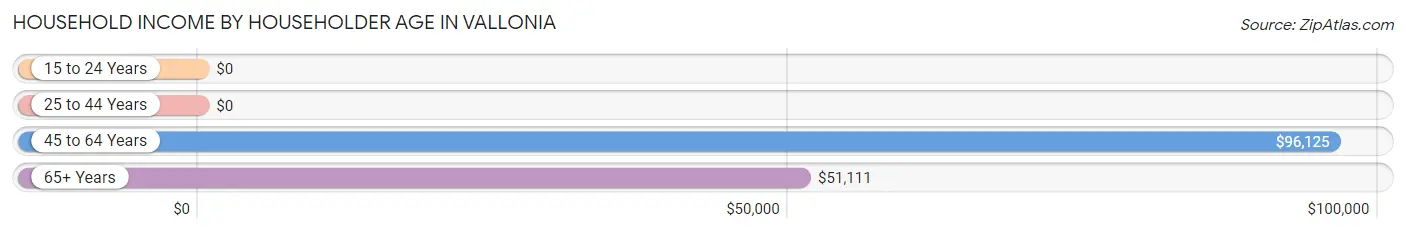
| Income Bracket | # Households | Median Income |
| 15 to 24 Years | 0 (0.0%) | $0 |
| 25 to 44 Years | 44 (30.8%) | $0 |
| 45 to 64 Years | 71 (49.6%) | $96,125 |
| 65+ Years | 28 (19.6%) | $51,111 |
| Total | 143 (100.0%) | $78,702 |
Poverty in Vallonia
Income Below Poverty by Sex and Age in Vallonia
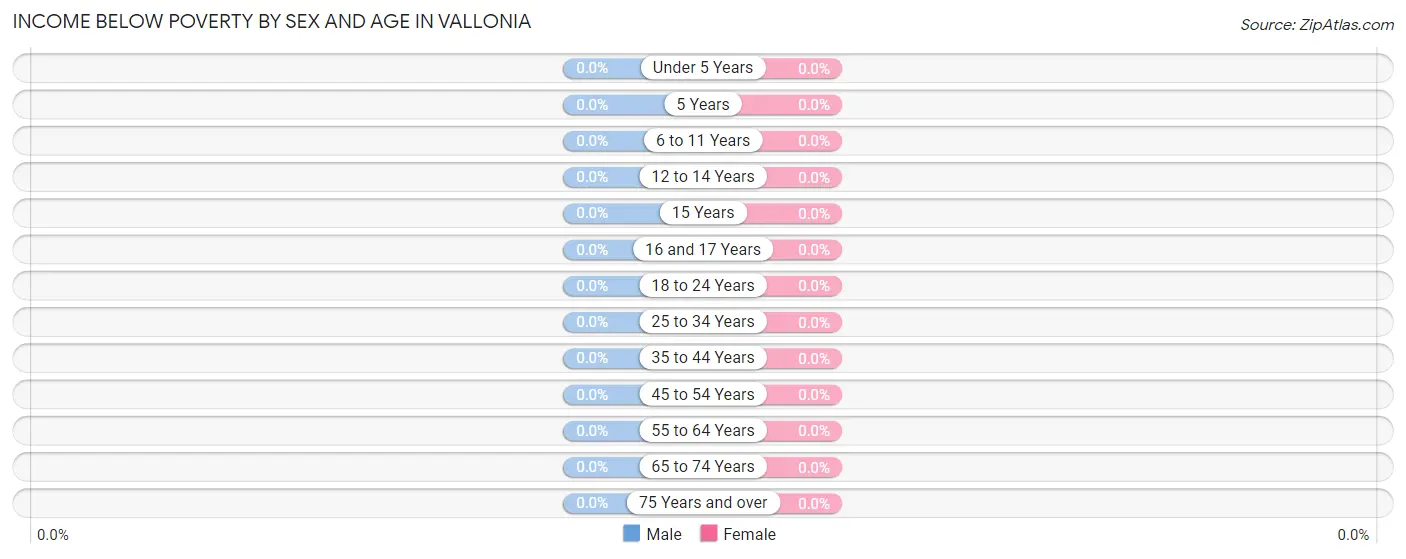
| Age Bracket | Male | Female |
| Under 5 Years | 0 (0.0%) | 0 (0.0%) |
| 5 Years | 0 (0.0%) | 0 (0.0%) |
| 6 to 11 Years | 0 (0.0%) | 0 (0.0%) |
| 12 to 14 Years | 0 (0.0%) | 0 (0.0%) |
| 15 Years | 0 (0.0%) | 0 (0.0%) |
| 16 and 17 Years | 0 (0.0%) | 0 (0.0%) |
| 18 to 24 Years | 0 (0.0%) | 0 (0.0%) |
| 25 to 34 Years | 0 (0.0%) | 0 (0.0%) |
| 35 to 44 Years | 0 (0.0%) | 0 (0.0%) |
| 45 to 54 Years | 0 (0.0%) | 0 (0.0%) |
| 55 to 64 Years | 0 (0.0%) | 0 (0.0%) |
| 65 to 74 Years | 0 (0.0%) | 0 (0.0%) |
| 75 Years and over | 0 (0.0%) | 0 (0.0%) |
| Total | 0 (0.0%) | 0 (0.0%) |
Income Above Poverty by Sex and Age in Vallonia
According to the poverty statistics in Vallonia, males aged 15 years and females aged 12 to 14 years are the age groups that are most secure financially, with 100.0% of males and 100.0% of females in these age groups living above the poverty line.
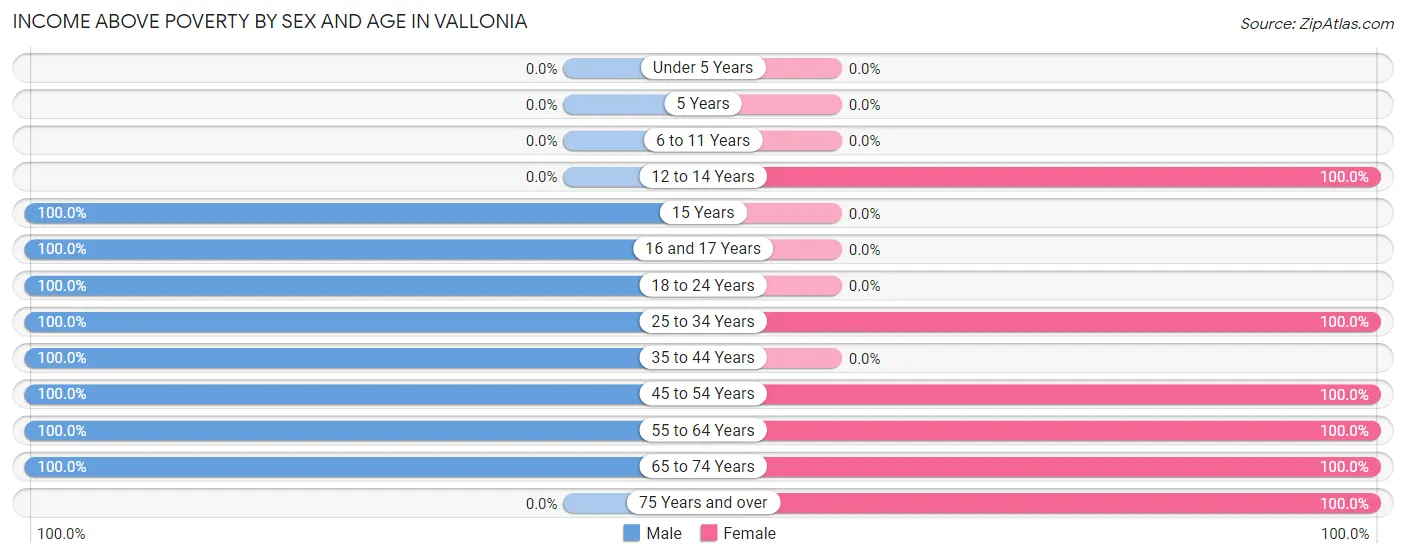
| Age Bracket | Male | Female |
| Under 5 Years | 0 (0.0%) | 0 (0.0%) |
| 5 Years | 0 (0.0%) | 0 (0.0%) |
| 6 to 11 Years | 0 (0.0%) | 0 (0.0%) |
| 12 to 14 Years | 0 (0.0%) | 23 (100.0%) |
| 15 Years | 11 (100.0%) | 0 (0.0%) |
| 16 and 17 Years | 24 (100.0%) | 0 (0.0%) |
| 18 to 24 Years | 17 (100.0%) | 0 (0.0%) |
| 25 to 34 Years | 18 (100.0%) | 47 (100.0%) |
| 35 to 44 Years | 38 (100.0%) | 0 (0.0%) |
| 45 to 54 Years | 12 (100.0%) | 36 (100.0%) |
| 55 to 64 Years | 29 (100.0%) | 61 (100.0%) |
| 65 to 74 Years | 19 (100.0%) | 10 (100.0%) |
| 75 Years and over | 0 (0.0%) | 9 (100.0%) |
| Total | 168 (100.0%) | 186 (100.0%) |
Income Below Poverty Among Married-Couple Families in Vallonia
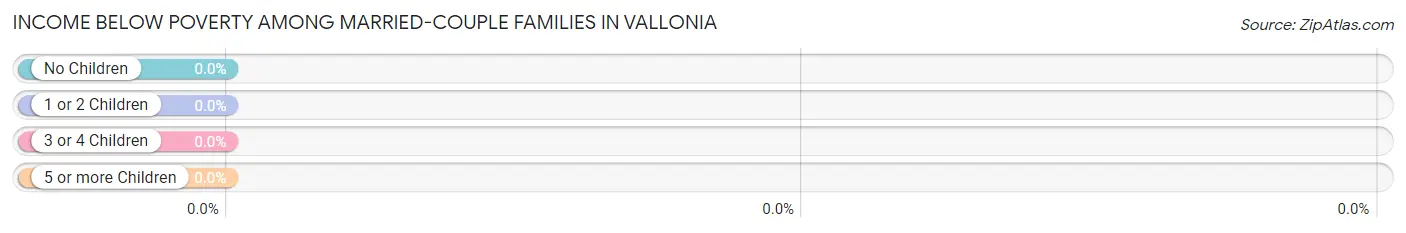
| Children | Above Poverty | Below Poverty |
| No Children | 65 (100.0%) | 0 (0.0%) |
| 1 or 2 Children | 38 (100.0%) | 0 (0.0%) |
| 3 or 4 Children | 0 (0.0%) | 0 (0.0%) |
| 5 or more Children | 0 (0.0%) | 0 (0.0%) |
| Total | 103 (100.0%) | 0 (0.0%) |
Income Below Poverty Among Single-Parent Households in Vallonia
| Children | Single Father | Single Mother |
| No Children | 0 (0.0%) | 0 (0.0%) |
| 1 or 2 Children | 0 (0.0%) | 0 (0.0%) |
| 3 or 4 Children | 0 (0.0%) | 0 (0.0%) |
| 5 or more Children | 0 (0.0%) | 0 (0.0%) |
| Total | 0 (0.0%) | 0 (0.0%) |
Income Below Poverty Among Married-Couple vs Single-Parent Households in Vallonia
| Children | Married-Couple Families | Single-Parent Households |
| No Children | 0 (0.0%) | 0 (0.0%) |
| 1 or 2 Children | 0 (0.0%) | 0 (0.0%) |
| 3 or 4 Children | 0 (0.0%) | 0 (0.0%) |
| 5 or more Children | 0 (0.0%) | 0 (0.0%) |
| Total | 0 (0.0%) | 0 (0.0%) |
Race in Vallonia
The most populous races in Vallonia are , and White / Caucasian (354 | 100.0%).
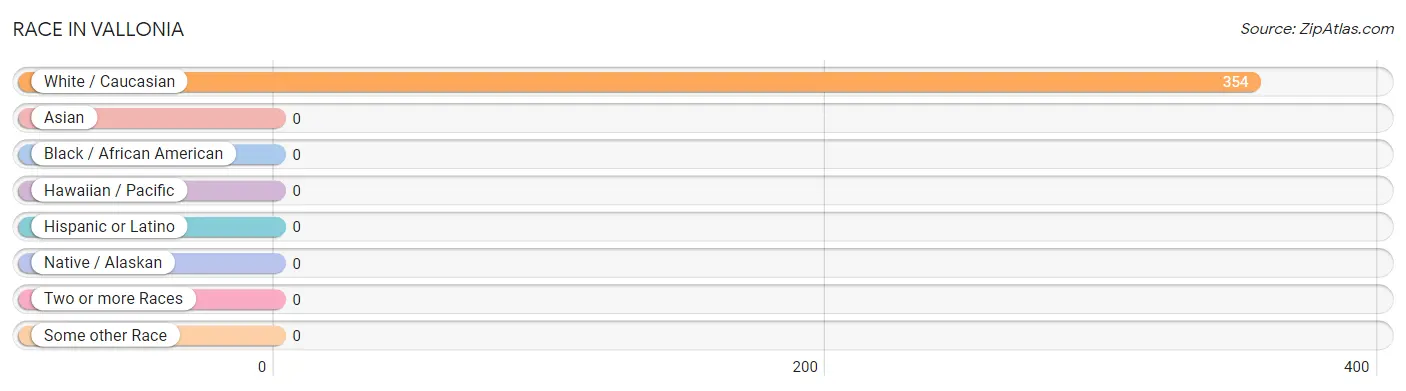
| Race | # Population | % Population |
| Asian | 0 | 0.0% |
| Black / African American | 0 | 0.0% |
| Hawaiian / Pacific | 0 | 0.0% |
| Hispanic or Latino | 0 | 0.0% |
| Native / Alaskan | 0 | 0.0% |
| White / Caucasian | 354 | 100.0% |
| Two or more Races | 0 | 0.0% |
| Some other Race | 0 | 0.0% |
| Total | 354 | 100.0% |
Ancestry in Vallonia
The most populous ancestries reported in Vallonia are German (116 | 32.8%), American (57 | 16.1%), Scottish (49 | 13.8%), English (38 | 10.7%), and Irish (18 | 5.1%), together accounting for 78.5% of all Vallonia residents.
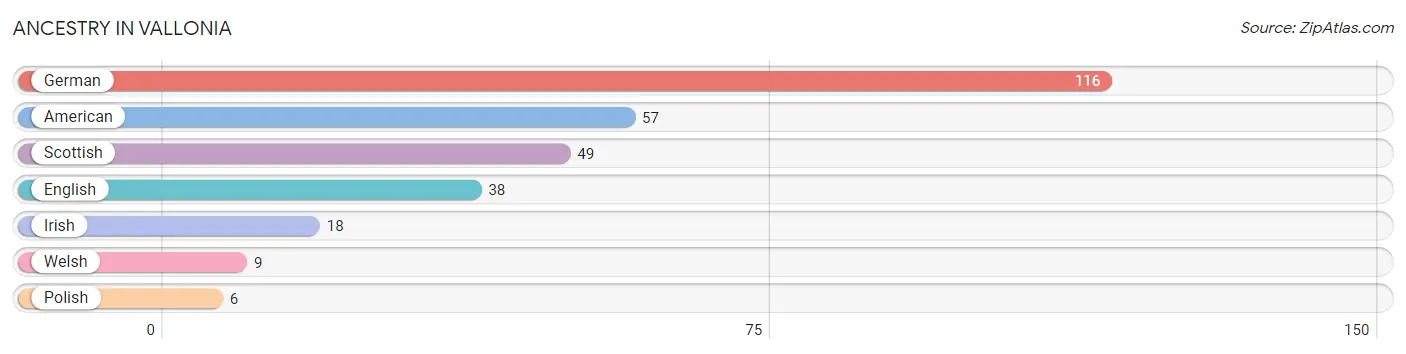
| Ancestry | # Population | % Population |
| American | 57 | 16.1% |
| English | 38 | 10.7% |
| German | 116 | 32.8% |
| Irish | 18 | 5.1% |
| Polish | 6 | 1.7% |
| Scottish | 49 | 13.8% |
| Welsh | 9 | 2.5% | View All 7 Rows |
Immigrants in Vallonia

| Immigration Origin | # Population | % Population | View All 0 Rows |
Sex and Age in Vallonia
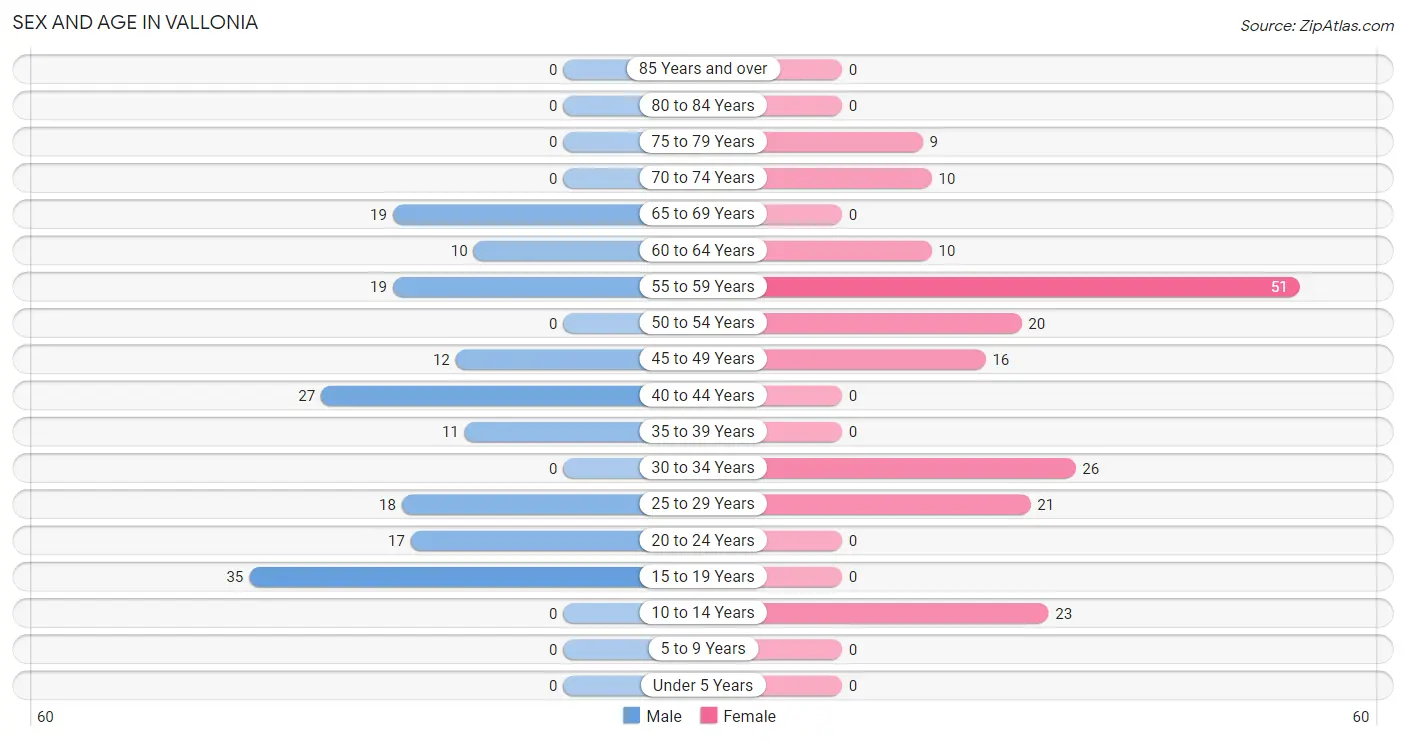
Sex and Age in Vallonia
The most populous age groups in Vallonia are 15 to 19 Years (35 | 20.8%) for men and 55 to 59 Years (51 | 27.4%) for women.
| Age Bracket | Male | Female |
| Under 5 Years | 0 (0.0%) | 0 (0.0%) |
| 5 to 9 Years | 0 (0.0%) | 0 (0.0%) |
| 10 to 14 Years | 0 (0.0%) | 23 (12.4%) |
| 15 to 19 Years | 35 (20.8%) | 0 (0.0%) |
| 20 to 24 Years | 17 (10.1%) | 0 (0.0%) |
| 25 to 29 Years | 18 (10.7%) | 21 (11.3%) |
| 30 to 34 Years | 0 (0.0%) | 26 (14.0%) |
| 35 to 39 Years | 11 (6.6%) | 0 (0.0%) |
| 40 to 44 Years | 27 (16.1%) | 0 (0.0%) |
| 45 to 49 Years | 12 (7.1%) | 16 (8.6%) |
| 50 to 54 Years | 0 (0.0%) | 20 (10.7%) |
| 55 to 59 Years | 19 (11.3%) | 51 (27.4%) |
| 60 to 64 Years | 10 (5.9%) | 10 (5.4%) |
| 65 to 69 Years | 19 (11.3%) | 0 (0.0%) |
| 70 to 74 Years | 0 (0.0%) | 10 (5.4%) |
| 75 to 79 Years | 0 (0.0%) | 9 (4.8%) |
| 80 to 84 Years | 0 (0.0%) | 0 (0.0%) |
| 85 Years and over | 0 (0.0%) | 0 (0.0%) |
| Total | 168 (100.0%) | 186 (100.0%) |
Families and Households in Vallonia
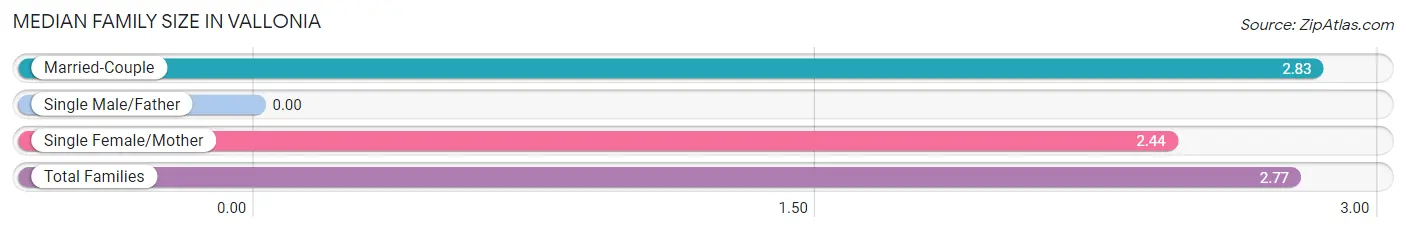
Median Family Size in Vallonia
| Family Type | # Families | Family Size |
| Married-Couple | 103 (86.6%) | 2.83 |
| Single Male/Father | 0 (0.0%) | - |
| Single Female/Mother | 16 (13.5%) | 2.44 |
| Total Families | 119 (100.0%) | 2.77 |
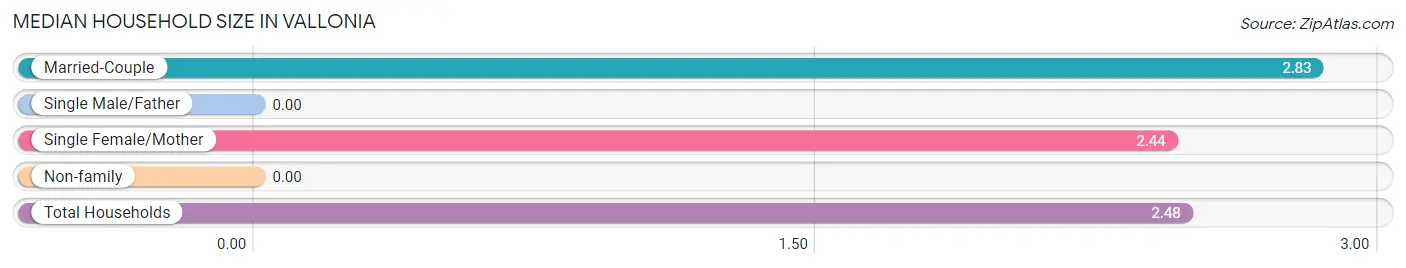
Median Household Size in Vallonia
| Household Type | # Households | Household Size |
| Married-Couple | 103 (72.0%) | 2.83 |
| Single Male/Father | 0 (0.0%) | - |
| Single Female/Mother | 16 (11.2%) | 2.44 |
| Non-family | 24 (16.8%) | - |
| Total Households | 143 (100.0%) | 2.48 |
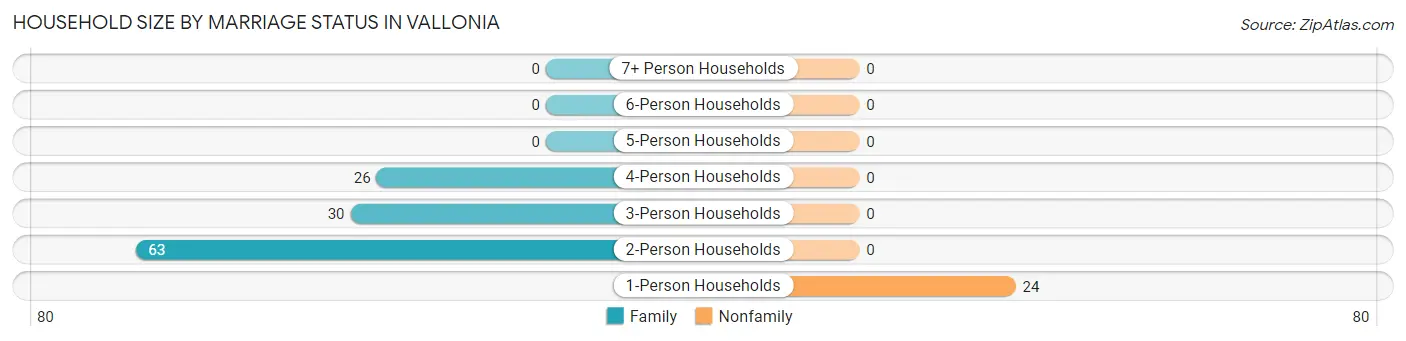
Household Size by Marriage Status in Vallonia
Out of a total of 143 households in Vallonia, 119 (83.2%) are family households, while 24 (16.8%) are nonfamily households. The most numerous type of family households are 2-person households, comprising 63, and the most common type of nonfamily households are 1-person households, comprising 24.
| Household Size | Family Households | Nonfamily Households |
| 1-Person Households | - | 24 (16.8%) |
| 2-Person Households | 63 (44.1%) | 0 (0.0%) |
| 3-Person Households | 30 (21.0%) | 0 (0.0%) |
| 4-Person Households | 26 (18.2%) | 0 (0.0%) |
| 5-Person Households | 0 (0.0%) | 0 (0.0%) |
| 6-Person Households | 0 (0.0%) | 0 (0.0%) |
| 7+ Person Households | 0 (0.0%) | 0 (0.0%) |
| Total | 119 (83.2%) | 24 (16.8%) |
Female Fertility in Vallonia
Fertility by Age in Vallonia
| Age Bracket | Women with Births | Births / 1,000 Women |
| 15 to 19 years | 0 (0.0%) | 0.0 |
| 20 to 34 years | 0 (0.0%) | 0.0 |
| 35 to 50 years | 0 (0.0%) | 0.0 |
| Total | 0 (0.0%) | 0.0 |
Fertility by Age by Marriage Status in Vallonia
| Age Bracket | Married | Unmarried |
| 15 to 19 years | 0 (0.0%) | 0 (0.0%) |
| 20 to 34 years | 0 (0.0%) | 0 (0.0%) |
| 35 to 50 years | 0 (0.0%) | 0 (0.0%) |
| Total | 0 (0.0%) | 0 (0.0%) |
Fertility by Education in Vallonia
| Educational Attainment | Women with Births | Births / 1,000 Women |
| Less than High School | 0 (0.0%) | 0.0 |
| High School Diploma | 0 (0.0%) | 0.0 |
| College or Associate's Degree | 0 (0.0%) | 0.0 |
| Bachelor's Degree | 0 (0.0%) | 0.0 |
| Graduate Degree | 0 (0.0%) | 0.0 |
| Total | 0 (0.0%) | 0.0 |
Fertility by Education by Marriage Status in Vallonia
| Educational Attainment | Married | Unmarried |
| Less than High School | 0 (0.0%) | 0 (0.0%) |
| High School Diploma | 0 (0.0%) | 0 (0.0%) |
| College or Associate's Degree | 0 (0.0%) | 0 (0.0%) |
| Bachelor's Degree | 0 (0.0%) | 0 (0.0%) |
| Graduate Degree | 0 (0.0%) | 0 (0.0%) |
| Total | 0 (0.0%) | 0 (0.0%) |
Employment Characteristics in Vallonia
Employment by Class of Employer in Vallonia
Among the 246 employed individuals in Vallonia, private company employees (212 | 86.2%), state government employees (18 | 7.3%), and not-for-profit organizations (16 | 6.5%) make up the most common classes of employment.
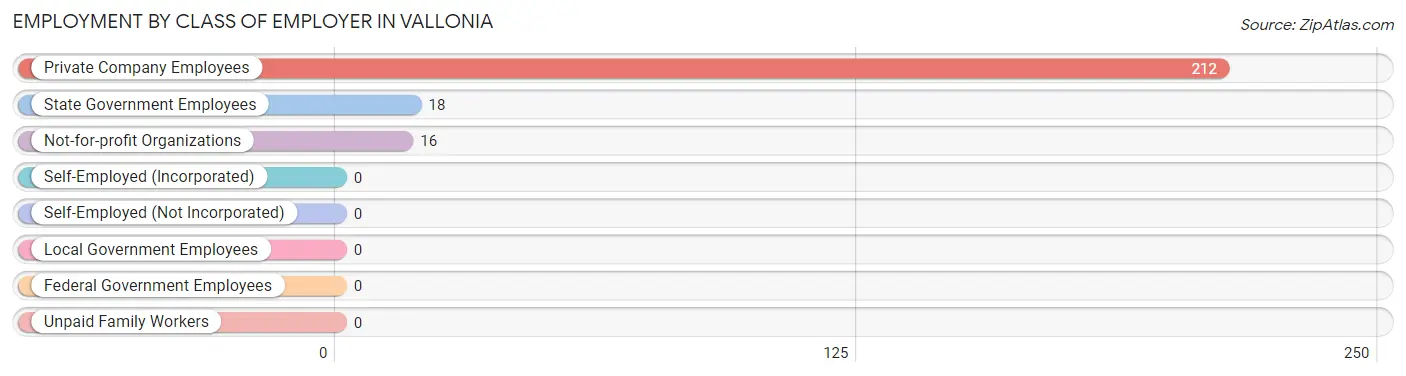
| Employer Class | # Employees | % Employees |
| Private Company Employees | 212 | 86.2% |
| Self-Employed (Incorporated) | 0 | 0.0% |
| Self-Employed (Not Incorporated) | 0 | 0.0% |
| Not-for-profit Organizations | 16 | 6.5% |
| Local Government Employees | 0 | 0.0% |
| State Government Employees | 18 | 7.3% |
| Federal Government Employees | 0 | 0.0% |
| Unpaid Family Workers | 0 | 0.0% |
| Total | 246 | 100.0% |
Employment Status by Age in Vallonia
According to the labor force statistics for Vallonia, out of the total population over 16 years of age (320), 82.2% or 263 individuals are in the labor force, with 6.5% or 17 of them unemployed. The age group with the highest labor force participation rate is 16 to 19 years, with 100.0% or 24 individuals in the labor force. Within the labor force, the 20 to 24 years age range has the highest percentage of unemployed individuals, with 100.0% or 17 of them being unemployed.
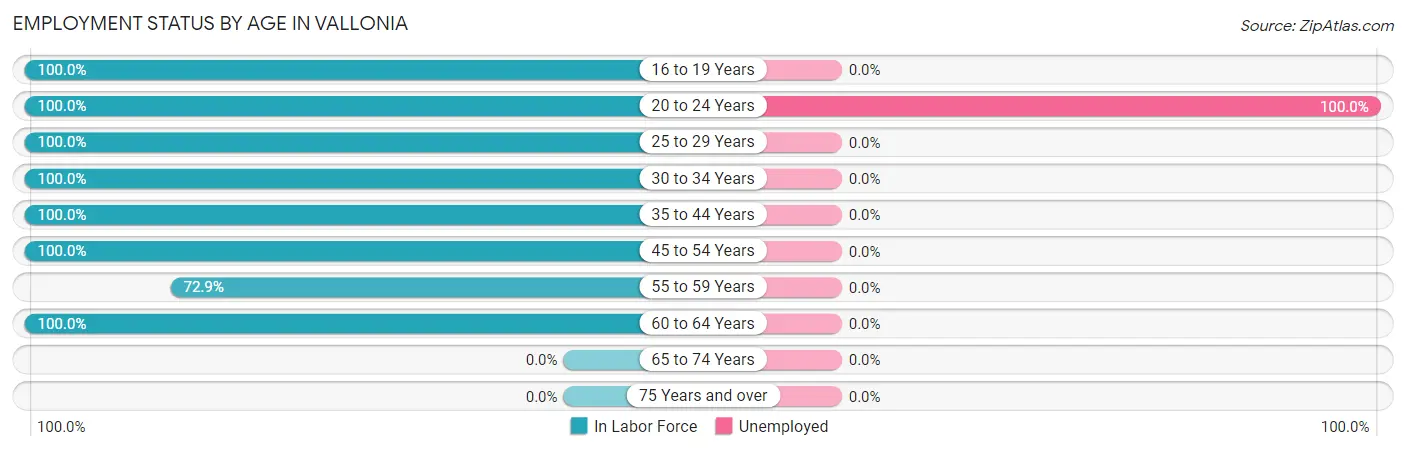
| Age Bracket | In Labor Force | Unemployed |
| 16 to 19 Years | 24 (100.0%) | 0 (0.0%) |
| 20 to 24 Years | 17 (100.0%) | 17 (100.0%) |
| 25 to 29 Years | 39 (100.0%) | 0 (0.0%) |
| 30 to 34 Years | 26 (100.0%) | 0 (0.0%) |
| 35 to 44 Years | 38 (100.0%) | 0 (0.0%) |
| 45 to 54 Years | 48 (100.0%) | 0 (0.0%) |
| 55 to 59 Years | 51 (72.9%) | 0 (0.0%) |
| 60 to 64 Years | 20 (100.0%) | 0 (0.0%) |
| 65 to 74 Years | 0 (0.0%) | 0 (0.0%) |
| 75 Years and over | 0 (0.0%) | 0 (0.0%) |
| Total | 263 (82.2%) | 17 (6.5%) |
Employment Status by Educational Attainment in Vallonia
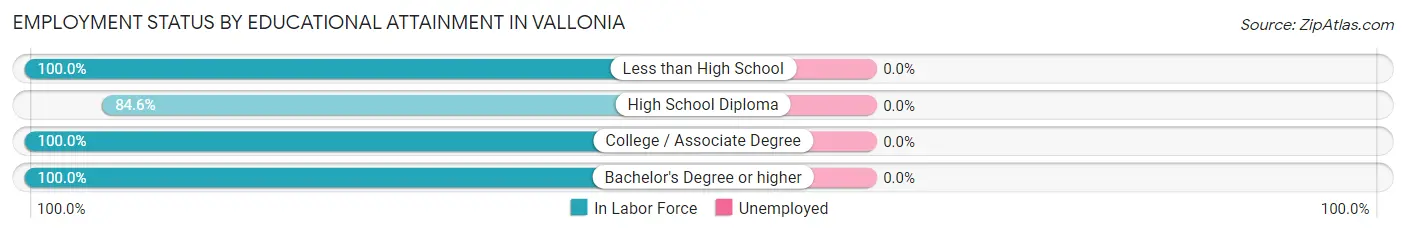
| Educational Attainment | In Labor Force | Unemployed |
| Less than High School | 10 (100.0%) | 0 (0.0%) |
| High School Diploma | 104 (84.6%) | 0 (0.0%) |
| College / Associate Degree | 73 (100.0%) | 0 (0.0%) |
| Bachelor's Degree or higher | 35 (100.0%) | 0 (0.0%) |
| Total | 222 (92.1%) | 0 (0.0%) |
Employment Occupations by Sex in Vallonia
Management, Business, Science and Arts Occupations
The most common Management, Business, Science and Arts occupations in Vallonia are Management (19 | 7.7%), Health Diagnosing & Treating (18 | 7.3%), Health Technologists (18 | 7.3%), Community & Social Service (16 | 6.5%), and Education, Arts & Media (16 | 6.5%).
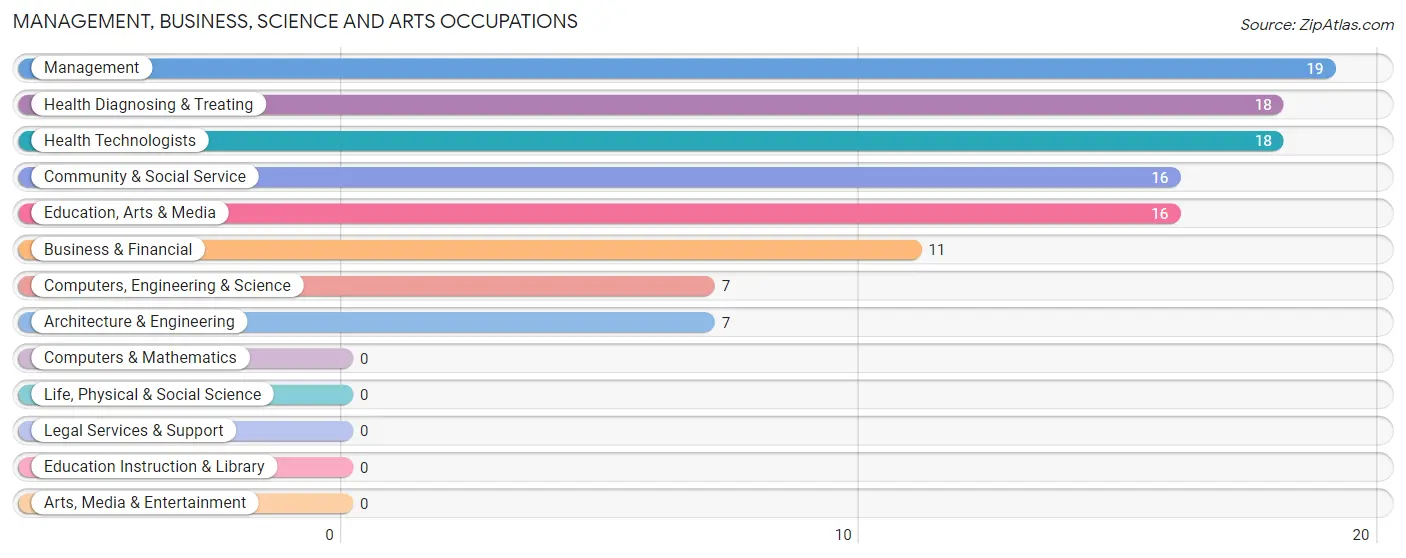
Management, Business, Science and Arts Occupations by Sex
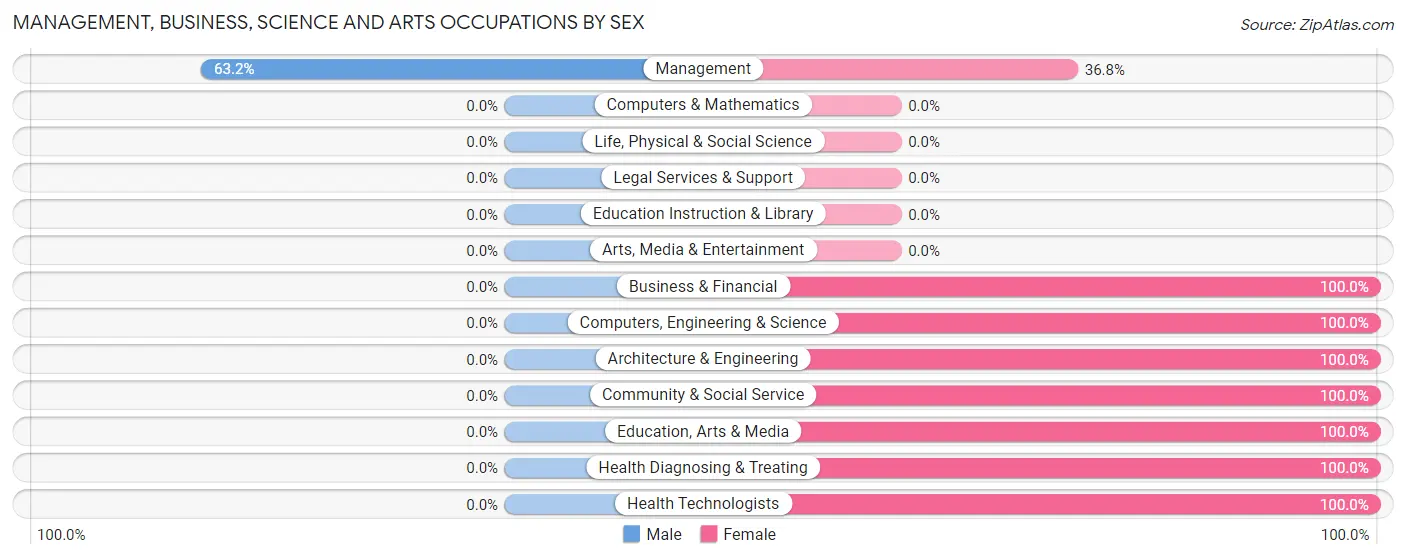
| Occupation | Male | Female |
| Management | 12 (63.2%) | 7 (36.8%) |
| Business & Financial | 0 (0.0%) | 11 (100.0%) |
| Computers, Engineering & Science | 0 (0.0%) | 7 (100.0%) |
| Computers & Mathematics | 0 (0.0%) | 0 (0.0%) |
| Architecture & Engineering | 0 (0.0%) | 7 (100.0%) |
| Life, Physical & Social Science | 0 (0.0%) | 0 (0.0%) |
| Community & Social Service | 0 (0.0%) | 16 (100.0%) |
| Education, Arts & Media | 0 (0.0%) | 16 (100.0%) |
| Legal Services & Support | 0 (0.0%) | 0 (0.0%) |
| Education Instruction & Library | 0 (0.0%) | 0 (0.0%) |
| Arts, Media & Entertainment | 0 (0.0%) | 0 (0.0%) |
| Health Diagnosing & Treating | 0 (0.0%) | 18 (100.0%) |
| Health Technologists | 0 (0.0%) | 18 (100.0%) |
| Total (Category) | 12 (16.9%) | 59 (83.1%) |
| Total (Overall) | 102 (41.5%) | 144 (58.5%) |
Services Occupations
The most common Services occupations in Vallonia are , and Food Preparation & Serving (24 | 9.8%).
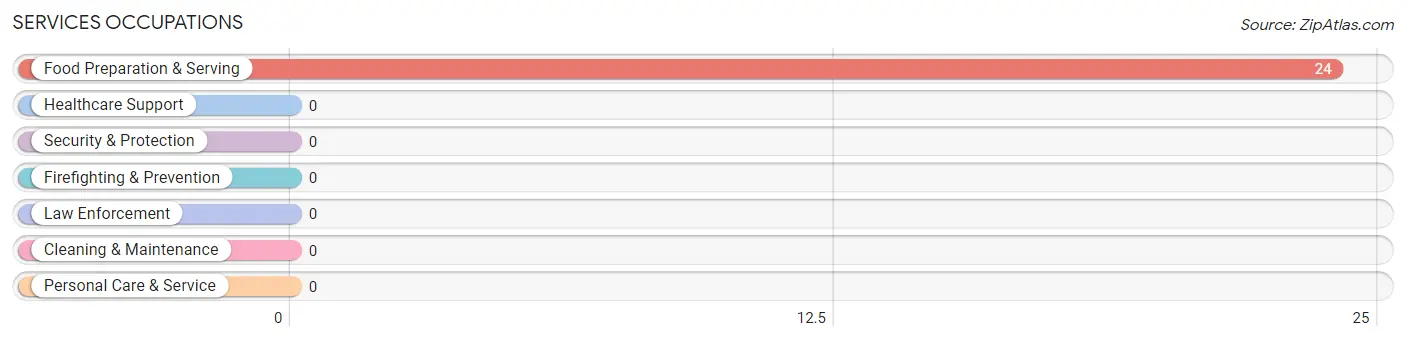
Services Occupations by Sex
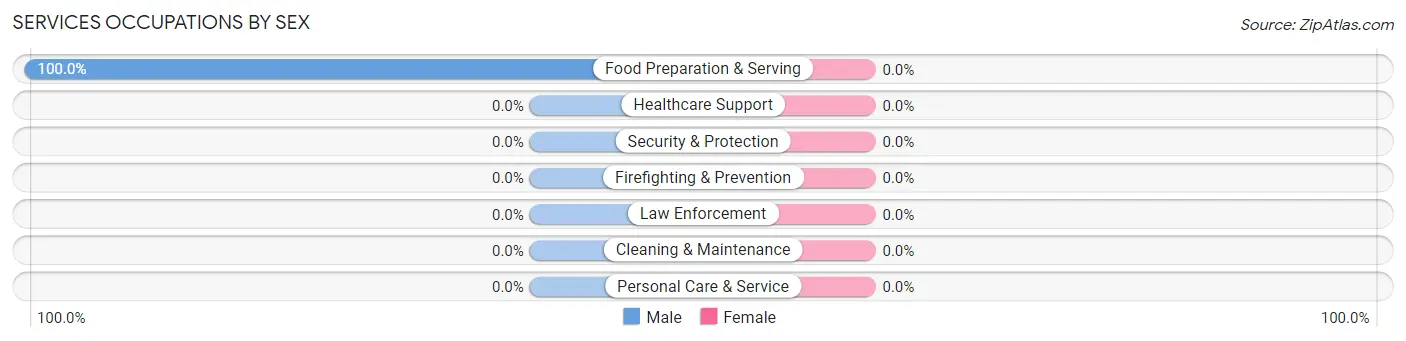
| Occupation | Male | Female |
| Healthcare Support | 0 (0.0%) | 0 (0.0%) |
| Security & Protection | 0 (0.0%) | 0 (0.0%) |
| Firefighting & Prevention | 0 (0.0%) | 0 (0.0%) |
| Law Enforcement | 0 (0.0%) | 0 (0.0%) |
| Food Preparation & Serving | 24 (100.0%) | 0 (0.0%) |
| Cleaning & Maintenance | 0 (0.0%) | 0 (0.0%) |
| Personal Care & Service | 0 (0.0%) | 0 (0.0%) |
| Total (Category) | 24 (100.0%) | 0 (0.0%) |
| Total (Overall) | 102 (41.5%) | 144 (58.5%) |
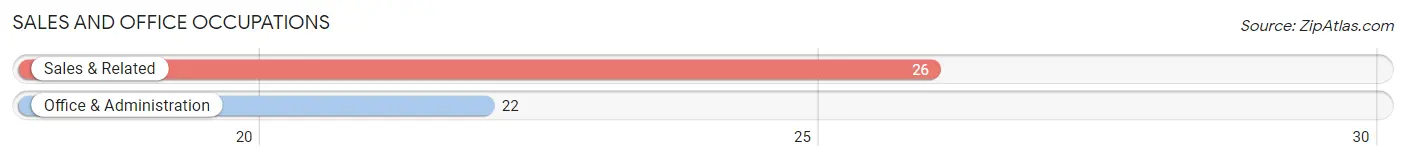
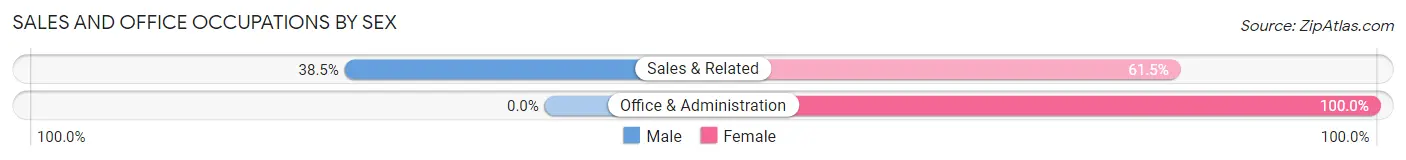
Sales and Office Occupations
The most common Sales and Office occupations in Vallonia are Sales & Related (26 | 10.6%), and Office & Administration (22 | 8.9%).
Sales and Office Occupations by Sex
| Occupation | Male | Female |
| Sales & Related | 10 (38.5%) | 16 (61.5%) |
| Office & Administration | 0 (0.0%) | 22 (100.0%) |
| Total (Category) | 10 (20.8%) | 38 (79.2%) |
| Total (Overall) | 102 (41.5%) | 144 (58.5%) |
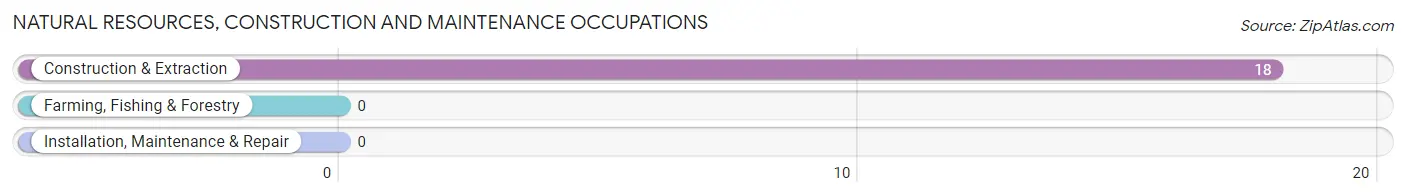
Natural Resources, Construction and Maintenance Occupations
The most common Natural Resources, Construction and Maintenance occupations in Vallonia are , and Construction & Extraction (18 | 7.3%).
Natural Resources, Construction and Maintenance Occupations by Sex
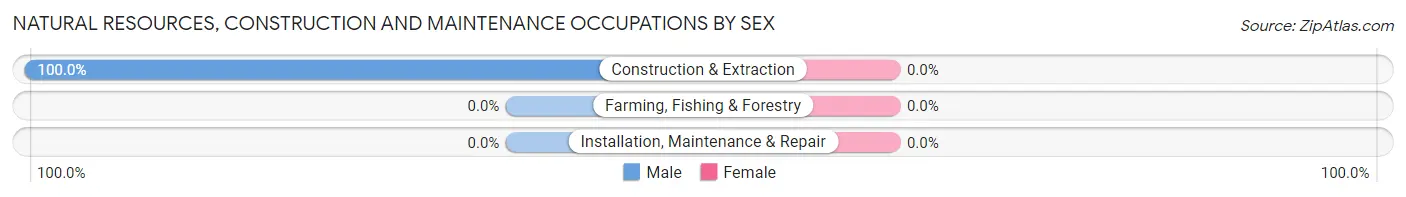
| Occupation | Male | Female |
| Farming, Fishing & Forestry | 0 (0.0%) | 0 (0.0%) |
| Construction & Extraction | 18 (100.0%) | 0 (0.0%) |
| Installation, Maintenance & Repair | 0 (0.0%) | 0 (0.0%) |
| Total (Category) | 18 (100.0%) | 0 (0.0%) |
| Total (Overall) | 102 (41.5%) | 144 (58.5%) |
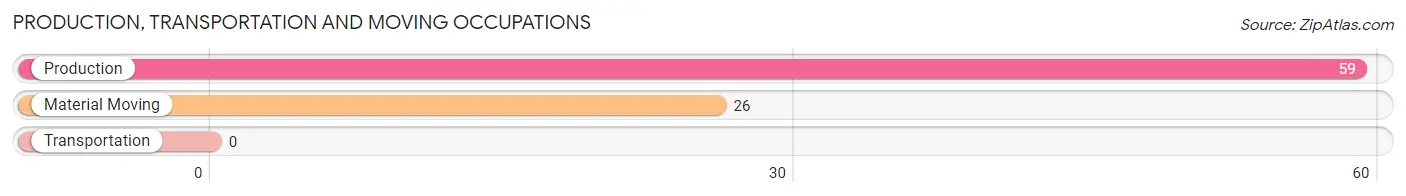
Production, Transportation and Moving Occupations
The most common Production, Transportation and Moving occupations in Vallonia are Production (59 | 24.0%), and Material Moving (26 | 10.6%).
Production, Transportation and Moving Occupations by Sex
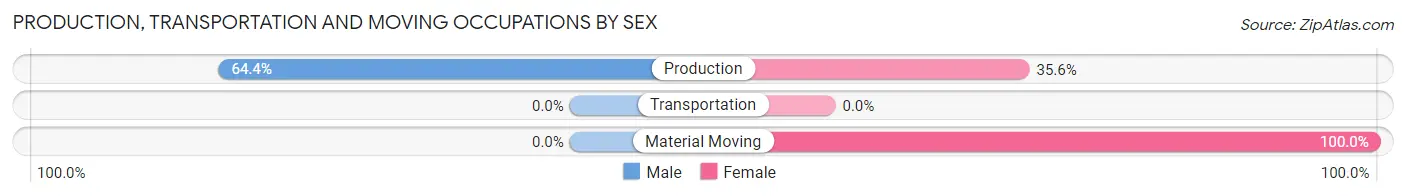
| Occupation | Male | Female |
| Production | 38 (64.4%) | 21 (35.6%) |
| Transportation | 0 (0.0%) | 0 (0.0%) |
| Material Moving | 0 (0.0%) | 26 (100.0%) |
| Total (Category) | 38 (44.7%) | 47 (55.3%) |
| Total (Overall) | 102 (41.5%) | 144 (58.5%) |
Employment Industries by Sex in Vallonia
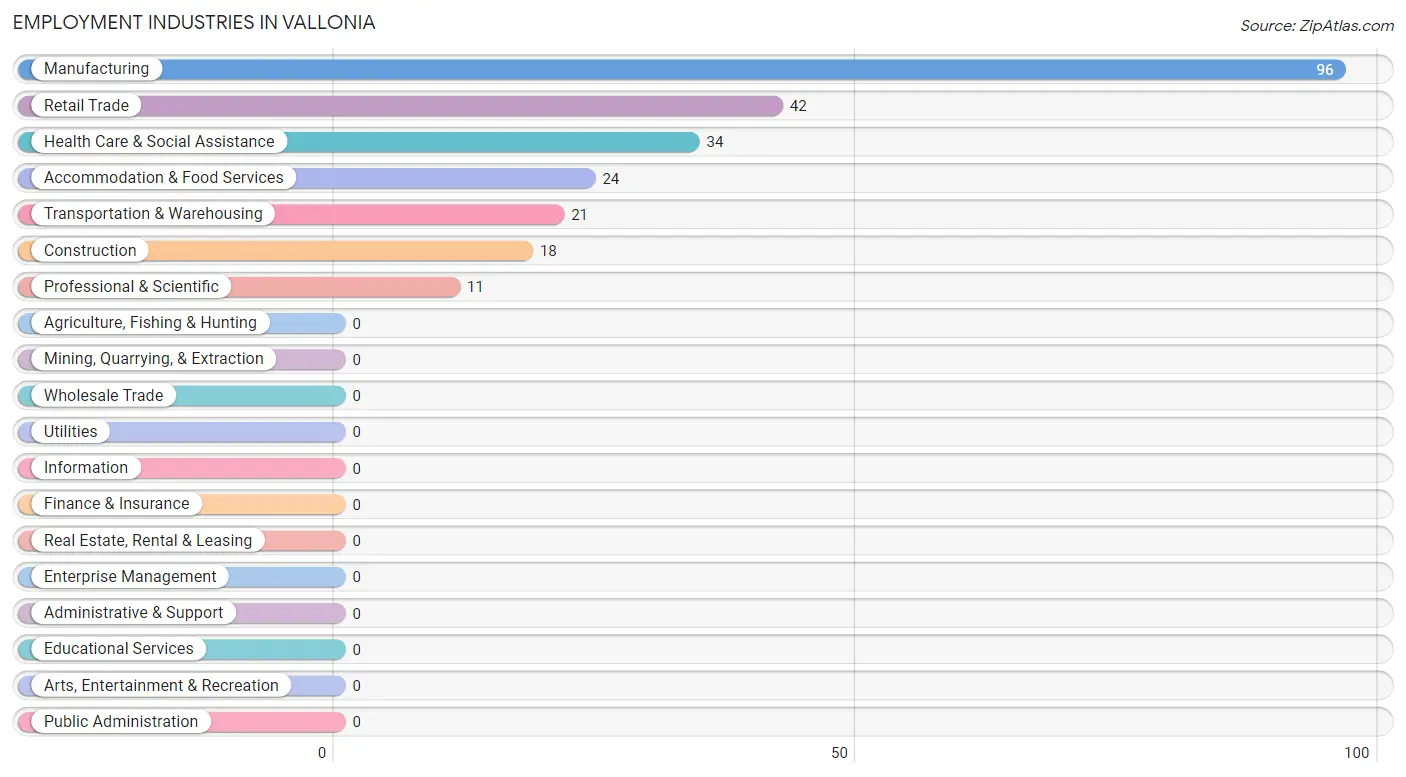
Employment Industries in Vallonia
The major employment industries in Vallonia include Manufacturing (96 | 39.0%), Retail Trade (42 | 17.1%), Health Care & Social Assistance (34 | 13.8%), Accommodation & Food Services (24 | 9.8%), and Transportation & Warehousing (21 | 8.5%).
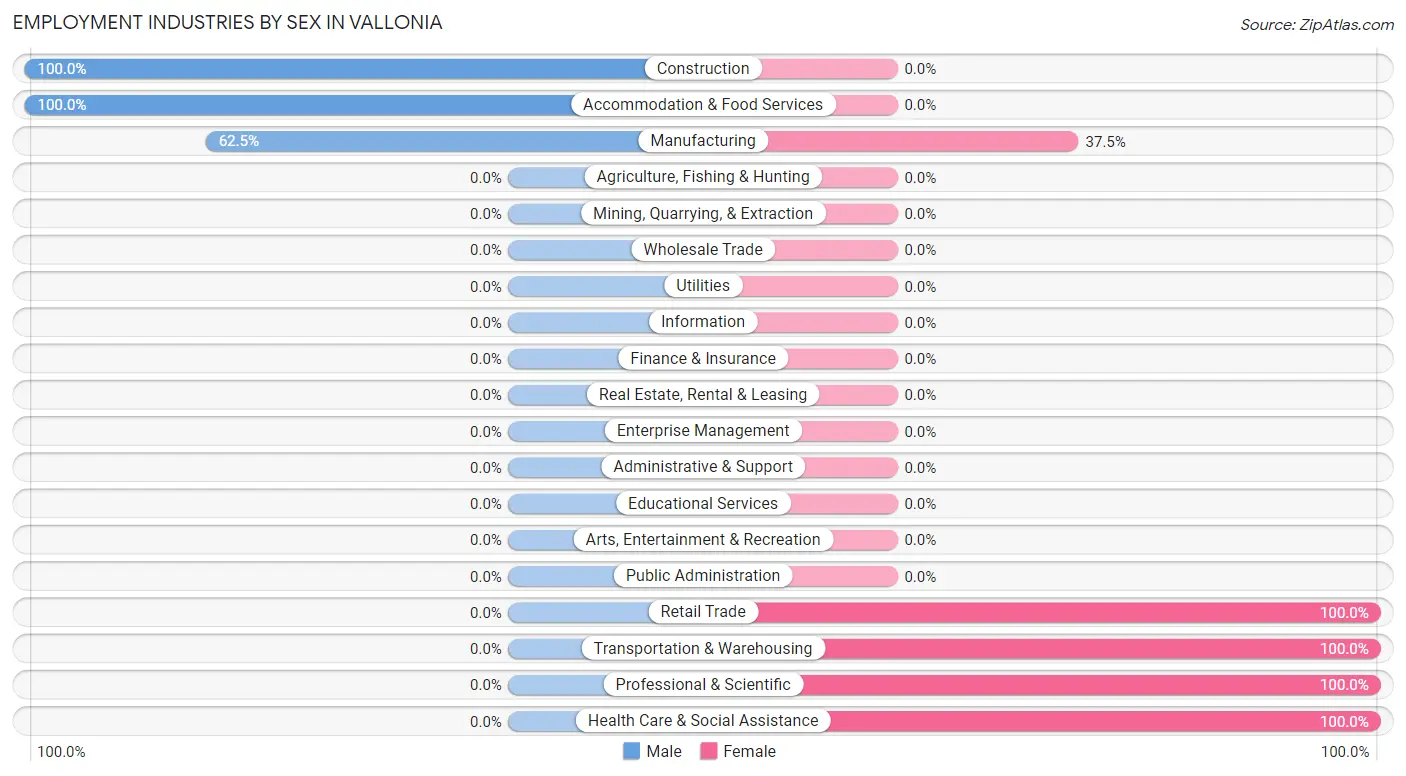
Employment Industries by Sex in Vallonia
The Vallonia industries that see more men than women are Construction (100.0%), Accommodation & Food Services (100.0%), and Manufacturing (62.5%), whereas the industries that tend to have a higher number of women are Retail Trade (100.0%), Transportation & Warehousing (100.0%), and Professional & Scientific (100.0%).
| Industry | Male | Female |
| Agriculture, Fishing & Hunting | 0 (0.0%) | 0 (0.0%) |
| Mining, Quarrying, & Extraction | 0 (0.0%) | 0 (0.0%) |
| Construction | 18 (100.0%) | 0 (0.0%) |
| Manufacturing | 60 (62.5%) | 36 (37.5%) |
| Wholesale Trade | 0 (0.0%) | 0 (0.0%) |
| Retail Trade | 0 (0.0%) | 42 (100.0%) |
| Transportation & Warehousing | 0 (0.0%) | 21 (100.0%) |
| Utilities | 0 (0.0%) | 0 (0.0%) |
| Information | 0 (0.0%) | 0 (0.0%) |
| Finance & Insurance | 0 (0.0%) | 0 (0.0%) |
| Real Estate, Rental & Leasing | 0 (0.0%) | 0 (0.0%) |
| Professional & Scientific | 0 (0.0%) | 11 (100.0%) |
| Enterprise Management | 0 (0.0%) | 0 (0.0%) |
| Administrative & Support | 0 (0.0%) | 0 (0.0%) |
| Educational Services | 0 (0.0%) | 0 (0.0%) |
| Health Care & Social Assistance | 0 (0.0%) | 34 (100.0%) |
| Arts, Entertainment & Recreation | 0 (0.0%) | 0 (0.0%) |
| Accommodation & Food Services | 24 (100.0%) | 0 (0.0%) |
| Public Administration | 0 (0.0%) | 0 (0.0%) |
| Total | 102 (41.5%) | 144 (58.5%) |
Education in Vallonia
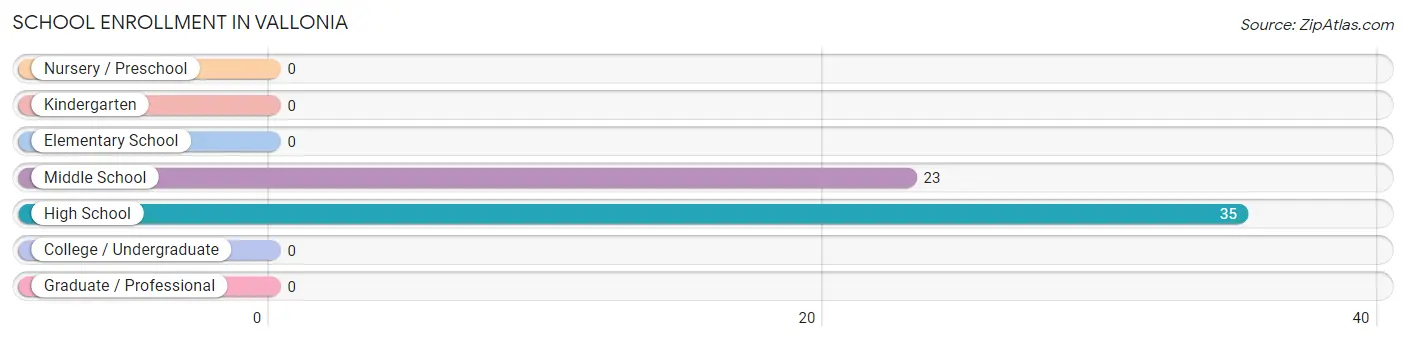
School Enrollment in Vallonia
The most common levels of schooling among the 58 students in Vallonia are high school (35 | 60.3%), and middle school (23 | 39.7%).
| School Level | # Students | % Students |
| Nursery / Preschool | 0 | 0.0% |
| Kindergarten | 0 | 0.0% |
| Elementary School | 0 | 0.0% |
| Middle School | 23 | 39.7% |
| High School | 35 | 60.3% |
| College / Undergraduate | 0 | 0.0% |
| Graduate / Professional | 0 | 0.0% |
| Total | 58 | 100.0% |
School Enrollment by Age by Funding Source in Vallonia
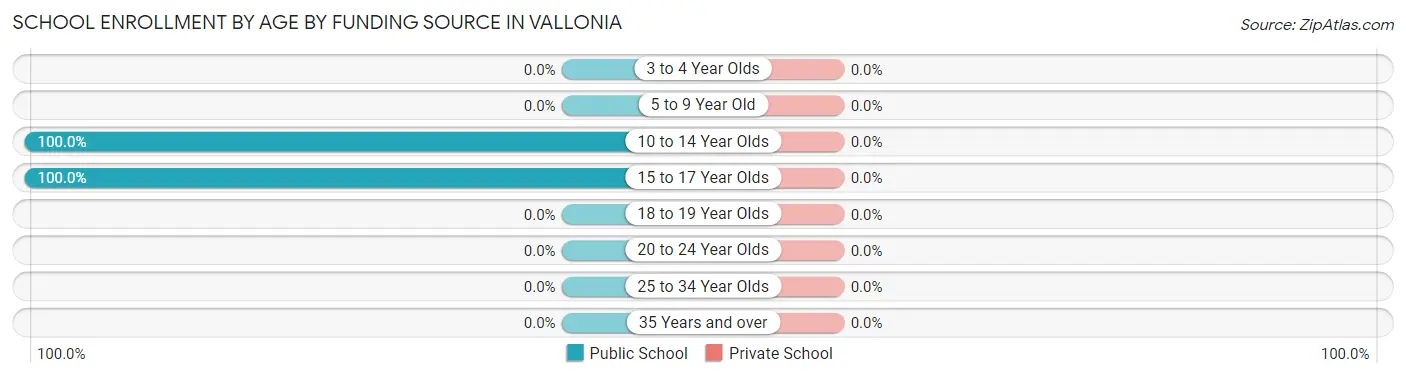
| Age Bracket | Public School | Private School |
| 3 to 4 Year Olds | 0 (0.0%) | 0 (0.0%) |
| 5 to 9 Year Old | 0 (0.0%) | 0 (0.0%) |
| 10 to 14 Year Olds | 23 (100.0%) | 0 (0.0%) |
| 15 to 17 Year Olds | 35 (100.0%) | 0 (0.0%) |
| 18 to 19 Year Olds | 0 (0.0%) | 0 (0.0%) |
| 20 to 24 Year Olds | 0 (0.0%) | 0 (0.0%) |
| 25 to 34 Year Olds | 0 (0.0%) | 0 (0.0%) |
| 35 Years and over | 0 (0.0%) | 0 (0.0%) |
| Total | 58 (100.0%) | 0 (0.0%) |
Educational Attainment by Field of Study in Vallonia
Arts & humanities (16 | 45.7%), science & technology (12 | 34.3%), and business (7 | 20.0%) are the most common fields of study among 35 individuals in Vallonia who have obtained a bachelor's degree or higher.
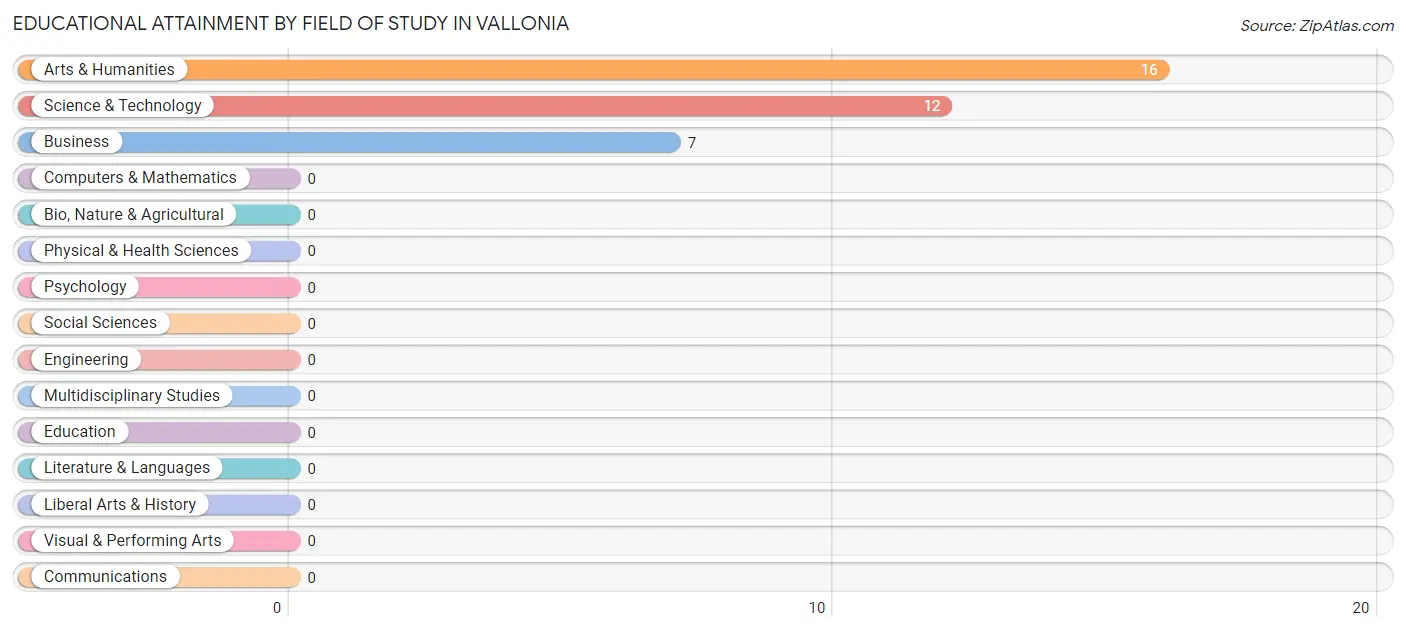
| Field of Study | # Graduates | % Graduates |
| Computers & Mathematics | 0 | 0.0% |
| Bio, Nature & Agricultural | 0 | 0.0% |
| Physical & Health Sciences | 0 | 0.0% |
| Psychology | 0 | 0.0% |
| Social Sciences | 0 | 0.0% |
| Engineering | 0 | 0.0% |
| Multidisciplinary Studies | 0 | 0.0% |
| Science & Technology | 12 | 34.3% |
| Business | 7 | 20.0% |
| Education | 0 | 0.0% |
| Literature & Languages | 0 | 0.0% |
| Liberal Arts & History | 0 | 0.0% |
| Visual & Performing Arts | 0 | 0.0% |
| Communications | 0 | 0.0% |
| Arts & Humanities | 16 | 45.7% |
| Total | 35 | 100.0% |
Transportation & Commute in Vallonia
Vehicle Availability by Sex in Vallonia
The most prevalent vehicle ownership categories in Vallonia are males with 3 vehicles (51, accounting for 50.0%) and females with 3 vehicles (38, making up 35.4%).
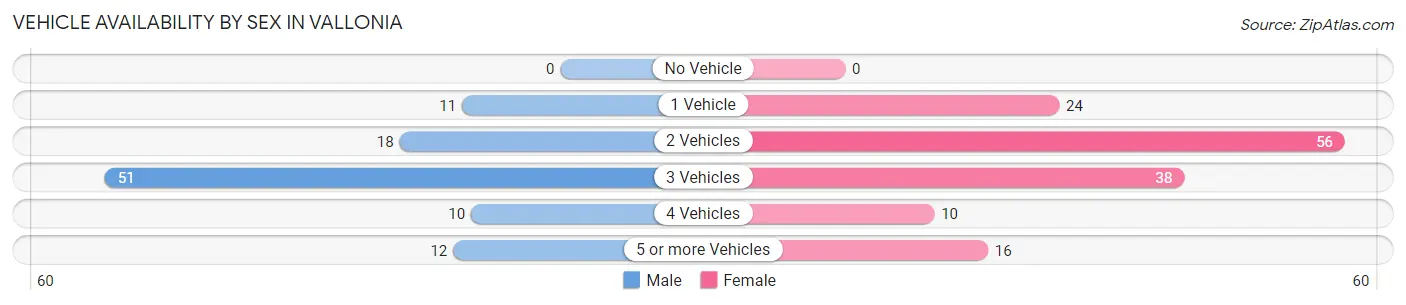
| Vehicles Available | Male | Female |
| No Vehicle | 0 (0.0%) | 0 (0.0%) |
| 1 Vehicle | 11 (10.8%) | 24 (16.7%) |
| 2 Vehicles | 18 (17.6%) | 56 (38.9%) |
| 3 Vehicles | 51 (50.0%) | 38 (26.4%) |
| 4 Vehicles | 10 (9.8%) | 10 (6.9%) |
| 5 or more Vehicles | 12 (11.8%) | 16 (11.1%) |
| Total | 102 (100.0%) | 144 (100.0%) |
Commute Time in Vallonia
The most frequently occuring commute durations in Vallonia are 25 to 29 minutes (46 commuters, 23.5%), 10 to 14 minutes (36 commuters, 18.4%), and 15 to 19 minutes (24 commuters, 12.2%).
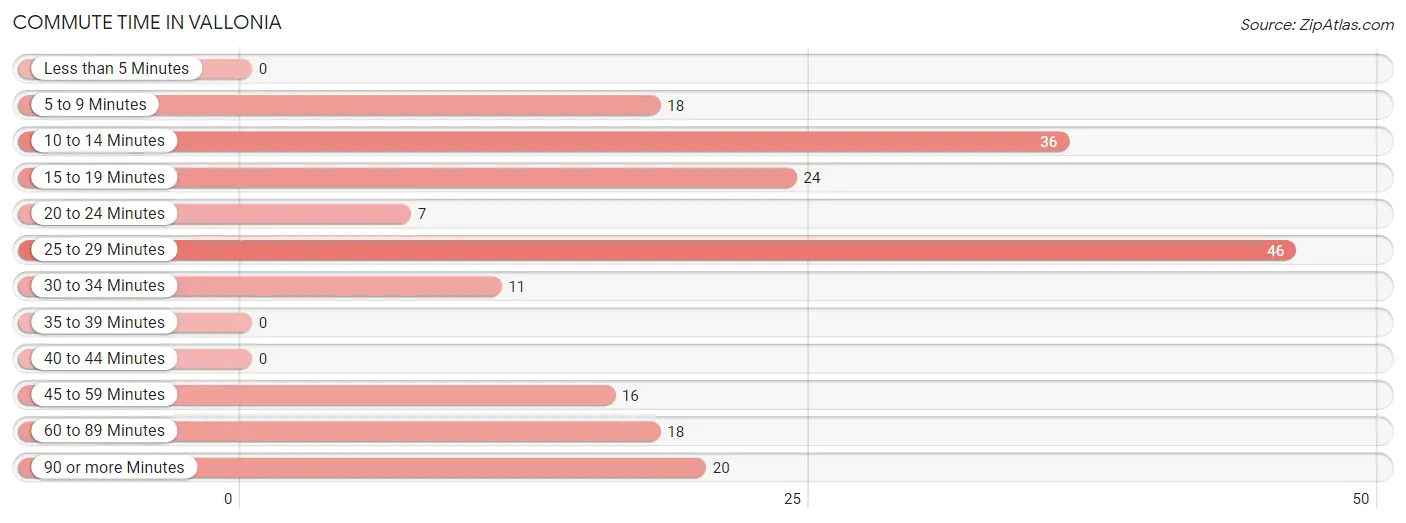
| Commute Time | # Commuters | % Commuters |
| Less than 5 Minutes | 0 | 0.0% |
| 5 to 9 Minutes | 18 | 9.2% |
| 10 to 14 Minutes | 36 | 18.4% |
| 15 to 19 Minutes | 24 | 12.2% |
| 20 to 24 Minutes | 7 | 3.6% |
| 25 to 29 Minutes | 46 | 23.5% |
| 30 to 34 Minutes | 11 | 5.6% |
| 35 to 39 Minutes | 0 | 0.0% |
| 40 to 44 Minutes | 0 | 0.0% |
| 45 to 59 Minutes | 16 | 8.2% |
| 60 to 89 Minutes | 18 | 9.2% |
| 90 or more Minutes | 20 | 10.2% |
Commute Time by Sex in Vallonia
The most common commute times in Vallonia are 15 to 19 minutes (24 commuters, 38.1%) for males and 10 to 14 minutes (36 commuters, 27.1%) for females.
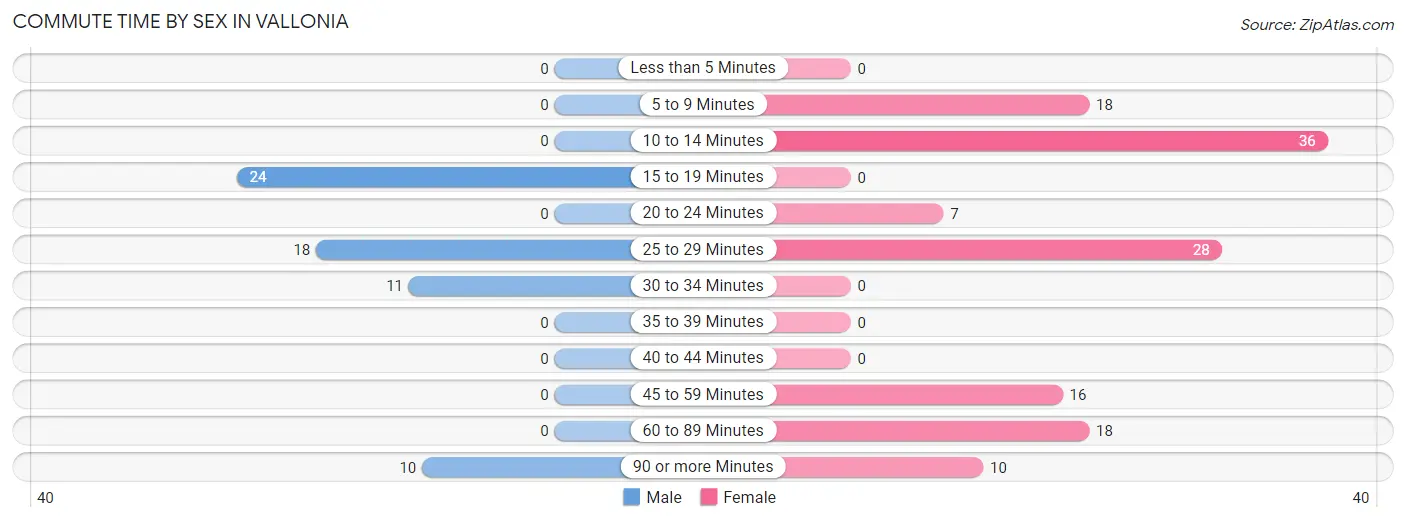
| Commute Time | Male | Female |
| Less than 5 Minutes | 0 (0.0%) | 0 (0.0%) |
| 5 to 9 Minutes | 0 (0.0%) | 18 (13.5%) |
| 10 to 14 Minutes | 0 (0.0%) | 36 (27.1%) |
| 15 to 19 Minutes | 24 (38.1%) | 0 (0.0%) |
| 20 to 24 Minutes | 0 (0.0%) | 7 (5.3%) |
| 25 to 29 Minutes | 18 (28.6%) | 28 (21.0%) |
| 30 to 34 Minutes | 11 (17.5%) | 0 (0.0%) |
| 35 to 39 Minutes | 0 (0.0%) | 0 (0.0%) |
| 40 to 44 Minutes | 0 (0.0%) | 0 (0.0%) |
| 45 to 59 Minutes | 0 (0.0%) | 16 (12.0%) |
| 60 to 89 Minutes | 0 (0.0%) | 18 (13.5%) |
| 90 or more Minutes | 10 (15.9%) | 10 (7.5%) |
Time of Departure to Work by Sex in Vallonia
The most frequent times of departure to work in Vallonia are 4:00 PM to 11:59 PM (24, 38.1%) for males and 5:30 AM to 5:59 AM (49, 36.8%) for females.
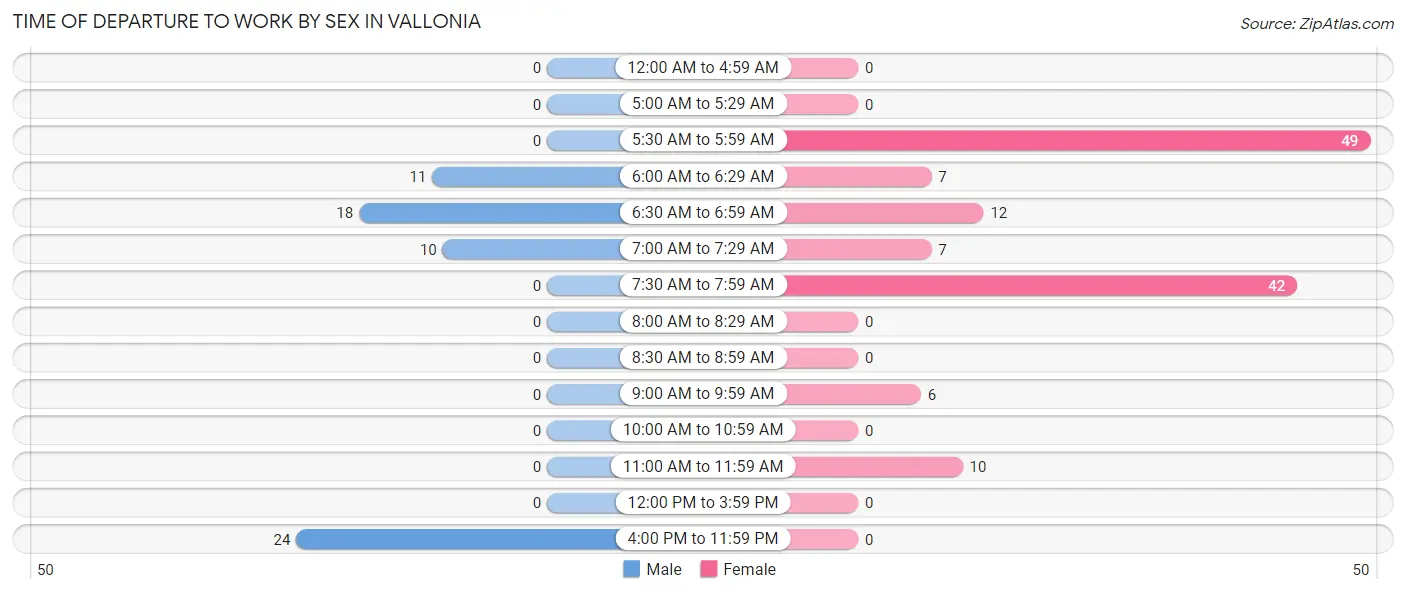
| Time of Departure | Male | Female |
| 12:00 AM to 4:59 AM | 0 (0.0%) | 0 (0.0%) |
| 5:00 AM to 5:29 AM | 0 (0.0%) | 0 (0.0%) |
| 5:30 AM to 5:59 AM | 0 (0.0%) | 49 (36.8%) |
| 6:00 AM to 6:29 AM | 11 (17.5%) | 7 (5.3%) |
| 6:30 AM to 6:59 AM | 18 (28.6%) | 12 (9.0%) |
| 7:00 AM to 7:29 AM | 10 (15.9%) | 7 (5.3%) |
| 7:30 AM to 7:59 AM | 0 (0.0%) | 42 (31.6%) |
| 8:00 AM to 8:29 AM | 0 (0.0%) | 0 (0.0%) |
| 8:30 AM to 8:59 AM | 0 (0.0%) | 0 (0.0%) |
| 9:00 AM to 9:59 AM | 0 (0.0%) | 6 (4.5%) |
| 10:00 AM to 10:59 AM | 0 (0.0%) | 0 (0.0%) |
| 11:00 AM to 11:59 AM | 0 (0.0%) | 10 (7.5%) |
| 12:00 PM to 3:59 PM | 0 (0.0%) | 0 (0.0%) |
| 4:00 PM to 11:59 PM | 24 (38.1%) | 0 (0.0%) |
| Total | 63 (100.0%) | 133 (100.0%) |
Housing Occupancy in Vallonia
Occupancy by Ownership in Vallonia
Of the total 143 dwellings in Vallonia, owner-occupied units account for 143 (100.0%), while renter-occupied units make up 0 (0.0%).
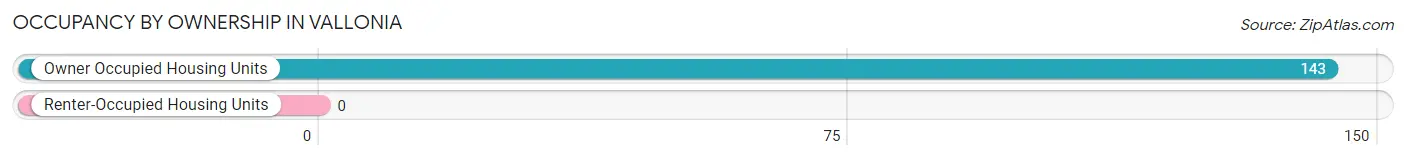
| Occupancy | # Housing Units | % Housing Units |
| Owner Occupied Housing Units | 143 | 100.0% |
| Renter-Occupied Housing Units | 0 | 0.0% |
| Total Occupied Housing Units | 143 | 100.0% |
Occupancy by Household Size in Vallonia
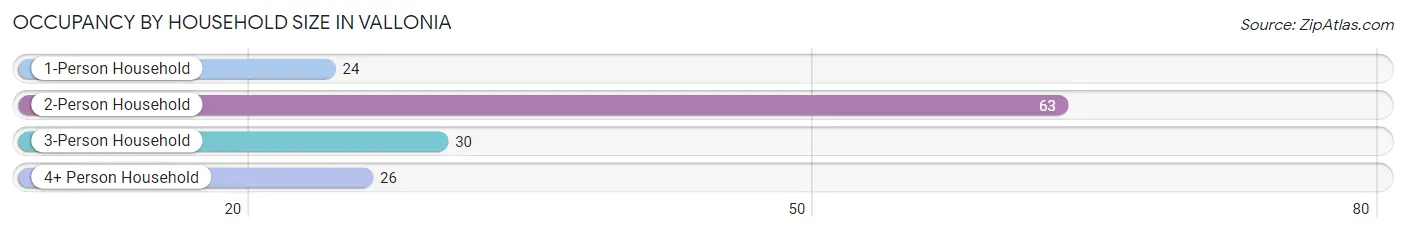
| Household Size | # Housing Units | % Housing Units |
| 1-Person Household | 24 | 16.8% |
| 2-Person Household | 63 | 44.1% |
| 3-Person Household | 30 | 21.0% |
| 4+ Person Household | 26 | 18.2% |
| Total Housing Units | 143 | 100.0% |
Occupancy by Ownership by Household Size in Vallonia
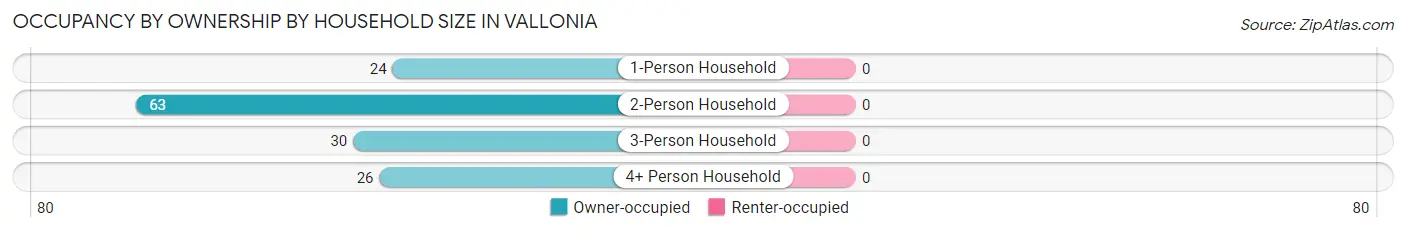
| Household Size | Owner-occupied | Renter-occupied |
| 1-Person Household | 24 (100.0%) | 0 (0.0%) |
| 2-Person Household | 63 (100.0%) | 0 (0.0%) |
| 3-Person Household | 30 (100.0%) | 0 (0.0%) |
| 4+ Person Household | 26 (100.0%) | 0 (0.0%) |
| Total Housing Units | 143 (100.0%) | 0 (0.0%) |
Occupancy by Educational Attainment in Vallonia
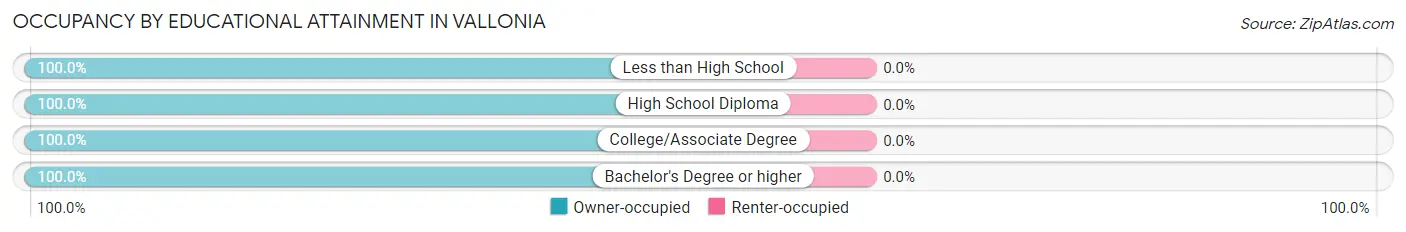
| Household Size | Owner-occupied | Renter-occupied |
| Less than High School | 9 (100.0%) | 0 (0.0%) |
| High School Diploma | 32 (100.0%) | 0 (0.0%) |
| College/Associate Degree | 83 (100.0%) | 0 (0.0%) |
| Bachelor's Degree or higher | 19 (100.0%) | 0 (0.0%) |
Occupancy by Age of Householder in Vallonia
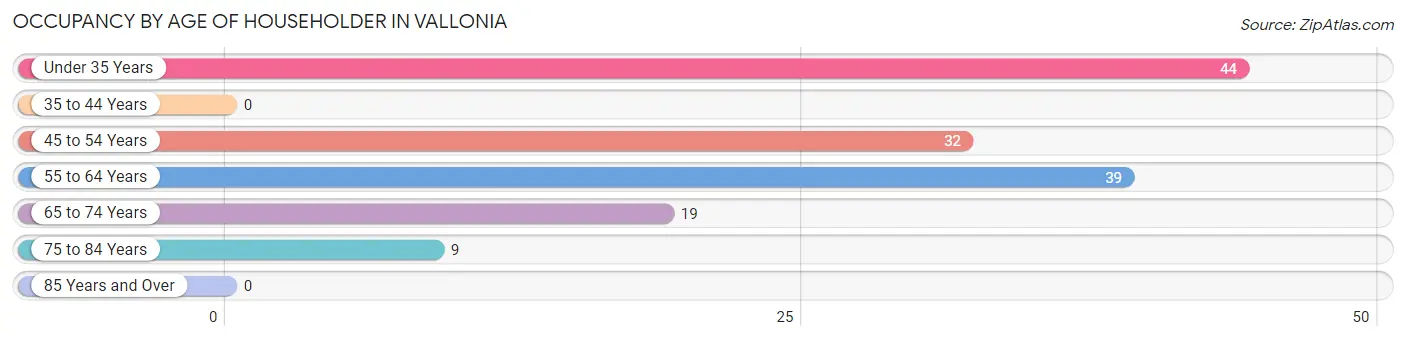
| Age Bracket | # Households | % Households |
| Under 35 Years | 44 | 30.8% |
| 35 to 44 Years | 0 | 0.0% |
| 45 to 54 Years | 32 | 22.4% |
| 55 to 64 Years | 39 | 27.3% |
| 65 to 74 Years | 19 | 13.3% |
| 75 to 84 Years | 9 | 6.3% |
| 85 Years and Over | 0 | 0.0% |
| Total | 143 | 100.0% |
Housing Finances in Vallonia
Median Income by Occupancy in Vallonia
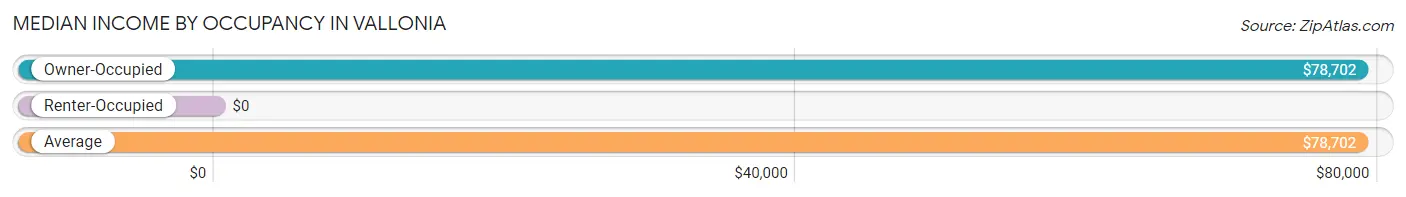
| Occupancy Type | # Households | Median Income |
| Owner-Occupied | 143 (100.0%) | $78,702 |
| Renter-Occupied | 0 (0.0%) | $0 |
| Average | 143 (100.0%) | $78,702 |
Occupancy by Householder Income Bracket in Vallonia
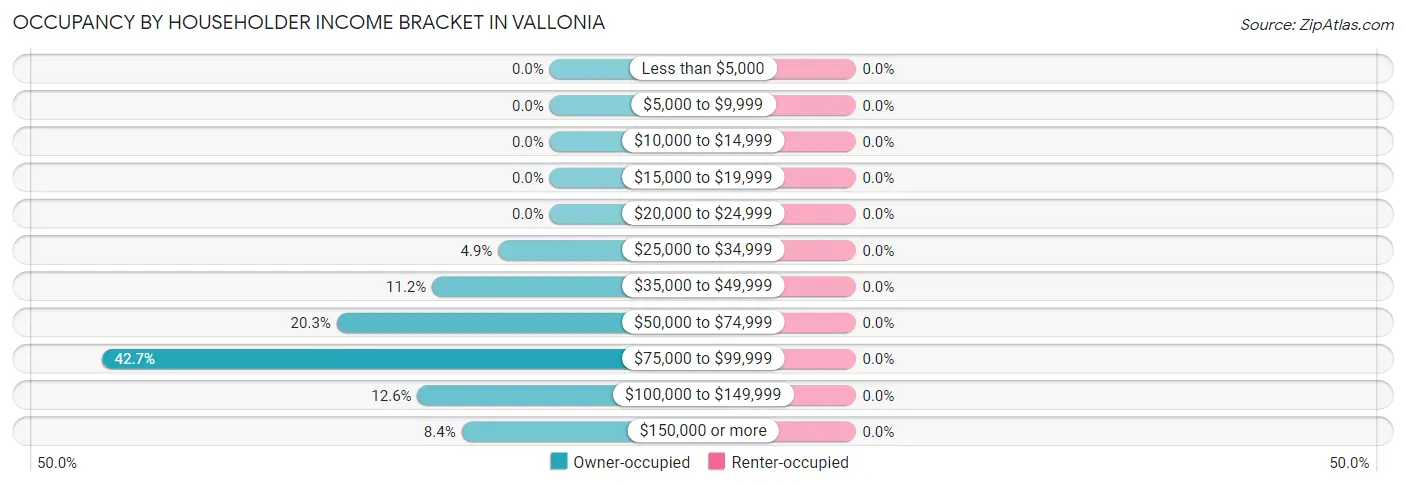
| Income Bracket | Owner-occupied | Renter-occupied |
| Less than $5,000 | 0 (0.0%) | 0 (0.0%) |
| $5,000 to $9,999 | 0 (0.0%) | 0 (0.0%) |
| $10,000 to $14,999 | 0 (0.0%) | 0 (0.0%) |
| $15,000 to $19,999 | 0 (0.0%) | 0 (0.0%) |
| $20,000 to $24,999 | 0 (0.0%) | 0 (0.0%) |
| $25,000 to $34,999 | 7 (4.9%) | 0 (0.0%) |
| $35,000 to $49,999 | 16 (11.2%) | 0 (0.0%) |
| $50,000 to $74,999 | 29 (20.3%) | 0 (0.0%) |
| $75,000 to $99,999 | 61 (42.7%) | 0 (0.0%) |
| $100,000 to $149,999 | 18 (12.6%) | 0 (0.0%) |
| $150,000 or more | 12 (8.4%) | 0 (0.0%) |
| Total | 143 (100.0%) | 0 (0.0%) |
Monthly Housing Cost Tiers in Vallonia
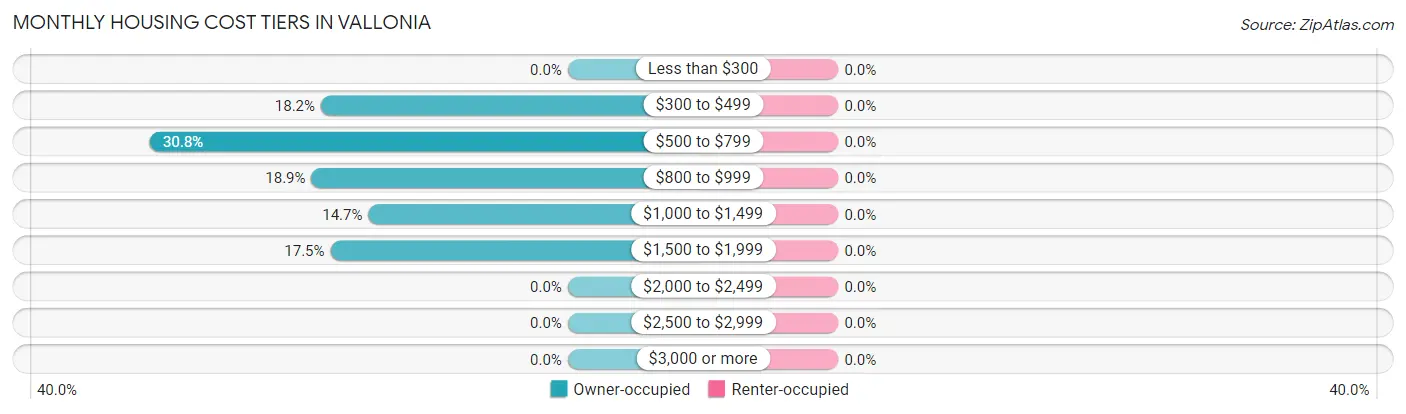
| Monthly Cost | Owner-occupied | Renter-occupied |
| Less than $300 | 0 (0.0%) | 0 (0.0%) |
| $300 to $499 | 26 (18.2%) | 0 (0.0%) |
| $500 to $799 | 44 (30.8%) | 0 (0.0%) |
| $800 to $999 | 27 (18.9%) | 0 (0.0%) |
| $1,000 to $1,499 | 21 (14.7%) | 0 (0.0%) |
| $1,500 to $1,999 | 25 (17.5%) | 0 (0.0%) |
| $2,000 to $2,499 | 0 (0.0%) | 0 (0.0%) |
| $2,500 to $2,999 | 0 (0.0%) | 0 (0.0%) |
| $3,000 or more | 0 (0.0%) | 0 (0.0%) |
| Total | 143 (100.0%) | 0 (0.0%) |
Physical Housing Characteristics in Vallonia
Housing Structures in Vallonia
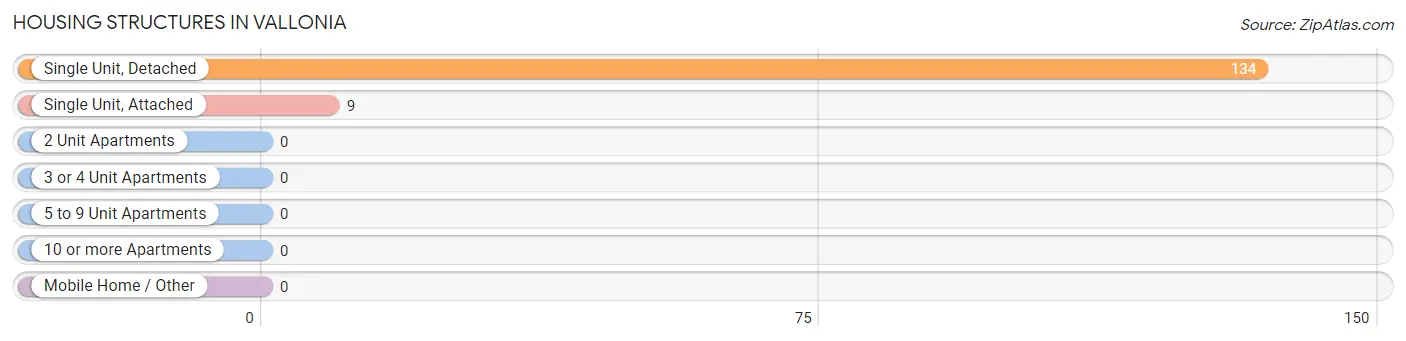
| Structure Type | # Housing Units | % Housing Units |
| Single Unit, Detached | 134 | 93.7% |
| Single Unit, Attached | 9 | 6.3% |
| 2 Unit Apartments | 0 | 0.0% |
| 3 or 4 Unit Apartments | 0 | 0.0% |
| 5 to 9 Unit Apartments | 0 | 0.0% |
| 10 or more Apartments | 0 | 0.0% |
| Mobile Home / Other | 0 | 0.0% |
| Total | 143 | 100.0% |
Housing Structures by Occupancy in Vallonia
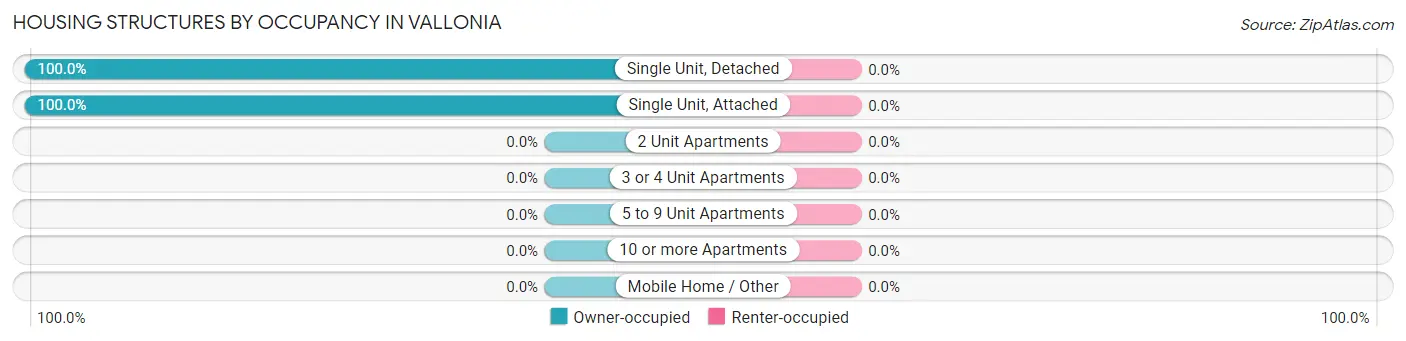
| Structure Type | Owner-occupied | Renter-occupied |
| Single Unit, Detached | 134 (100.0%) | 0 (0.0%) |
| Single Unit, Attached | 9 (100.0%) | 0 (0.0%) |
| 2 Unit Apartments | 0 (0.0%) | 0 (0.0%) |
| 3 or 4 Unit Apartments | 0 (0.0%) | 0 (0.0%) |
| 5 to 9 Unit Apartments | 0 (0.0%) | 0 (0.0%) |
| 10 or more Apartments | 0 (0.0%) | 0 (0.0%) |
| Mobile Home / Other | 0 (0.0%) | 0 (0.0%) |
| Total | 143 (100.0%) | 0 (0.0%) |
Housing Structures by Number of Rooms in Vallonia
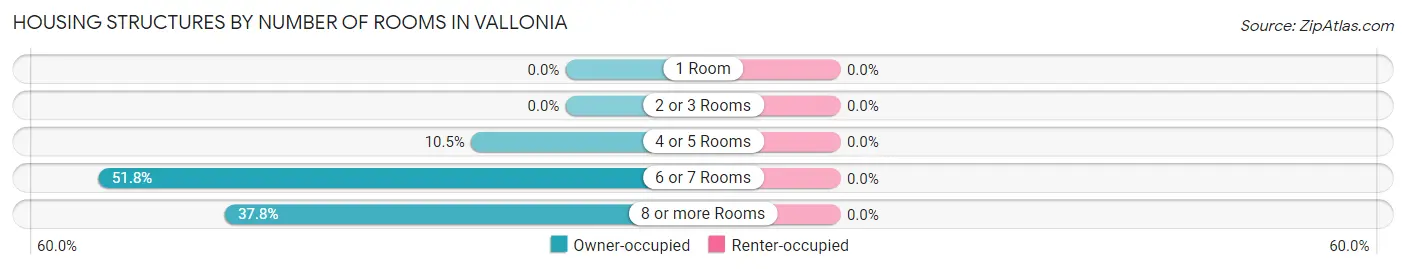
| Number of Rooms | Owner-occupied | Renter-occupied |
| 1 Room | 0 (0.0%) | 0 (0.0%) |
| 2 or 3 Rooms | 0 (0.0%) | 0 (0.0%) |
| 4 or 5 Rooms | 15 (10.5%) | 0 (0.0%) |
| 6 or 7 Rooms | 74 (51.7%) | 0 (0.0%) |
| 8 or more Rooms | 54 (37.8%) | 0 (0.0%) |
| Total | 143 (100.0%) | 0 (0.0%) |
Housing Structure by Heating Type in Vallonia
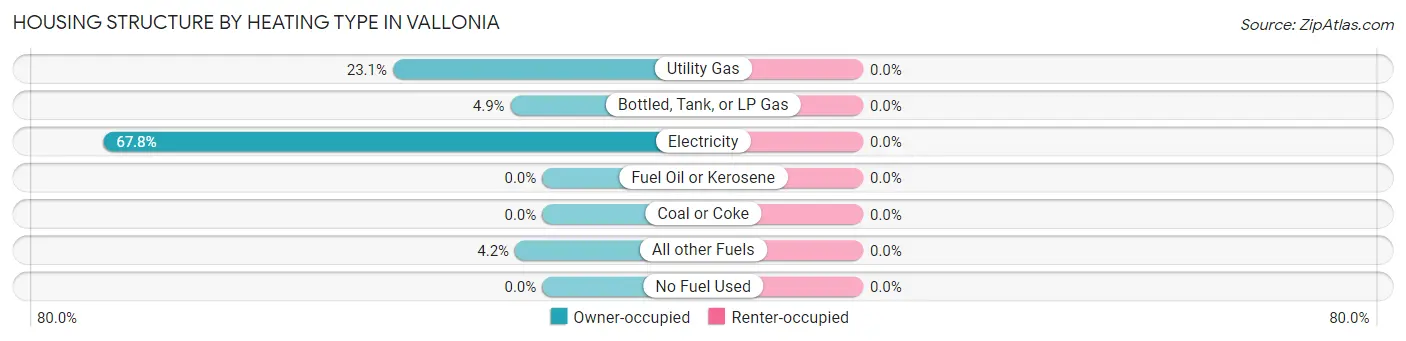
| Heating Type | Owner-occupied | Renter-occupied |
| Utility Gas | 33 (23.1%) | 0 (0.0%) |
| Bottled, Tank, or LP Gas | 7 (4.9%) | 0 (0.0%) |
| Electricity | 97 (67.8%) | 0 (0.0%) |
| Fuel Oil or Kerosene | 0 (0.0%) | 0 (0.0%) |
| Coal or Coke | 0 (0.0%) | 0 (0.0%) |
| All other Fuels | 6 (4.2%) | 0 (0.0%) |
| No Fuel Used | 0 (0.0%) | 0 (0.0%) |
| Total | 143 (100.0%) | 0 (0.0%) |
Household Vehicle Usage in Vallonia
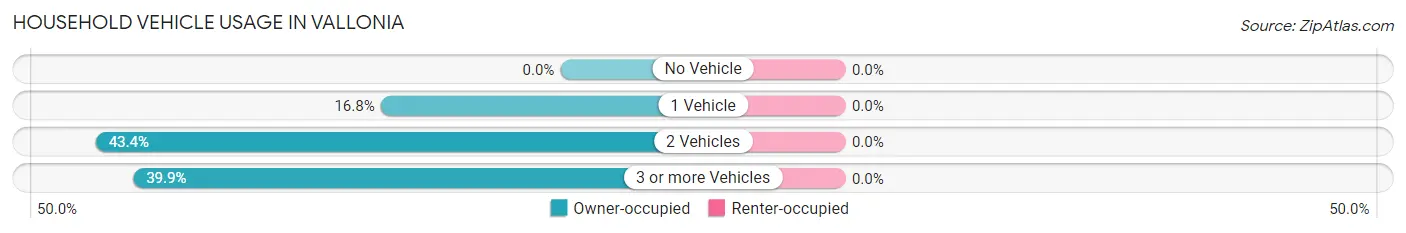
| Vehicles per Household | Owner-occupied | Renter-occupied |
| No Vehicle | 0 (0.0%) | 0 (0.0%) |
| 1 Vehicle | 24 (16.8%) | 0 (0.0%) |
| 2 Vehicles | 62 (43.4%) | 0 (0.0%) |
| 3 or more Vehicles | 57 (39.9%) | 0 (0.0%) |
| Total | 143 (100.0%) | 0 (0.0%) |
Real Estate & Mortgages in Vallonia
Real Estate and Mortgage Overview in Vallonia
| Characteristic | Without Mortgage | With Mortgage |
| Housing Units | 38 | 105 |
| Median Property Value | - | - |
| Median Household Income | - | - |
| Monthly Housing Costs | $473 | $0 |
| Real Estate Taxes | - | - |
Property Value by Mortgage Status in Vallonia
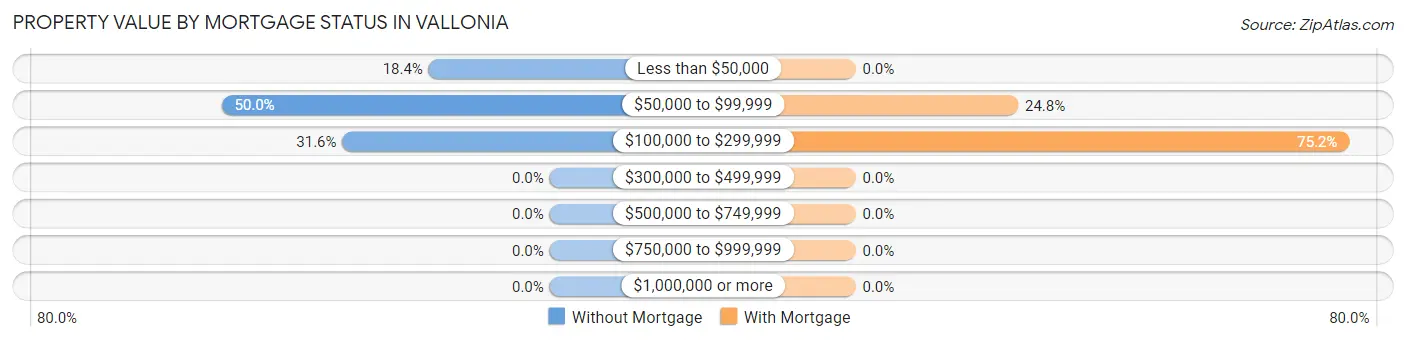
| Property Value | Without Mortgage | With Mortgage |
| Less than $50,000 | 7 (18.4%) | 0 (0.0%) |
| $50,000 to $99,999 | 19 (50.0%) | 26 (24.8%) |
| $100,000 to $299,999 | 12 (31.6%) | 79 (75.2%) |
| $300,000 to $499,999 | 0 (0.0%) | 0 (0.0%) |
| $500,000 to $749,999 | 0 (0.0%) | 0 (0.0%) |
| $750,000 to $999,999 | 0 (0.0%) | 0 (0.0%) |
| $1,000,000 or more | 0 (0.0%) | 0 (0.0%) |
| Total | 38 (100.0%) | 105 (100.0%) |
Household Income by Mortgage Status in Vallonia
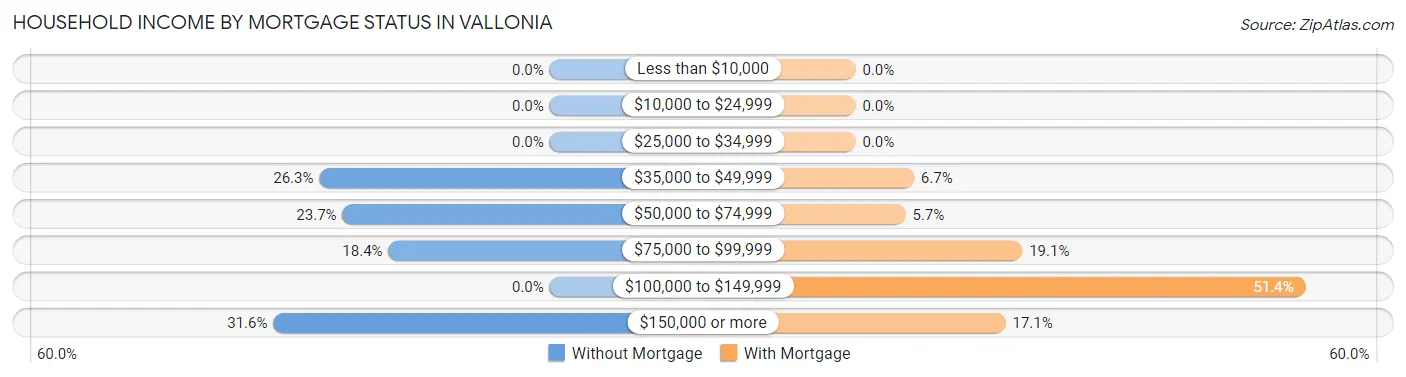
| Household Income | Without Mortgage | With Mortgage |
| Less than $10,000 | 0 (0.0%) | 0 (0.0%) |
| $10,000 to $24,999 | 0 (0.0%) | 0 (0.0%) |
| $25,000 to $34,999 | 0 (0.0%) | 0 (0.0%) |
| $35,000 to $49,999 | 10 (26.3%) | 7 (6.7%) |
| $50,000 to $74,999 | 9 (23.7%) | 6 (5.7%) |
| $75,000 to $99,999 | 7 (18.4%) | 20 (19.1%) |
| $100,000 to $149,999 | 0 (0.0%) | 54 (51.4%) |
| $150,000 or more | 12 (31.6%) | 18 (17.1%) |
| Total | 38 (100.0%) | 105 (100.0%) |
Property Value to Household Income Ratio in Vallonia
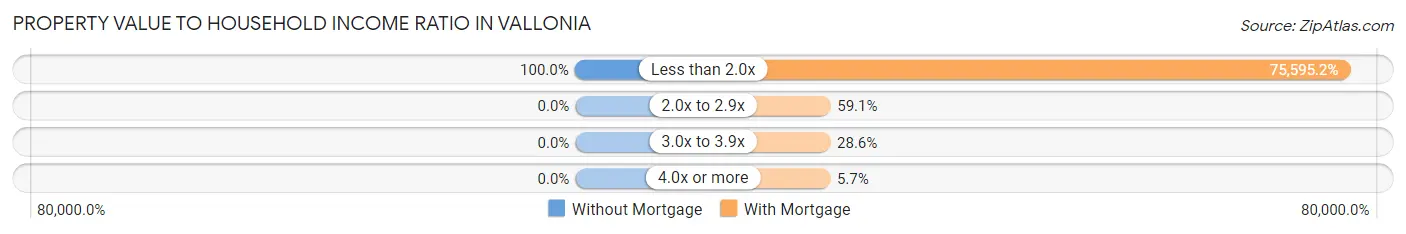
| Value-to-Income Ratio | Without Mortgage | With Mortgage |
| Less than 2.0x | 38 (100.0%) | 79,375 (75,595.2%) |
| 2.0x to 2.9x | 0 (0.0%) | 62 (59.1%) |
| 3.0x to 3.9x | 0 (0.0%) | 30 (28.6%) |
| 4.0x or more | 0 (0.0%) | 6 (5.7%) |
| Total | 38 (100.0%) | 105 (100.0%) |
Real Estate Taxes by Mortgage Status in Vallonia
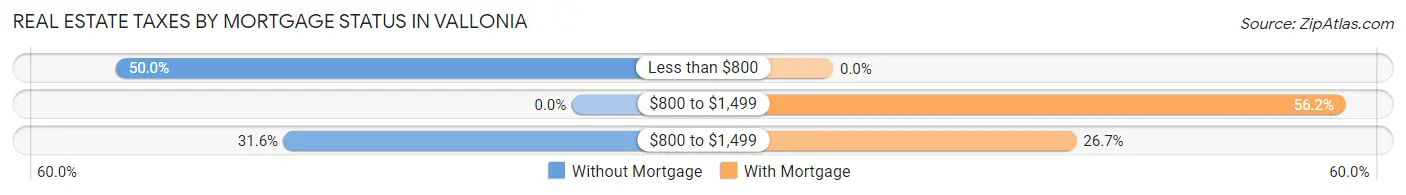
| Property Taxes | Without Mortgage | With Mortgage |
| Less than $800 | 19 (50.0%) | 0 (0.0%) |
| $800 to $1,499 | 0 (0.0%) | 59 (56.2%) |
| $800 to $1,499 | 12 (31.6%) | 28 (26.7%) |
| Total | 38 (100.0%) | 105 (100.0%) |
Health & Disability in Vallonia
Health Insurance Coverage by Age in Vallonia
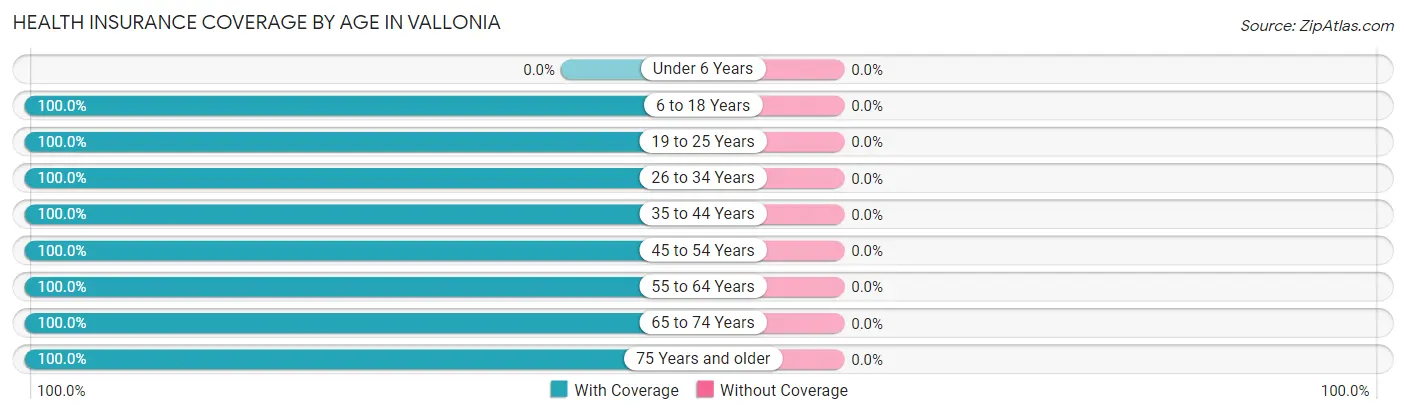
| Age Bracket | With Coverage | Without Coverage |
| Under 6 Years | 0 (0.0%) | 0 (0.0%) |
| 6 to 18 Years | 58 (100.0%) | 0 (0.0%) |
| 19 to 25 Years | 17 (100.0%) | 0 (0.0%) |
| 26 to 34 Years | 65 (100.0%) | 0 (0.0%) |
| 35 to 44 Years | 38 (100.0%) | 0 (0.0%) |
| 45 to 54 Years | 48 (100.0%) | 0 (0.0%) |
| 55 to 64 Years | 90 (100.0%) | 0 (0.0%) |
| 65 to 74 Years | 29 (100.0%) | 0 (0.0%) |
| 75 Years and older | 9 (100.0%) | 0 (0.0%) |
| Total | 354 (100.0%) | 0 (0.0%) |
Health Insurance Coverage by Citizenship Status in Vallonia
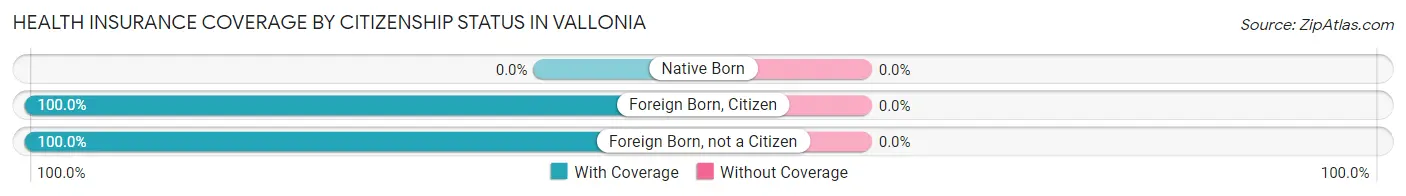
| Citizenship Status | With Coverage | Without Coverage |
| Native Born | 0 (0.0%) | 0 (0.0%) |
| Foreign Born, Citizen | 58 (100.0%) | 0 (0.0%) |
| Foreign Born, not a Citizen | 17 (100.0%) | 0 (0.0%) |
Health Insurance Coverage by Household Income in Vallonia
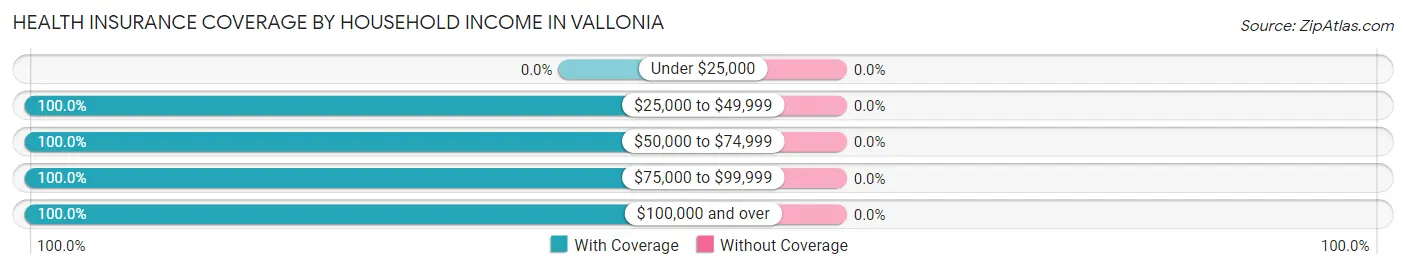
| Household Income | With Coverage | Without Coverage |
| Under $25,000 | 0 (0.0%) | 0 (0.0%) |
| $25,000 to $49,999 | 33 (100.0%) | 0 (0.0%) |
| $50,000 to $74,999 | 51 (100.0%) | 0 (0.0%) |
| $75,000 to $99,999 | 177 (100.0%) | 0 (0.0%) |
| $100,000 and over | 93 (100.0%) | 0 (0.0%) |
Public vs Private Health Insurance Coverage by Age in Vallonia
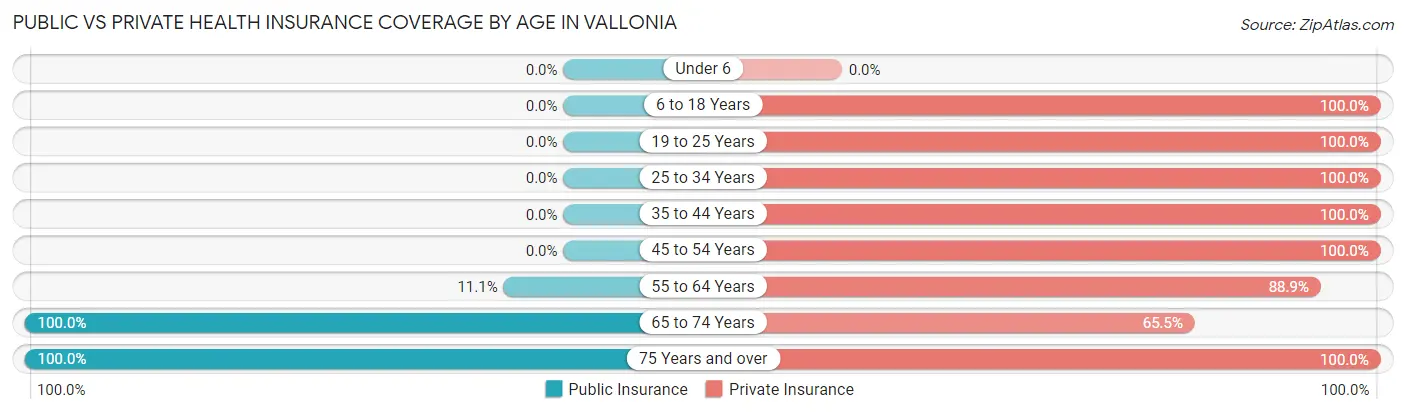
| Age Bracket | Public Insurance | Private Insurance |
| Under 6 | 0 (0.0%) | 0 (0.0%) |
| 6 to 18 Years | 0 (0.0%) | 58 (100.0%) |
| 19 to 25 Years | 0 (0.0%) | 17 (100.0%) |
| 25 to 34 Years | 0 (0.0%) | 65 (100.0%) |
| 35 to 44 Years | 0 (0.0%) | 38 (100.0%) |
| 45 to 54 Years | 0 (0.0%) | 48 (100.0%) |
| 55 to 64 Years | 10 (11.1%) | 80 (88.9%) |
| 65 to 74 Years | 29 (100.0%) | 19 (65.5%) |
| 75 Years and over | 9 (100.0%) | 9 (100.0%) |
| Total | 48 (13.6%) | 334 (94.4%) |
Disability Status by Sex by Age in Vallonia
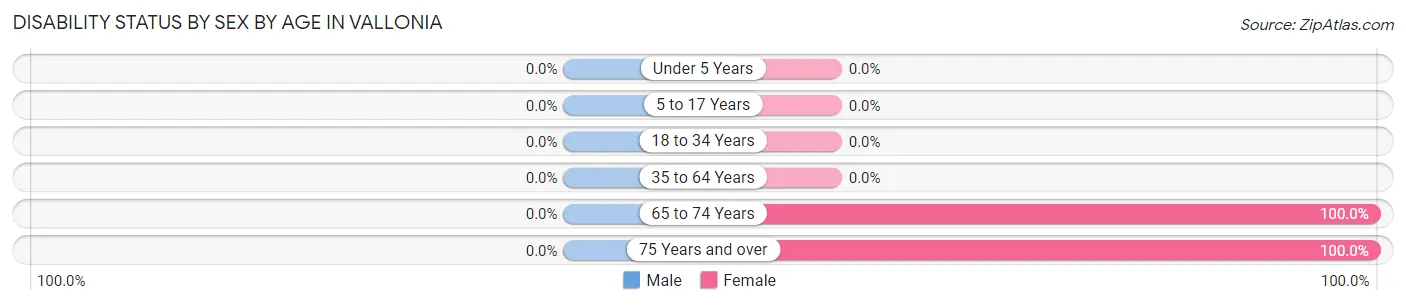
| Age Bracket | Male | Female |
| Under 5 Years | 0 (0.0%) | 0 (0.0%) |
| 5 to 17 Years | 0 (0.0%) | 0 (0.0%) |
| 18 to 34 Years | 0 (0.0%) | 0 (0.0%) |
| 35 to 64 Years | 0 (0.0%) | 0 (0.0%) |
| 65 to 74 Years | 0 (0.0%) | 10 (100.0%) |
| 75 Years and over | 0 (0.0%) | 9 (100.0%) |
Disability Class by Sex by Age in Vallonia
Disability Class: Hearing Difficulty
| Age Bracket | Male | Female |
| Under 5 Years | 0 (0.0%) | 0 (0.0%) |
| 5 to 17 Years | 0 (0.0%) | 0 (0.0%) |
| 18 to 34 Years | 0 (0.0%) | 0 (0.0%) |
| 35 to 64 Years | 0 (0.0%) | 0 (0.0%) |
| 65 to 74 Years | 0 (0.0%) | 0 (0.0%) |
| 75 Years and over | 0 (0.0%) | 0 (0.0%) |
Disability Class: Vision Difficulty
| Age Bracket | Male | Female |
| Under 5 Years | 0 (0.0%) | 0 (0.0%) |
| 5 to 17 Years | 0 (0.0%) | 0 (0.0%) |
| 18 to 34 Years | 0 (0.0%) | 0 (0.0%) |
| 35 to 64 Years | 0 (0.0%) | 0 (0.0%) |
| 65 to 74 Years | 0 (0.0%) | 0 (0.0%) |
| 75 Years and over | 0 (0.0%) | 0 (0.0%) |
Disability Class: Cognitive Difficulty
| Age Bracket | Male | Female |
| 5 to 17 Years | 0 (0.0%) | 0 (0.0%) |
| 18 to 34 Years | 0 (0.0%) | 0 (0.0%) |
| 35 to 64 Years | 0 (0.0%) | 0 (0.0%) |
| 65 to 74 Years | 0 (0.0%) | 0 (0.0%) |
| 75 Years and over | 0 (0.0%) | 0 (0.0%) |
Disability Class: Ambulatory Difficulty
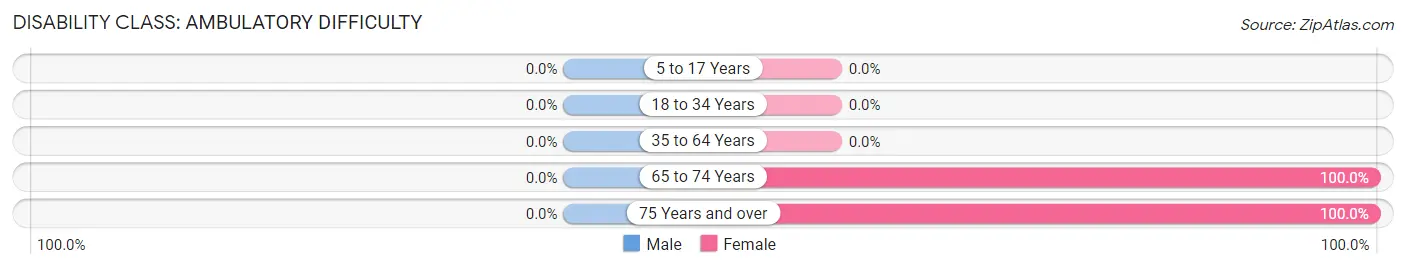
| Age Bracket | Male | Female |
| 5 to 17 Years | 0 (0.0%) | 0 (0.0%) |
| 18 to 34 Years | 0 (0.0%) | 0 (0.0%) |
| 35 to 64 Years | 0 (0.0%) | 0 (0.0%) |
| 65 to 74 Years | 0 (0.0%) | 10 (100.0%) |
| 75 Years and over | 0 (0.0%) | 9 (100.0%) |
Disability Class: Self-Care Difficulty
| Age Bracket | Male | Female |
| 5 to 17 Years | 0 (0.0%) | 0 (0.0%) |
| 18 to 34 Years | 0 (0.0%) | 0 (0.0%) |
| 35 to 64 Years | 0 (0.0%) | 0 (0.0%) |
| 65 to 74 Years | 0 (0.0%) | 0 (0.0%) |
| 75 Years and over | 0 (0.0%) | 0 (0.0%) |
Technology Access in Vallonia
Computing Device Access in Vallonia
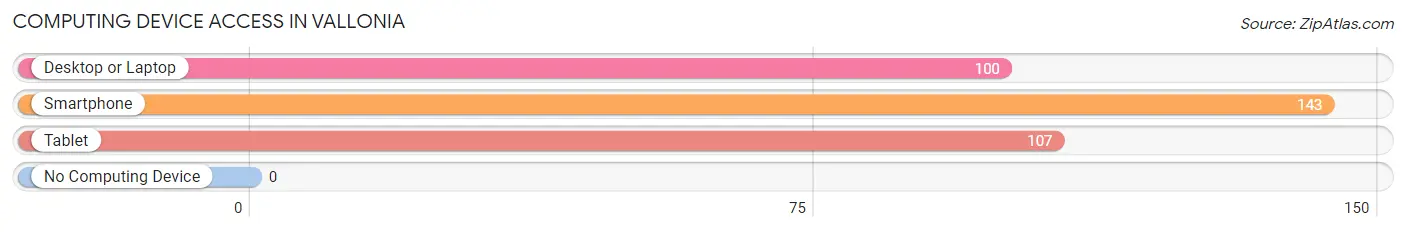
| Device Type | # Households | % Households |
| Desktop or Laptop | 100 | 69.9% |
| Smartphone | 143 | 100.0% |
| Tablet | 107 | 74.8% |
| No Computing Device | 0 | 0.0% |
| Total | 143 | 100.0% |
Internet Access in Vallonia
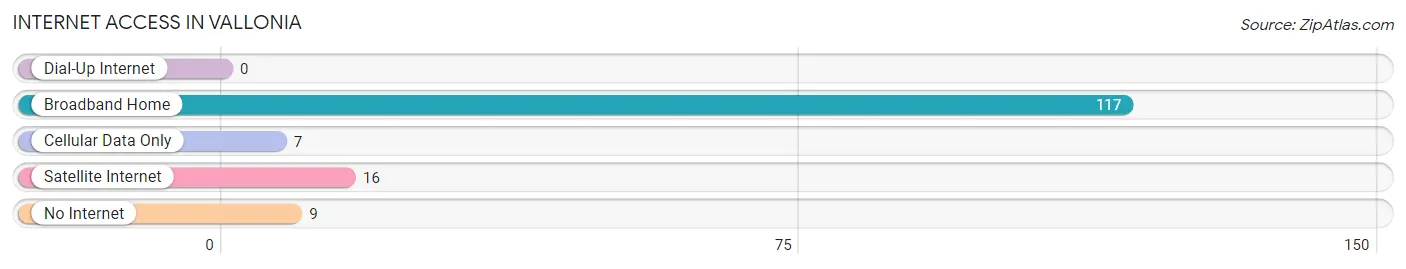
| Internet Type | # Households | % Households |
| Dial-Up Internet | 0 | 0.0% |
| Broadband Home | 117 | 81.8% |
| Cellular Data Only | 7 | 4.9% |
| Satellite Internet | 16 | 11.2% |
| No Internet | 9 | 6.3% |
| Total | 143 | 100.0% |
Vallonia Summary
Vallonia, Indiana is a small town located in Jackson County, Indiana. It is situated in the southeastern part of the state, about 30 miles north of Louisville, Kentucky. The town was founded in 1837 and has a population of approximately 1,000 people.
Vallonia is located in a rural area of Jackson County, surrounded by rolling hills and farmland. The town is situated on the banks of the East Fork of the White River, which provides a scenic backdrop for the town. The town is also located near the Hoosier National Forest, which provides a variety of outdoor activities for residents and visitors alike.
The economy of Vallonia is largely based on agriculture. The town is home to several farms, which produce a variety of crops, including corn, soybeans, wheat, and hay. The town also has a few small businesses, including a grocery store, a hardware store, and a few restaurants.
The demographics of Vallonia are largely white, with a small percentage of African Americans and Hispanics. The median household income is approximately $35,000, and the median home value is around $90,000. The town has a low unemployment rate, and the majority of residents are employed in the agricultural sector.
Vallonia is served by the Jackson County School Corporation, which provides public education to the town's students. The town also has a library, a post office, and a few churches. The town is home to a few parks, including a community park and a nature preserve.
Vallonia is a small town with a rich history and a strong sense of community. The town is home to a variety of activities and attractions, including a farmers market, a flea market, and a variety of festivals and events. The town is also home to a few historical sites, including the Vallonia Historical Museum and the Vallonia Cemetery.
Vallonia is a great place to live and visit, with its rural setting, friendly people, and a variety of activities and attractions. The town is a great place to raise a family, with its low cost of living and its strong sense of community.
Common Questions
What is Per Capita Income in Vallonia?
Per Capita income in Vallonia is $37,185.
What is the Median Family Income in Vallonia?
Median Family Income in Vallonia is $79,856.
What is the Median Household income in Vallonia?
Median Household Income in Vallonia is $78,702.
What is Income or Wage Gap in Vallonia?
Income or Wage Gap in Vallonia is 1.2%.
Women in Vallonia earn 98.8 cents for every dollar earned by a man.
What is Inequality or Gini Index in Vallonia?
Inequality or Gini Index in Vallonia is 0.27.
What is the Total Population of Vallonia?
Total Population of Vallonia is 354.
What is the Total Male Population of Vallonia?
Total Male Population of Vallonia is 168.
What is the Total Female Population of Vallonia?
Total Female Population of Vallonia is 186.
What is the Ratio of Males per 100 Females in Vallonia?
There are 90.32 Males per 100 Females in Vallonia.
What is the Ratio of Females per 100 Males in Vallonia?
There are 110.71 Females per 100 Males in Vallonia.
What is the Median Population Age in Vallonia?
Median Population Age in Vallonia is 41.0 Years.
What is the Average Family Size in Vallonia
Average Family Size in Vallonia is 2.8 People.
What is the Average Household Size in Vallonia
Average Household Size in Vallonia is 2.5 People.
How Large is the Labor Force in Vallonia?
There are 263 People in the Labor Forcein in Vallonia.
What is the Percentage of People in the Labor Force in Vallonia?
82.2% of People are in the Labor Force in Vallonia.
What is the Unemployment Rate in Vallonia?
Unemployment Rate in Vallonia is 6.5%.