Sullivan, IN Map & Demographics
Sullivan Map
Sullivan Overview
$22,556
PER CAPITA INCOME
$63,405
AVG FAMILY INCOME
$44,227
AVG HOUSEHOLD INCOME
7.7%
WAGE / INCOME GAP [ % ]
92.3¢/ $1
WAGE / INCOME GAP [ $ ]
0.38
INEQUALITY / GINI INDEX
4,243
TOTAL POPULATION
1,959
MALE POPULATION
2,284
FEMALE POPULATION
85.77
MALES / 100 FEMALES
116.59
FEMALES / 100 MALES
34.5
MEDIAN AGE
2.9
AVG FAMILY SIZE
2.4
AVG HOUSEHOLD SIZE
2,148
LABOR FORCE [ PEOPLE ]
66.1%
PERCENT IN LABOR FORCE
4.6%
UNEMPLOYMENT RATE
Sullivan Zip Codes
Sullivan Area Codes
Income in Sullivan
Income Overview in Sullivan
Per Capita Income in Sullivan is $22,556, while median incomes of families and households are $63,405 and $44,227 respectively.
| Characteristic | Number | Measure |
| Per Capita Income | 4,243 | $22,556 |
| Median Family Income | 1,161 | $63,405 |
| Mean Family Income | 1,161 | $60,222 |
| Median Household Income | 1,767 | $44,227 |
| Mean Household Income | 1,767 | $53,223 |
| Income Deficit | 1,161 | $0 |
| Wage / Income Gap (%) | 4,243 | 7.74% |
| Wage / Income Gap ($) | 4,243 | 92.26¢ per $1 |
| Gini / Inequality Index | 4,243 | 0.38 |
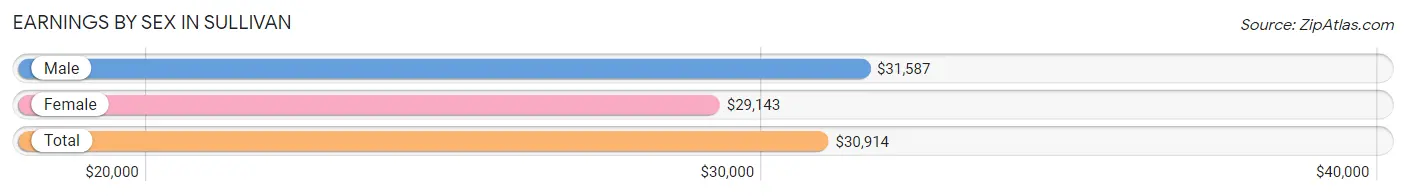
Earnings by Sex in Sullivan
Average Earnings in Sullivan are $30,914, $31,587 for men and $29,143 for women, a difference of 7.7%.
| Sex | Number | Average Earnings |
| Male | 932 (43.9%) | $31,587 |
| Female | 1,192 (56.1%) | $29,143 |
| Total | 2,124 (100.0%) | $30,914 |
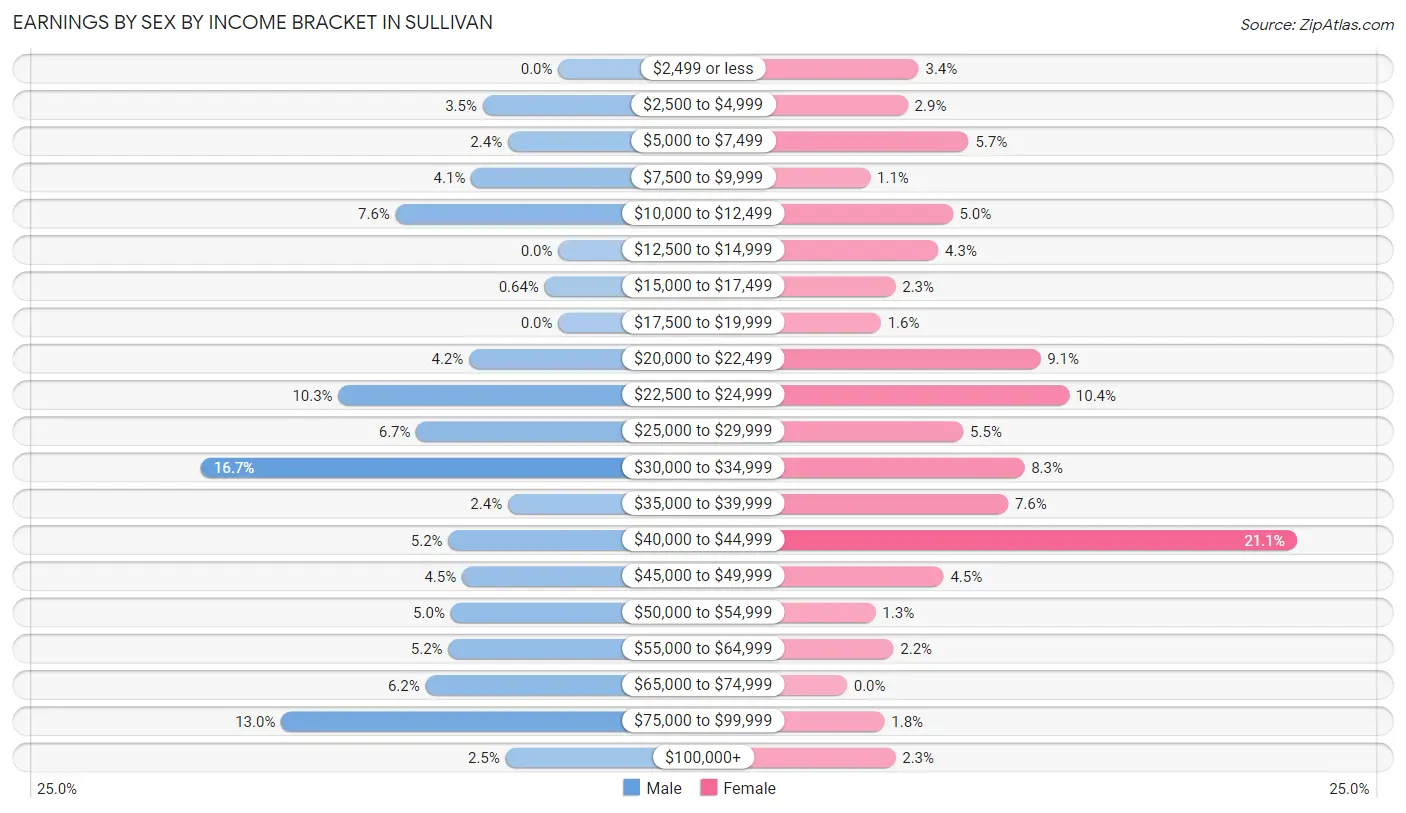
Earnings by Sex by Income Bracket in Sullivan
The most common earnings brackets in Sullivan are $30,000 to $34,999 for men (156 | 16.7%) and $40,000 to $44,999 for women (251 | 21.1%).
| Income | Male | Female |
| $2,499 or less | 0 (0.0%) | 40 (3.4%) |
| $2,500 to $4,999 | 33 (3.5%) | 34 (2.9%) |
| $5,000 to $7,499 | 22 (2.4%) | 68 (5.7%) |
| $7,500 to $9,999 | 38 (4.1%) | 13 (1.1%) |
| $10,000 to $12,499 | 71 (7.6%) | 59 (5.0%) |
| $12,500 to $14,999 | 0 (0.0%) | 51 (4.3%) |
| $15,000 to $17,499 | 6 (0.6%) | 27 (2.3%) |
| $17,500 to $19,999 | 0 (0.0%) | 19 (1.6%) |
| $20,000 to $22,499 | 39 (4.2%) | 108 (9.1%) |
| $22,500 to $24,999 | 96 (10.3%) | 124 (10.4%) |
| $25,000 to $29,999 | 62 (6.7%) | 65 (5.4%) |
| $30,000 to $34,999 | 156 (16.7%) | 99 (8.3%) |
| $35,000 to $39,999 | 22 (2.4%) | 90 (7.5%) |
| $40,000 to $44,999 | 48 (5.1%) | 251 (21.1%) |
| $45,000 to $49,999 | 42 (4.5%) | 54 (4.5%) |
| $50,000 to $54,999 | 47 (5.0%) | 16 (1.3%) |
| $55,000 to $64,999 | 48 (5.1%) | 26 (2.2%) |
| $65,000 to $74,999 | 58 (6.2%) | 0 (0.0%) |
| $75,000 to $99,999 | 121 (13.0%) | 21 (1.8%) |
| $100,000+ | 23 (2.5%) | 27 (2.3%) |
| Total | 932 (100.0%) | 1,192 (100.0%) |
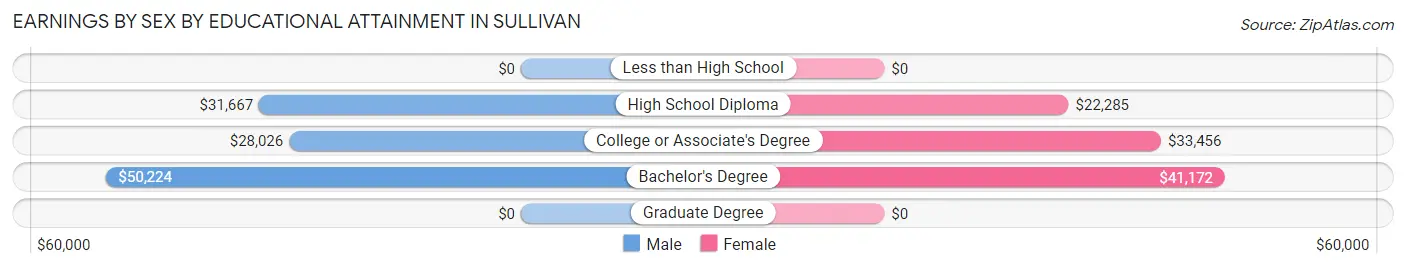
Earnings by Sex by Educational Attainment in Sullivan
Average earnings in Sullivan are $31,811 for men and $31,845 for women, a difference of 0.1%. Men with an educational attainment of bachelor's degree enjoy the highest average annual earnings of $50,224, while those with college or associate's degree education earn the least with $28,026. Women with an educational attainment of bachelor's degree earn the most with the average annual earnings of $41,172, while those with high school diploma education have the smallest earnings of $22,285.
| Educational Attainment | Male Income | Female Income |
| Less than High School | - | - |
| High School Diploma | $31,667 | $22,285 |
| College or Associate's Degree | $28,026 | $33,456 |
| Bachelor's Degree | $50,224 | $41,172 |
| Graduate Degree | - | - |
| Total | $31,811 | $31,845 |
Family Income in Sullivan
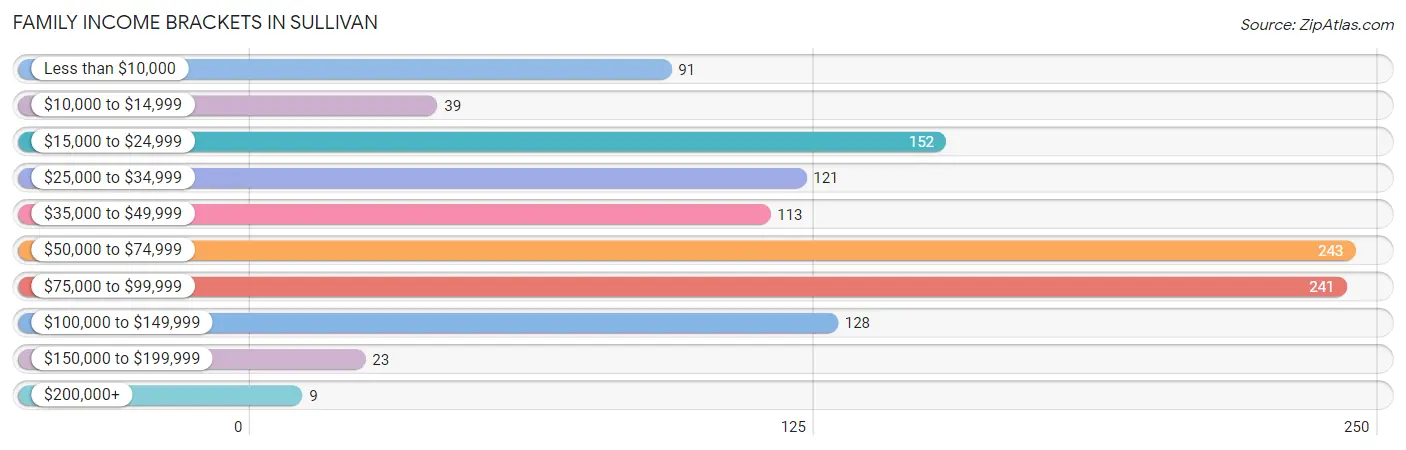
Family Income Brackets in Sullivan
According to the Sullivan family income data, there are 243 families falling into the $50,000 to $74,999 income range, which is the most common income bracket and makes up 20.9% of all families. Conversely, the $200,000+ income bracket is the least frequent group with only 9 families (0.8%) belonging to this category.
| Income Bracket | # Families | % Families |
| Less than $10,000 | 91 | 7.8% |
| $10,000 to $14,999 | 39 | 3.4% |
| $15,000 to $24,999 | 152 | 13.1% |
| $25,000 to $34,999 | 121 | 10.4% |
| $35,000 to $49,999 | 113 | 9.7% |
| $50,000 to $74,999 | 243 | 20.9% |
| $75,000 to $99,999 | 241 | 20.8% |
| $100,000 to $149,999 | 128 | 11.0% |
| $150,000 to $199,999 | 23 | 2.0% |
| $200,000+ | 9 | 0.8% |
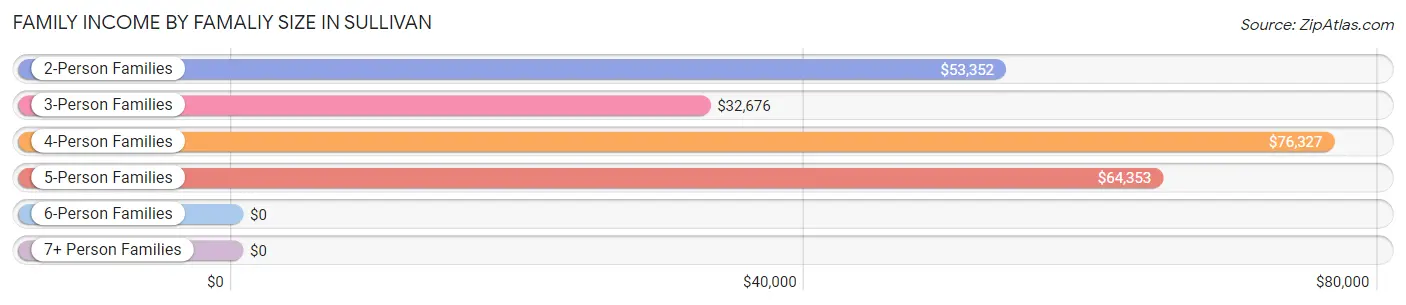
Family Income by Famaliy Size in Sullivan
4-person families (188 | 16.2%) account for the highest median family income in Sullivan with $76,327 per family, while 2-person families (533 | 45.9%) have the highest median income of $26,676 per family member.
| Income Bracket | # Families | Median Income |
| 2-Person Families | 533 (45.9%) | $53,352 |
| 3-Person Families | 279 (24.0%) | $32,676 |
| 4-Person Families | 188 (16.2%) | $76,327 |
| 5-Person Families | 161 (13.9%) | $64,353 |
| 6-Person Families | 0 (0.0%) | $0 |
| 7+ Person Families | 0 (0.0%) | $0 |
| Total | 1,161 (100.0%) | $63,405 |
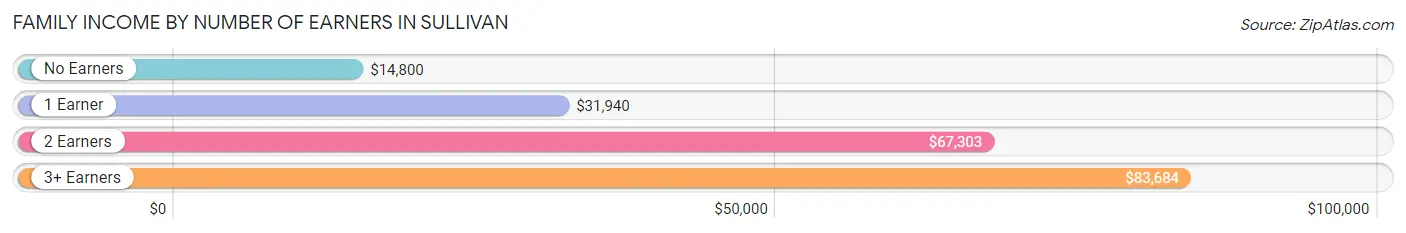
Family Income by Number of Earners in Sullivan
The median family income in Sullivan is $63,405, with families comprising 3+ earners (76) having the highest median family income of $83,684, while families with no earners (166) have the lowest median family income of $14,800, accounting for 6.6% and 14.3% of families, respectively.
| Number of Earners | # Families | Median Income |
| No Earners | 166 (14.3%) | $14,800 |
| 1 Earner | 389 (33.5%) | $31,940 |
| 2 Earners | 530 (45.7%) | $67,303 |
| 3+ Earners | 76 (6.6%) | $83,684 |
| Total | 1,161 (100.0%) | $63,405 |
Household Income in Sullivan
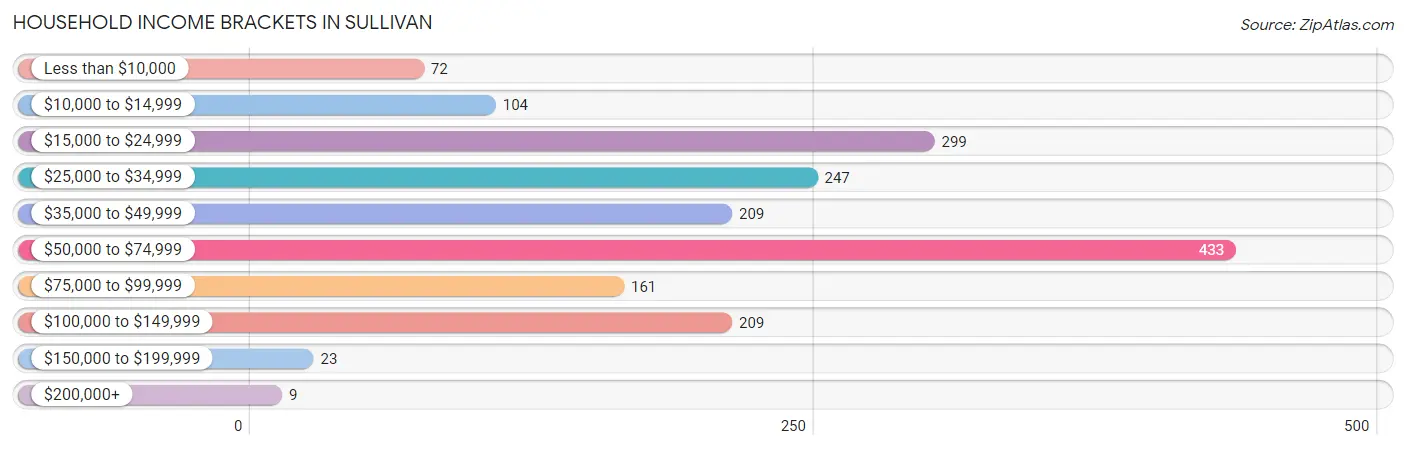
Household Income Brackets in Sullivan
With 433 households falling in the category, the $50,000 to $74,999 income range is the most frequent in Sullivan, accounting for 24.5% of all households. In contrast, only 9 households (0.5%) fall into the $200,000+ income bracket, making it the least populous group.
| Income Bracket | # Households | % Households |
| Less than $10,000 | 72 | 4.1% |
| $10,000 to $14,999 | 104 | 5.9% |
| $15,000 to $24,999 | 299 | 16.9% |
| $25,000 to $34,999 | 247 | 14.0% |
| $35,000 to $49,999 | 209 | 11.8% |
| $50,000 to $74,999 | 433 | 24.5% |
| $75,000 to $99,999 | 161 | 9.1% |
| $100,000 to $149,999 | 209 | 11.8% |
| $150,000 to $199,999 | 23 | 1.3% |
| $200,000+ | 9 | 0.5% |
Household Income by Householder Age in Sullivan
The median household income in Sullivan is $44,227, with the highest median household income of $53,182 found in the 45 to 64 years age bracket for the primary householder. A total of 494 households (28.0%) fall into this category. Meanwhile, the 15 to 24 years age bracket for the primary householder has the lowest median household income of $0, with 99 households (5.6%) in this group.
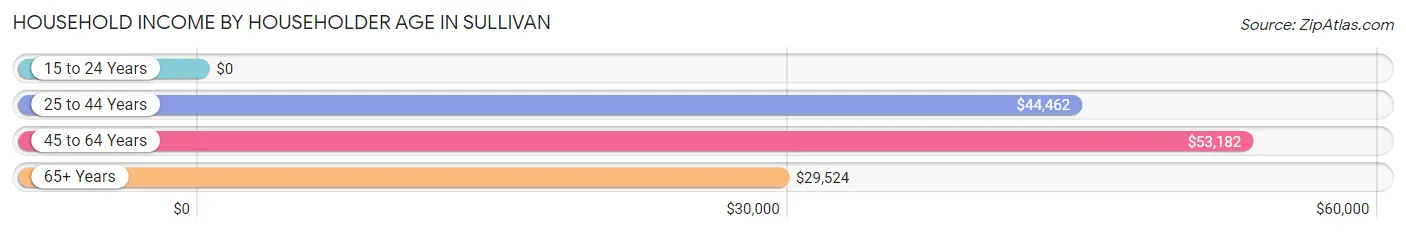
| Income Bracket | # Households | Median Income |
| 15 to 24 Years | 99 (5.6%) | $0 |
| 25 to 44 Years | 696 (39.4%) | $44,462 |
| 45 to 64 Years | 494 (28.0%) | $53,182 |
| 65+ Years | 478 (27.1%) | $29,524 |
| Total | 1,767 (100.0%) | $44,227 |
Poverty in Sullivan
Income Below Poverty by Sex and Age in Sullivan
With 16.6% poverty level for males and 19.3% for females among the residents of Sullivan, under 5 year old males and 25 to 34 year old females are the most vulnerable to poverty, with 110 males (37.2%) and 146 females (43.6%) in their respective age groups living below the poverty level.
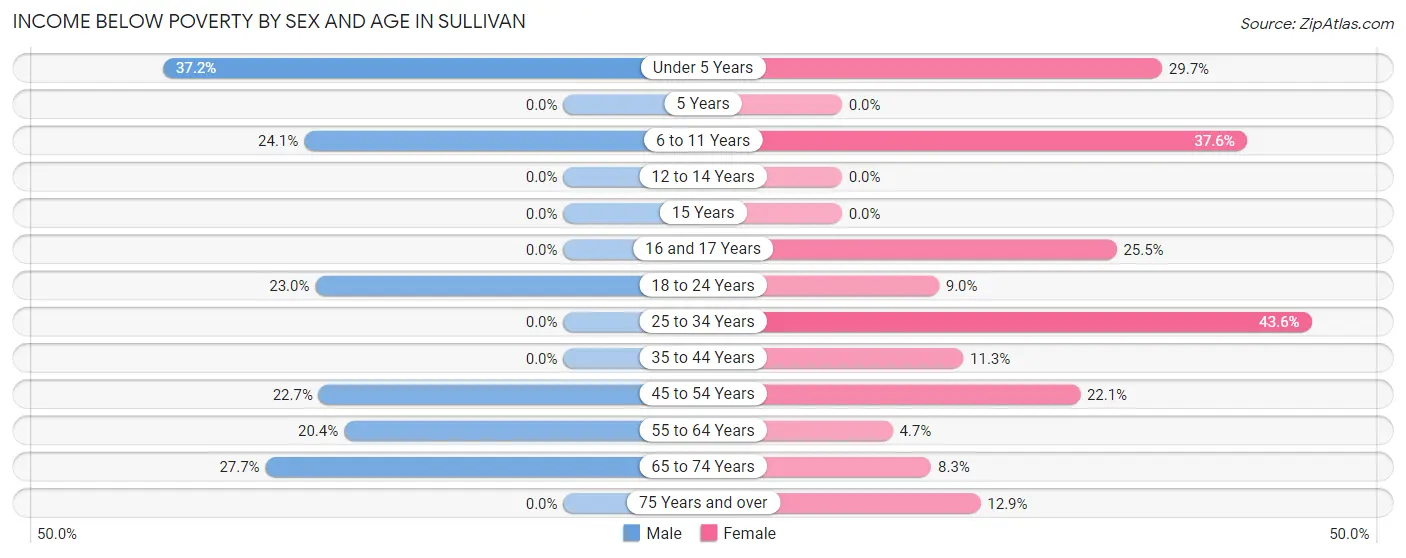
| Age Bracket | Male | Female |
| Under 5 Years | 110 (37.2%) | 41 (29.7%) |
| 5 Years | 0 (0.0%) | 0 (0.0%) |
| 6 to 11 Years | 51 (24.1%) | 68 (37.6%) |
| 12 to 14 Years | 0 (0.0%) | 0 (0.0%) |
| 15 Years | 0 (0.0%) | 0 (0.0%) |
| 16 and 17 Years | 0 (0.0%) | 13 (25.5%) |
| 18 to 24 Years | 32 (23.0%) | 26 (9.0%) |
| 25 to 34 Years | 0 (0.0%) | 146 (43.6%) |
| 35 to 44 Years | 0 (0.0%) | 25 (11.3%) |
| 45 to 54 Years | 32 (22.7%) | 40 (22.1%) |
| 55 to 64 Years | 46 (20.3%) | 14 (4.7%) |
| 65 to 74 Years | 47 (27.7%) | 15 (8.3%) |
| 75 Years and over | 0 (0.0%) | 40 (12.9%) |
| Total | 318 (16.6%) | 428 (19.3%) |
Income Above Poverty by Sex and Age in Sullivan
According to the poverty statistics in Sullivan, males aged 5 years and females aged 15 years are the age groups that are most secure financially, with 100.0% of males and 100.0% of females in these age groups living above the poverty line.
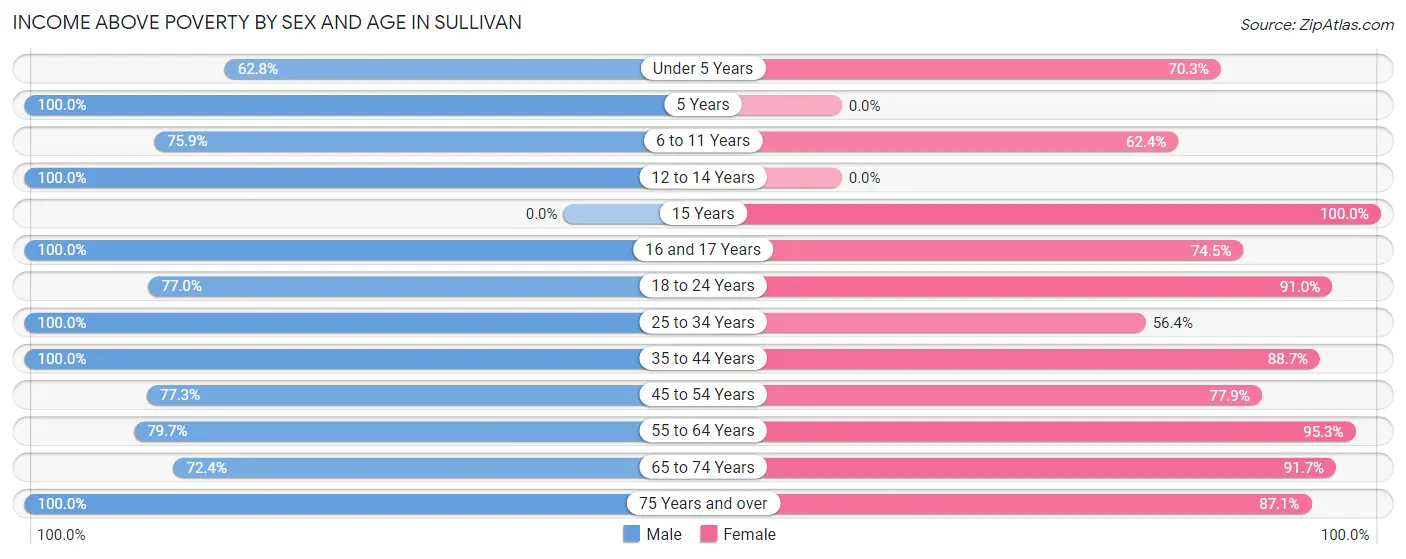
| Age Bracket | Male | Female |
| Under 5 Years | 186 (62.8%) | 97 (70.3%) |
| 5 Years | 47 (100.0%) | 0 (0.0%) |
| 6 to 11 Years | 161 (75.9%) | 113 (62.4%) |
| 12 to 14 Years | 54 (100.0%) | 0 (0.0%) |
| 15 Years | 0 (0.0%) | 29 (100.0%) |
| 16 and 17 Years | 75 (100.0%) | 38 (74.5%) |
| 18 to 24 Years | 107 (77.0%) | 263 (91.0%) |
| 25 to 34 Years | 286 (100.0%) | 189 (56.4%) |
| 35 to 44 Years | 241 (100.0%) | 197 (88.7%) |
| 45 to 54 Years | 109 (77.3%) | 141 (77.9%) |
| 55 to 64 Years | 180 (79.6%) | 284 (95.3%) |
| 65 to 74 Years | 123 (72.4%) | 166 (91.7%) |
| 75 Years and over | 33 (100.0%) | 271 (87.1%) |
| Total | 1,602 (83.4%) | 1,788 (80.7%) |
Income Below Poverty Among Married-Couple Families in Sullivan
The poverty statistics for married-couple families in Sullivan show that 4.4% or 31 of the total 702 families live below the poverty line. Families with no children have the highest poverty rate of 8.0%, comprising of 31 families. On the other hand, families with 1 or 2 children have the lowest poverty rate of 0.0%, which includes 0 families.
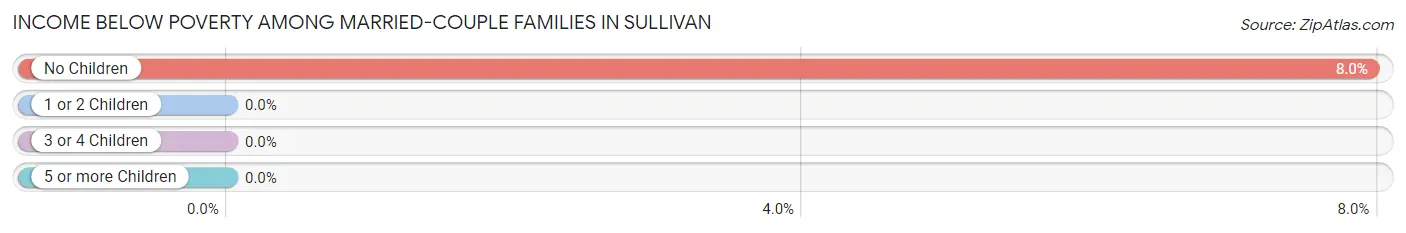
| Children | Above Poverty | Below Poverty |
| No Children | 359 (92.0%) | 31 (8.0%) |
| 1 or 2 Children | 189 (100.0%) | 0 (0.0%) |
| 3 or 4 Children | 123 (100.0%) | 0 (0.0%) |
| 5 or more Children | 0 (0.0%) | 0 (0.0%) |
| Total | 671 (95.6%) | 31 (4.4%) |
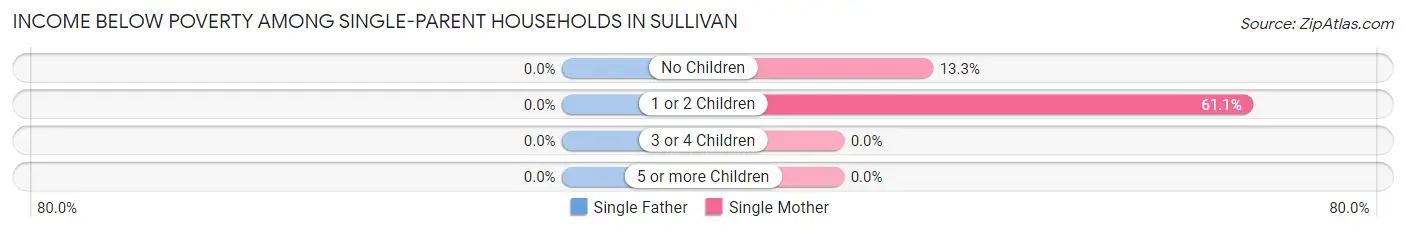
Income Below Poverty Among Single-Parent Households in Sullivan
| Children | Single Father | Single Mother |
| No Children | 0 (0.0%) | 13 (13.3%) |
| 1 or 2 Children | 0 (0.0%) | 171 (61.1%) |
| 3 or 4 Children | 0 (0.0%) | 0 (0.0%) |
| 5 or more Children | 0 (0.0%) | 0 (0.0%) |
| Total | 0 (0.0%) | 184 (48.7%) |
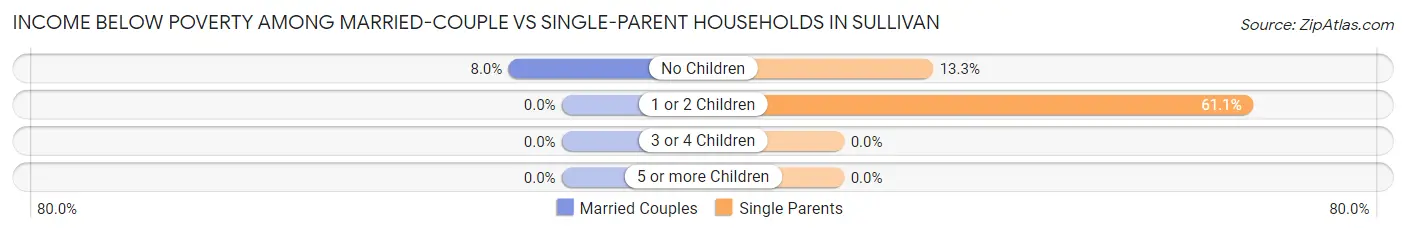
Income Below Poverty Among Married-Couple vs Single-Parent Households in Sullivan
The poverty data for Sullivan shows that 31 of the married-couple family households (4.4%) and 184 of the single-parent households (40.1%) are living below the poverty level. Within the married-couple family households, those with no children have the highest poverty rate, with 31 households (8.0%) falling below the poverty line. Among the single-parent households, those with 1 or 2 children have the highest poverty rate, with 171 household (61.1%) living below poverty.
| Children | Married-Couple Families | Single-Parent Households |
| No Children | 31 (8.0%) | 13 (13.3%) |
| 1 or 2 Children | 0 (0.0%) | 171 (61.1%) |
| 3 or 4 Children | 0 (0.0%) | 0 (0.0%) |
| 5 or more Children | 0 (0.0%) | 0 (0.0%) |
| Total | 31 (4.4%) | 184 (40.1%) |
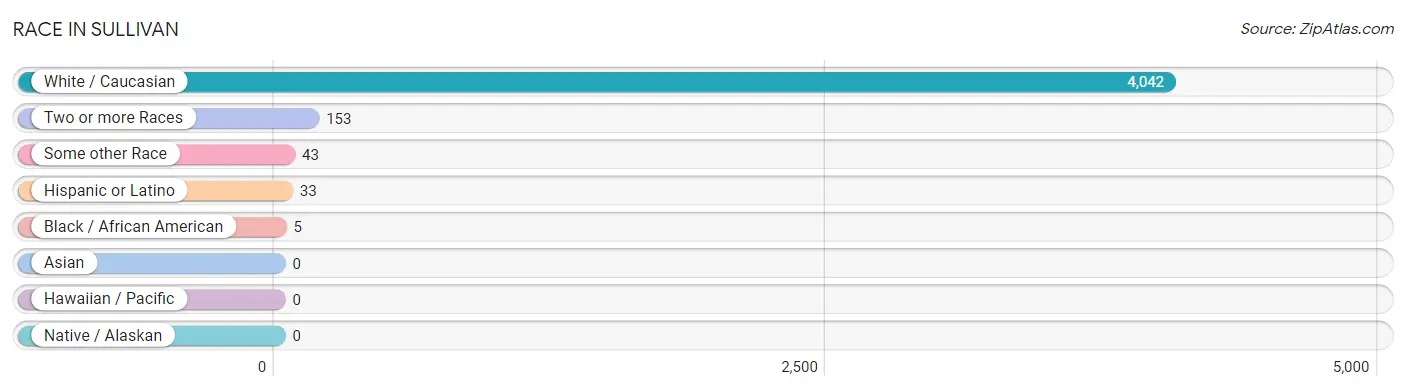
Race in Sullivan
The most populous races in Sullivan are White / Caucasian (4,042 | 95.3%), Two or more Races (153 | 3.6%), and Some other Race (43 | 1.0%).
| Race | # Population | % Population |
| Asian | 0 | 0.0% |
| Black / African American | 5 | 0.1% |
| Hawaiian / Pacific | 0 | 0.0% |
| Hispanic or Latino | 33 | 0.8% |
| Native / Alaskan | 0 | 0.0% |
| White / Caucasian | 4,042 | 95.3% |
| Two or more Races | 153 | 3.6% |
| Some other Race | 43 | 1.0% |
| Total | 4,243 | 100.0% |
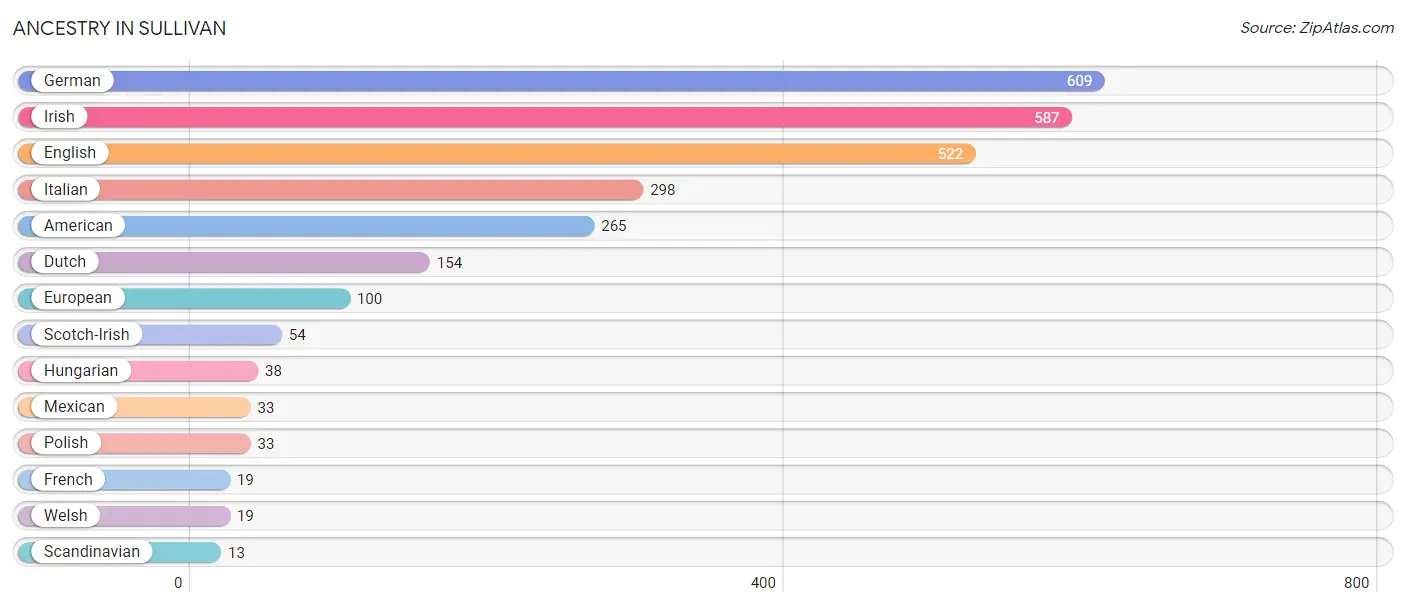
Ancestry in Sullivan
The most populous ancestries reported in Sullivan are German (609 | 14.3%), Irish (587 | 13.8%), English (522 | 12.3%), Italian (298 | 7.0%), and American (265 | 6.2%), together accounting for 53.7% of all Sullivan residents.
| Ancestry | # Population | % Population |
| American | 265 | 6.2% |
| Dutch | 154 | 3.6% |
| English | 522 | 12.3% |
| European | 100 | 2.4% |
| French | 19 | 0.4% |
| German | 609 | 14.3% |
| Hungarian | 38 | 0.9% |
| Irish | 587 | 13.8% |
| Italian | 298 | 7.0% |
| Mexican | 33 | 0.8% |
| Polish | 33 | 0.8% |
| Scandinavian | 13 | 0.3% |
| Scotch-Irish | 54 | 1.3% |
| Welsh | 19 | 0.4% | View All 14 Rows |
Immigrants in Sullivan

| Immigration Origin | # Population | % Population | View All 0 Rows |
Sex and Age in Sullivan
Sex and Age in Sullivan
The most populous age groups in Sullivan are Under 5 Years (311 | 15.9%) for men and 20 to 24 Years (243 | 10.6%) for women.
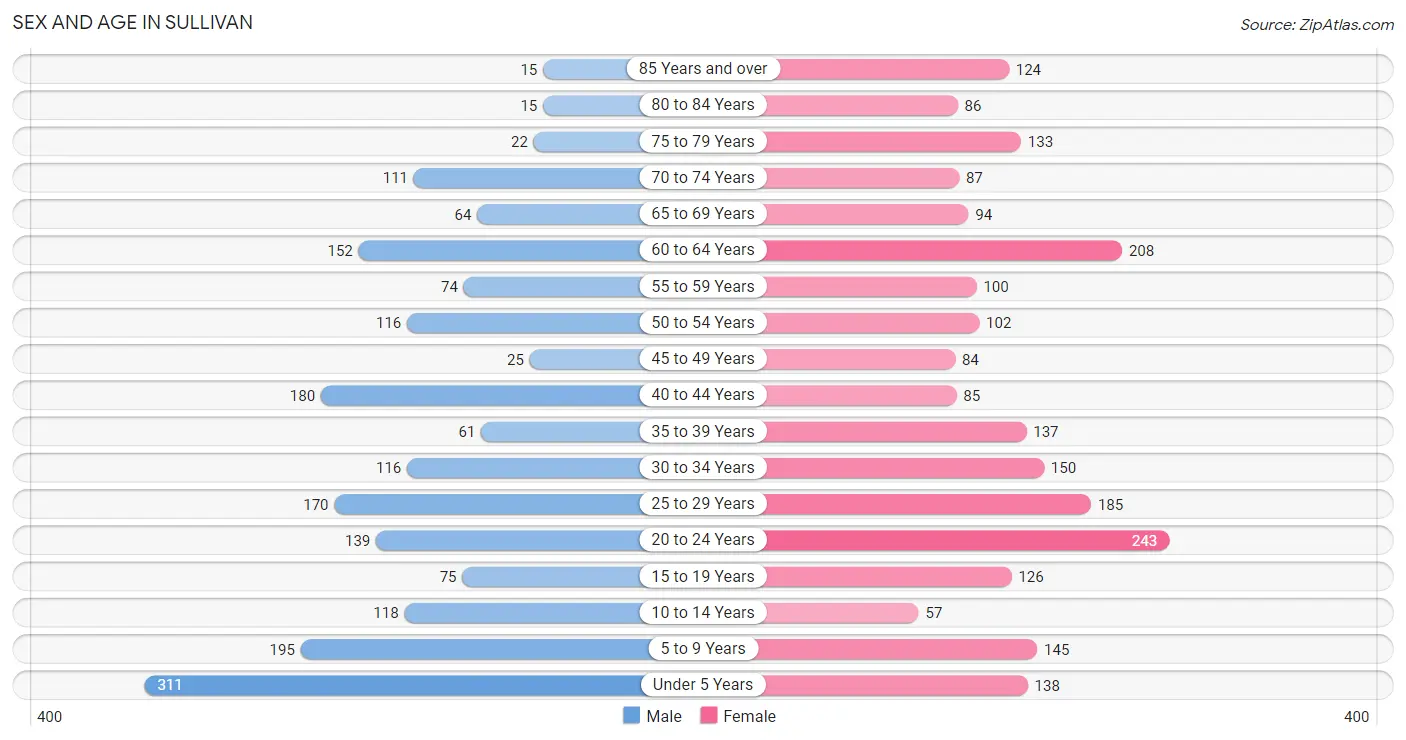
| Age Bracket | Male | Female |
| Under 5 Years | 311 (15.9%) | 138 (6.0%) |
| 5 to 9 Years | 195 (10.0%) | 145 (6.4%) |
| 10 to 14 Years | 118 (6.0%) | 57 (2.5%) |
| 15 to 19 Years | 75 (3.8%) | 126 (5.5%) |
| 20 to 24 Years | 139 (7.1%) | 243 (10.6%) |
| 25 to 29 Years | 170 (8.7%) | 185 (8.1%) |
| 30 to 34 Years | 116 (5.9%) | 150 (6.6%) |
| 35 to 39 Years | 61 (3.1%) | 137 (6.0%) |
| 40 to 44 Years | 180 (9.2%) | 85 (3.7%) |
| 45 to 49 Years | 25 (1.3%) | 84 (3.7%) |
| 50 to 54 Years | 116 (5.9%) | 102 (4.5%) |
| 55 to 59 Years | 74 (3.8%) | 100 (4.4%) |
| 60 to 64 Years | 152 (7.8%) | 208 (9.1%) |
| 65 to 69 Years | 64 (3.3%) | 94 (4.1%) |
| 70 to 74 Years | 111 (5.7%) | 87 (3.8%) |
| 75 to 79 Years | 22 (1.1%) | 133 (5.8%) |
| 80 to 84 Years | 15 (0.8%) | 86 (3.8%) |
| 85 Years and over | 15 (0.8%) | 124 (5.4%) |
| Total | 1,959 (100.0%) | 2,284 (100.0%) |
Families and Households in Sullivan
Median Family Size in Sullivan
The median family size in Sullivan is 2.85 persons per family, with married-couple families (702 | 60.5%) accounting for the largest median family size of 3.03 persons per family. On the other hand, single male/father families (81 | 7.0%) represent the smallest median family size with 2.53 persons per family.
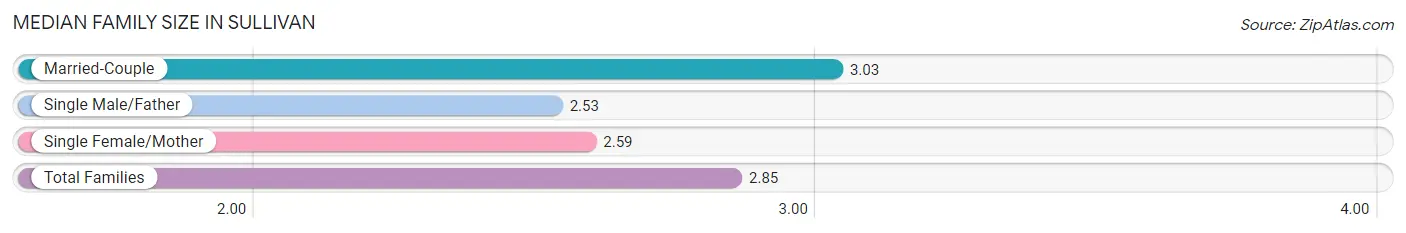
| Family Type | # Families | Family Size |
| Married-Couple | 702 (60.5%) | 3.03 |
| Single Male/Father | 81 (7.0%) | 2.53 |
| Single Female/Mother | 378 (32.6%) | 2.59 |
| Total Families | 1,161 (100.0%) | 2.85 |
Median Household Size in Sullivan
The median household size in Sullivan is 2.36 persons per household, with single male/father households (81 | 4.6%) accounting for the largest median household size of 3.09 persons per household. non-family households (606 | 34.3%) represent the smallest median household size with 1.21 persons per household.
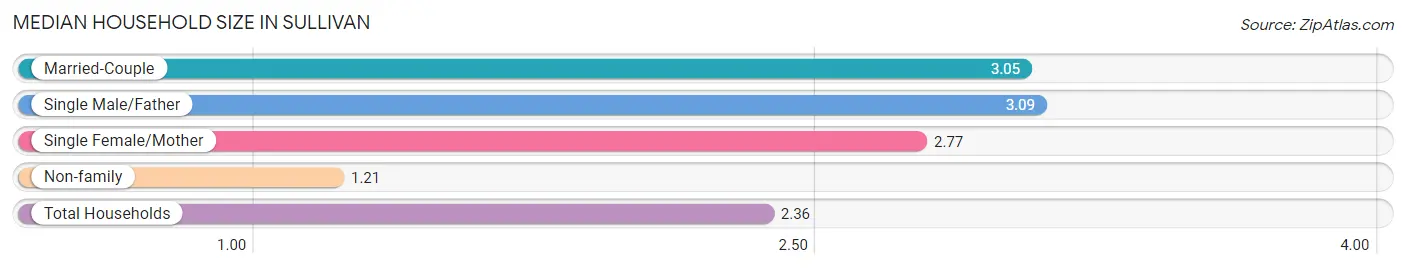
| Household Type | # Households | Household Size |
| Married-Couple | 702 (39.7%) | 3.05 |
| Single Male/Father | 81 (4.6%) | 3.09 |
| Single Female/Mother | 378 (21.4%) | 2.77 |
| Non-family | 606 (34.3%) | 1.21 |
| Total Households | 1,767 (100.0%) | 2.36 |
Household Size by Marriage Status in Sullivan
Out of a total of 1,767 households in Sullivan, 1,161 (65.7%) are family households, while 606 (34.3%) are nonfamily households. The most numerous type of family households are 2-person households, comprising 502, and the most common type of nonfamily households are 1-person households, comprising 510.
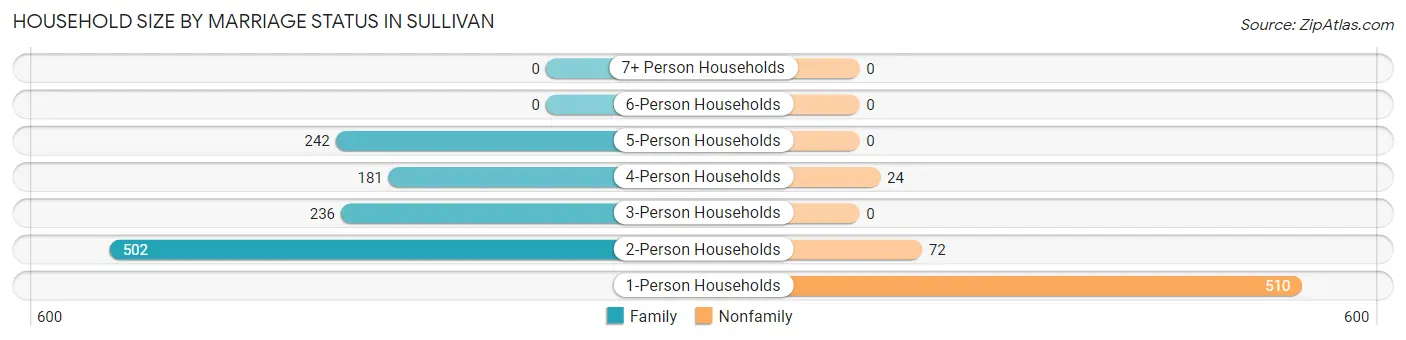
| Household Size | Family Households | Nonfamily Households |
| 1-Person Households | - | 510 (28.9%) |
| 2-Person Households | 502 (28.4%) | 72 (4.1%) |
| 3-Person Households | 236 (13.4%) | 0 (0.0%) |
| 4-Person Households | 181 (10.2%) | 24 (1.4%) |
| 5-Person Households | 242 (13.7%) | 0 (0.0%) |
| 6-Person Households | 0 (0.0%) | 0 (0.0%) |
| 7+ Person Households | 0 (0.0%) | 0 (0.0%) |
| Total | 1,161 (65.7%) | 606 (34.3%) |
Female Fertility in Sullivan
Fertility by Age in Sullivan
Average fertility rate in Sullivan is 95.0 births per 1,000 women. Women in the age bracket of 20 to 34 years have the highest fertility rate with 166.0 births per 1,000 women. Women in the age bracket of 20 to 34 years acount for 100.0% of all women with births.
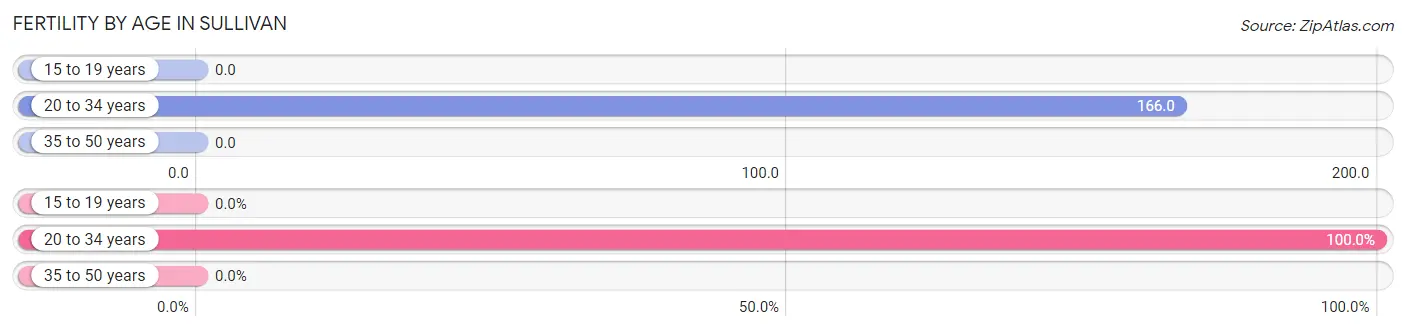
| Age Bracket | Women with Births | Births / 1,000 Women |
| 15 to 19 years | 0 (0.0%) | 0.0 |
| 20 to 34 years | 96 (100.0%) | 166.0 |
| 35 to 50 years | 0 (0.0%) | 0.0 |
| Total | 96 (100.0%) | 95.0 |
Fertility by Age by Marriage Status in Sullivan
27.1% of women with births (96) in Sullivan are married. The highest percentage of unmarried women with births falls into 20 to 34 years age bracket with 72.9% of them unmarried at the time of birth, while the lowest percentage of unmarried women with births belong to 20 to 34 years age bracket with 72.9% of them unmarried.
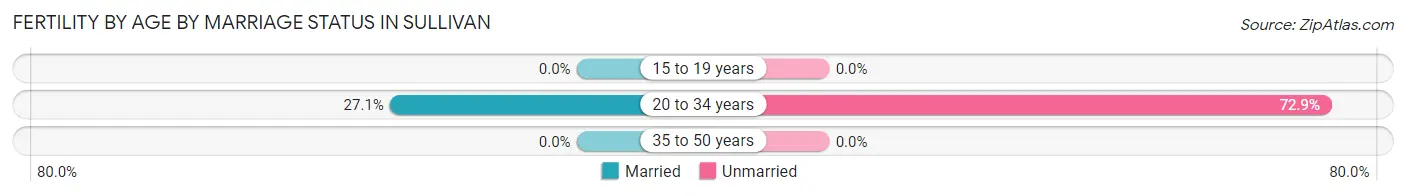
| Age Bracket | Married | Unmarried |
| 15 to 19 years | 0 (0.0%) | 0 (0.0%) |
| 20 to 34 years | 26 (27.1%) | 70 (72.9%) |
| 35 to 50 years | 0 (0.0%) | 0 (0.0%) |
| Total | 26 (27.1%) | 70 (72.9%) |
Fertility by Education in Sullivan
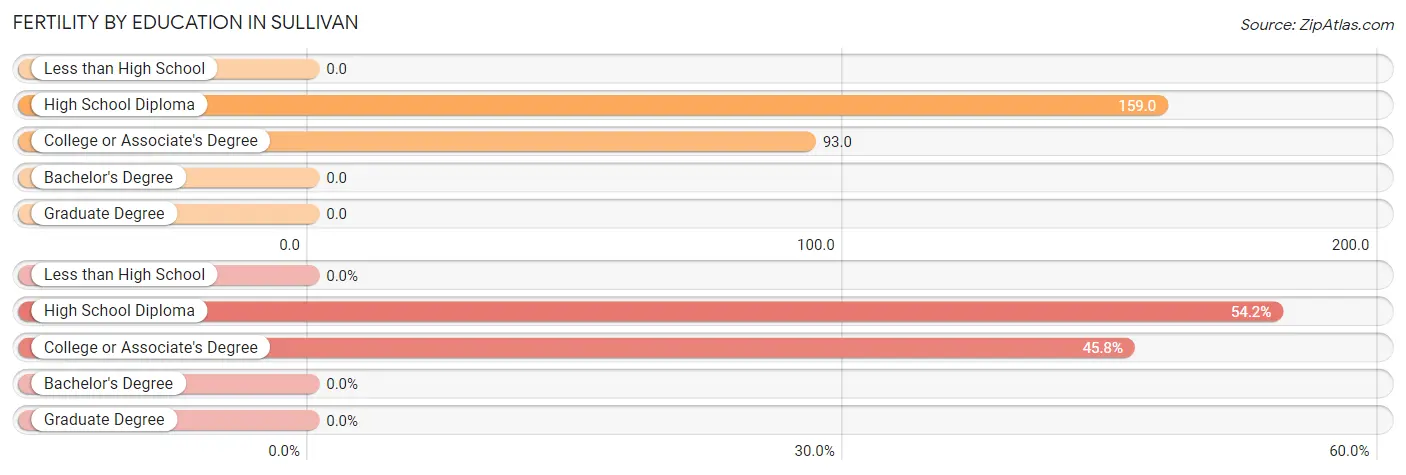
| Educational Attainment | Women with Births | Births / 1,000 Women |
| Less than High School | 0 (0.0%) | 0.0 |
| High School Diploma | 52 (54.2%) | 159.0 |
| College or Associate's Degree | 44 (45.8%) | 93.0 |
| Bachelor's Degree | 0 (0.0%) | 0.0 |
| Graduate Degree | 0 (0.0%) | 0.0 |
| Total | 96 (100.0%) | 95.0 |
Fertility by Education by Marriage Status in Sullivan
72.9% of women with births in Sullivan are unmarried. Women with the educational attainment of college or associate's degree are most likely to be married with 59.1% of them married at childbirth, while women with the educational attainment of high school diploma are least likely to be married with 100.0% of them unmarried at childbirth.
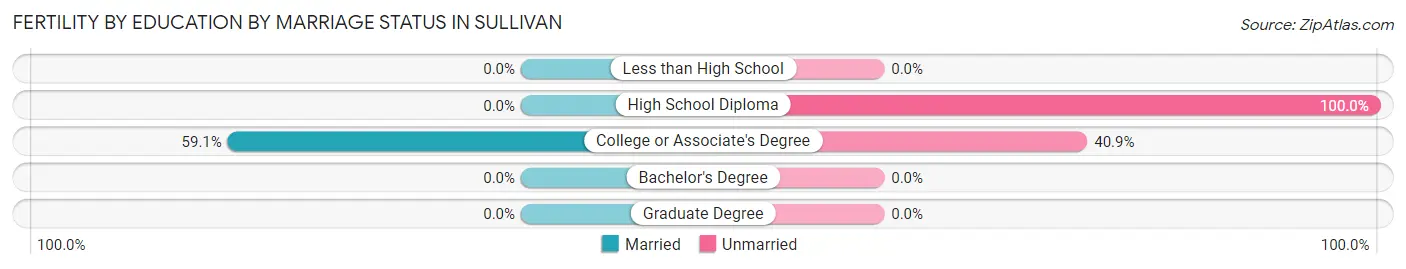
| Educational Attainment | Married | Unmarried |
| Less than High School | 0 (0.0%) | 0 (0.0%) |
| High School Diploma | 0 (0.0%) | 52 (100.0%) |
| College or Associate's Degree | 26 (59.1%) | 18 (40.9%) |
| Bachelor's Degree | 0 (0.0%) | 0 (0.0%) |
| Graduate Degree | 0 (0.0%) | 0 (0.0%) |
| Total | 26 (27.1%) | 70 (72.9%) |
Employment Characteristics in Sullivan
Employment by Class of Employer in Sullivan
Among the 1,993 employed individuals in Sullivan, private company employees (1,378 | 69.1%), not-for-profit organizations (288 | 14.4%), and state government employees (201 | 10.1%) make up the most common classes of employment.
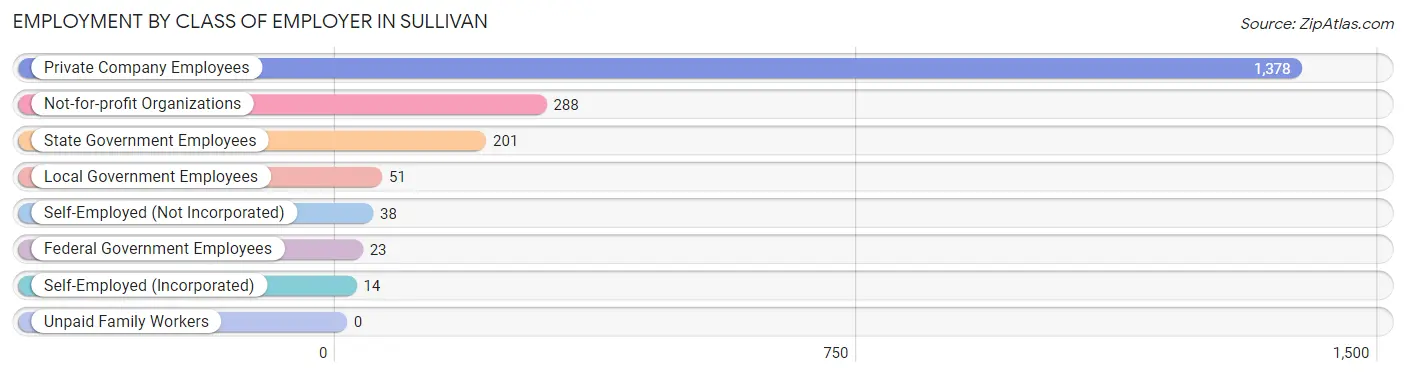
| Employer Class | # Employees | % Employees |
| Private Company Employees | 1,378 | 69.1% |
| Self-Employed (Incorporated) | 14 | 0.7% |
| Self-Employed (Not Incorporated) | 38 | 1.9% |
| Not-for-profit Organizations | 288 | 14.4% |
| Local Government Employees | 51 | 2.6% |
| State Government Employees | 201 | 10.1% |
| Federal Government Employees | 23 | 1.1% |
| Unpaid Family Workers | 0 | 0.0% |
| Total | 1,993 | 100.0% |
Employment Status by Age in Sullivan
According to the labor force statistics for Sullivan, out of the total population over 16 years of age (3,250), 66.1% or 2,148 individuals are in the labor force, with 4.6% or 99 of them unemployed. The age group with the highest labor force participation rate is 30 to 34 years, with 100.0% or 266 individuals in the labor force. Within the labor force, the 30 to 34 years age range has the highest percentage of unemployed individuals, with 24.1% or 64 of them being unemployed.
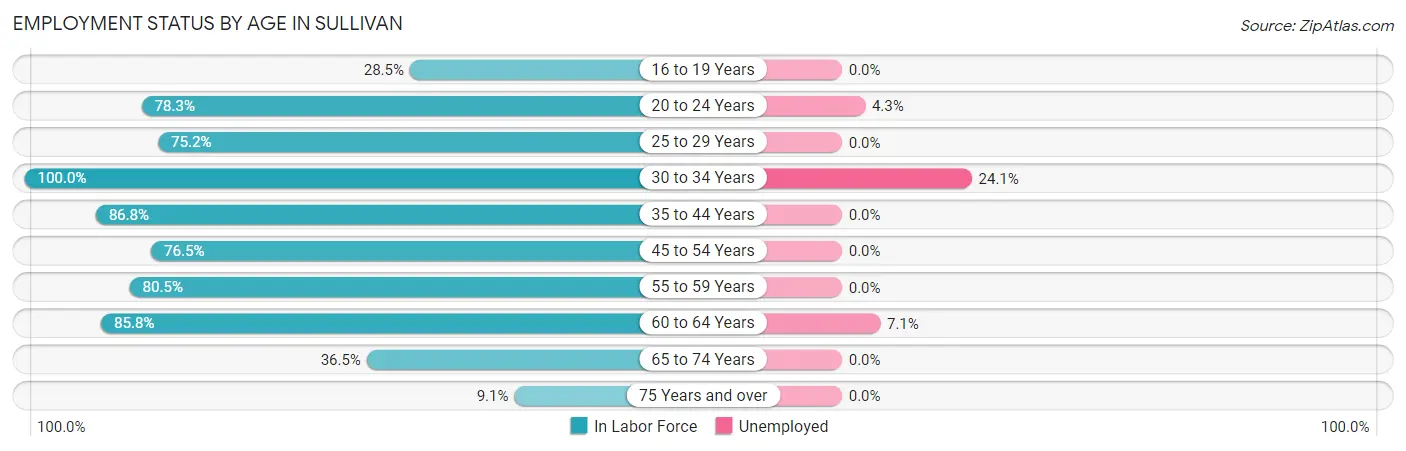
| Age Bracket | In Labor Force | Unemployed |
| 16 to 19 Years | 49 (28.5%) | 0 (0.0%) |
| 20 to 24 Years | 299 (78.3%) | 13 (4.3%) |
| 25 to 29 Years | 267 (75.2%) | 0 (0.0%) |
| 30 to 34 Years | 266 (100.0%) | 64 (24.1%) |
| 35 to 44 Years | 402 (86.8%) | 0 (0.0%) |
| 45 to 54 Years | 250 (76.5%) | 0 (0.0%) |
| 55 to 59 Years | 140 (80.5%) | 0 (0.0%) |
| 60 to 64 Years | 309 (85.8%) | 22 (7.1%) |
| 65 to 74 Years | 130 (36.5%) | 0 (0.0%) |
| 75 Years and over | 36 (9.1%) | 0 (0.0%) |
| Total | 2,148 (66.1%) | 99 (4.6%) |
Employment Status by Educational Attainment in Sullivan
According to labor force statistics for Sullivan, 84.0% of individuals (1,634) out of the total population between 25 and 64 years of age (1,945) are in the labor force, with 5.3% or 87 of them being unemployed. The group with the highest labor force participation rate are those with the educational attainment of bachelor's degree or higher, with 100.0% or 245 individuals in the labor force. Within the labor force, individuals with high school diploma education have the highest percentage of unemployment, with 7.1% or 50 of them being unemployed.
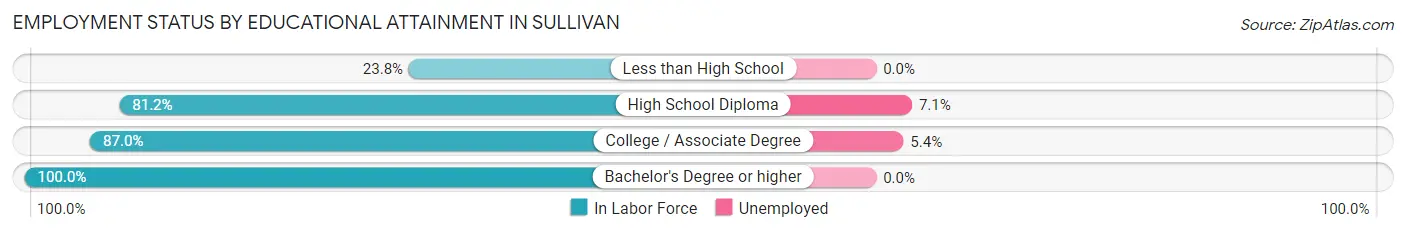
| Educational Attainment | In Labor Force | Unemployed |
| Less than High School | 15 (23.8%) | 0 (0.0%) |
| High School Diploma | 702 (81.2%) | 61 (7.1%) |
| College / Associate Degree | 672 (87.0%) | 42 (5.4%) |
| Bachelor's Degree or higher | 245 (100.0%) | 0 (0.0%) |
| Total | 1,634 (84.0%) | 103 (5.3%) |
Employment Occupations by Sex in Sullivan
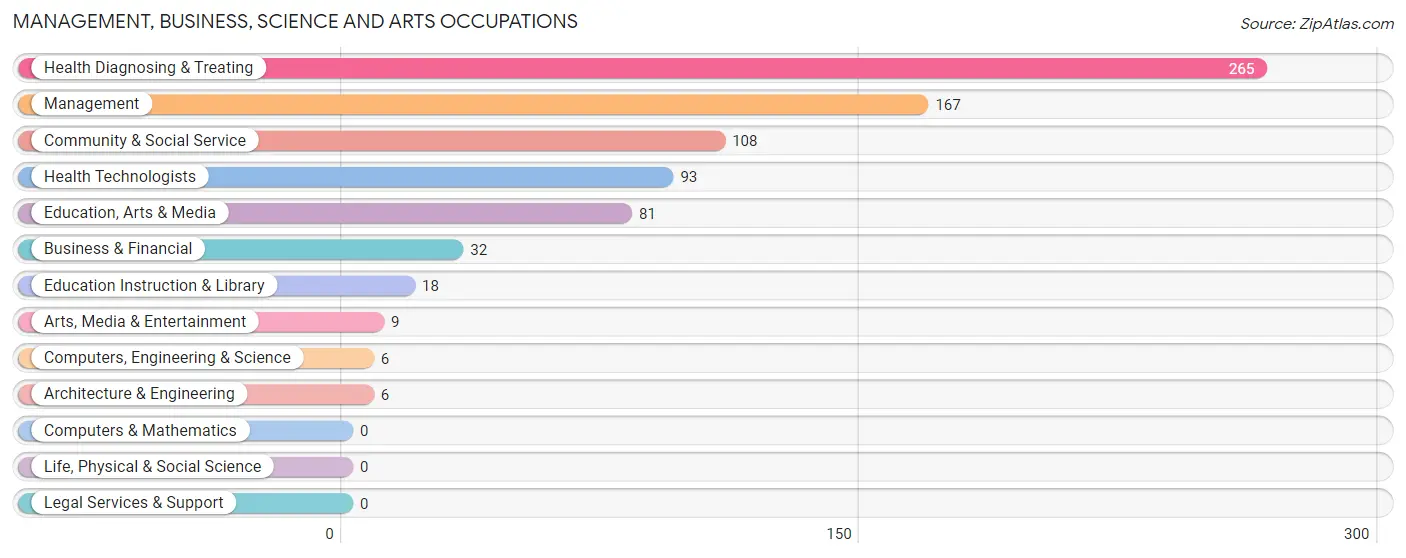
Management, Business, Science and Arts Occupations
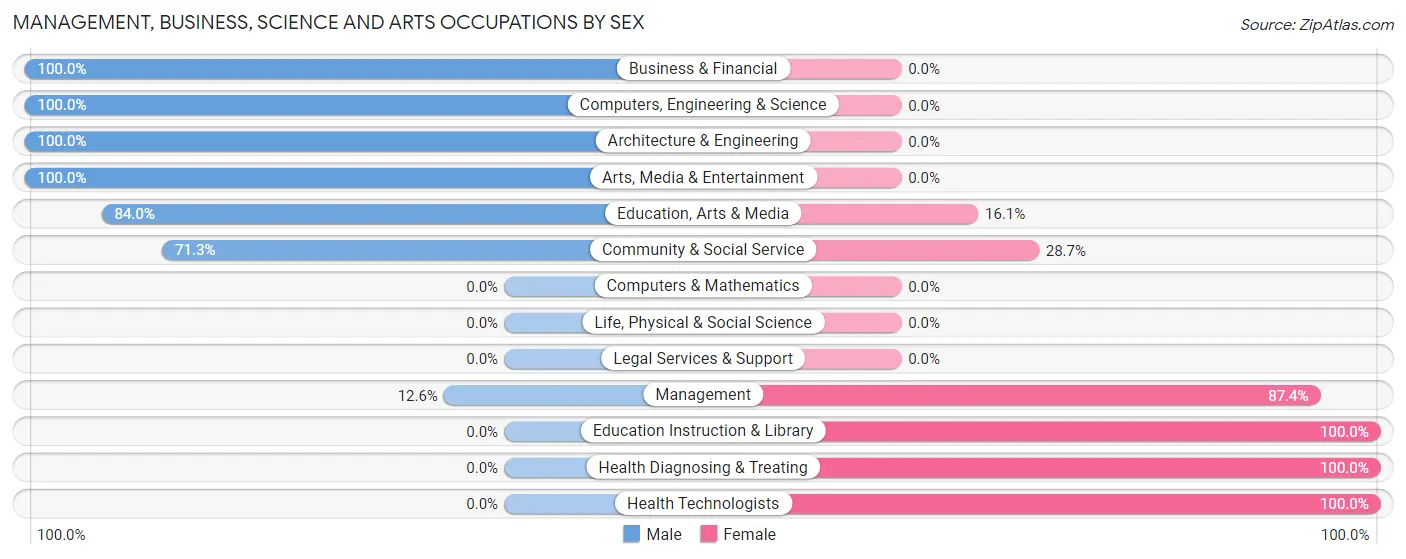
The most common Management, Business, Science and Arts occupations in Sullivan are Health Diagnosing & Treating (265 | 12.9%), Management (167 | 8.2%), Community & Social Service (108 | 5.3%), Health Technologists (93 | 4.5%), and Education, Arts & Media (81 | 4.0%).
Management, Business, Science and Arts Occupations by Sex
Within the Management, Business, Science and Arts occupations in Sullivan, the most male-oriented occupations are Business & Financial (100.0%), Computers, Engineering & Science (100.0%), and Architecture & Engineering (100.0%), while the most female-oriented occupations are Education Instruction & Library (100.0%), Health Diagnosing & Treating (100.0%), and Health Technologists (100.0%).
| Occupation | Male | Female |
| Management | 21 (12.6%) | 146 (87.4%) |
| Business & Financial | 32 (100.0%) | 0 (0.0%) |
| Computers, Engineering & Science | 6 (100.0%) | 0 (0.0%) |
| Computers & Mathematics | 0 (0.0%) | 0 (0.0%) |
| Architecture & Engineering | 6 (100.0%) | 0 (0.0%) |
| Life, Physical & Social Science | 0 (0.0%) | 0 (0.0%) |
| Community & Social Service | 77 (71.3%) | 31 (28.7%) |
| Education, Arts & Media | 68 (84.0%) | 13 (16.1%) |
| Legal Services & Support | 0 (0.0%) | 0 (0.0%) |
| Education Instruction & Library | 0 (0.0%) | 18 (100.0%) |
| Arts, Media & Entertainment | 9 (100.0%) | 0 (0.0%) |
| Health Diagnosing & Treating | 0 (0.0%) | 265 (100.0%) |
| Health Technologists | 0 (0.0%) | 93 (100.0%) |
| Total (Category) | 136 (23.5%) | 442 (76.5%) |
| Total (Overall) | 877 (42.8%) | 1,172 (57.2%) |
Services Occupations
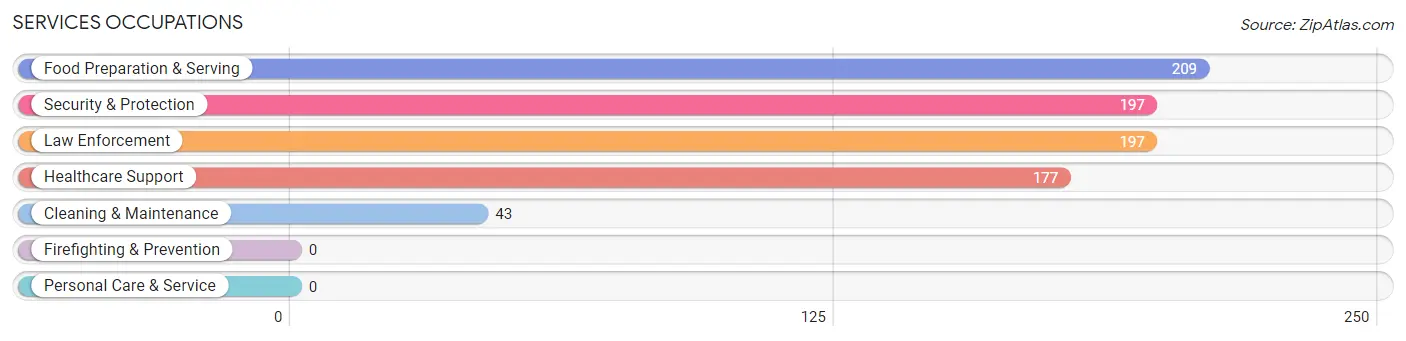
The most common Services occupations in Sullivan are Food Preparation & Serving (209 | 10.2%), Security & Protection (197 | 9.6%), Law Enforcement (197 | 9.6%), Healthcare Support (177 | 8.6%), and Cleaning & Maintenance (43 | 2.1%).
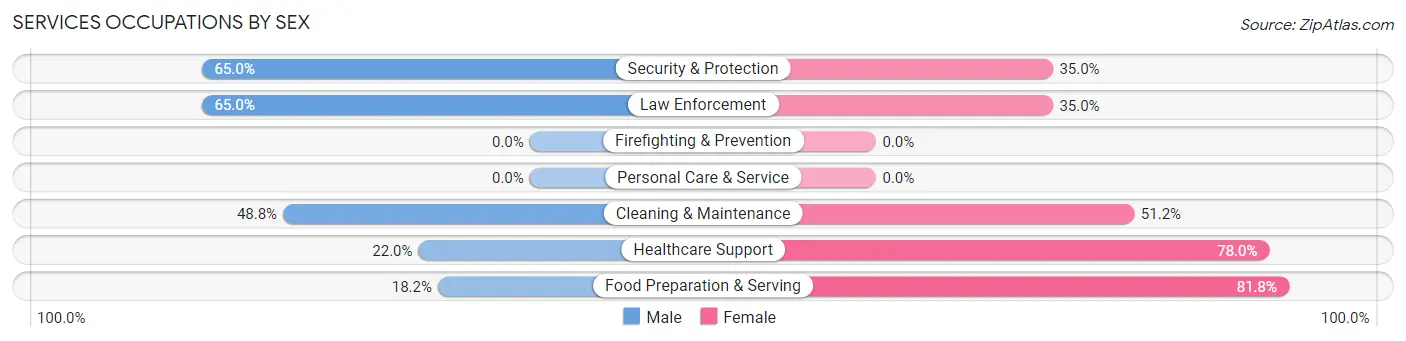
Services Occupations by Sex
Within the Services occupations in Sullivan, the most male-oriented occupations are Security & Protection (65.0%), Law Enforcement (65.0%), and Cleaning & Maintenance (48.8%), while the most female-oriented occupations are Food Preparation & Serving (81.8%), Healthcare Support (78.0%), and Cleaning & Maintenance (51.2%).
| Occupation | Male | Female |
| Healthcare Support | 39 (22.0%) | 138 (78.0%) |
| Security & Protection | 128 (65.0%) | 69 (35.0%) |
| Firefighting & Prevention | 0 (0.0%) | 0 (0.0%) |
| Law Enforcement | 128 (65.0%) | 69 (35.0%) |
| Food Preparation & Serving | 38 (18.2%) | 171 (81.8%) |
| Cleaning & Maintenance | 21 (48.8%) | 22 (51.2%) |
| Personal Care & Service | 0 (0.0%) | 0 (0.0%) |
| Total (Category) | 226 (36.1%) | 400 (63.9%) |
| Total (Overall) | 877 (42.8%) | 1,172 (57.2%) |
Sales and Office Occupations
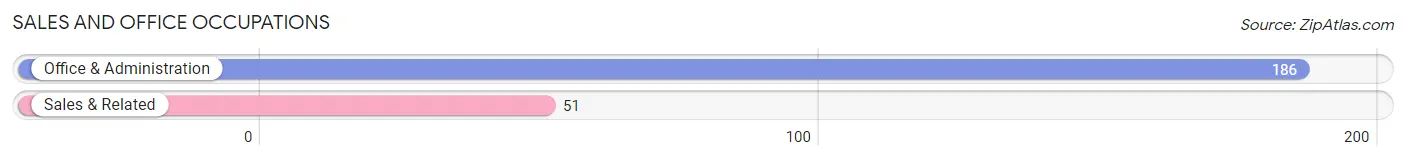
The most common Sales and Office occupations in Sullivan are Office & Administration (186 | 9.1%), and Sales & Related (51 | 2.5%).
Sales and Office Occupations by Sex
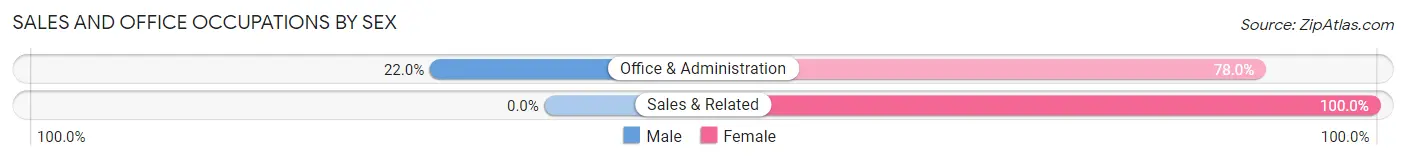
| Occupation | Male | Female |
| Sales & Related | 0 (0.0%) | 51 (100.0%) |
| Office & Administration | 41 (22.0%) | 145 (78.0%) |
| Total (Category) | 41 (17.3%) | 196 (82.7%) |
| Total (Overall) | 877 (42.8%) | 1,172 (57.2%) |
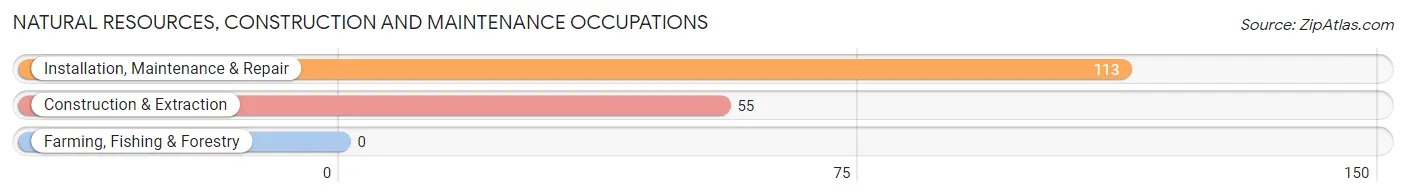
Natural Resources, Construction and Maintenance Occupations
The most common Natural Resources, Construction and Maintenance occupations in Sullivan are Installation, Maintenance & Repair (113 | 5.5%), and Construction & Extraction (55 | 2.7%).
Natural Resources, Construction and Maintenance Occupations by Sex
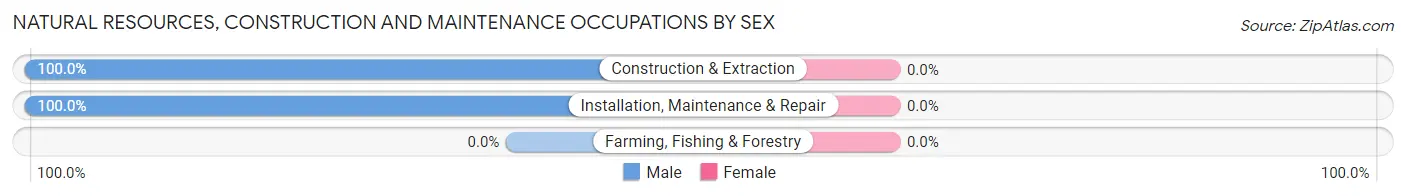
| Occupation | Male | Female |
| Farming, Fishing & Forestry | 0 (0.0%) | 0 (0.0%) |
| Construction & Extraction | 55 (100.0%) | 0 (0.0%) |
| Installation, Maintenance & Repair | 113 (100.0%) | 0 (0.0%) |
| Total (Category) | 168 (100.0%) | 0 (0.0%) |
| Total (Overall) | 877 (42.8%) | 1,172 (57.2%) |
Production, Transportation and Moving Occupations
The most common Production, Transportation and Moving occupations in Sullivan are Production (281 | 13.7%), Material Moving (94 | 4.6%), and Transportation (65 | 3.2%).
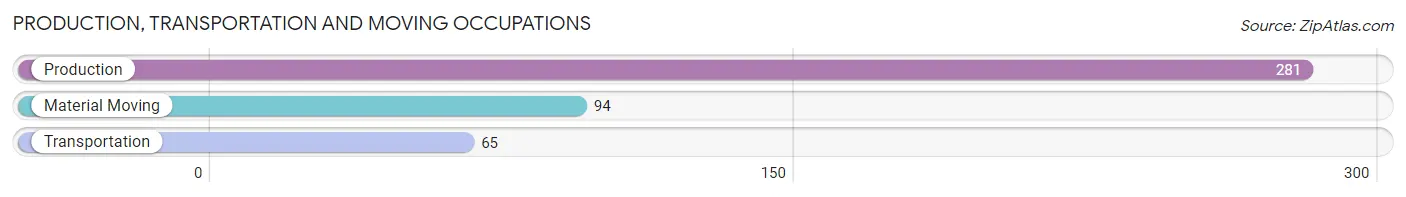
Production, Transportation and Moving Occupations by Sex
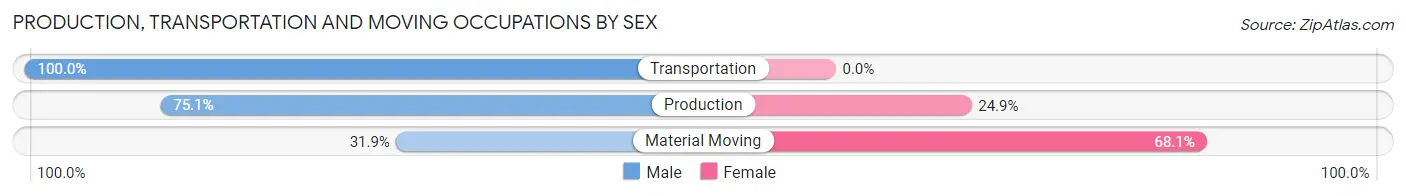
| Occupation | Male | Female |
| Production | 211 (75.1%) | 70 (24.9%) |
| Transportation | 65 (100.0%) | 0 (0.0%) |
| Material Moving | 30 (31.9%) | 64 (68.1%) |
| Total (Category) | 306 (69.6%) | 134 (30.4%) |
| Total (Overall) | 877 (42.8%) | 1,172 (57.2%) |
Employment Industries by Sex in Sullivan
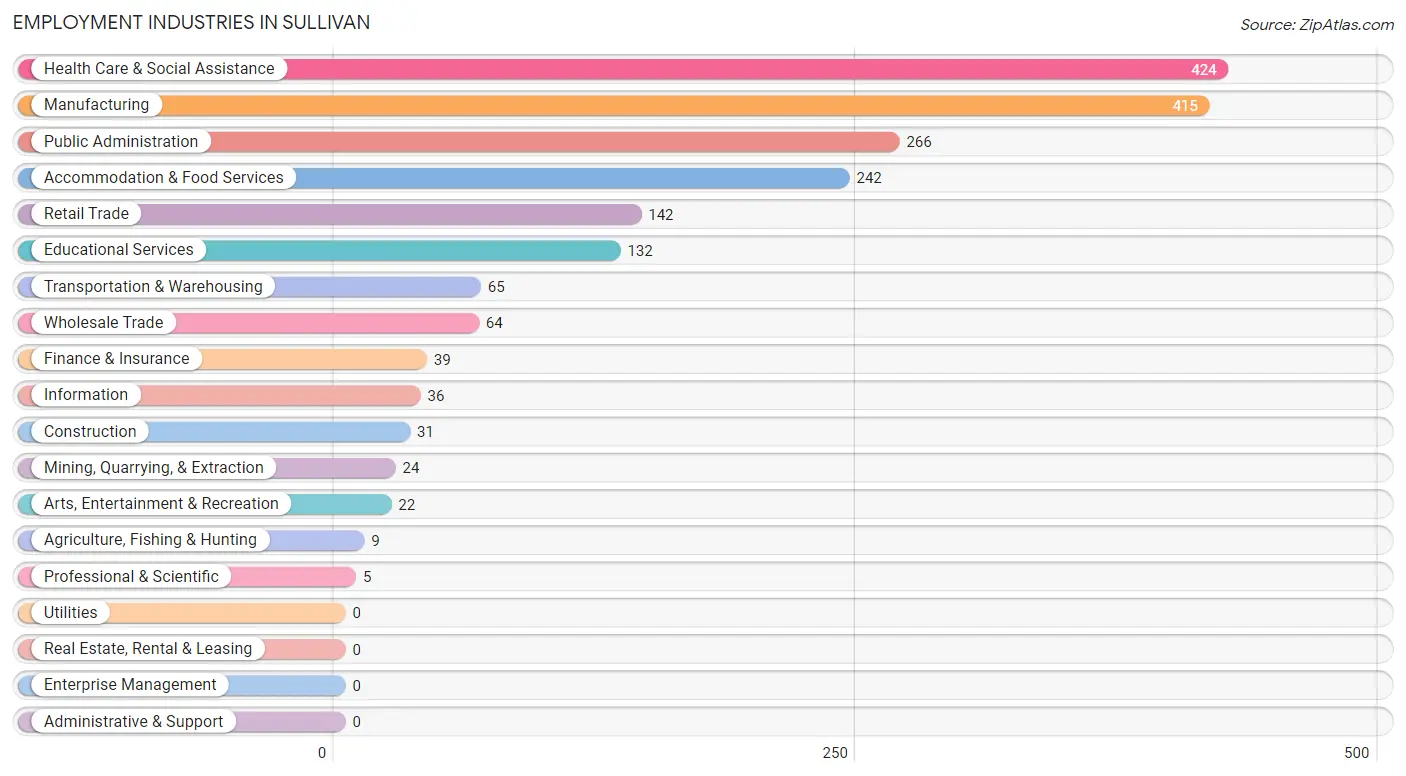
Employment Industries in Sullivan
The major employment industries in Sullivan include Health Care & Social Assistance (424 | 20.7%), Manufacturing (415 | 20.3%), Public Administration (266 | 13.0%), Accommodation & Food Services (242 | 11.8%), and Retail Trade (142 | 6.9%).
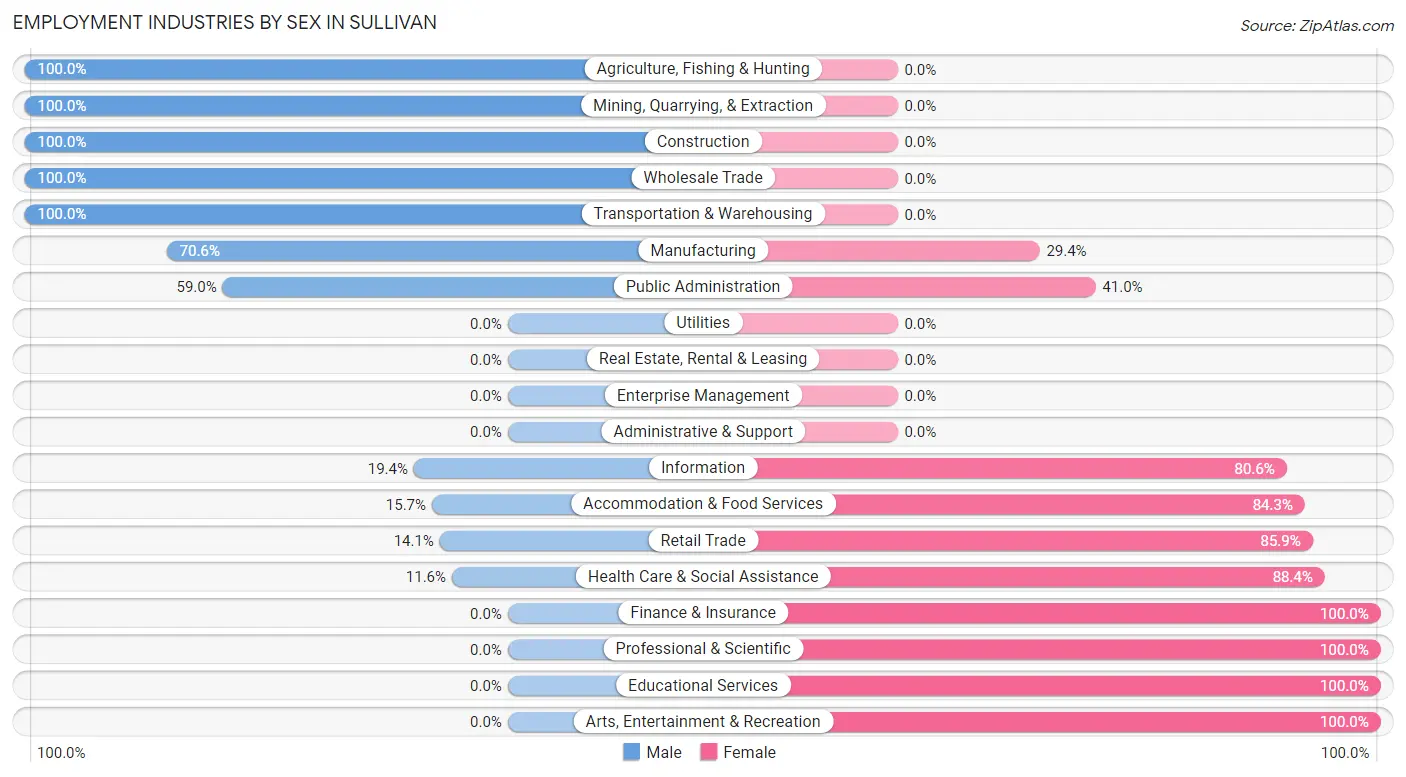
Employment Industries by Sex in Sullivan
The Sullivan industries that see more men than women are Agriculture, Fishing & Hunting (100.0%), Mining, Quarrying, & Extraction (100.0%), and Construction (100.0%), whereas the industries that tend to have a higher number of women are Finance & Insurance (100.0%), Professional & Scientific (100.0%), and Educational Services (100.0%).
| Industry | Male | Female |
| Agriculture, Fishing & Hunting | 9 (100.0%) | 0 (0.0%) |
| Mining, Quarrying, & Extraction | 24 (100.0%) | 0 (0.0%) |
| Construction | 31 (100.0%) | 0 (0.0%) |
| Manufacturing | 293 (70.6%) | 122 (29.4%) |
| Wholesale Trade | 64 (100.0%) | 0 (0.0%) |
| Retail Trade | 20 (14.1%) | 122 (85.9%) |
| Transportation & Warehousing | 65 (100.0%) | 0 (0.0%) |
| Utilities | 0 (0.0%) | 0 (0.0%) |
| Information | 7 (19.4%) | 29 (80.6%) |
| Finance & Insurance | 0 (0.0%) | 39 (100.0%) |
| Real Estate, Rental & Leasing | 0 (0.0%) | 0 (0.0%) |
| Professional & Scientific | 0 (0.0%) | 5 (100.0%) |
| Enterprise Management | 0 (0.0%) | 0 (0.0%) |
| Administrative & Support | 0 (0.0%) | 0 (0.0%) |
| Educational Services | 0 (0.0%) | 132 (100.0%) |
| Health Care & Social Assistance | 49 (11.6%) | 375 (88.4%) |
| Arts, Entertainment & Recreation | 0 (0.0%) | 22 (100.0%) |
| Accommodation & Food Services | 38 (15.7%) | 204 (84.3%) |
| Public Administration | 157 (59.0%) | 109 (41.0%) |
| Total | 877 (42.8%) | 1,172 (57.2%) |
Education in Sullivan
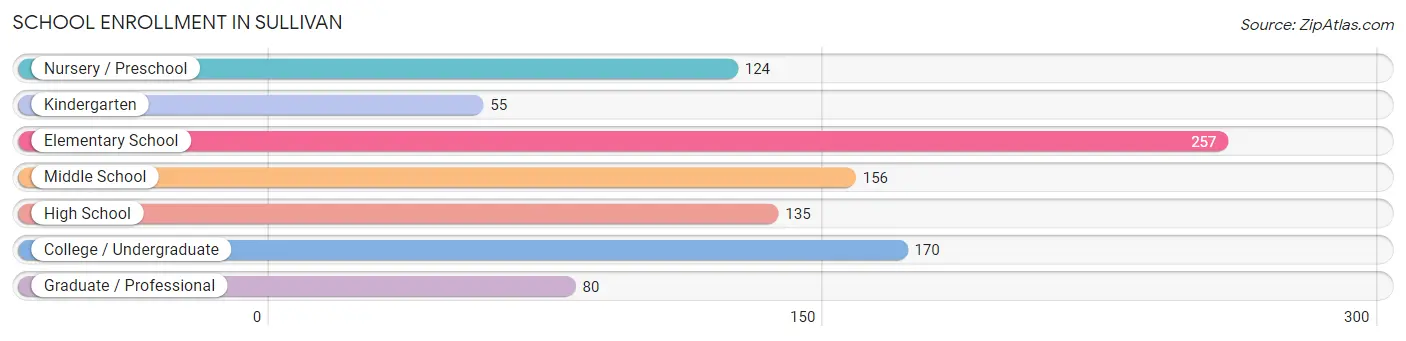
School Enrollment in Sullivan
The most common levels of schooling among the 977 students in Sullivan are elementary school (257 | 26.3%), college / undergraduate (170 | 17.4%), and middle school (156 | 16.0%).
| School Level | # Students | % Students |
| Nursery / Preschool | 124 | 12.7% |
| Kindergarten | 55 | 5.6% |
| Elementary School | 257 | 26.3% |
| Middle School | 156 | 16.0% |
| High School | 135 | 13.8% |
| College / Undergraduate | 170 | 17.4% |
| Graduate / Professional | 80 | 8.2% |
| Total | 977 | 100.0% |
School Enrollment by Age by Funding Source in Sullivan
Out of a total of 977 students who are enrolled in schools in Sullivan, 32 (3.3%) attend a private institution, while the remaining 945 (96.7%) are enrolled in public schools. The age group of 10 to 14 year olds has the highest likelihood of being enrolled in private schools, with 26 (14.9% in the age bracket) enrolled. Conversely, the age group of 3 to 4 year olds has the lowest likelihood of being enrolled in a private school, with 77 (100.0% in the age bracket) attending a public institution.
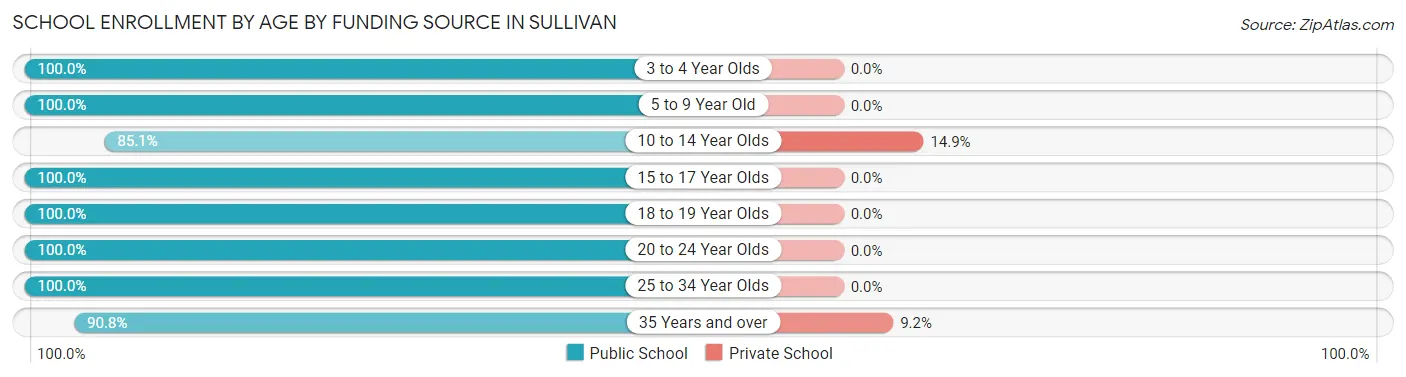
| Age Bracket | Public School | Private School |
| 3 to 4 Year Olds | 77 (100.0%) | 0 (0.0%) |
| 5 to 9 Year Old | 340 (100.0%) | 0 (0.0%) |
| 10 to 14 Year Olds | 149 (85.1%) | 26 (14.9%) |
| 15 to 17 Year Olds | 155 (100.0%) | 0 (0.0%) |
| 18 to 19 Year Olds | 38 (100.0%) | 0 (0.0%) |
| 20 to 24 Year Olds | 21 (100.0%) | 0 (0.0%) |
| 25 to 34 Year Olds | 106 (100.0%) | 0 (0.0%) |
| 35 Years and over | 59 (90.8%) | 6 (9.2%) |
| Total | 945 (96.7%) | 32 (3.3%) |
Educational Attainment by Field of Study in Sullivan
Science & technology (99 | 30.3%), psychology (71 | 21.7%), business (39 | 11.9%), education (39 | 11.9%), and liberal arts & history (37 | 11.3%) are the most common fields of study among 327 individuals in Sullivan who have obtained a bachelor's degree or higher.
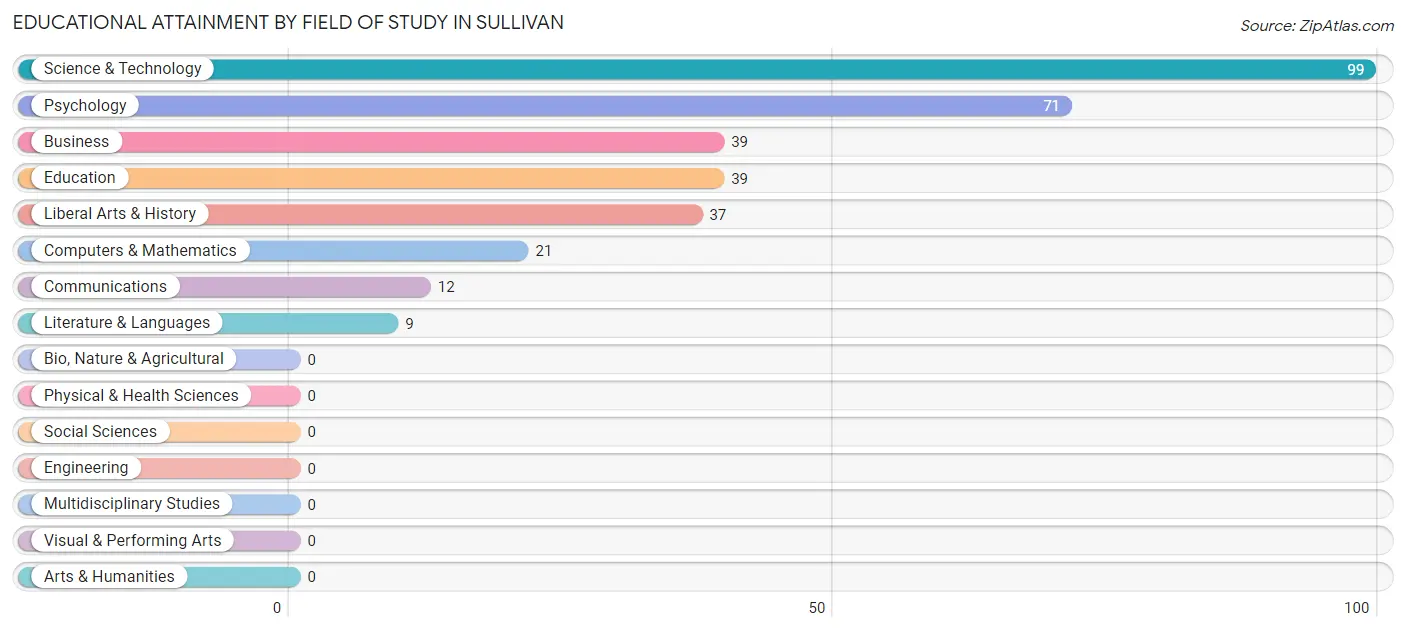
| Field of Study | # Graduates | % Graduates |
| Computers & Mathematics | 21 | 6.4% |
| Bio, Nature & Agricultural | 0 | 0.0% |
| Physical & Health Sciences | 0 | 0.0% |
| Psychology | 71 | 21.7% |
| Social Sciences | 0 | 0.0% |
| Engineering | 0 | 0.0% |
| Multidisciplinary Studies | 0 | 0.0% |
| Science & Technology | 99 | 30.3% |
| Business | 39 | 11.9% |
| Education | 39 | 11.9% |
| Literature & Languages | 9 | 2.8% |
| Liberal Arts & History | 37 | 11.3% |
| Visual & Performing Arts | 0 | 0.0% |
| Communications | 12 | 3.7% |
| Arts & Humanities | 0 | 0.0% |
| Total | 327 | 100.0% |
Transportation & Commute in Sullivan
Vehicle Availability by Sex in Sullivan
The most prevalent vehicle ownership categories in Sullivan are males with 2 vehicles (484, accounting for 55.2%) and females with 2 vehicles (377, making up 43.4%).
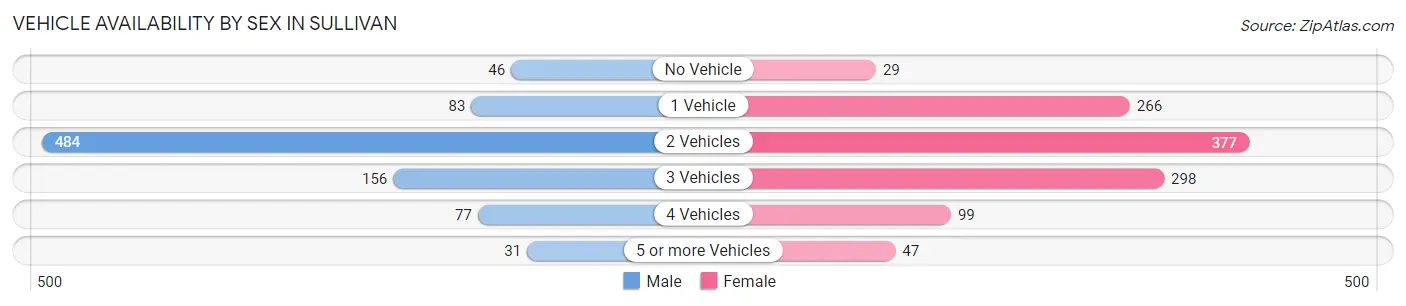
| Vehicles Available | Male | Female |
| No Vehicle | 46 (5.2%) | 29 (2.6%) |
| 1 Vehicle | 83 (9.5%) | 266 (23.8%) |
| 2 Vehicles | 484 (55.2%) | 377 (33.8%) |
| 3 Vehicles | 156 (17.8%) | 298 (26.7%) |
| 4 Vehicles | 77 (8.8%) | 99 (8.9%) |
| 5 or more Vehicles | 31 (3.5%) | 47 (4.2%) |
| Total | 877 (100.0%) | 1,116 (100.0%) |
Commute Time in Sullivan
The most frequently occuring commute durations in Sullivan are 5 to 9 minutes (661 commuters, 34.6%), 15 to 19 minutes (236 commuters, 12.3%), and 45 to 59 minutes (232 commuters, 12.1%).
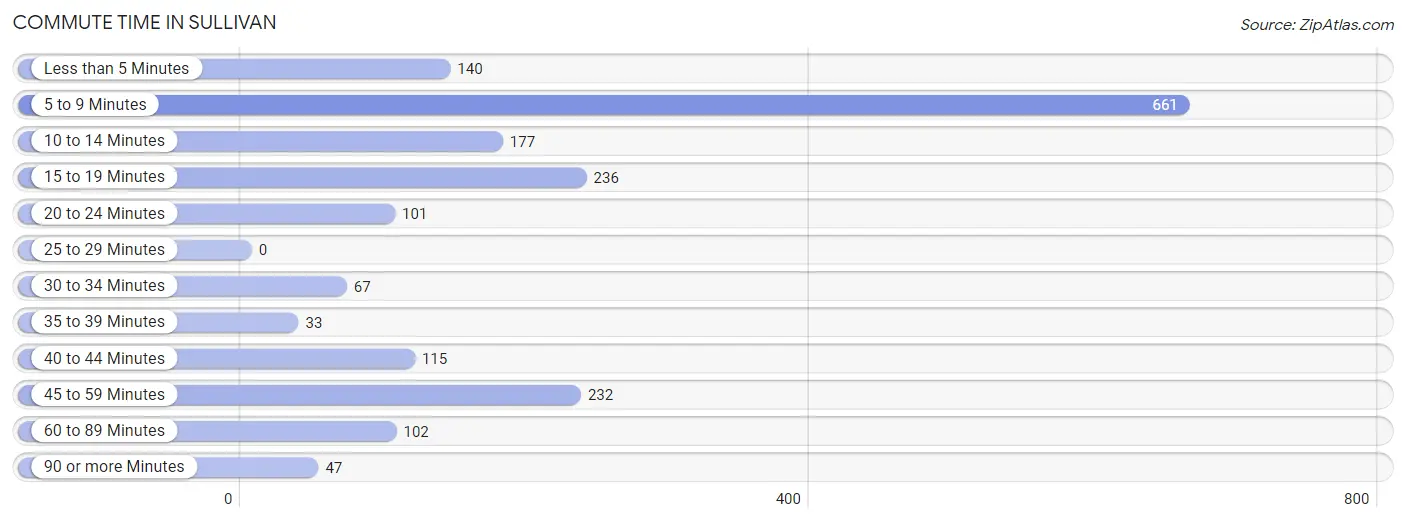
| Commute Time | # Commuters | % Commuters |
| Less than 5 Minutes | 140 | 7.3% |
| 5 to 9 Minutes | 661 | 34.6% |
| 10 to 14 Minutes | 177 | 9.3% |
| 15 to 19 Minutes | 236 | 12.3% |
| 20 to 24 Minutes | 101 | 5.3% |
| 25 to 29 Minutes | 0 | 0.0% |
| 30 to 34 Minutes | 67 | 3.5% |
| 35 to 39 Minutes | 33 | 1.7% |
| 40 to 44 Minutes | 115 | 6.0% |
| 45 to 59 Minutes | 232 | 12.1% |
| 60 to 89 Minutes | 102 | 5.3% |
| 90 or more Minutes | 47 | 2.5% |
Commute Time by Sex in Sullivan
The most common commute times in Sullivan are 5 to 9 minutes (212 commuters, 26.2%) for males and 5 to 9 minutes (449 commuters, 40.7%) for females.
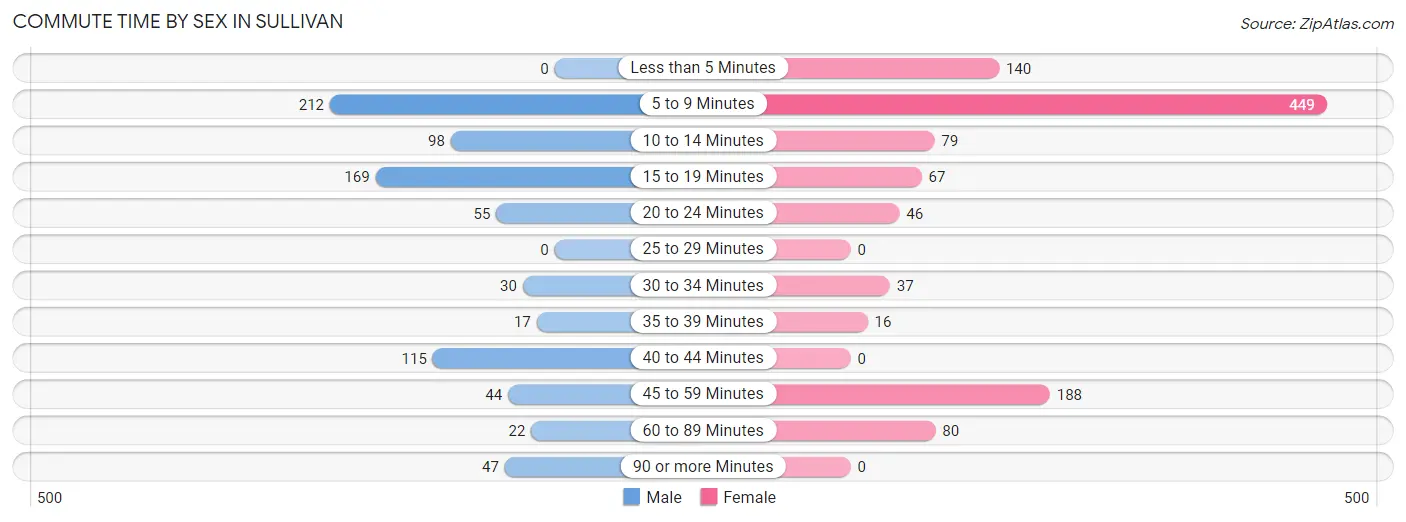
| Commute Time | Male | Female |
| Less than 5 Minutes | 0 (0.0%) | 140 (12.7%) |
| 5 to 9 Minutes | 212 (26.2%) | 449 (40.7%) |
| 10 to 14 Minutes | 98 (12.1%) | 79 (7.2%) |
| 15 to 19 Minutes | 169 (20.9%) | 67 (6.1%) |
| 20 to 24 Minutes | 55 (6.8%) | 46 (4.2%) |
| 25 to 29 Minutes | 0 (0.0%) | 0 (0.0%) |
| 30 to 34 Minutes | 30 (3.7%) | 37 (3.4%) |
| 35 to 39 Minutes | 17 (2.1%) | 16 (1.5%) |
| 40 to 44 Minutes | 115 (14.2%) | 0 (0.0%) |
| 45 to 59 Minutes | 44 (5.4%) | 188 (17.1%) |
| 60 to 89 Minutes | 22 (2.7%) | 80 (7.3%) |
| 90 or more Minutes | 47 (5.8%) | 0 (0.0%) |
Time of Departure to Work by Sex in Sullivan
The most frequent times of departure to work in Sullivan are 12:00 AM to 4:59 AM (252, 31.1%) for males and 8:00 AM to 8:29 AM (177, 16.1%) for females.
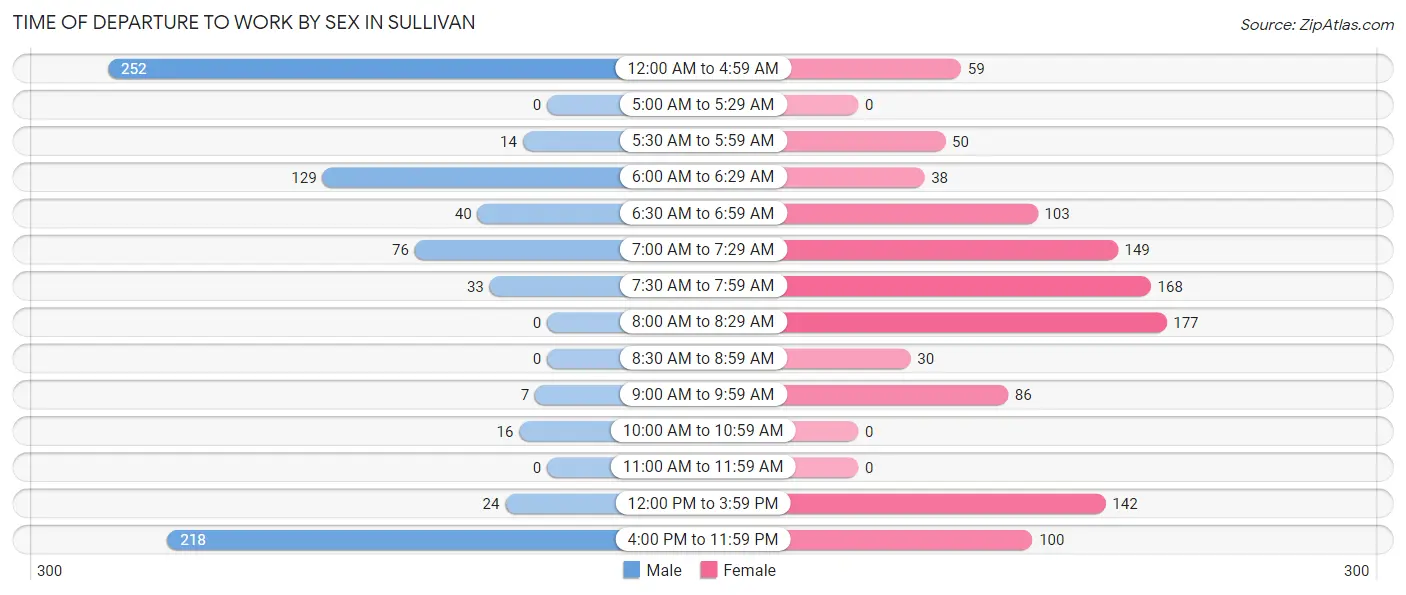
| Time of Departure | Male | Female |
| 12:00 AM to 4:59 AM | 252 (31.1%) | 59 (5.3%) |
| 5:00 AM to 5:29 AM | 0 (0.0%) | 0 (0.0%) |
| 5:30 AM to 5:59 AM | 14 (1.7%) | 50 (4.5%) |
| 6:00 AM to 6:29 AM | 129 (16.0%) | 38 (3.5%) |
| 6:30 AM to 6:59 AM | 40 (4.9%) | 103 (9.3%) |
| 7:00 AM to 7:29 AM | 76 (9.4%) | 149 (13.5%) |
| 7:30 AM to 7:59 AM | 33 (4.1%) | 168 (15.2%) |
| 8:00 AM to 8:29 AM | 0 (0.0%) | 177 (16.1%) |
| 8:30 AM to 8:59 AM | 0 (0.0%) | 30 (2.7%) |
| 9:00 AM to 9:59 AM | 7 (0.9%) | 86 (7.8%) |
| 10:00 AM to 10:59 AM | 16 (2.0%) | 0 (0.0%) |
| 11:00 AM to 11:59 AM | 0 (0.0%) | 0 (0.0%) |
| 12:00 PM to 3:59 PM | 24 (3.0%) | 142 (12.9%) |
| 4:00 PM to 11:59 PM | 218 (27.0%) | 100 (9.1%) |
| Total | 809 (100.0%) | 1,102 (100.0%) |
Housing Occupancy in Sullivan
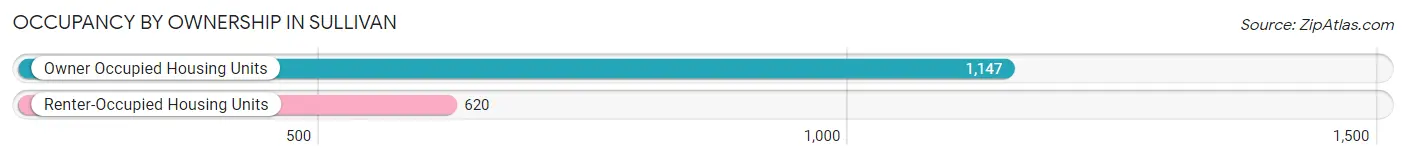
Occupancy by Ownership in Sullivan
Of the total 1,767 dwellings in Sullivan, owner-occupied units account for 1,147 (64.9%), while renter-occupied units make up 620 (35.1%).
| Occupancy | # Housing Units | % Housing Units |
| Owner Occupied Housing Units | 1,147 | 64.9% |
| Renter-Occupied Housing Units | 620 | 35.1% |
| Total Occupied Housing Units | 1,767 | 100.0% |
Occupancy by Household Size in Sullivan
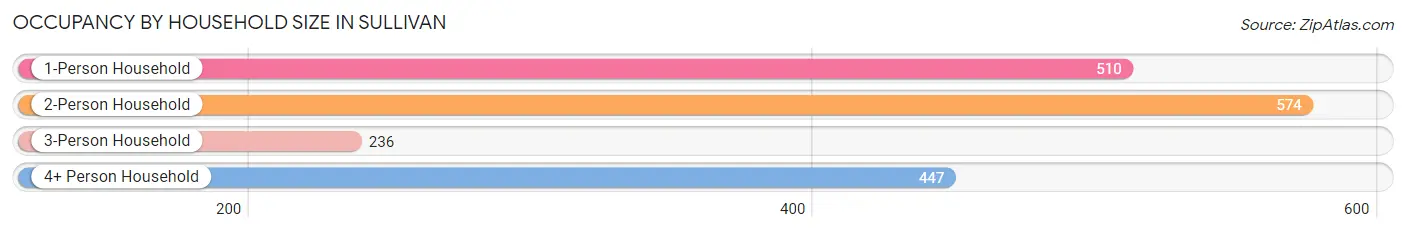
| Household Size | # Housing Units | % Housing Units |
| 1-Person Household | 510 | 28.9% |
| 2-Person Household | 574 | 32.5% |
| 3-Person Household | 236 | 13.4% |
| 4+ Person Household | 447 | 25.3% |
| Total Housing Units | 1,767 | 100.0% |
Occupancy by Ownership by Household Size in Sullivan
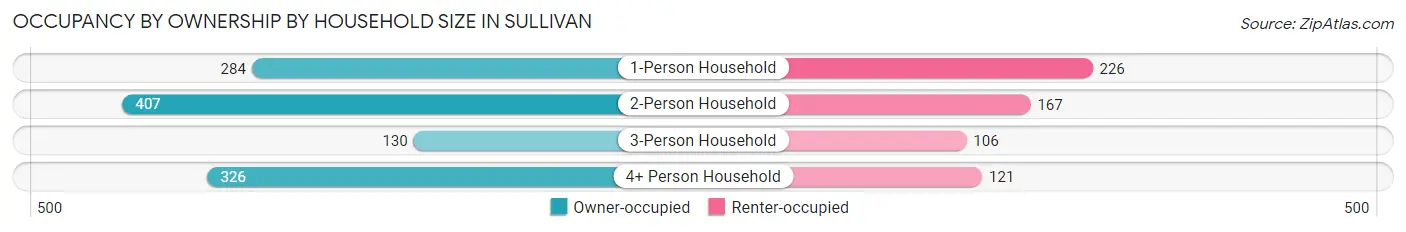
| Household Size | Owner-occupied | Renter-occupied |
| 1-Person Household | 284 (55.7%) | 226 (44.3%) |
| 2-Person Household | 407 (70.9%) | 167 (29.1%) |
| 3-Person Household | 130 (55.1%) | 106 (44.9%) |
| 4+ Person Household | 326 (72.9%) | 121 (27.1%) |
| Total Housing Units | 1,147 (64.9%) | 620 (35.1%) |
Occupancy by Educational Attainment in Sullivan
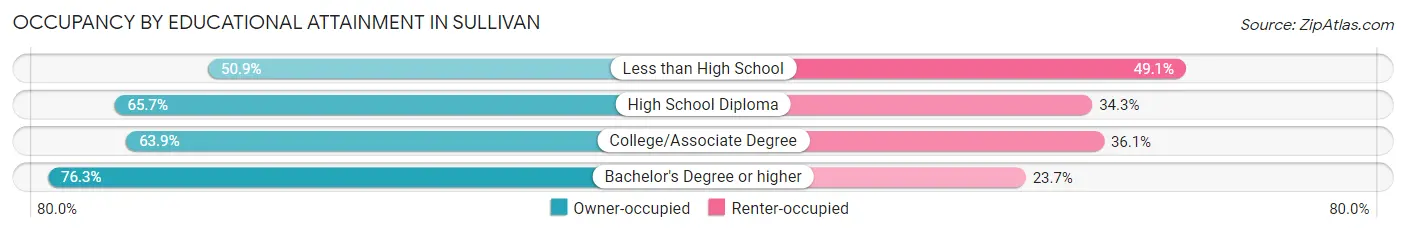
| Household Size | Owner-occupied | Renter-occupied |
| Less than High School | 58 (50.9%) | 56 (49.1%) |
| High School Diploma | 491 (65.7%) | 256 (34.3%) |
| College/Associate Degree | 479 (63.9%) | 271 (36.1%) |
| Bachelor's Degree or higher | 119 (76.3%) | 37 (23.7%) |
Occupancy by Age of Householder in Sullivan
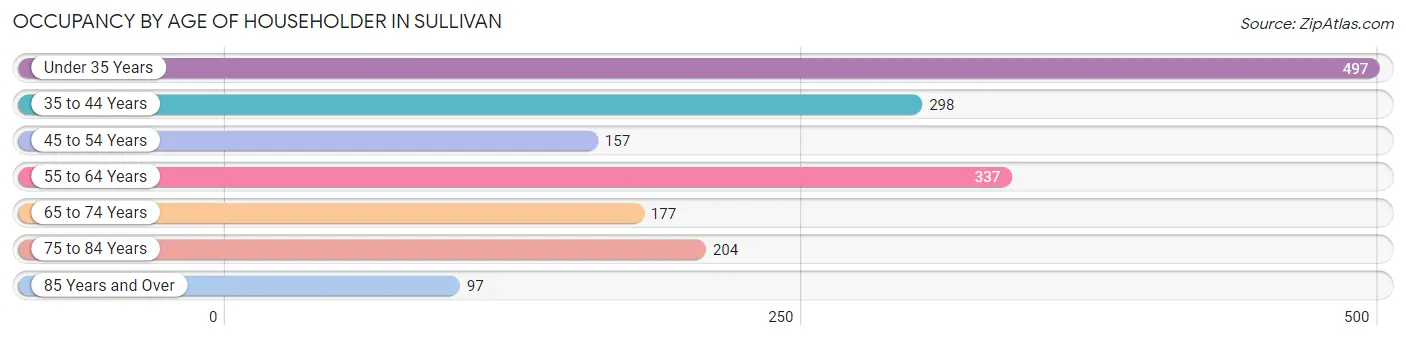
| Age Bracket | # Households | % Households |
| Under 35 Years | 497 | 28.1% |
| 35 to 44 Years | 298 | 16.9% |
| 45 to 54 Years | 157 | 8.9% |
| 55 to 64 Years | 337 | 19.1% |
| 65 to 74 Years | 177 | 10.0% |
| 75 to 84 Years | 204 | 11.5% |
| 85 Years and Over | 97 | 5.5% |
| Total | 1,767 | 100.0% |
Housing Finances in Sullivan
Median Income by Occupancy in Sullivan
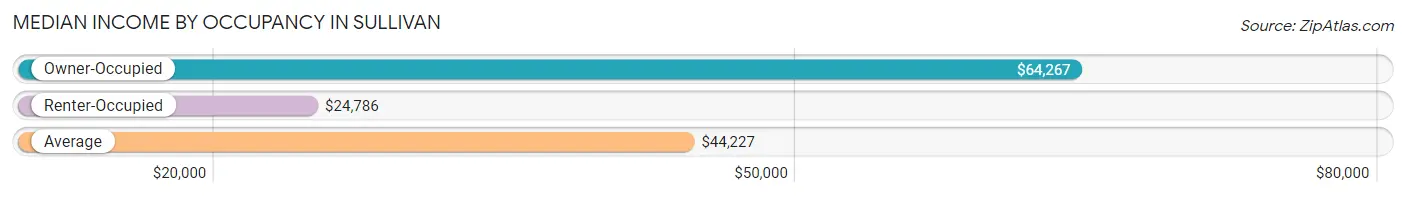
| Occupancy Type | # Households | Median Income |
| Owner-Occupied | 1,147 (64.9%) | $64,267 |
| Renter-Occupied | 620 (35.1%) | $24,786 |
| Average | 1,767 (100.0%) | $44,227 |
Occupancy by Householder Income Bracket in Sullivan
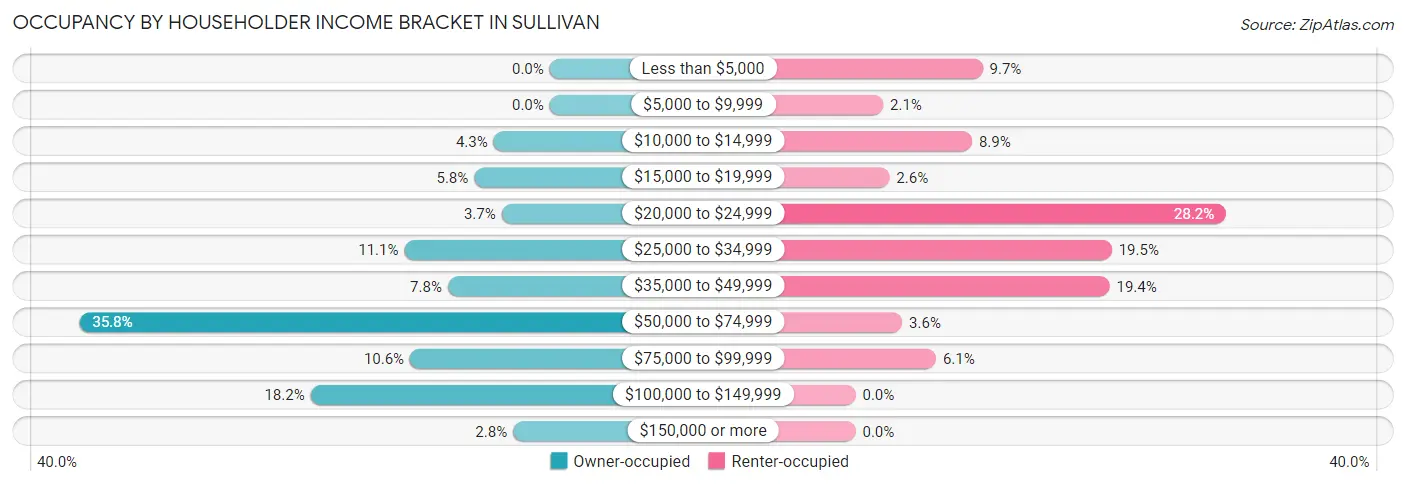
| Income Bracket | Owner-occupied | Renter-occupied |
| Less than $5,000 | 0 (0.0%) | 60 (9.7%) |
| $5,000 to $9,999 | 0 (0.0%) | 13 (2.1%) |
| $10,000 to $14,999 | 49 (4.3%) | 55 (8.9%) |
| $15,000 to $19,999 | 66 (5.8%) | 16 (2.6%) |
| $20,000 to $24,999 | 42 (3.7%) | 175 (28.2%) |
| $25,000 to $34,999 | 127 (11.1%) | 121 (19.5%) |
| $35,000 to $49,999 | 89 (7.8%) | 120 (19.4%) |
| $50,000 to $74,999 | 411 (35.8%) | 22 (3.5%) |
| $75,000 to $99,999 | 122 (10.6%) | 38 (6.1%) |
| $100,000 to $149,999 | 209 (18.2%) | 0 (0.0%) |
| $150,000 or more | 32 (2.8%) | 0 (0.0%) |
| Total | 1,147 (100.0%) | 620 (100.0%) |
Monthly Housing Cost Tiers in Sullivan
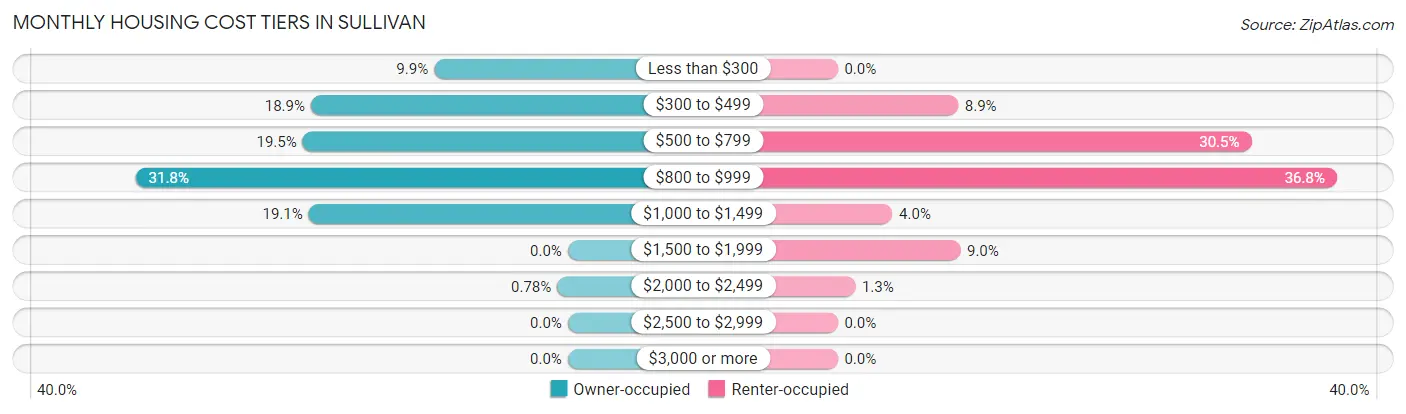
| Monthly Cost | Owner-occupied | Renter-occupied |
| Less than $300 | 113 (9.9%) | 0 (0.0%) |
| $300 to $499 | 217 (18.9%) | 55 (8.9%) |
| $500 to $799 | 224 (19.5%) | 189 (30.5%) |
| $800 to $999 | 365 (31.8%) | 228 (36.8%) |
| $1,000 to $1,499 | 219 (19.1%) | 25 (4.0%) |
| $1,500 to $1,999 | 0 (0.0%) | 56 (9.0%) |
| $2,000 to $2,499 | 9 (0.8%) | 8 (1.3%) |
| $2,500 to $2,999 | 0 (0.0%) | 0 (0.0%) |
| $3,000 or more | 0 (0.0%) | 0 (0.0%) |
| Total | 1,147 (100.0%) | 620 (100.0%) |
Physical Housing Characteristics in Sullivan
Housing Structures in Sullivan
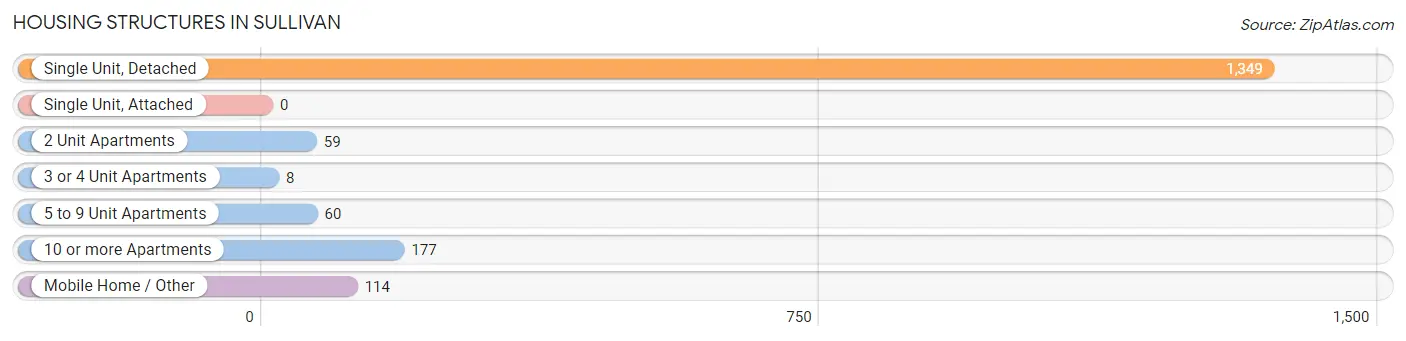
| Structure Type | # Housing Units | % Housing Units |
| Single Unit, Detached | 1,349 | 76.3% |
| Single Unit, Attached | 0 | 0.0% |
| 2 Unit Apartments | 59 | 3.3% |
| 3 or 4 Unit Apartments | 8 | 0.4% |
| 5 to 9 Unit Apartments | 60 | 3.4% |
| 10 or more Apartments | 177 | 10.0% |
| Mobile Home / Other | 114 | 6.5% |
| Total | 1,767 | 100.0% |
Housing Structures by Occupancy in Sullivan
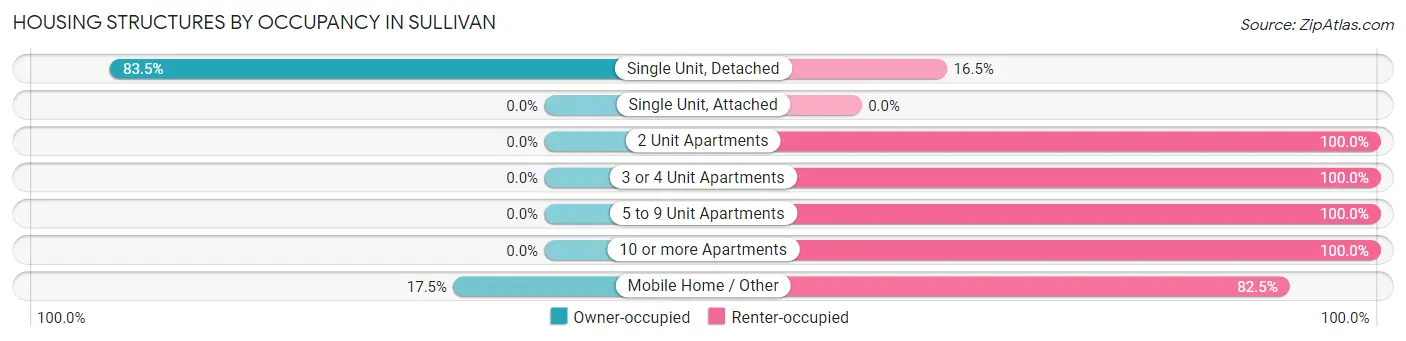
| Structure Type | Owner-occupied | Renter-occupied |
| Single Unit, Detached | 1,127 (83.5%) | 222 (16.5%) |
| Single Unit, Attached | 0 (0.0%) | 0 (0.0%) |
| 2 Unit Apartments | 0 (0.0%) | 59 (100.0%) |
| 3 or 4 Unit Apartments | 0 (0.0%) | 8 (100.0%) |
| 5 to 9 Unit Apartments | 0 (0.0%) | 60 (100.0%) |
| 10 or more Apartments | 0 (0.0%) | 177 (100.0%) |
| Mobile Home / Other | 20 (17.5%) | 94 (82.5%) |
| Total | 1,147 (64.9%) | 620 (35.1%) |
Housing Structures by Number of Rooms in Sullivan
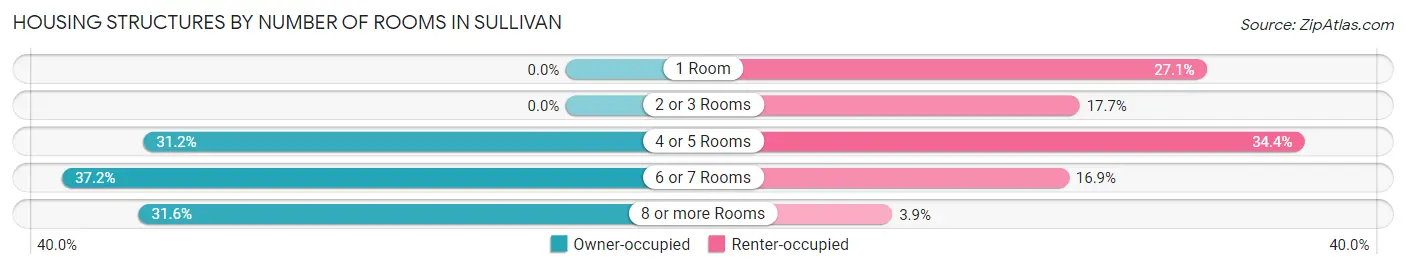
| Number of Rooms | Owner-occupied | Renter-occupied |
| 1 Room | 0 (0.0%) | 168 (27.1%) |
| 2 or 3 Rooms | 0 (0.0%) | 110 (17.7%) |
| 4 or 5 Rooms | 358 (31.2%) | 213 (34.4%) |
| 6 or 7 Rooms | 427 (37.2%) | 105 (16.9%) |
| 8 or more Rooms | 362 (31.6%) | 24 (3.9%) |
| Total | 1,147 (100.0%) | 620 (100.0%) |
Housing Structure by Heating Type in Sullivan
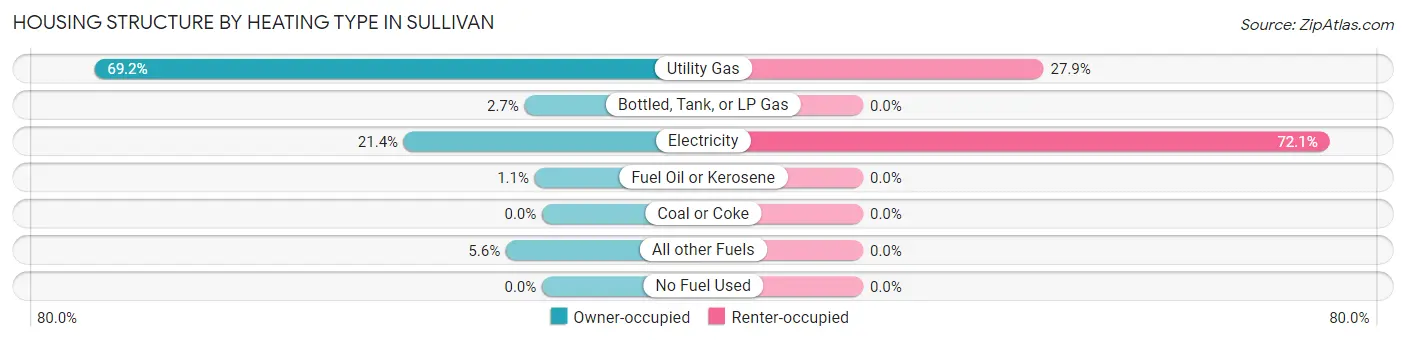
| Heating Type | Owner-occupied | Renter-occupied |
| Utility Gas | 794 (69.2%) | 173 (27.9%) |
| Bottled, Tank, or LP Gas | 31 (2.7%) | 0 (0.0%) |
| Electricity | 245 (21.4%) | 447 (72.1%) |
| Fuel Oil or Kerosene | 13 (1.1%) | 0 (0.0%) |
| Coal or Coke | 0 (0.0%) | 0 (0.0%) |
| All other Fuels | 64 (5.6%) | 0 (0.0%) |
| No Fuel Used | 0 (0.0%) | 0 (0.0%) |
| Total | 1,147 (100.0%) | 620 (100.0%) |
Household Vehicle Usage in Sullivan
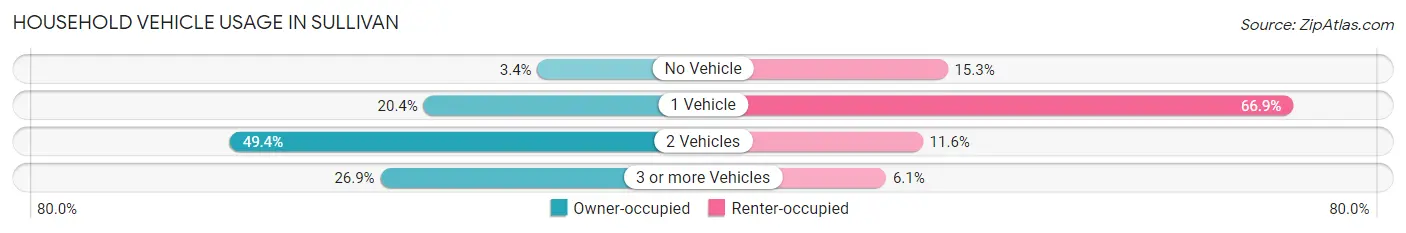
| Vehicles per Household | Owner-occupied | Renter-occupied |
| No Vehicle | 39 (3.4%) | 95 (15.3%) |
| 1 Vehicle | 234 (20.4%) | 415 (66.9%) |
| 2 Vehicles | 566 (49.3%) | 72 (11.6%) |
| 3 or more Vehicles | 308 (26.9%) | 38 (6.1%) |
| Total | 1,147 (100.0%) | 620 (100.0%) |
Real Estate & Mortgages in Sullivan
Real Estate and Mortgage Overview in Sullivan
| Characteristic | Without Mortgage | With Mortgage |
| Housing Units | 409 | 738 |
| Median Property Value | $81,600 | $96,100 |
| Median Household Income | $50,488 | $18 |
| Monthly Housing Costs | $407 | $0 |
| Real Estate Taxes | $801 | $46 |
Property Value by Mortgage Status in Sullivan
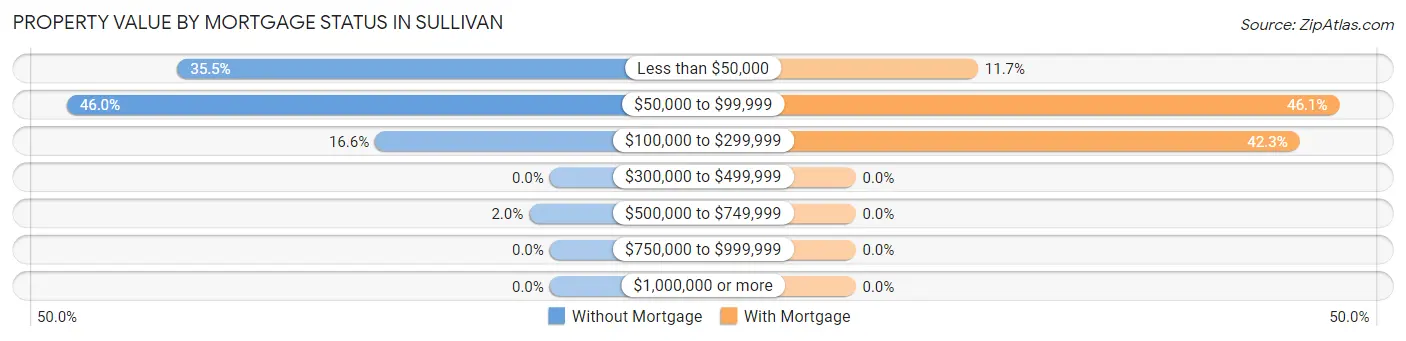
| Property Value | Without Mortgage | With Mortgage |
| Less than $50,000 | 145 (35.4%) | 86 (11.7%) |
| $50,000 to $99,999 | 188 (46.0%) | 340 (46.1%) |
| $100,000 to $299,999 | 68 (16.6%) | 312 (42.3%) |
| $300,000 to $499,999 | 0 (0.0%) | 0 (0.0%) |
| $500,000 to $749,999 | 8 (2.0%) | 0 (0.0%) |
| $750,000 to $999,999 | 0 (0.0%) | 0 (0.0%) |
| $1,000,000 or more | 0 (0.0%) | 0 (0.0%) |
| Total | 409 (100.0%) | 738 (100.0%) |
Household Income by Mortgage Status in Sullivan
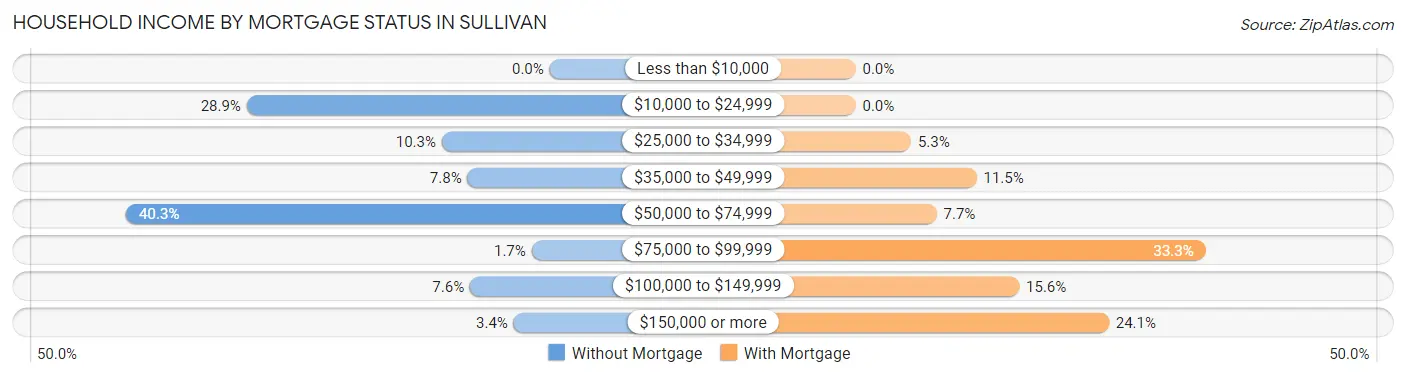
| Household Income | Without Mortgage | With Mortgage |
| Less than $10,000 | 0 (0.0%) | 0 (0.0%) |
| $10,000 to $24,999 | 118 (28.8%) | 0 (0.0%) |
| $25,000 to $34,999 | 42 (10.3%) | 39 (5.3%) |
| $35,000 to $49,999 | 32 (7.8%) | 85 (11.5%) |
| $50,000 to $74,999 | 165 (40.3%) | 57 (7.7%) |
| $75,000 to $99,999 | 7 (1.7%) | 246 (33.3%) |
| $100,000 to $149,999 | 31 (7.6%) | 115 (15.6%) |
| $150,000 or more | 14 (3.4%) | 178 (24.1%) |
| Total | 409 (100.0%) | 738 (100.0%) |
Property Value to Household Income Ratio in Sullivan
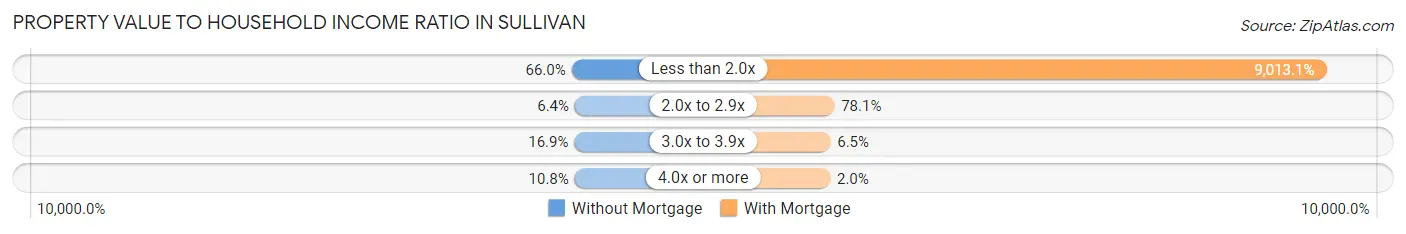
| Value-to-Income Ratio | Without Mortgage | With Mortgage |
| Less than 2.0x | 270 (66.0%) | 66,517 (9,013.1%) |
| 2.0x to 2.9x | 26 (6.4%) | 576 (78.0%) |
| 3.0x to 3.9x | 69 (16.9%) | 48 (6.5%) |
| 4.0x or more | 44 (10.8%) | 15 (2.0%) |
| Total | 409 (100.0%) | 738 (100.0%) |
Real Estate Taxes by Mortgage Status in Sullivan
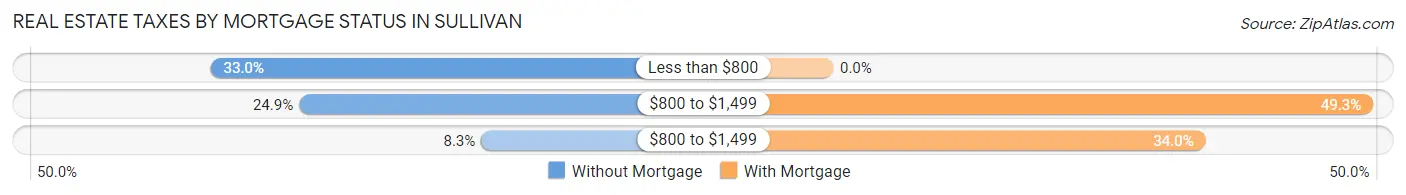
| Property Taxes | Without Mortgage | With Mortgage |
| Less than $800 | 135 (33.0%) | 0 (0.0%) |
| $800 to $1,499 | 102 (24.9%) | 364 (49.3%) |
| $800 to $1,499 | 34 (8.3%) | 251 (34.0%) |
| Total | 409 (100.0%) | 738 (100.0%) |
Health & Disability in Sullivan
Health Insurance Coverage by Age in Sullivan
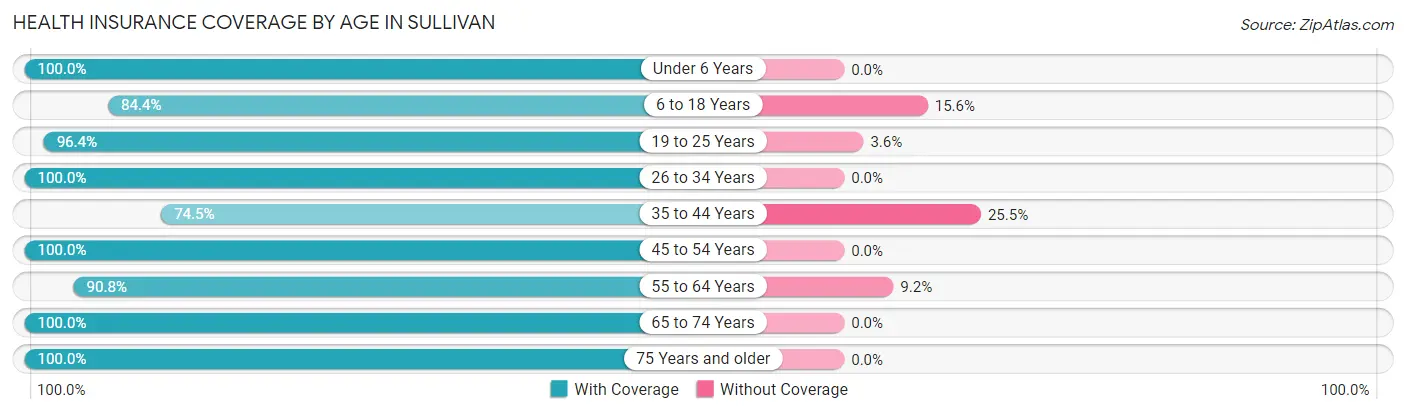
| Age Bracket | With Coverage | Without Coverage |
| Under 6 Years | 496 (100.0%) | 0 (0.0%) |
| 6 to 18 Years | 537 (84.4%) | 99 (15.6%) |
| 19 to 25 Years | 512 (96.4%) | 19 (3.6%) |
| 26 to 34 Years | 505 (100.0%) | 0 (0.0%) |
| 35 to 44 Years | 345 (74.5%) | 118 (25.5%) |
| 45 to 54 Years | 322 (100.0%) | 0 (0.0%) |
| 55 to 64 Years | 476 (90.8%) | 48 (9.2%) |
| 65 to 74 Years | 351 (100.0%) | 0 (0.0%) |
| 75 Years and older | 344 (100.0%) | 0 (0.0%) |
| Total | 3,888 (93.2%) | 284 (6.8%) |
Health Insurance Coverage by Citizenship Status in Sullivan
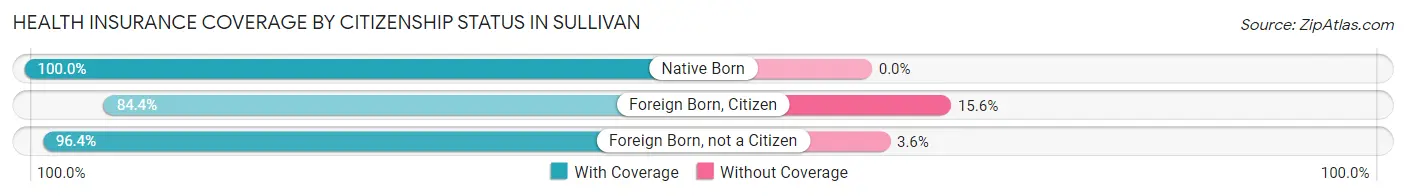
| Citizenship Status | With Coverage | Without Coverage |
| Native Born | 496 (100.0%) | 0 (0.0%) |
| Foreign Born, Citizen | 537 (84.4%) | 99 (15.6%) |
| Foreign Born, not a Citizen | 512 (96.4%) | 19 (3.6%) |
Health Insurance Coverage by Household Income in Sullivan
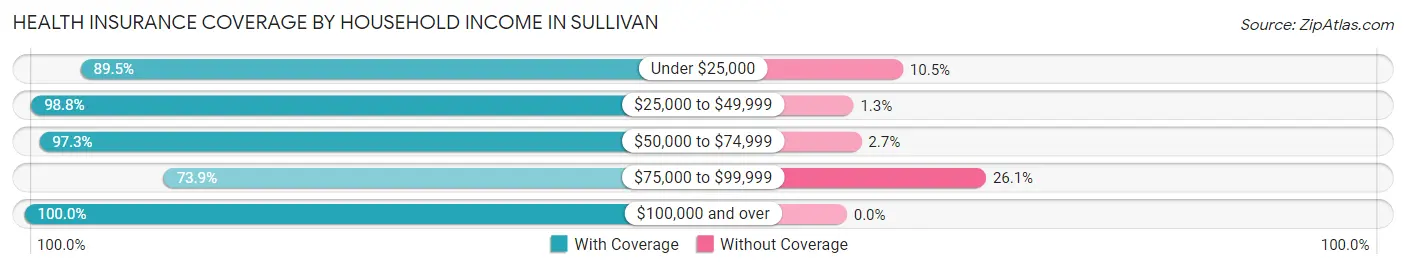
| Household Income | With Coverage | Without Coverage |
| Under $25,000 | 877 (89.5%) | 103 (10.5%) |
| $25,000 to $49,999 | 868 (98.8%) | 11 (1.3%) |
| $50,000 to $74,999 | 1,064 (97.3%) | 30 (2.7%) |
| $75,000 to $99,999 | 397 (73.9%) | 140 (26.1%) |
| $100,000 and over | 682 (100.0%) | 0 (0.0%) |
Public vs Private Health Insurance Coverage by Age in Sullivan
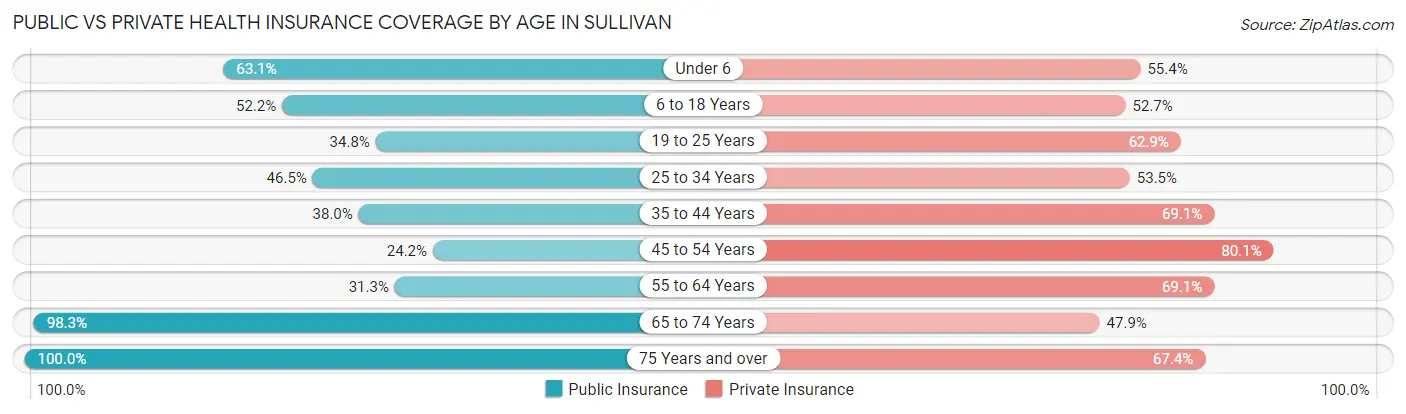
| Age Bracket | Public Insurance | Private Insurance |
| Under 6 | 313 (63.1%) | 275 (55.4%) |
| 6 to 18 Years | 332 (52.2%) | 335 (52.7%) |
| 19 to 25 Years | 185 (34.8%) | 334 (62.9%) |
| 25 to 34 Years | 235 (46.5%) | 270 (53.5%) |
| 35 to 44 Years | 176 (38.0%) | 320 (69.1%) |
| 45 to 54 Years | 78 (24.2%) | 258 (80.1%) |
| 55 to 64 Years | 164 (31.3%) | 362 (69.1%) |
| 65 to 74 Years | 345 (98.3%) | 168 (47.9%) |
| 75 Years and over | 344 (100.0%) | 232 (67.4%) |
| Total | 2,172 (52.1%) | 2,554 (61.2%) |
Disability Status by Sex by Age in Sullivan
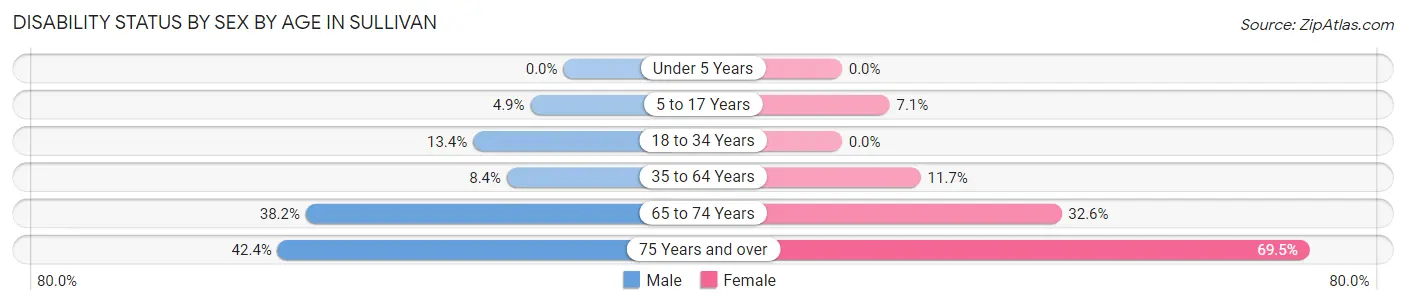
| Age Bracket | Male | Female |
| Under 5 Years | 0 (0.0%) | 0 (0.0%) |
| 5 to 17 Years | 19 (4.9%) | 20 (7.1%) |
| 18 to 34 Years | 57 (13.4%) | 0 (0.0%) |
| 35 to 64 Years | 51 (8.4%) | 82 (11.7%) |
| 65 to 74 Years | 65 (38.2%) | 59 (32.6%) |
| 75 Years and over | 14 (42.4%) | 216 (69.5%) |
Disability Class by Sex by Age in Sullivan
Disability Class: Hearing Difficulty
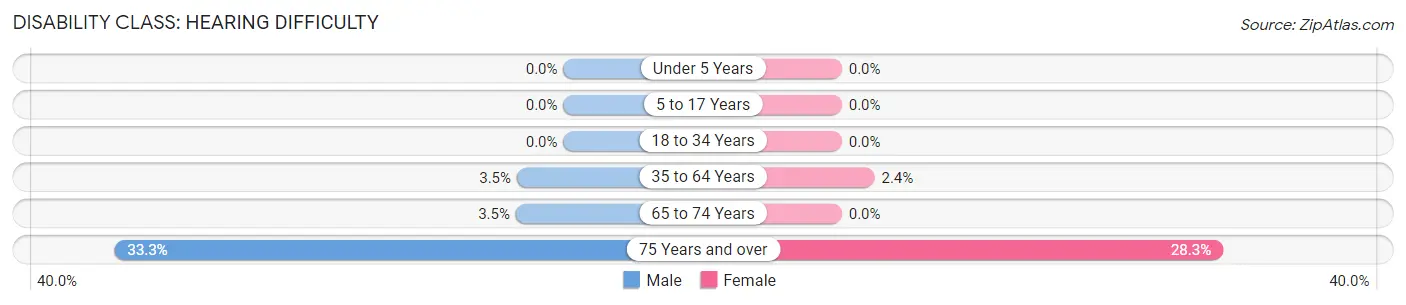
| Age Bracket | Male | Female |
| Under 5 Years | 0 (0.0%) | 0 (0.0%) |
| 5 to 17 Years | 0 (0.0%) | 0 (0.0%) |
| 18 to 34 Years | 0 (0.0%) | 0 (0.0%) |
| 35 to 64 Years | 21 (3.5%) | 17 (2.4%) |
| 65 to 74 Years | 6 (3.5%) | 0 (0.0%) |
| 75 Years and over | 11 (33.3%) | 88 (28.3%) |
Disability Class: Vision Difficulty
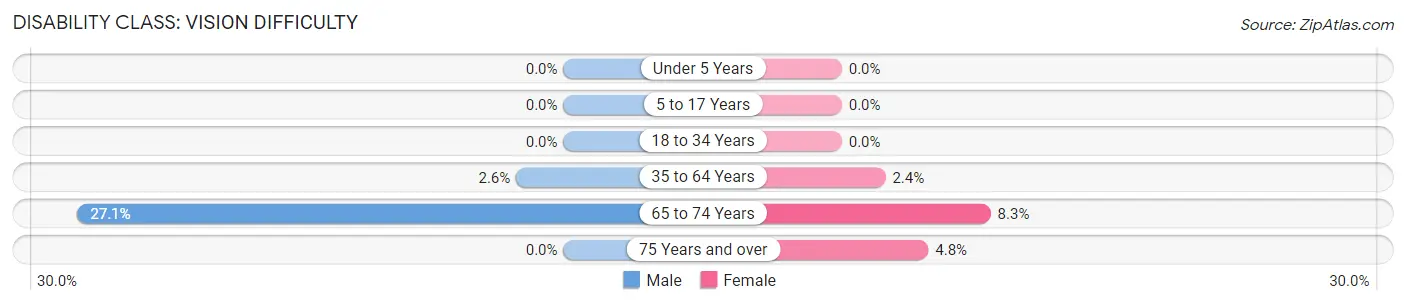
| Age Bracket | Male | Female |
| Under 5 Years | 0 (0.0%) | 0 (0.0%) |
| 5 to 17 Years | 0 (0.0%) | 0 (0.0%) |
| 18 to 34 Years | 0 (0.0%) | 0 (0.0%) |
| 35 to 64 Years | 16 (2.6%) | 17 (2.4%) |
| 65 to 74 Years | 46 (27.1%) | 15 (8.3%) |
| 75 Years and over | 0 (0.0%) | 15 (4.8%) |
Disability Class: Cognitive Difficulty
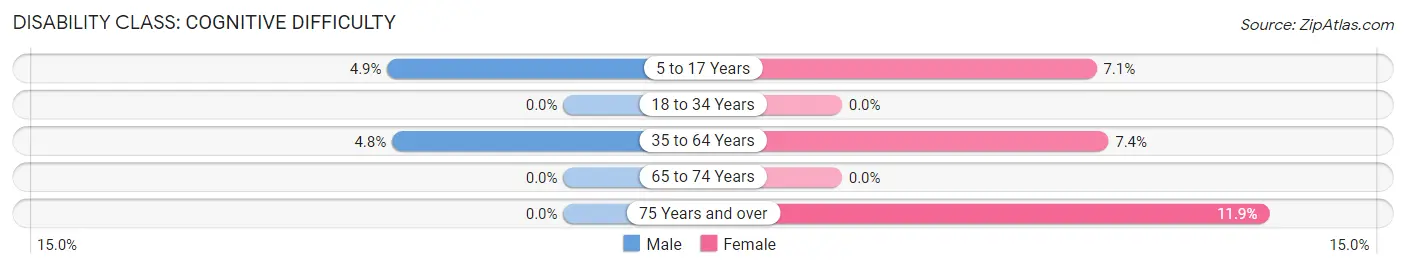
| Age Bracket | Male | Female |
| 5 to 17 Years | 19 (4.9%) | 20 (7.1%) |
| 18 to 34 Years | 0 (0.0%) | 0 (0.0%) |
| 35 to 64 Years | 29 (4.8%) | 52 (7.4%) |
| 65 to 74 Years | 0 (0.0%) | 0 (0.0%) |
| 75 Years and over | 0 (0.0%) | 37 (11.9%) |
Disability Class: Ambulatory Difficulty
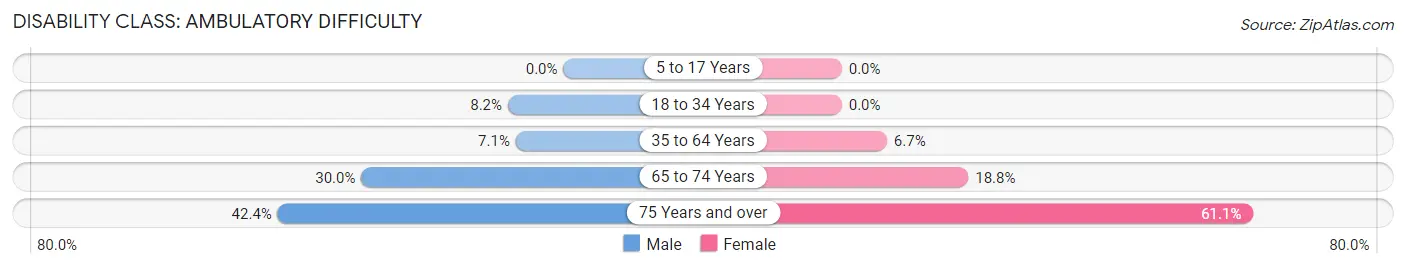
| Age Bracket | Male | Female |
| 5 to 17 Years | 0 (0.0%) | 0 (0.0%) |
| 18 to 34 Years | 35 (8.2%) | 0 (0.0%) |
| 35 to 64 Years | 43 (7.1%) | 47 (6.7%) |
| 65 to 74 Years | 51 (30.0%) | 34 (18.8%) |
| 75 Years and over | 14 (42.4%) | 190 (61.1%) |
Disability Class: Self-Care Difficulty
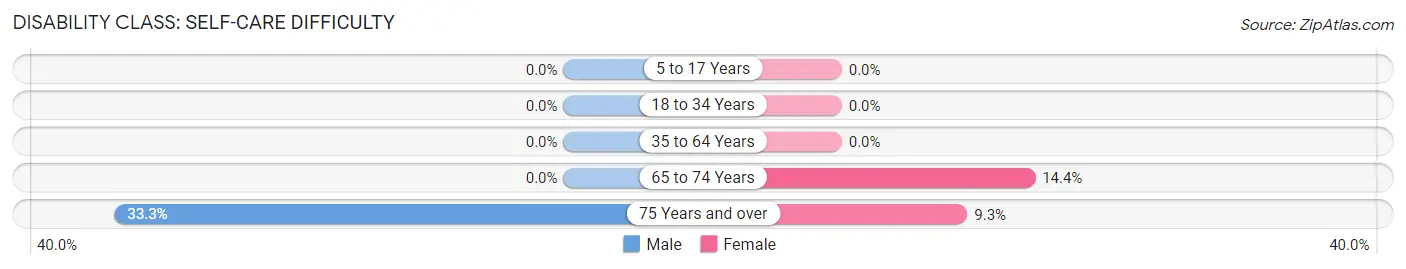
| Age Bracket | Male | Female |
| 5 to 17 Years | 0 (0.0%) | 0 (0.0%) |
| 18 to 34 Years | 0 (0.0%) | 0 (0.0%) |
| 35 to 64 Years | 0 (0.0%) | 0 (0.0%) |
| 65 to 74 Years | 0 (0.0%) | 26 (14.4%) |
| 75 Years and over | 11 (33.3%) | 29 (9.3%) |
Technology Access in Sullivan
Computing Device Access in Sullivan
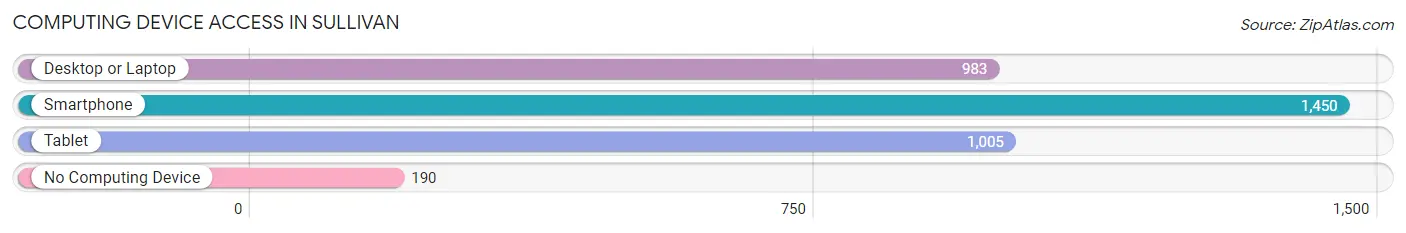
| Device Type | # Households | % Households |
| Desktop or Laptop | 983 | 55.6% |
| Smartphone | 1,450 | 82.1% |
| Tablet | 1,005 | 56.9% |
| No Computing Device | 190 | 10.7% |
| Total | 1,767 | 100.0% |
Internet Access in Sullivan
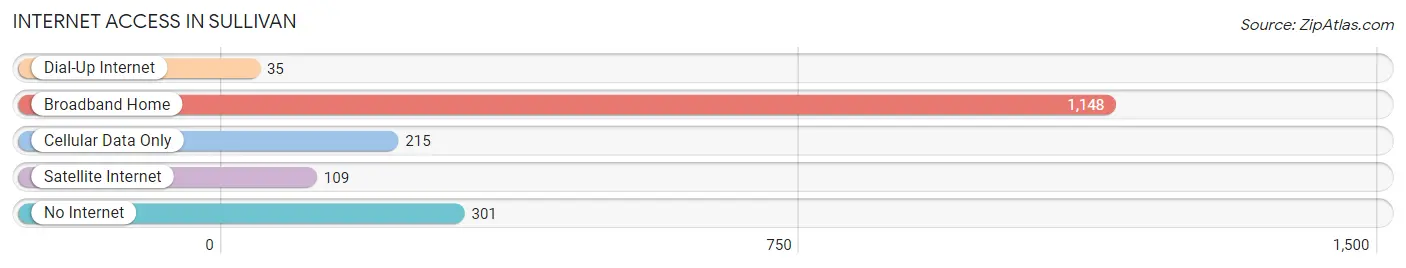
| Internet Type | # Households | % Households |
| Dial-Up Internet | 35 | 2.0% |
| Broadband Home | 1,148 | 65.0% |
| Cellular Data Only | 215 | 12.2% |
| Satellite Internet | 109 | 6.2% |
| No Internet | 301 | 17.0% |
| Total | 1,767 | 100.0% |
Sullivan Summary
Sullivan, Indiana is a small city located in the southwestern part of the state, in Sullivan County. It is the county seat and the largest city in the county. The city has a population of 4,249 according to the 2010 census. Sullivan is located in the Wabash Valley region of Indiana, and is part of the Terre Haute Metropolitan Statistical Area.
History
Sullivan was founded in 1817 by William Sullivan, a Revolutionary War veteran. The city was originally known as Sullivantown, and was later renamed Sullivan in 1837. The city was incorporated in 1851.
Sullivan was an important stop on the Wabash and Erie Canal, which was built in the 1840s. The canal was an important transportation route for goods and people, and helped to spur the growth of the city.
In the late 19th century, Sullivan was a major center for the coal mining industry. The city was home to several coal mines, and the coal industry was a major employer in the area.
Geography
Sullivan is located in southwestern Indiana, in Sullivan County. The city is situated in the Wabash Valley region of the state, and is part of the Terre Haute Metropolitan Statistical Area.
The city is located at the intersection of State Road 154 and State Road 48. The city is located approximately 50 miles south of Indianapolis, and about 100 miles west of Cincinnati, Ohio.
The terrain around Sullivan is mostly flat, with some rolling hills. The city is located in the Wabash River Valley, and the Wabash River runs through the city.
Economy
Sullivan’s economy is largely based on agriculture and manufacturing. The city is home to several manufacturing plants, including a steel mill, a paper mill, and a plastics plant.
Agriculture is also an important part of the local economy. The city is home to several farms, and the surrounding area is known for its production of corn, soybeans, and wheat.
The city is also home to several retail stores restaurants and other businesses
Demographics
According to the 2010 census, Sullivan has a population of 4,249. The city has a median household income of $37,945, and a median family income of $45,945.
The population of Sullivan is predominantly white, with about 90% of the population identifying as white. The city also has a small African American population, with about 4% of the population identifying as African American.
The city also has a small Hispanic population, with about 2% of the population identifying as Hispanic or Latino.
Conclusion
Sullivan, Indiana is a small city located in the southwestern part of the state, in Sullivan County. The city has a population of 4,249 according to the 2010 census, and is part of the Terre Haute Metropolitan Statistical Area. The city’s economy is largely based on agriculture and manufacturing, and the city is home to several retail stores, restaurants, and other businesses. The population of Sullivan is predominantly white, with about 90% of the population identifying as white. The city also has a small African American population, with about 4% of the population identifying as African American, and a small Hispanic population, with about 2% of the population identifying as Hispanic or Latino.
Common Questions
What is Per Capita Income in Sullivan?
Per Capita income in Sullivan is $22,556.
What is the Median Family Income in Sullivan?
Median Family Income in Sullivan is $63,405.
What is the Median Household income in Sullivan?
Median Household Income in Sullivan is $44,227.
What is Income or Wage Gap in Sullivan?
Income or Wage Gap in Sullivan is 7.7%.
Women in Sullivan earn 92.3 cents for every dollar earned by a man.
What is Inequality or Gini Index in Sullivan?
Inequality or Gini Index in Sullivan is 0.38.
What is the Total Population of Sullivan?
Total Population of Sullivan is 4,243.
What is the Total Male Population of Sullivan?
Total Male Population of Sullivan is 1,959.
What is the Total Female Population of Sullivan?
Total Female Population of Sullivan is 2,284.
What is the Ratio of Males per 100 Females in Sullivan?
There are 85.77 Males per 100 Females in Sullivan.
What is the Ratio of Females per 100 Males in Sullivan?
There are 116.59 Females per 100 Males in Sullivan.
What is the Median Population Age in Sullivan?
Median Population Age in Sullivan is 34.5 Years.
What is the Average Family Size in Sullivan
Average Family Size in Sullivan is 2.9 People.
What is the Average Household Size in Sullivan
Average Household Size in Sullivan is 2.4 People.
How Large is the Labor Force in Sullivan?
There are 2,148 People in the Labor Forcein in Sullivan.
What is the Percentage of People in the Labor Force in Sullivan?
66.1% of People are in the Labor Force in Sullivan.
What is the Unemployment Rate in Sullivan?
Unemployment Rate in Sullivan is 4.6%.