Staunton, IN Map & Demographics
Staunton Map
Staunton Overview
$23,397
PER CAPITA INCOME
$41,875
AVG FAMILY INCOME
$41,250
AVG HOUSEHOLD INCOME
0.43
INEQUALITY / GINI INDEX
262
TOTAL POPULATION
136
MALE POPULATION
126
FEMALE POPULATION
107.94
MALES / 100 FEMALES
92.65
FEMALES / 100 MALES
38.3
MEDIAN AGE
3.0
AVG FAMILY SIZE
2.6
AVG HOUSEHOLD SIZE
107
LABOR FORCE [ PEOPLE ]
53.5%
PERCENT IN LABOR FORCE
4.7%
UNEMPLOYMENT RATE
Staunton Zip Codes
Staunton Area Codes
Income in Staunton
Income Overview in Staunton
Per Capita Income in Staunton is $23,397, while median incomes of families and households are $41,875 and $41,250 respectively.
| Characteristic | Number | Measure |
| Per Capita Income | 262 | $23,397 |
| Median Family Income | 77 | $41,875 |
| Mean Family Income | 77 | $61,370 |
| Median Household Income | 101 | $41,250 |
| Mean Household Income | 101 | $60,246 |
| Income Deficit | 77 | $0 |
| Wage / Income Gap (%) | 262 | 0.00% |
| Wage / Income Gap ($) | 262 | 100.00¢ per $1 |
| Gini / Inequality Index | 262 | 0.43 |
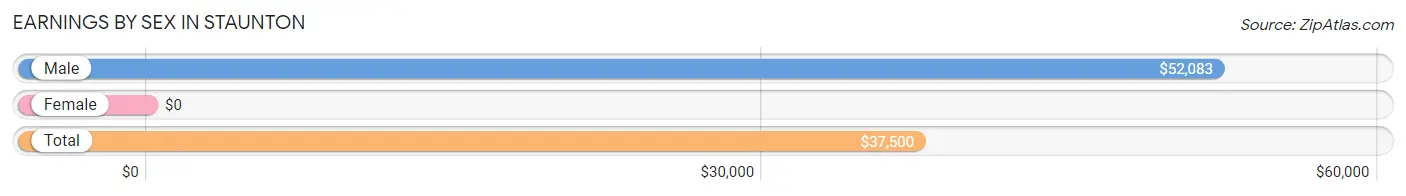
Earnings by Sex in Staunton
| Sex | Number | Average Earnings |
| Male | 50 (42.4%) | $52,083 |
| Female | 68 (57.6%) | $0 |
| Total | 118 (100.0%) | $37,500 |
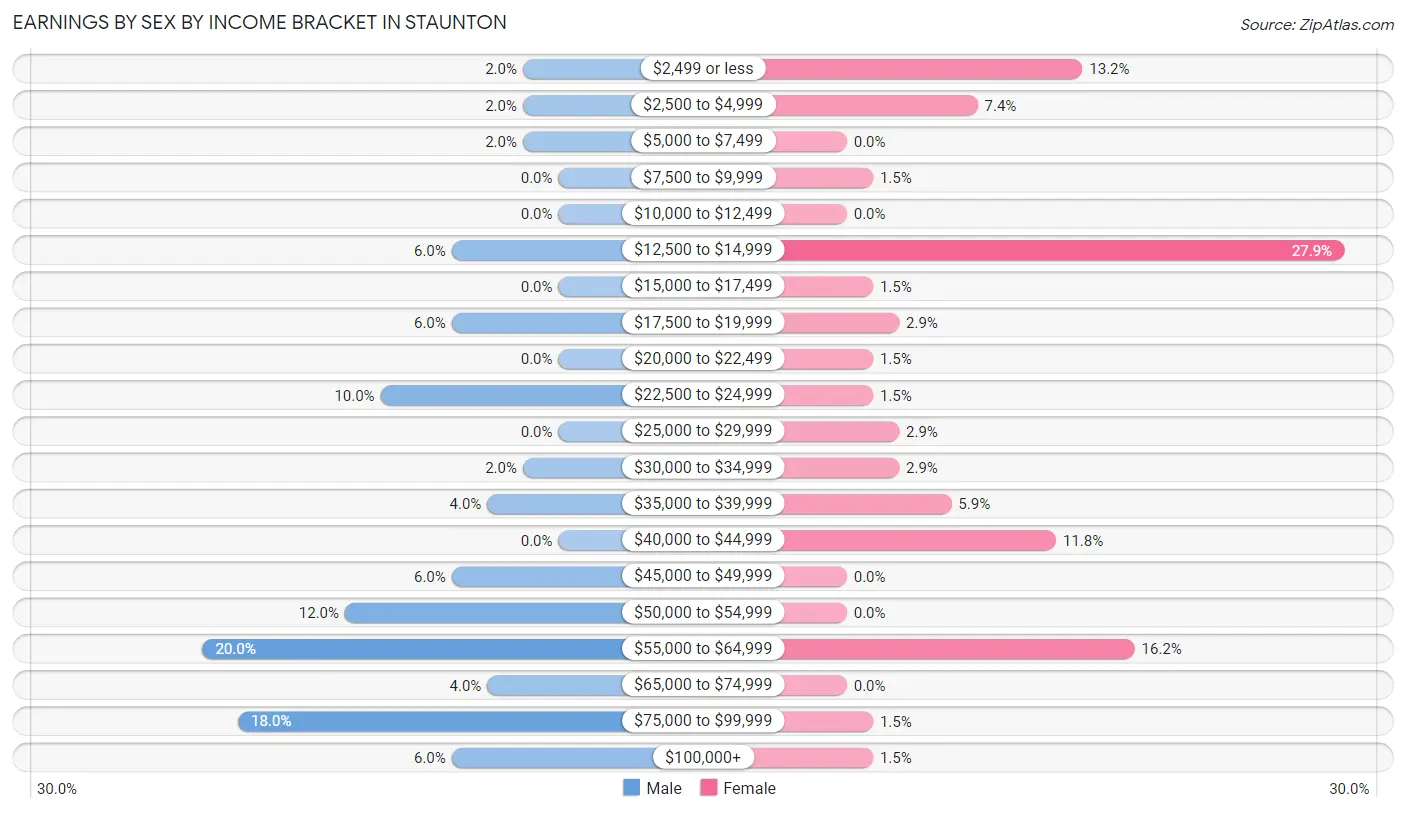
Earnings by Sex by Income Bracket in Staunton
The most common earnings brackets in Staunton are $55,000 to $64,999 for men (10 | 20.0%) and $12,500 to $14,999 for women (19 | 27.9%).
| Income | Male | Female |
| $2,499 or less | 1 (2.0%) | 9 (13.2%) |
| $2,500 to $4,999 | 1 (2.0%) | 5 (7.3%) |
| $5,000 to $7,499 | 1 (2.0%) | 0 (0.0%) |
| $7,500 to $9,999 | 0 (0.0%) | 1 (1.5%) |
| $10,000 to $12,499 | 0 (0.0%) | 0 (0.0%) |
| $12,500 to $14,999 | 3 (6.0%) | 19 (27.9%) |
| $15,000 to $17,499 | 0 (0.0%) | 1 (1.5%) |
| $17,500 to $19,999 | 3 (6.0%) | 2 (2.9%) |
| $20,000 to $22,499 | 0 (0.0%) | 1 (1.5%) |
| $22,500 to $24,999 | 5 (10.0%) | 1 (1.5%) |
| $25,000 to $29,999 | 0 (0.0%) | 2 (2.9%) |
| $30,000 to $34,999 | 1 (2.0%) | 2 (2.9%) |
| $35,000 to $39,999 | 2 (4.0%) | 4 (5.9%) |
| $40,000 to $44,999 | 0 (0.0%) | 8 (11.8%) |
| $45,000 to $49,999 | 3 (6.0%) | 0 (0.0%) |
| $50,000 to $54,999 | 6 (12.0%) | 0 (0.0%) |
| $55,000 to $64,999 | 10 (20.0%) | 11 (16.2%) |
| $65,000 to $74,999 | 2 (4.0%) | 0 (0.0%) |
| $75,000 to $99,999 | 9 (18.0%) | 1 (1.5%) |
| $100,000+ | 3 (6.0%) | 1 (1.5%) |
| Total | 50 (100.0%) | 68 (100.0%) |
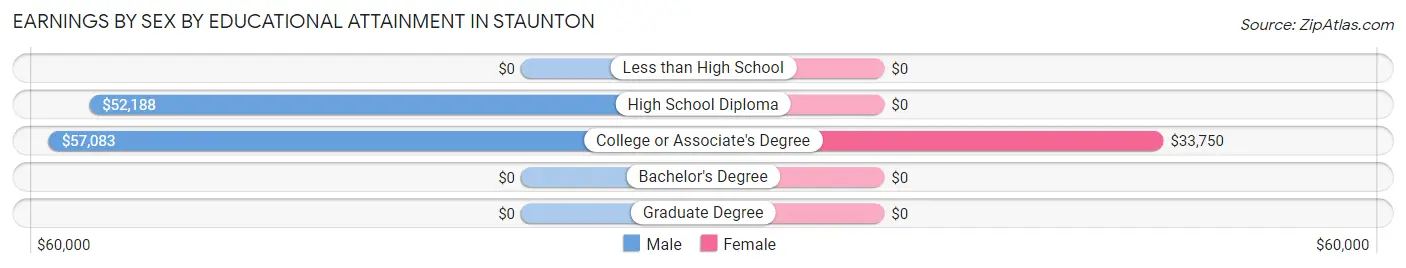
Earnings by Sex by Educational Attainment in Staunton
| Educational Attainment | Male Income | Female Income |
| Less than High School | - | - |
| High School Diploma | $52,188 | $0 |
| College or Associate's Degree | $57,083 | $33,750 |
| Bachelor's Degree | - | - |
| Graduate Degree | - | - |
| Total | $55,625 | $0 |
Family Income in Staunton
Family Income Brackets in Staunton
According to the Staunton family income data, there are 16 families falling into the $100,000 to $149,999 income range, which is the most common income bracket and makes up 20.8% of all families.
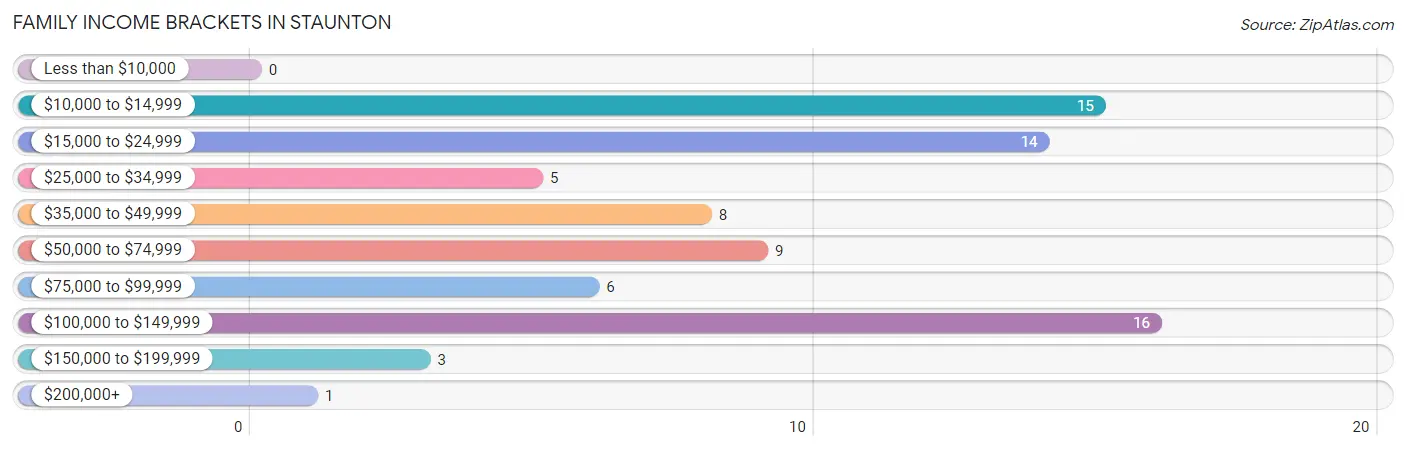
| Income Bracket | # Families | % Families |
| Less than $10,000 | 0 | 0.0% |
| $10,000 to $14,999 | 15 | 19.5% |
| $15,000 to $24,999 | 14 | 18.2% |
| $25,000 to $34,999 | 5 | 6.5% |
| $35,000 to $49,999 | 8 | 10.4% |
| $50,000 to $74,999 | 9 | 11.7% |
| $75,000 to $99,999 | 6 | 7.8% |
| $100,000 to $149,999 | 16 | 20.8% |
| $150,000 to $199,999 | 3 | 3.9% |
| $200,000+ | 1 | 1.3% |
Family Income by Famaliy Size in Staunton
4-person families (9 | 11.7%) account for the highest median family income in Staunton with $119,583 per family, while 4-person families (9 | 11.7%) have the highest median income of $29,896 per family member.
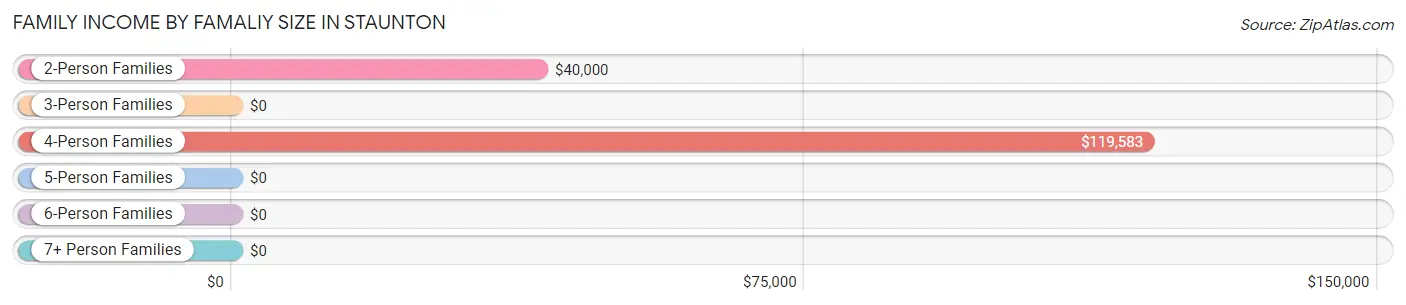
| Income Bracket | # Families | Median Income |
| 2-Person Families | 38 (49.3%) | $40,000 |
| 3-Person Families | 23 (29.9%) | $0 |
| 4-Person Families | 9 (11.7%) | $119,583 |
| 5-Person Families | 5 (6.5%) | $0 |
| 6-Person Families | 0 (0.0%) | $0 |
| 7+ Person Families | 2 (2.6%) | $0 |
| Total | 77 (100.0%) | $41,875 |
Family Income by Number of Earners in Staunton
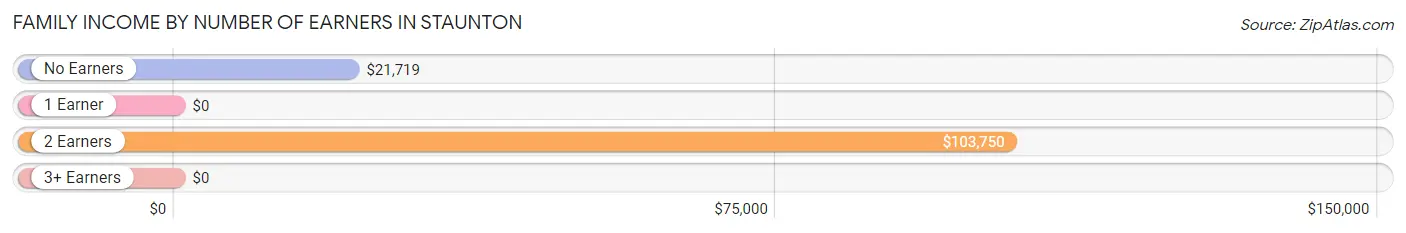
| Number of Earners | # Families | Median Income |
| No Earners | 19 (24.7%) | $21,719 |
| 1 Earner | 26 (33.8%) | $0 |
| 2 Earners | 28 (36.4%) | $103,750 |
| 3+ Earners | 4 (5.2%) | $0 |
| Total | 77 (100.0%) | $41,875 |
Household Income in Staunton
Household Income Brackets in Staunton
With 24 households falling in the category, the $100,000 to $149,999 income range is the most frequent in Staunton, accounting for 23.8% of all households. In contrast, only 1 households (1.0%) fall into the $200,000+ income bracket, making it the least populous group.
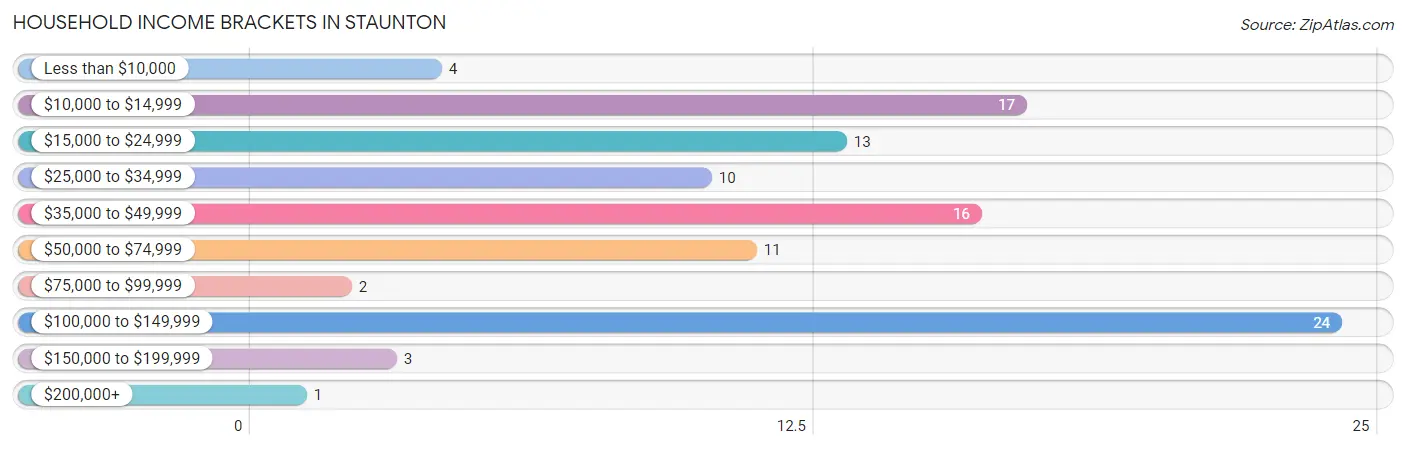
| Income Bracket | # Households | % Households |
| Less than $10,000 | 4 | 4.0% |
| $10,000 to $14,999 | 17 | 16.8% |
| $15,000 to $24,999 | 13 | 12.9% |
| $25,000 to $34,999 | 10 | 9.9% |
| $35,000 to $49,999 | 16 | 15.8% |
| $50,000 to $74,999 | 11 | 10.9% |
| $75,000 to $99,999 | 2 | 2.0% |
| $100,000 to $149,999 | 24 | 23.8% |
| $150,000 to $199,999 | 3 | 3.0% |
| $200,000+ | 1 | 1.0% |
Household Income by Householder Age in Staunton
The median household income in Staunton is $41,250, with the highest median household income of $42,083 found in the 45 to 64 years age bracket for the primary householder. A total of 45 households (44.6%) fall into this category.
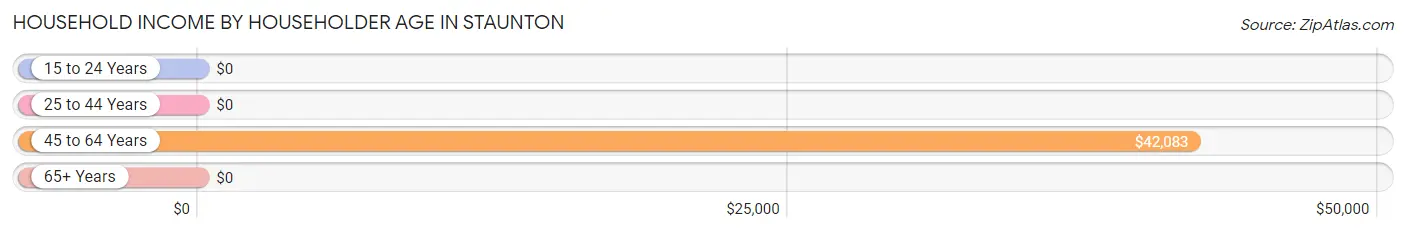
| Income Bracket | # Households | Median Income |
| 15 to 24 Years | 0 (0.0%) | $0 |
| 25 to 44 Years | 30 (29.7%) | $0 |
| 45 to 64 Years | 45 (44.6%) | $42,083 |
| 65+ Years | 26 (25.7%) | $0 |
| Total | 101 (100.0%) | $41,250 |
Poverty in Staunton
Income Below Poverty by Sex and Age in Staunton
With 22.8% poverty level for males and 34.1% for females among the residents of Staunton, 5 year old males and under 5 year old females are the most vulnerable to poverty, with 8 males (100.0%) and 13 females (76.5%) in their respective age groups living below the poverty level.
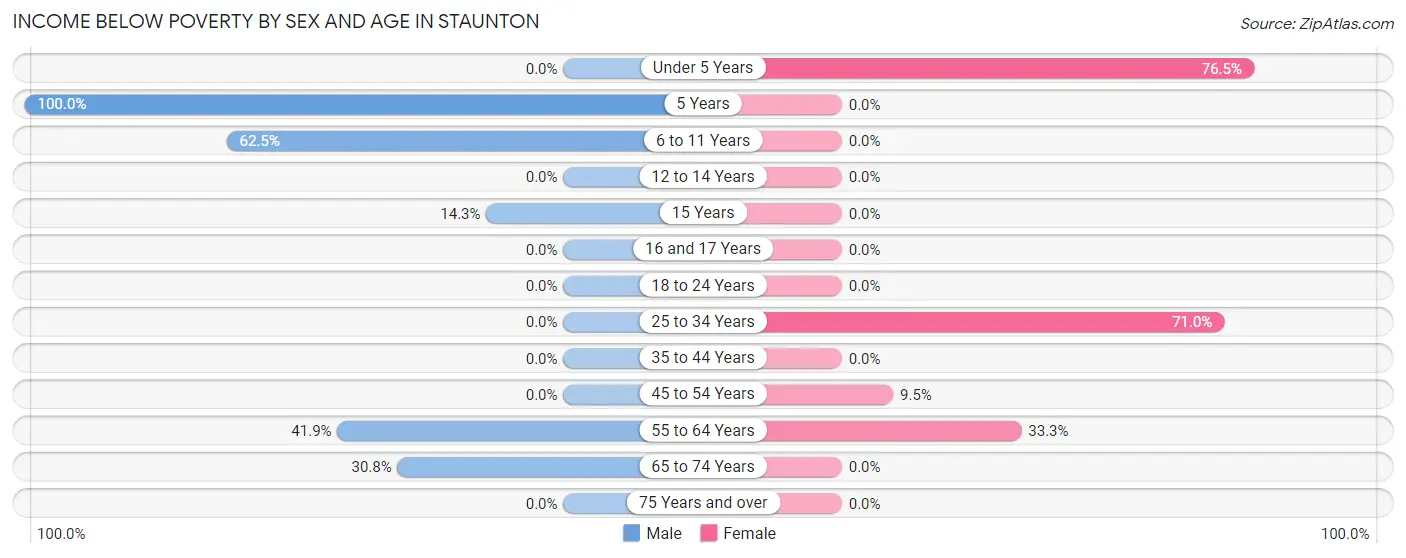
| Age Bracket | Male | Female |
| Under 5 Years | 0 (0.0%) | 13 (76.5%) |
| 5 Years | 8 (100.0%) | 0 (0.0%) |
| 6 to 11 Years | 5 (62.5%) | 0 (0.0%) |
| 12 to 14 Years | 0 (0.0%) | 0 (0.0%) |
| 15 Years | 1 (14.3%) | 0 (0.0%) |
| 16 and 17 Years | 0 (0.0%) | 0 (0.0%) |
| 18 to 24 Years | 0 (0.0%) | 0 (0.0%) |
| 25 to 34 Years | 0 (0.0%) | 22 (71.0%) |
| 35 to 44 Years | 0 (0.0%) | 0 (0.0%) |
| 45 to 54 Years | 0 (0.0%) | 2 (9.5%) |
| 55 to 64 Years | 13 (41.9%) | 6 (33.3%) |
| 65 to 74 Years | 4 (30.8%) | 0 (0.0%) |
| 75 Years and over | 0 (0.0%) | 0 (0.0%) |
| Total | 31 (22.8%) | 43 (34.1%) |
Income Above Poverty by Sex and Age in Staunton
According to the poverty statistics in Staunton, males aged under 5 years and females aged 6 to 11 years are the age groups that are most secure financially, with 100.0% of males and 100.0% of females in these age groups living above the poverty line.
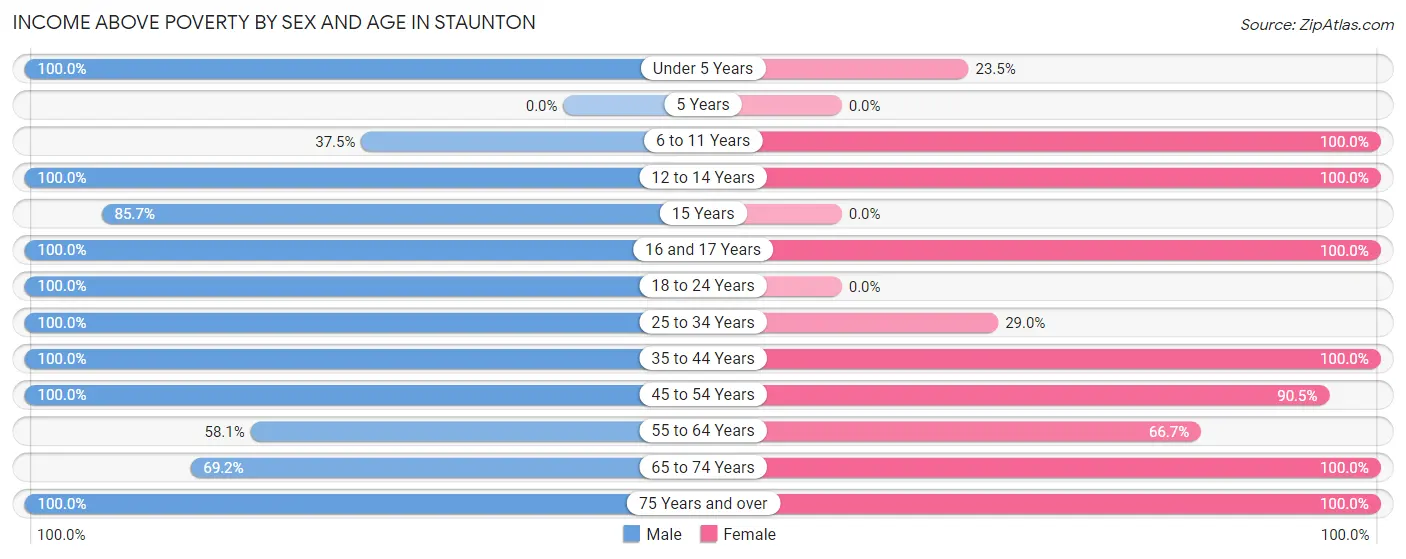
| Age Bracket | Male | Female |
| Under 5 Years | 12 (100.0%) | 4 (23.5%) |
| 5 Years | 0 (0.0%) | 0 (0.0%) |
| 6 to 11 Years | 3 (37.5%) | 5 (100.0%) |
| 12 to 14 Years | 1 (100.0%) | 4 (100.0%) |
| 15 Years | 6 (85.7%) | 0 (0.0%) |
| 16 and 17 Years | 2 (100.0%) | 5 (100.0%) |
| 18 to 24 Years | 13 (100.0%) | 0 (0.0%) |
| 25 to 34 Years | 10 (100.0%) | 9 (29.0%) |
| 35 to 44 Years | 11 (100.0%) | 6 (100.0%) |
| 45 to 54 Years | 11 (100.0%) | 19 (90.5%) |
| 55 to 64 Years | 18 (58.1%) | 12 (66.7%) |
| 65 to 74 Years | 9 (69.2%) | 7 (100.0%) |
| 75 Years and over | 9 (100.0%) | 12 (100.0%) |
| Total | 105 (77.2%) | 83 (65.9%) |
Income Below Poverty Among Married-Couple Families in Staunton
The poverty statistics for married-couple families in Staunton show that 12.2% or 5 of the total 41 families live below the poverty line. Families with 1 or 2 children have the highest poverty rate of 28.6%, comprising of 4 families. On the other hand, families with 3 or 4 children have the lowest poverty rate of 0.0%, which includes 0 families.
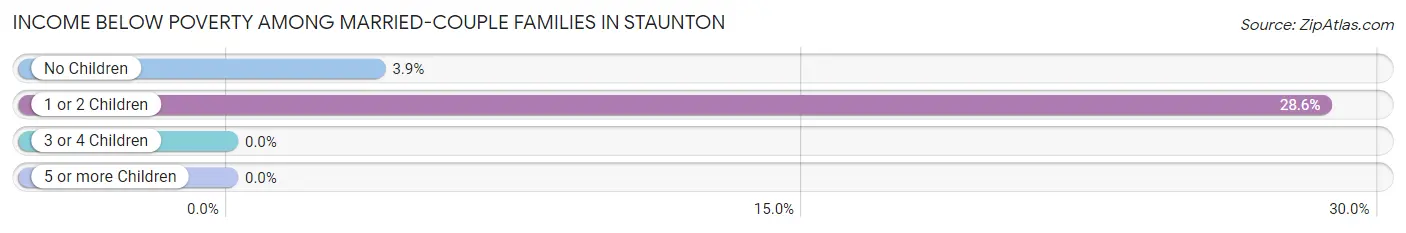
| Children | Above Poverty | Below Poverty |
| No Children | 25 (96.2%) | 1 (3.8%) |
| 1 or 2 Children | 10 (71.4%) | 4 (28.6%) |
| 3 or 4 Children | 1 (100.0%) | 0 (0.0%) |
| 5 or more Children | 0 (0.0%) | 0 (0.0%) |
| Total | 36 (87.8%) | 5 (12.2%) |
Income Below Poverty Among Single-Parent Households in Staunton
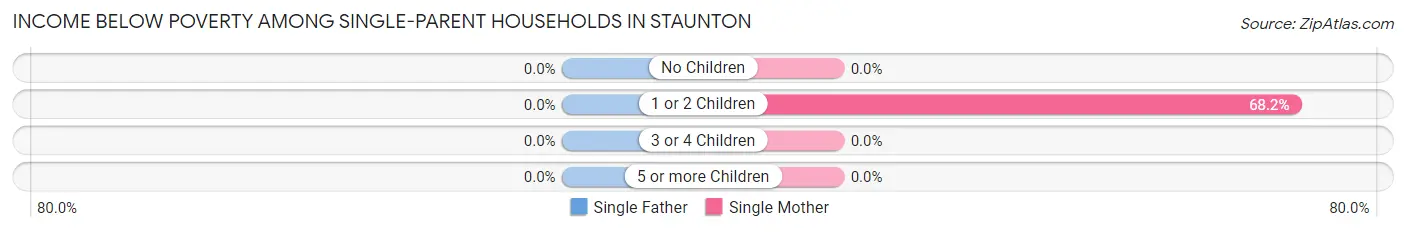
| Children | Single Father | Single Mother |
| No Children | 0 (0.0%) | 0 (0.0%) |
| 1 or 2 Children | 0 (0.0%) | 15 (68.2%) |
| 3 or 4 Children | 0 (0.0%) | 0 (0.0%) |
| 5 or more Children | 0 (0.0%) | 0 (0.0%) |
| Total | 0 (0.0%) | 15 (55.6%) |
Income Below Poverty Among Married-Couple vs Single-Parent Households in Staunton
The poverty data for Staunton shows that 5 of the married-couple family households (12.2%) and 15 of the single-parent households (41.7%) are living below the poverty level. Within the married-couple family households, those with 1 or 2 children have the highest poverty rate, with 4 households (28.6%) falling below the poverty line. Among the single-parent households, those with 1 or 2 children have the highest poverty rate, with 15 household (51.7%) living below poverty.
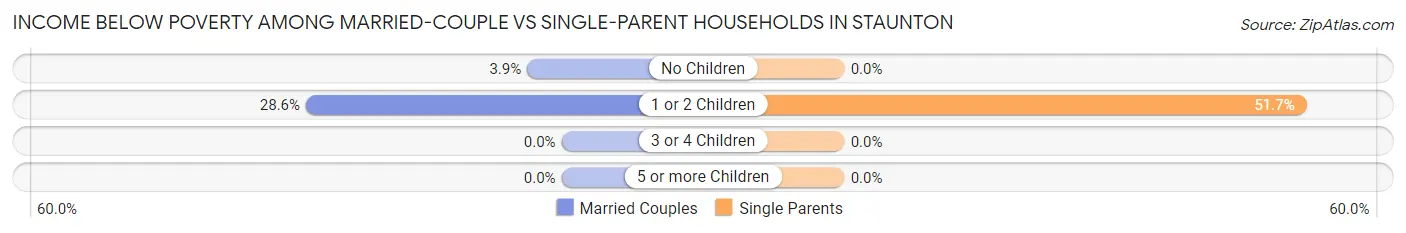
| Children | Married-Couple Families | Single-Parent Households |
| No Children | 1 (3.8%) | 0 (0.0%) |
| 1 or 2 Children | 4 (28.6%) | 15 (51.7%) |
| 3 or 4 Children | 0 (0.0%) | 0 (0.0%) |
| 5 or more Children | 0 (0.0%) | 0 (0.0%) |
| Total | 5 (12.2%) | 15 (41.7%) |
Race in Staunton
The most populous races in Staunton are White / Caucasian (262 | 100.0%), and Hispanic or Latino (2 | 0.8%).
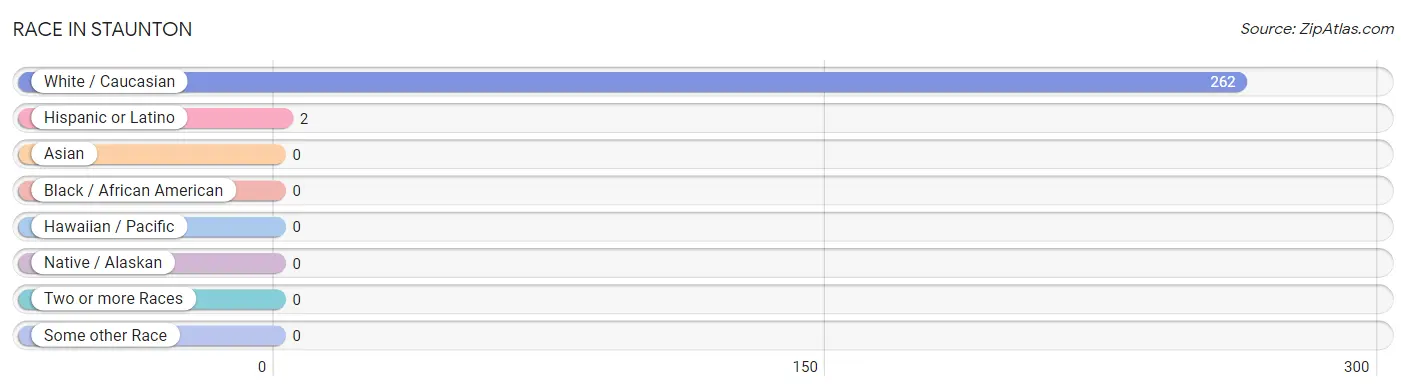
| Race | # Population | % Population |
| Asian | 0 | 0.0% |
| Black / African American | 0 | 0.0% |
| Hawaiian / Pacific | 0 | 0.0% |
| Hispanic or Latino | 2 | 0.8% |
| Native / Alaskan | 0 | 0.0% |
| White / Caucasian | 262 | 100.0% |
| Two or more Races | 0 | 0.0% |
| Some other Race | 0 | 0.0% |
| Total | 262 | 100.0% |
Ancestry in Staunton
The most populous ancestries reported in Staunton are German (56 | 21.4%), Scottish (23 | 8.8%), Irish (22 | 8.4%), American (18 | 6.9%), and Italian (16 | 6.1%), together accounting for 51.5% of all Staunton residents.
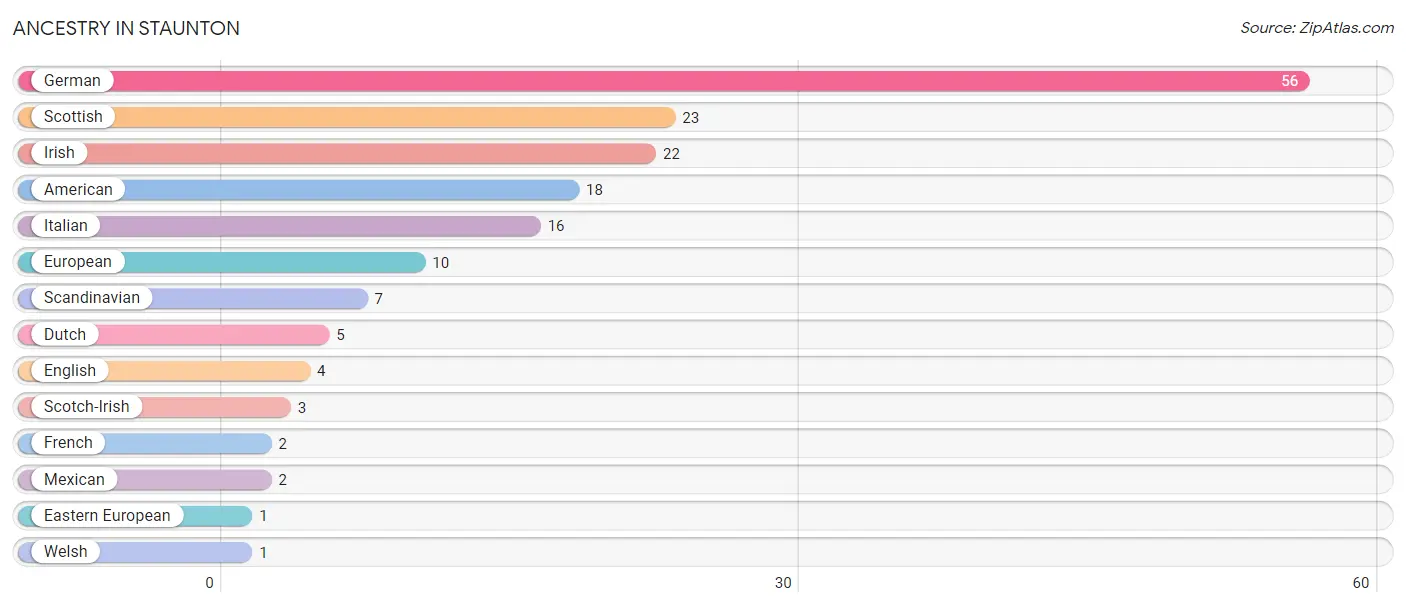
| Ancestry | # Population | % Population |
| American | 18 | 6.9% |
| Dutch | 5 | 1.9% |
| Eastern European | 1 | 0.4% |
| English | 4 | 1.5% |
| European | 10 | 3.8% |
| French | 2 | 0.8% |
| German | 56 | 21.4% |
| Irish | 22 | 8.4% |
| Italian | 16 | 6.1% |
| Mexican | 2 | 0.8% |
| Scandinavian | 7 | 2.7% |
| Scotch-Irish | 3 | 1.1% |
| Scottish | 23 | 8.8% |
| Welsh | 1 | 0.4% | View All 14 Rows |
Immigrants in Staunton

| Immigration Origin | # Population | % Population | View All 0 Rows |
Sex and Age in Staunton
Sex and Age in Staunton
The most populous age groups in Staunton are 60 to 64 Years (16 | 11.8%) for men and 25 to 29 Years (23 | 18.2%) for women.
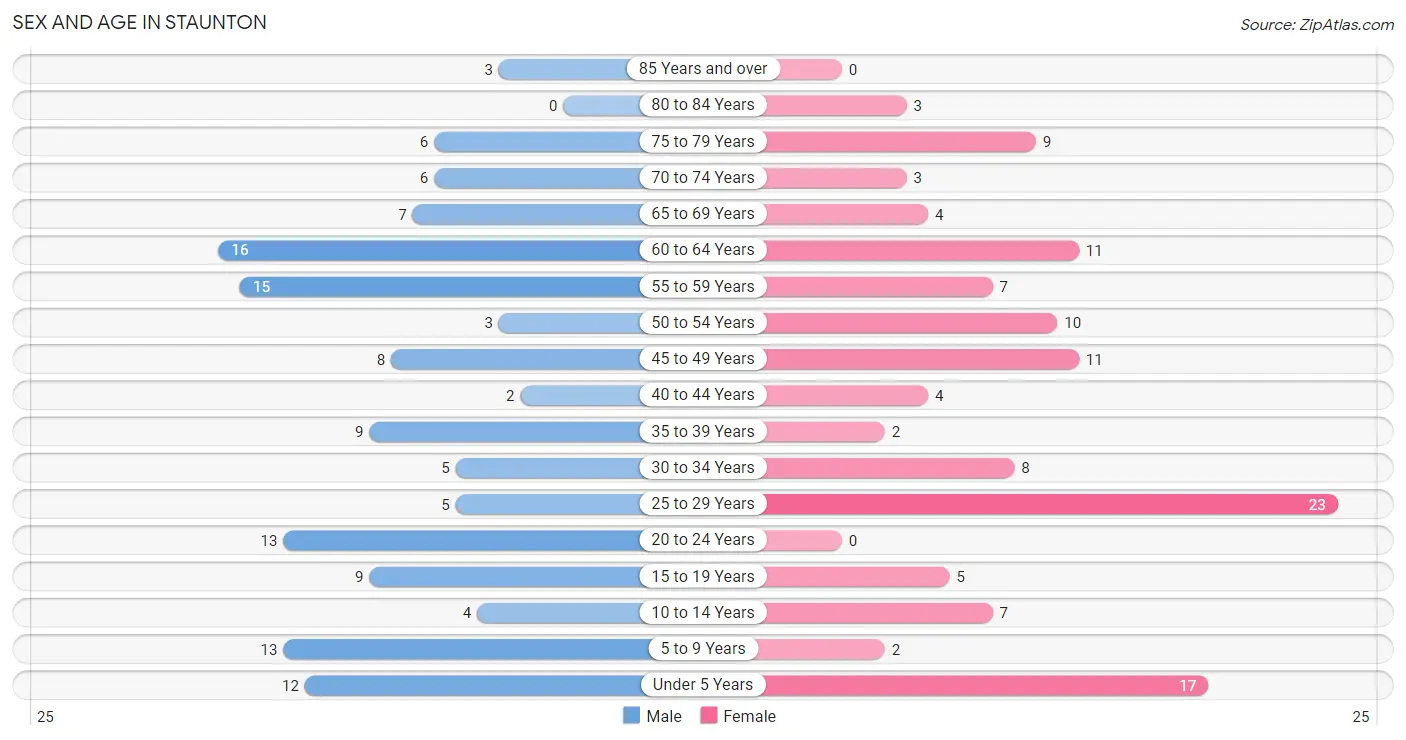
| Age Bracket | Male | Female |
| Under 5 Years | 12 (8.8%) | 17 (13.5%) |
| 5 to 9 Years | 13 (9.6%) | 2 (1.6%) |
| 10 to 14 Years | 4 (2.9%) | 7 (5.6%) |
| 15 to 19 Years | 9 (6.6%) | 5 (4.0%) |
| 20 to 24 Years | 13 (9.6%) | 0 (0.0%) |
| 25 to 29 Years | 5 (3.7%) | 23 (18.2%) |
| 30 to 34 Years | 5 (3.7%) | 8 (6.4%) |
| 35 to 39 Years | 9 (6.6%) | 2 (1.6%) |
| 40 to 44 Years | 2 (1.5%) | 4 (3.2%) |
| 45 to 49 Years | 8 (5.9%) | 11 (8.7%) |
| 50 to 54 Years | 3 (2.2%) | 10 (7.9%) |
| 55 to 59 Years | 15 (11.0%) | 7 (5.6%) |
| 60 to 64 Years | 16 (11.8%) | 11 (8.7%) |
| 65 to 69 Years | 7 (5.1%) | 4 (3.2%) |
| 70 to 74 Years | 6 (4.4%) | 3 (2.4%) |
| 75 to 79 Years | 6 (4.4%) | 9 (7.1%) |
| 80 to 84 Years | 0 (0.0%) | 3 (2.4%) |
| 85 Years and over | 3 (2.2%) | 0 (0.0%) |
| Total | 136 (100.0%) | 126 (100.0%) |
Families and Households in Staunton
Median Family Size in Staunton
The median family size in Staunton is 2.97 persons per family, with married-couple families (41 | 53.2%) accounting for the largest median family size of 3.44 persons per family. On the other hand, single male/father families (9 | 11.7%) represent the smallest median family size with 2.44 persons per family.
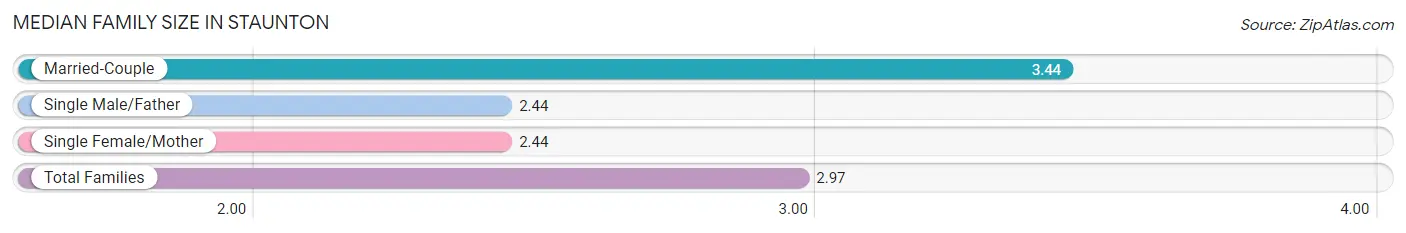
| Family Type | # Families | Family Size |
| Married-Couple | 41 (53.2%) | 3.44 |
| Single Male/Father | 9 (11.7%) | 2.44 |
| Single Female/Mother | 27 (35.1%) | 2.44 |
| Total Families | 77 (100.0%) | 2.97 |
Median Household Size in Staunton
The median household size in Staunton is 2.59 persons per household, with married-couple households (41 | 40.6%) accounting for the largest median household size of 3.44 persons per household. non-family households (24 | 23.8%) represent the smallest median household size with 1.13 persons per household.
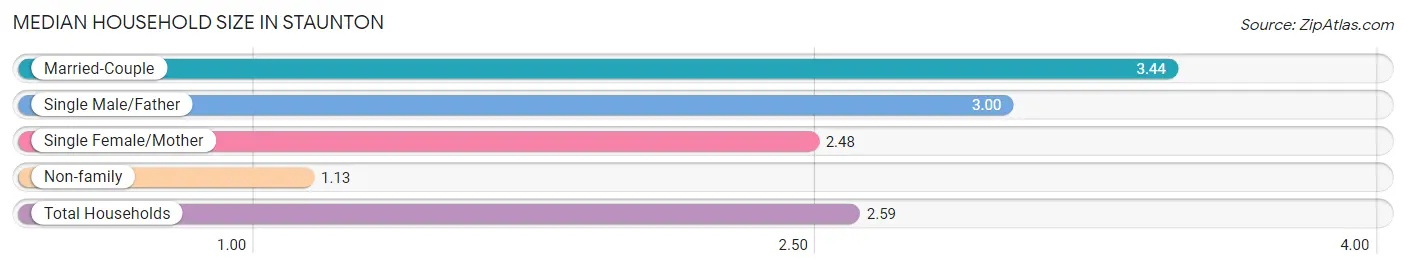
| Household Type | # Households | Household Size |
| Married-Couple | 41 (40.6%) | 3.44 |
| Single Male/Father | 9 (8.9%) | 3.00 |
| Single Female/Mother | 27 (26.7%) | 2.48 |
| Non-family | 24 (23.8%) | 1.13 |
| Total Households | 101 (100.0%) | 2.59 |
Household Size by Marriage Status in Staunton
Out of a total of 101 households in Staunton, 77 (76.2%) are family households, while 24 (23.8%) are nonfamily households. The most numerous type of family households are 2-person households, comprising 31, and the most common type of nonfamily households are 1-person households, comprising 20.
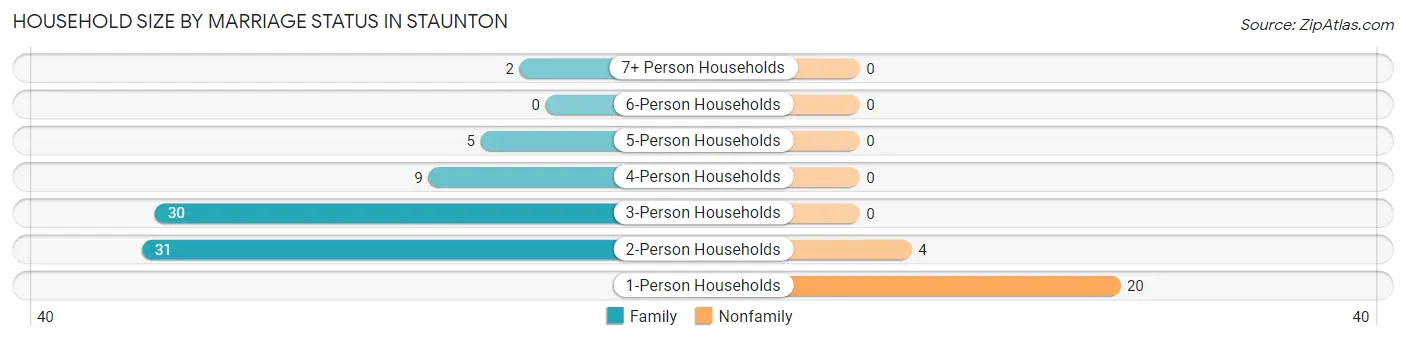
| Household Size | Family Households | Nonfamily Households |
| 1-Person Households | - | 20 (19.8%) |
| 2-Person Households | 31 (30.7%) | 4 (4.0%) |
| 3-Person Households | 30 (29.7%) | 0 (0.0%) |
| 4-Person Households | 9 (8.9%) | 0 (0.0%) |
| 5-Person Households | 5 (5.0%) | 0 (0.0%) |
| 6-Person Households | 0 (0.0%) | 0 (0.0%) |
| 7+ Person Households | 2 (2.0%) | 0 (0.0%) |
| Total | 77 (76.2%) | 24 (23.8%) |
Female Fertility in Staunton
Fertility by Age in Staunton
Average fertility rate in Staunton is 93.0 births per 1,000 women. Women in the age bracket of 20 to 34 years have the highest fertility rate with 161.0 births per 1,000 women. Women in the age bracket of 20 to 34 years acount for 100.0% of all women with births.
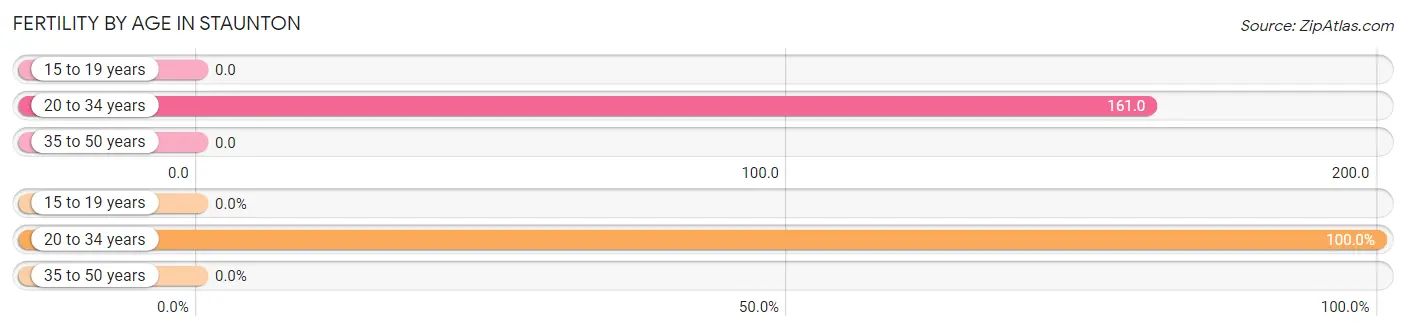
| Age Bracket | Women with Births | Births / 1,000 Women |
| 15 to 19 years | 0 (0.0%) | 0.0 |
| 20 to 34 years | 5 (100.0%) | 161.0 |
| 35 to 50 years | 0 (0.0%) | 0.0 |
| Total | 5 (100.0%) | 93.0 |
Fertility by Age by Marriage Status in Staunton
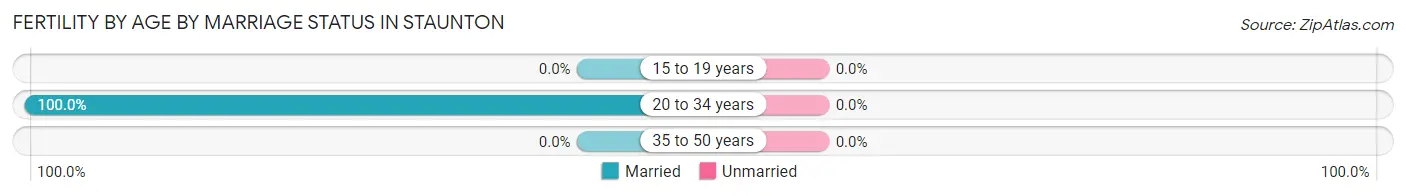
| Age Bracket | Married | Unmarried |
| 15 to 19 years | 0 (0.0%) | 0 (0.0%) |
| 20 to 34 years | 5 (100.0%) | 0 (0.0%) |
| 35 to 50 years | 0 (0.0%) | 0 (0.0%) |
| Total | 5 (100.0%) | 0 (0.0%) |
Fertility by Education in Staunton
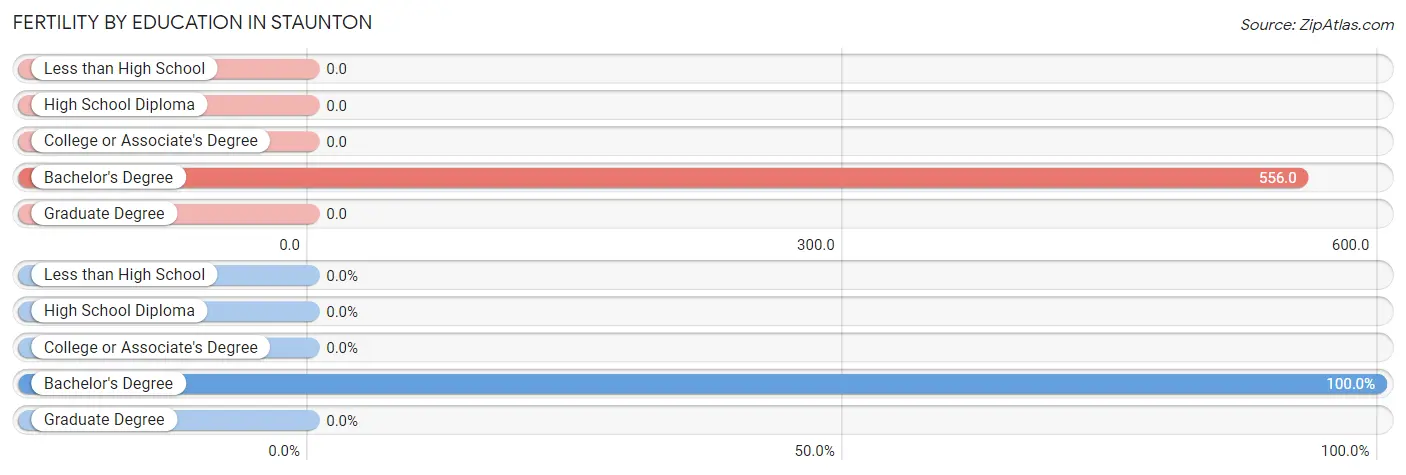
| Educational Attainment | Women with Births | Births / 1,000 Women |
| Less than High School | 0 (0.0%) | 0.0 |
| High School Diploma | 0 (0.0%) | 0.0 |
| College or Associate's Degree | 0 (0.0%) | 0.0 |
| Bachelor's Degree | 5 (100.0%) | 556.0 |
| Graduate Degree | 0 (0.0%) | 0.0 |
| Total | 5 (100.0%) | 93.0 |
Fertility by Education by Marriage Status in Staunton

| Educational Attainment | Married | Unmarried |
| Less than High School | 0 (0.0%) | 0 (0.0%) |
| High School Diploma | 0 (0.0%) | 0 (0.0%) |
| College or Associate's Degree | 0 (0.0%) | 0 (0.0%) |
| Bachelor's Degree | 5 (100.0%) | 0 (0.0%) |
| Graduate Degree | 0 (0.0%) | 0 (0.0%) |
| Total | 5 (100.0%) | 0 (0.0%) |
Employment Characteristics in Staunton
Employment by Class of Employer in Staunton
Among the 102 employed individuals in Staunton, private company employees (81 | 79.4%), local government employees (14 | 13.7%), and self-employed (not incorporated) (3 | 2.9%) make up the most common classes of employment.
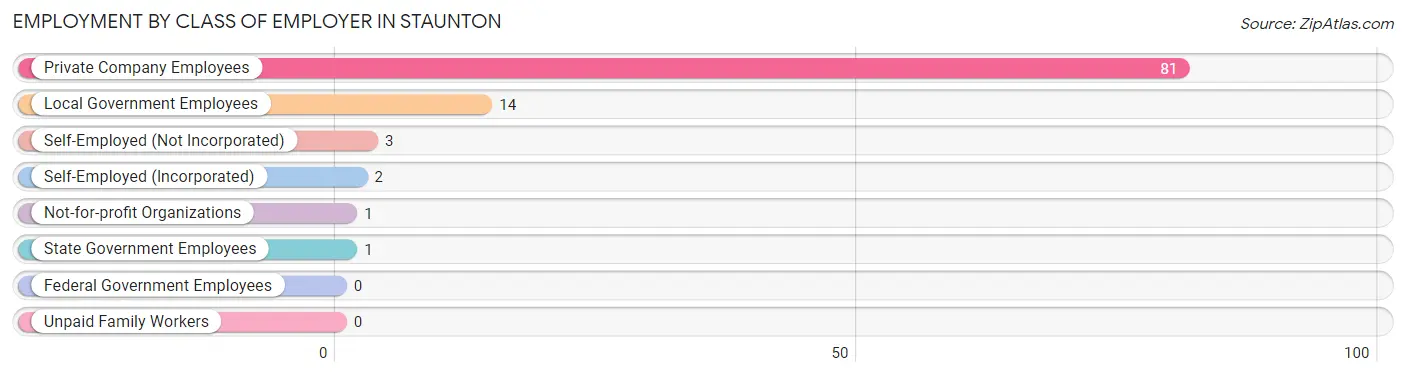
| Employer Class | # Employees | % Employees |
| Private Company Employees | 81 | 79.4% |
| Self-Employed (Incorporated) | 2 | 2.0% |
| Self-Employed (Not Incorporated) | 3 | 2.9% |
| Not-for-profit Organizations | 1 | 1.0% |
| Local Government Employees | 14 | 13.7% |
| State Government Employees | 1 | 1.0% |
| Federal Government Employees | 0 | 0.0% |
| Unpaid Family Workers | 0 | 0.0% |
| Total | 102 | 100.0% |
Employment Status by Age in Staunton
According to the labor force statistics for Staunton, out of the total population over 16 years of age (200), 53.5% or 107 individuals are in the labor force, with 4.7% or 5 of them unemployed. The age group with the highest labor force participation rate is 45 to 54 years, with 96.9% or 31 individuals in the labor force. Within the labor force, the 20 to 24 years age range has the highest percentage of unemployed individuals, with 25.0% or 1 of them being unemployed.
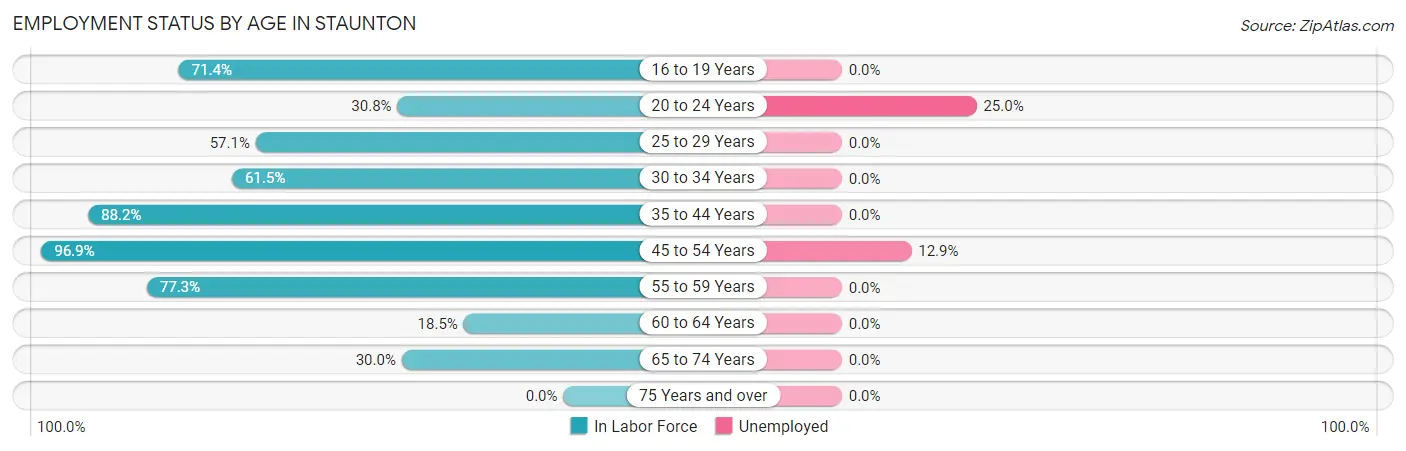
| Age Bracket | In Labor Force | Unemployed |
| 16 to 19 Years | 5 (71.4%) | 0 (0.0%) |
| 20 to 24 Years | 4 (30.8%) | 1 (25.0%) |
| 25 to 29 Years | 16 (57.1%) | 0 (0.0%) |
| 30 to 34 Years | 8 (61.5%) | 0 (0.0%) |
| 35 to 44 Years | 15 (88.2%) | 0 (0.0%) |
| 45 to 54 Years | 31 (96.9%) | 4 (12.9%) |
| 55 to 59 Years | 17 (77.3%) | 0 (0.0%) |
| 60 to 64 Years | 5 (18.5%) | 0 (0.0%) |
| 65 to 74 Years | 6 (30.0%) | 0 (0.0%) |
| 75 Years and over | 0 (0.0%) | 0 (0.0%) |
| Total | 107 (53.5%) | 5 (4.7%) |
Employment Status by Educational Attainment in Staunton
According to labor force statistics for Staunton, 66.2% of individuals (92) out of the total population between 25 and 64 years of age (139) are in the labor force, with 4.3% or 4 of them being unemployed. The group with the highest labor force participation rate are those with the educational attainment of college / associate degree, with 80.9% or 38 individuals in the labor force. Within the labor force, individuals with less than high school education have the highest percentage of unemployment, with 80.0% or 4 of them being unemployed.
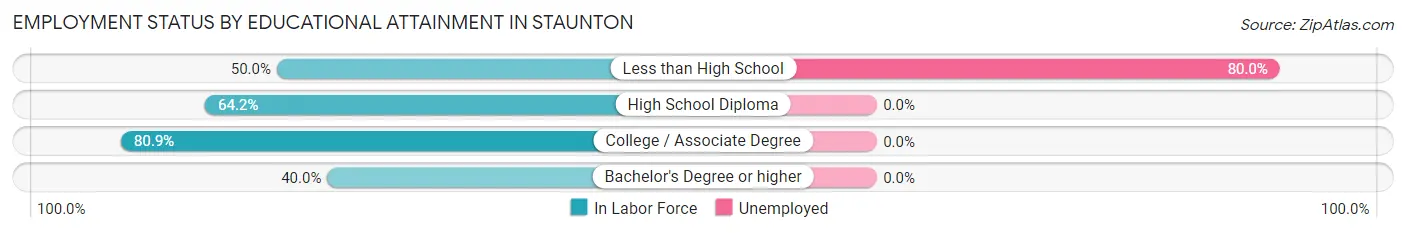
| Educational Attainment | In Labor Force | Unemployed |
| Less than High School | 5 (50.0%) | 8 (80.0%) |
| High School Diploma | 43 (64.2%) | 0 (0.0%) |
| College / Associate Degree | 38 (80.9%) | 0 (0.0%) |
| Bachelor's Degree or higher | 6 (40.0%) | 0 (0.0%) |
| Total | 92 (66.2%) | 6 (4.3%) |
Employment Occupations by Sex in Staunton
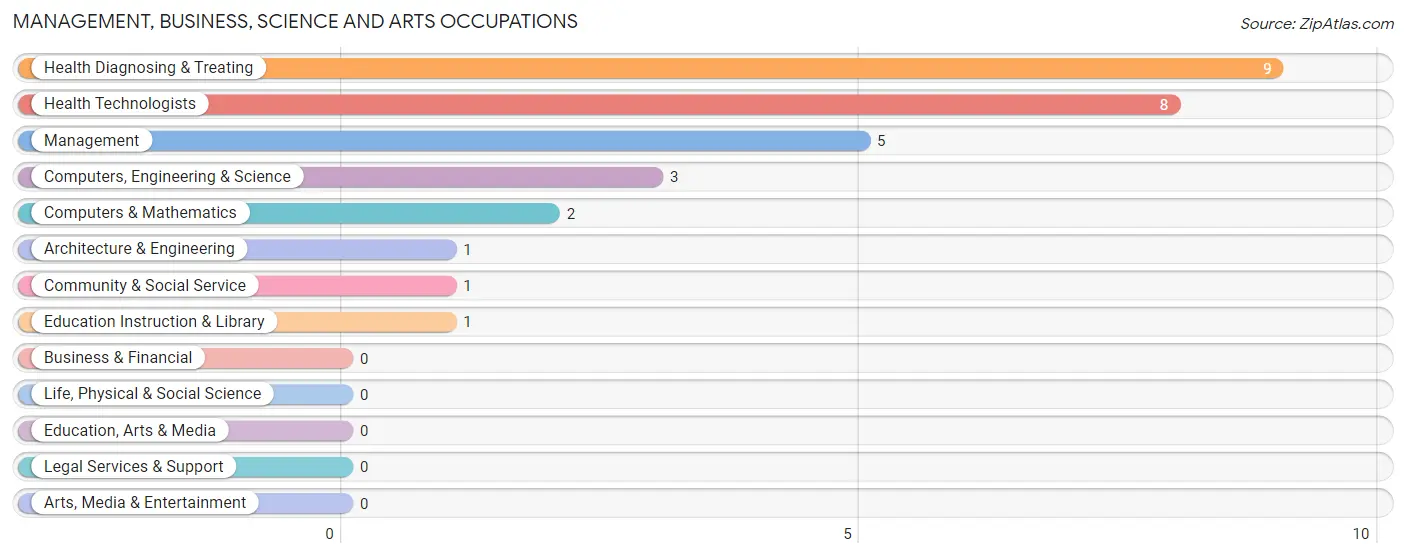
Management, Business, Science and Arts Occupations
The most common Management, Business, Science and Arts occupations in Staunton are Health Diagnosing & Treating (9 | 8.8%), Health Technologists (8 | 7.8%), Management (5 | 4.9%), Computers, Engineering & Science (3 | 2.9%), and Computers & Mathematics (2 | 2.0%).
Management, Business, Science and Arts Occupations by Sex
Within the Management, Business, Science and Arts occupations in Staunton, the most male-oriented occupations are Computers, Engineering & Science (100.0%), Computers & Mathematics (100.0%), and Architecture & Engineering (100.0%), while the most female-oriented occupations are Community & Social Service (100.0%), Education Instruction & Library (100.0%), and Health Diagnosing & Treating (100.0%).
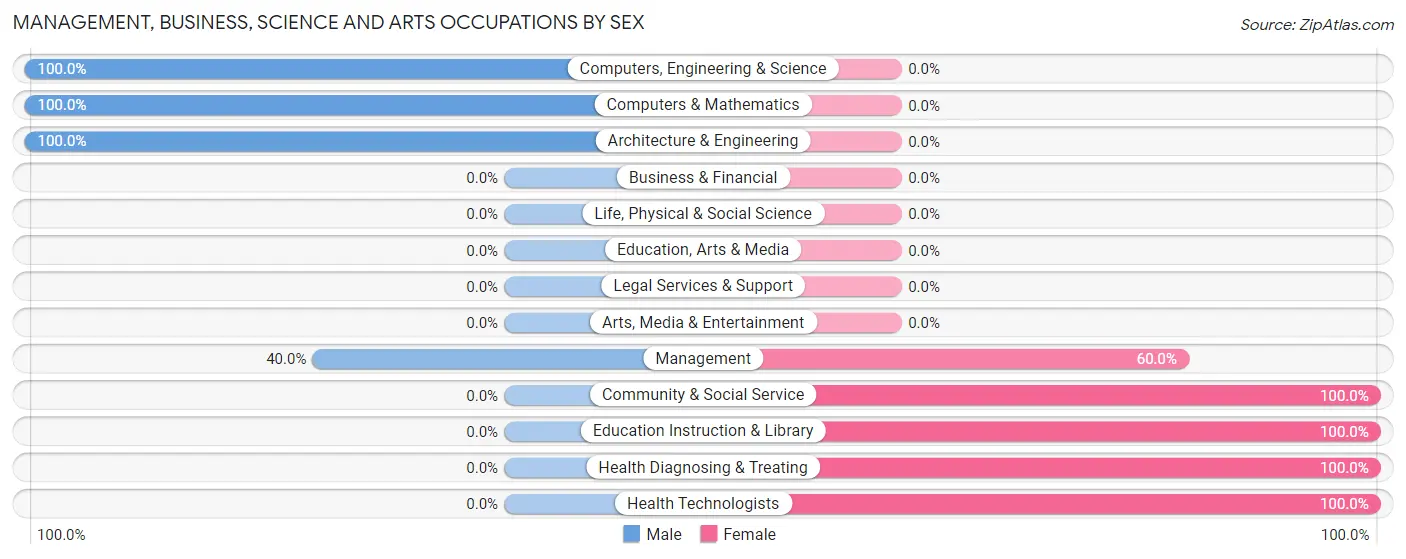
| Occupation | Male | Female |
| Management | 2 (40.0%) | 3 (60.0%) |
| Business & Financial | 0 (0.0%) | 0 (0.0%) |
| Computers, Engineering & Science | 3 (100.0%) | 0 (0.0%) |
| Computers & Mathematics | 2 (100.0%) | 0 (0.0%) |
| Architecture & Engineering | 1 (100.0%) | 0 (0.0%) |
| Life, Physical & Social Science | 0 (0.0%) | 0 (0.0%) |
| Community & Social Service | 0 (0.0%) | 1 (100.0%) |
| Education, Arts & Media | 0 (0.0%) | 0 (0.0%) |
| Legal Services & Support | 0 (0.0%) | 0 (0.0%) |
| Education Instruction & Library | 0 (0.0%) | 1 (100.0%) |
| Arts, Media & Entertainment | 0 (0.0%) | 0 (0.0%) |
| Health Diagnosing & Treating | 0 (0.0%) | 9 (100.0%) |
| Health Technologists | 0 (0.0%) | 8 (100.0%) |
| Total (Category) | 5 (27.8%) | 13 (72.2%) |
| Total (Overall) | 42 (41.2%) | 60 (58.8%) |
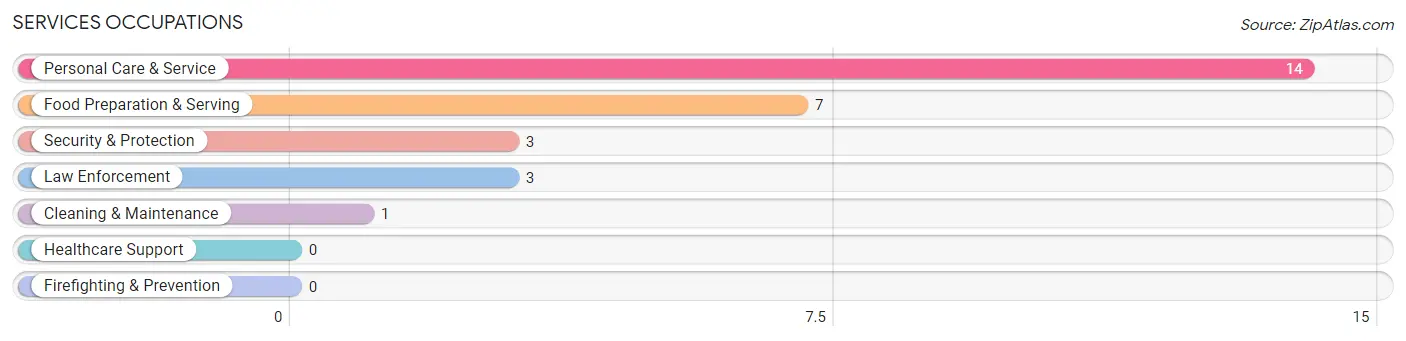
Services Occupations
The most common Services occupations in Staunton are Personal Care & Service (14 | 13.7%), Food Preparation & Serving (7 | 6.9%), Security & Protection (3 | 2.9%), Law Enforcement (3 | 2.9%), and Cleaning & Maintenance (1 | 1.0%).
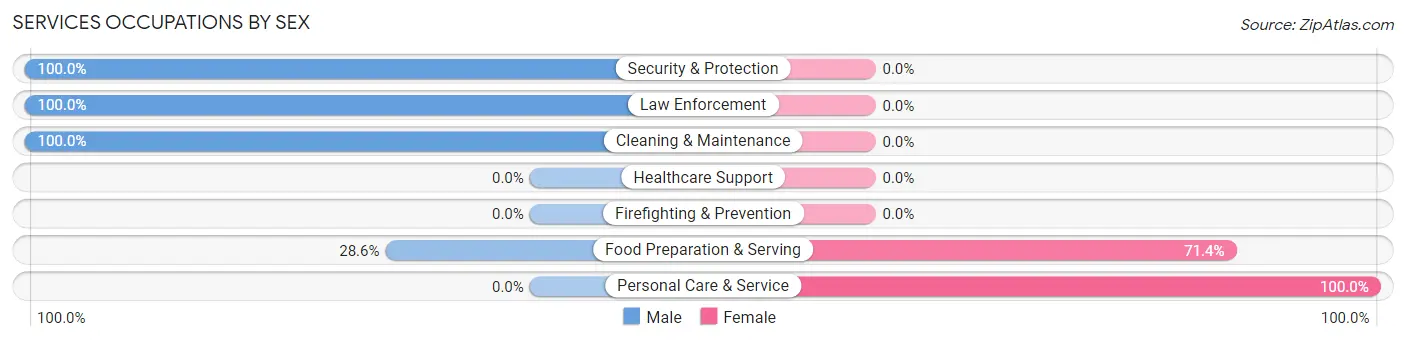
Services Occupations by Sex
Within the Services occupations in Staunton, the most male-oriented occupations are Security & Protection (100.0%), Law Enforcement (100.0%), and Cleaning & Maintenance (100.0%), while the most female-oriented occupations are Personal Care & Service (100.0%), and Food Preparation & Serving (71.4%).
| Occupation | Male | Female |
| Healthcare Support | 0 (0.0%) | 0 (0.0%) |
| Security & Protection | 3 (100.0%) | 0 (0.0%) |
| Firefighting & Prevention | 0 (0.0%) | 0 (0.0%) |
| Law Enforcement | 3 (100.0%) | 0 (0.0%) |
| Food Preparation & Serving | 2 (28.6%) | 5 (71.4%) |
| Cleaning & Maintenance | 1 (100.0%) | 0 (0.0%) |
| Personal Care & Service | 0 (0.0%) | 14 (100.0%) |
| Total (Category) | 6 (24.0%) | 19 (76.0%) |
| Total (Overall) | 42 (41.2%) | 60 (58.8%) |
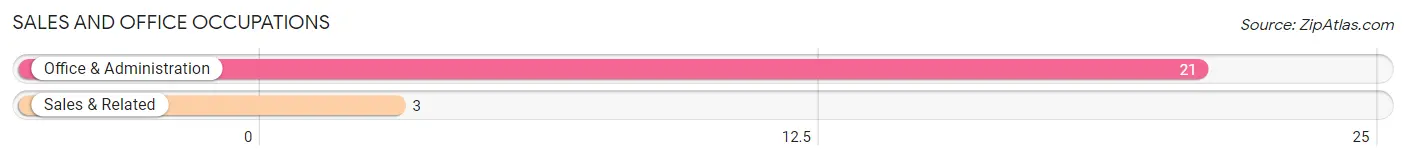
Sales and Office Occupations
The most common Sales and Office occupations in Staunton are Office & Administration (21 | 20.6%), and Sales & Related (3 | 2.9%).
Sales and Office Occupations by Sex
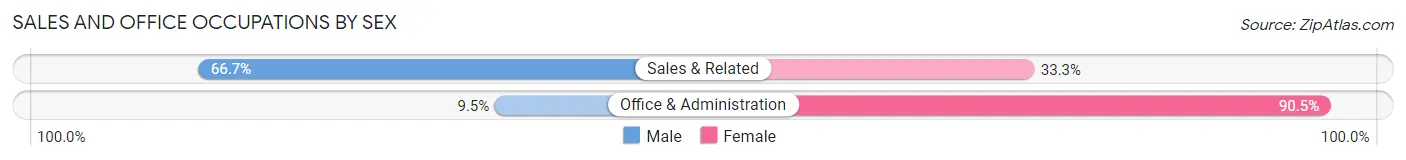
| Occupation | Male | Female |
| Sales & Related | 2 (66.7%) | 1 (33.3%) |
| Office & Administration | 2 (9.5%) | 19 (90.5%) |
| Total (Category) | 4 (16.7%) | 20 (83.3%) |
| Total (Overall) | 42 (41.2%) | 60 (58.8%) |
Natural Resources, Construction and Maintenance Occupations
The most common Natural Resources, Construction and Maintenance occupations in Staunton are Installation, Maintenance & Repair (9 | 8.8%), and Construction & Extraction (3 | 2.9%).
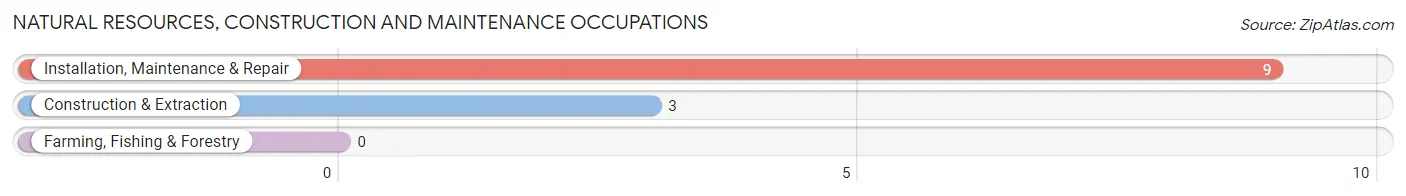
Natural Resources, Construction and Maintenance Occupations by Sex
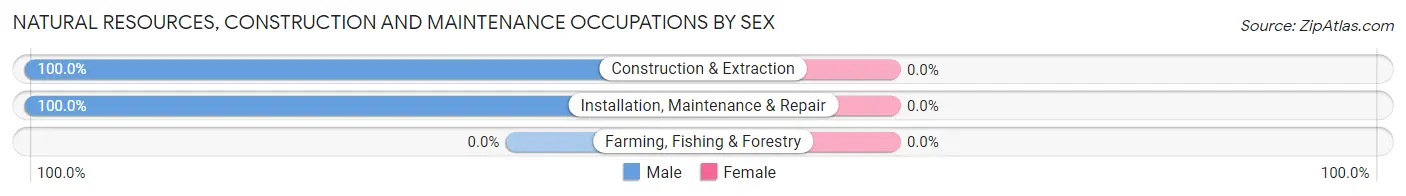
| Occupation | Male | Female |
| Farming, Fishing & Forestry | 0 (0.0%) | 0 (0.0%) |
| Construction & Extraction | 3 (100.0%) | 0 (0.0%) |
| Installation, Maintenance & Repair | 9 (100.0%) | 0 (0.0%) |
| Total (Category) | 12 (100.0%) | 0 (0.0%) |
| Total (Overall) | 42 (41.2%) | 60 (58.8%) |
Production, Transportation and Moving Occupations
The most common Production, Transportation and Moving occupations in Staunton are Transportation (13 | 12.8%), Production (7 | 6.9%), and Material Moving (3 | 2.9%).
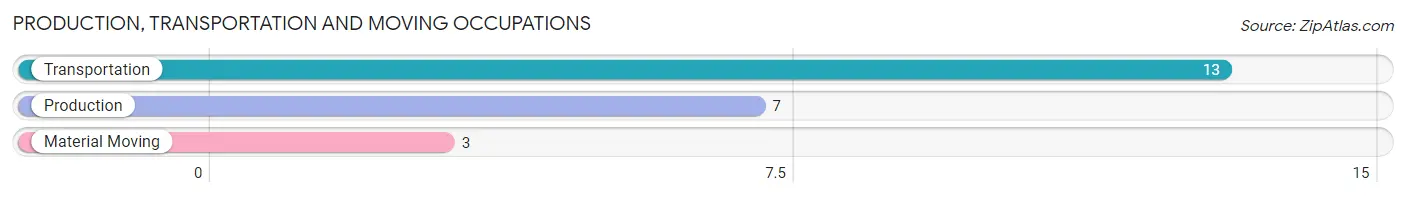
Production, Transportation and Moving Occupations by Sex
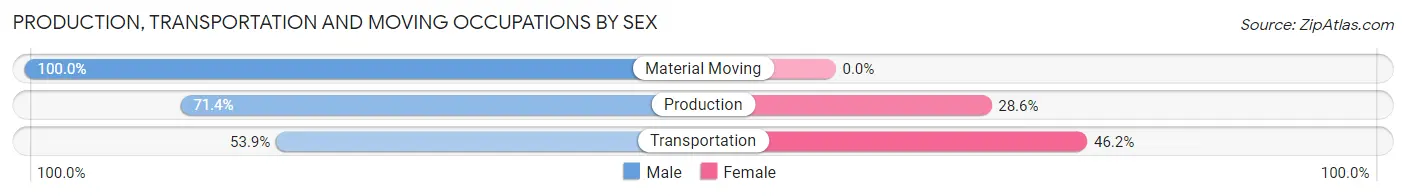
| Occupation | Male | Female |
| Production | 5 (71.4%) | 2 (28.6%) |
| Transportation | 7 (53.8%) | 6 (46.2%) |
| Material Moving | 3 (100.0%) | 0 (0.0%) |
| Total (Category) | 15 (65.2%) | 8 (34.8%) |
| Total (Overall) | 42 (41.2%) | 60 (58.8%) |
Employment Industries by Sex in Staunton
Employment Industries in Staunton
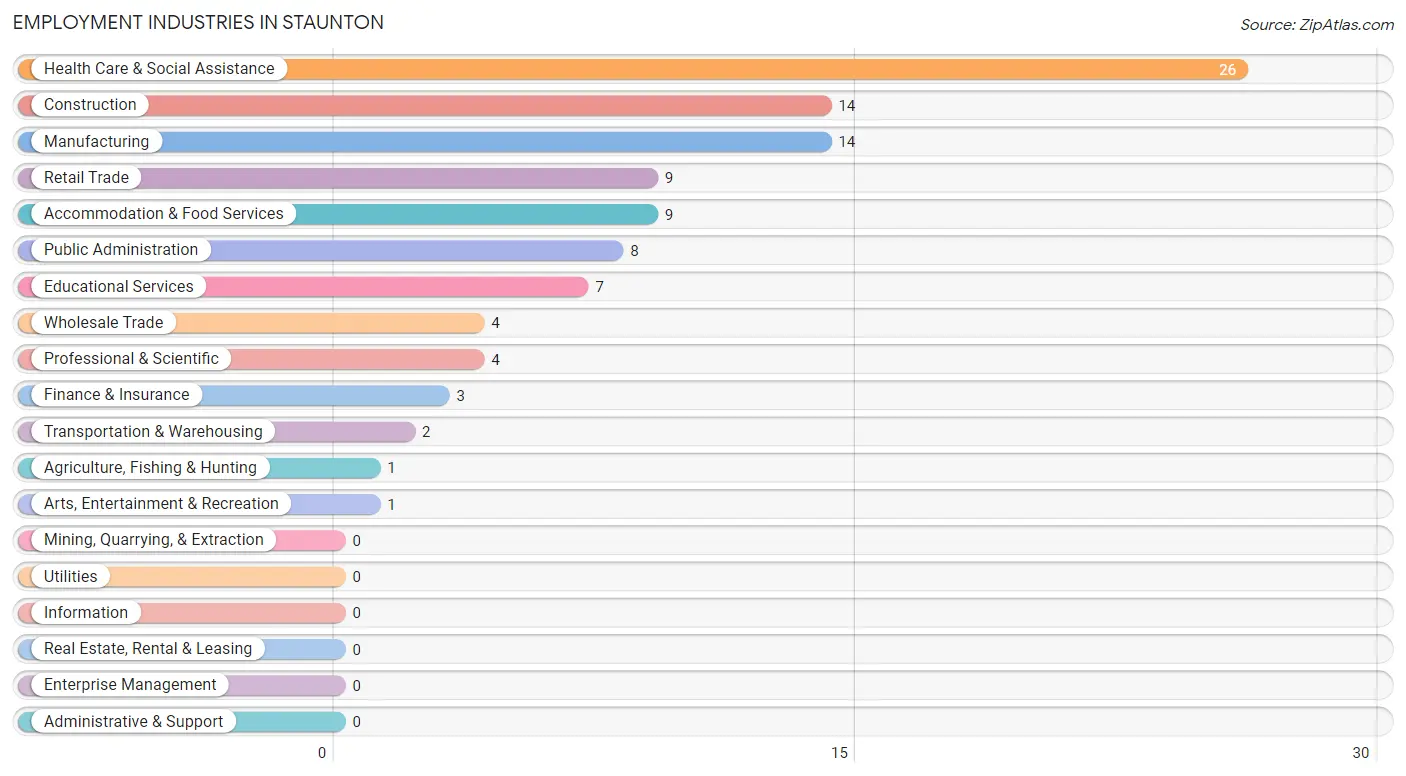
The major employment industries in Staunton include Health Care & Social Assistance (26 | 25.5%), Construction (14 | 13.7%), Manufacturing (14 | 13.7%), Retail Trade (9 | 8.8%), and Accommodation & Food Services (9 | 8.8%).
Employment Industries by Sex in Staunton
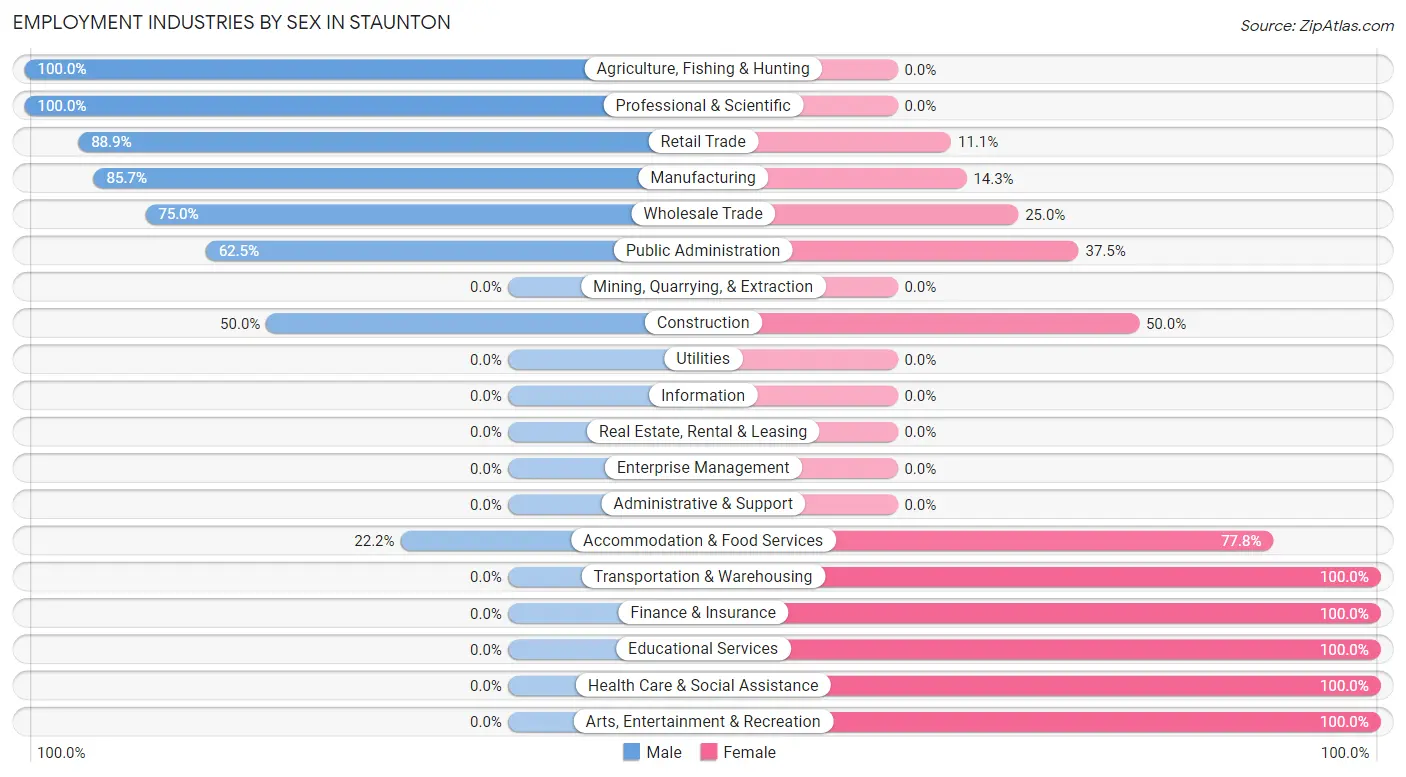
The Staunton industries that see more men than women are Agriculture, Fishing & Hunting (100.0%), Professional & Scientific (100.0%), and Retail Trade (88.9%), whereas the industries that tend to have a higher number of women are Transportation & Warehousing (100.0%), Finance & Insurance (100.0%), and Educational Services (100.0%).
| Industry | Male | Female |
| Agriculture, Fishing & Hunting | 1 (100.0%) | 0 (0.0%) |
| Mining, Quarrying, & Extraction | 0 (0.0%) | 0 (0.0%) |
| Construction | 7 (50.0%) | 7 (50.0%) |
| Manufacturing | 12 (85.7%) | 2 (14.3%) |
| Wholesale Trade | 3 (75.0%) | 1 (25.0%) |
| Retail Trade | 8 (88.9%) | 1 (11.1%) |
| Transportation & Warehousing | 0 (0.0%) | 2 (100.0%) |
| Utilities | 0 (0.0%) | 0 (0.0%) |
| Information | 0 (0.0%) | 0 (0.0%) |
| Finance & Insurance | 0 (0.0%) | 3 (100.0%) |
| Real Estate, Rental & Leasing | 0 (0.0%) | 0 (0.0%) |
| Professional & Scientific | 4 (100.0%) | 0 (0.0%) |
| Enterprise Management | 0 (0.0%) | 0 (0.0%) |
| Administrative & Support | 0 (0.0%) | 0 (0.0%) |
| Educational Services | 0 (0.0%) | 7 (100.0%) |
| Health Care & Social Assistance | 0 (0.0%) | 26 (100.0%) |
| Arts, Entertainment & Recreation | 0 (0.0%) | 1 (100.0%) |
| Accommodation & Food Services | 2 (22.2%) | 7 (77.8%) |
| Public Administration | 5 (62.5%) | 3 (37.5%) |
| Total | 42 (41.2%) | 60 (58.8%) |
Education in Staunton
School Enrollment in Staunton
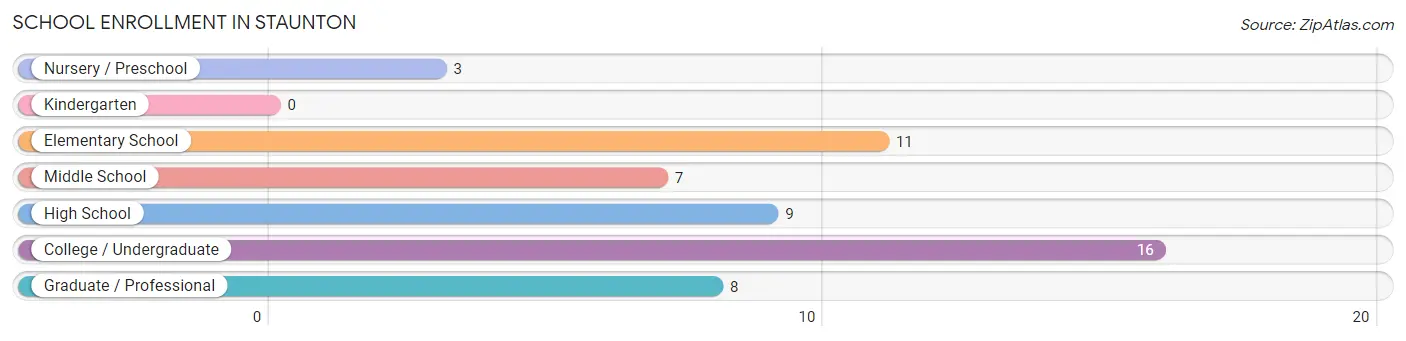
The most common levels of schooling among the 54 students in Staunton are college / undergraduate (16 | 29.6%), elementary school (11 | 20.4%), and high school (9 | 16.7%).
| School Level | # Students | % Students |
| Nursery / Preschool | 3 | 5.6% |
| Kindergarten | 0 | 0.0% |
| Elementary School | 11 | 20.4% |
| Middle School | 7 | 13.0% |
| High School | 9 | 16.7% |
| College / Undergraduate | 16 | 29.6% |
| Graduate / Professional | 8 | 14.8% |
| Total | 54 | 100.0% |
School Enrollment by Age by Funding Source in Staunton
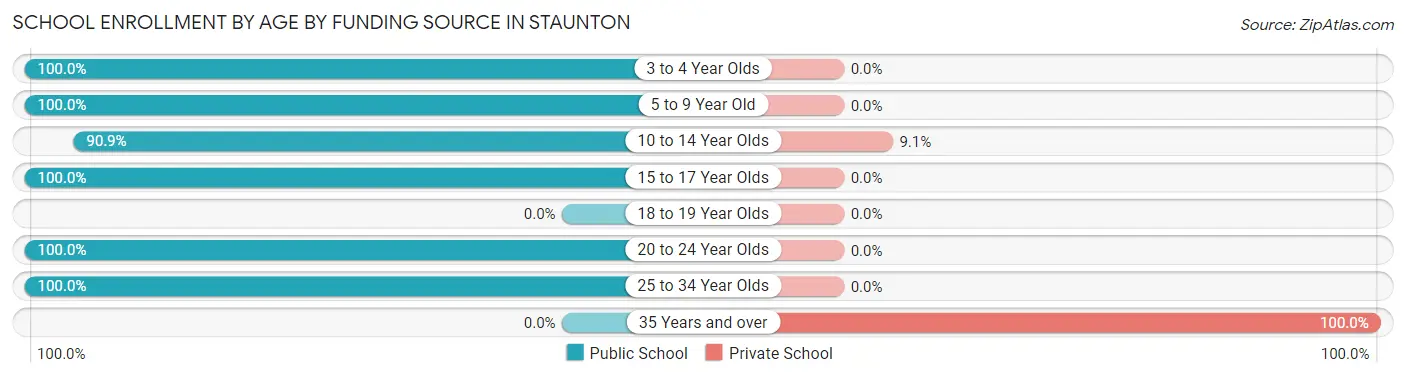
Out of a total of 54 students who are enrolled in schools in Staunton, 10 (18.5%) attend a private institution, while the remaining 44 (81.5%) are enrolled in public schools. The age group of 35 years and over has the highest likelihood of being enrolled in private schools, with 9 (100.0% in the age bracket) enrolled. Conversely, the age group of 3 to 4 year olds has the lowest likelihood of being enrolled in a private school, with 3 (100.0% in the age bracket) attending a public institution.
| Age Bracket | Public School | Private School |
| 3 to 4 Year Olds | 3 (100.0%) | 0 (0.0%) |
| 5 to 9 Year Old | 7 (100.0%) | 0 (0.0%) |
| 10 to 14 Year Olds | 10 (90.9%) | 1 (9.1%) |
| 15 to 17 Year Olds | 9 (100.0%) | 0 (0.0%) |
| 18 to 19 Year Olds | 0 (0.0%) | 0 (0.0%) |
| 20 to 24 Year Olds | 11 (100.0%) | 0 (0.0%) |
| 25 to 34 Year Olds | 4 (100.0%) | 0 (0.0%) |
| 35 Years and over | 0 (0.0%) | 9 (100.0%) |
| Total | 44 (81.5%) | 10 (18.5%) |
Educational Attainment by Field of Study in Staunton
Science & technology (8 | 47.1%), arts & humanities (5 | 29.4%), business (3 | 17.6%), and education (1 | 5.9%) are the most common fields of study among 17 individuals in Staunton who have obtained a bachelor's degree or higher.
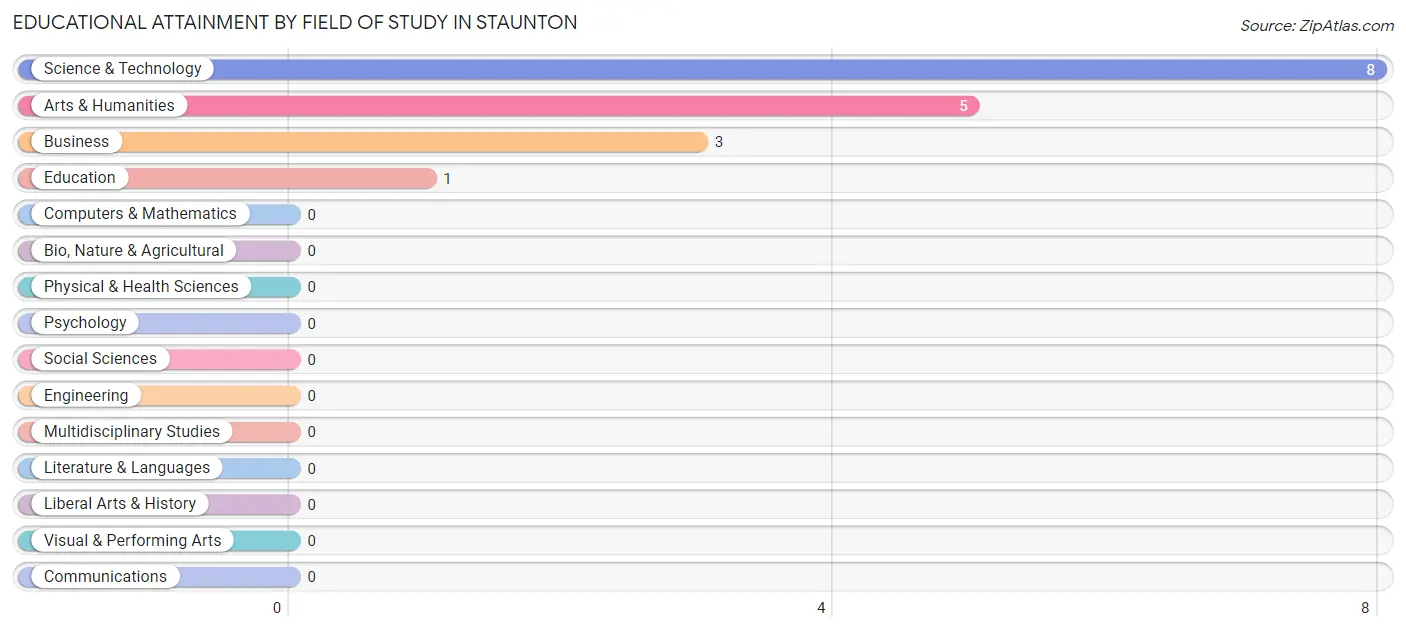
| Field of Study | # Graduates | % Graduates |
| Computers & Mathematics | 0 | 0.0% |
| Bio, Nature & Agricultural | 0 | 0.0% |
| Physical & Health Sciences | 0 | 0.0% |
| Psychology | 0 | 0.0% |
| Social Sciences | 0 | 0.0% |
| Engineering | 0 | 0.0% |
| Multidisciplinary Studies | 0 | 0.0% |
| Science & Technology | 8 | 47.1% |
| Business | 3 | 17.6% |
| Education | 1 | 5.9% |
| Literature & Languages | 0 | 0.0% |
| Liberal Arts & History | 0 | 0.0% |
| Visual & Performing Arts | 0 | 0.0% |
| Communications | 0 | 0.0% |
| Arts & Humanities | 5 | 29.4% |
| Total | 17 | 100.0% |
Transportation & Commute in Staunton
Vehicle Availability by Sex in Staunton
The most prevalent vehicle ownership categories in Staunton are males with 2 vehicles (22, accounting for 52.4%) and females with 2 vehicles (14, making up 36.7%).
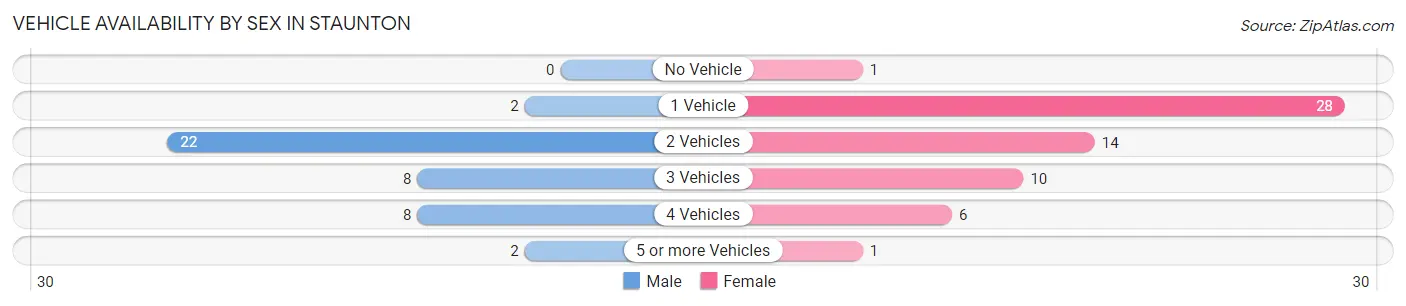
| Vehicles Available | Male | Female |
| No Vehicle | 0 (0.0%) | 1 (1.7%) |
| 1 Vehicle | 2 (4.8%) | 28 (46.7%) |
| 2 Vehicles | 22 (52.4%) | 14 (23.3%) |
| 3 Vehicles | 8 (19.1%) | 10 (16.7%) |
| 4 Vehicles | 8 (19.1%) | 6 (10.0%) |
| 5 or more Vehicles | 2 (4.8%) | 1 (1.7%) |
| Total | 42 (100.0%) | 60 (100.0%) |
Commute Time in Staunton
The most frequently occuring commute durations in Staunton are 15 to 19 minutes (35 commuters, 34.3%), 5 to 9 minutes (15 commuters, 14.7%), and 30 to 34 minutes (12 commuters, 11.8%).
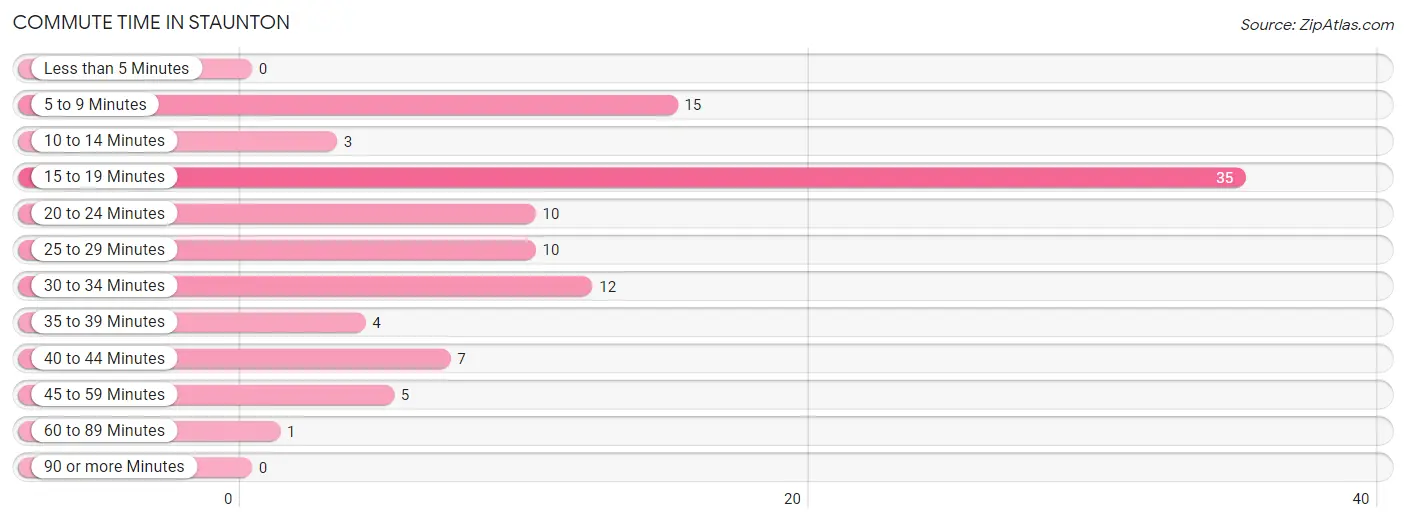
| Commute Time | # Commuters | % Commuters |
| Less than 5 Minutes | 0 | 0.0% |
| 5 to 9 Minutes | 15 | 14.7% |
| 10 to 14 Minutes | 3 | 2.9% |
| 15 to 19 Minutes | 35 | 34.3% |
| 20 to 24 Minutes | 10 | 9.8% |
| 25 to 29 Minutes | 10 | 9.8% |
| 30 to 34 Minutes | 12 | 11.8% |
| 35 to 39 Minutes | 4 | 3.9% |
| 40 to 44 Minutes | 7 | 6.9% |
| 45 to 59 Minutes | 5 | 4.9% |
| 60 to 89 Minutes | 1 | 1.0% |
| 90 or more Minutes | 0 | 0.0% |
Commute Time by Sex in Staunton
The most common commute times in Staunton are 15 to 19 minutes (13 commuters, 30.9%) for males and 15 to 19 minutes (22 commuters, 36.7%) for females.
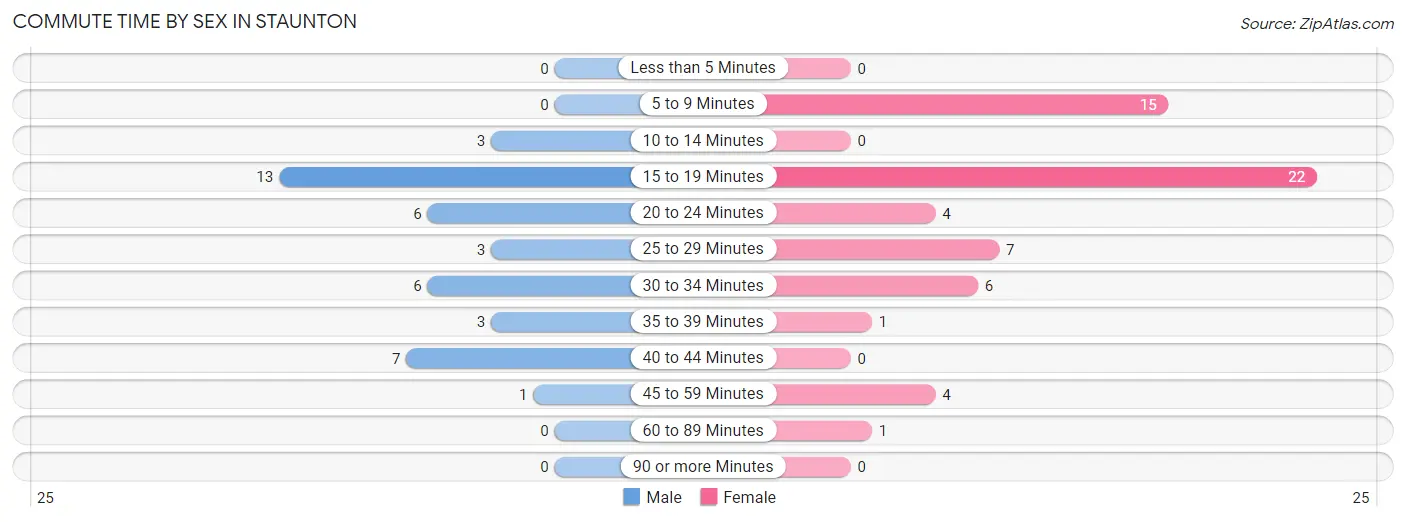
| Commute Time | Male | Female |
| Less than 5 Minutes | 0 (0.0%) | 0 (0.0%) |
| 5 to 9 Minutes | 0 (0.0%) | 15 (25.0%) |
| 10 to 14 Minutes | 3 (7.1%) | 0 (0.0%) |
| 15 to 19 Minutes | 13 (30.9%) | 22 (36.7%) |
| 20 to 24 Minutes | 6 (14.3%) | 4 (6.7%) |
| 25 to 29 Minutes | 3 (7.1%) | 7 (11.7%) |
| 30 to 34 Minutes | 6 (14.3%) | 6 (10.0%) |
| 35 to 39 Minutes | 3 (7.1%) | 1 (1.7%) |
| 40 to 44 Minutes | 7 (16.7%) | 0 (0.0%) |
| 45 to 59 Minutes | 1 (2.4%) | 4 (6.7%) |
| 60 to 89 Minutes | 0 (0.0%) | 1 (1.7%) |
| 90 or more Minutes | 0 (0.0%) | 0 (0.0%) |
Time of Departure to Work by Sex in Staunton
The most frequent times of departure to work in Staunton are 12:00 AM to 4:59 AM (7, 16.7%) for males and 7:00 AM to 7:29 AM (37, 61.7%) for females.
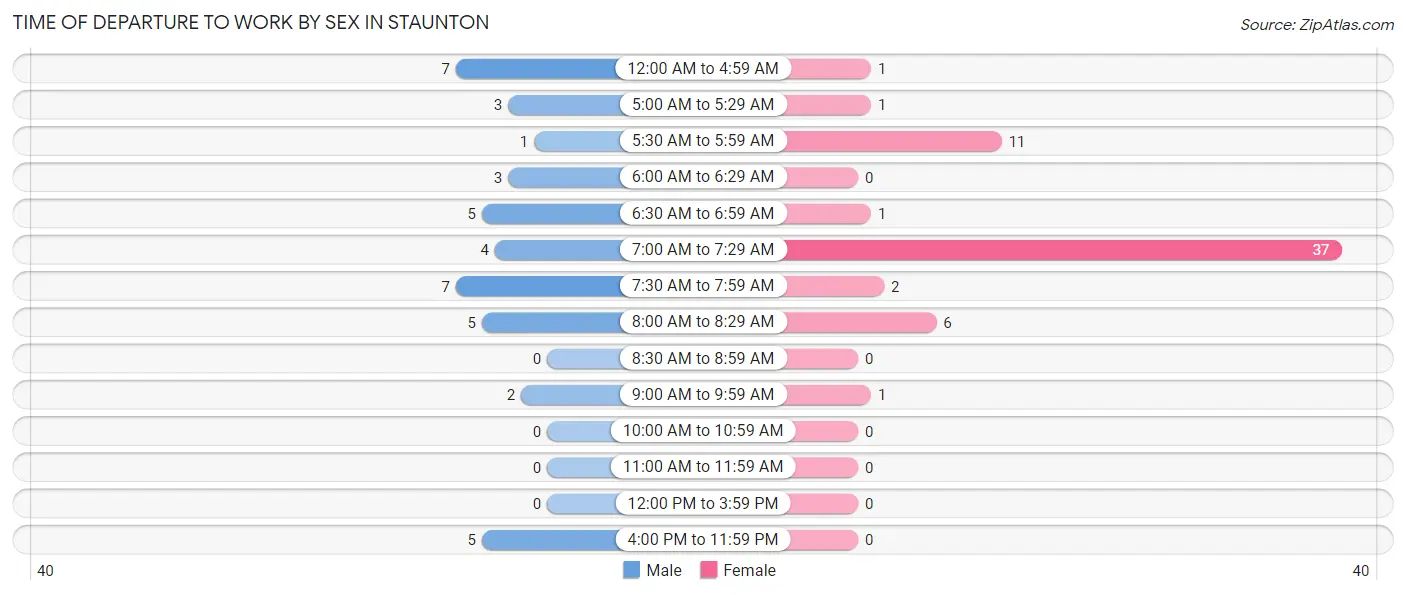
| Time of Departure | Male | Female |
| 12:00 AM to 4:59 AM | 7 (16.7%) | 1 (1.7%) |
| 5:00 AM to 5:29 AM | 3 (7.1%) | 1 (1.7%) |
| 5:30 AM to 5:59 AM | 1 (2.4%) | 11 (18.3%) |
| 6:00 AM to 6:29 AM | 3 (7.1%) | 0 (0.0%) |
| 6:30 AM to 6:59 AM | 5 (11.9%) | 1 (1.7%) |
| 7:00 AM to 7:29 AM | 4 (9.5%) | 37 (61.7%) |
| 7:30 AM to 7:59 AM | 7 (16.7%) | 2 (3.3%) |
| 8:00 AM to 8:29 AM | 5 (11.9%) | 6 (10.0%) |
| 8:30 AM to 8:59 AM | 0 (0.0%) | 0 (0.0%) |
| 9:00 AM to 9:59 AM | 2 (4.8%) | 1 (1.7%) |
| 10:00 AM to 10:59 AM | 0 (0.0%) | 0 (0.0%) |
| 11:00 AM to 11:59 AM | 0 (0.0%) | 0 (0.0%) |
| 12:00 PM to 3:59 PM | 0 (0.0%) | 0 (0.0%) |
| 4:00 PM to 11:59 PM | 5 (11.9%) | 0 (0.0%) |
| Total | 42 (100.0%) | 60 (100.0%) |
Housing Occupancy in Staunton
Occupancy by Ownership in Staunton
Of the total 101 dwellings in Staunton, owner-occupied units account for 74 (73.3%), while renter-occupied units make up 27 (26.7%).
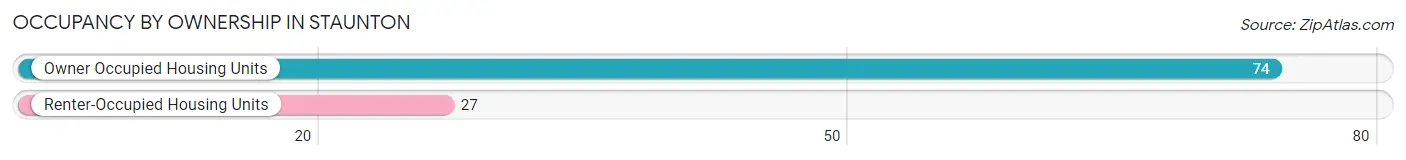
| Occupancy | # Housing Units | % Housing Units |
| Owner Occupied Housing Units | 74 | 73.3% |
| Renter-Occupied Housing Units | 27 | 26.7% |
| Total Occupied Housing Units | 101 | 100.0% |
Occupancy by Household Size in Staunton
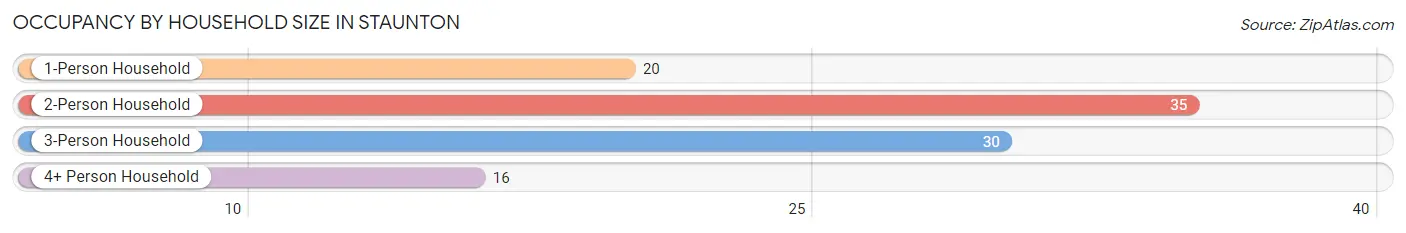
| Household Size | # Housing Units | % Housing Units |
| 1-Person Household | 20 | 19.8% |
| 2-Person Household | 35 | 34.6% |
| 3-Person Household | 30 | 29.7% |
| 4+ Person Household | 16 | 15.8% |
| Total Housing Units | 101 | 100.0% |
Occupancy by Ownership by Household Size in Staunton
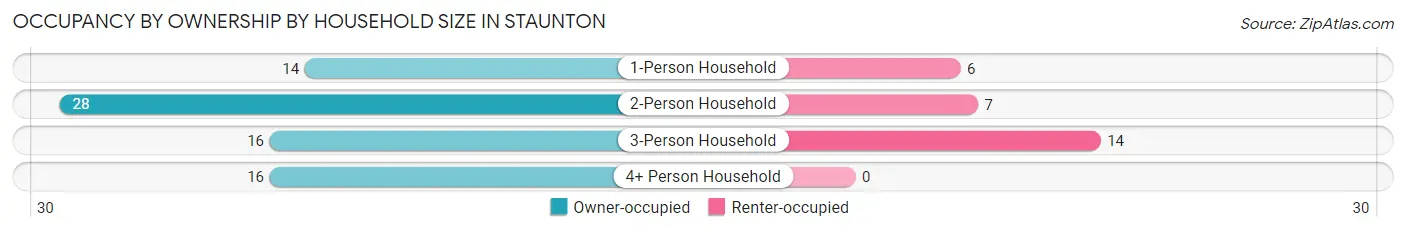
| Household Size | Owner-occupied | Renter-occupied |
| 1-Person Household | 14 (70.0%) | 6 (30.0%) |
| 2-Person Household | 28 (80.0%) | 7 (20.0%) |
| 3-Person Household | 16 (53.3%) | 14 (46.7%) |
| 4+ Person Household | 16 (100.0%) | 0 (0.0%) |
| Total Housing Units | 74 (73.3%) | 27 (26.7%) |
Occupancy by Educational Attainment in Staunton
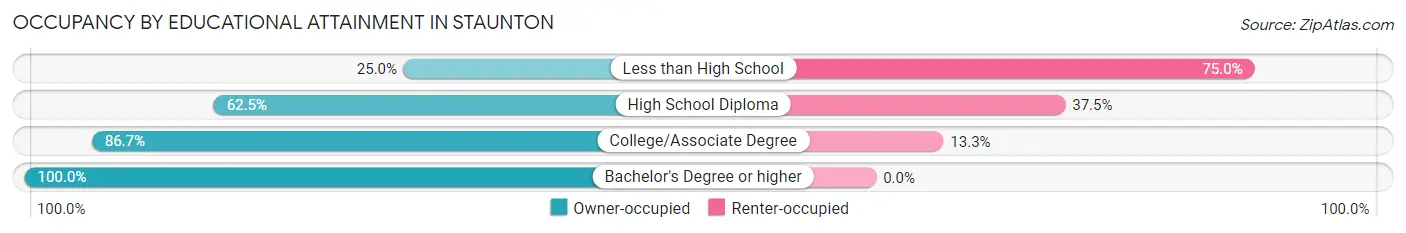
| Household Size | Owner-occupied | Renter-occupied |
| Less than High School | 2 (25.0%) | 6 (75.0%) |
| High School Diploma | 25 (62.5%) | 15 (37.5%) |
| College/Associate Degree | 39 (86.7%) | 6 (13.3%) |
| Bachelor's Degree or higher | 8 (100.0%) | 0 (0.0%) |
Occupancy by Age of Householder in Staunton
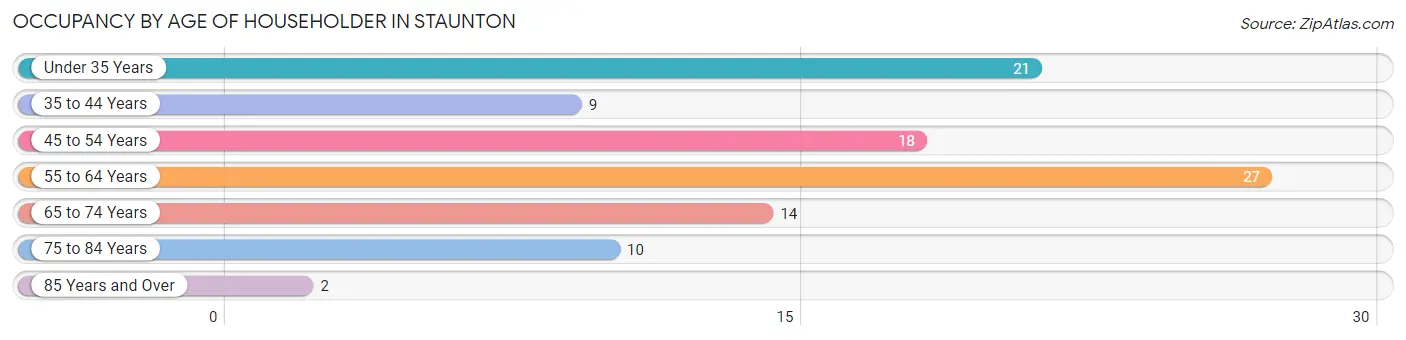
| Age Bracket | # Households | % Households |
| Under 35 Years | 21 | 20.8% |
| 35 to 44 Years | 9 | 8.9% |
| 45 to 54 Years | 18 | 17.8% |
| 55 to 64 Years | 27 | 26.7% |
| 65 to 74 Years | 14 | 13.9% |
| 75 to 84 Years | 10 | 9.9% |
| 85 Years and Over | 2 | 2.0% |
| Total | 101 | 100.0% |
Housing Finances in Staunton
Median Income by Occupancy in Staunton
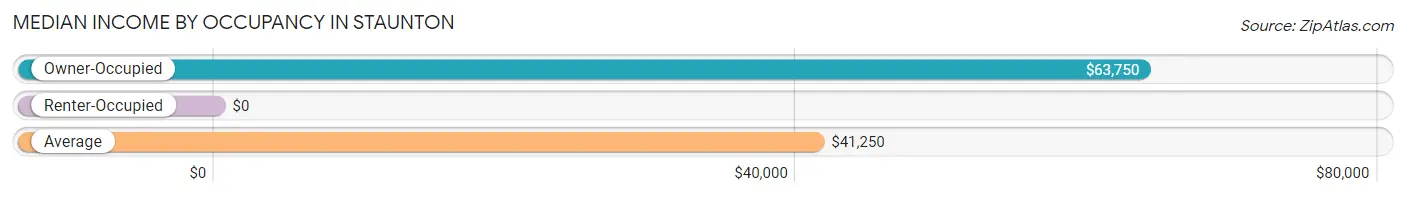
| Occupancy Type | # Households | Median Income |
| Owner-Occupied | 74 (73.3%) | $63,750 |
| Renter-Occupied | 27 (26.7%) | $0 |
| Average | 101 (100.0%) | $41,250 |
Occupancy by Householder Income Bracket in Staunton
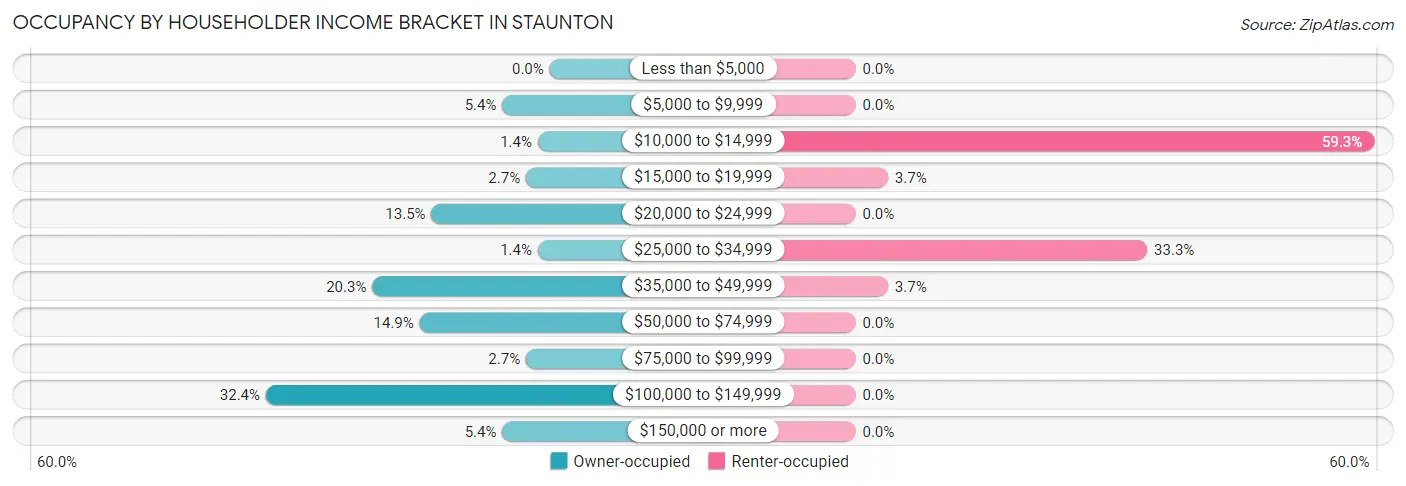
| Income Bracket | Owner-occupied | Renter-occupied |
| Less than $5,000 | 0 (0.0%) | 0 (0.0%) |
| $5,000 to $9,999 | 4 (5.4%) | 0 (0.0%) |
| $10,000 to $14,999 | 1 (1.3%) | 16 (59.3%) |
| $15,000 to $19,999 | 2 (2.7%) | 1 (3.7%) |
| $20,000 to $24,999 | 10 (13.5%) | 0 (0.0%) |
| $25,000 to $34,999 | 1 (1.3%) | 9 (33.3%) |
| $35,000 to $49,999 | 15 (20.3%) | 1 (3.7%) |
| $50,000 to $74,999 | 11 (14.9%) | 0 (0.0%) |
| $75,000 to $99,999 | 2 (2.7%) | 0 (0.0%) |
| $100,000 to $149,999 | 24 (32.4%) | 0 (0.0%) |
| $150,000 or more | 4 (5.4%) | 0 (0.0%) |
| Total | 74 (100.0%) | 27 (100.0%) |
Monthly Housing Cost Tiers in Staunton
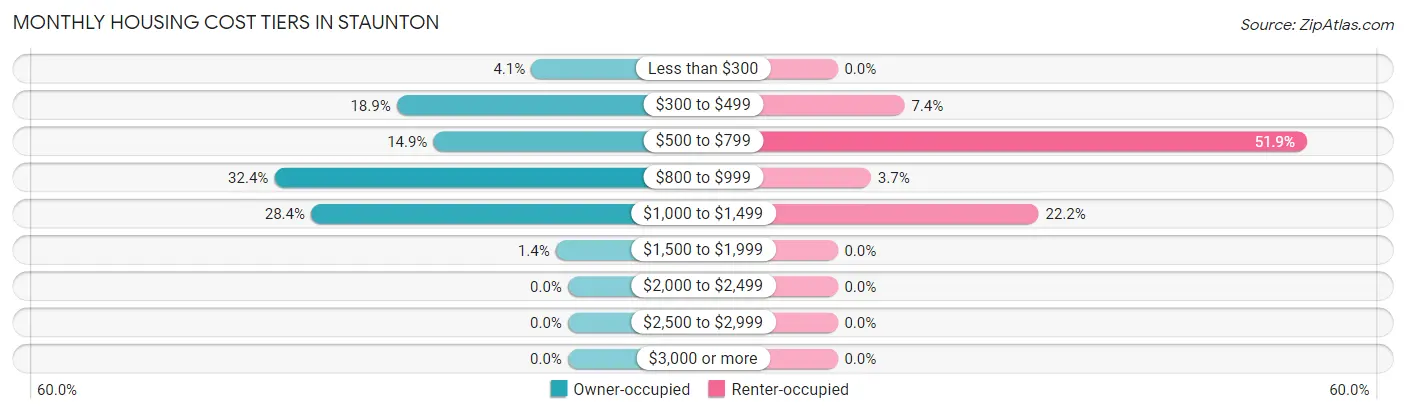
| Monthly Cost | Owner-occupied | Renter-occupied |
| Less than $300 | 3 (4.1%) | 0 (0.0%) |
| $300 to $499 | 14 (18.9%) | 2 (7.4%) |
| $500 to $799 | 11 (14.9%) | 14 (51.8%) |
| $800 to $999 | 24 (32.4%) | 1 (3.7%) |
| $1,000 to $1,499 | 21 (28.4%) | 6 (22.2%) |
| $1,500 to $1,999 | 1 (1.3%) | 0 (0.0%) |
| $2,000 to $2,499 | 0 (0.0%) | 0 (0.0%) |
| $2,500 to $2,999 | 0 (0.0%) | 0 (0.0%) |
| $3,000 or more | 0 (0.0%) | 0 (0.0%) |
| Total | 74 (100.0%) | 27 (100.0%) |
Physical Housing Characteristics in Staunton
Housing Structures in Staunton
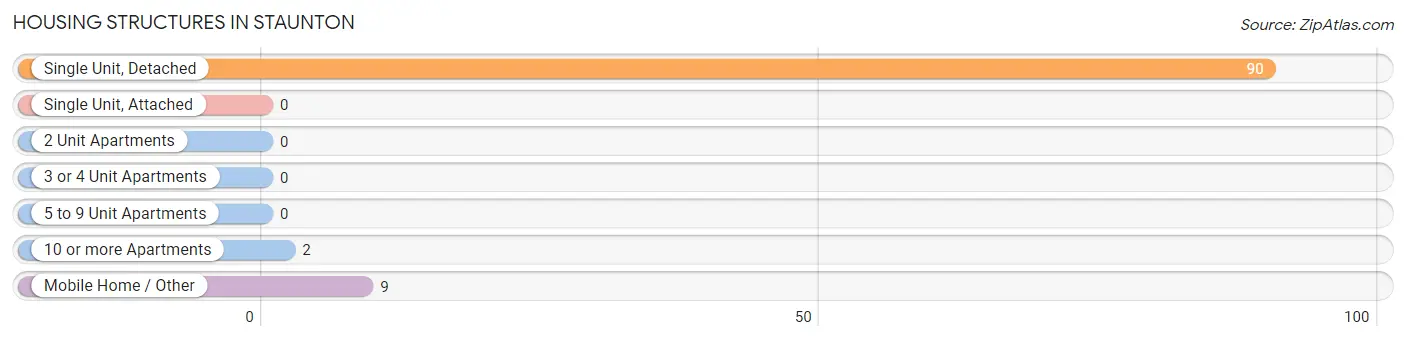
| Structure Type | # Housing Units | % Housing Units |
| Single Unit, Detached | 90 | 89.1% |
| Single Unit, Attached | 0 | 0.0% |
| 2 Unit Apartments | 0 | 0.0% |
| 3 or 4 Unit Apartments | 0 | 0.0% |
| 5 to 9 Unit Apartments | 0 | 0.0% |
| 10 or more Apartments | 2 | 2.0% |
| Mobile Home / Other | 9 | 8.9% |
| Total | 101 | 100.0% |
Housing Structures by Occupancy in Staunton
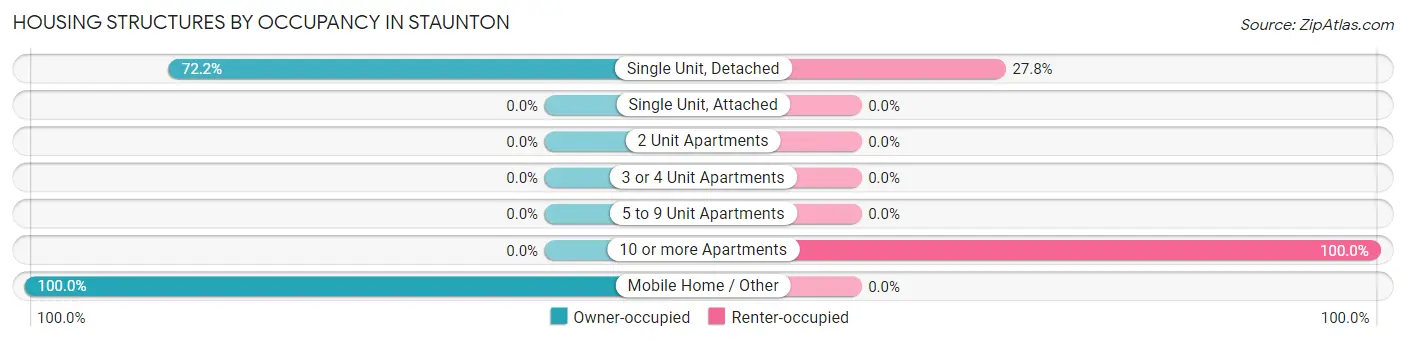
| Structure Type | Owner-occupied | Renter-occupied |
| Single Unit, Detached | 65 (72.2%) | 25 (27.8%) |
| Single Unit, Attached | 0 (0.0%) | 0 (0.0%) |
| 2 Unit Apartments | 0 (0.0%) | 0 (0.0%) |
| 3 or 4 Unit Apartments | 0 (0.0%) | 0 (0.0%) |
| 5 to 9 Unit Apartments | 0 (0.0%) | 0 (0.0%) |
| 10 or more Apartments | 0 (0.0%) | 2 (100.0%) |
| Mobile Home / Other | 9 (100.0%) | 0 (0.0%) |
| Total | 74 (73.3%) | 27 (26.7%) |
Housing Structures by Number of Rooms in Staunton
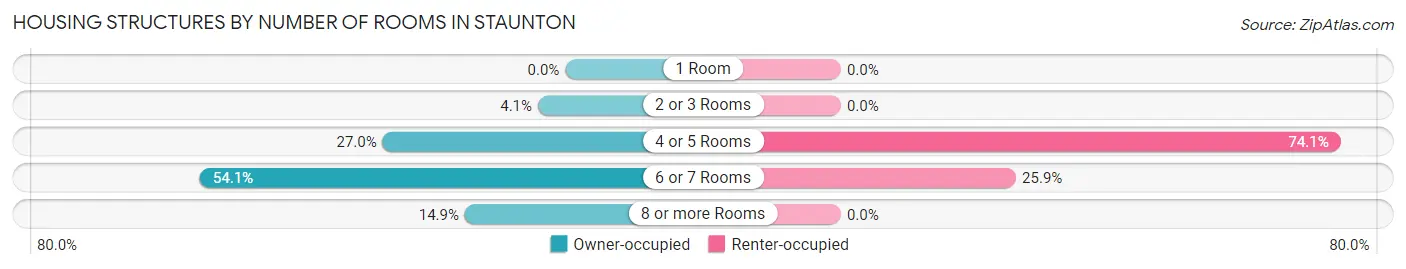
| Number of Rooms | Owner-occupied | Renter-occupied |
| 1 Room | 0 (0.0%) | 0 (0.0%) |
| 2 or 3 Rooms | 3 (4.1%) | 0 (0.0%) |
| 4 or 5 Rooms | 20 (27.0%) | 20 (74.1%) |
| 6 or 7 Rooms | 40 (54.0%) | 7 (25.9%) |
| 8 or more Rooms | 11 (14.9%) | 0 (0.0%) |
| Total | 74 (100.0%) | 27 (100.0%) |
Housing Structure by Heating Type in Staunton
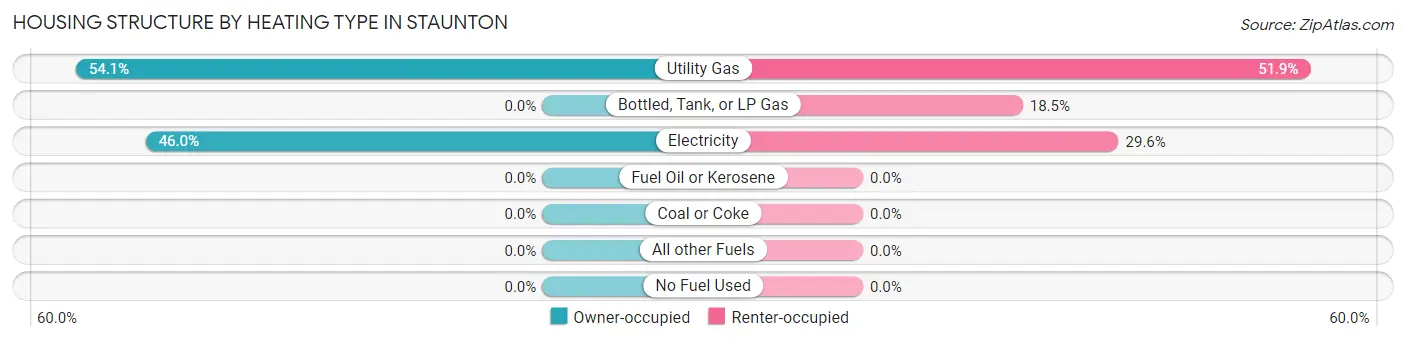
| Heating Type | Owner-occupied | Renter-occupied |
| Utility Gas | 40 (54.0%) | 14 (51.8%) |
| Bottled, Tank, or LP Gas | 0 (0.0%) | 5 (18.5%) |
| Electricity | 34 (46.0%) | 8 (29.6%) |
| Fuel Oil or Kerosene | 0 (0.0%) | 0 (0.0%) |
| Coal or Coke | 0 (0.0%) | 0 (0.0%) |
| All other Fuels | 0 (0.0%) | 0 (0.0%) |
| No Fuel Used | 0 (0.0%) | 0 (0.0%) |
| Total | 74 (100.0%) | 27 (100.0%) |
Household Vehicle Usage in Staunton
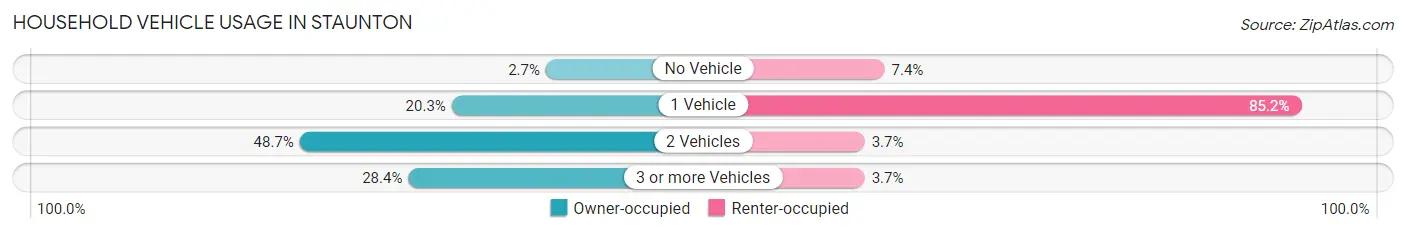
| Vehicles per Household | Owner-occupied | Renter-occupied |
| No Vehicle | 2 (2.7%) | 2 (7.4%) |
| 1 Vehicle | 15 (20.3%) | 23 (85.2%) |
| 2 Vehicles | 36 (48.6%) | 1 (3.7%) |
| 3 or more Vehicles | 21 (28.4%) | 1 (3.7%) |
| Total | 74 (100.0%) | 27 (100.0%) |
Real Estate & Mortgages in Staunton
Real Estate and Mortgage Overview in Staunton
| Characteristic | Without Mortgage | With Mortgage |
| Housing Units | 20 | 54 |
| Median Property Value | $70,000 | $95,500 |
| Median Household Income | - | - |
| Monthly Housing Costs | $394 | $0 |
| Real Estate Taxes | $400 | $6 |
Property Value by Mortgage Status in Staunton
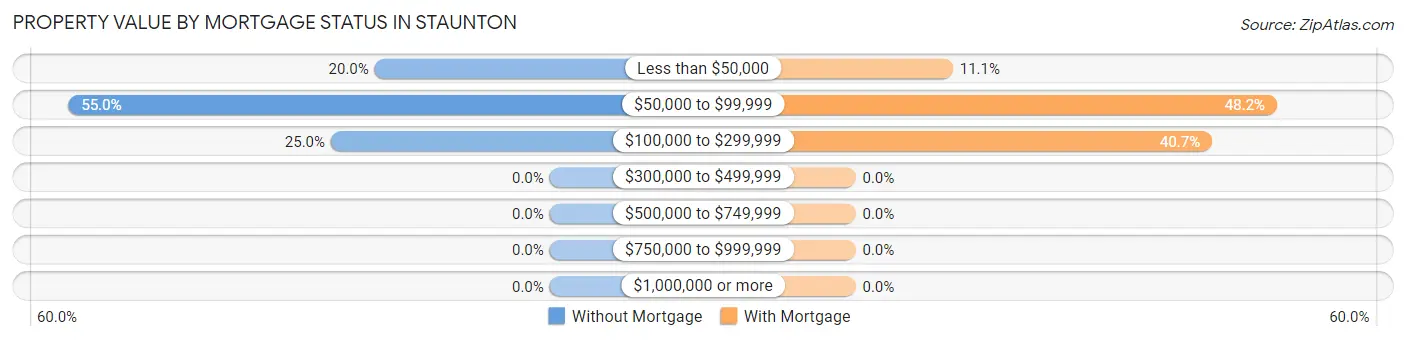
| Property Value | Without Mortgage | With Mortgage |
| Less than $50,000 | 4 (20.0%) | 6 (11.1%) |
| $50,000 to $99,999 | 11 (55.0%) | 26 (48.1%) |
| $100,000 to $299,999 | 5 (25.0%) | 22 (40.7%) |
| $300,000 to $499,999 | 0 (0.0%) | 0 (0.0%) |
| $500,000 to $749,999 | 0 (0.0%) | 0 (0.0%) |
| $750,000 to $999,999 | 0 (0.0%) | 0 (0.0%) |
| $1,000,000 or more | 0 (0.0%) | 0 (0.0%) |
| Total | 20 (100.0%) | 54 (100.0%) |
Household Income by Mortgage Status in Staunton
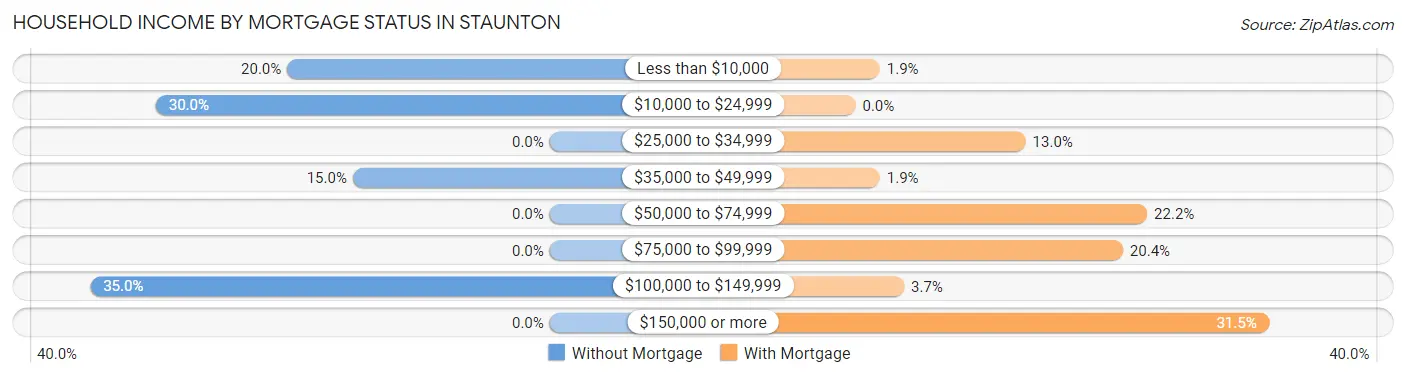
| Household Income | Without Mortgage | With Mortgage |
| Less than $10,000 | 4 (20.0%) | 1 (1.8%) |
| $10,000 to $24,999 | 6 (30.0%) | 0 (0.0%) |
| $25,000 to $34,999 | 0 (0.0%) | 7 (13.0%) |
| $35,000 to $49,999 | 3 (15.0%) | 1 (1.8%) |
| $50,000 to $74,999 | 0 (0.0%) | 12 (22.2%) |
| $75,000 to $99,999 | 0 (0.0%) | 11 (20.4%) |
| $100,000 to $149,999 | 7 (35.0%) | 2 (3.7%) |
| $150,000 or more | 0 (0.0%) | 17 (31.5%) |
| Total | 20 (100.0%) | 54 (100.0%) |
Property Value to Household Income Ratio in Staunton
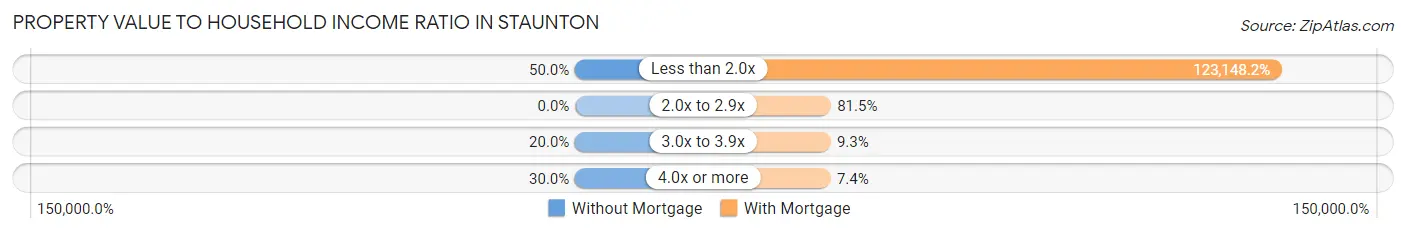
| Value-to-Income Ratio | Without Mortgage | With Mortgage |
| Less than 2.0x | 10 (50.0%) | 66,500 (123,148.2%) |
| 2.0x to 2.9x | 0 (0.0%) | 44 (81.5%) |
| 3.0x to 3.9x | 4 (20.0%) | 5 (9.3%) |
| 4.0x or more | 6 (30.0%) | 4 (7.4%) |
| Total | 20 (100.0%) | 54 (100.0%) |
Real Estate Taxes by Mortgage Status in Staunton
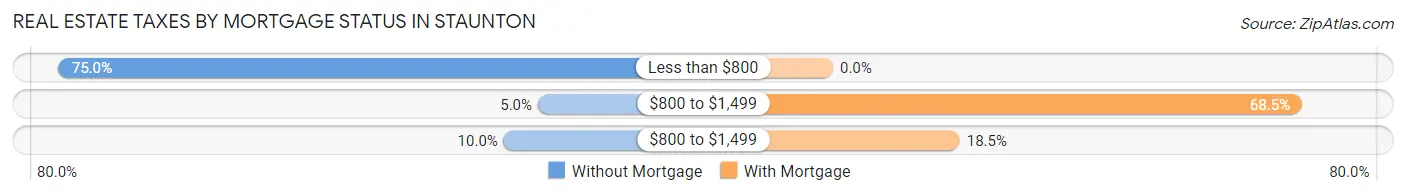
| Property Taxes | Without Mortgage | With Mortgage |
| Less than $800 | 15 (75.0%) | 0 (0.0%) |
| $800 to $1,499 | 1 (5.0%) | 37 (68.5%) |
| $800 to $1,499 | 2 (10.0%) | 10 (18.5%) |
| Total | 20 (100.0%) | 54 (100.0%) |
Health & Disability in Staunton
Health Insurance Coverage by Age in Staunton
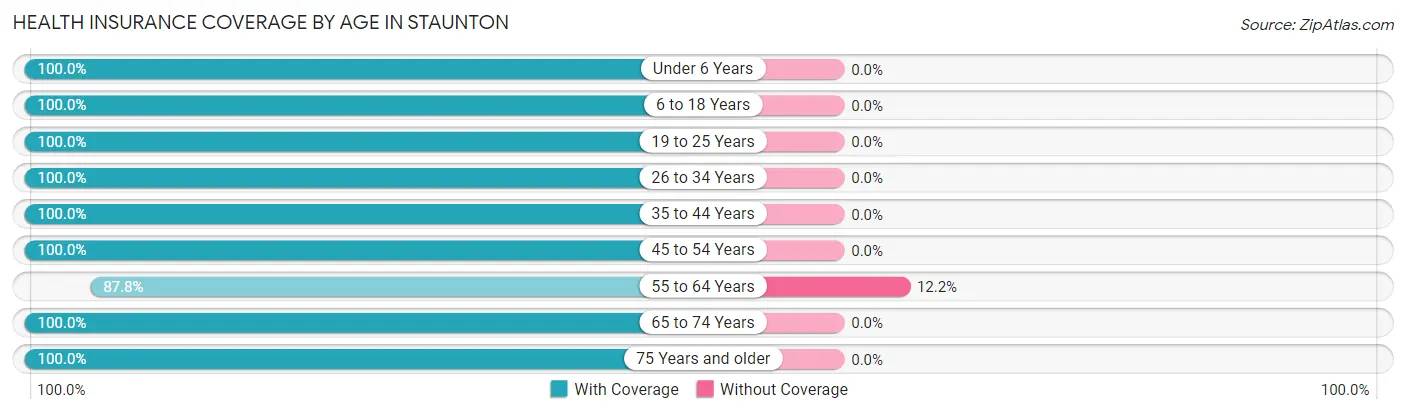
| Age Bracket | With Coverage | Without Coverage |
| Under 6 Years | 37 (100.0%) | 0 (0.0%) |
| 6 to 18 Years | 32 (100.0%) | 0 (0.0%) |
| 19 to 25 Years | 18 (100.0%) | 0 (0.0%) |
| 26 to 34 Years | 36 (100.0%) | 0 (0.0%) |
| 35 to 44 Years | 17 (100.0%) | 0 (0.0%) |
| 45 to 54 Years | 32 (100.0%) | 0 (0.0%) |
| 55 to 64 Years | 43 (87.8%) | 6 (12.2%) |
| 65 to 74 Years | 20 (100.0%) | 0 (0.0%) |
| 75 Years and older | 21 (100.0%) | 0 (0.0%) |
| Total | 256 (97.7%) | 6 (2.3%) |
Health Insurance Coverage by Citizenship Status in Staunton
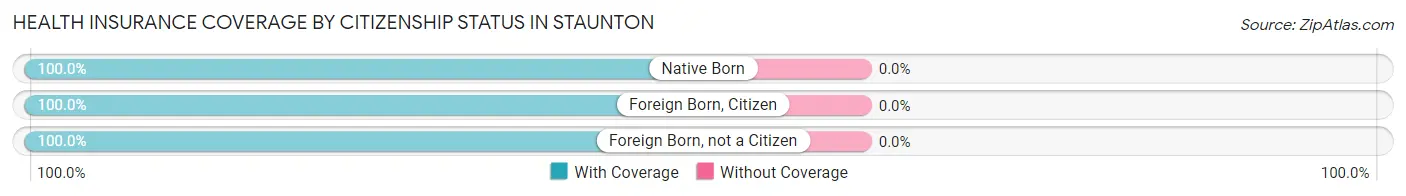
| Citizenship Status | With Coverage | Without Coverage |
| Native Born | 37 (100.0%) | 0 (0.0%) |
| Foreign Born, Citizen | 32 (100.0%) | 0 (0.0%) |
| Foreign Born, not a Citizen | 18 (100.0%) | 0 (0.0%) |
Health Insurance Coverage by Household Income in Staunton
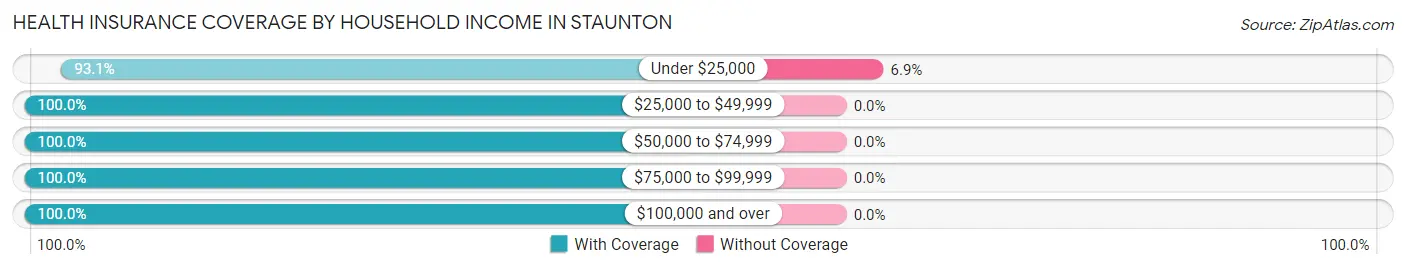
| Household Income | With Coverage | Without Coverage |
| Under $25,000 | 81 (93.1%) | 6 (6.9%) |
| $25,000 to $49,999 | 46 (100.0%) | 0 (0.0%) |
| $50,000 to $74,999 | 32 (100.0%) | 0 (0.0%) |
| $75,000 to $99,999 | 8 (100.0%) | 0 (0.0%) |
| $100,000 and over | 89 (100.0%) | 0 (0.0%) |
Public vs Private Health Insurance Coverage by Age in Staunton
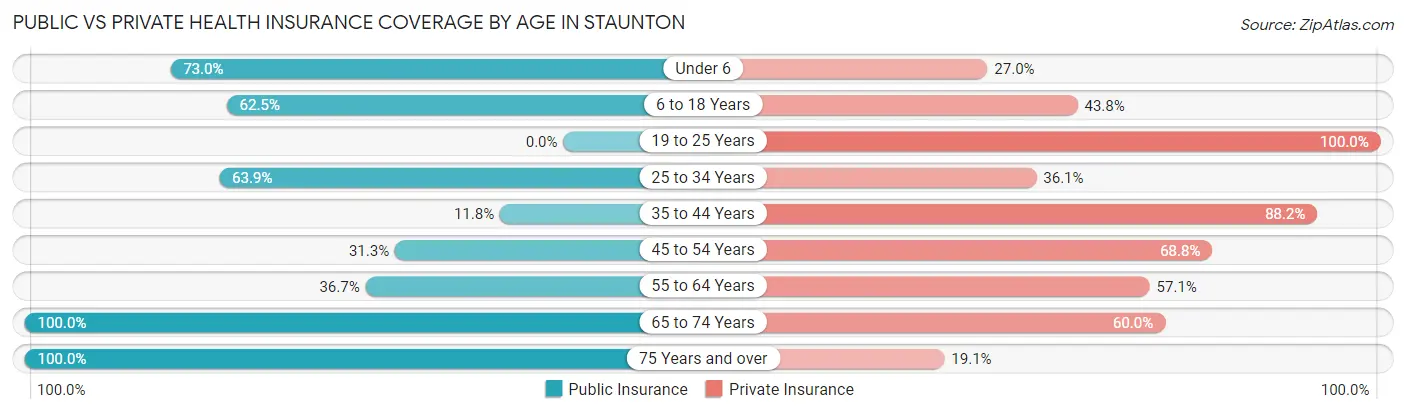
| Age Bracket | Public Insurance | Private Insurance |
| Under 6 | 27 (73.0%) | 10 (27.0%) |
| 6 to 18 Years | 20 (62.5%) | 14 (43.8%) |
| 19 to 25 Years | 0 (0.0%) | 18 (100.0%) |
| 25 to 34 Years | 23 (63.9%) | 13 (36.1%) |
| 35 to 44 Years | 2 (11.8%) | 15 (88.2%) |
| 45 to 54 Years | 10 (31.2%) | 22 (68.8%) |
| 55 to 64 Years | 18 (36.7%) | 28 (57.1%) |
| 65 to 74 Years | 20 (100.0%) | 12 (60.0%) |
| 75 Years and over | 21 (100.0%) | 4 (19.1%) |
| Total | 141 (53.8%) | 136 (51.9%) |
Disability Status by Sex by Age in Staunton
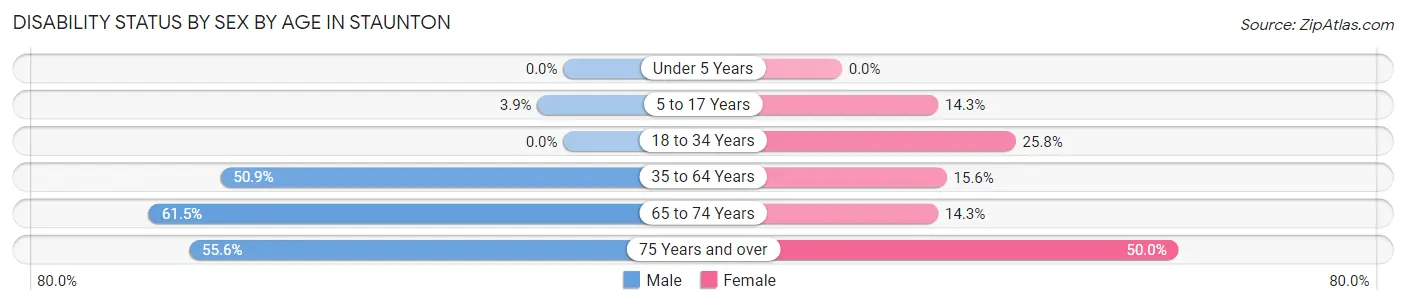
| Age Bracket | Male | Female |
| Under 5 Years | 0 (0.0%) | 0 (0.0%) |
| 5 to 17 Years | 1 (3.8%) | 2 (14.3%) |
| 18 to 34 Years | 0 (0.0%) | 8 (25.8%) |
| 35 to 64 Years | 27 (50.9%) | 7 (15.6%) |
| 65 to 74 Years | 8 (61.5%) | 1 (14.3%) |
| 75 Years and over | 5 (55.6%) | 6 (50.0%) |
Disability Class by Sex by Age in Staunton
Disability Class: Hearing Difficulty
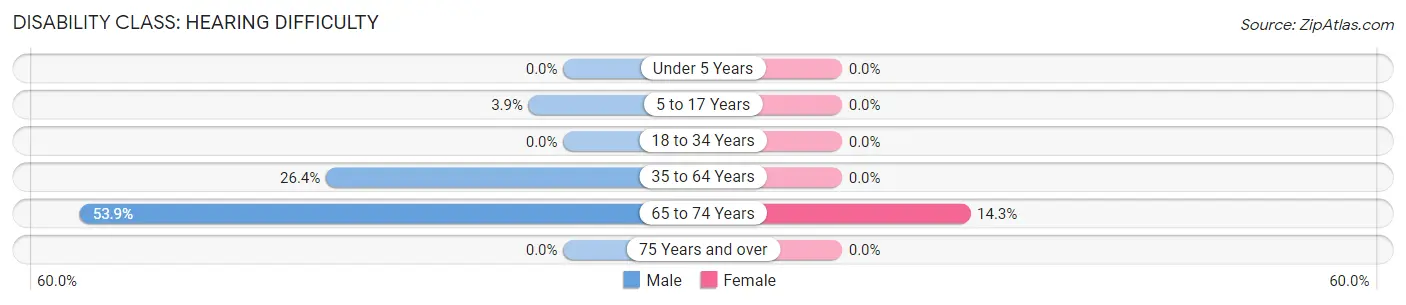
| Age Bracket | Male | Female |
| Under 5 Years | 0 (0.0%) | 0 (0.0%) |
| 5 to 17 Years | 1 (3.8%) | 0 (0.0%) |
| 18 to 34 Years | 0 (0.0%) | 0 (0.0%) |
| 35 to 64 Years | 14 (26.4%) | 0 (0.0%) |
| 65 to 74 Years | 7 (53.8%) | 1 (14.3%) |
| 75 Years and over | 0 (0.0%) | 0 (0.0%) |
Disability Class: Vision Difficulty
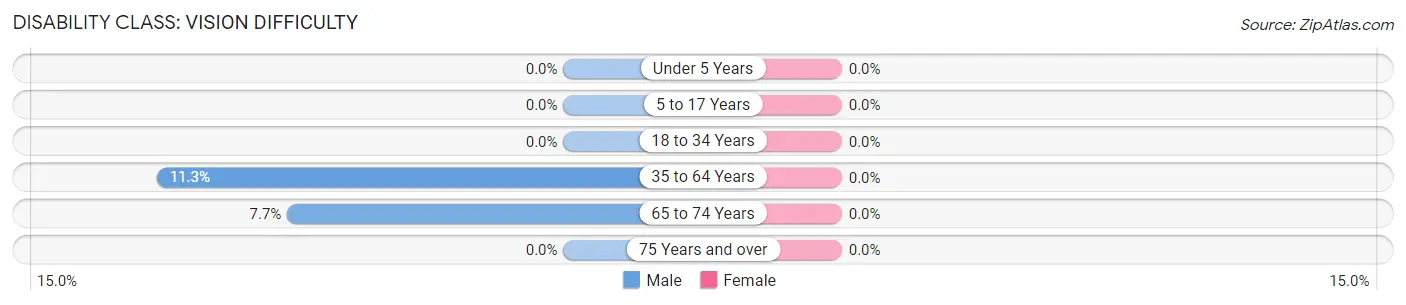
| Age Bracket | Male | Female |
| Under 5 Years | 0 (0.0%) | 0 (0.0%) |
| 5 to 17 Years | 0 (0.0%) | 0 (0.0%) |
| 18 to 34 Years | 0 (0.0%) | 0 (0.0%) |
| 35 to 64 Years | 6 (11.3%) | 0 (0.0%) |
| 65 to 74 Years | 1 (7.7%) | 0 (0.0%) |
| 75 Years and over | 0 (0.0%) | 0 (0.0%) |
Disability Class: Cognitive Difficulty
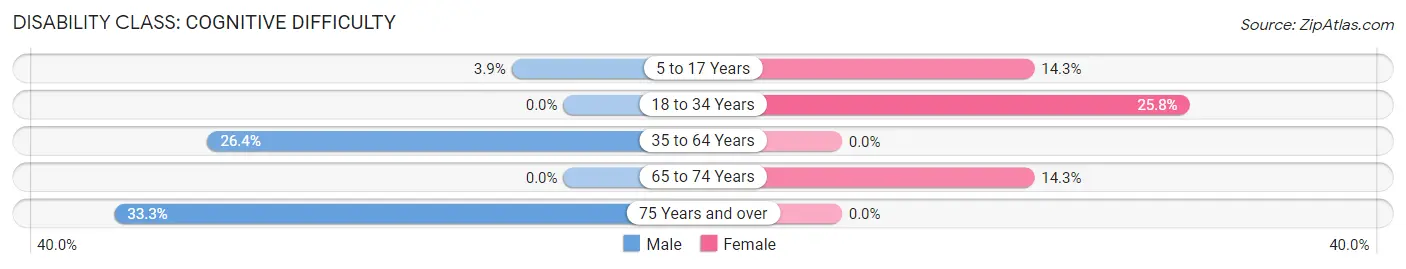
| Age Bracket | Male | Female |
| 5 to 17 Years | 1 (3.8%) | 2 (14.3%) |
| 18 to 34 Years | 0 (0.0%) | 8 (25.8%) |
| 35 to 64 Years | 14 (26.4%) | 0 (0.0%) |
| 65 to 74 Years | 0 (0.0%) | 1 (14.3%) |
| 75 Years and over | 3 (33.3%) | 0 (0.0%) |
Disability Class: Ambulatory Difficulty
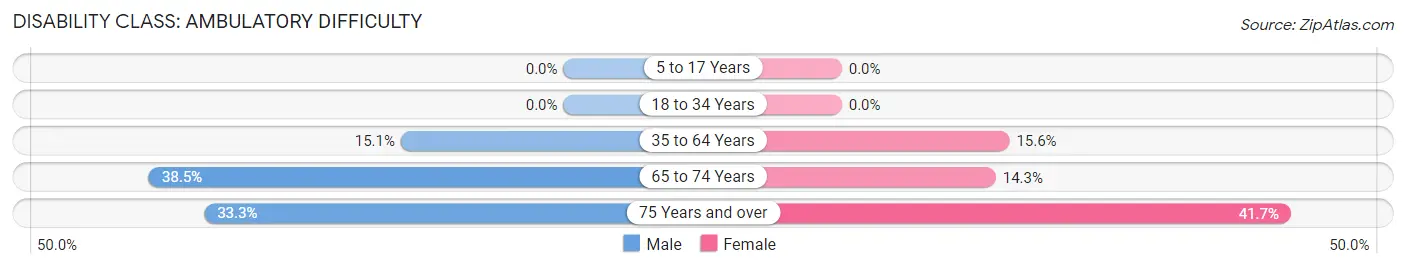
| Age Bracket | Male | Female |
| 5 to 17 Years | 0 (0.0%) | 0 (0.0%) |
| 18 to 34 Years | 0 (0.0%) | 0 (0.0%) |
| 35 to 64 Years | 8 (15.1%) | 7 (15.6%) |
| 65 to 74 Years | 5 (38.5%) | 1 (14.3%) |
| 75 Years and over | 3 (33.3%) | 5 (41.7%) |
Disability Class: Self-Care Difficulty
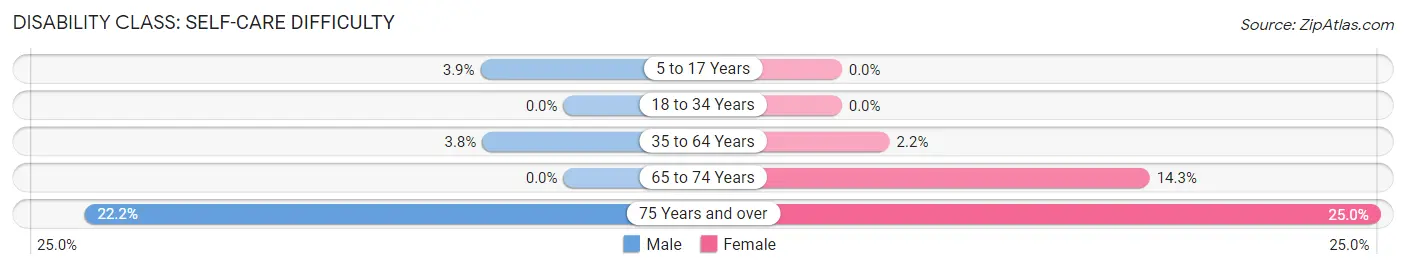
| Age Bracket | Male | Female |
| 5 to 17 Years | 1 (3.8%) | 0 (0.0%) |
| 18 to 34 Years | 0 (0.0%) | 0 (0.0%) |
| 35 to 64 Years | 2 (3.8%) | 1 (2.2%) |
| 65 to 74 Years | 0 (0.0%) | 1 (14.3%) |
| 75 Years and over | 2 (22.2%) | 3 (25.0%) |
Technology Access in Staunton
Computing Device Access in Staunton
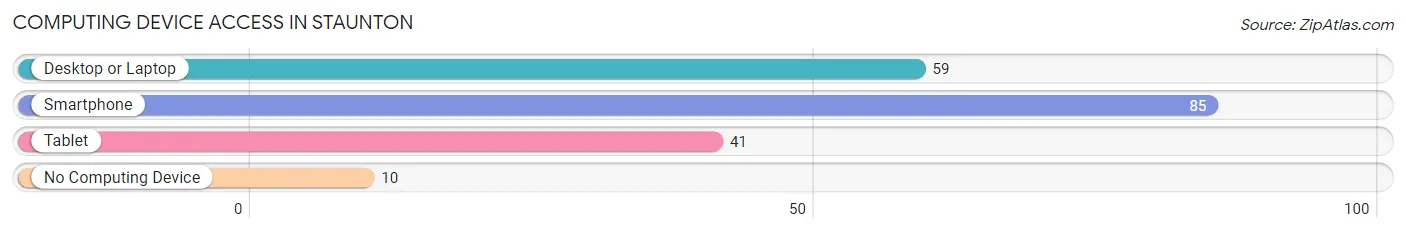
| Device Type | # Households | % Households |
| Desktop or Laptop | 59 | 58.4% |
| Smartphone | 85 | 84.2% |
| Tablet | 41 | 40.6% |
| No Computing Device | 10 | 9.9% |
| Total | 101 | 100.0% |
Internet Access in Staunton
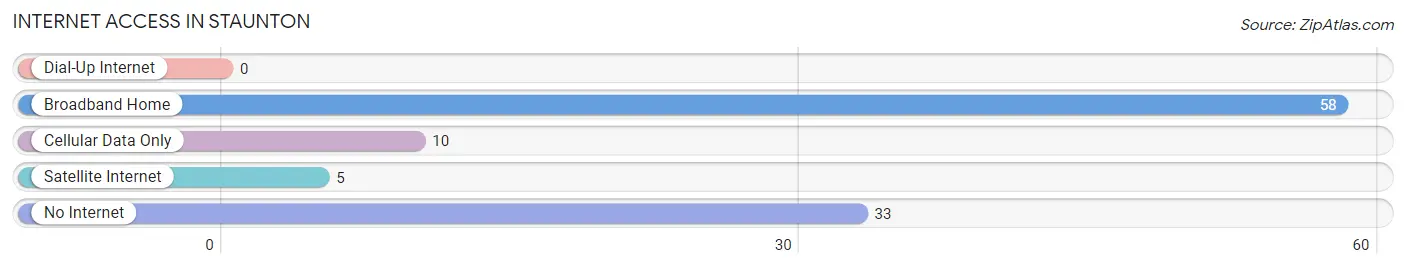
| Internet Type | # Households | % Households |
| Dial-Up Internet | 0 | 0.0% |
| Broadband Home | 58 | 57.4% |
| Cellular Data Only | 10 | 9.9% |
| Satellite Internet | 5 | 5.0% |
| No Internet | 33 | 32.7% |
| Total | 101 | 100.0% |
Staunton Summary
Staunton is a small town located in the southwestern corner of Indiana, in the United States. It is situated in the Wabash Valley, in the county of Vigo. The town has a population of approximately 1,500 people, and is located about 30 miles from Terre Haute, the county seat.
History
Staunton was founded in 1820 by William Staunton, a Revolutionary War veteran. He purchased the land from the government and named the town after himself. The town was incorporated in 1837, and the first post office was established in 1838.
The town grew slowly, but steadily, and by the late 19th century, it had become a thriving agricultural center. The town was also home to several businesses, including a flour mill, a sawmill, a brickyard, and a furniture factory.
In the early 20th century, Staunton experienced a period of growth and prosperity. The town was home to several banks, a movie theater, and a variety of stores. The town also had a thriving music scene, with several bands playing in local venues.
Geography
Staunton is located in the Wabash Valley, in the southwestern corner of Indiana. The town is situated on the banks of the Wabash River, and is surrounded by rolling hills and farmland. The town is located about 30 miles from Terre Haute, the county seat.
The climate in Staunton is humid continental, with hot summers and cold winters. The average annual temperature is around 50 degrees Fahrenheit, and the average annual precipitation is around 40 inches.
Economy
Staunton’s economy is largely based on agriculture. The town is home to several farms, and the surrounding area is known for its production of corn, soybeans, and wheat. The town is also home to several businesses, including a furniture factory, a sawmill, and a brickyard.
The town is also home to several small businesses, including restaurants, shops, and other services. The town is also home to a few manufacturing companies, including a plastics factory and a metal fabrication plant.
Demographics
As of the 2010 census, Staunton had a population of 1,500 people. The racial makeup of the town was 97.3% White, 0.7% African American, 0.3% Native American, 0.3% Asian, and 1.3% from other races. The median household income was $37,500, and the median family income was $45,000.
Staunton is a small, rural town with a close-knit community. The town is home to several churches, and the town’s residents are known for their friendliness and hospitality. The town is also home to several parks and recreational areas, including a golf course and a swimming pool.
Common Questions
What is Per Capita Income in Staunton?
Per Capita income in Staunton is $23,397.
What is the Median Family Income in Staunton?
Median Family Income in Staunton is $41,875.
What is the Median Household income in Staunton?
Median Household Income in Staunton is $41,250.
What is Inequality or Gini Index in Staunton?
Inequality or Gini Index in Staunton is 0.43.
What is the Total Population of Staunton?
Total Population of Staunton is 262.
What is the Total Male Population of Staunton?
Total Male Population of Staunton is 136.
What is the Total Female Population of Staunton?
Total Female Population of Staunton is 126.
What is the Ratio of Males per 100 Females in Staunton?
There are 107.94 Males per 100 Females in Staunton.
What is the Ratio of Females per 100 Males in Staunton?
There are 92.65 Females per 100 Males in Staunton.
What is the Median Population Age in Staunton?
Median Population Age in Staunton is 38.3 Years.
What is the Average Family Size in Staunton
Average Family Size in Staunton is 3.0 People.
What is the Average Household Size in Staunton
Average Household Size in Staunton is 2.6 People.
How Large is the Labor Force in Staunton?
There are 107 People in the Labor Forcein in Staunton.
What is the Percentage of People in the Labor Force in Staunton?
53.5% of People are in the Labor Force in Staunton.
What is the Unemployment Rate in Staunton?
Unemployment Rate in Staunton is 4.7%.