Star City, IN Map & Demographics
Star City Map
Star City Overview
$30,087
PER CAPITA INCOME
$80,962
AVG FAMILY INCOME
$55,036
AVG HOUSEHOLD INCOME
48.2%
WAGE / INCOME GAP [ % ]
51.8¢/ $1
WAGE / INCOME GAP [ $ ]
0.24
INEQUALITY / GINI INDEX
226
TOTAL POPULATION
63
MALE POPULATION
163
FEMALE POPULATION
38.65
MALES / 100 FEMALES
258.73
FEMALES / 100 MALES
57.4
MEDIAN AGE
3.9
AVG FAMILY SIZE
1.9
AVG HOUSEHOLD SIZE
101
LABOR FORCE [ PEOPLE ]
54.0%
PERCENT IN LABOR FORCE
10.9%
UNEMPLOYMENT RATE
Star City Zip Codes
Star City Area Codes
Income in Star City
Income Overview in Star City
Per Capita Income in Star City is $30,087, while median incomes of families and households are $80,962 and $55,036 respectively.
| Characteristic | Number | Measure |
| Per Capita Income | 226 | $30,087 |
| Median Family Income | 38 | $80,962 |
| Mean Family Income | 38 | $74,724 |
| Median Household Income | 117 | $55,036 |
| Mean Household Income | 117 | $53,469 |
| Income Deficit | 38 | $0 |
| Wage / Income Gap (%) | 226 | 48.15% |
| Wage / Income Gap ($) | 226 | 51.85¢ per $1 |
| Gini / Inequality Index | 226 | 0.24 |
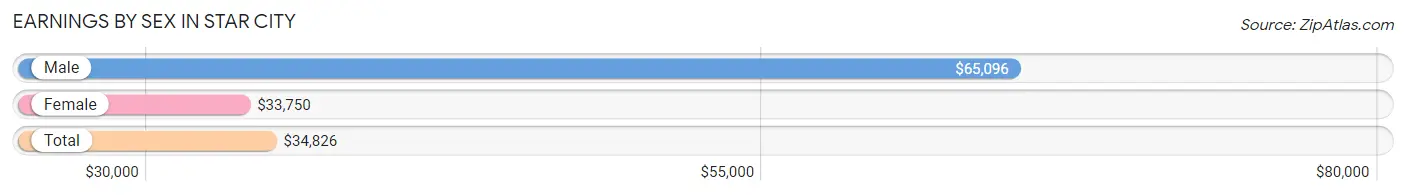
Earnings by Sex in Star City
Average Earnings in Star City are $34,826, $65,096 for men and $33,750 for women, a difference of 48.1%.
| Sex | Number | Average Earnings |
| Male | 37 (41.1%) | $65,096 |
| Female | 53 (58.9%) | $33,750 |
| Total | 90 (100.0%) | $34,826 |
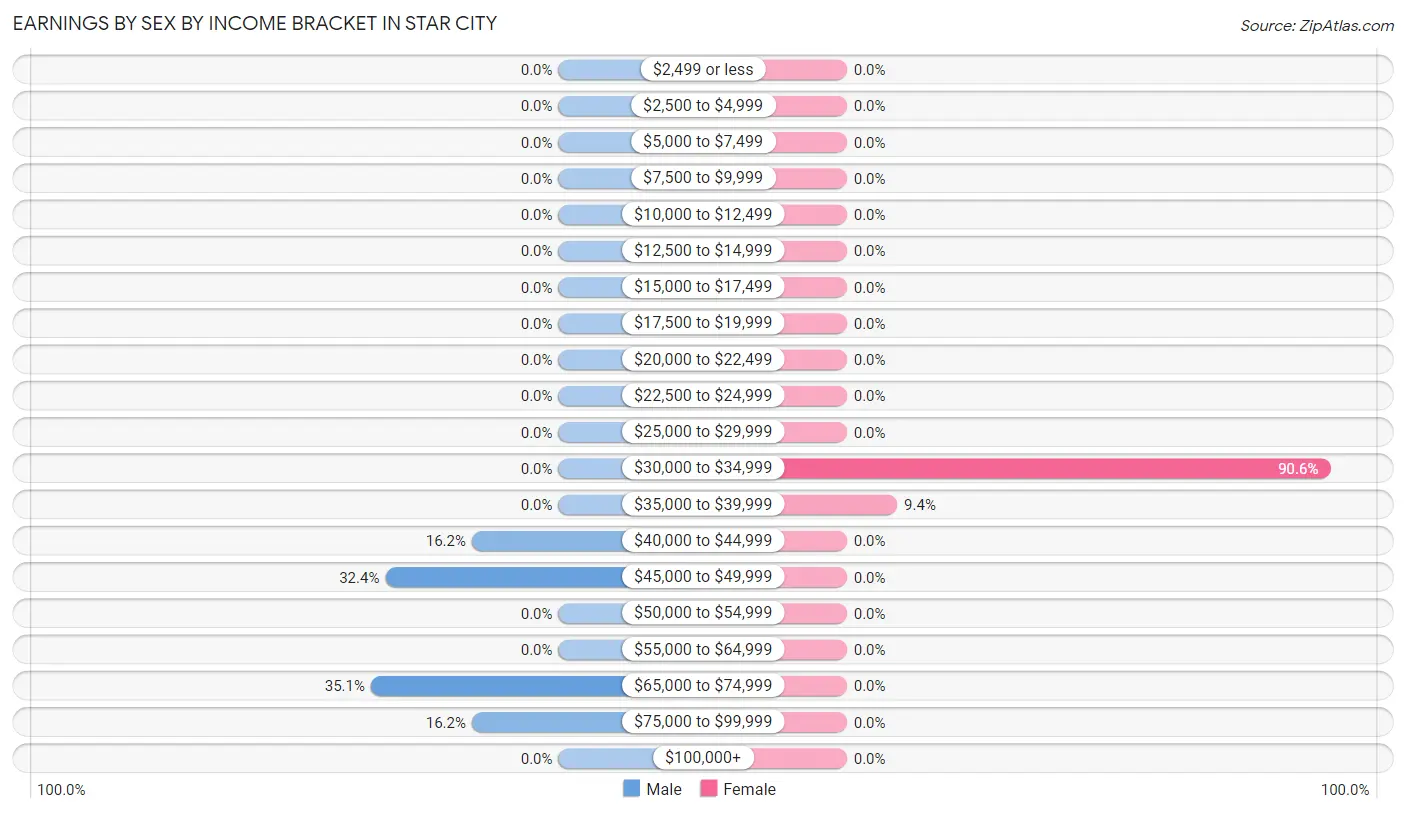
Earnings by Sex by Income Bracket in Star City
The most common earnings brackets in Star City are $65,000 to $74,999 for men (13 | 35.1%) and $30,000 to $34,999 for women (48 | 90.6%).
| Income | Male | Female |
| $2,499 or less | 0 (0.0%) | 0 (0.0%) |
| $2,500 to $4,999 | 0 (0.0%) | 0 (0.0%) |
| $5,000 to $7,499 | 0 (0.0%) | 0 (0.0%) |
| $7,500 to $9,999 | 0 (0.0%) | 0 (0.0%) |
| $10,000 to $12,499 | 0 (0.0%) | 0 (0.0%) |
| $12,500 to $14,999 | 0 (0.0%) | 0 (0.0%) |
| $15,000 to $17,499 | 0 (0.0%) | 0 (0.0%) |
| $17,500 to $19,999 | 0 (0.0%) | 0 (0.0%) |
| $20,000 to $22,499 | 0 (0.0%) | 0 (0.0%) |
| $22,500 to $24,999 | 0 (0.0%) | 0 (0.0%) |
| $25,000 to $29,999 | 0 (0.0%) | 0 (0.0%) |
| $30,000 to $34,999 | 0 (0.0%) | 48 (90.6%) |
| $35,000 to $39,999 | 0 (0.0%) | 5 (9.4%) |
| $40,000 to $44,999 | 6 (16.2%) | 0 (0.0%) |
| $45,000 to $49,999 | 12 (32.4%) | 0 (0.0%) |
| $50,000 to $54,999 | 0 (0.0%) | 0 (0.0%) |
| $55,000 to $64,999 | 0 (0.0%) | 0 (0.0%) |
| $65,000 to $74,999 | 13 (35.1%) | 0 (0.0%) |
| $75,000 to $99,999 | 6 (16.2%) | 0 (0.0%) |
| $100,000+ | 0 (0.0%) | 0 (0.0%) |
| Total | 37 (100.0%) | 53 (100.0%) |
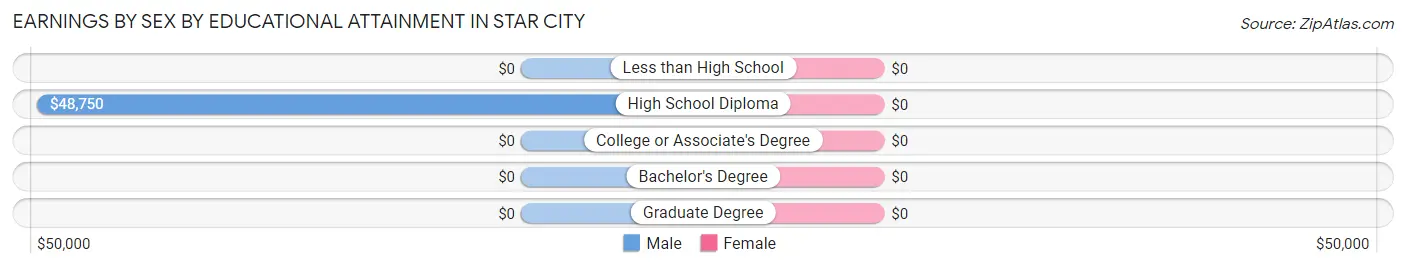
Earnings by Sex by Educational Attainment in Star City
| Educational Attainment | Male Income | Female Income |
| Less than High School | - | - |
| High School Diploma | $48,750 | $0 |
| College or Associate's Degree | - | - |
| Bachelor's Degree | - | - |
| Graduate Degree | - | - |
| Total | $65,096 | $33,750 |
Family Income in Star City
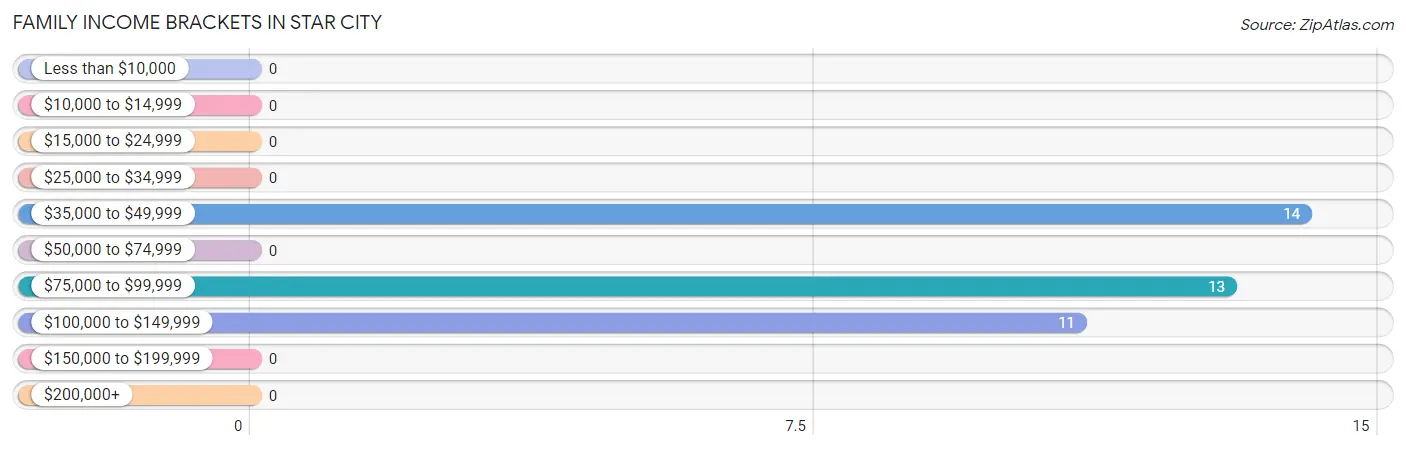
Family Income Brackets in Star City
According to the Star City family income data, there are 14 families falling into the $35,000 to $49,999 income range, which is the most common income bracket and makes up 36.8% of all families.
| Income Bracket | # Families | % Families |
| Less than $10,000 | 0 | 0.0% |
| $10,000 to $14,999 | 0 | 0.0% |
| $15,000 to $24,999 | 0 | 0.0% |
| $25,000 to $34,999 | 0 | 0.0% |
| $35,000 to $49,999 | 14 | 36.8% |
| $50,000 to $74,999 | 0 | 0.0% |
| $75,000 to $99,999 | 13 | 34.2% |
| $100,000 to $149,999 | 11 | 28.9% |
| $150,000 to $199,999 | 0 | 0.0% |
| $200,000+ | 0 | 0.0% |
Family Income by Famaliy Size in Star City
| Income Bracket | # Families | Median Income |
| 2-Person Families | 14 (36.8%) | $0 |
| 3-Person Families | 19 (50.0%) | $0 |
| 4-Person Families | 5 (13.2%) | $0 |
| 5-Person Families | 0 (0.0%) | $0 |
| 6-Person Families | 0 (0.0%) | $0 |
| 7+ Person Families | 0 (0.0%) | $0 |
| Total | 38 (100.0%) | $80,962 |
Family Income by Number of Earners in Star City
| Number of Earners | # Families | Median Income |
| No Earners | 0 (0.0%) | $0 |
| 1 Earner | 27 (71.1%) | $0 |
| 2 Earners | 11 (28.9%) | $0 |
| 3+ Earners | 0 (0.0%) | $0 |
| Total | 38 (100.0%) | $80,962 |
Household Income in Star City
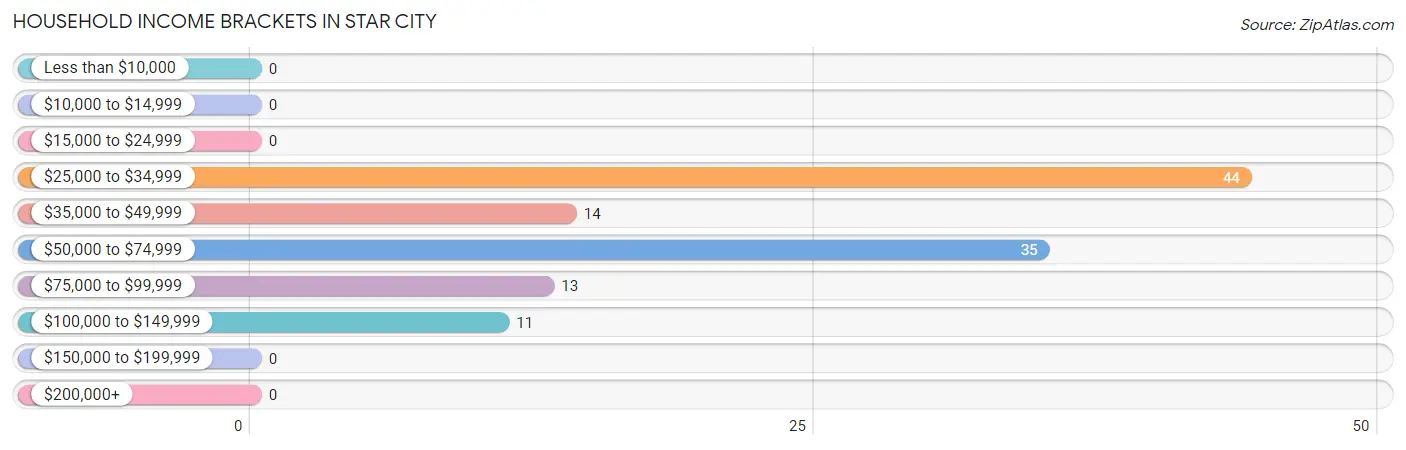
Household Income Brackets in Star City
With 44 households falling in the category, the $25,000 to $34,999 income range is the most frequent in Star City, accounting for 37.6% of all households.
| Income Bracket | # Households | % Households |
| Less than $10,000 | 0 | 0.0% |
| $10,000 to $14,999 | 0 | 0.0% |
| $15,000 to $24,999 | 0 | 0.0% |
| $25,000 to $34,999 | 44 | 37.6% |
| $35,000 to $49,999 | 14 | 12.0% |
| $50,000 to $74,999 | 35 | 29.9% |
| $75,000 to $99,999 | 13 | 11.1% |
| $100,000 to $149,999 | 11 | 9.4% |
| $150,000 to $199,999 | 0 | 0.0% |
| $200,000+ | 0 | 0.0% |
Household Income by Householder Age in Star City
The median household income in Star City is $55,036, with the highest median household income of $38,125 found in the 65+ years age bracket for the primary householder. A total of 91 households (77.8%) fall into this category.
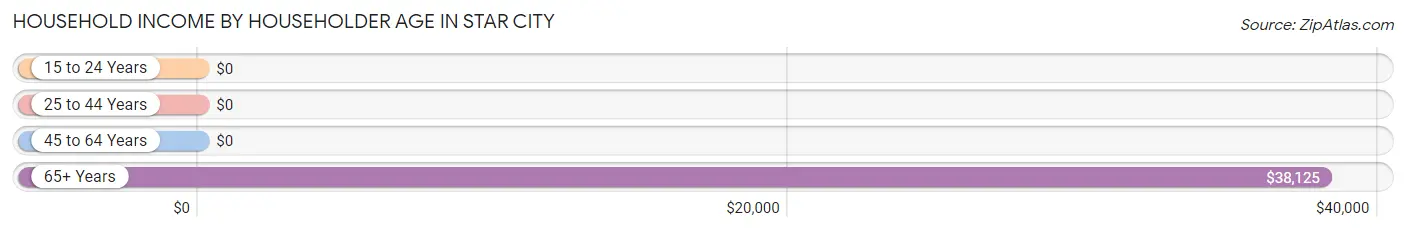
| Income Bracket | # Households | Median Income |
| 15 to 24 Years | 0 (0.0%) | $0 |
| 25 to 44 Years | 18 (15.4%) | $0 |
| 45 to 64 Years | 8 (6.8%) | $0 |
| 65+ Years | 91 (77.8%) | $38,125 |
| Total | 117 (100.0%) | $55,036 |
Poverty in Star City
Income Below Poverty by Sex and Age in Star City
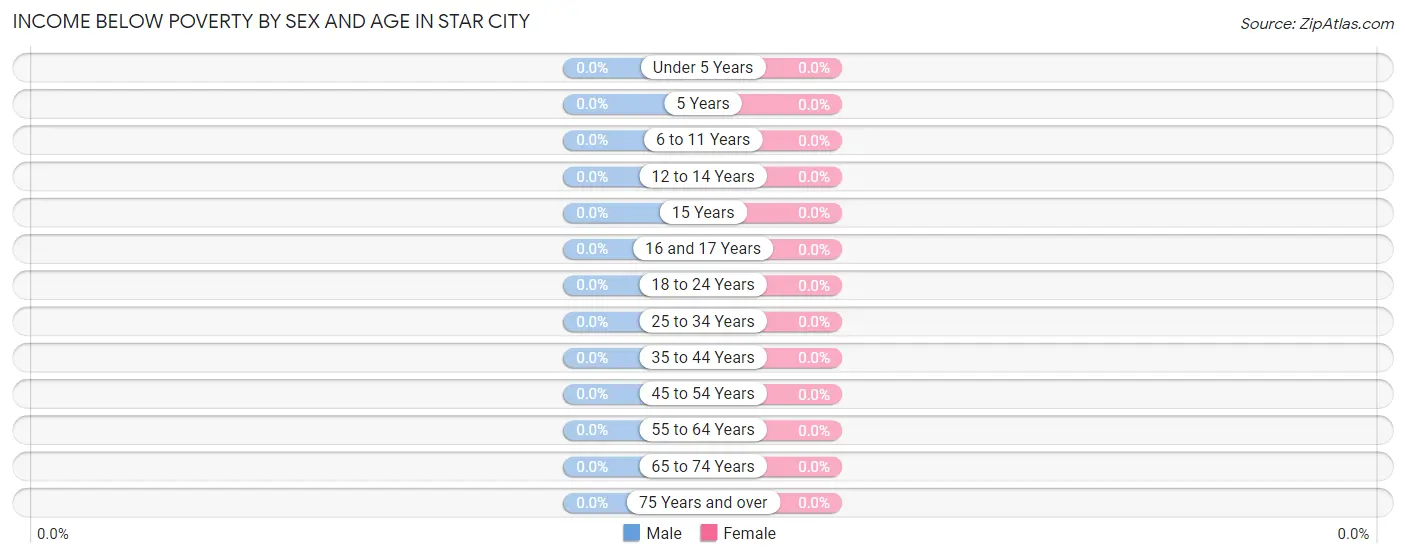
| Age Bracket | Male | Female |
| Under 5 Years | 0 (0.0%) | 0 (0.0%) |
| 5 Years | 0 (0.0%) | 0 (0.0%) |
| 6 to 11 Years | 0 (0.0%) | 0 (0.0%) |
| 12 to 14 Years | 0 (0.0%) | 0 (0.0%) |
| 15 Years | 0 (0.0%) | 0 (0.0%) |
| 16 and 17 Years | 0 (0.0%) | 0 (0.0%) |
| 18 to 24 Years | 0 (0.0%) | 0 (0.0%) |
| 25 to 34 Years | 0 (0.0%) | 0 (0.0%) |
| 35 to 44 Years | 0 (0.0%) | 0 (0.0%) |
| 45 to 54 Years | 0 (0.0%) | 0 (0.0%) |
| 55 to 64 Years | 0 (0.0%) | 0 (0.0%) |
| 65 to 74 Years | 0 (0.0%) | 0 (0.0%) |
| 75 Years and over | 0 (0.0%) | 0 (0.0%) |
| Total | 0 (0.0%) | 0 (0.0%) |
Income Above Poverty by Sex and Age in Star City
According to the poverty statistics in Star City, males aged 25 to 34 years and females aged under 5 years are the age groups that are most secure financially, with 100.0% of males and 100.0% of females in these age groups living above the poverty line.
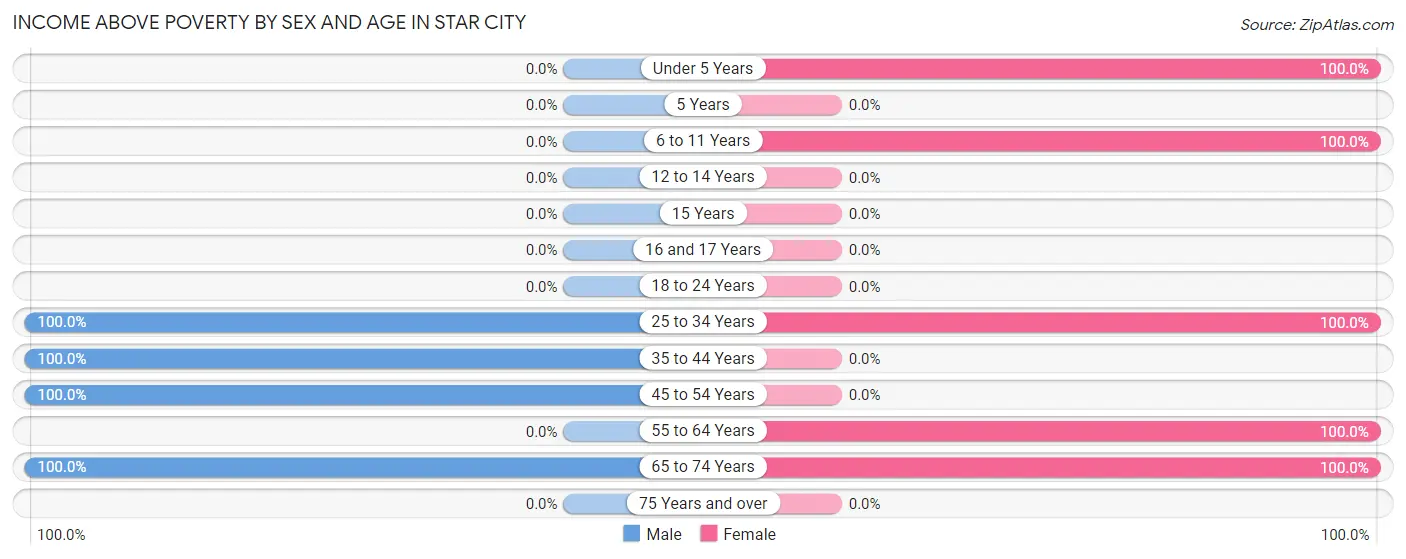
| Age Bracket | Male | Female |
| Under 5 Years | 0 (0.0%) | 28 (100.0%) |
| 5 Years | 0 (0.0%) | 0 (0.0%) |
| 6 to 11 Years | 0 (0.0%) | 11 (100.0%) |
| 12 to 14 Years | 0 (0.0%) | 0 (0.0%) |
| 15 Years | 0 (0.0%) | 0 (0.0%) |
| 16 and 17 Years | 0 (0.0%) | 0 (0.0%) |
| 18 to 24 Years | 0 (0.0%) | 0 (0.0%) |
| 25 to 34 Years | 6 (100.0%) | 5 (100.0%) |
| 35 to 44 Years | 24 (100.0%) | 0 (0.0%) |
| 45 to 54 Years | 9 (100.0%) | 0 (0.0%) |
| 55 to 64 Years | 0 (0.0%) | 40 (100.0%) |
| 65 to 74 Years | 24 (100.0%) | 79 (100.0%) |
| 75 Years and over | 0 (0.0%) | 0 (0.0%) |
| Total | 63 (100.0%) | 163 (100.0%) |
Income Below Poverty Among Married-Couple Families in Star City
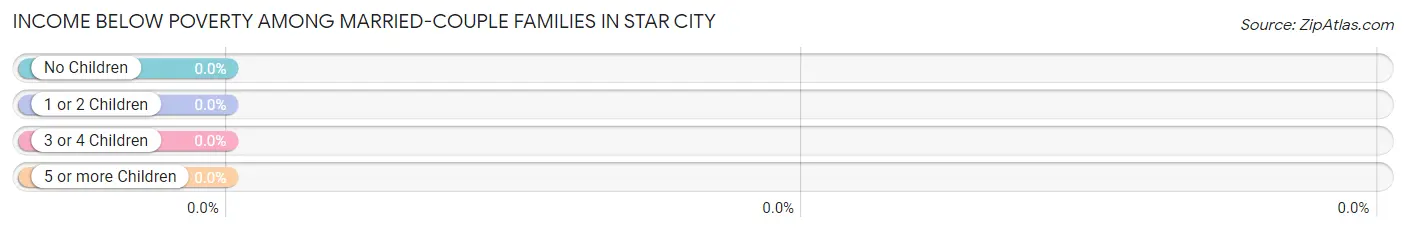
| Children | Above Poverty | Below Poverty |
| No Children | 14 (100.0%) | 0 (0.0%) |
| 1 or 2 Children | 5 (100.0%) | 0 (0.0%) |
| 3 or 4 Children | 0 (0.0%) | 0 (0.0%) |
| 5 or more Children | 0 (0.0%) | 0 (0.0%) |
| Total | 19 (100.0%) | 0 (0.0%) |
Income Below Poverty Among Single-Parent Households in Star City
| Children | Single Father | Single Mother |
| No Children | 0 (0.0%) | 0 (0.0%) |
| 1 or 2 Children | 0 (0.0%) | 0 (0.0%) |
| 3 or 4 Children | 0 (0.0%) | 0 (0.0%) |
| 5 or more Children | 0 (0.0%) | 0 (0.0%) |
| Total | 0 (0.0%) | 0 (0.0%) |
Income Below Poverty Among Married-Couple vs Single-Parent Households in Star City
| Children | Married-Couple Families | Single-Parent Households |
| No Children | 0 (0.0%) | 0 (0.0%) |
| 1 or 2 Children | 0 (0.0%) | 0 (0.0%) |
| 3 or 4 Children | 0 (0.0%) | 0 (0.0%) |
| 5 or more Children | 0 (0.0%) | 0 (0.0%) |
| Total | 0 (0.0%) | 0 (0.0%) |
Race in Star City
The most populous races in Star City are , and White / Caucasian (226 | 100.0%).
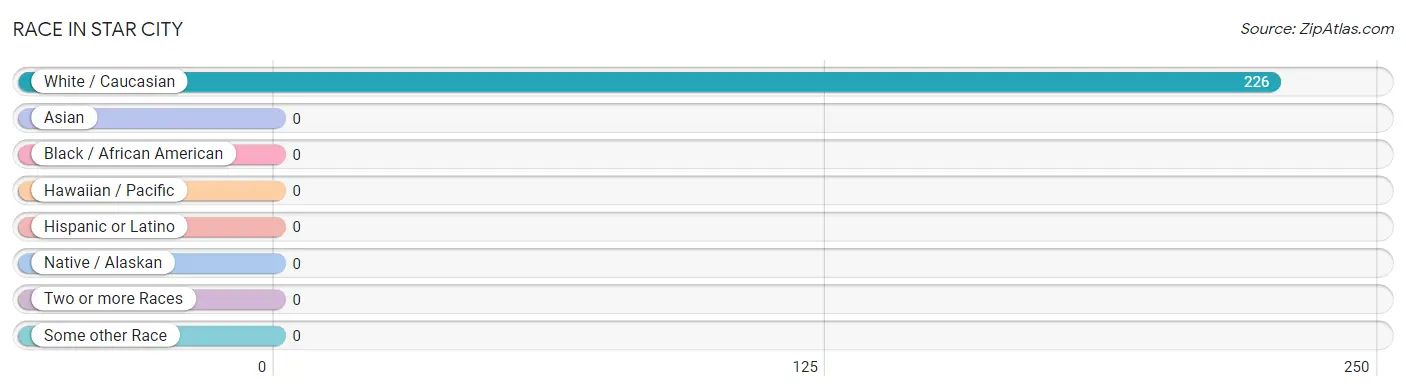
| Race | # Population | % Population |
| Asian | 0 | 0.0% |
| Black / African American | 0 | 0.0% |
| Hawaiian / Pacific | 0 | 0.0% |
| Hispanic or Latino | 0 | 0.0% |
| Native / Alaskan | 0 | 0.0% |
| White / Caucasian | 226 | 100.0% |
| Two or more Races | 0 | 0.0% |
| Some other Race | 0 | 0.0% |
| Total | 226 | 100.0% |
Ancestry in Star City
The most populous ancestries reported in Star City are German (74 | 32.7%), European (69 | 30.5%), Irish (52 | 23.0%), British (33 | 14.6%), and American (16 | 7.1%), together accounting for 108.0% of all Star City residents.
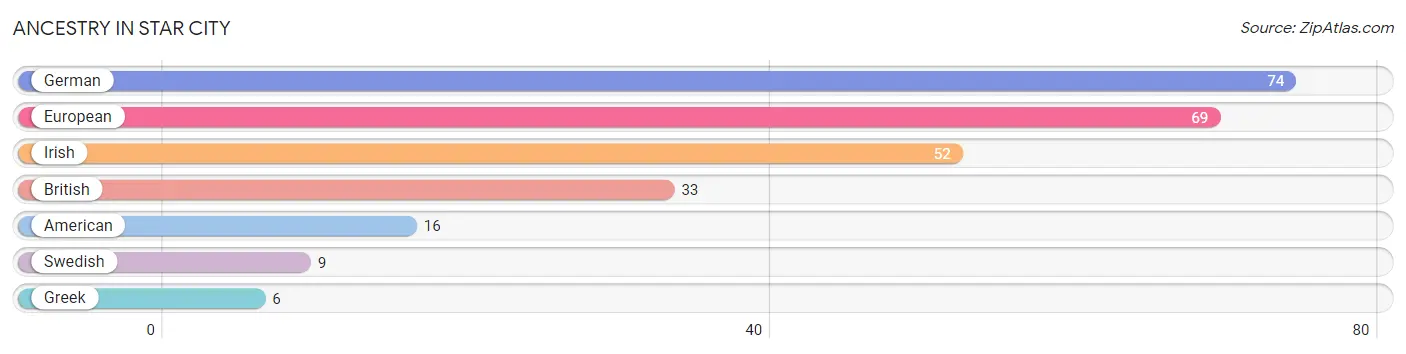
| Ancestry | # Population | % Population |
| American | 16 | 7.1% |
| British | 33 | 14.6% |
| European | 69 | 30.5% |
| German | 74 | 32.7% |
| Greek | 6 | 2.6% |
| Irish | 52 | 23.0% |
| Swedish | 9 | 4.0% | View All 7 Rows |
Immigrants in Star City
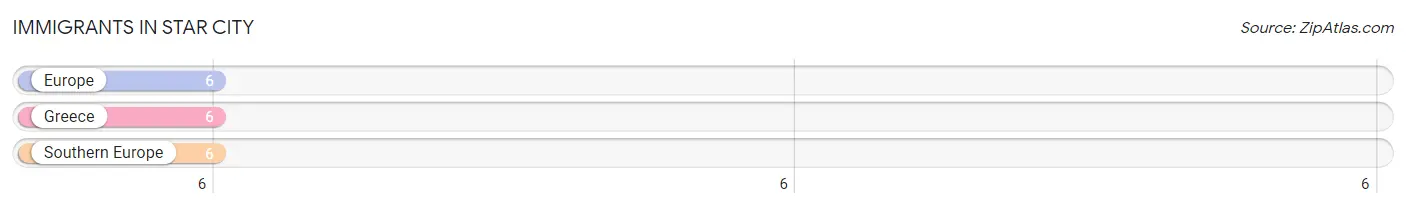
The most numerous immigrant groups reported in Star City came from Europe (6 | 2.6%), Greece (6 | 2.6%), and Southern Europe (6 | 2.6%), together accounting for 8.0% of all Star City residents.
| Immigration Origin | # Population | % Population |
| Europe | 6 | 2.6% |
| Greece | 6 | 2.6% |
| Southern Europe | 6 | 2.6% | View All 3 Rows |
Sex and Age in Star City
Sex and Age in Star City
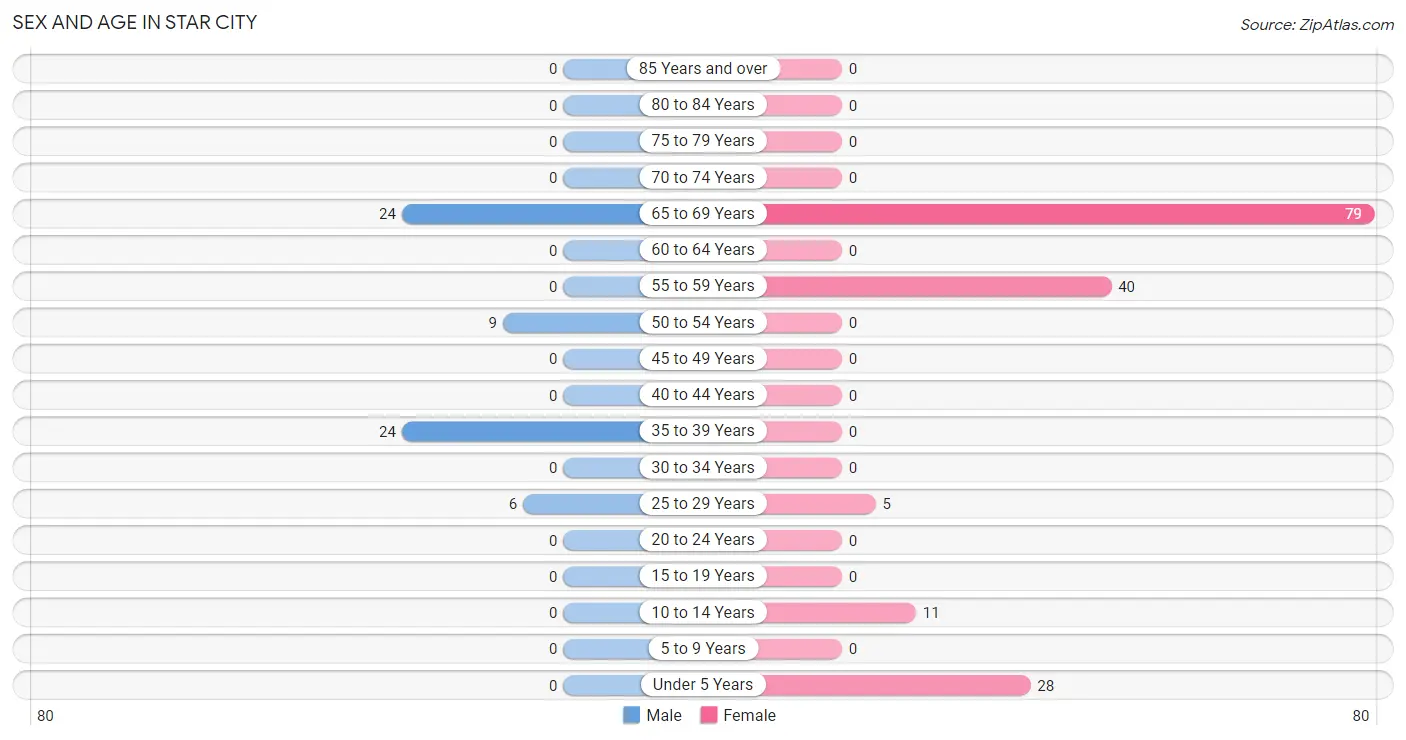
The most populous age groups in Star City are 35 to 39 Years (24 | 38.1%) for men and 65 to 69 Years (79 | 48.5%) for women.
| Age Bracket | Male | Female |
| Under 5 Years | 0 (0.0%) | 28 (17.2%) |
| 5 to 9 Years | 0 (0.0%) | 0 (0.0%) |
| 10 to 14 Years | 0 (0.0%) | 11 (6.8%) |
| 15 to 19 Years | 0 (0.0%) | 0 (0.0%) |
| 20 to 24 Years | 0 (0.0%) | 0 (0.0%) |
| 25 to 29 Years | 6 (9.5%) | 5 (3.1%) |
| 30 to 34 Years | 0 (0.0%) | 0 (0.0%) |
| 35 to 39 Years | 24 (38.1%) | 0 (0.0%) |
| 40 to 44 Years | 0 (0.0%) | 0 (0.0%) |
| 45 to 49 Years | 0 (0.0%) | 0 (0.0%) |
| 50 to 54 Years | 9 (14.3%) | 0 (0.0%) |
| 55 to 59 Years | 0 (0.0%) | 40 (24.5%) |
| 60 to 64 Years | 0 (0.0%) | 0 (0.0%) |
| 65 to 69 Years | 24 (38.1%) | 79 (48.5%) |
| 70 to 74 Years | 0 (0.0%) | 0 (0.0%) |
| 75 to 79 Years | 0 (0.0%) | 0 (0.0%) |
| 80 to 84 Years | 0 (0.0%) | 0 (0.0%) |
| 85 Years and over | 0 (0.0%) | 0 (0.0%) |
| Total | 63 (100.0%) | 163 (100.0%) |
Families and Households in Star City
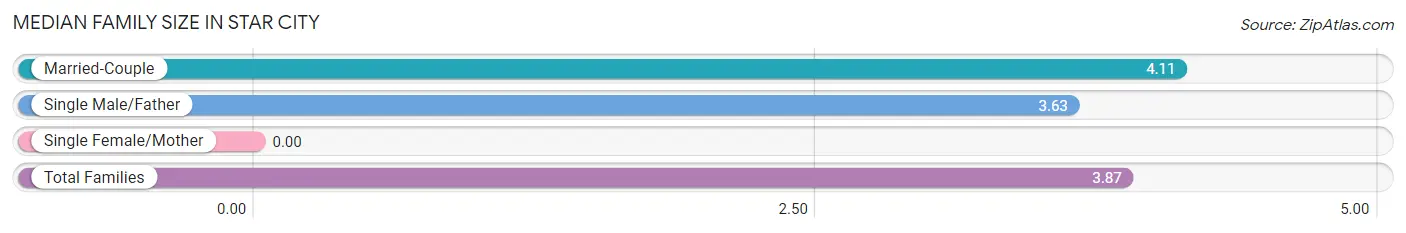
Median Family Size in Star City
| Family Type | # Families | Family Size |
| Married-Couple | 19 (50.0%) | 4.11 |
| Single Male/Father | 19 (50.0%) | 3.63 |
| Single Female/Mother | 0 (0.0%) | - |
| Total Families | 38 (100.0%) | 3.87 |
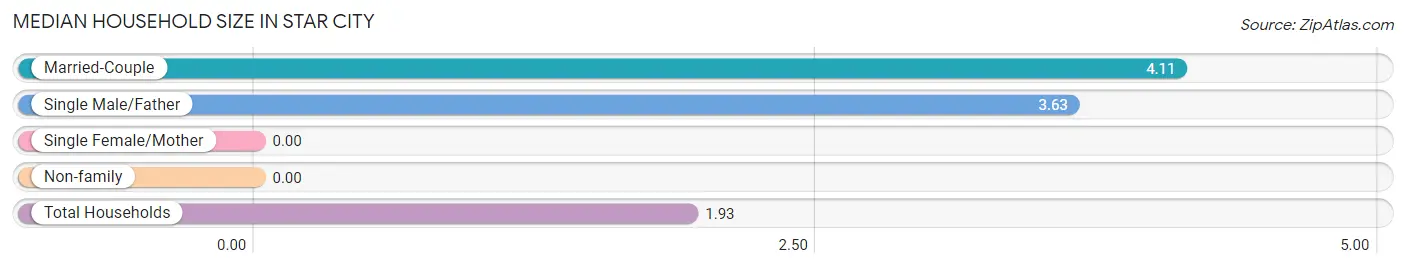
Median Household Size in Star City
| Household Type | # Households | Household Size |
| Married-Couple | 19 (16.2%) | 4.11 |
| Single Male/Father | 19 (16.2%) | 3.63 |
| Single Female/Mother | 0 (0.0%) | - |
| Non-family | 79 (67.5%) | - |
| Total Households | 117 (100.0%) | 1.93 |
Household Size by Marriage Status in Star City
Out of a total of 117 households in Star City, 38 (32.5%) are family households, while 79 (67.5%) are nonfamily households. The most numerous type of family households are 3-person households, comprising 19, and the most common type of nonfamily households are 1-person households, comprising 79.
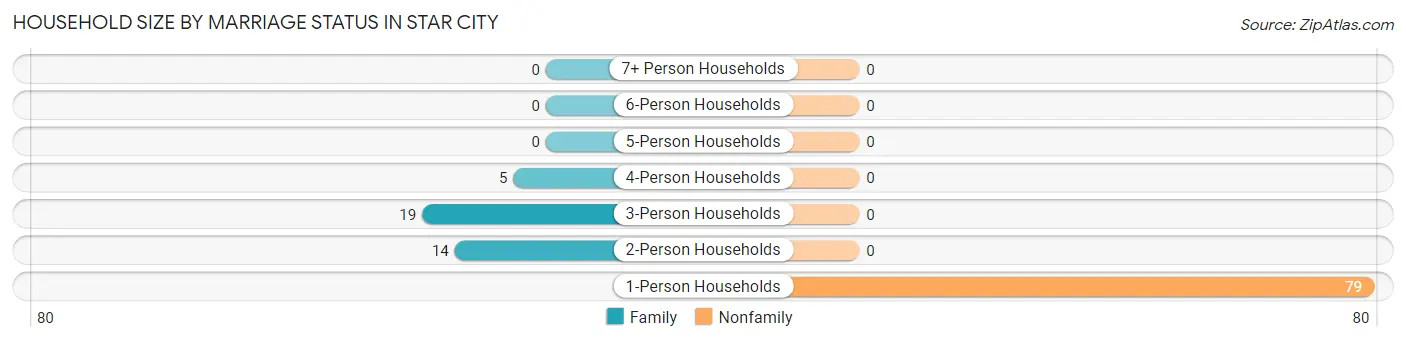
| Household Size | Family Households | Nonfamily Households |
| 1-Person Households | - | 79 (67.5%) |
| 2-Person Households | 14 (12.0%) | 0 (0.0%) |
| 3-Person Households | 19 (16.2%) | 0 (0.0%) |
| 4-Person Households | 5 (4.3%) | 0 (0.0%) |
| 5-Person Households | 0 (0.0%) | 0 (0.0%) |
| 6-Person Households | 0 (0.0%) | 0 (0.0%) |
| 7+ Person Households | 0 (0.0%) | 0 (0.0%) |
| Total | 38 (32.5%) | 79 (67.5%) |
Female Fertility in Star City
Fertility by Age in Star City
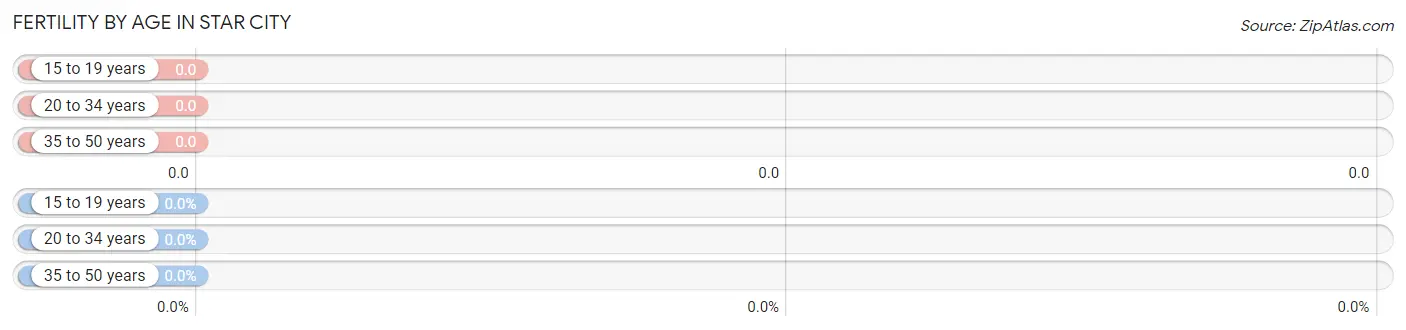
| Age Bracket | Women with Births | Births / 1,000 Women |
| 15 to 19 years | 0 (0.0%) | 0.0 |
| 20 to 34 years | 0 (0.0%) | 0.0 |
| 35 to 50 years | 0 (0.0%) | 0.0 |
| Total | 0 (0.0%) | 0.0 |
Fertility by Age by Marriage Status in Star City
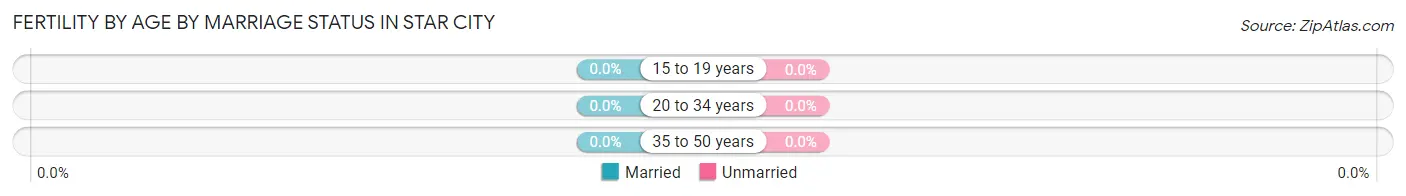
| Age Bracket | Married | Unmarried |
| 15 to 19 years | 0 (0.0%) | 0 (0.0%) |
| 20 to 34 years | 0 (0.0%) | 0 (0.0%) |
| 35 to 50 years | 0 (0.0%) | 0 (0.0%) |
| Total | 0 (0.0%) | 0 (0.0%) |
Fertility by Education in Star City
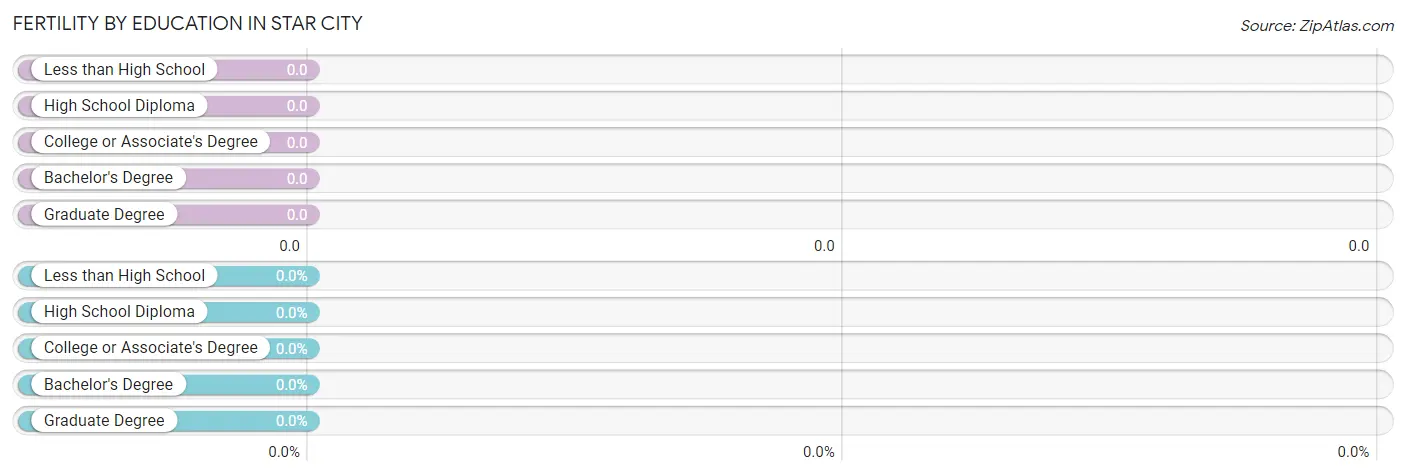
| Educational Attainment | Women with Births | Births / 1,000 Women |
| Less than High School | 0 (0.0%) | 0.0 |
| High School Diploma | 0 (0.0%) | 0.0 |
| College or Associate's Degree | 0 (0.0%) | 0.0 |
| Bachelor's Degree | 0 (0.0%) | 0.0 |
| Graduate Degree | 0 (0.0%) | 0.0 |
| Total | 0 (0.0%) | 0.0 |
Fertility by Education by Marriage Status in Star City
| Educational Attainment | Married | Unmarried |
| Less than High School | 0 (0.0%) | 0 (0.0%) |
| High School Diploma | 0 (0.0%) | 0 (0.0%) |
| College or Associate's Degree | 0 (0.0%) | 0 (0.0%) |
| Bachelor's Degree | 0 (0.0%) | 0 (0.0%) |
| Graduate Degree | 0 (0.0%) | 0 (0.0%) |
| Total | 0 (0.0%) | 0 (0.0%) |
Employment Characteristics in Star City
Employment by Class of Employer in Star City
Among the 90 employed individuals in Star City, private company employees (50 | 55.6%), self-employed (incorporated) (35 | 38.9%), and not-for-profit organizations (5 | 5.6%) make up the most common classes of employment.
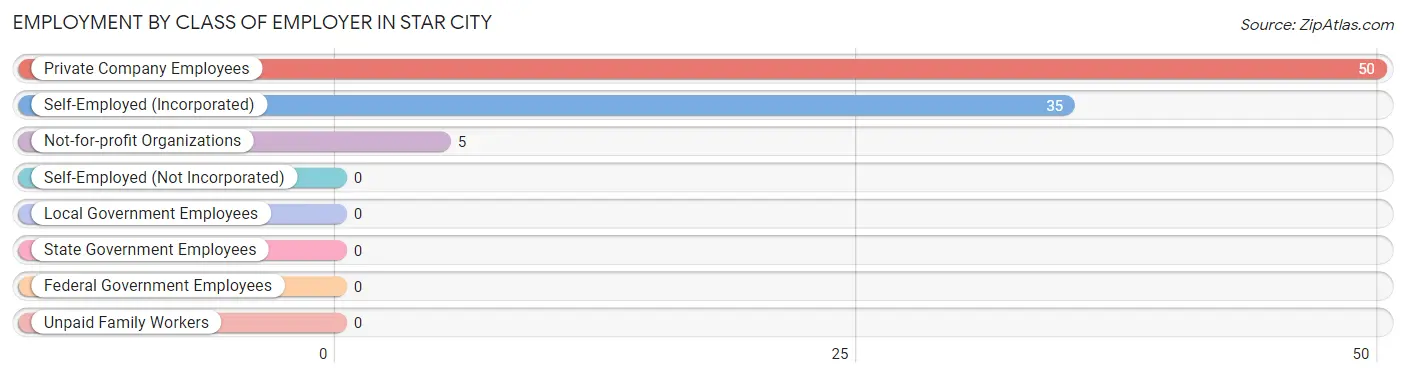
| Employer Class | # Employees | % Employees |
| Private Company Employees | 50 | 55.6% |
| Self-Employed (Incorporated) | 35 | 38.9% |
| Self-Employed (Not Incorporated) | 0 | 0.0% |
| Not-for-profit Organizations | 5 | 5.6% |
| Local Government Employees | 0 | 0.0% |
| State Government Employees | 0 | 0.0% |
| Federal Government Employees | 0 | 0.0% |
| Unpaid Family Workers | 0 | 0.0% |
| Total | 90 | 100.0% |
Employment Status by Age in Star City
According to the labor force statistics for Star City, out of the total population over 16 years of age (187), 54.0% or 101 individuals are in the labor force, with 10.9% or 11 of them unemployed. The age group with the highest labor force participation rate is 25 to 29 years, with 100.0% or 11 individuals in the labor force. Within the labor force, the 35 to 44 years age range has the highest percentage of unemployed individuals, with 45.8% or 11 of them being unemployed.
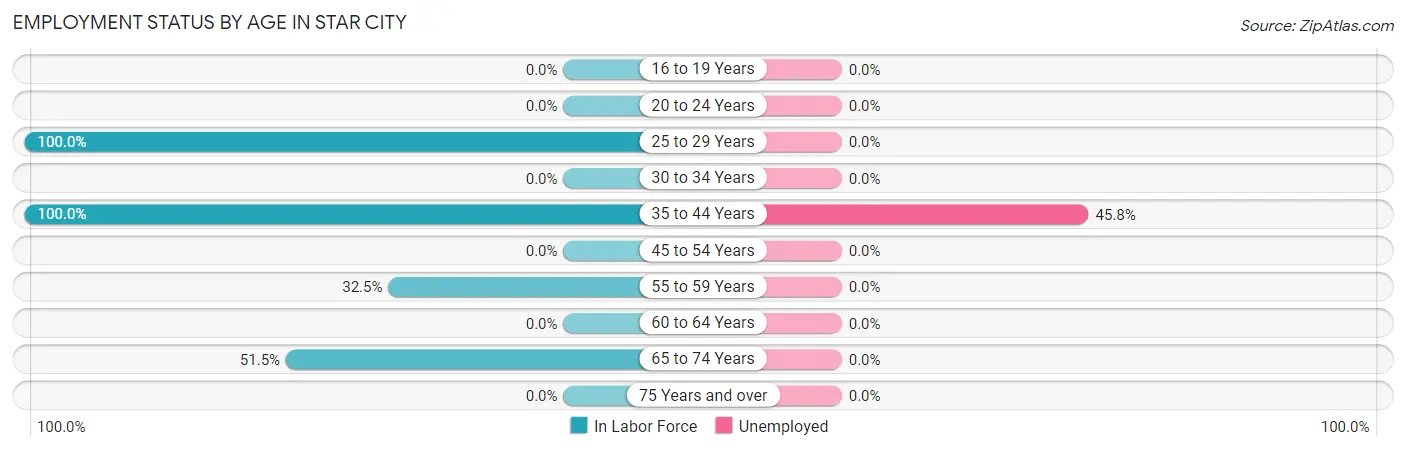
| Age Bracket | In Labor Force | Unemployed |
| 16 to 19 Years | 0 (0.0%) | 0 (0.0%) |
| 20 to 24 Years | 0 (0.0%) | 0 (0.0%) |
| 25 to 29 Years | 11 (100.0%) | 0 (0.0%) |
| 30 to 34 Years | 0 (0.0%) | 0 (0.0%) |
| 35 to 44 Years | 24 (100.0%) | 11 (45.8%) |
| 45 to 54 Years | 0 (0.0%) | 0 (0.0%) |
| 55 to 59 Years | 13 (32.5%) | 0 (0.0%) |
| 60 to 64 Years | 0 (0.0%) | 0 (0.0%) |
| 65 to 74 Years | 53 (51.5%) | 0 (0.0%) |
| 75 Years and over | 0 (0.0%) | 0 (0.0%) |
| Total | 101 (54.0%) | 11 (10.9%) |
Employment Status by Educational Attainment in Star City
According to labor force statistics for Star City, 57.1% of individuals (48) out of the total population between 25 and 64 years of age (84) are in the labor force, with 22.9% or 11 of them being unemployed. The group with the highest labor force participation rate are those with the educational attainment of less than high school, with 100.0% or 11 individuals in the labor force. Within the labor force, individuals with less than high school education have the highest percentage of unemployment, with 100.0% or 11 of them being unemployed.
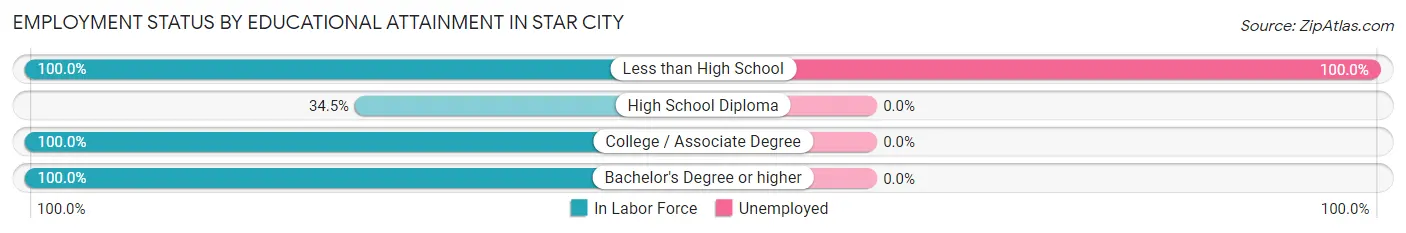
| Educational Attainment | In Labor Force | Unemployed |
| Less than High School | 11 (100.0%) | 11 (100.0%) |
| High School Diploma | 19 (34.5%) | 0 (0.0%) |
| College / Associate Degree | 5 (100.0%) | 0 (0.0%) |
| Bachelor's Degree or higher | 13 (100.0%) | 0 (0.0%) |
| Total | 48 (57.1%) | 19 (22.9%) |
Employment Occupations by Sex in Star City
Management, Business, Science and Arts Occupations
The most common Management, Business, Science and Arts occupations in Star City are , and Business & Financial (13 | 14.4%).
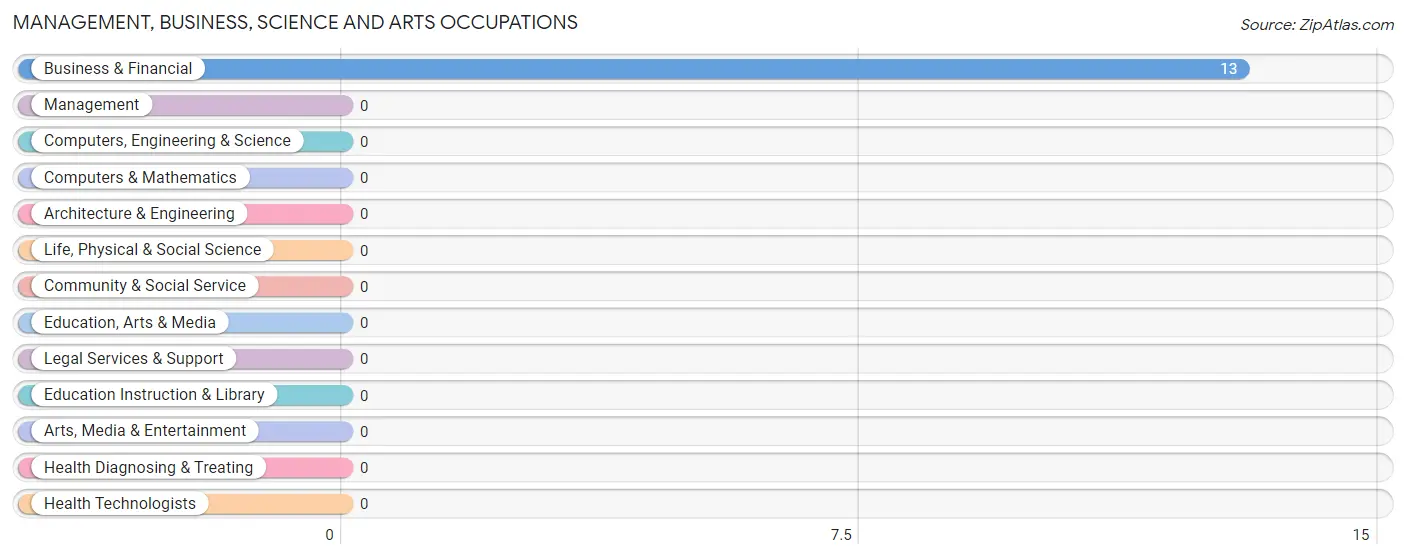
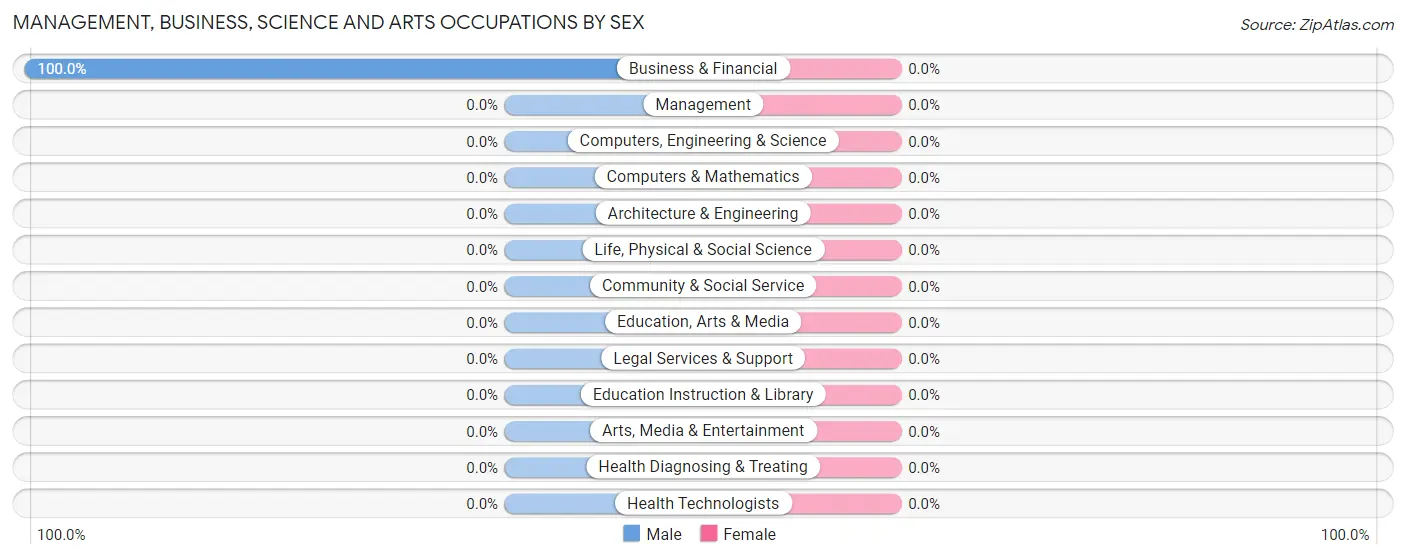
Management, Business, Science and Arts Occupations by Sex
| Occupation | Male | Female |
| Management | 0 (0.0%) | 0 (0.0%) |
| Business & Financial | 13 (100.0%) | 0 (0.0%) |
| Computers, Engineering & Science | 0 (0.0%) | 0 (0.0%) |
| Computers & Mathematics | 0 (0.0%) | 0 (0.0%) |
| Architecture & Engineering | 0 (0.0%) | 0 (0.0%) |
| Life, Physical & Social Science | 0 (0.0%) | 0 (0.0%) |
| Community & Social Service | 0 (0.0%) | 0 (0.0%) |
| Education, Arts & Media | 0 (0.0%) | 0 (0.0%) |
| Legal Services & Support | 0 (0.0%) | 0 (0.0%) |
| Education Instruction & Library | 0 (0.0%) | 0 (0.0%) |
| Arts, Media & Entertainment | 0 (0.0%) | 0 (0.0%) |
| Health Diagnosing & Treating | 0 (0.0%) | 0 (0.0%) |
| Health Technologists | 0 (0.0%) | 0 (0.0%) |
| Total (Category) | 13 (100.0%) | 0 (0.0%) |
| Total (Overall) | 37 (41.1%) | 53 (58.9%) |
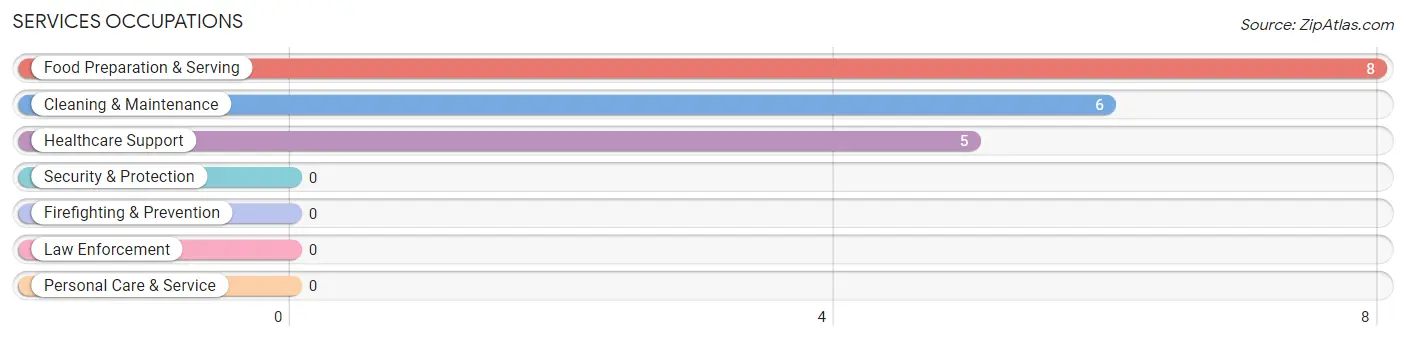
Services Occupations
The most common Services occupations in Star City are Food Preparation & Serving (8 | 8.9%), Cleaning & Maintenance (6 | 6.7%), and Healthcare Support (5 | 5.6%).
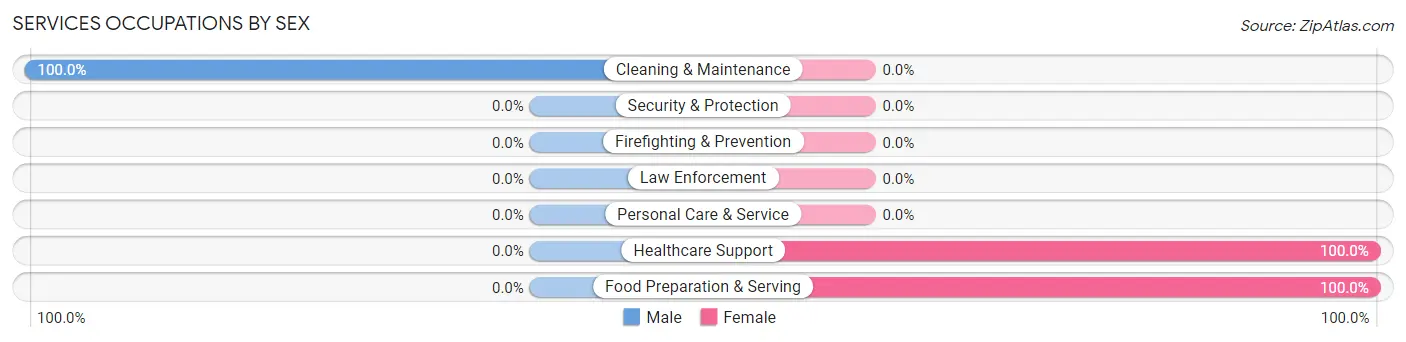
Services Occupations by Sex
| Occupation | Male | Female |
| Healthcare Support | 0 (0.0%) | 5 (100.0%) |
| Security & Protection | 0 (0.0%) | 0 (0.0%) |
| Firefighting & Prevention | 0 (0.0%) | 0 (0.0%) |
| Law Enforcement | 0 (0.0%) | 0 (0.0%) |
| Food Preparation & Serving | 0 (0.0%) | 8 (100.0%) |
| Cleaning & Maintenance | 6 (100.0%) | 0 (0.0%) |
| Personal Care & Service | 0 (0.0%) | 0 (0.0%) |
| Total (Category) | 6 (31.6%) | 13 (68.4%) |
| Total (Overall) | 37 (41.1%) | 53 (58.9%) |
Sales and Office Occupations
The most common Sales and Office occupations in Star City are , and Office & Administration (35 | 38.9%).
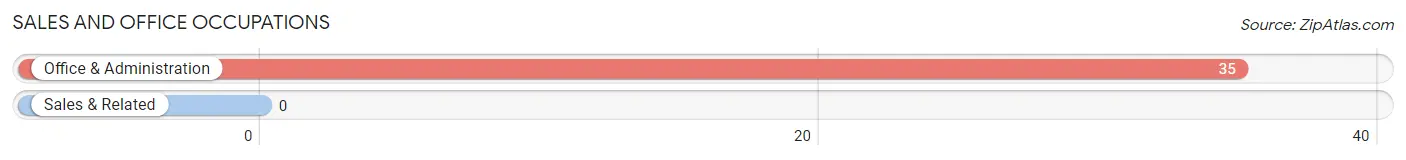
Sales and Office Occupations by Sex

| Occupation | Male | Female |
| Sales & Related | 0 (0.0%) | 0 (0.0%) |
| Office & Administration | 0 (0.0%) | 35 (100.0%) |
| Total (Category) | 0 (0.0%) | 35 (100.0%) |
| Total (Overall) | 37 (41.1%) | 53 (58.9%) |
Natural Resources, Construction and Maintenance Occupations

Natural Resources, Construction and Maintenance Occupations by Sex
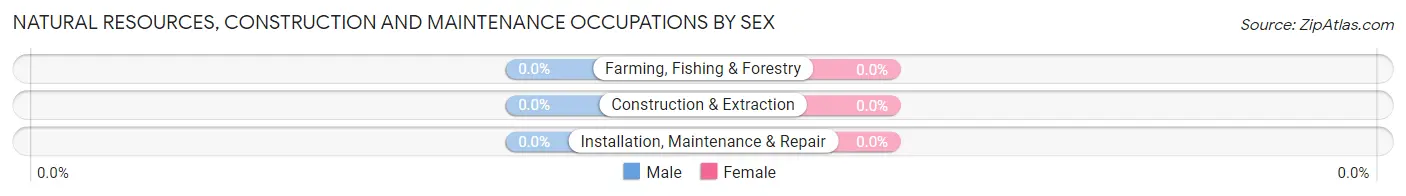
| Occupation | Male | Female |
| Farming, Fishing & Forestry | 0 (0.0%) | 0 (0.0%) |
| Construction & Extraction | 0 (0.0%) | 0 (0.0%) |
| Installation, Maintenance & Repair | 0 (0.0%) | 0 (0.0%) |
| Total (Category) | 0 (0.0%) | 0 (0.0%) |
| Total (Overall) | 37 (41.1%) | 53 (58.9%) |
Production, Transportation and Moving Occupations
The most common Production, Transportation and Moving occupations in Star City are Production (12 | 13.3%), Transportation (6 | 6.7%), and Material Moving (5 | 5.6%).
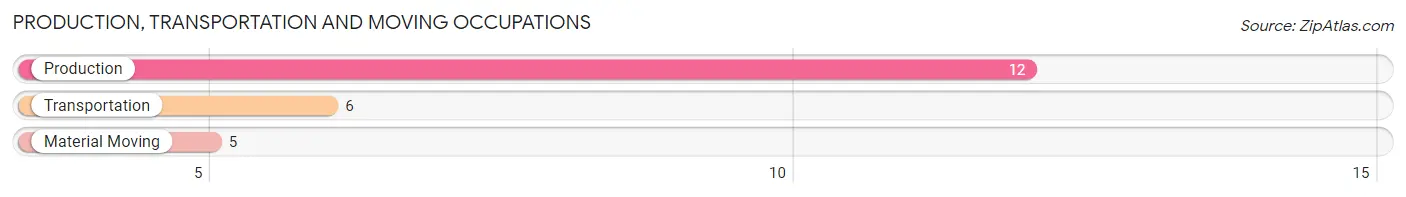
Production, Transportation and Moving Occupations by Sex
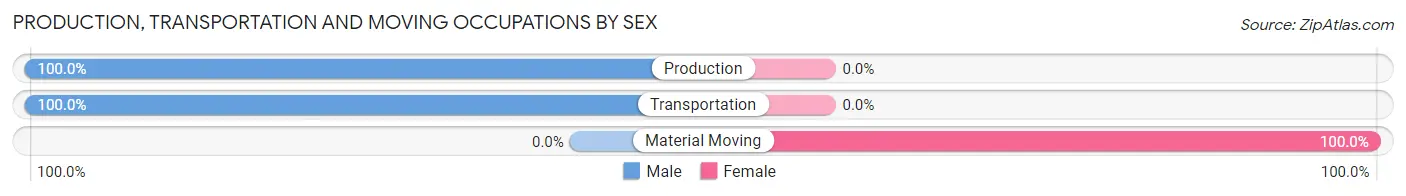
| Occupation | Male | Female |
| Production | 12 (100.0%) | 0 (0.0%) |
| Transportation | 6 (100.0%) | 0 (0.0%) |
| Material Moving | 0 (0.0%) | 5 (100.0%) |
| Total (Category) | 18 (78.3%) | 5 (21.7%) |
| Total (Overall) | 37 (41.1%) | 53 (58.9%) |
Employment Industries by Sex in Star City
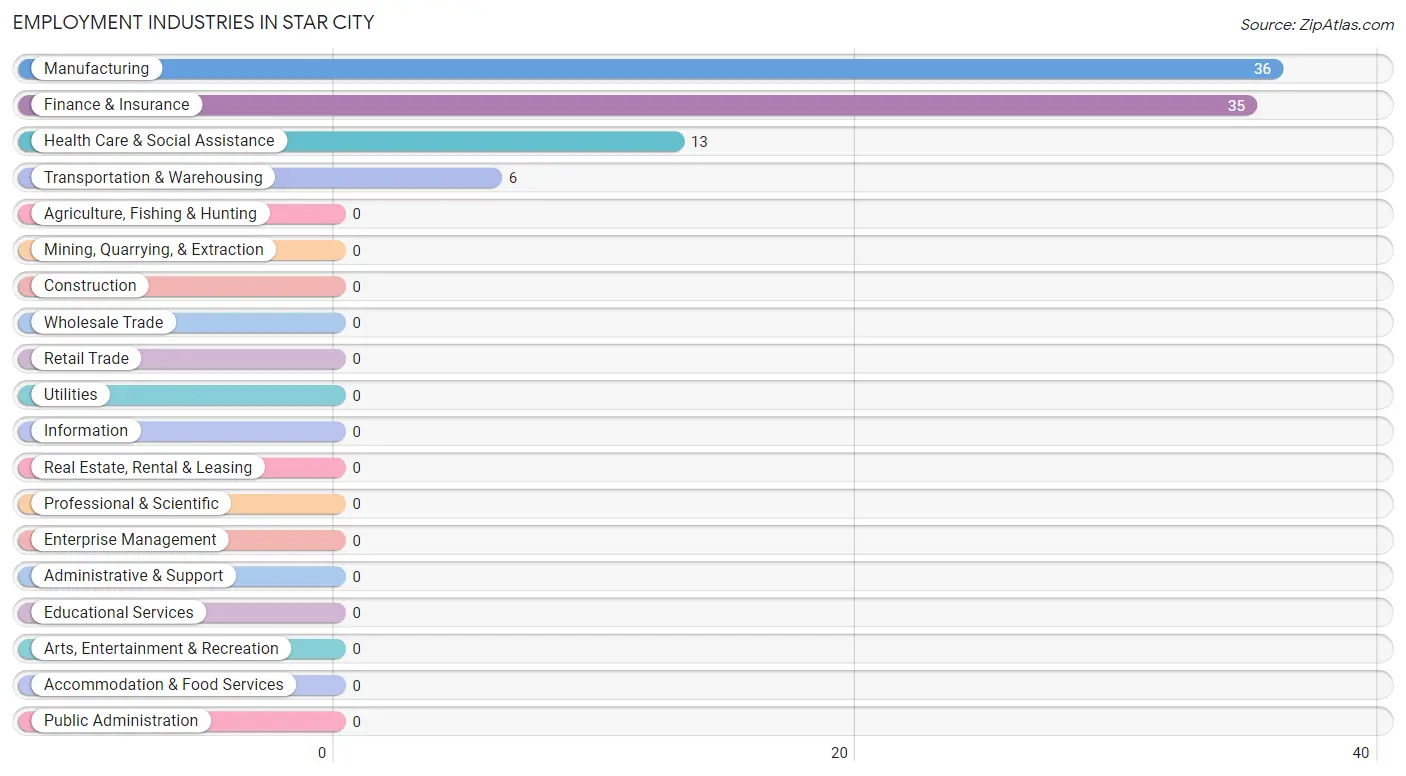
Employment Industries in Star City
The major employment industries in Star City include Manufacturing (36 | 40.0%), Finance & Insurance (35 | 38.9%), Health Care & Social Assistance (13 | 14.4%), and Transportation & Warehousing (6 | 6.7%).
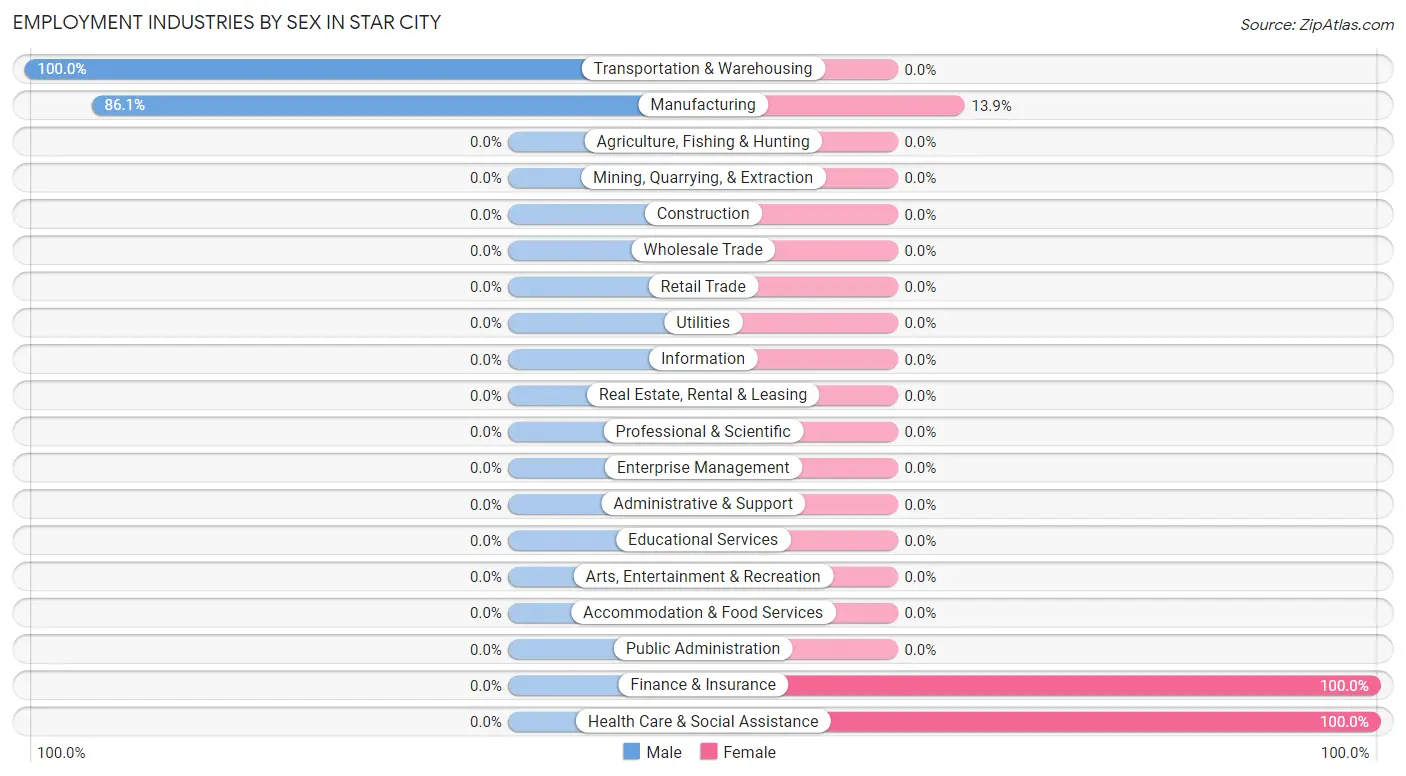
Employment Industries by Sex in Star City
The Star City industries that see more men than women are Transportation & Warehousing (100.0%), and Manufacturing (86.1%), whereas the industries that tend to have a higher number of women are Finance & Insurance (100.0%), Health Care & Social Assistance (100.0%), and Manufacturing (13.9%).
| Industry | Male | Female |
| Agriculture, Fishing & Hunting | 0 (0.0%) | 0 (0.0%) |
| Mining, Quarrying, & Extraction | 0 (0.0%) | 0 (0.0%) |
| Construction | 0 (0.0%) | 0 (0.0%) |
| Manufacturing | 31 (86.1%) | 5 (13.9%) |
| Wholesale Trade | 0 (0.0%) | 0 (0.0%) |
| Retail Trade | 0 (0.0%) | 0 (0.0%) |
| Transportation & Warehousing | 6 (100.0%) | 0 (0.0%) |
| Utilities | 0 (0.0%) | 0 (0.0%) |
| Information | 0 (0.0%) | 0 (0.0%) |
| Finance & Insurance | 0 (0.0%) | 35 (100.0%) |
| Real Estate, Rental & Leasing | 0 (0.0%) | 0 (0.0%) |
| Professional & Scientific | 0 (0.0%) | 0 (0.0%) |
| Enterprise Management | 0 (0.0%) | 0 (0.0%) |
| Administrative & Support | 0 (0.0%) | 0 (0.0%) |
| Educational Services | 0 (0.0%) | 0 (0.0%) |
| Health Care & Social Assistance | 0 (0.0%) | 13 (100.0%) |
| Arts, Entertainment & Recreation | 0 (0.0%) | 0 (0.0%) |
| Accommodation & Food Services | 0 (0.0%) | 0 (0.0%) |
| Public Administration | 0 (0.0%) | 0 (0.0%) |
| Total | 37 (41.1%) | 53 (58.9%) |
Education in Star City
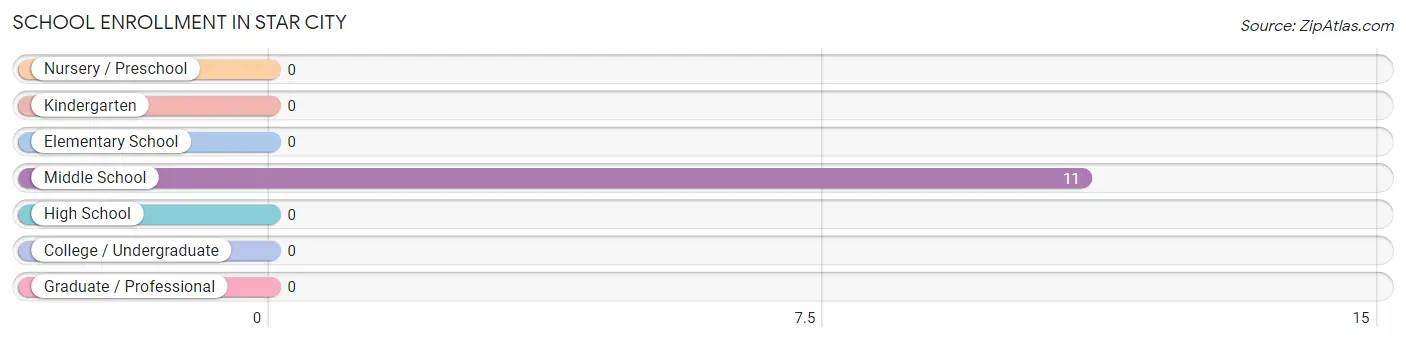
School Enrollment in Star City
| School Level | # Students | % Students |
| Nursery / Preschool | 0 | 0.0% |
| Kindergarten | 0 | 0.0% |
| Elementary School | 0 | 0.0% |
| Middle School | 11 | 100.0% |
| High School | 0 | 0.0% |
| College / Undergraduate | 0 | 0.0% |
| Graduate / Professional | 0 | 0.0% |
| Total | 11 | 100.0% |
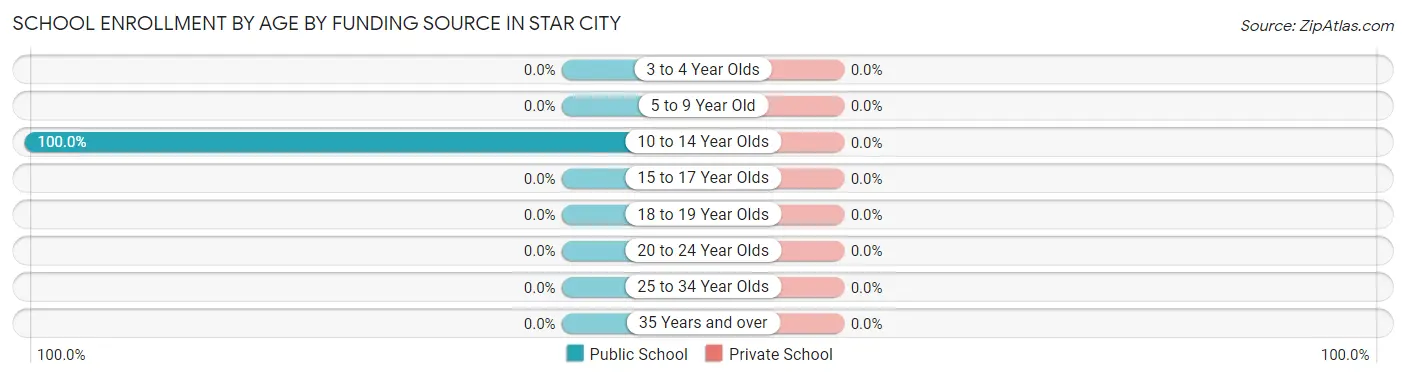
School Enrollment by Age by Funding Source in Star City
| Age Bracket | Public School | Private School |
| 3 to 4 Year Olds | 0 (0.0%) | 0 (0.0%) |
| 5 to 9 Year Old | 0 (0.0%) | 0 (0.0%) |
| 10 to 14 Year Olds | 11 (100.0%) | 0 (0.0%) |
| 15 to 17 Year Olds | 0 (0.0%) | 0 (0.0%) |
| 18 to 19 Year Olds | 0 (0.0%) | 0 (0.0%) |
| 20 to 24 Year Olds | 0 (0.0%) | 0 (0.0%) |
| 25 to 34 Year Olds | 0 (0.0%) | 0 (0.0%) |
| 35 Years and over | 0 (0.0%) | 0 (0.0%) |
| Total | 11 (100.0%) | 0 (0.0%) |
Educational Attainment by Field of Study in Star City
, and business (13 | 100.0%) are the most common fields of study among 13 individuals in Star City who have obtained a bachelor's degree or higher.
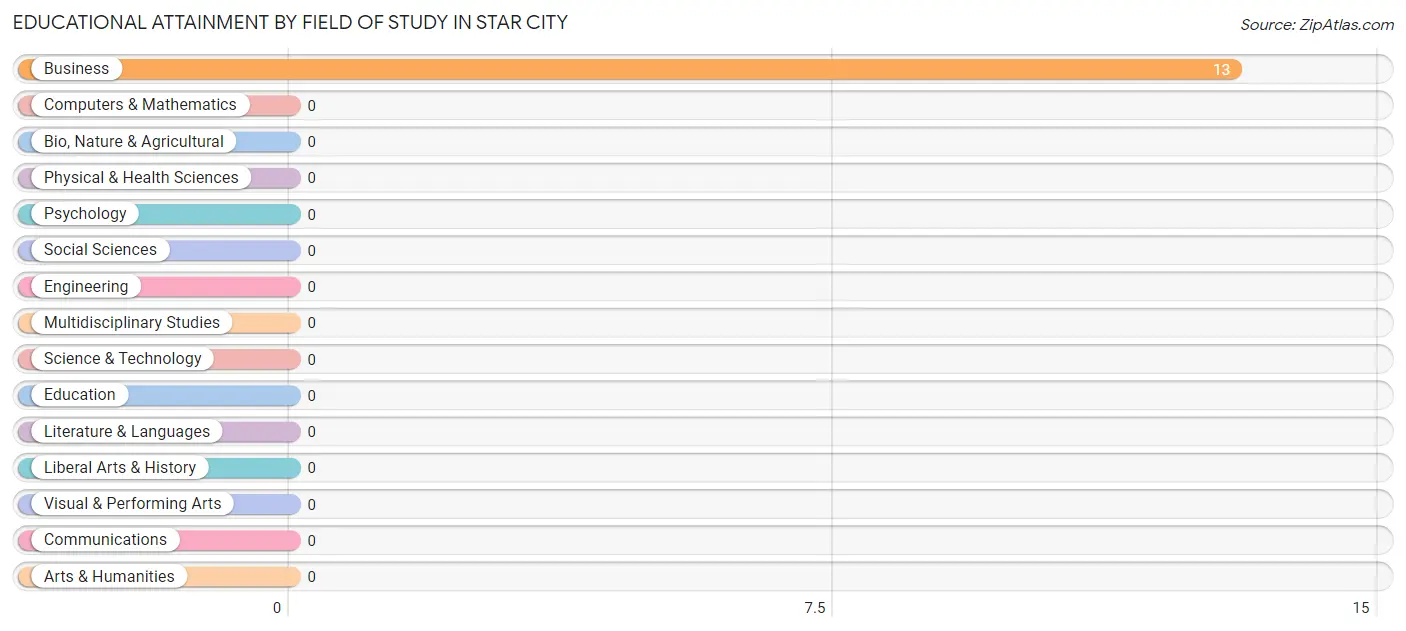
| Field of Study | # Graduates | % Graduates |
| Computers & Mathematics | 0 | 0.0% |
| Bio, Nature & Agricultural | 0 | 0.0% |
| Physical & Health Sciences | 0 | 0.0% |
| Psychology | 0 | 0.0% |
| Social Sciences | 0 | 0.0% |
| Engineering | 0 | 0.0% |
| Multidisciplinary Studies | 0 | 0.0% |
| Science & Technology | 0 | 0.0% |
| Business | 13 | 100.0% |
| Education | 0 | 0.0% |
| Literature & Languages | 0 | 0.0% |
| Liberal Arts & History | 0 | 0.0% |
| Visual & Performing Arts | 0 | 0.0% |
| Communications | 0 | 0.0% |
| Arts & Humanities | 0 | 0.0% |
| Total | 13 | 100.0% |
Transportation & Commute in Star City
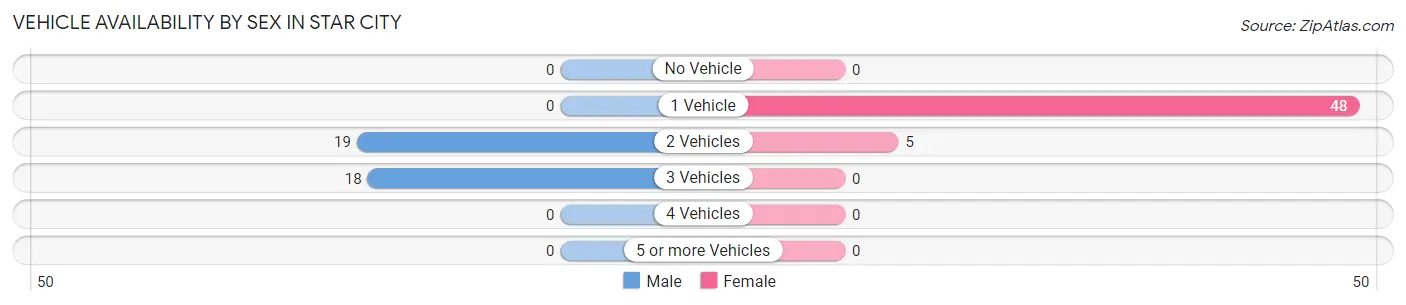
Vehicle Availability by Sex in Star City
The most prevalent vehicle ownership categories in Star City are males with 2 vehicles (19, accounting for 51.3%) and females with 2 vehicles (5, making up 35.8%).
| Vehicles Available | Male | Female |
| No Vehicle | 0 (0.0%) | 0 (0.0%) |
| 1 Vehicle | 0 (0.0%) | 48 (90.6%) |
| 2 Vehicles | 19 (51.3%) | 5 (9.4%) |
| 3 Vehicles | 18 (48.6%) | 0 (0.0%) |
| 4 Vehicles | 0 (0.0%) | 0 (0.0%) |
| 5 or more Vehicles | 0 (0.0%) | 0 (0.0%) |
| Total | 37 (100.0%) | 53 (100.0%) |
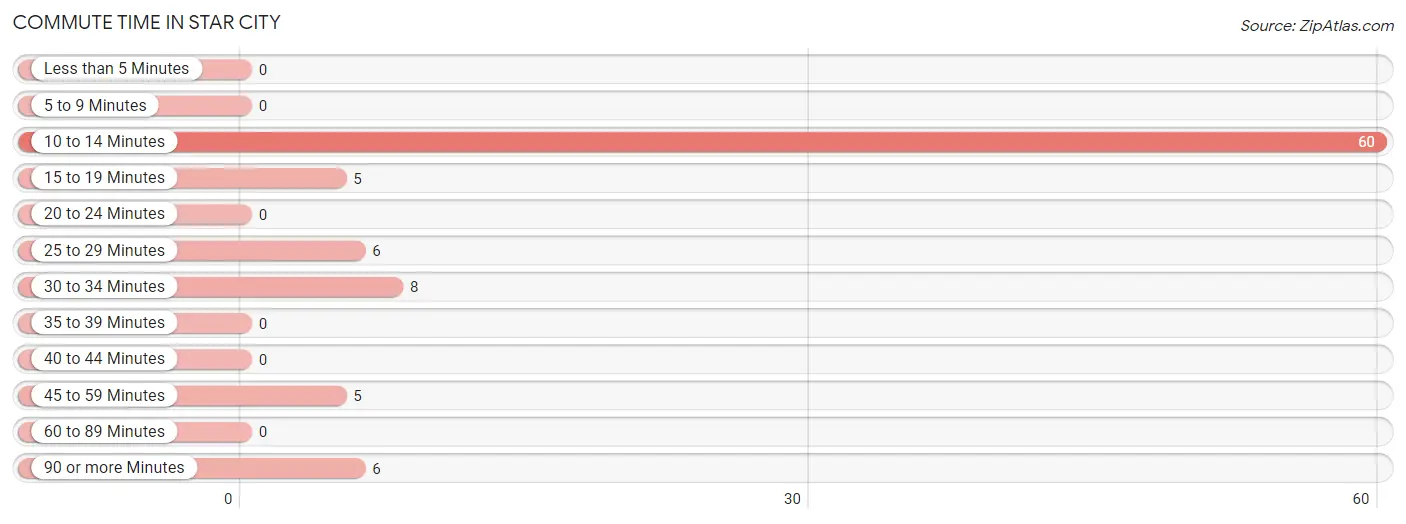
Commute Time in Star City
The most frequently occuring commute durations in Star City are 10 to 14 minutes (60 commuters, 66.7%), 30 to 34 minutes (8 commuters, 8.9%), and 25 to 29 minutes (6 commuters, 6.7%).
| Commute Time | # Commuters | % Commuters |
| Less than 5 Minutes | 0 | 0.0% |
| 5 to 9 Minutes | 0 | 0.0% |
| 10 to 14 Minutes | 60 | 66.7% |
| 15 to 19 Minutes | 5 | 5.6% |
| 20 to 24 Minutes | 0 | 0.0% |
| 25 to 29 Minutes | 6 | 6.7% |
| 30 to 34 Minutes | 8 | 8.9% |
| 35 to 39 Minutes | 0 | 0.0% |
| 40 to 44 Minutes | 0 | 0.0% |
| 45 to 59 Minutes | 5 | 5.6% |
| 60 to 89 Minutes | 0 | 0.0% |
| 90 or more Minutes | 6 | 6.7% |
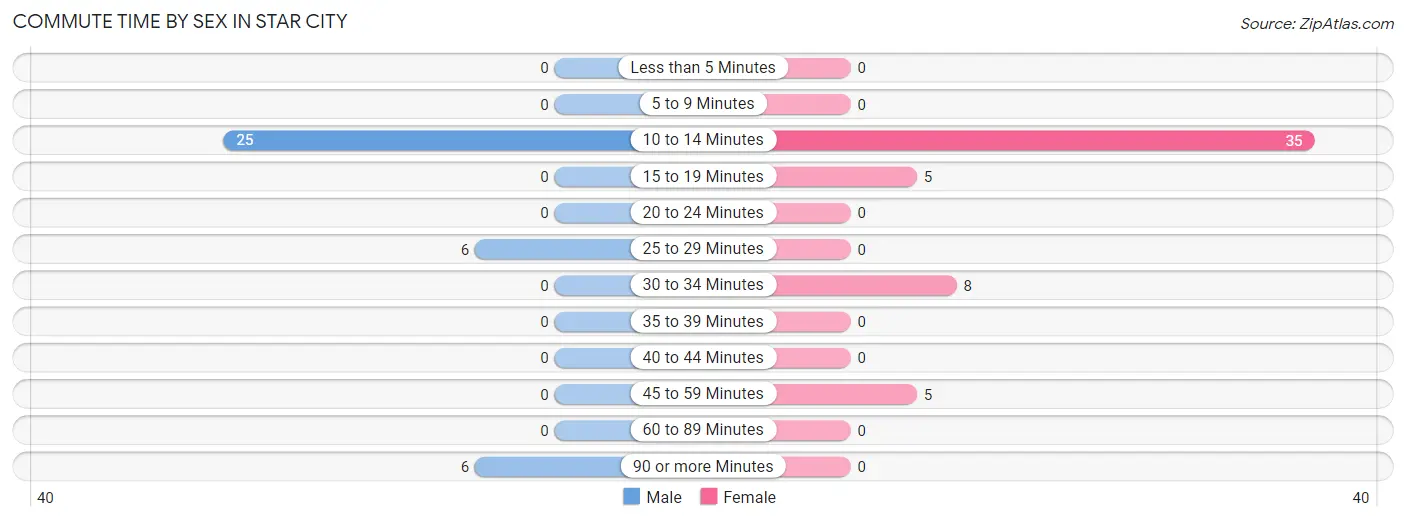
Commute Time by Sex in Star City
The most common commute times in Star City are 10 to 14 minutes (25 commuters, 67.6%) for males and 10 to 14 minutes (35 commuters, 66.0%) for females.
| Commute Time | Male | Female |
| Less than 5 Minutes | 0 (0.0%) | 0 (0.0%) |
| 5 to 9 Minutes | 0 (0.0%) | 0 (0.0%) |
| 10 to 14 Minutes | 25 (67.6%) | 35 (66.0%) |
| 15 to 19 Minutes | 0 (0.0%) | 5 (9.4%) |
| 20 to 24 Minutes | 0 (0.0%) | 0 (0.0%) |
| 25 to 29 Minutes | 6 (16.2%) | 0 (0.0%) |
| 30 to 34 Minutes | 0 (0.0%) | 8 (15.1%) |
| 35 to 39 Minutes | 0 (0.0%) | 0 (0.0%) |
| 40 to 44 Minutes | 0 (0.0%) | 0 (0.0%) |
| 45 to 59 Minutes | 0 (0.0%) | 5 (9.4%) |
| 60 to 89 Minutes | 0 (0.0%) | 0 (0.0%) |
| 90 or more Minutes | 6 (16.2%) | 0 (0.0%) |
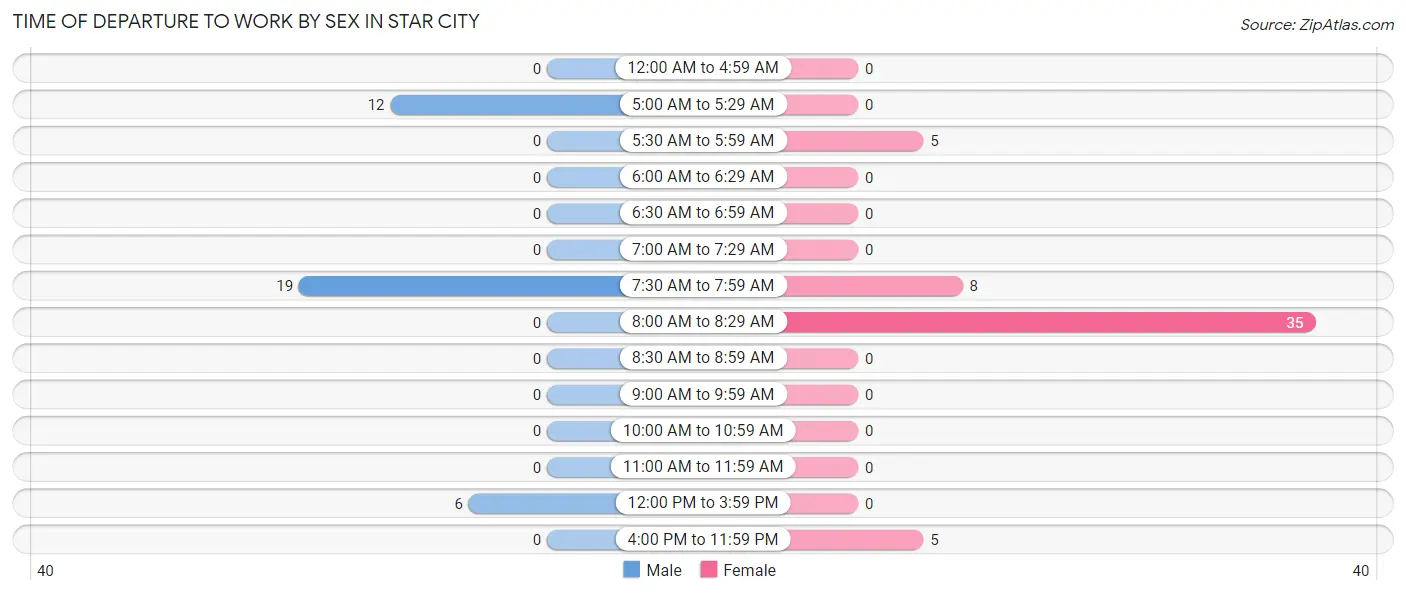
Time of Departure to Work by Sex in Star City
The most frequent times of departure to work in Star City are 7:30 AM to 7:59 AM (19, 51.3%) for males and 8:00 AM to 8:29 AM (35, 66.0%) for females.
| Time of Departure | Male | Female |
| 12:00 AM to 4:59 AM | 0 (0.0%) | 0 (0.0%) |
| 5:00 AM to 5:29 AM | 12 (32.4%) | 0 (0.0%) |
| 5:30 AM to 5:59 AM | 0 (0.0%) | 5 (9.4%) |
| 6:00 AM to 6:29 AM | 0 (0.0%) | 0 (0.0%) |
| 6:30 AM to 6:59 AM | 0 (0.0%) | 0 (0.0%) |
| 7:00 AM to 7:29 AM | 0 (0.0%) | 0 (0.0%) |
| 7:30 AM to 7:59 AM | 19 (51.3%) | 8 (15.1%) |
| 8:00 AM to 8:29 AM | 0 (0.0%) | 35 (66.0%) |
| 8:30 AM to 8:59 AM | 0 (0.0%) | 0 (0.0%) |
| 9:00 AM to 9:59 AM | 0 (0.0%) | 0 (0.0%) |
| 10:00 AM to 10:59 AM | 0 (0.0%) | 0 (0.0%) |
| 11:00 AM to 11:59 AM | 0 (0.0%) | 0 (0.0%) |
| 12:00 PM to 3:59 PM | 6 (16.2%) | 0 (0.0%) |
| 4:00 PM to 11:59 PM | 0 (0.0%) | 5 (9.4%) |
| Total | 37 (100.0%) | 53 (100.0%) |
Housing Occupancy in Star City
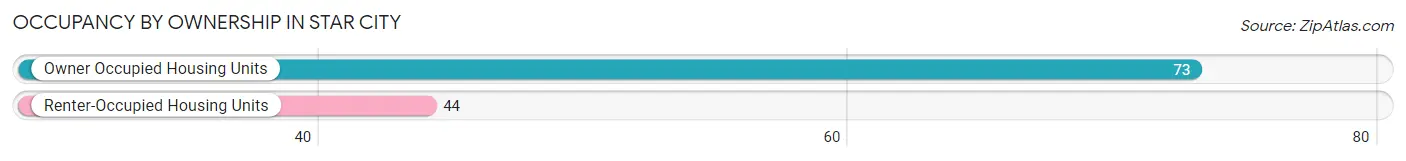
Occupancy by Ownership in Star City
Of the total 117 dwellings in Star City, owner-occupied units account for 73 (62.4%), while renter-occupied units make up 44 (37.6%).
| Occupancy | # Housing Units | % Housing Units |
| Owner Occupied Housing Units | 73 | 62.4% |
| Renter-Occupied Housing Units | 44 | 37.6% |
| Total Occupied Housing Units | 117 | 100.0% |
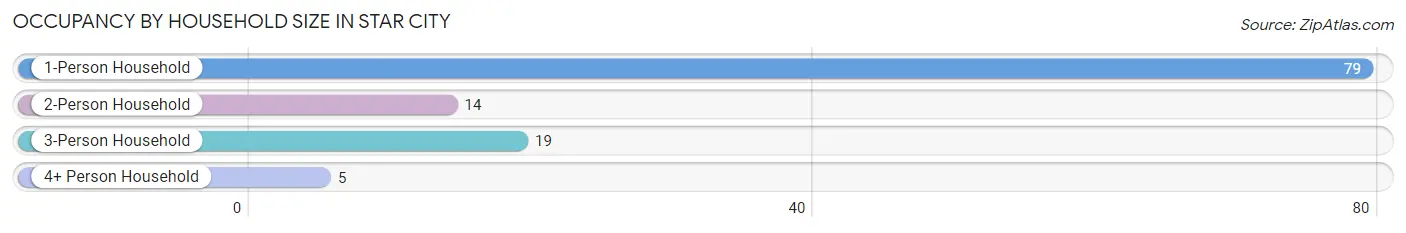
Occupancy by Household Size in Star City
| Household Size | # Housing Units | % Housing Units |
| 1-Person Household | 79 | 67.5% |
| 2-Person Household | 14 | 12.0% |
| 3-Person Household | 19 | 16.2% |
| 4+ Person Household | 5 | 4.3% |
| Total Housing Units | 117 | 100.0% |
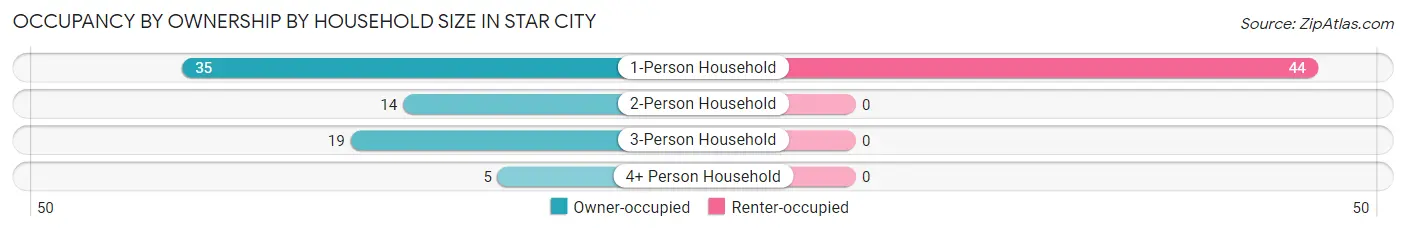
Occupancy by Ownership by Household Size in Star City
| Household Size | Owner-occupied | Renter-occupied |
| 1-Person Household | 35 (44.3%) | 44 (55.7%) |
| 2-Person Household | 14 (100.0%) | 0 (0.0%) |
| 3-Person Household | 19 (100.0%) | 0 (0.0%) |
| 4+ Person Household | 5 (100.0%) | 0 (0.0%) |
| Total Housing Units | 73 (62.4%) | 44 (37.6%) |
Occupancy by Educational Attainment in Star City
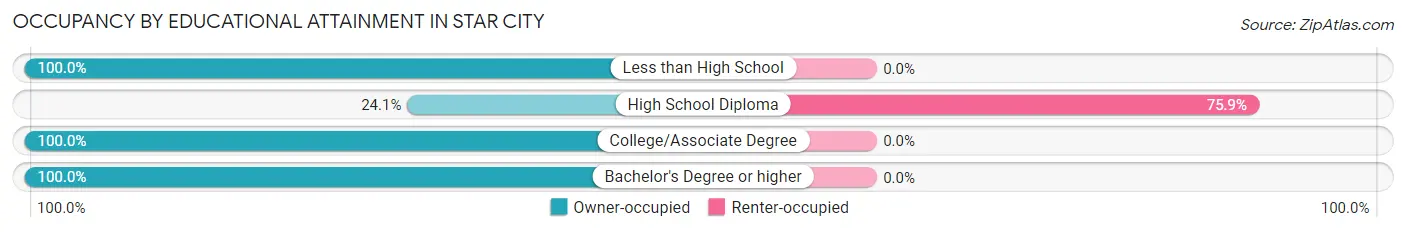
| Household Size | Owner-occupied | Renter-occupied |
| Less than High School | 6 (100.0%) | 0 (0.0%) |
| High School Diploma | 14 (24.1%) | 44 (75.9%) |
| College/Associate Degree | 40 (100.0%) | 0 (0.0%) |
| Bachelor's Degree or higher | 13 (100.0%) | 0 (0.0%) |
Occupancy by Age of Householder in Star City
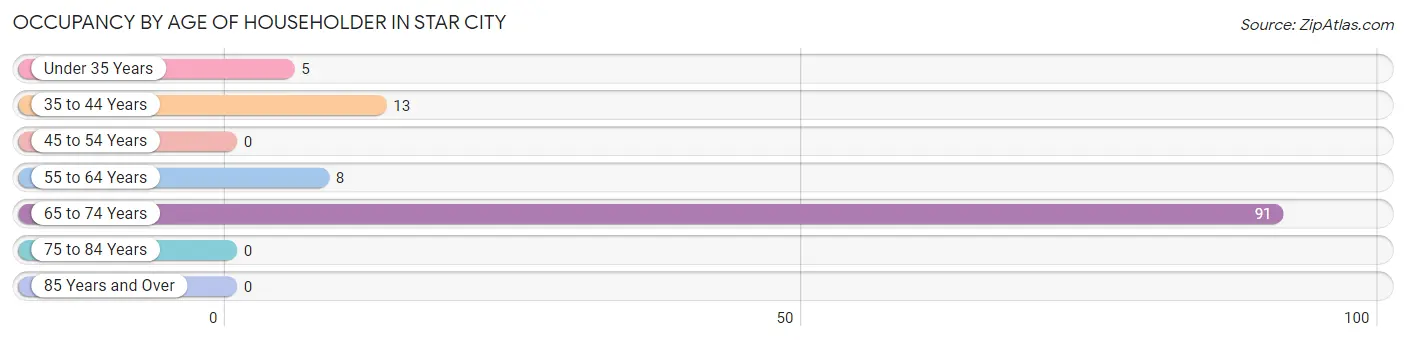
| Age Bracket | # Households | % Households |
| Under 35 Years | 5 | 4.3% |
| 35 to 44 Years | 13 | 11.1% |
| 45 to 54 Years | 0 | 0.0% |
| 55 to 64 Years | 8 | 6.8% |
| 65 to 74 Years | 91 | 77.8% |
| 75 to 84 Years | 0 | 0.0% |
| 85 Years and Over | 0 | 0.0% |
| Total | 117 | 100.0% |
Housing Finances in Star City
Median Income by Occupancy in Star City
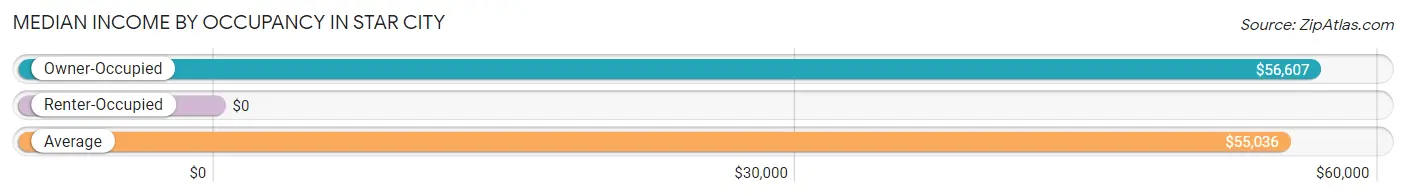
| Occupancy Type | # Households | Median Income |
| Owner-Occupied | 73 (62.4%) | $56,607 |
| Renter-Occupied | 44 (37.6%) | $0 |
| Average | 117 (100.0%) | $55,036 |
Occupancy by Householder Income Bracket in Star City
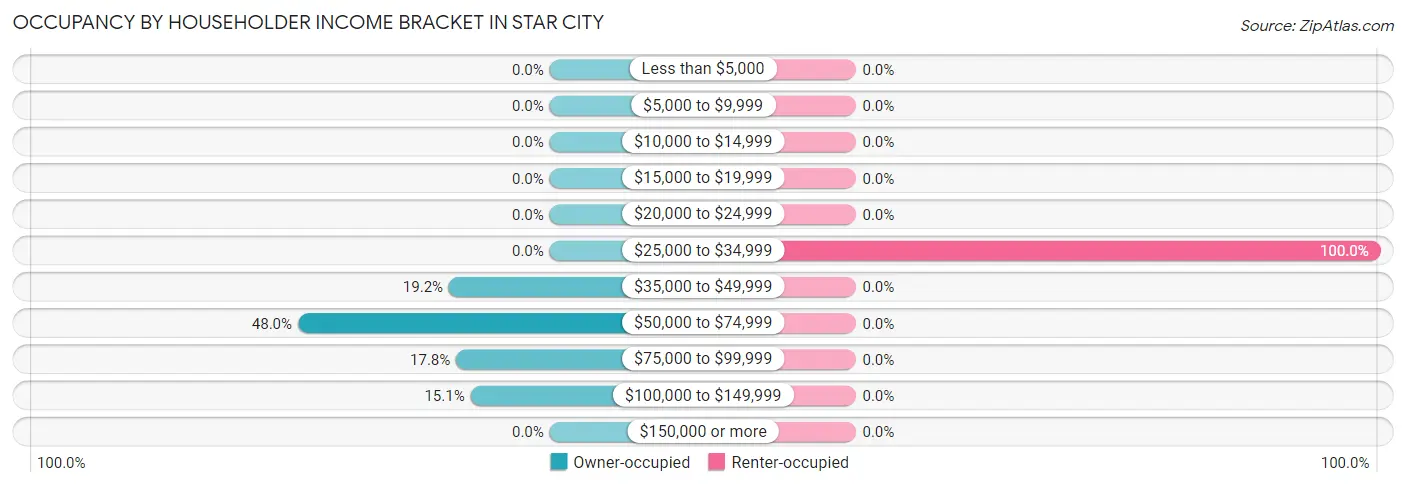
| Income Bracket | Owner-occupied | Renter-occupied |
| Less than $5,000 | 0 (0.0%) | 0 (0.0%) |
| $5,000 to $9,999 | 0 (0.0%) | 0 (0.0%) |
| $10,000 to $14,999 | 0 (0.0%) | 0 (0.0%) |
| $15,000 to $19,999 | 0 (0.0%) | 0 (0.0%) |
| $20,000 to $24,999 | 0 (0.0%) | 0 (0.0%) |
| $25,000 to $34,999 | 0 (0.0%) | 44 (100.0%) |
| $35,000 to $49,999 | 14 (19.2%) | 0 (0.0%) |
| $50,000 to $74,999 | 35 (47.9%) | 0 (0.0%) |
| $75,000 to $99,999 | 13 (17.8%) | 0 (0.0%) |
| $100,000 to $149,999 | 11 (15.1%) | 0 (0.0%) |
| $150,000 or more | 0 (0.0%) | 0 (0.0%) |
| Total | 73 (100.0%) | 44 (100.0%) |
Monthly Housing Cost Tiers in Star City
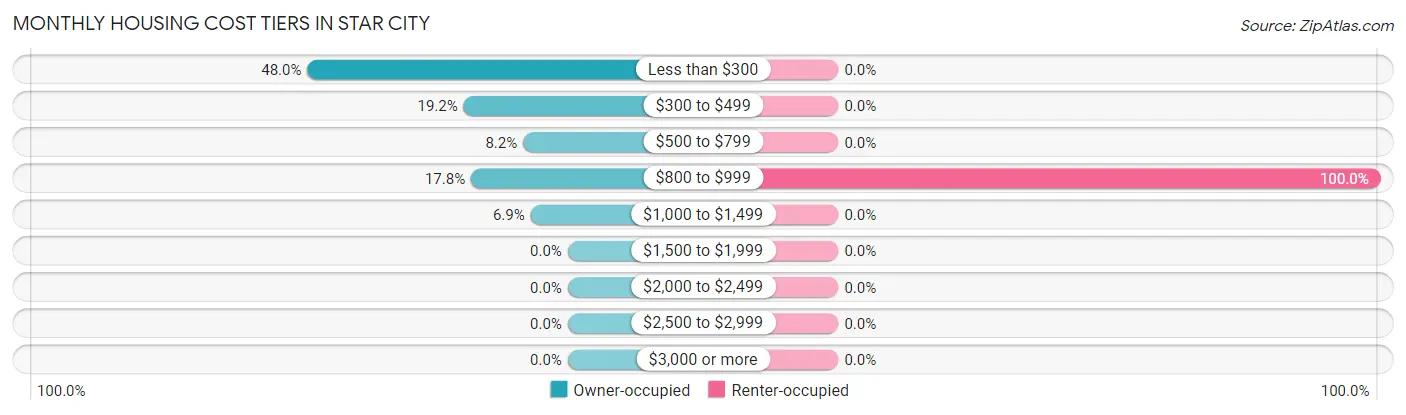
| Monthly Cost | Owner-occupied | Renter-occupied |
| Less than $300 | 35 (47.9%) | 0 (0.0%) |
| $300 to $499 | 14 (19.2%) | 0 (0.0%) |
| $500 to $799 | 6 (8.2%) | 0 (0.0%) |
| $800 to $999 | 13 (17.8%) | 44 (100.0%) |
| $1,000 to $1,499 | 5 (6.9%) | 0 (0.0%) |
| $1,500 to $1,999 | 0 (0.0%) | 0 (0.0%) |
| $2,000 to $2,499 | 0 (0.0%) | 0 (0.0%) |
| $2,500 to $2,999 | 0 (0.0%) | 0 (0.0%) |
| $3,000 or more | 0 (0.0%) | 0 (0.0%) |
| Total | 73 (100.0%) | 44 (100.0%) |
Physical Housing Characteristics in Star City
Housing Structures in Star City
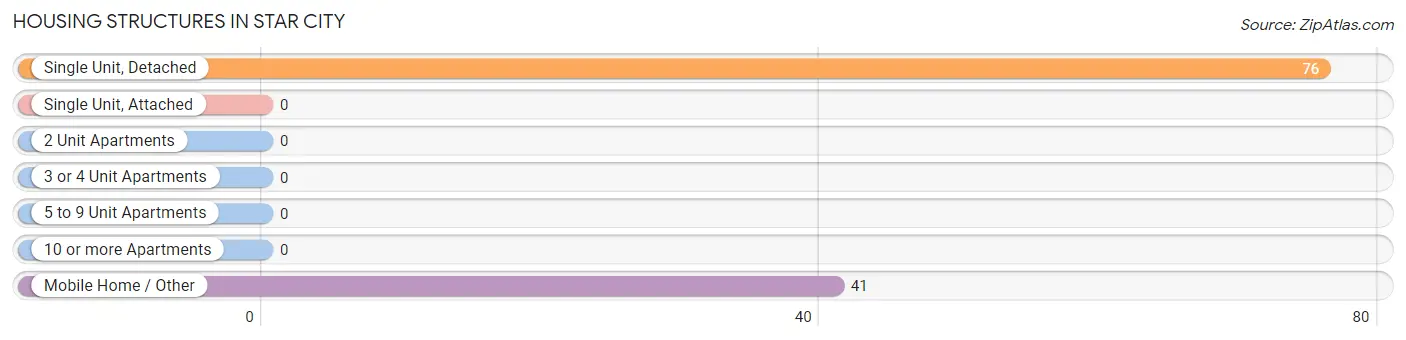
| Structure Type | # Housing Units | % Housing Units |
| Single Unit, Detached | 76 | 65.0% |
| Single Unit, Attached | 0 | 0.0% |
| 2 Unit Apartments | 0 | 0.0% |
| 3 or 4 Unit Apartments | 0 | 0.0% |
| 5 to 9 Unit Apartments | 0 | 0.0% |
| 10 or more Apartments | 0 | 0.0% |
| Mobile Home / Other | 41 | 35.0% |
| Total | 117 | 100.0% |
Housing Structures by Occupancy in Star City
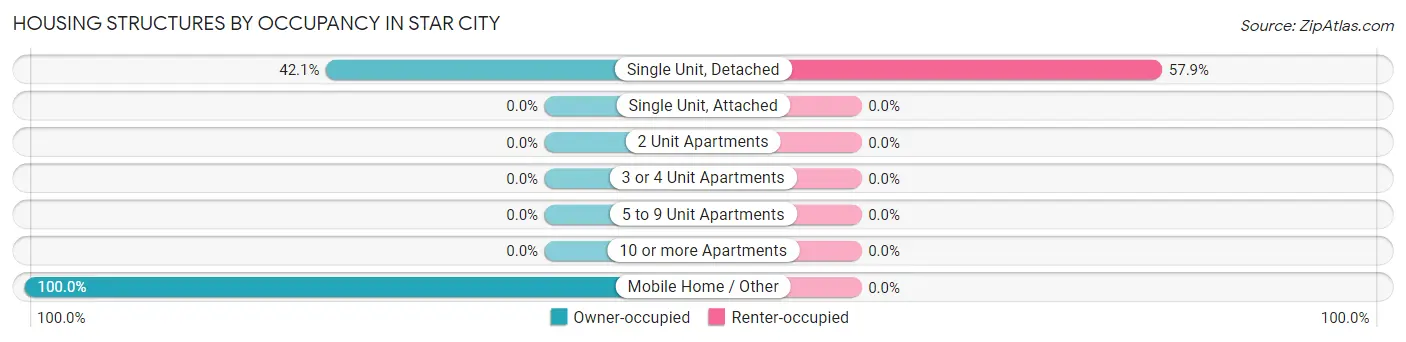
| Structure Type | Owner-occupied | Renter-occupied |
| Single Unit, Detached | 32 (42.1%) | 44 (57.9%) |
| Single Unit, Attached | 0 (0.0%) | 0 (0.0%) |
| 2 Unit Apartments | 0 (0.0%) | 0 (0.0%) |
| 3 or 4 Unit Apartments | 0 (0.0%) | 0 (0.0%) |
| 5 to 9 Unit Apartments | 0 (0.0%) | 0 (0.0%) |
| 10 or more Apartments | 0 (0.0%) | 0 (0.0%) |
| Mobile Home / Other | 41 (100.0%) | 0 (0.0%) |
| Total | 73 (62.4%) | 44 (37.6%) |
Housing Structures by Number of Rooms in Star City
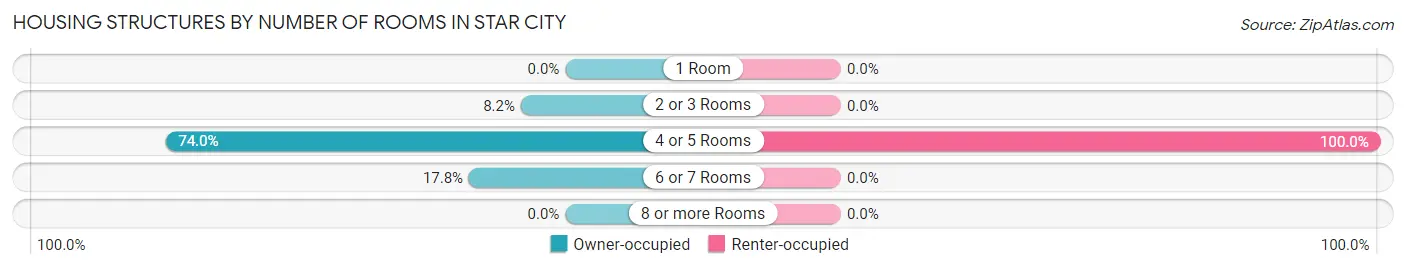
| Number of Rooms | Owner-occupied | Renter-occupied |
| 1 Room | 0 (0.0%) | 0 (0.0%) |
| 2 or 3 Rooms | 6 (8.2%) | 0 (0.0%) |
| 4 or 5 Rooms | 54 (74.0%) | 44 (100.0%) |
| 6 or 7 Rooms | 13 (17.8%) | 0 (0.0%) |
| 8 or more Rooms | 0 (0.0%) | 0 (0.0%) |
| Total | 73 (100.0%) | 44 (100.0%) |
Housing Structure by Heating Type in Star City
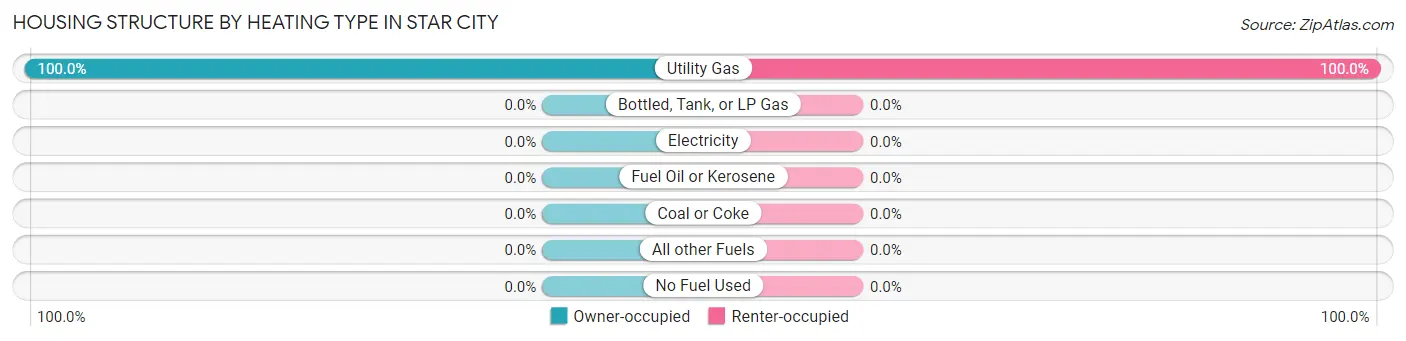
| Heating Type | Owner-occupied | Renter-occupied |
| Utility Gas | 73 (100.0%) | 44 (100.0%) |
| Bottled, Tank, or LP Gas | 0 (0.0%) | 0 (0.0%) |
| Electricity | 0 (0.0%) | 0 (0.0%) |
| Fuel Oil or Kerosene | 0 (0.0%) | 0 (0.0%) |
| Coal or Coke | 0 (0.0%) | 0 (0.0%) |
| All other Fuels | 0 (0.0%) | 0 (0.0%) |
| No Fuel Used | 0 (0.0%) | 0 (0.0%) |
| Total | 73 (100.0%) | 44 (100.0%) |
Household Vehicle Usage in Star City
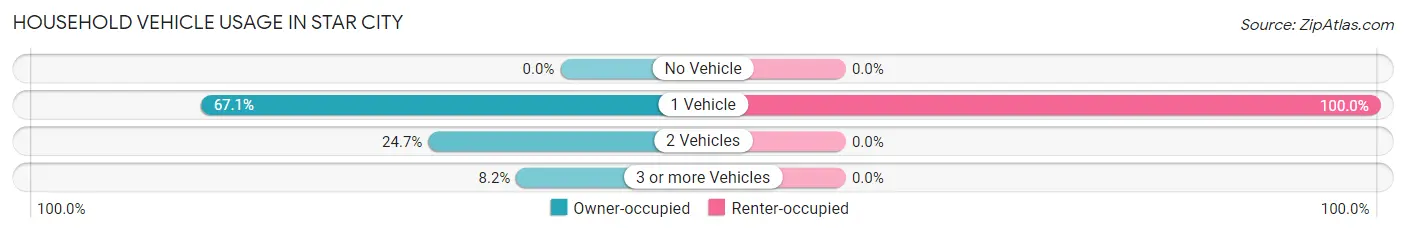
| Vehicles per Household | Owner-occupied | Renter-occupied |
| No Vehicle | 0 (0.0%) | 0 (0.0%) |
| 1 Vehicle | 49 (67.1%) | 44 (100.0%) |
| 2 Vehicles | 18 (24.7%) | 0 (0.0%) |
| 3 or more Vehicles | 6 (8.2%) | 0 (0.0%) |
| Total | 73 (100.0%) | 44 (100.0%) |
Real Estate & Mortgages in Star City
Real Estate and Mortgage Overview in Star City
| Characteristic | Without Mortgage | With Mortgage |
| Housing Units | 55 | 18 |
| Median Property Value | $9,999 | $0 |
| Median Household Income | $55,964 | $0 |
| Monthly Housing Costs | $289 | $0 |
| Real Estate Taxes | $199 | $0 |
Property Value by Mortgage Status in Star City
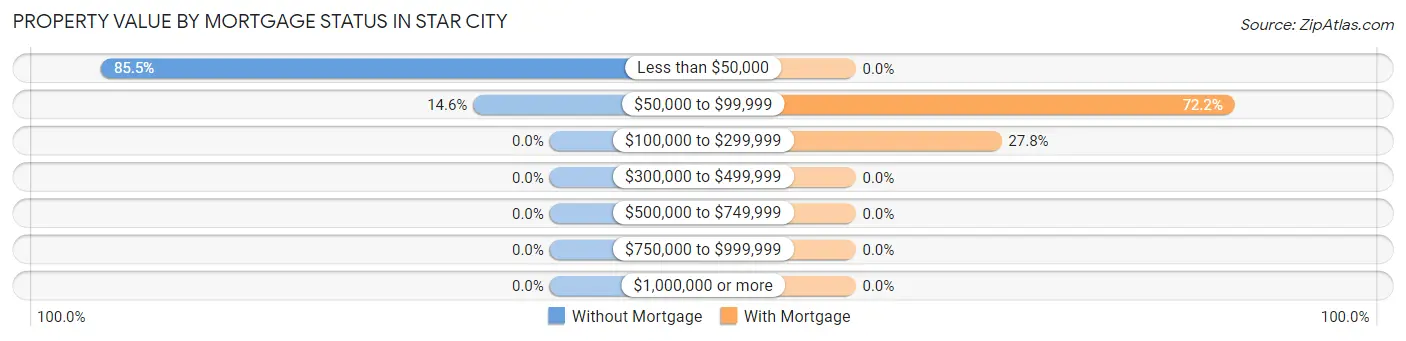
| Property Value | Without Mortgage | With Mortgage |
| Less than $50,000 | 47 (85.5%) | 0 (0.0%) |
| $50,000 to $99,999 | 8 (14.5%) | 13 (72.2%) |
| $100,000 to $299,999 | 0 (0.0%) | 5 (27.8%) |
| $300,000 to $499,999 | 0 (0.0%) | 0 (0.0%) |
| $500,000 to $749,999 | 0 (0.0%) | 0 (0.0%) |
| $750,000 to $999,999 | 0 (0.0%) | 0 (0.0%) |
| $1,000,000 or more | 0 (0.0%) | 0 (0.0%) |
| Total | 55 (100.0%) | 18 (100.0%) |
Household Income by Mortgage Status in Star City
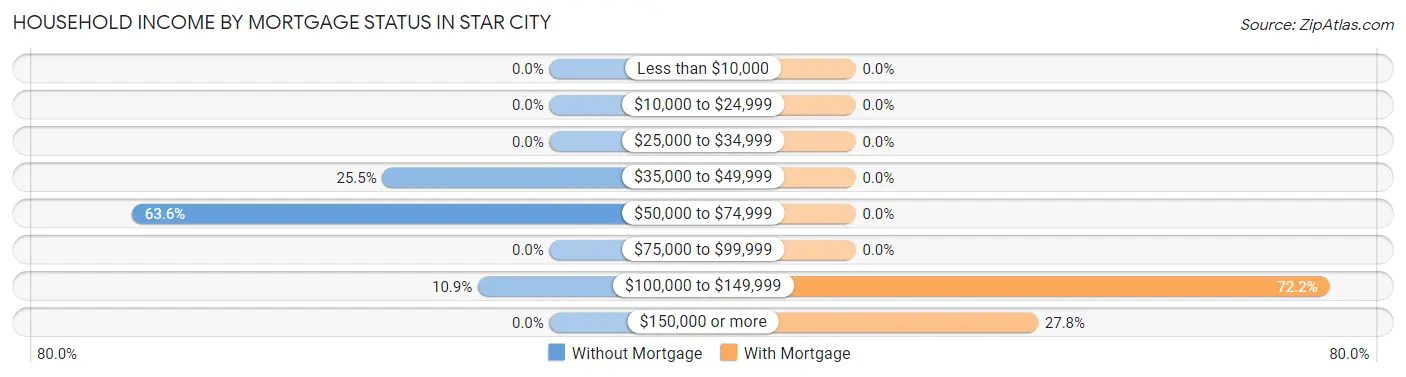
| Household Income | Without Mortgage | With Mortgage |
| Less than $10,000 | 0 (0.0%) | 0 (0.0%) |
| $10,000 to $24,999 | 0 (0.0%) | 0 (0.0%) |
| $25,000 to $34,999 | 0 (0.0%) | 0 (0.0%) |
| $35,000 to $49,999 | 14 (25.5%) | 0 (0.0%) |
| $50,000 to $74,999 | 35 (63.6%) | 0 (0.0%) |
| $75,000 to $99,999 | 0 (0.0%) | 0 (0.0%) |
| $100,000 to $149,999 | 6 (10.9%) | 13 (72.2%) |
| $150,000 or more | 0 (0.0%) | 5 (27.8%) |
| Total | 55 (100.0%) | 18 (100.0%) |
Property Value to Household Income Ratio in Star City
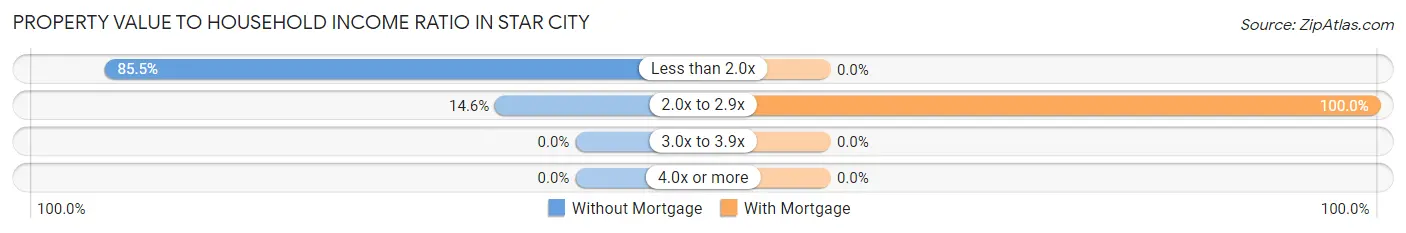
| Value-to-Income Ratio | Without Mortgage | With Mortgage |
| Less than 2.0x | 47 (85.5%) | 0 (0.0%) |
| 2.0x to 2.9x | 8 (14.5%) | 18 (100.0%) |
| 3.0x to 3.9x | 0 (0.0%) | 0 (0.0%) |
| 4.0x or more | 0 (0.0%) | 0 (0.0%) |
| Total | 55 (100.0%) | 18 (100.0%) |
Real Estate Taxes by Mortgage Status in Star City
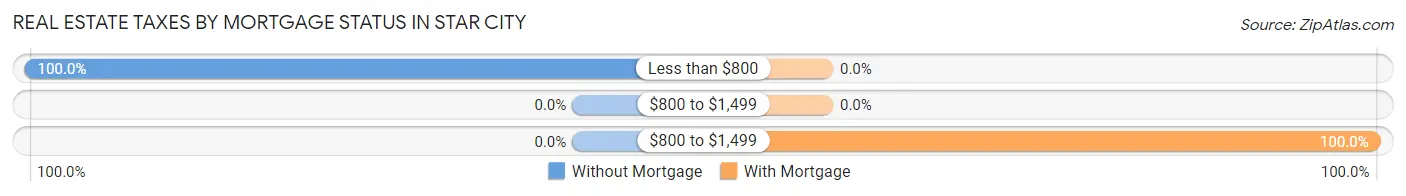
| Property Taxes | Without Mortgage | With Mortgage |
| Less than $800 | 55 (100.0%) | 0 (0.0%) |
| $800 to $1,499 | 0 (0.0%) | 0 (0.0%) |
| $800 to $1,499 | 0 (0.0%) | 18 (100.0%) |
| Total | 55 (100.0%) | 18 (100.0%) |
Health & Disability in Star City
Health Insurance Coverage by Age in Star City
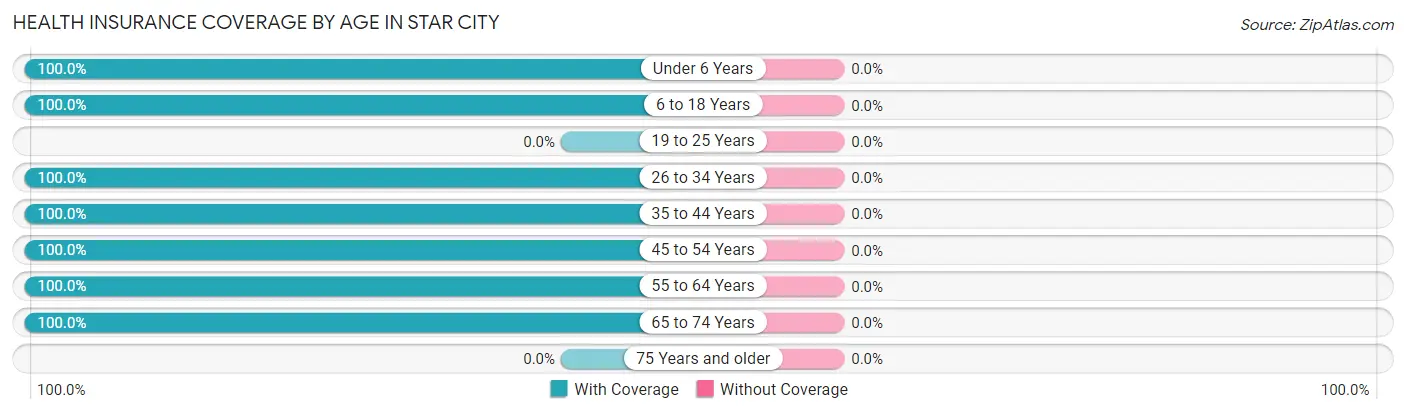
| Age Bracket | With Coverage | Without Coverage |
| Under 6 Years | 28 (100.0%) | 0 (0.0%) |
| 6 to 18 Years | 11 (100.0%) | 0 (0.0%) |
| 19 to 25 Years | 0 (0.0%) | 0 (0.0%) |
| 26 to 34 Years | 11 (100.0%) | 0 (0.0%) |
| 35 to 44 Years | 24 (100.0%) | 0 (0.0%) |
| 45 to 54 Years | 9 (100.0%) | 0 (0.0%) |
| 55 to 64 Years | 40 (100.0%) | 0 (0.0%) |
| 65 to 74 Years | 103 (100.0%) | 0 (0.0%) |
| 75 Years and older | 0 (0.0%) | 0 (0.0%) |
| Total | 226 (100.0%) | 0 (0.0%) |
Health Insurance Coverage by Citizenship Status in Star City

| Citizenship Status | With Coverage | Without Coverage |
| Native Born | 28 (100.0%) | 0 (0.0%) |
| Foreign Born, Citizen | 11 (100.0%) | 0 (0.0%) |
| Foreign Born, not a Citizen | 0 (0.0%) | 0 (0.0%) |
Health Insurance Coverage by Household Income in Star City
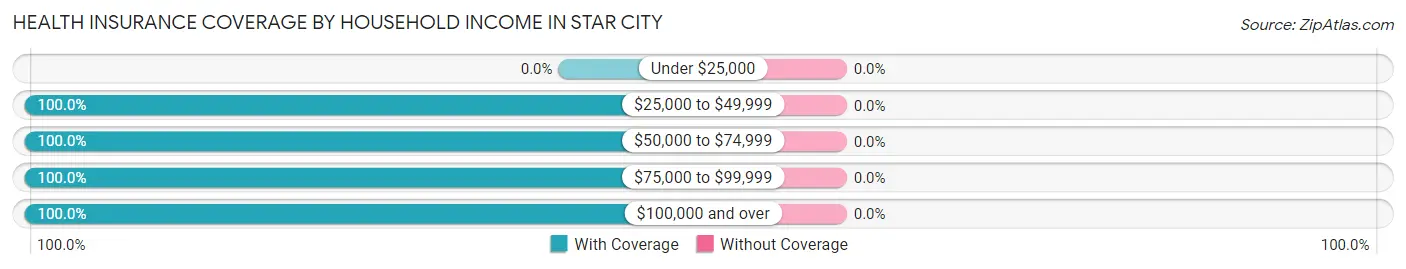
| Household Income | With Coverage | Without Coverage |
| Under $25,000 | 0 (0.0%) | 0 (0.0%) |
| $25,000 to $49,999 | 83 (100.0%) | 0 (0.0%) |
| $50,000 to $74,999 | 35 (100.0%) | 0 (0.0%) |
| $75,000 to $99,999 | 51 (100.0%) | 0 (0.0%) |
| $100,000 and over | 57 (100.0%) | 0 (0.0%) |
Public vs Private Health Insurance Coverage by Age in Star City
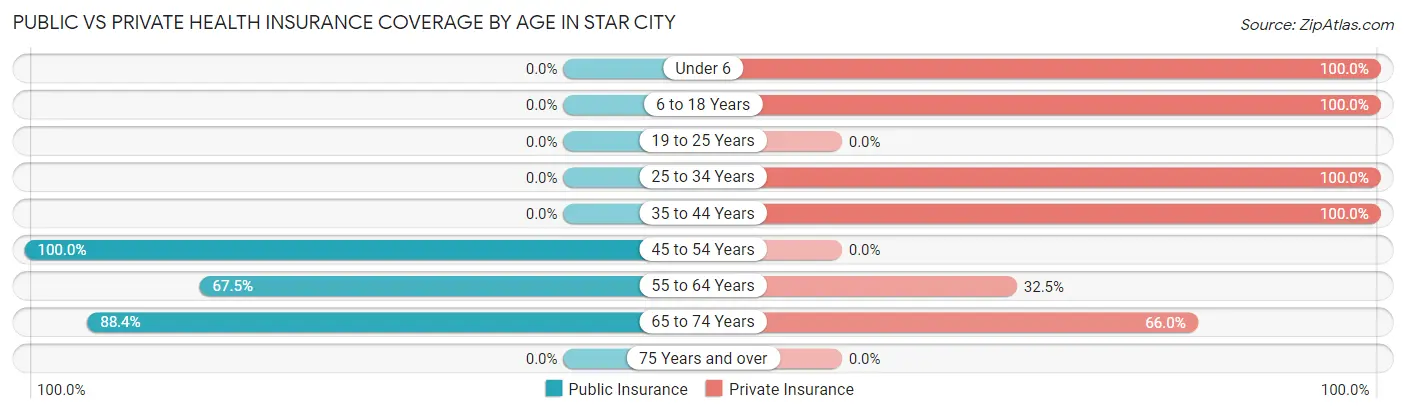
| Age Bracket | Public Insurance | Private Insurance |
| Under 6 | 0 (0.0%) | 28 (100.0%) |
| 6 to 18 Years | 0 (0.0%) | 11 (100.0%) |
| 19 to 25 Years | 0 (0.0%) | 0 (0.0%) |
| 25 to 34 Years | 0 (0.0%) | 11 (100.0%) |
| 35 to 44 Years | 0 (0.0%) | 24 (100.0%) |
| 45 to 54 Years | 9 (100.0%) | 0 (0.0%) |
| 55 to 64 Years | 27 (67.5%) | 13 (32.5%) |
| 65 to 74 Years | 91 (88.3%) | 68 (66.0%) |
| 75 Years and over | 0 (0.0%) | 0 (0.0%) |
| Total | 127 (56.2%) | 155 (68.6%) |
Disability Status by Sex by Age in Star City
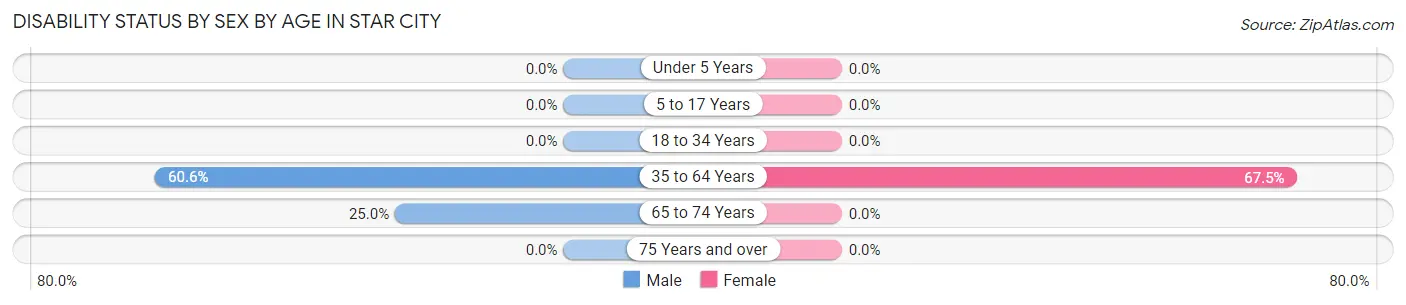
| Age Bracket | Male | Female |
| Under 5 Years | 0 (0.0%) | 0 (0.0%) |
| 5 to 17 Years | 0 (0.0%) | 0 (0.0%) |
| 18 to 34 Years | 0 (0.0%) | 0 (0.0%) |
| 35 to 64 Years | 20 (60.6%) | 27 (67.5%) |
| 65 to 74 Years | 6 (25.0%) | 0 (0.0%) |
| 75 Years and over | 0 (0.0%) | 0 (0.0%) |
Disability Class by Sex by Age in Star City
Disability Class: Hearing Difficulty
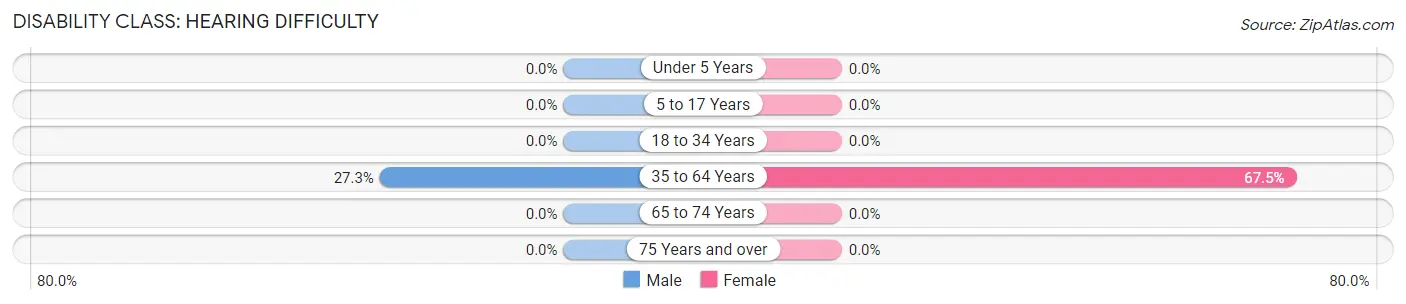
| Age Bracket | Male | Female |
| Under 5 Years | 0 (0.0%) | 0 (0.0%) |
| 5 to 17 Years | 0 (0.0%) | 0 (0.0%) |
| 18 to 34 Years | 0 (0.0%) | 0 (0.0%) |
| 35 to 64 Years | 9 (27.3%) | 27 (67.5%) |
| 65 to 74 Years | 0 (0.0%) | 0 (0.0%) |
| 75 Years and over | 0 (0.0%) | 0 (0.0%) |
Disability Class: Vision Difficulty
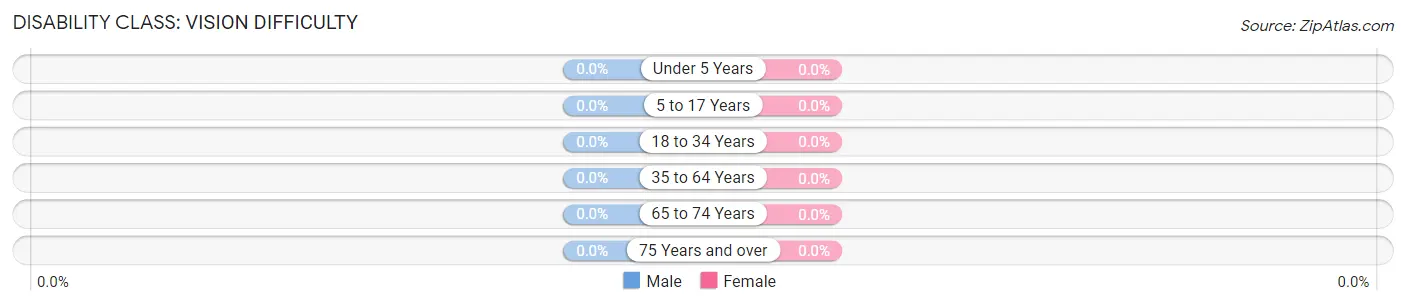
| Age Bracket | Male | Female |
| Under 5 Years | 0 (0.0%) | 0 (0.0%) |
| 5 to 17 Years | 0 (0.0%) | 0 (0.0%) |
| 18 to 34 Years | 0 (0.0%) | 0 (0.0%) |
| 35 to 64 Years | 0 (0.0%) | 0 (0.0%) |
| 65 to 74 Years | 0 (0.0%) | 0 (0.0%) |
| 75 Years and over | 0 (0.0%) | 0 (0.0%) |
Disability Class: Cognitive Difficulty
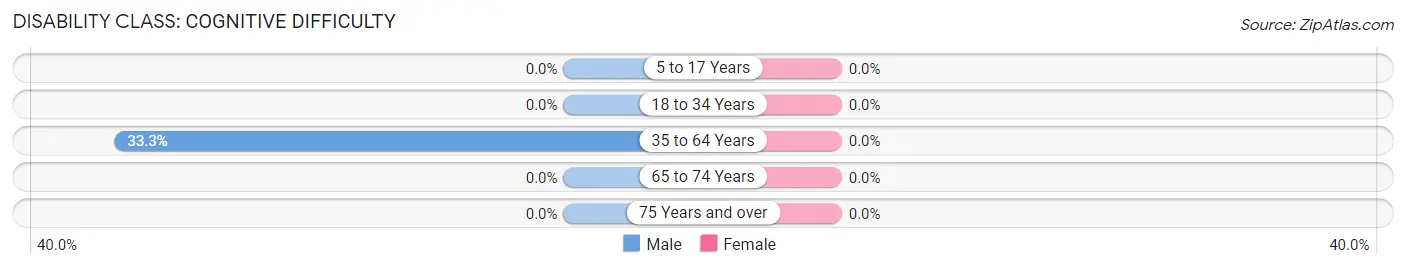
| Age Bracket | Male | Female |
| 5 to 17 Years | 0 (0.0%) | 0 (0.0%) |
| 18 to 34 Years | 0 (0.0%) | 0 (0.0%) |
| 35 to 64 Years | 11 (33.3%) | 0 (0.0%) |
| 65 to 74 Years | 0 (0.0%) | 0 (0.0%) |
| 75 Years and over | 0 (0.0%) | 0 (0.0%) |
Disability Class: Ambulatory Difficulty
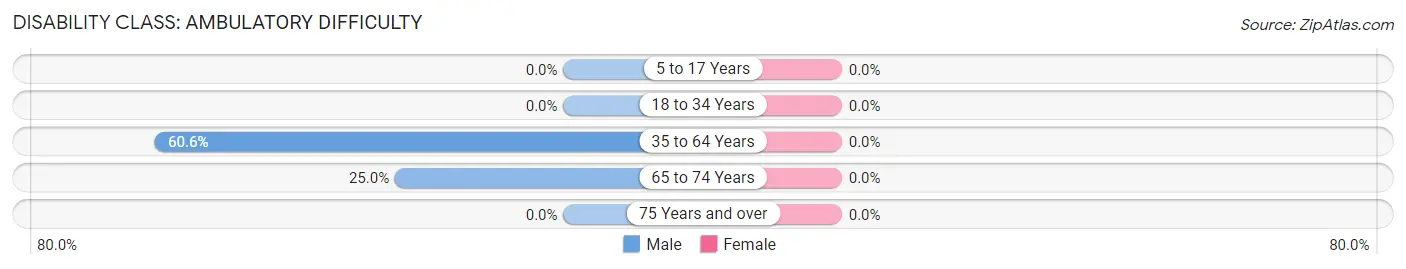
| Age Bracket | Male | Female |
| 5 to 17 Years | 0 (0.0%) | 0 (0.0%) |
| 18 to 34 Years | 0 (0.0%) | 0 (0.0%) |
| 35 to 64 Years | 20 (60.6%) | 0 (0.0%) |
| 65 to 74 Years | 6 (25.0%) | 0 (0.0%) |
| 75 Years and over | 0 (0.0%) | 0 (0.0%) |
Disability Class: Self-Care Difficulty
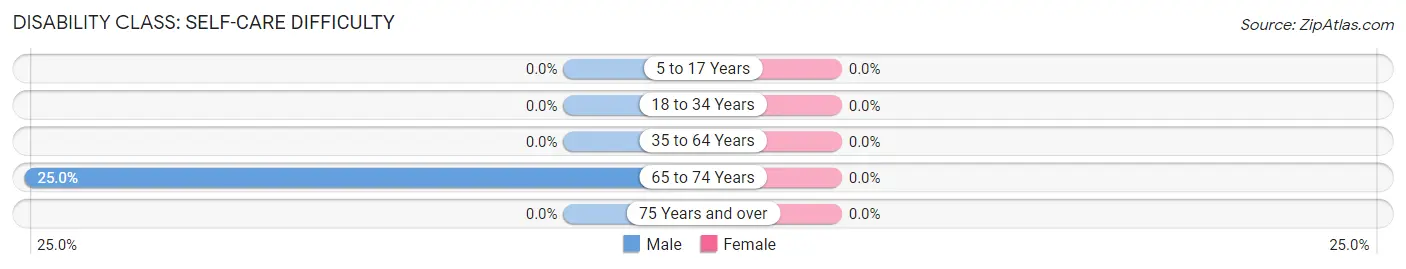
| Age Bracket | Male | Female |
| 5 to 17 Years | 0 (0.0%) | 0 (0.0%) |
| 18 to 34 Years | 0 (0.0%) | 0 (0.0%) |
| 35 to 64 Years | 0 (0.0%) | 0 (0.0%) |
| 65 to 74 Years | 6 (25.0%) | 0 (0.0%) |
| 75 Years and over | 0 (0.0%) | 0 (0.0%) |
Technology Access in Star City
Computing Device Access in Star City
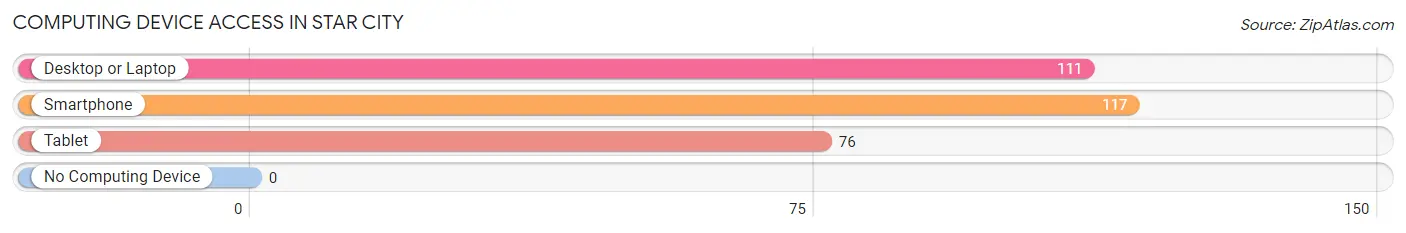
| Device Type | # Households | % Households |
| Desktop or Laptop | 111 | 94.9% |
| Smartphone | 117 | 100.0% |
| Tablet | 76 | 65.0% |
| No Computing Device | 0 | 0.0% |
| Total | 117 | 100.0% |
Internet Access in Star City
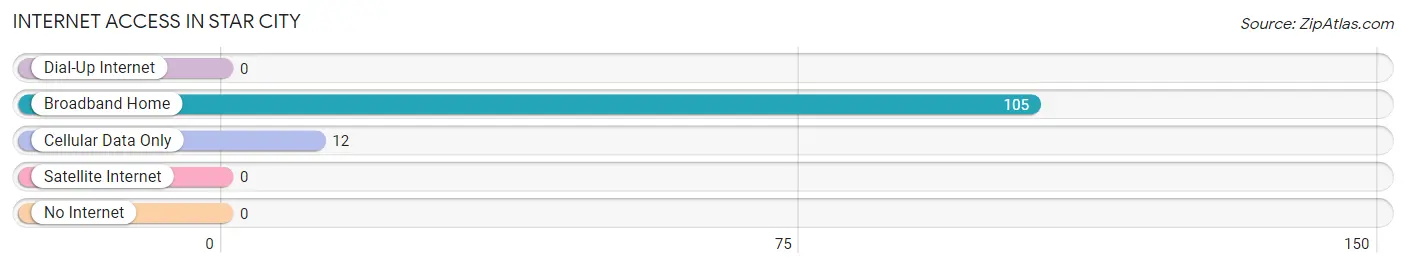
| Internet Type | # Households | % Households |
| Dial-Up Internet | 0 | 0.0% |
| Broadband Home | 105 | 89.7% |
| Cellular Data Only | 12 | 10.3% |
| Satellite Internet | 0 | 0.0% |
| No Internet | 0 | 0.0% |
| Total | 117 | 100.0% |
Star City Summary
Star City is a small town located in Pulaski County, Indiana, United States. It is situated on the banks of the Tippecanoe River, approximately 20 miles south of the city of Lafayette. The population of Star City was 1,845 at the 2010 census.
History
Star City was founded in 1837 by a group of settlers from Ohio. The town was named after the star-shaped fort that was built by the settlers to protect themselves from Native American attacks. The fort was later destroyed by a tornado in 1844.
In 1851, the town was incorporated and the first post office was established. The town grew slowly over the next few decades, but by the turn of the century, Star City had become a thriving community.
In the early 1900s, Star City was a major stop on the Monon Railroad. The railroad brought in many new businesses and industries, including a flour mill, a sawmill, a brickyard, and a furniture factory.
Geography
Star City is located at 40°41'45" North, 86°37'45" West (40.695833, -86.629167). According to the 2010 census, the town has a total area of 1.2 square miles, all land.
The town is situated on the banks of the Tippecanoe River, which flows through the town and provides a scenic backdrop. The town is surrounded by rolling hills and farmland.
Economy
Star City's economy is largely based on agriculture and manufacturing. The town is home to several small businesses, including a grocery store, a hardware store, and a restaurant.
The town is also home to several large employers, including a manufacturing plant, a trucking company, and a lumber yard.
Demographics
As of the 2010 census, the population of Star City was 1,845. The racial makeup of the town was 97.2% White, 0.7% African American, 0.2% Native American, 0.2% Asian, 0.2% from other races, and 1.7% from two or more races. Hispanic or Latino of any race were 1.2% of the population.
The median income for a household in Star City was $37,500, and the median income for a family was $45,000. The per capita income for the town was $18,845. About 11.2% of families and 14.2% of the population were below the poverty line, including 18.2% of those under age 18 and 8.2% of those age 65 or over.
Star City is served by the Pulaski County Community School Corporation. The town is home to one elementary school, one middle school, and one high school.
Star City is a small town with a rich history and a bright future. The town is home to a diverse population and a strong economy. With its scenic location on the banks of the Tippecanoe River and its close proximity to the city of Lafayette, Star City is an ideal place to live and work.
Common Questions
What is Per Capita Income in Star City?
Per Capita income in Star City is $30,087.
What is the Median Family Income in Star City?
Median Family Income in Star City is $80,962.
What is the Median Household income in Star City?
Median Household Income in Star City is $55,036.
What is Income or Wage Gap in Star City?
Income or Wage Gap in Star City is 48.2%.
Women in Star City earn 51.8 cents for every dollar earned by a man.
What is Inequality or Gini Index in Star City?
Inequality or Gini Index in Star City is 0.24.
What is the Total Population of Star City?
Total Population of Star City is 226.
What is the Total Male Population of Star City?
Total Male Population of Star City is 63.
What is the Total Female Population of Star City?
Total Female Population of Star City is 163.
What is the Ratio of Males per 100 Females in Star City?
There are 38.65 Males per 100 Females in Star City.
What is the Ratio of Females per 100 Males in Star City?
There are 258.73 Females per 100 Males in Star City.
What is the Median Population Age in Star City?
Median Population Age in Star City is 57.4 Years.
What is the Average Family Size in Star City
Average Family Size in Star City is 3.9 People.
What is the Average Household Size in Star City
Average Household Size in Star City is 1.9 People.
How Large is the Labor Force in Star City?
There are 101 People in the Labor Forcein in Star City.
What is the Percentage of People in the Labor Force in Star City?
54.0% of People are in the Labor Force in Star City.
What is the Unemployment Rate in Star City?
Unemployment Rate in Star City is 10.9%.