Spencer, IN Map & Demographics
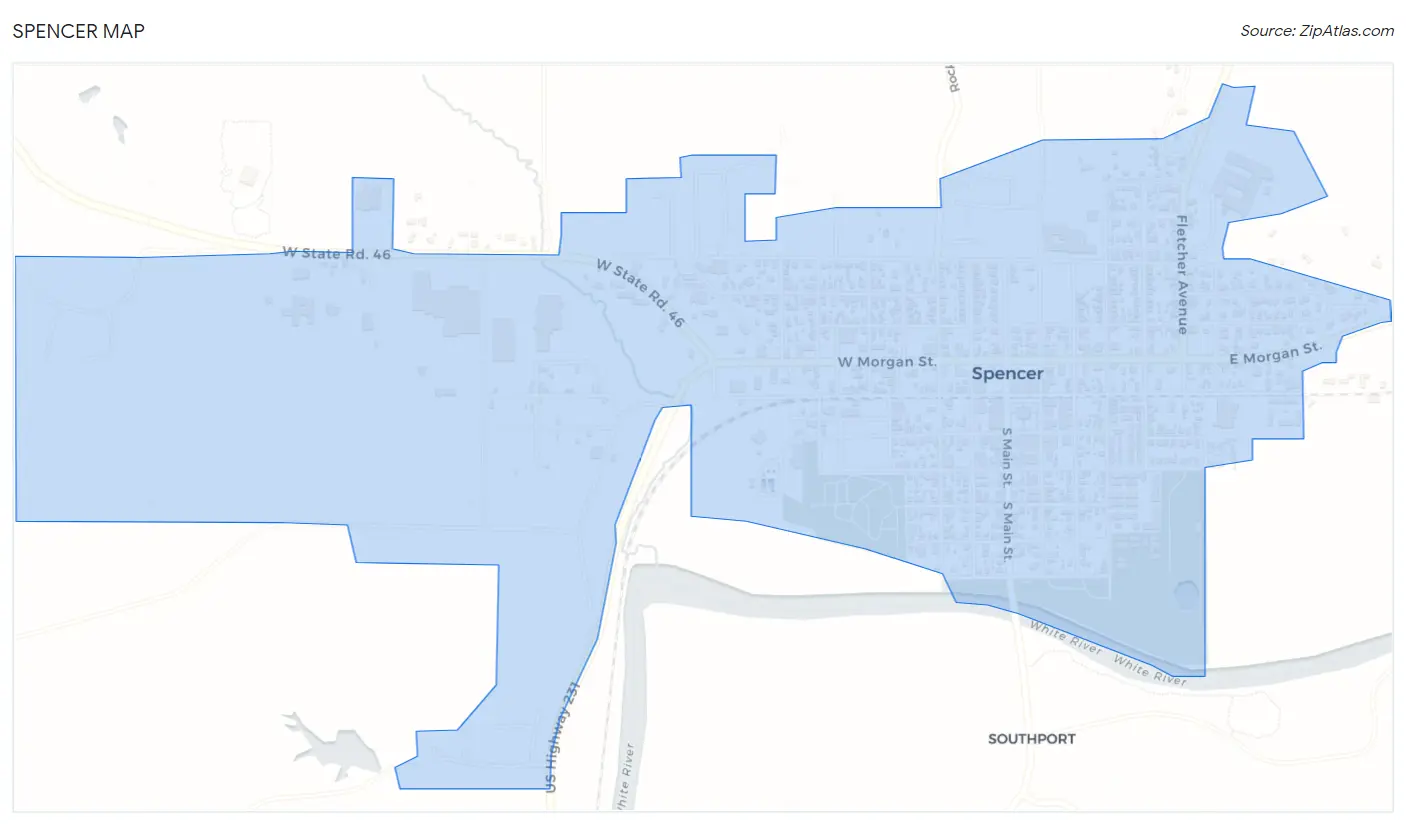
Spencer Map
Spencer Overview
$31,342
PER CAPITA INCOME
$64,572
AVG FAMILY INCOME
$45,536
AVG HOUSEHOLD INCOME
17.4%
WAGE / INCOME GAP [ % ]
82.6¢/ $1
WAGE / INCOME GAP [ $ ]
0.46
INEQUALITY / GINI INDEX
2,240
TOTAL POPULATION
1,100
MALE POPULATION
1,140
FEMALE POPULATION
96.49
MALES / 100 FEMALES
103.64
FEMALES / 100 MALES
46.8
MEDIAN AGE
3.0
AVG FAMILY SIZE
2.0
AVG HOUSEHOLD SIZE
1,058
LABOR FORCE [ PEOPLE ]
55.2%
PERCENT IN LABOR FORCE
6.0%
UNEMPLOYMENT RATE
Spencer Zip Codes
Spencer Area Codes
Income in Spencer
Income Overview in Spencer
Per Capita Income in Spencer is $31,342, while median incomes of families and households are $64,572 and $45,536 respectively.
| Characteristic | Number | Measure |
| Per Capita Income | 2,240 | $31,342 |
| Median Family Income | 493 | $64,572 |
| Mean Family Income | 493 | $85,008 |
| Median Household Income | 1,079 | $45,536 |
| Mean Household Income | 1,079 | $61,088 |
| Income Deficit | 493 | $0 |
| Wage / Income Gap (%) | 2,240 | 17.44% |
| Wage / Income Gap ($) | 2,240 | 82.56¢ per $1 |
| Gini / Inequality Index | 2,240 | 0.46 |
Earnings by Sex in Spencer
Average Earnings in Spencer are $28,484, $31,522 for men and $26,023 for women, a difference of 17.4%.
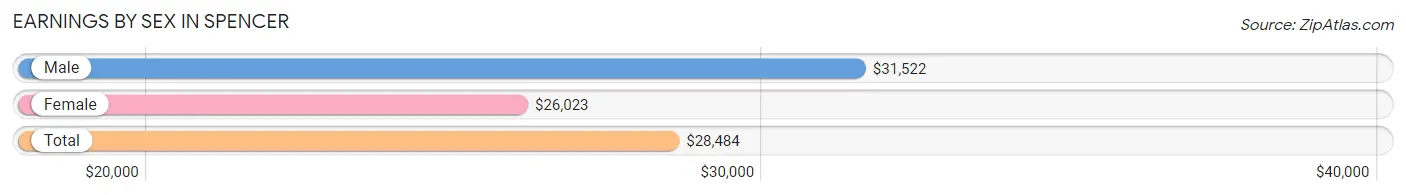
| Sex | Number | Average Earnings |
| Male | 576 (51.1%) | $31,522 |
| Female | 551 (48.9%) | $26,023 |
| Total | 1,127 (100.0%) | $28,484 |
Earnings by Sex by Income Bracket in Spencer
The most common earnings brackets in Spencer are $55,000 to $64,999 for men (58 | 10.1%) and $25,000 to $29,999 for women (56 | 10.2%).
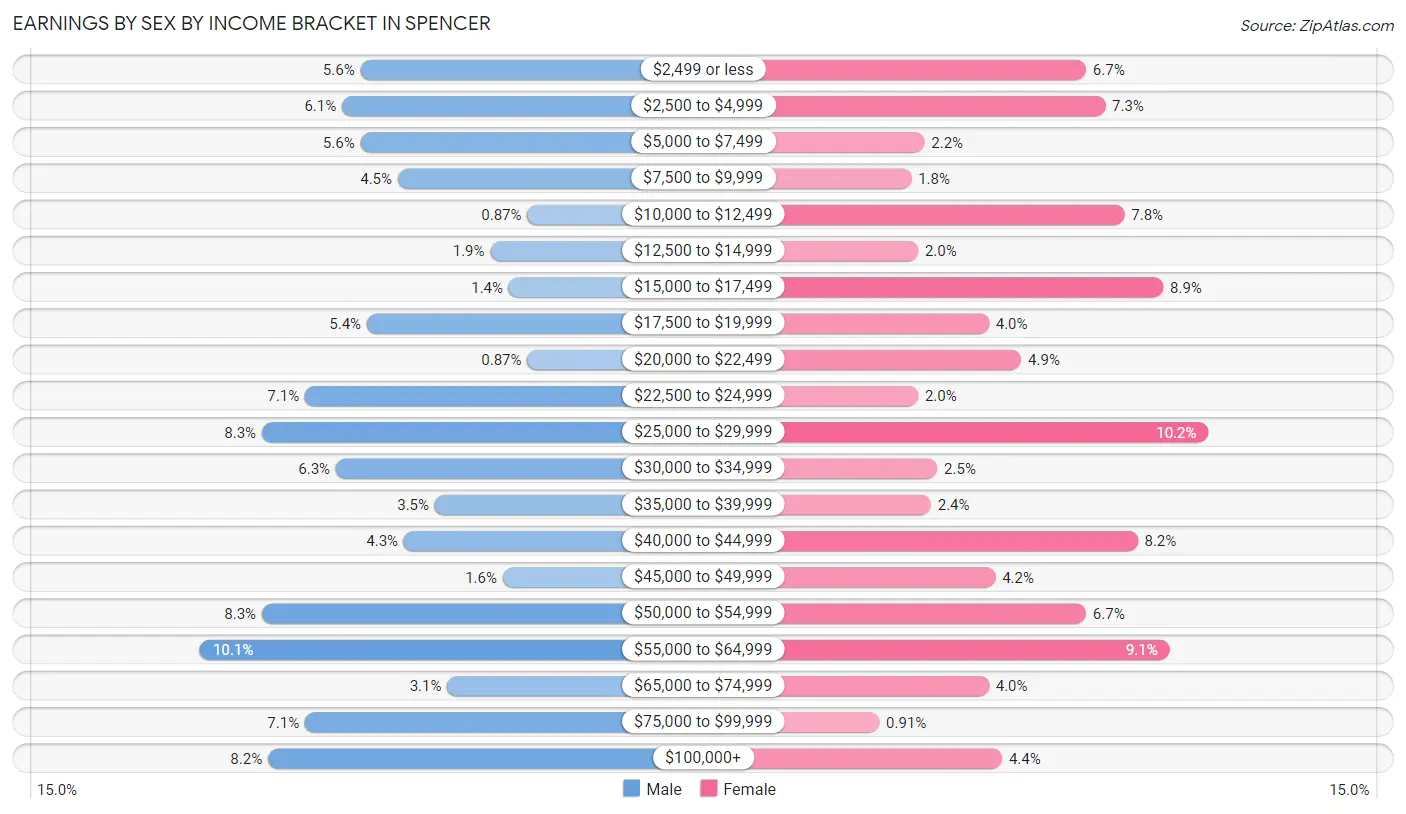
| Income | Male | Female |
| $2,499 or less | 32 (5.6%) | 37 (6.7%) |
| $2,500 to $4,999 | 35 (6.1%) | 40 (7.3%) |
| $5,000 to $7,499 | 32 (5.6%) | 12 (2.2%) |
| $7,500 to $9,999 | 26 (4.5%) | 10 (1.8%) |
| $10,000 to $12,499 | 5 (0.9%) | 43 (7.8%) |
| $12,500 to $14,999 | 11 (1.9%) | 11 (2.0%) |
| $15,000 to $17,499 | 8 (1.4%) | 49 (8.9%) |
| $17,500 to $19,999 | 31 (5.4%) | 22 (4.0%) |
| $20,000 to $22,499 | 5 (0.9%) | 27 (4.9%) |
| $22,500 to $24,999 | 41 (7.1%) | 11 (2.0%) |
| $25,000 to $29,999 | 48 (8.3%) | 56 (10.2%) |
| $30,000 to $34,999 | 36 (6.2%) | 14 (2.5%) |
| $35,000 to $39,999 | 20 (3.5%) | 13 (2.4%) |
| $40,000 to $44,999 | 25 (4.3%) | 45 (8.2%) |
| $45,000 to $49,999 | 9 (1.6%) | 23 (4.2%) |
| $50,000 to $54,999 | 48 (8.3%) | 37 (6.7%) |
| $55,000 to $64,999 | 58 (10.1%) | 50 (9.1%) |
| $65,000 to $74,999 | 18 (3.1%) | 22 (4.0%) |
| $75,000 to $99,999 | 41 (7.1%) | 5 (0.9%) |
| $100,000+ | 47 (8.2%) | 24 (4.4%) |
| Total | 576 (100.0%) | 551 (100.0%) |
Earnings by Sex by Educational Attainment in Spencer
Average earnings in Spencer are $37,955 for men and $30,750 for women, a difference of 19.0%. Men with an educational attainment of less than high school enjoy the highest average annual earnings of $83,313, while those with high school diploma education earn the least with $26,094. Women with an educational attainment of graduate degree earn the most with the average annual earnings of $57,083, while those with college or associate's degree education have the smallest earnings of $19,375.
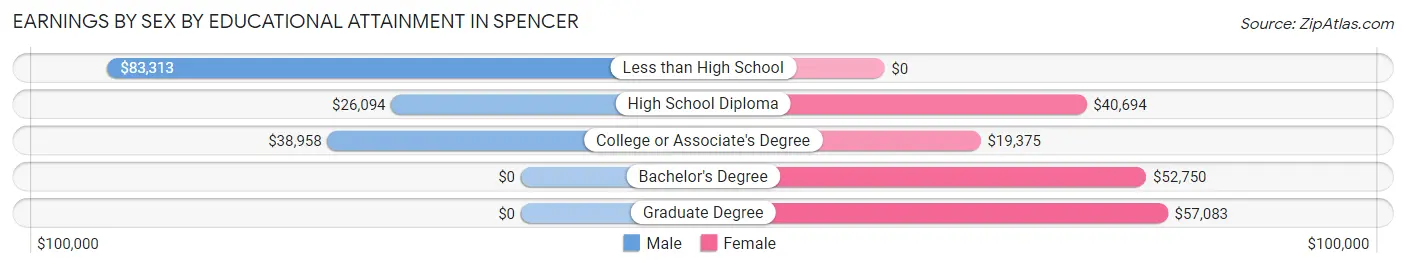
| Educational Attainment | Male Income | Female Income |
| Less than High School | $83,313 | $0 |
| High School Diploma | $26,094 | $40,694 |
| College or Associate's Degree | $38,958 | $19,375 |
| Bachelor's Degree | - | - |
| Graduate Degree | - | - |
| Total | $37,955 | $30,750 |
Family Income in Spencer
Family Income Brackets in Spencer
According to the Spencer family income data, there are 135 families falling into the $50,000 to $74,999 income range, which is the most common income bracket and makes up 27.4% of all families.
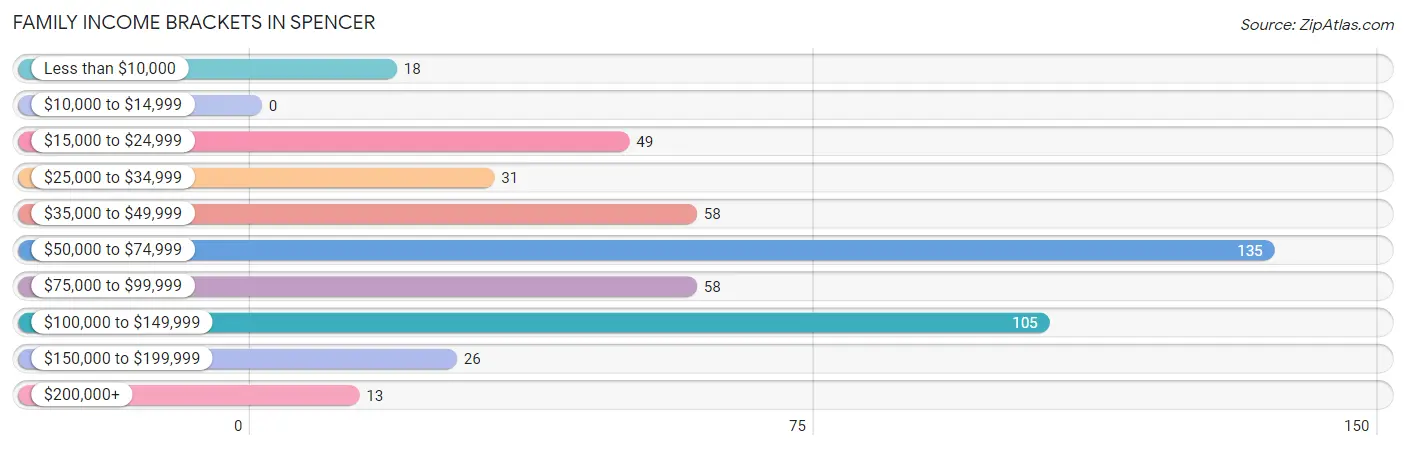
| Income Bracket | # Families | % Families |
| Less than $10,000 | 18 | 3.7% |
| $10,000 to $14,999 | 0 | 0.0% |
| $15,000 to $24,999 | 49 | 9.9% |
| $25,000 to $34,999 | 31 | 6.3% |
| $35,000 to $49,999 | 58 | 11.8% |
| $50,000 to $74,999 | 135 | 27.4% |
| $75,000 to $99,999 | 58 | 11.8% |
| $100,000 to $149,999 | 105 | 21.3% |
| $150,000 to $199,999 | 26 | 5.3% |
| $200,000+ | 13 | 2.6% |
Family Income by Famaliy Size in Spencer
3-person families (151 | 30.6%) account for the highest median family income in Spencer with $65,972 per family, while 2-person families (233 | 47.3%) have the highest median income of $32,670 per family member.
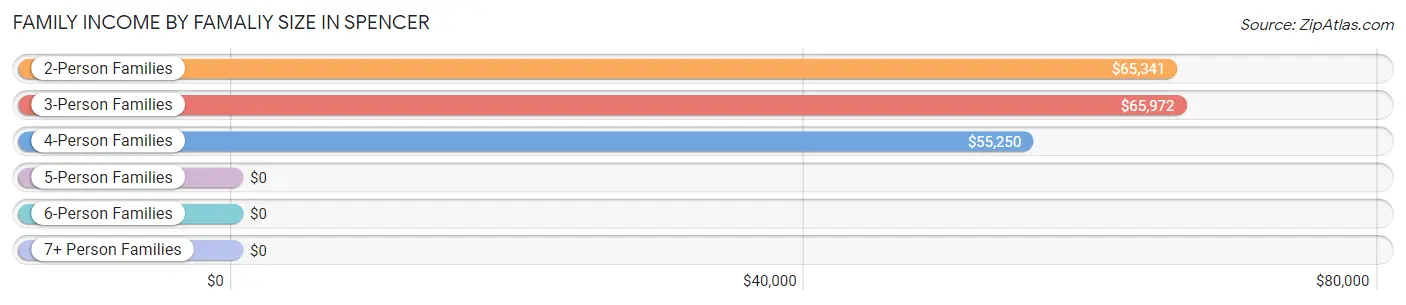
| Income Bracket | # Families | Median Income |
| 2-Person Families | 233 (47.3%) | $65,341 |
| 3-Person Families | 151 (30.6%) | $65,972 |
| 4-Person Families | 85 (17.2%) | $55,250 |
| 5-Person Families | 5 (1.0%) | $0 |
| 6-Person Families | 19 (3.8%) | $0 |
| 7+ Person Families | 0 (0.0%) | $0 |
| Total | 493 (100.0%) | $64,572 |
Family Income by Number of Earners in Spencer
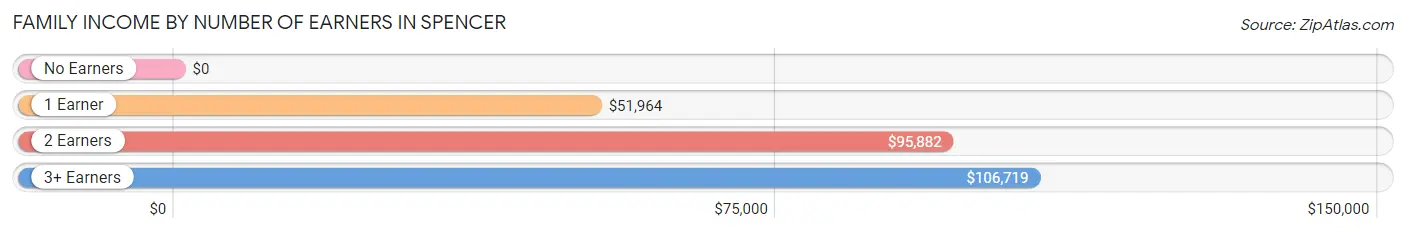
| Number of Earners | # Families | Median Income |
| No Earners | 106 (21.5%) | $0 |
| 1 Earner | 140 (28.4%) | $51,964 |
| 2 Earners | 214 (43.4%) | $95,882 |
| 3+ Earners | 33 (6.7%) | $106,719 |
| Total | 493 (100.0%) | $64,572 |
Household Income in Spencer
Household Income Brackets in Spencer
With 230 households falling in the category, the $50,000 to $74,999 income range is the most frequent in Spencer, accounting for 21.3% of all households. In contrast, only 13 households (1.2%) fall into the $200,000+ income bracket, making it the least populous group.
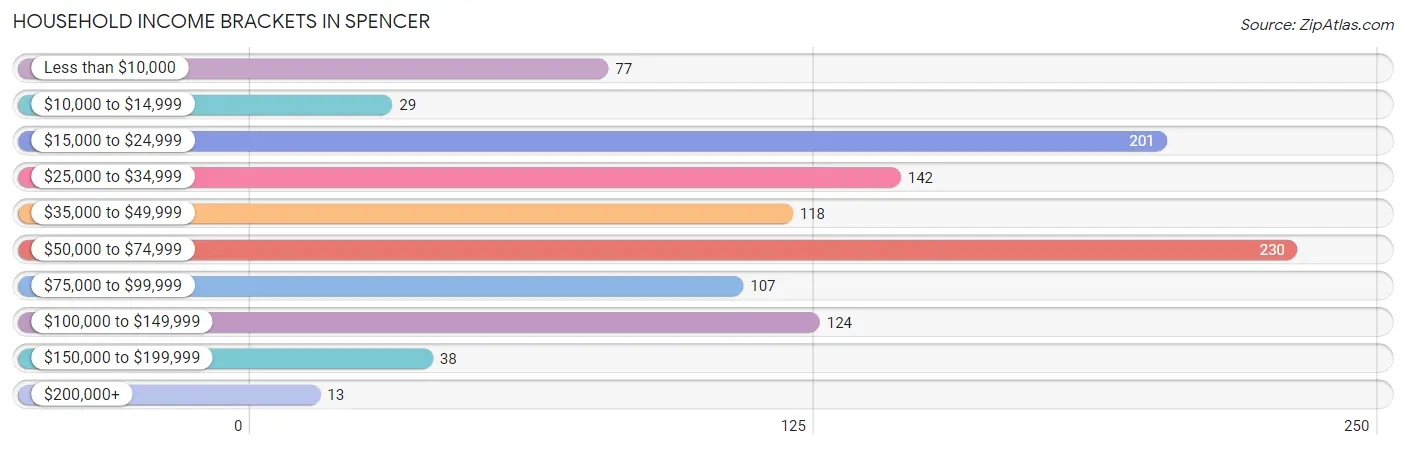
| Income Bracket | # Households | % Households |
| Less than $10,000 | 77 | 7.1% |
| $10,000 to $14,999 | 29 | 2.7% |
| $15,000 to $24,999 | 201 | 18.6% |
| $25,000 to $34,999 | 142 | 13.2% |
| $35,000 to $49,999 | 118 | 10.9% |
| $50,000 to $74,999 | 230 | 21.3% |
| $75,000 to $99,999 | 107 | 9.9% |
| $100,000 to $149,999 | 124 | 11.5% |
| $150,000 to $199,999 | 38 | 3.5% |
| $200,000+ | 13 | 1.2% |
Household Income by Householder Age in Spencer
The median household income in Spencer is $45,536, with the highest median household income of $54,792 found in the 45 to 64 years age bracket for the primary householder. A total of 305 households (28.3%) fall into this category. Meanwhile, the 15 to 24 years age bracket for the primary householder has the lowest median household income of $31,500, with 42 households (3.9%) in this group.
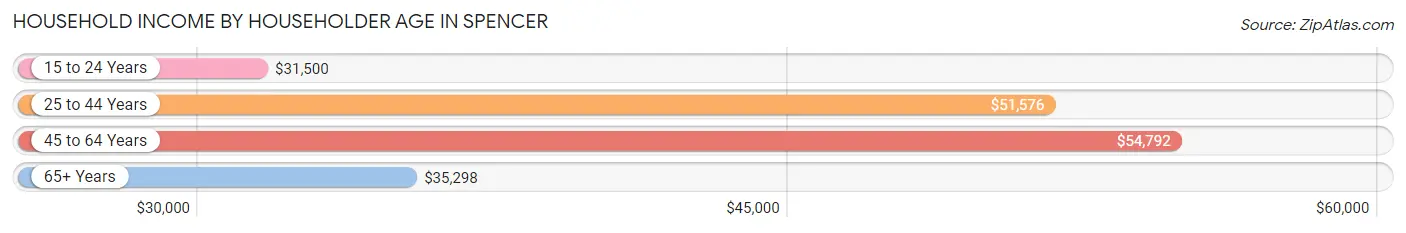
| Income Bracket | # Households | Median Income |
| 15 to 24 Years | 42 (3.9%) | $31,500 |
| 25 to 44 Years | 231 (21.4%) | $51,576 |
| 45 to 64 Years | 305 (28.3%) | $54,792 |
| 65+ Years | 501 (46.4%) | $35,298 |
| Total | 1,079 (100.0%) | $45,536 |
Poverty in Spencer
Income Below Poverty by Sex and Age in Spencer
With 10.5% poverty level for males and 14.8% for females among the residents of Spencer, 25 to 34 year old males and 18 to 24 year old females are the most vulnerable to poverty, with 33 males (26.0%) and 37 females (42.5%) in their respective age groups living below the poverty level.
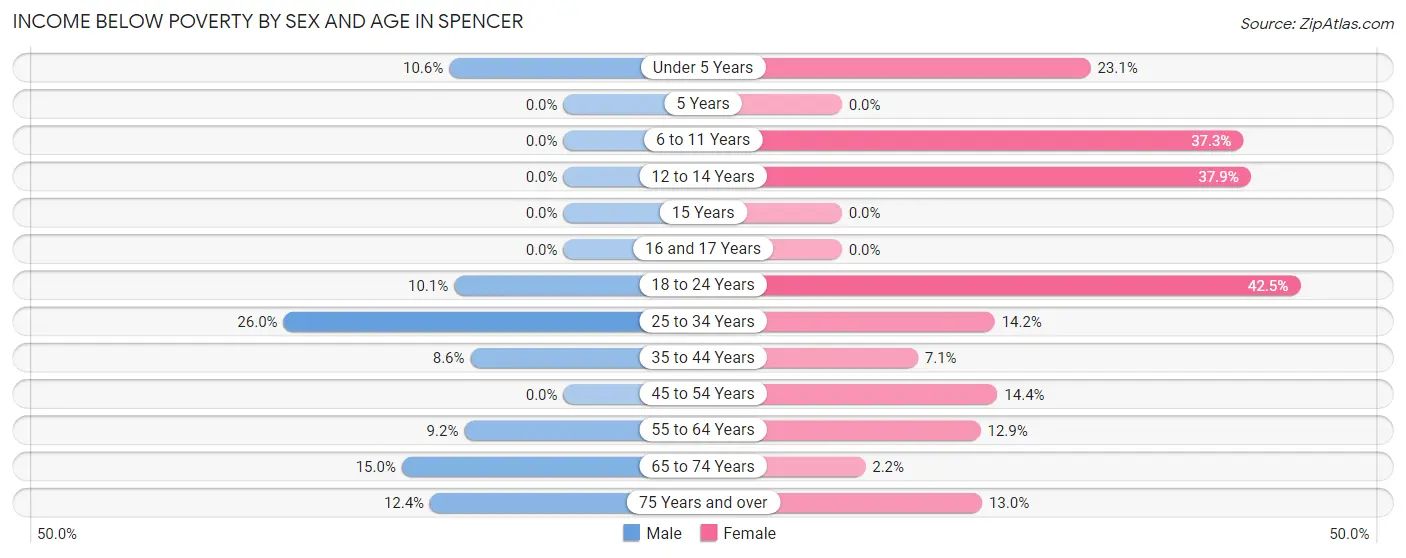
| Age Bracket | Male | Female |
| Under 5 Years | 7 (10.6%) | 18 (23.1%) |
| 5 Years | 0 (0.0%) | 0 (0.0%) |
| 6 to 11 Years | 0 (0.0%) | 19 (37.2%) |
| 12 to 14 Years | 0 (0.0%) | 11 (37.9%) |
| 15 Years | 0 (0.0%) | 0 (0.0%) |
| 16 and 17 Years | 0 (0.0%) | 0 (0.0%) |
| 18 to 24 Years | 7 (10.1%) | 37 (42.5%) |
| 25 to 34 Years | 33 (26.0%) | 21 (14.2%) |
| 35 to 44 Years | 12 (8.6%) | 6 (7.1%) |
| 45 to 54 Years | 0 (0.0%) | 13 (14.4%) |
| 55 to 64 Years | 15 (9.2%) | 21 (12.9%) |
| 65 to 74 Years | 24 (15.0%) | 5 (2.2%) |
| 75 Years and over | 13 (12.4%) | 16 (13.0%) |
| Total | 111 (10.5%) | 167 (14.8%) |
Income Above Poverty by Sex and Age in Spencer
According to the poverty statistics in Spencer, males aged 6 to 11 years and females aged 5 years are the age groups that are most secure financially, with 100.0% of males and 100.0% of females in these age groups living above the poverty line.
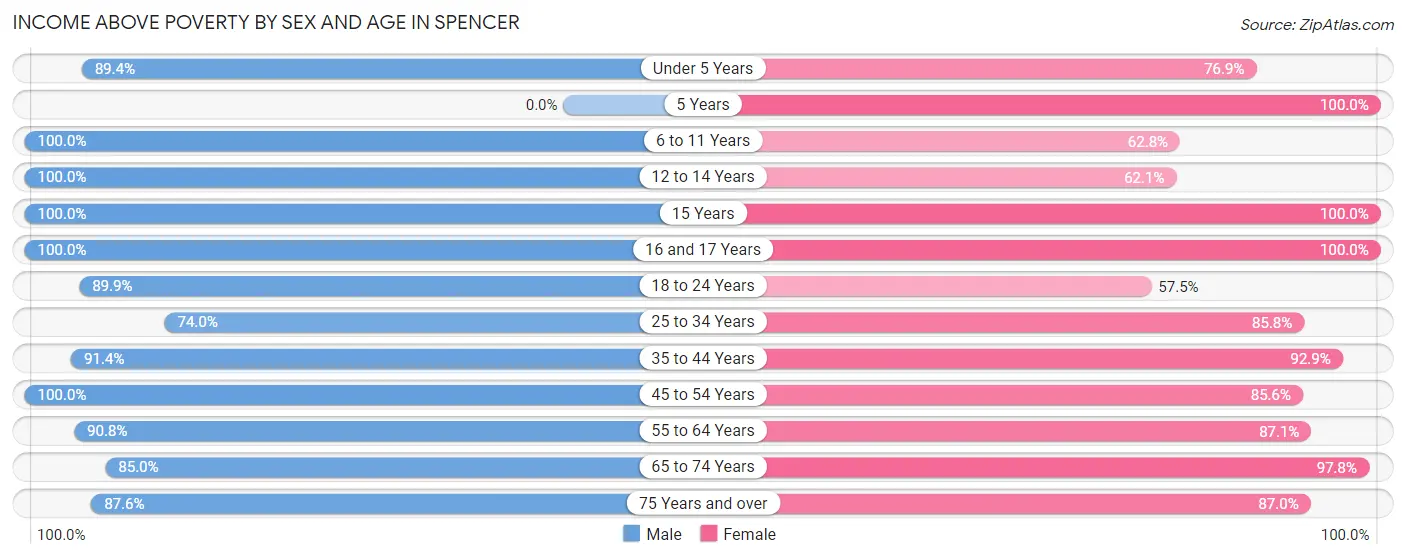
| Age Bracket | Male | Female |
| Under 5 Years | 59 (89.4%) | 60 (76.9%) |
| 5 Years | 0 (0.0%) | 9 (100.0%) |
| 6 to 11 Years | 39 (100.0%) | 32 (62.7%) |
| 12 to 14 Years | 29 (100.0%) | 18 (62.1%) |
| 15 Years | 5 (100.0%) | 18 (100.0%) |
| 16 and 17 Years | 16 (100.0%) | 21 (100.0%) |
| 18 to 24 Years | 62 (89.9%) | 50 (57.5%) |
| 25 to 34 Years | 94 (74.0%) | 127 (85.8%) |
| 35 to 44 Years | 127 (91.4%) | 79 (92.9%) |
| 45 to 54 Years | 141 (100.0%) | 77 (85.6%) |
| 55 to 64 Years | 148 (90.8%) | 142 (87.1%) |
| 65 to 74 Years | 136 (85.0%) | 224 (97.8%) |
| 75 Years and over | 92 (87.6%) | 107 (87.0%) |
| Total | 948 (89.5%) | 964 (85.2%) |
Income Below Poverty Among Married-Couple Families in Spencer
The poverty statistics for married-couple families in Spencer show that 4.2% or 16 of the total 381 families live below the poverty line. Families with 1 or 2 children have the highest poverty rate of 8.7%, comprising of 10 families. On the other hand, families with 3 or 4 children have the lowest poverty rate of 0.0%, which includes 0 families.
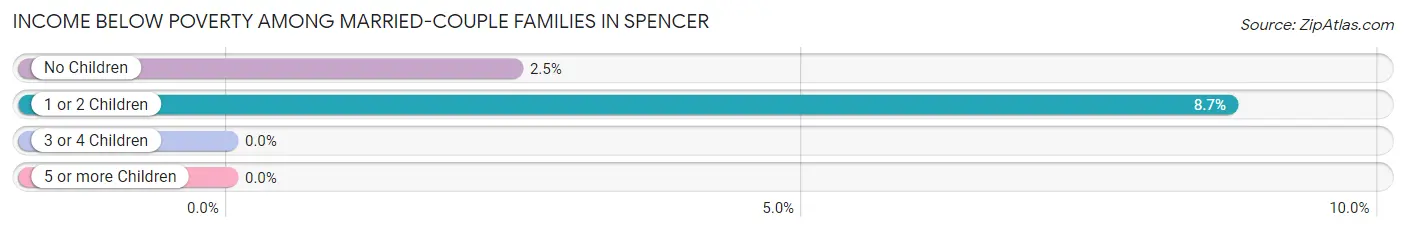
| Children | Above Poverty | Below Poverty |
| No Children | 236 (97.5%) | 6 (2.5%) |
| 1 or 2 Children | 105 (91.3%) | 10 (8.7%) |
| 3 or 4 Children | 24 (100.0%) | 0 (0.0%) |
| 5 or more Children | 0 (0.0%) | 0 (0.0%) |
| Total | 365 (95.8%) | 16 (4.2%) |
Income Below Poverty Among Single-Parent Households in Spencer
According to the poverty data in Spencer, 11.0% or 8 single-father households and 38.5% or 15 single-mother households are living below the poverty line. Among single-father households, those with 1 or 2 children have the highest poverty rate, with 8 households (23.5%) experiencing poverty. Likewise, among single-mother households, those with 1 or 2 children have the highest poverty rate, with 15 households (75.0%) falling below the poverty line.
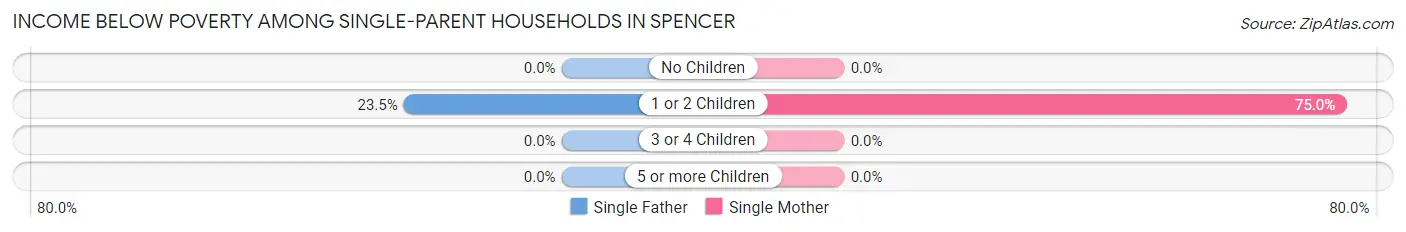
| Children | Single Father | Single Mother |
| No Children | 0 (0.0%) | 0 (0.0%) |
| 1 or 2 Children | 8 (23.5%) | 15 (75.0%) |
| 3 or 4 Children | 0 (0.0%) | 0 (0.0%) |
| 5 or more Children | 0 (0.0%) | 0 (0.0%) |
| Total | 8 (11.0%) | 15 (38.5%) |
Income Below Poverty Among Married-Couple vs Single-Parent Households in Spencer
The poverty data for Spencer shows that 16 of the married-couple family households (4.2%) and 23 of the single-parent households (20.5%) are living below the poverty level. Within the married-couple family households, those with 1 or 2 children have the highest poverty rate, with 10 households (8.7%) falling below the poverty line. Among the single-parent households, those with 1 or 2 children have the highest poverty rate, with 23 household (42.6%) living below poverty.
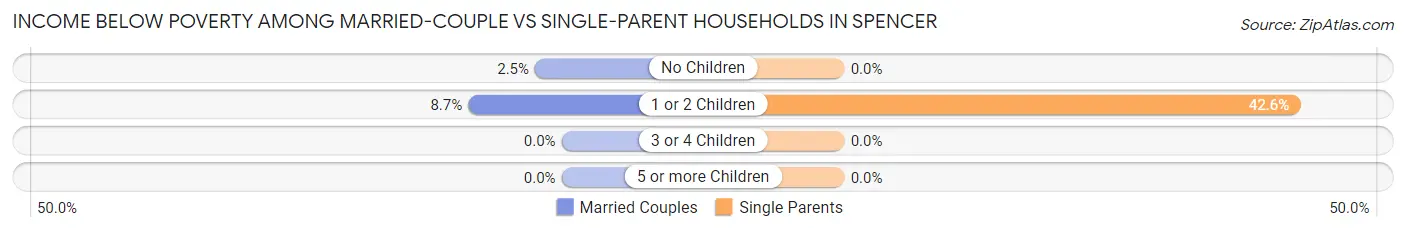
| Children | Married-Couple Families | Single-Parent Households |
| No Children | 6 (2.5%) | 0 (0.0%) |
| 1 or 2 Children | 10 (8.7%) | 23 (42.6%) |
| 3 or 4 Children | 0 (0.0%) | 0 (0.0%) |
| 5 or more Children | 0 (0.0%) | 0 (0.0%) |
| Total | 16 (4.2%) | 23 (20.5%) |
Race in Spencer
The most populous races in Spencer are White / Caucasian (2,133 | 95.2%), Two or more Races (43 | 1.9%), and Asian (35 | 1.6%).
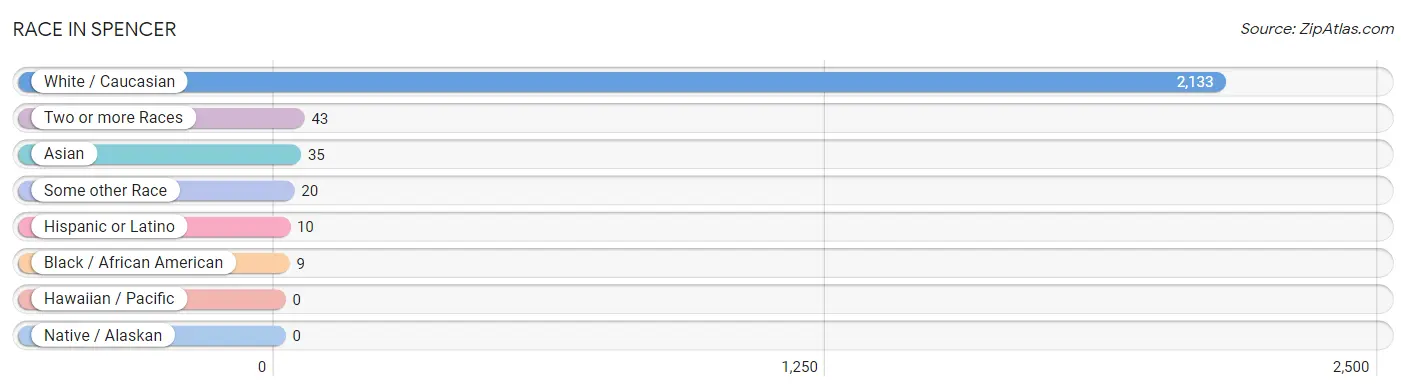
| Race | # Population | % Population |
| Asian | 35 | 1.6% |
| Black / African American | 9 | 0.4% |
| Hawaiian / Pacific | 0 | 0.0% |
| Hispanic or Latino | 10 | 0.4% |
| Native / Alaskan | 0 | 0.0% |
| White / Caucasian | 2,133 | 95.2% |
| Two or more Races | 43 | 1.9% |
| Some other Race | 20 | 0.9% |
| Total | 2,240 | 100.0% |
Ancestry in Spencer
The most populous ancestries reported in Spencer are German (442 | 19.7%), Irish (336 | 15.0%), English (297 | 13.3%), American (200 | 8.9%), and European (55 | 2.5%), together accounting for 59.4% of all Spencer residents.
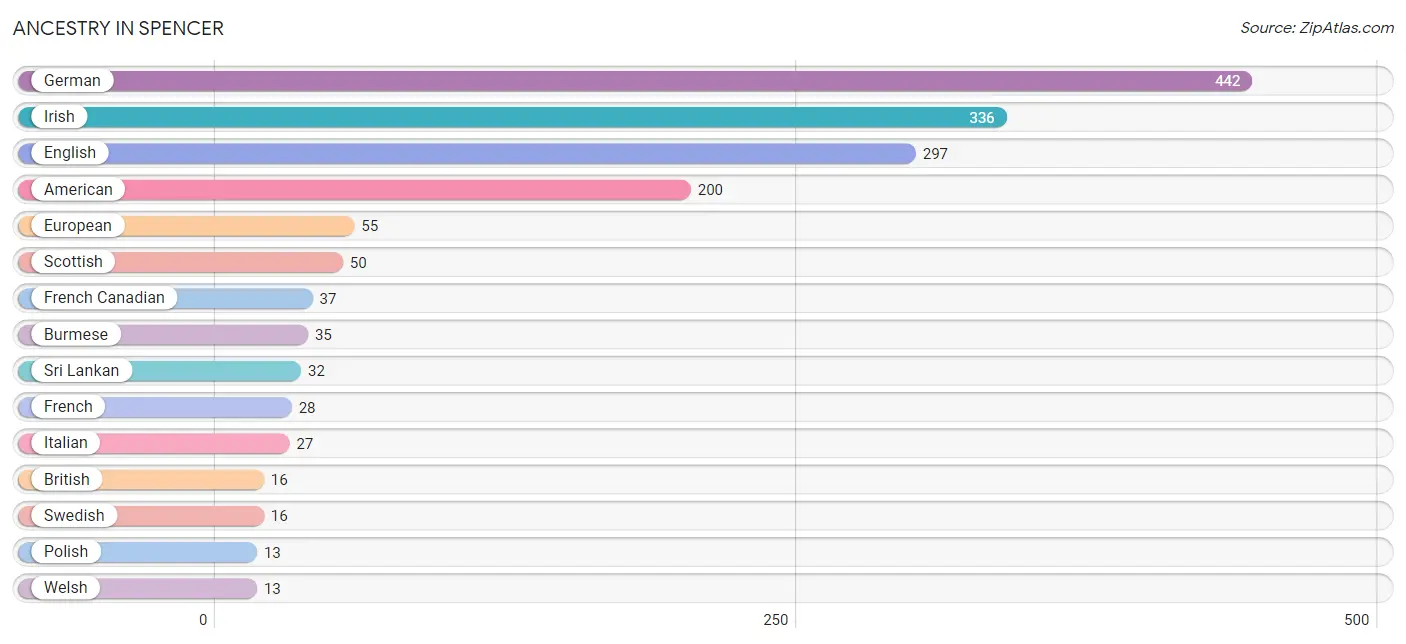
| Ancestry | # Population | % Population |
| American | 200 | 8.9% |
| British | 16 | 0.7% |
| Burmese | 35 | 1.6% |
| Cherokee | 1 | 0.0% |
| Czech | 5 | 0.2% |
| Dutch | 5 | 0.2% |
| English | 297 | 13.3% |
| European | 55 | 2.5% |
| French | 28 | 1.3% |
| French Canadian | 37 | 1.7% |
| German | 442 | 19.7% |
| Irish | 336 | 15.0% |
| Italian | 27 | 1.2% |
| Mexican | 10 | 0.4% |
| Norwegian | 6 | 0.3% |
| Polish | 13 | 0.6% |
| Romanian | 4 | 0.2% |
| Scotch-Irish | 11 | 0.5% |
| Scottish | 50 | 2.2% |
| Sri Lankan | 32 | 1.4% |
| Swedish | 16 | 0.7% |
| Welsh | 13 | 0.6% | View All 22 Rows |
Immigrants in Spencer
The most numerous immigrant groups reported in Spencer came from Asia (10 | 0.4%), Eastern Asia (10 | 0.4%), and Korea (10 | 0.4%), together accounting for 1.3% of all Spencer residents.
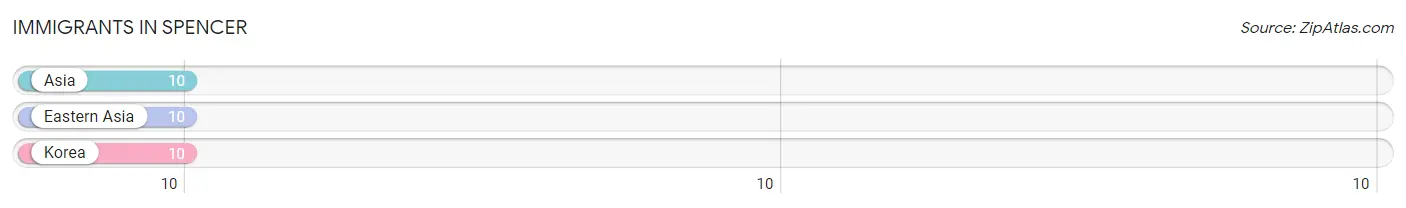
| Immigration Origin | # Population | % Population |
| Asia | 10 | 0.4% |
| Eastern Asia | 10 | 0.4% |
| Korea | 10 | 0.4% | View All 3 Rows |
Sex and Age in Spencer
Sex and Age in Spencer
The most populous age groups in Spencer are 45 to 49 Years (119 | 10.8%) for men and 70 to 74 Years (165 | 14.5%) for women.
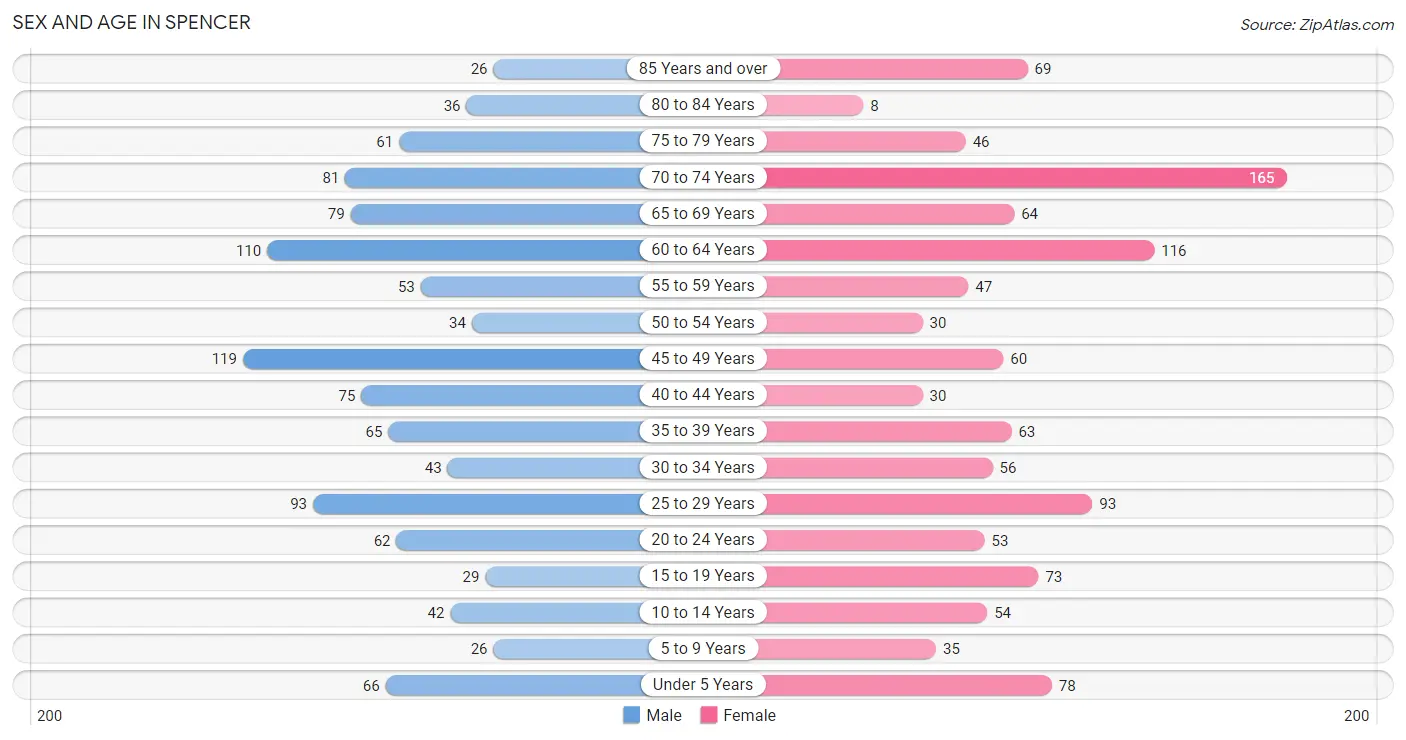
| Age Bracket | Male | Female |
| Under 5 Years | 66 (6.0%) | 78 (6.8%) |
| 5 to 9 Years | 26 (2.4%) | 35 (3.1%) |
| 10 to 14 Years | 42 (3.8%) | 54 (4.7%) |
| 15 to 19 Years | 29 (2.6%) | 73 (6.4%) |
| 20 to 24 Years | 62 (5.6%) | 53 (4.6%) |
| 25 to 29 Years | 93 (8.5%) | 93 (8.2%) |
| 30 to 34 Years | 43 (3.9%) | 56 (4.9%) |
| 35 to 39 Years | 65 (5.9%) | 63 (5.5%) |
| 40 to 44 Years | 75 (6.8%) | 30 (2.6%) |
| 45 to 49 Years | 119 (10.8%) | 60 (5.3%) |
| 50 to 54 Years | 34 (3.1%) | 30 (2.6%) |
| 55 to 59 Years | 53 (4.8%) | 47 (4.1%) |
| 60 to 64 Years | 110 (10.0%) | 116 (10.2%) |
| 65 to 69 Years | 79 (7.2%) | 64 (5.6%) |
| 70 to 74 Years | 81 (7.4%) | 165 (14.5%) |
| 75 to 79 Years | 61 (5.6%) | 46 (4.0%) |
| 80 to 84 Years | 36 (3.3%) | 8 (0.7%) |
| 85 Years and over | 26 (2.4%) | 69 (6.0%) |
| Total | 1,100 (100.0%) | 1,140 (100.0%) |
Families and Households in Spencer
Median Family Size in Spencer
The median family size in Spencer is 3.02 persons per family, with single female/mother families (39 | 7.9%) accounting for the largest median family size of 3.62 persons per family. On the other hand, single male/father families (73 | 14.8%) represent the smallest median family size with 2.63 persons per family.
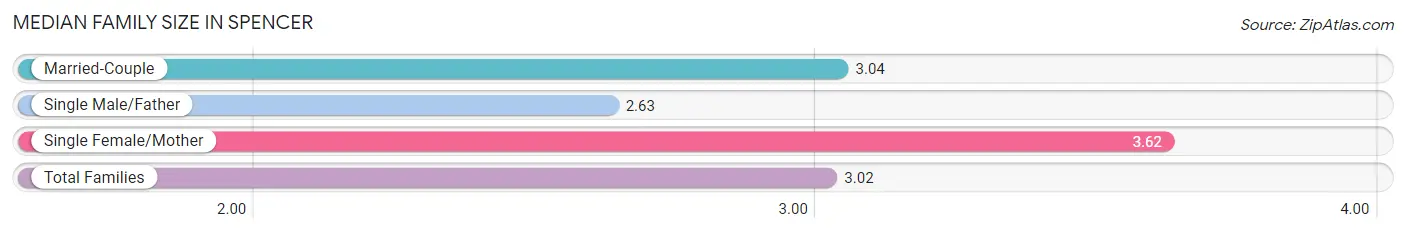
| Family Type | # Families | Family Size |
| Married-Couple | 381 (77.3%) | 3.04 |
| Single Male/Father | 73 (14.8%) | 2.63 |
| Single Female/Mother | 39 (7.9%) | 3.62 |
| Total Families | 493 (100.0%) | 3.02 |
Median Household Size in Spencer
The median household size in Spencer is 2.01 persons per household, with single female/mother households (39 | 3.6%) accounting for the largest median household size of 3.92 persons per household. non-family households (586 | 54.3%) represent the smallest median household size with 1.09 persons per household.
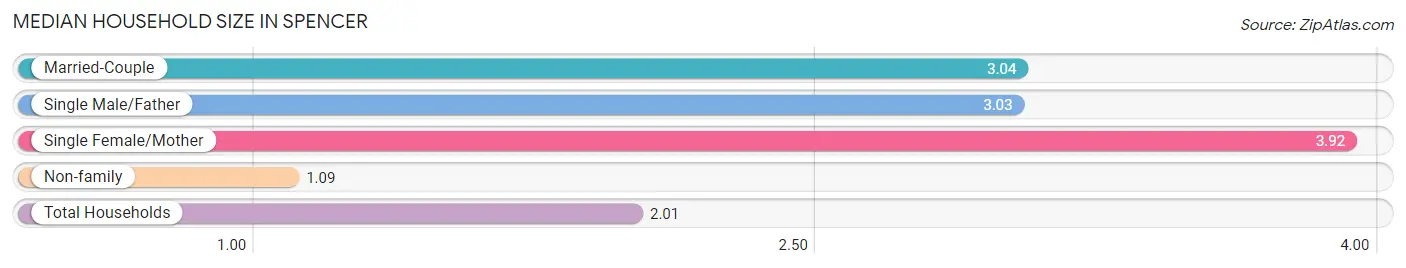
| Household Type | # Households | Household Size |
| Married-Couple | 381 (35.3%) | 3.04 |
| Single Male/Father | 73 (6.8%) | 3.03 |
| Single Female/Mother | 39 (3.6%) | 3.92 |
| Non-family | 586 (54.3%) | 1.09 |
| Total Households | 1,079 (100.0%) | 2.01 |
Household Size by Marriage Status in Spencer
Out of a total of 1,079 households in Spencer, 493 (45.7%) are family households, while 586 (54.3%) are nonfamily households. The most numerous type of family households are 2-person households, comprising 221, and the most common type of nonfamily households are 1-person households, comprising 524.
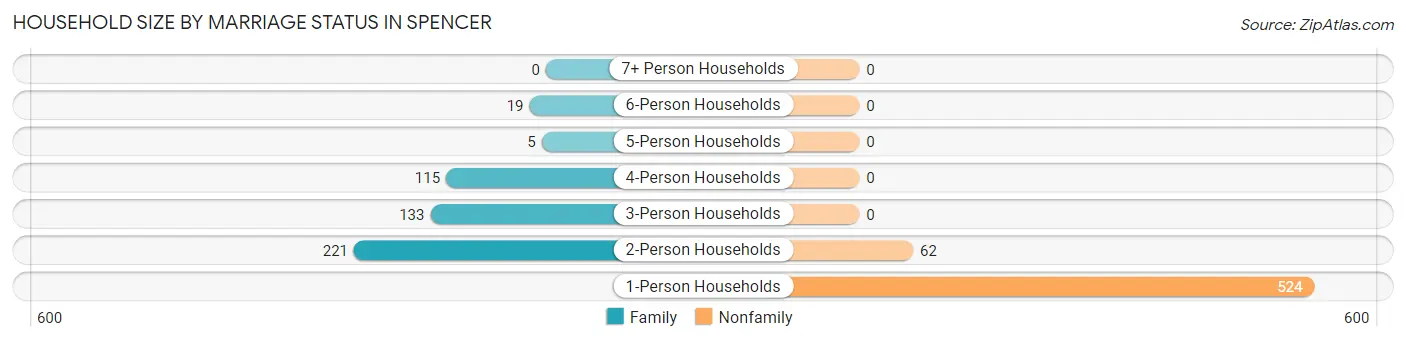
| Household Size | Family Households | Nonfamily Households |
| 1-Person Households | - | 524 (48.6%) |
| 2-Person Households | 221 (20.5%) | 62 (5.8%) |
| 3-Person Households | 133 (12.3%) | 0 (0.0%) |
| 4-Person Households | 115 (10.7%) | 0 (0.0%) |
| 5-Person Households | 5 (0.5%) | 0 (0.0%) |
| 6-Person Households | 19 (1.8%) | 0 (0.0%) |
| 7+ Person Households | 0 (0.0%) | 0 (0.0%) |
| Total | 493 (45.7%) | 586 (54.3%) |
Female Fertility in Spencer
Fertility by Age in Spencer
Average fertility rate in Spencer is 54.0 births per 1,000 women. Women in the age bracket of 20 to 34 years have the highest fertility rate with 114.0 births per 1,000 women. Women in the age bracket of 20 to 34 years acount for 100.0% of all women with births.
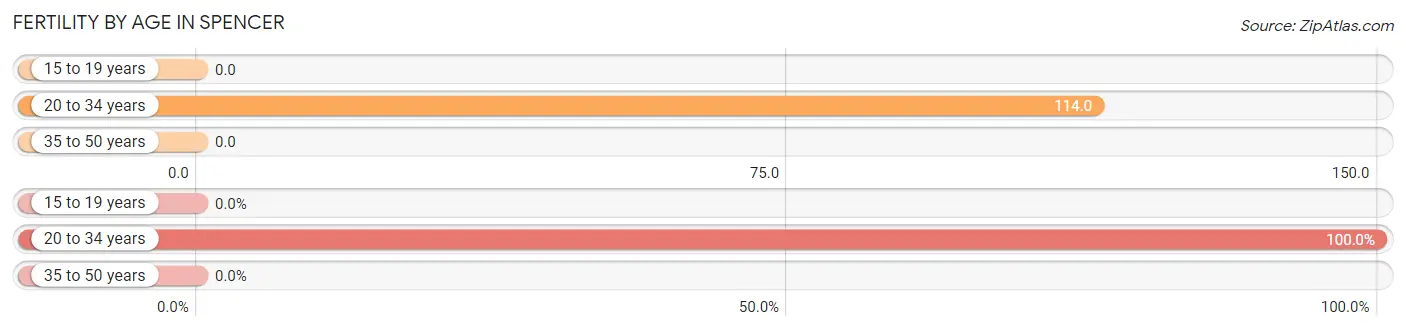
| Age Bracket | Women with Births | Births / 1,000 Women |
| 15 to 19 years | 0 (0.0%) | 0.0 |
| 20 to 34 years | 23 (100.0%) | 114.0 |
| 35 to 50 years | 0 (0.0%) | 0.0 |
| Total | 23 (100.0%) | 54.0 |
Fertility by Age by Marriage Status in Spencer
56.5% of women with births (23) in Spencer are married. The highest percentage of unmarried women with births falls into 20 to 34 years age bracket with 43.5% of them unmarried at the time of birth, while the lowest percentage of unmarried women with births belong to 20 to 34 years age bracket with 43.5% of them unmarried.
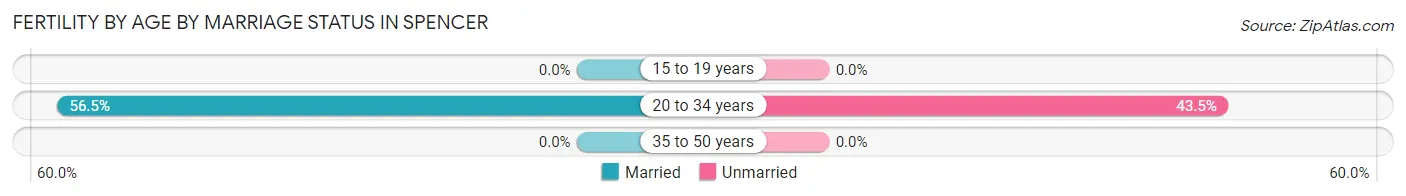
| Age Bracket | Married | Unmarried |
| 15 to 19 years | 0 (0.0%) | 0 (0.0%) |
| 20 to 34 years | 13 (56.5%) | 10 (43.5%) |
| 35 to 50 years | 0 (0.0%) | 0 (0.0%) |
| Total | 13 (56.5%) | 10 (43.5%) |
Fertility by Education in Spencer
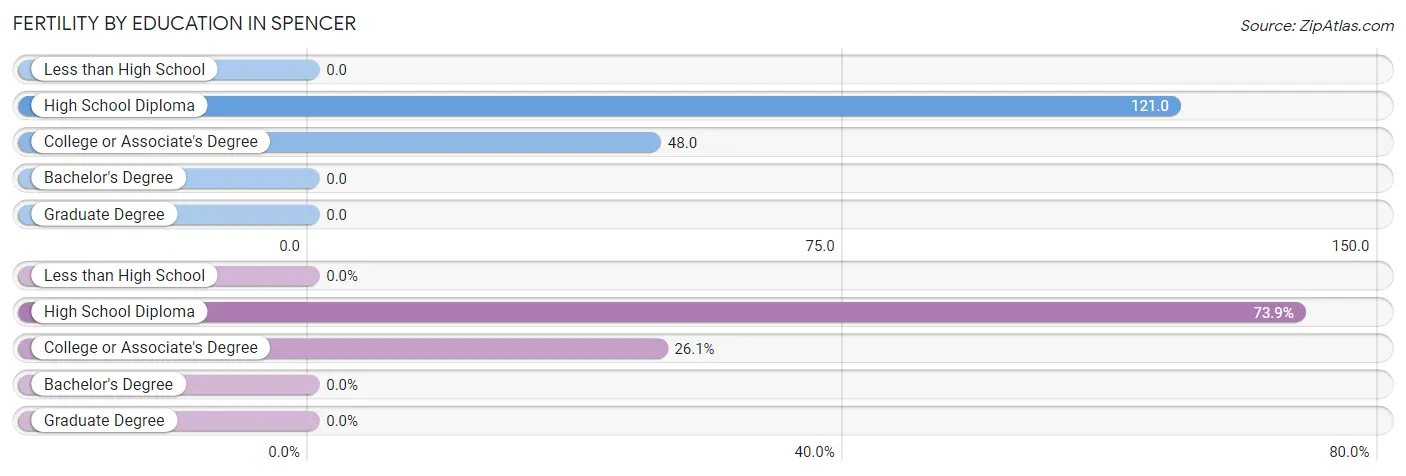
| Educational Attainment | Women with Births | Births / 1,000 Women |
| Less than High School | 0 (0.0%) | 0.0 |
| High School Diploma | 17 (73.9%) | 121.0 |
| College or Associate's Degree | 6 (26.1%) | 48.0 |
| Bachelor's Degree | 0 (0.0%) | 0.0 |
| Graduate Degree | 0 (0.0%) | 0.0 |
| Total | 23 (100.0%) | 54.0 |
Fertility by Education by Marriage Status in Spencer
43.5% of women with births in Spencer are unmarried. Women with the educational attainment of high school diploma are most likely to be married with 76.5% of them married at childbirth, while women with the educational attainment of college or associate's degree are least likely to be married with 100.0% of them unmarried at childbirth.
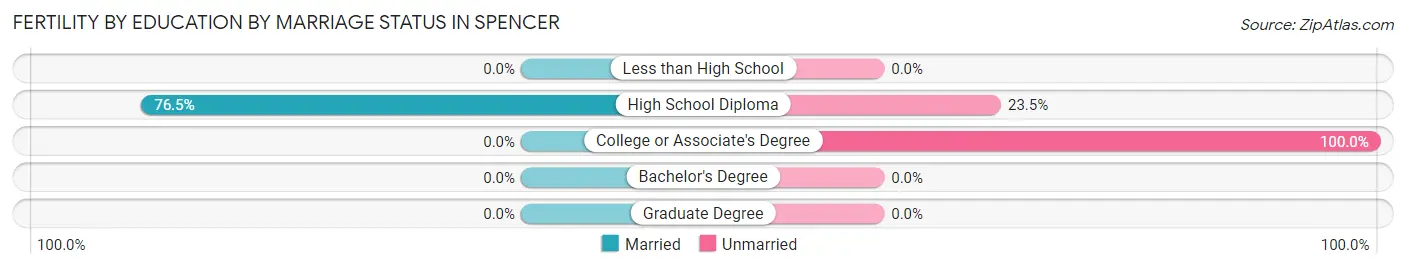
| Educational Attainment | Married | Unmarried |
| Less than High School | 0 (0.0%) | 0 (0.0%) |
| High School Diploma | 13 (76.5%) | 4 (23.5%) |
| College or Associate's Degree | 0 (0.0%) | 6 (100.0%) |
| Bachelor's Degree | 0 (0.0%) | 0 (0.0%) |
| Graduate Degree | 0 (0.0%) | 0 (0.0%) |
| Total | 13 (56.5%) | 10 (43.5%) |
Employment Characteristics in Spencer
Employment by Class of Employer in Spencer
Among the 962 employed individuals in Spencer, private company employees (611 | 63.5%), local government employees (116 | 12.1%), and not-for-profit organizations (86 | 8.9%) make up the most common classes of employment.
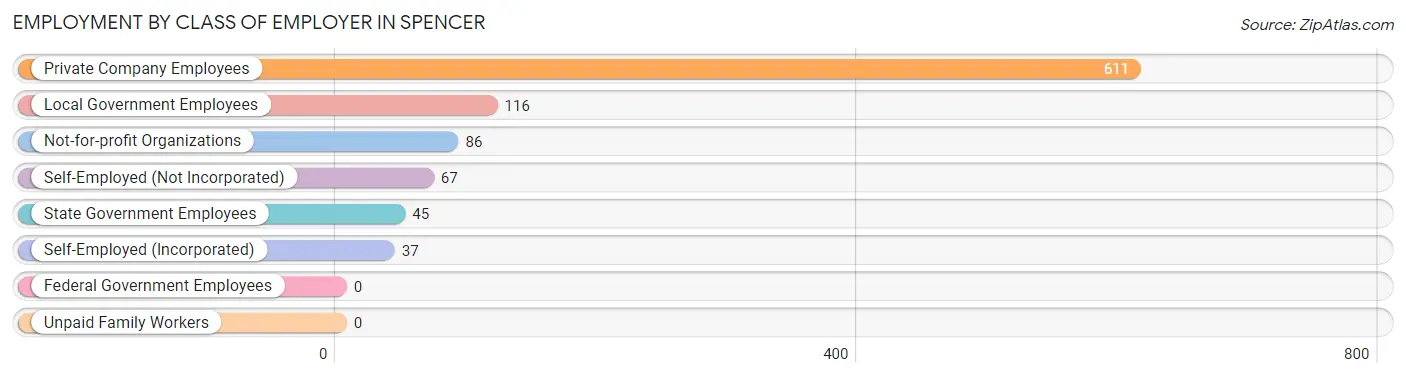
| Employer Class | # Employees | % Employees |
| Private Company Employees | 611 | 63.5% |
| Self-Employed (Incorporated) | 37 | 3.8% |
| Self-Employed (Not Incorporated) | 67 | 7.0% |
| Not-for-profit Organizations | 86 | 8.9% |
| Local Government Employees | 116 | 12.1% |
| State Government Employees | 45 | 4.7% |
| Federal Government Employees | 0 | 0.0% |
| Unpaid Family Workers | 0 | 0.0% |
| Total | 962 | 100.0% |
Employment Status by Age in Spencer
According to the labor force statistics for Spencer, out of the total population over 16 years of age (1,916), 55.2% or 1,058 individuals are in the labor force, with 6.0% or 63 of them unemployed. The age group with the highest labor force participation rate is 55 to 59 years, with 91.0% or 91 individuals in the labor force. Within the labor force, the 16 to 19 years age range has the highest percentage of unemployed individuals, with 30.0% or 21 of them being unemployed.

| Age Bracket | In Labor Force | Unemployed |
| 16 to 19 Years | 70 (88.6%) | 21 (30.0%) |
| 20 to 24 Years | 87 (75.7%) | 0 (0.0%) |
| 25 to 29 Years | 131 (70.4%) | 7 (5.3%) |
| 30 to 34 Years | 86 (86.9%) | 0 (0.0%) |
| 35 to 44 Years | 166 (71.2%) | 19 (11.4%) |
| 45 to 54 Years | 205 (84.4%) | 0 (0.0%) |
| 55 to 59 Years | 91 (91.0%) | 11 (12.1%) |
| 60 to 64 Years | 93 (41.2%) | 0 (0.0%) |
| 65 to 74 Years | 112 (28.8%) | 5 (4.5%) |
| 75 Years and over | 16 (6.5%) | 0 (0.0%) |
| Total | 1,058 (55.2%) | 63 (6.0%) |
Employment Status by Educational Attainment in Spencer
According to labor force statistics for Spencer, 71.0% of individuals (772) out of the total population between 25 and 64 years of age (1,087) are in the labor force, with 4.8% or 37 of them being unemployed. The group with the highest labor force participation rate are those with the educational attainment of bachelor's degree or higher, with 91.1% or 154 individuals in the labor force. Within the labor force, individuals with high school diploma education have the highest percentage of unemployment, with 7.3% or 19 of them being unemployed.
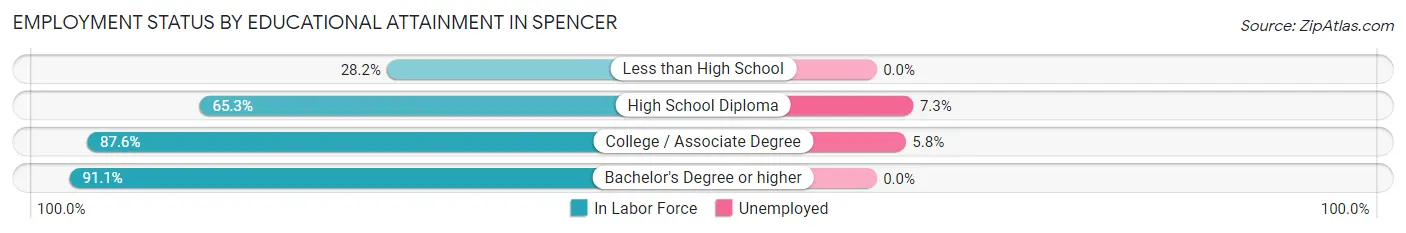
| Educational Attainment | In Labor Force | Unemployed |
| Less than High School | 46 (28.2%) | 0 (0.0%) |
| High School Diploma | 262 (65.3%) | 29 (7.3%) |
| College / Associate Degree | 310 (87.6%) | 21 (5.8%) |
| Bachelor's Degree or higher | 154 (91.1%) | 0 (0.0%) |
| Total | 772 (71.0%) | 52 (4.8%) |
Employment Occupations by Sex in Spencer
Management, Business, Science and Arts Occupations
The most common Management, Business, Science and Arts occupations in Spencer are Community & Social Service (97 | 9.8%), Education Instruction & Library (67 | 6.7%), Business & Financial (55 | 5.5%), Management (50 | 5.0%), and Computers, Engineering & Science (36 | 3.6%).
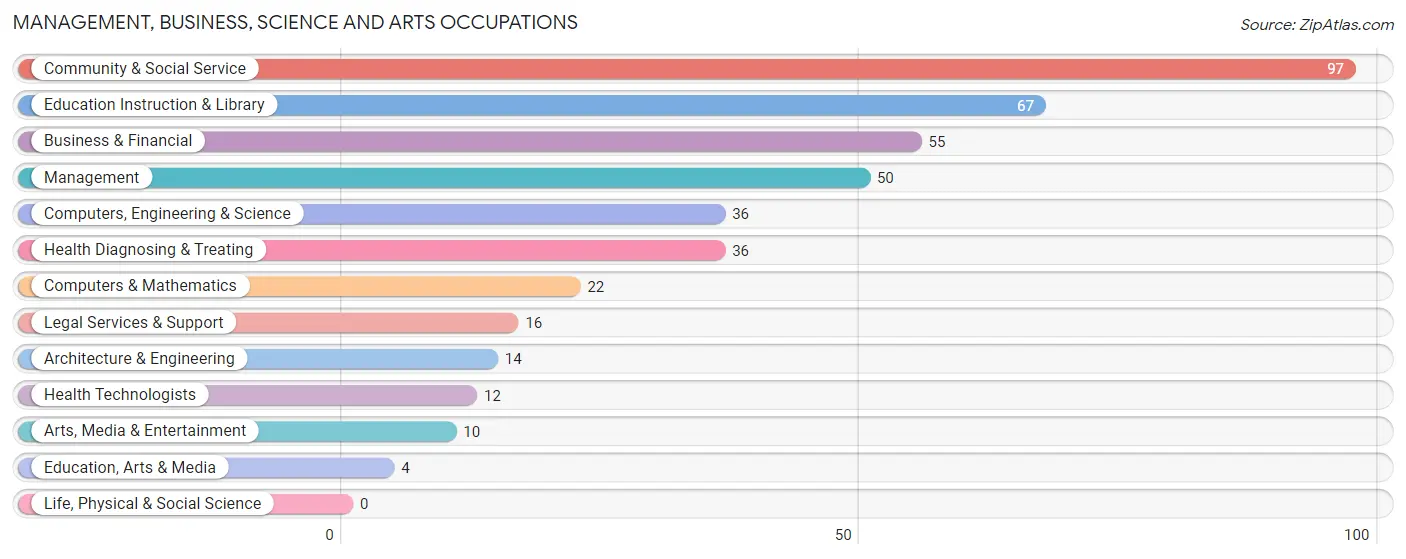
Management, Business, Science and Arts Occupations by Sex
Within the Management, Business, Science and Arts occupations in Spencer, the most male-oriented occupations are Computers & Mathematics (100.0%), Legal Services & Support (68.8%), and Management (66.0%), while the most female-oriented occupations are Architecture & Engineering (100.0%), Education, Arts & Media (100.0%), and Arts, Media & Entertainment (100.0%).
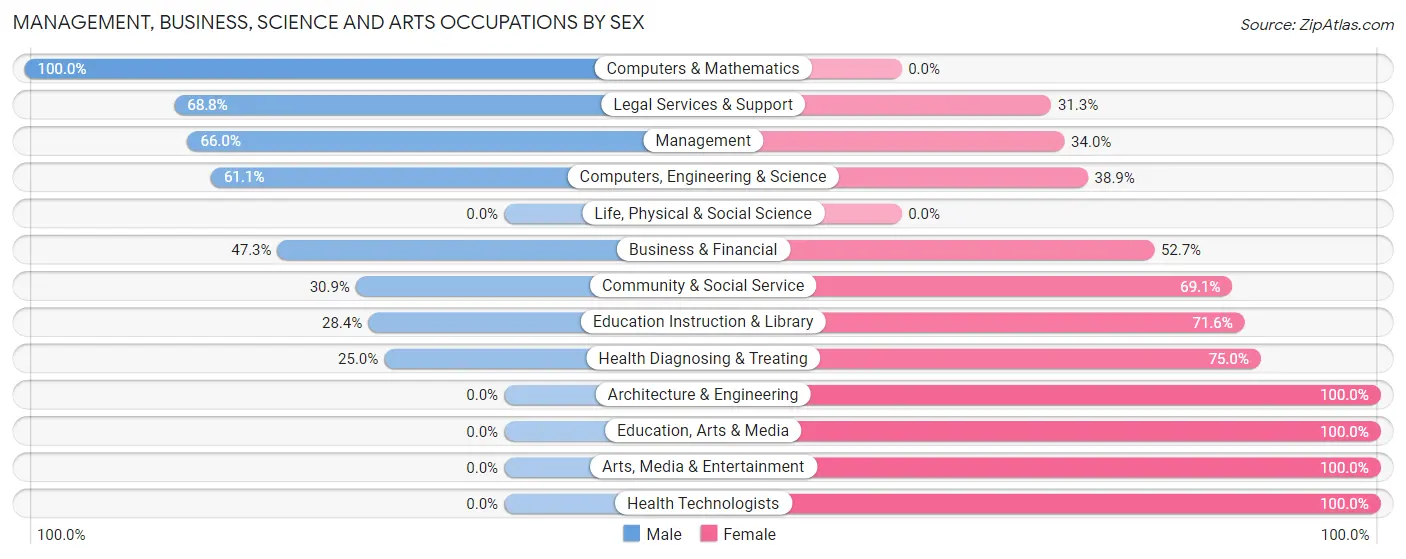
| Occupation | Male | Female |
| Management | 33 (66.0%) | 17 (34.0%) |
| Business & Financial | 26 (47.3%) | 29 (52.7%) |
| Computers, Engineering & Science | 22 (61.1%) | 14 (38.9%) |
| Computers & Mathematics | 22 (100.0%) | 0 (0.0%) |
| Architecture & Engineering | 0 (0.0%) | 14 (100.0%) |
| Life, Physical & Social Science | 0 (0.0%) | 0 (0.0%) |
| Community & Social Service | 30 (30.9%) | 67 (69.1%) |
| Education, Arts & Media | 0 (0.0%) | 4 (100.0%) |
| Legal Services & Support | 11 (68.8%) | 5 (31.2%) |
| Education Instruction & Library | 19 (28.4%) | 48 (71.6%) |
| Arts, Media & Entertainment | 0 (0.0%) | 10 (100.0%) |
| Health Diagnosing & Treating | 9 (25.0%) | 27 (75.0%) |
| Health Technologists | 0 (0.0%) | 12 (100.0%) |
| Total (Category) | 120 (43.8%) | 154 (56.2%) |
| Total (Overall) | 499 (50.2%) | 495 (49.8%) |
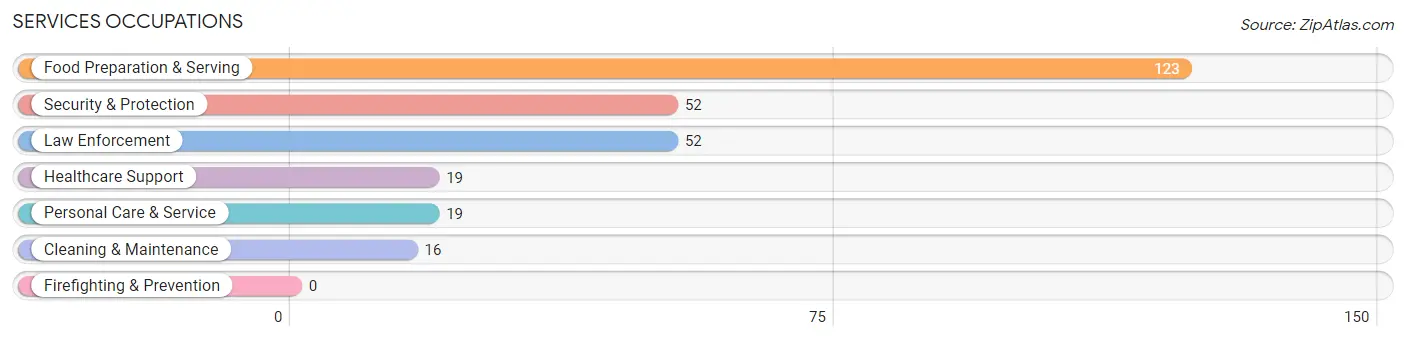
Services Occupations
The most common Services occupations in Spencer are Food Preparation & Serving (123 | 12.4%), Security & Protection (52 | 5.2%), Law Enforcement (52 | 5.2%), Healthcare Support (19 | 1.9%), and Personal Care & Service (19 | 1.9%).
Services Occupations by Sex
Within the Services occupations in Spencer, the most male-oriented occupations are Security & Protection (80.8%), Law Enforcement (80.8%), and Cleaning & Maintenance (43.8%), while the most female-oriented occupations are Healthcare Support (100.0%), Food Preparation & Serving (64.2%), and Personal Care & Service (57.9%).
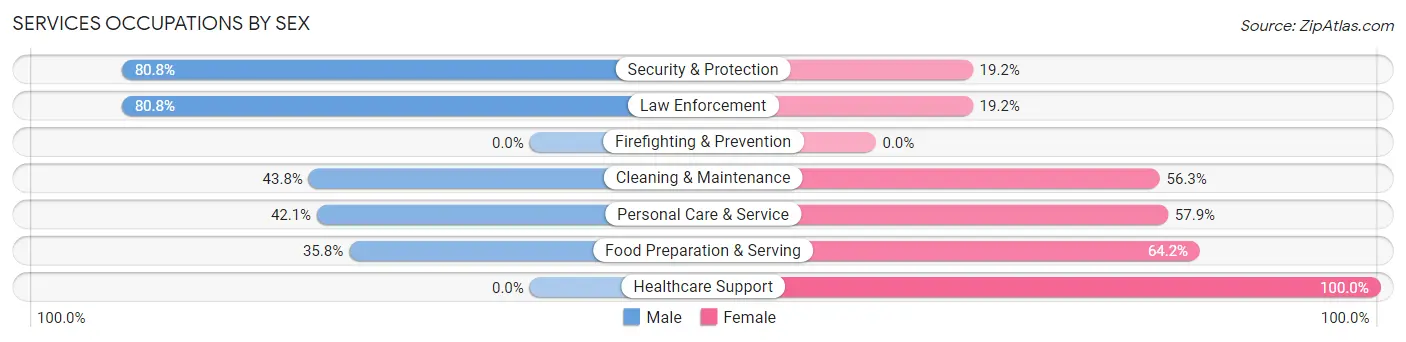
| Occupation | Male | Female |
| Healthcare Support | 0 (0.0%) | 19 (100.0%) |
| Security & Protection | 42 (80.8%) | 10 (19.2%) |
| Firefighting & Prevention | 0 (0.0%) | 0 (0.0%) |
| Law Enforcement | 42 (80.8%) | 10 (19.2%) |
| Food Preparation & Serving | 44 (35.8%) | 79 (64.2%) |
| Cleaning & Maintenance | 7 (43.8%) | 9 (56.2%) |
| Personal Care & Service | 8 (42.1%) | 11 (57.9%) |
| Total (Category) | 101 (44.1%) | 128 (55.9%) |
| Total (Overall) | 499 (50.2%) | 495 (49.8%) |
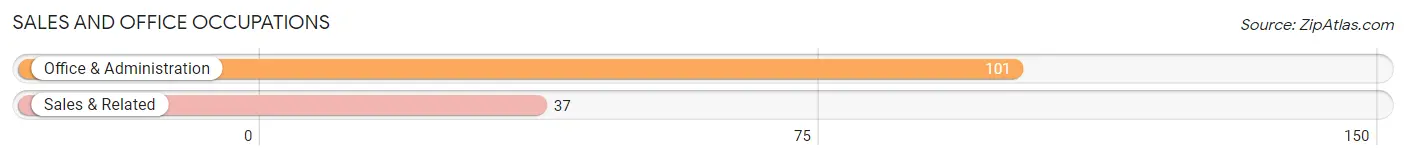
Sales and Office Occupations
The most common Sales and Office occupations in Spencer are Office & Administration (101 | 10.2%), and Sales & Related (37 | 3.7%).
Sales and Office Occupations by Sex
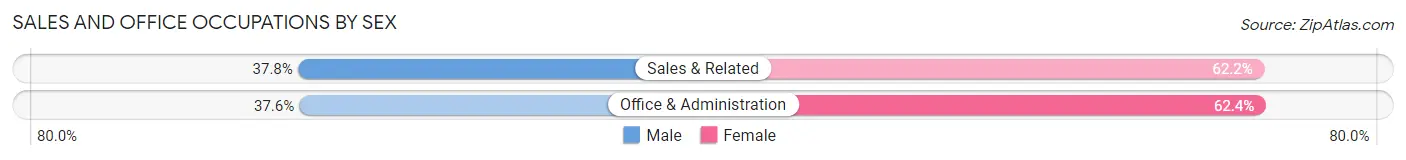
| Occupation | Male | Female |
| Sales & Related | 14 (37.8%) | 23 (62.2%) |
| Office & Administration | 38 (37.6%) | 63 (62.4%) |
| Total (Category) | 52 (37.7%) | 86 (62.3%) |
| Total (Overall) | 499 (50.2%) | 495 (49.8%) |
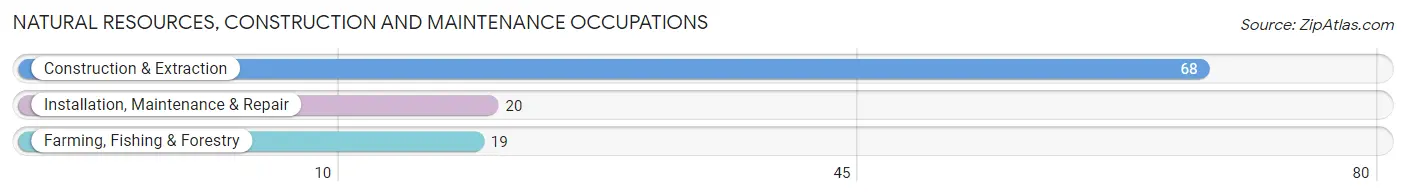
Natural Resources, Construction and Maintenance Occupations
The most common Natural Resources, Construction and Maintenance occupations in Spencer are Construction & Extraction (68 | 6.8%), Installation, Maintenance & Repair (20 | 2.0%), and Farming, Fishing & Forestry (19 | 1.9%).
Natural Resources, Construction and Maintenance Occupations by Sex
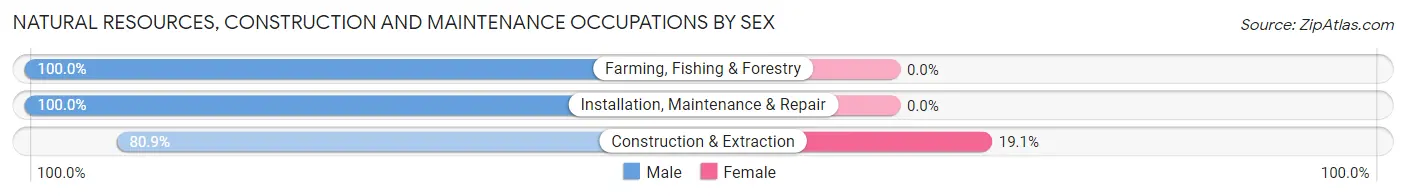
| Occupation | Male | Female |
| Farming, Fishing & Forestry | 19 (100.0%) | 0 (0.0%) |
| Construction & Extraction | 55 (80.9%) | 13 (19.1%) |
| Installation, Maintenance & Repair | 20 (100.0%) | 0 (0.0%) |
| Total (Category) | 94 (87.8%) | 13 (12.1%) |
| Total (Overall) | 499 (50.2%) | 495 (49.8%) |
Production, Transportation and Moving Occupations
The most common Production, Transportation and Moving occupations in Spencer are Production (186 | 18.7%), Transportation (33 | 3.3%), and Material Moving (27 | 2.7%).
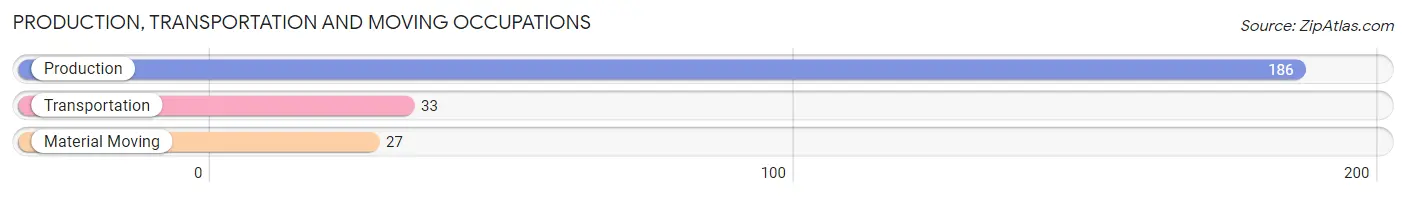
Production, Transportation and Moving Occupations by Sex
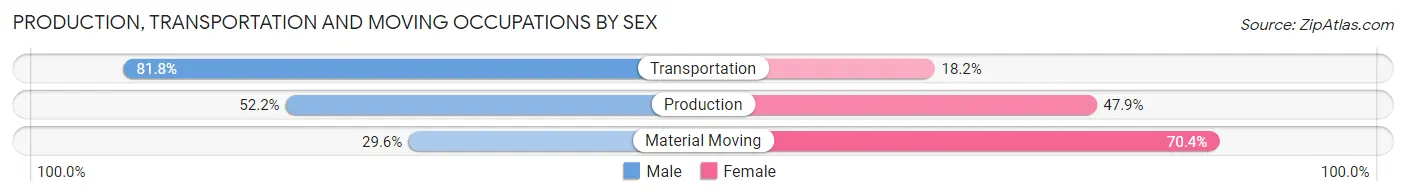
| Occupation | Male | Female |
| Production | 97 (52.1%) | 89 (47.8%) |
| Transportation | 27 (81.8%) | 6 (18.2%) |
| Material Moving | 8 (29.6%) | 19 (70.4%) |
| Total (Category) | 132 (53.7%) | 114 (46.3%) |
| Total (Overall) | 499 (50.2%) | 495 (49.8%) |
Employment Industries by Sex in Spencer
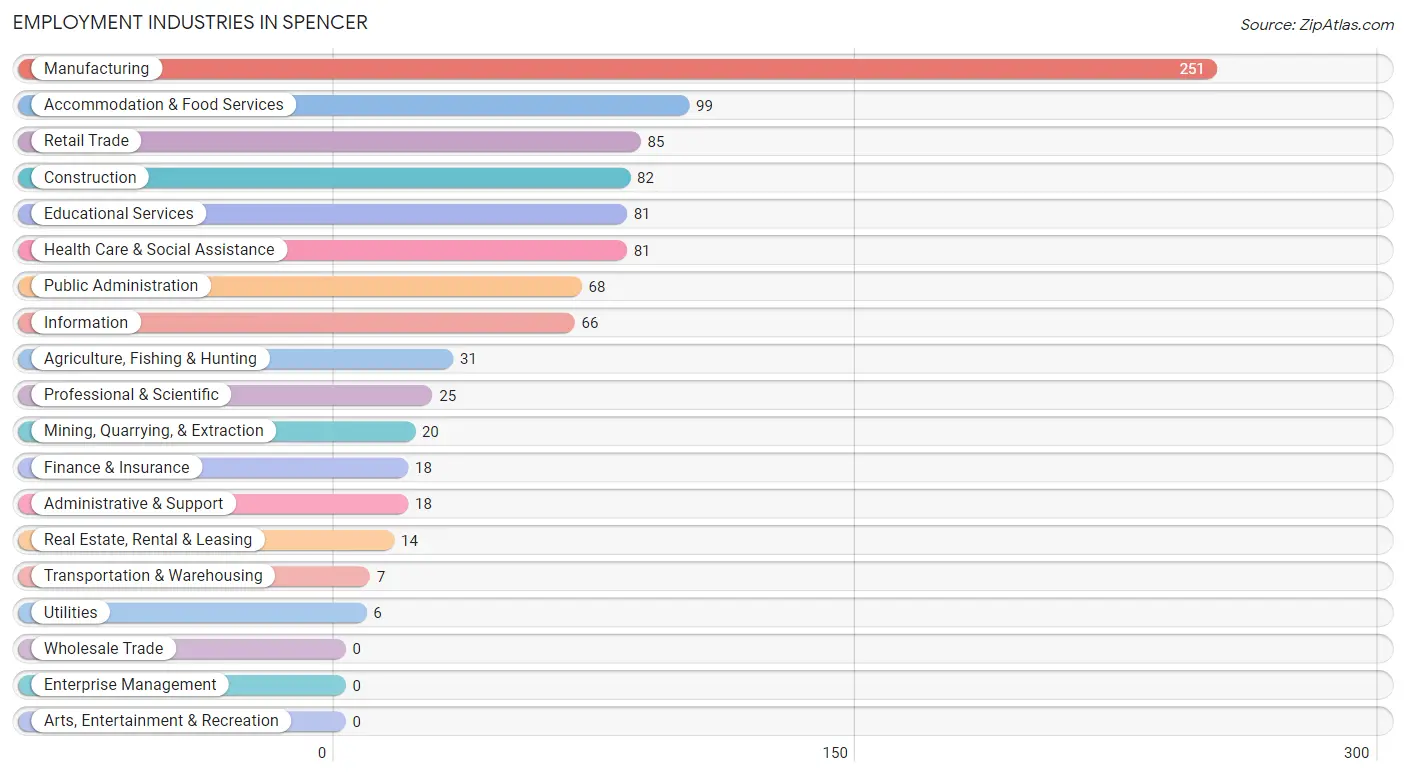
Employment Industries in Spencer
The major employment industries in Spencer include Manufacturing (251 | 25.3%), Accommodation & Food Services (99 | 10.0%), Retail Trade (85 | 8.6%), Construction (82 | 8.3%), and Educational Services (81 | 8.2%).
Employment Industries by Sex in Spencer
The Spencer industries that see more men than women are Agriculture, Fishing & Hunting (100.0%), Mining, Quarrying, & Extraction (100.0%), and Transportation & Warehousing (100.0%), whereas the industries that tend to have a higher number of women are Utilities (100.0%), Finance & Insurance (77.8%), and Health Care & Social Assistance (76.5%).
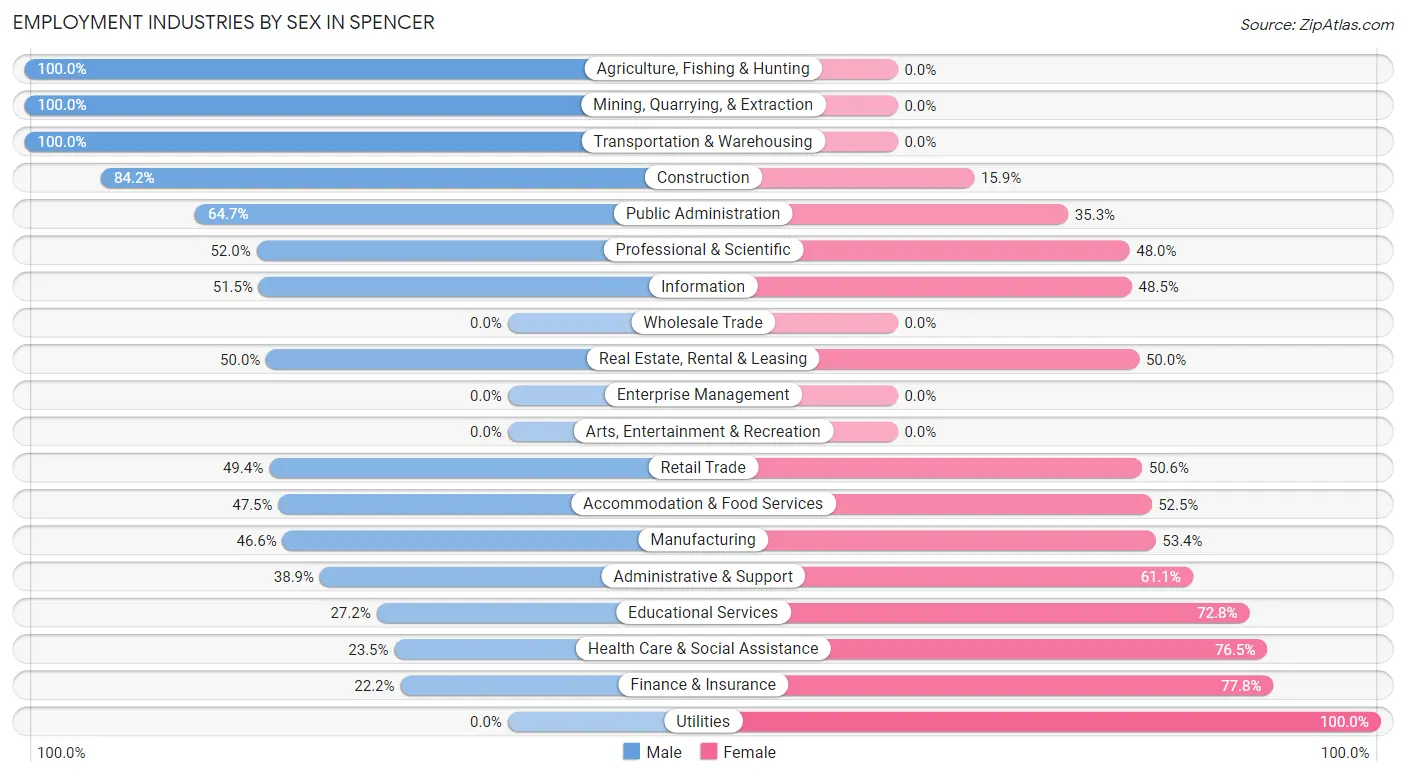
| Industry | Male | Female |
| Agriculture, Fishing & Hunting | 31 (100.0%) | 0 (0.0%) |
| Mining, Quarrying, & Extraction | 20 (100.0%) | 0 (0.0%) |
| Construction | 69 (84.2%) | 13 (15.9%) |
| Manufacturing | 117 (46.6%) | 134 (53.4%) |
| Wholesale Trade | 0 (0.0%) | 0 (0.0%) |
| Retail Trade | 42 (49.4%) | 43 (50.6%) |
| Transportation & Warehousing | 7 (100.0%) | 0 (0.0%) |
| Utilities | 0 (0.0%) | 6 (100.0%) |
| Information | 34 (51.5%) | 32 (48.5%) |
| Finance & Insurance | 4 (22.2%) | 14 (77.8%) |
| Real Estate, Rental & Leasing | 7 (50.0%) | 7 (50.0%) |
| Professional & Scientific | 13 (52.0%) | 12 (48.0%) |
| Enterprise Management | 0 (0.0%) | 0 (0.0%) |
| Administrative & Support | 7 (38.9%) | 11 (61.1%) |
| Educational Services | 22 (27.2%) | 59 (72.8%) |
| Health Care & Social Assistance | 19 (23.5%) | 62 (76.5%) |
| Arts, Entertainment & Recreation | 0 (0.0%) | 0 (0.0%) |
| Accommodation & Food Services | 47 (47.5%) | 52 (52.5%) |
| Public Administration | 44 (64.7%) | 24 (35.3%) |
| Total | 499 (50.2%) | 495 (49.8%) |
Education in Spencer
School Enrollment in Spencer
The most common levels of schooling among the 311 students in Spencer are middle school (78 | 25.1%), high school (76 | 24.4%), and college / undergraduate (55 | 17.7%).
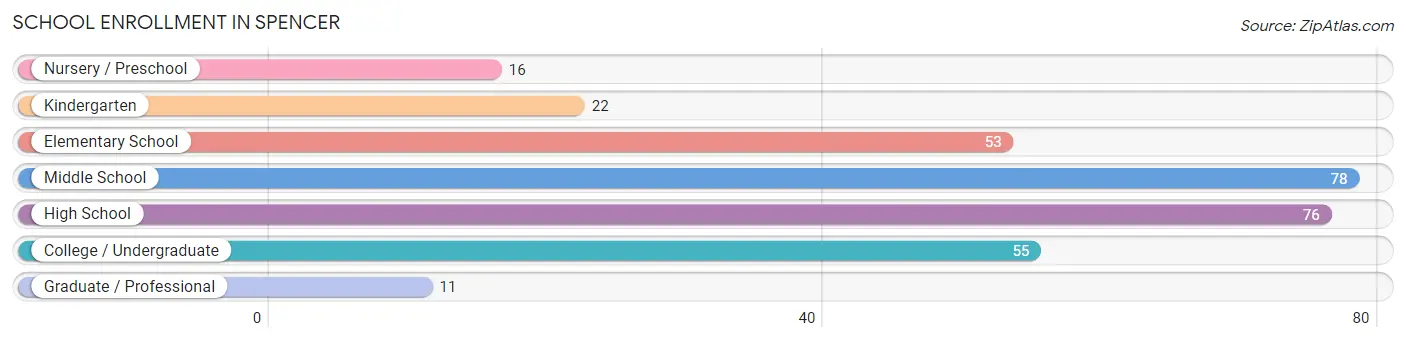
| School Level | # Students | % Students |
| Nursery / Preschool | 16 | 5.1% |
| Kindergarten | 22 | 7.1% |
| Elementary School | 53 | 17.0% |
| Middle School | 78 | 25.1% |
| High School | 76 | 24.4% |
| College / Undergraduate | 55 | 17.7% |
| Graduate / Professional | 11 | 3.5% |
| Total | 311 | 100.0% |
School Enrollment by Age by Funding Source in Spencer
Out of a total of 311 students who are enrolled in schools in Spencer, 37 (11.9%) attend a private institution, while the remaining 274 (88.1%) are enrolled in public schools. The age group of 35 years and over has the highest likelihood of being enrolled in private schools, with 12 (52.2% in the age bracket) enrolled. Conversely, the age group of 5 to 9 year old has the lowest likelihood of being enrolled in a private school, with 61 (100.0% in the age bracket) attending a public institution.
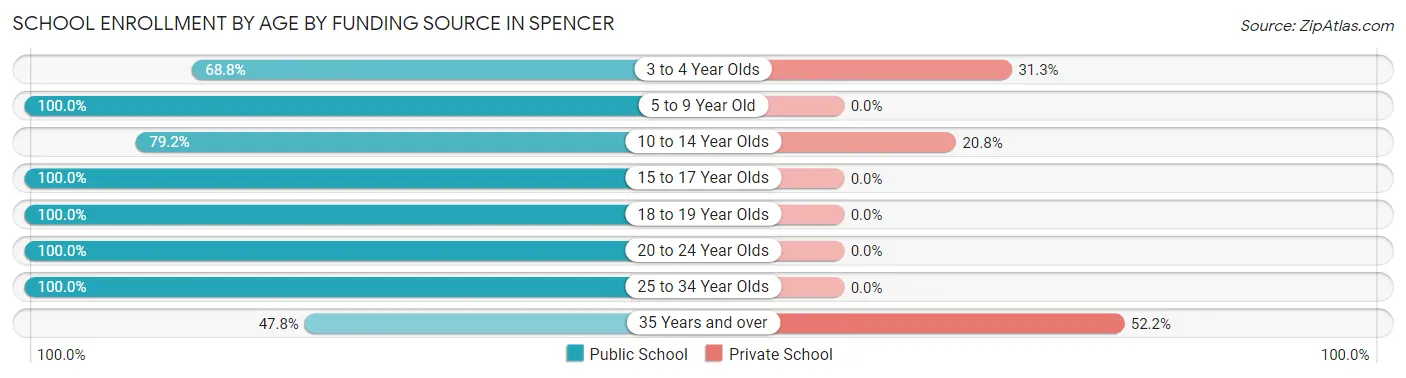
| Age Bracket | Public School | Private School |
| 3 to 4 Year Olds | 11 (68.8%) | 5 (31.2%) |
| 5 to 9 Year Old | 61 (100.0%) | 0 (0.0%) |
| 10 to 14 Year Olds | 76 (79.2%) | 20 (20.8%) |
| 15 to 17 Year Olds | 56 (100.0%) | 0 (0.0%) |
| 18 to 19 Year Olds | 29 (100.0%) | 0 (0.0%) |
| 20 to 24 Year Olds | 4 (100.0%) | 0 (0.0%) |
| 25 to 34 Year Olds | 26 (100.0%) | 0 (0.0%) |
| 35 Years and over | 11 (47.8%) | 12 (52.2%) |
| Total | 274 (88.1%) | 37 (11.9%) |
Educational Attainment by Field of Study in Spencer
Education (74 | 21.4%), literature & languages (49 | 14.2%), science & technology (48 | 13.9%), business (43 | 12.4%), and social sciences (39 | 11.3%) are the most common fields of study among 346 individuals in Spencer who have obtained a bachelor's degree or higher.
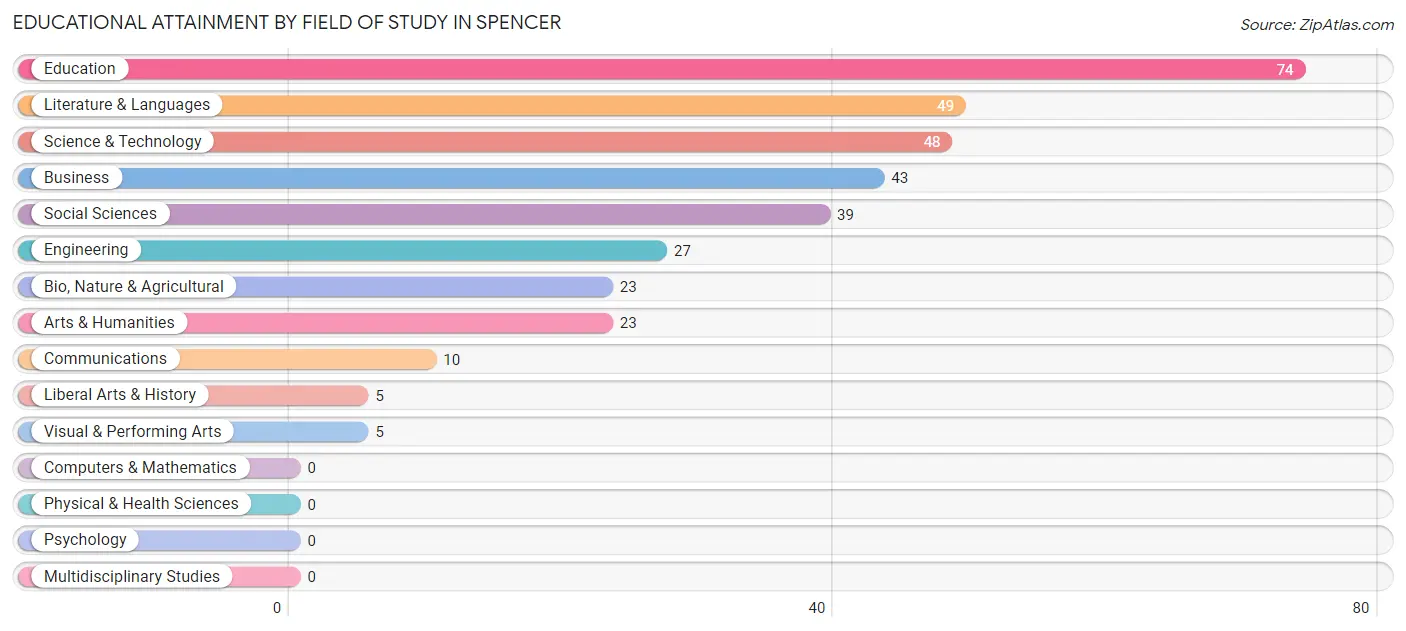
| Field of Study | # Graduates | % Graduates |
| Computers & Mathematics | 0 | 0.0% |
| Bio, Nature & Agricultural | 23 | 6.7% |
| Physical & Health Sciences | 0 | 0.0% |
| Psychology | 0 | 0.0% |
| Social Sciences | 39 | 11.3% |
| Engineering | 27 | 7.8% |
| Multidisciplinary Studies | 0 | 0.0% |
| Science & Technology | 48 | 13.9% |
| Business | 43 | 12.4% |
| Education | 74 | 21.4% |
| Literature & Languages | 49 | 14.2% |
| Liberal Arts & History | 5 | 1.5% |
| Visual & Performing Arts | 5 | 1.5% |
| Communications | 10 | 2.9% |
| Arts & Humanities | 23 | 6.7% |
| Total | 346 | 100.0% |
Transportation & Commute in Spencer
Vehicle Availability by Sex in Spencer
The most prevalent vehicle ownership categories in Spencer are males with 3 vehicles (195, accounting for 39.8%) and females with 3 vehicles (117, making up 41.7%).
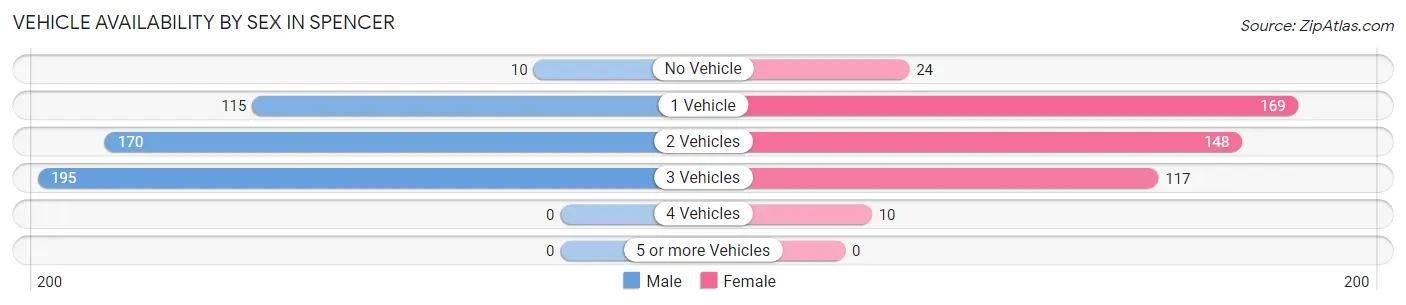
| Vehicles Available | Male | Female |
| No Vehicle | 10 (2.0%) | 24 (5.1%) |
| 1 Vehicle | 115 (23.5%) | 169 (36.1%) |
| 2 Vehicles | 170 (34.7%) | 148 (31.6%) |
| 3 Vehicles | 195 (39.8%) | 117 (25.0%) |
| 4 Vehicles | 0 (0.0%) | 10 (2.1%) |
| 5 or more Vehicles | 0 (0.0%) | 0 (0.0%) |
| Total | 490 (100.0%) | 468 (100.0%) |
Commute Time in Spencer
The most frequently occuring commute durations in Spencer are 5 to 9 minutes (231 commuters, 25.3%), 30 to 34 minutes (115 commuters, 12.6%), and 20 to 24 minutes (105 commuters, 11.5%).
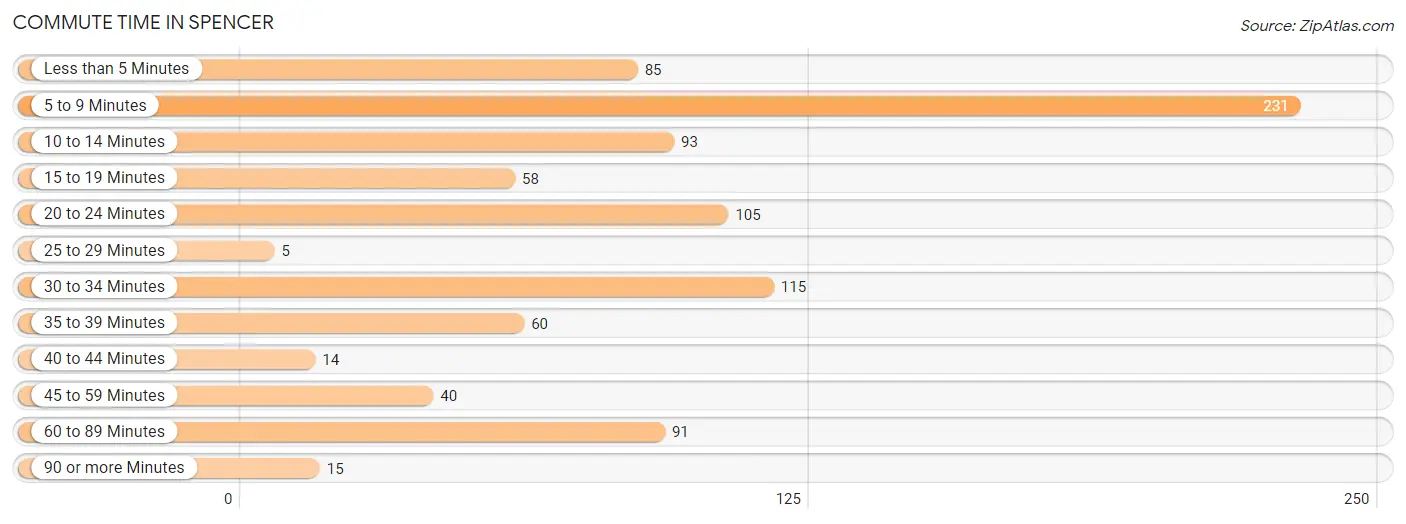
| Commute Time | # Commuters | % Commuters |
| Less than 5 Minutes | 85 | 9.3% |
| 5 to 9 Minutes | 231 | 25.3% |
| 10 to 14 Minutes | 93 | 10.2% |
| 15 to 19 Minutes | 58 | 6.4% |
| 20 to 24 Minutes | 105 | 11.5% |
| 25 to 29 Minutes | 5 | 0.5% |
| 30 to 34 Minutes | 115 | 12.6% |
| 35 to 39 Minutes | 60 | 6.6% |
| 40 to 44 Minutes | 14 | 1.5% |
| 45 to 59 Minutes | 40 | 4.4% |
| 60 to 89 Minutes | 91 | 10.0% |
| 90 or more Minutes | 15 | 1.6% |
Commute Time by Sex in Spencer
The most common commute times in Spencer are 5 to 9 minutes (105 commuters, 22.5%) for males and 5 to 9 minutes (126 commuters, 28.3%) for females.
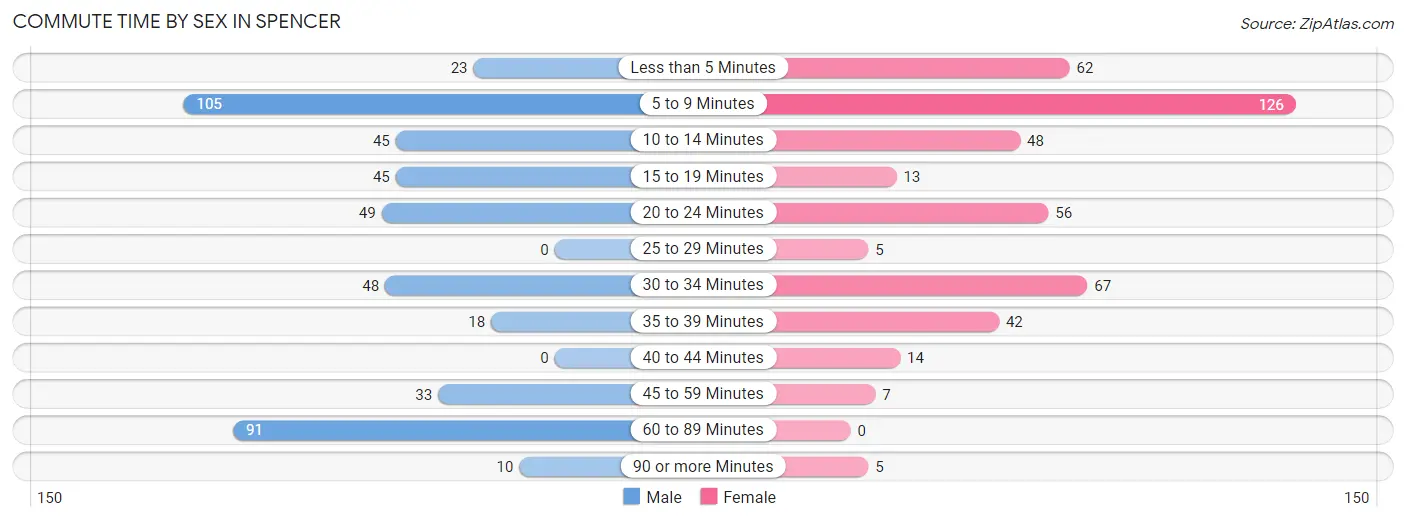
| Commute Time | Male | Female |
| Less than 5 Minutes | 23 (4.9%) | 62 (13.9%) |
| 5 to 9 Minutes | 105 (22.5%) | 126 (28.3%) |
| 10 to 14 Minutes | 45 (9.6%) | 48 (10.8%) |
| 15 to 19 Minutes | 45 (9.6%) | 13 (2.9%) |
| 20 to 24 Minutes | 49 (10.5%) | 56 (12.6%) |
| 25 to 29 Minutes | 0 (0.0%) | 5 (1.1%) |
| 30 to 34 Minutes | 48 (10.3%) | 67 (15.1%) |
| 35 to 39 Minutes | 18 (3.8%) | 42 (9.4%) |
| 40 to 44 Minutes | 0 (0.0%) | 14 (3.2%) |
| 45 to 59 Minutes | 33 (7.1%) | 7 (1.6%) |
| 60 to 89 Minutes | 91 (19.5%) | 0 (0.0%) |
| 90 or more Minutes | 10 (2.1%) | 5 (1.1%) |
Time of Departure to Work by Sex in Spencer
The most frequent times of departure to work in Spencer are 12:00 AM to 4:59 AM (101, 21.6%) for males and 7:00 AM to 7:29 AM (100, 22.5%) for females.
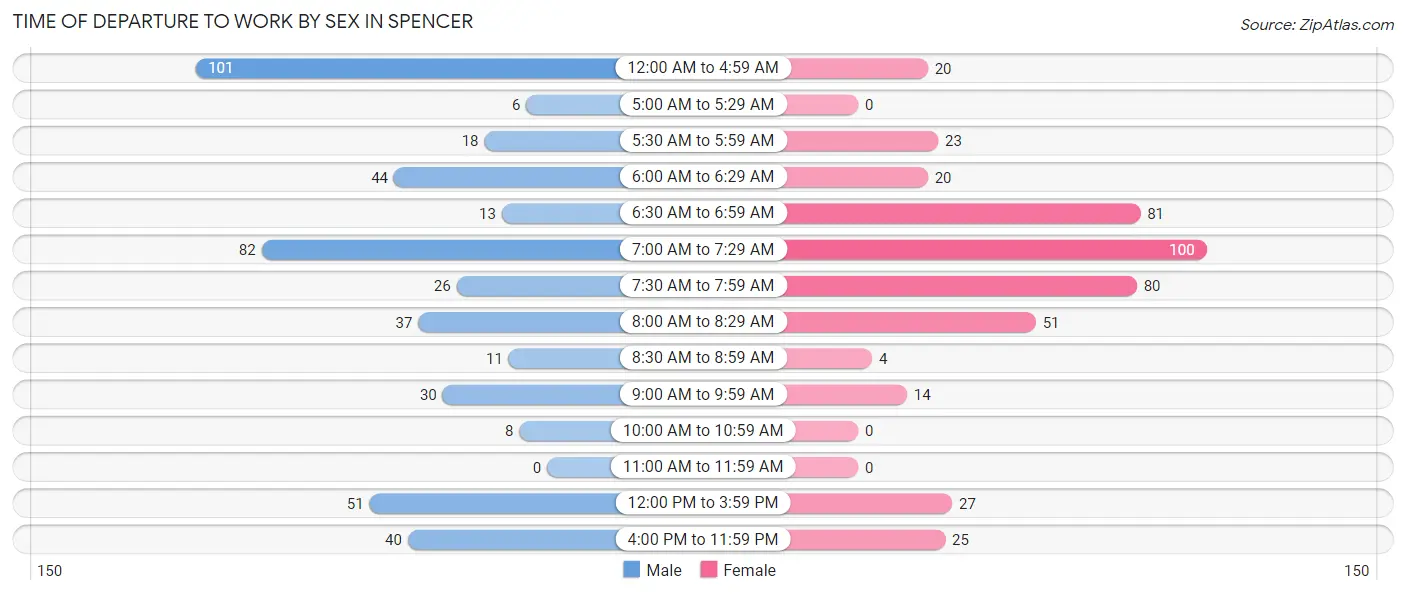
| Time of Departure | Male | Female |
| 12:00 AM to 4:59 AM | 101 (21.6%) | 20 (4.5%) |
| 5:00 AM to 5:29 AM | 6 (1.3%) | 0 (0.0%) |
| 5:30 AM to 5:59 AM | 18 (3.8%) | 23 (5.2%) |
| 6:00 AM to 6:29 AM | 44 (9.4%) | 20 (4.5%) |
| 6:30 AM to 6:59 AM | 13 (2.8%) | 81 (18.2%) |
| 7:00 AM to 7:29 AM | 82 (17.6%) | 100 (22.5%) |
| 7:30 AM to 7:59 AM | 26 (5.6%) | 80 (18.0%) |
| 8:00 AM to 8:29 AM | 37 (7.9%) | 51 (11.5%) |
| 8:30 AM to 8:59 AM | 11 (2.4%) | 4 (0.9%) |
| 9:00 AM to 9:59 AM | 30 (6.4%) | 14 (3.2%) |
| 10:00 AM to 10:59 AM | 8 (1.7%) | 0 (0.0%) |
| 11:00 AM to 11:59 AM | 0 (0.0%) | 0 (0.0%) |
| 12:00 PM to 3:59 PM | 51 (10.9%) | 27 (6.1%) |
| 4:00 PM to 11:59 PM | 40 (8.6%) | 25 (5.6%) |
| Total | 467 (100.0%) | 445 (100.0%) |
Housing Occupancy in Spencer
Occupancy by Ownership in Spencer
Of the total 1,079 dwellings in Spencer, owner-occupied units account for 700 (64.9%), while renter-occupied units make up 379 (35.1%).
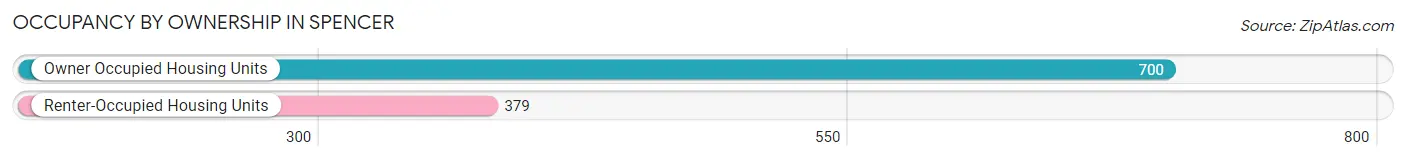
| Occupancy | # Housing Units | % Housing Units |
| Owner Occupied Housing Units | 700 | 64.9% |
| Renter-Occupied Housing Units | 379 | 35.1% |
| Total Occupied Housing Units | 1,079 | 100.0% |
Occupancy by Household Size in Spencer
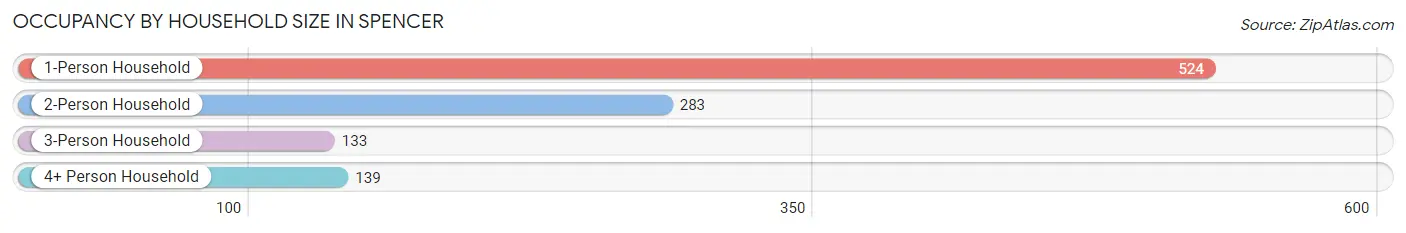
| Household Size | # Housing Units | % Housing Units |
| 1-Person Household | 524 | 48.6% |
| 2-Person Household | 283 | 26.2% |
| 3-Person Household | 133 | 12.3% |
| 4+ Person Household | 139 | 12.9% |
| Total Housing Units | 1,079 | 100.0% |
Occupancy by Ownership by Household Size in Spencer
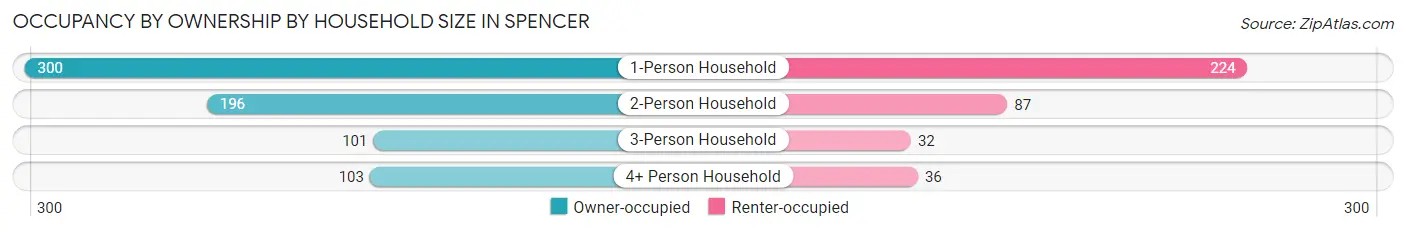
| Household Size | Owner-occupied | Renter-occupied |
| 1-Person Household | 300 (57.3%) | 224 (42.7%) |
| 2-Person Household | 196 (69.3%) | 87 (30.7%) |
| 3-Person Household | 101 (75.9%) | 32 (24.1%) |
| 4+ Person Household | 103 (74.1%) | 36 (25.9%) |
| Total Housing Units | 700 (64.9%) | 379 (35.1%) |
Occupancy by Educational Attainment in Spencer
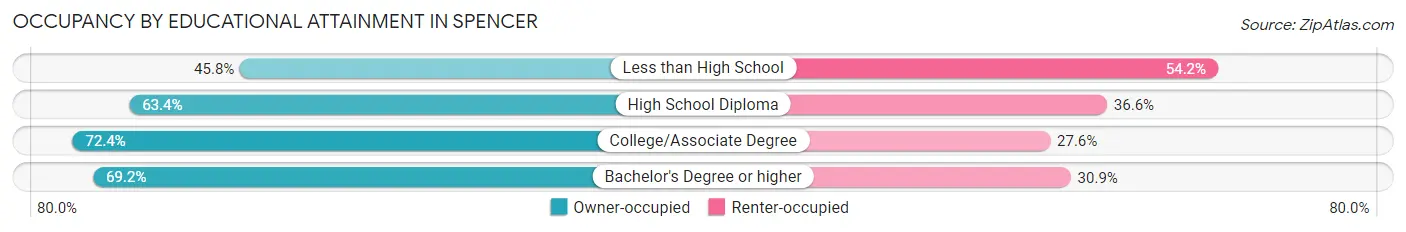
| Household Size | Owner-occupied | Renter-occupied |
| Less than High School | 82 (45.8%) | 97 (54.2%) |
| High School Diploma | 194 (63.4%) | 112 (36.6%) |
| College/Associate Degree | 294 (72.4%) | 112 (27.6%) |
| Bachelor's Degree or higher | 130 (69.2%) | 58 (30.8%) |
Occupancy by Age of Householder in Spencer
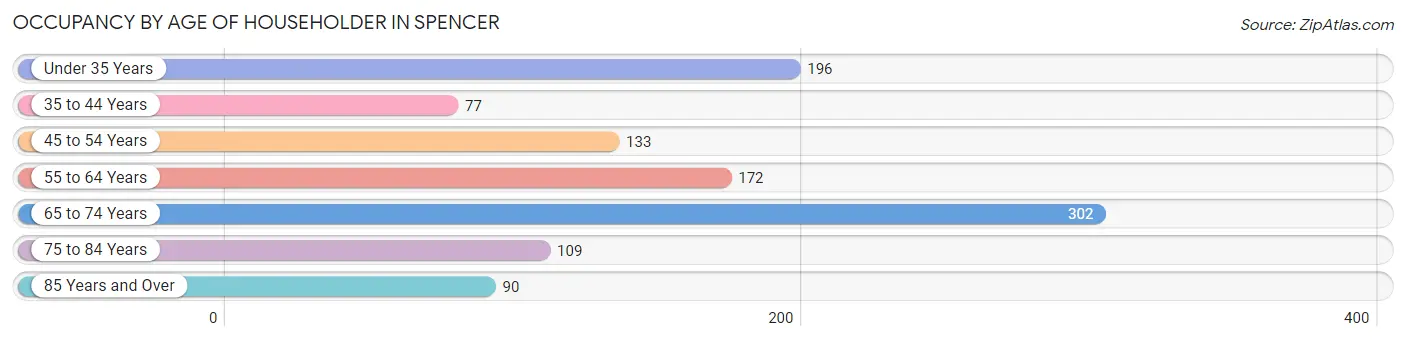
| Age Bracket | # Households | % Households |
| Under 35 Years | 196 | 18.2% |
| 35 to 44 Years | 77 | 7.1% |
| 45 to 54 Years | 133 | 12.3% |
| 55 to 64 Years | 172 | 15.9% |
| 65 to 74 Years | 302 | 28.0% |
| 75 to 84 Years | 109 | 10.1% |
| 85 Years and Over | 90 | 8.3% |
| Total | 1,079 | 100.0% |
Housing Finances in Spencer
Median Income by Occupancy in Spencer
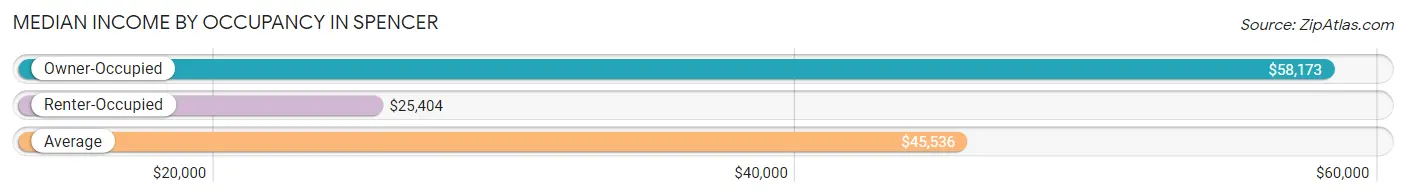
| Occupancy Type | # Households | Median Income |
| Owner-Occupied | 700 (64.9%) | $58,173 |
| Renter-Occupied | 379 (35.1%) | $25,404 |
| Average | 1,079 (100.0%) | $45,536 |
Occupancy by Householder Income Bracket in Spencer
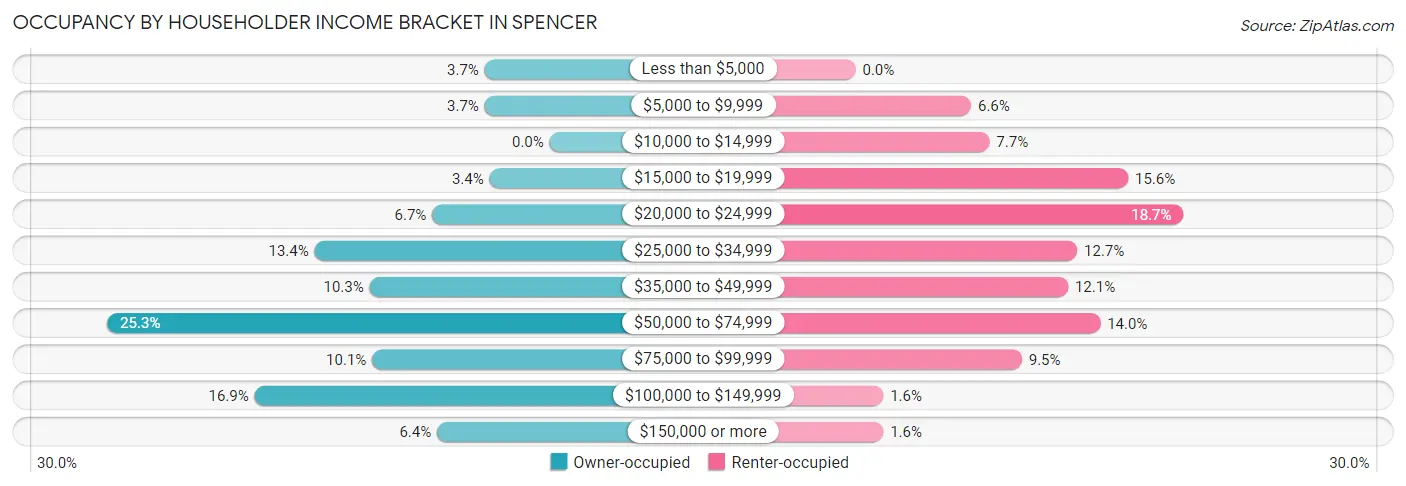
| Income Bracket | Owner-occupied | Renter-occupied |
| Less than $5,000 | 26 (3.7%) | 0 (0.0%) |
| $5,000 to $9,999 | 26 (3.7%) | 25 (6.6%) |
| $10,000 to $14,999 | 0 (0.0%) | 29 (7.6%) |
| $15,000 to $19,999 | 24 (3.4%) | 59 (15.6%) |
| $20,000 to $24,999 | 47 (6.7%) | 71 (18.7%) |
| $25,000 to $34,999 | 94 (13.4%) | 48 (12.7%) |
| $35,000 to $49,999 | 72 (10.3%) | 46 (12.1%) |
| $50,000 to $74,999 | 177 (25.3%) | 53 (14.0%) |
| $75,000 to $99,999 | 71 (10.1%) | 36 (9.5%) |
| $100,000 to $149,999 | 118 (16.9%) | 6 (1.6%) |
| $150,000 or more | 45 (6.4%) | 6 (1.6%) |
| Total | 700 (100.0%) | 379 (100.0%) |
Monthly Housing Cost Tiers in Spencer
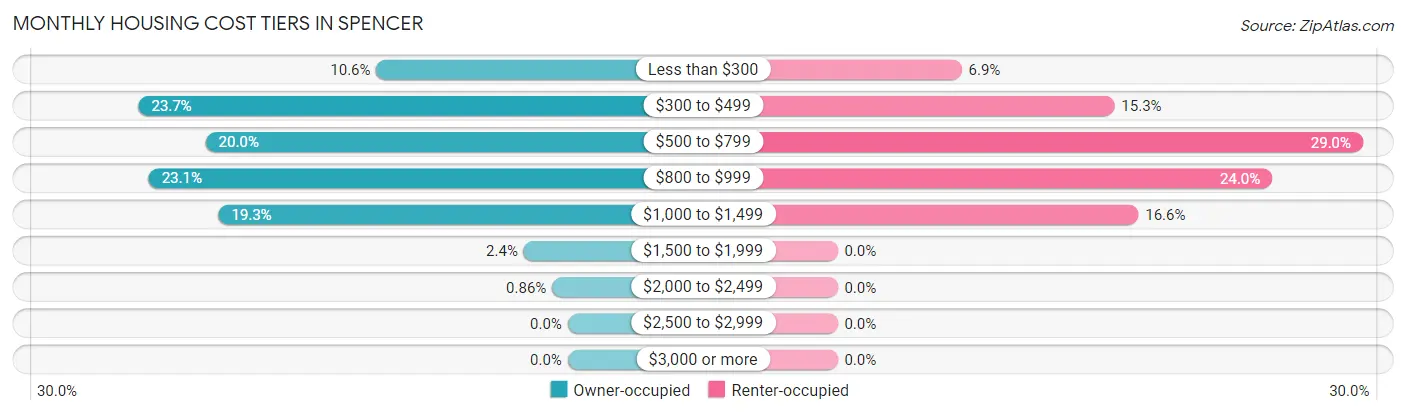
| Monthly Cost | Owner-occupied | Renter-occupied |
| Less than $300 | 74 (10.6%) | 26 (6.9%) |
| $300 to $499 | 166 (23.7%) | 58 (15.3%) |
| $500 to $799 | 140 (20.0%) | 110 (29.0%) |
| $800 to $999 | 162 (23.1%) | 91 (24.0%) |
| $1,000 to $1,499 | 135 (19.3%) | 63 (16.6%) |
| $1,500 to $1,999 | 17 (2.4%) | 0 (0.0%) |
| $2,000 to $2,499 | 6 (0.9%) | 0 (0.0%) |
| $2,500 to $2,999 | 0 (0.0%) | 0 (0.0%) |
| $3,000 or more | 0 (0.0%) | 0 (0.0%) |
| Total | 700 (100.0%) | 379 (100.0%) |
Physical Housing Characteristics in Spencer
Housing Structures in Spencer
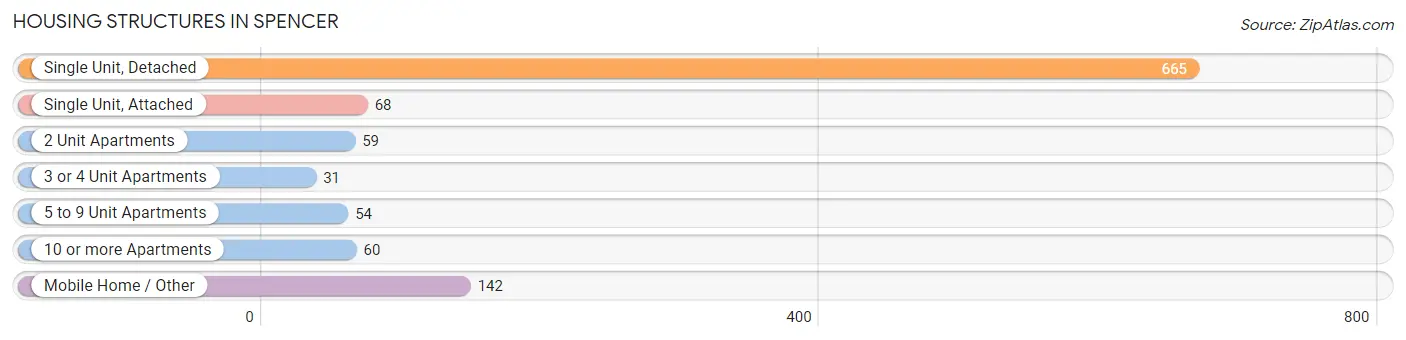
| Structure Type | # Housing Units | % Housing Units |
| Single Unit, Detached | 665 | 61.6% |
| Single Unit, Attached | 68 | 6.3% |
| 2 Unit Apartments | 59 | 5.5% |
| 3 or 4 Unit Apartments | 31 | 2.9% |
| 5 to 9 Unit Apartments | 54 | 5.0% |
| 10 or more Apartments | 60 | 5.6% |
| Mobile Home / Other | 142 | 13.2% |
| Total | 1,079 | 100.0% |
Housing Structures by Occupancy in Spencer
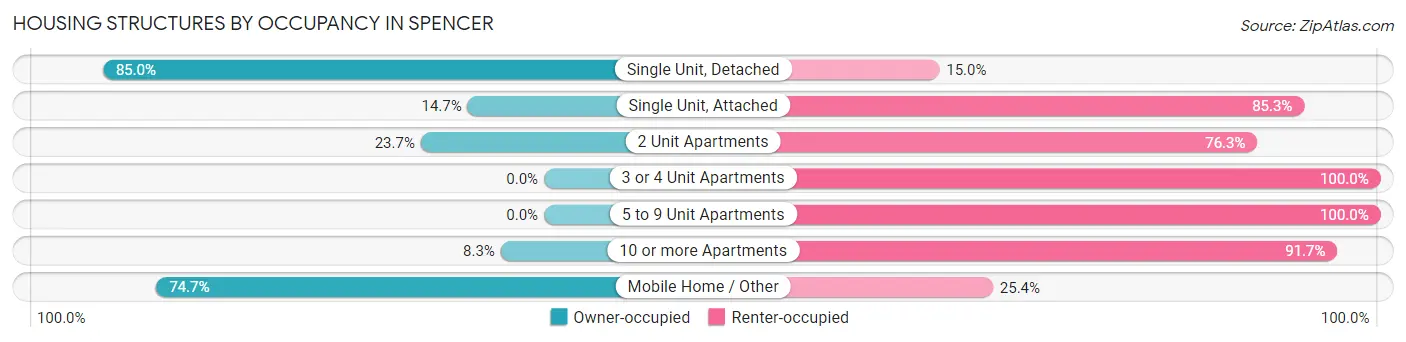
| Structure Type | Owner-occupied | Renter-occupied |
| Single Unit, Detached | 565 (85.0%) | 100 (15.0%) |
| Single Unit, Attached | 10 (14.7%) | 58 (85.3%) |
| 2 Unit Apartments | 14 (23.7%) | 45 (76.3%) |
| 3 or 4 Unit Apartments | 0 (0.0%) | 31 (100.0%) |
| 5 to 9 Unit Apartments | 0 (0.0%) | 54 (100.0%) |
| 10 or more Apartments | 5 (8.3%) | 55 (91.7%) |
| Mobile Home / Other | 106 (74.7%) | 36 (25.4%) |
| Total | 700 (64.9%) | 379 (35.1%) |
Housing Structures by Number of Rooms in Spencer
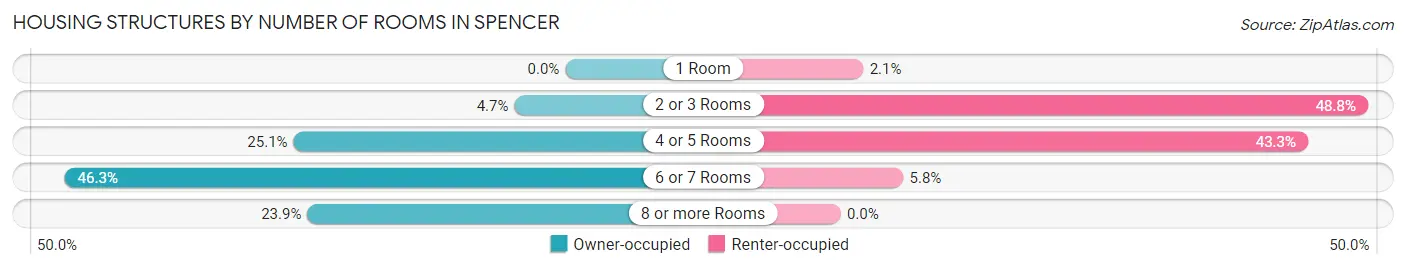
| Number of Rooms | Owner-occupied | Renter-occupied |
| 1 Room | 0 (0.0%) | 8 (2.1%) |
| 2 or 3 Rooms | 33 (4.7%) | 185 (48.8%) |
| 4 or 5 Rooms | 176 (25.1%) | 164 (43.3%) |
| 6 or 7 Rooms | 324 (46.3%) | 22 (5.8%) |
| 8 or more Rooms | 167 (23.9%) | 0 (0.0%) |
| Total | 700 (100.0%) | 379 (100.0%) |
Housing Structure by Heating Type in Spencer
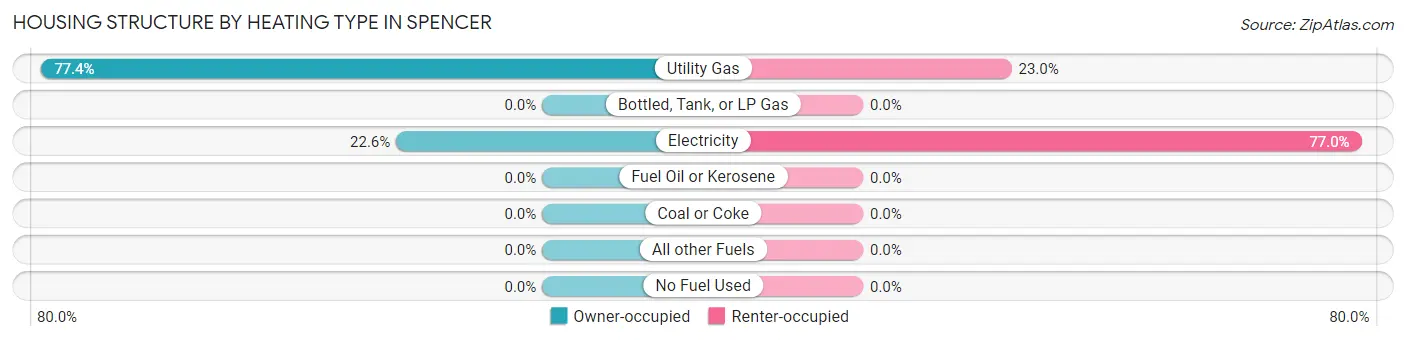
| Heating Type | Owner-occupied | Renter-occupied |
| Utility Gas | 542 (77.4%) | 87 (23.0%) |
| Bottled, Tank, or LP Gas | 0 (0.0%) | 0 (0.0%) |
| Electricity | 158 (22.6%) | 292 (77.0%) |
| Fuel Oil or Kerosene | 0 (0.0%) | 0 (0.0%) |
| Coal or Coke | 0 (0.0%) | 0 (0.0%) |
| All other Fuels | 0 (0.0%) | 0 (0.0%) |
| No Fuel Used | 0 (0.0%) | 0 (0.0%) |
| Total | 700 (100.0%) | 379 (100.0%) |
Household Vehicle Usage in Spencer
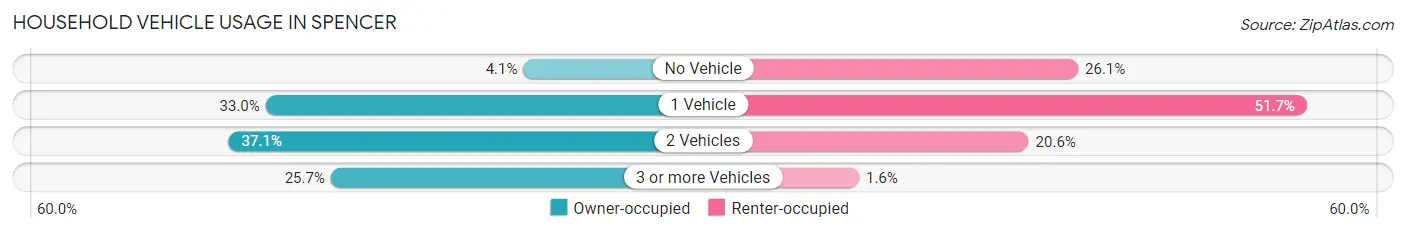
| Vehicles per Household | Owner-occupied | Renter-occupied |
| No Vehicle | 29 (4.1%) | 99 (26.1%) |
| 1 Vehicle | 231 (33.0%) | 196 (51.7%) |
| 2 Vehicles | 260 (37.1%) | 78 (20.6%) |
| 3 or more Vehicles | 180 (25.7%) | 6 (1.6%) |
| Total | 700 (100.0%) | 379 (100.0%) |
Real Estate & Mortgages in Spencer
Real Estate and Mortgage Overview in Spencer
| Characteristic | Without Mortgage | With Mortgage |
| Housing Units | 344 | 356 |
| Median Property Value | $145,500 | $118,900 |
| Median Household Income | $38,214 | $23 |
| Monthly Housing Costs | $419 | $0 |
| Real Estate Taxes | $845 | $18 |
Property Value by Mortgage Status in Spencer
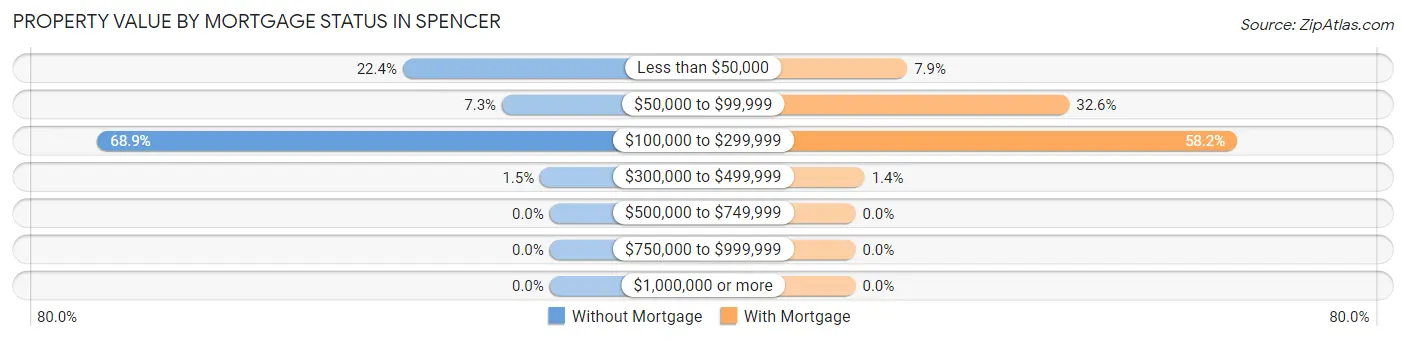
| Property Value | Without Mortgage | With Mortgage |
| Less than $50,000 | 77 (22.4%) | 28 (7.9%) |
| $50,000 to $99,999 | 25 (7.3%) | 116 (32.6%) |
| $100,000 to $299,999 | 237 (68.9%) | 207 (58.2%) |
| $300,000 to $499,999 | 5 (1.5%) | 5 (1.4%) |
| $500,000 to $749,999 | 0 (0.0%) | 0 (0.0%) |
| $750,000 to $999,999 | 0 (0.0%) | 0 (0.0%) |
| $1,000,000 or more | 0 (0.0%) | 0 (0.0%) |
| Total | 344 (100.0%) | 356 (100.0%) |
Household Income by Mortgage Status in Spencer
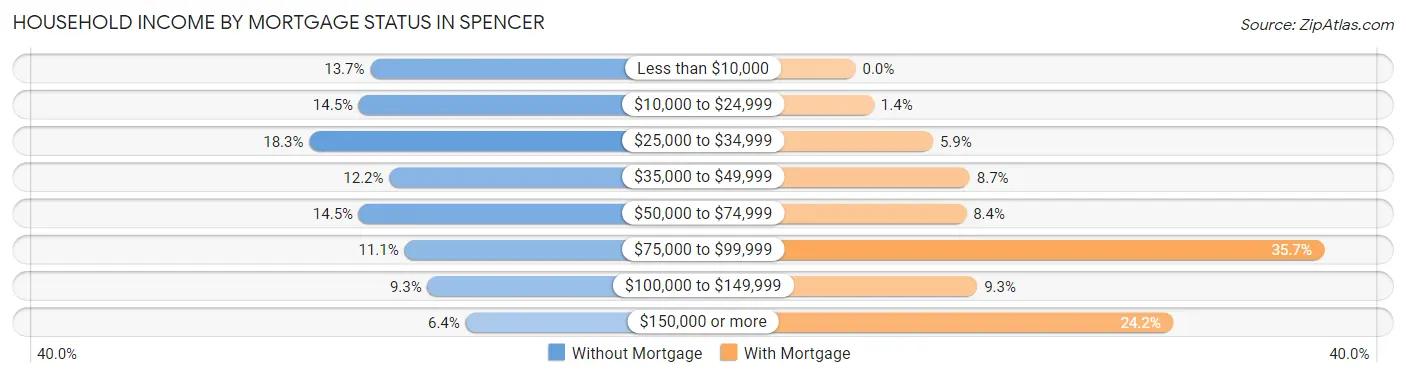
| Household Income | Without Mortgage | With Mortgage |
| Less than $10,000 | 47 (13.7%) | 0 (0.0%) |
| $10,000 to $24,999 | 50 (14.5%) | 5 (1.4%) |
| $25,000 to $34,999 | 63 (18.3%) | 21 (5.9%) |
| $35,000 to $49,999 | 42 (12.2%) | 31 (8.7%) |
| $50,000 to $74,999 | 50 (14.5%) | 30 (8.4%) |
| $75,000 to $99,999 | 38 (11.1%) | 127 (35.7%) |
| $100,000 to $149,999 | 32 (9.3%) | 33 (9.3%) |
| $150,000 or more | 22 (6.4%) | 86 (24.2%) |
| Total | 344 (100.0%) | 356 (100.0%) |
Property Value to Household Income Ratio in Spencer
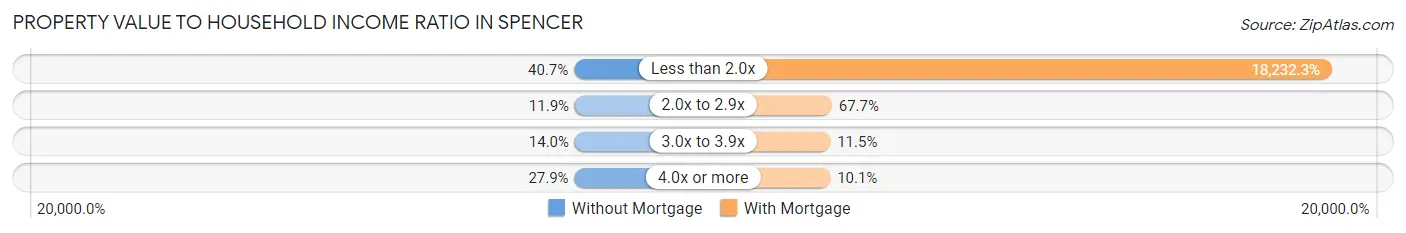
| Value-to-Income Ratio | Without Mortgage | With Mortgage |
| Less than 2.0x | 140 (40.7%) | 64,907 (18,232.3%) |
| 2.0x to 2.9x | 41 (11.9%) | 241 (67.7%) |
| 3.0x to 3.9x | 48 (14.0%) | 41 (11.5%) |
| 4.0x or more | 96 (27.9%) | 36 (10.1%) |
| Total | 344 (100.0%) | 356 (100.0%) |
Real Estate Taxes by Mortgage Status in Spencer
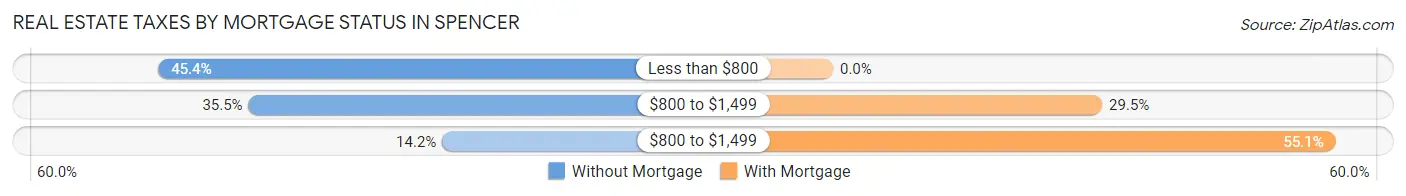
| Property Taxes | Without Mortgage | With Mortgage |
| Less than $800 | 156 (45.4%) | 0 (0.0%) |
| $800 to $1,499 | 122 (35.5%) | 105 (29.5%) |
| $800 to $1,499 | 49 (14.2%) | 196 (55.1%) |
| Total | 344 (100.0%) | 356 (100.0%) |
Health & Disability in Spencer
Health Insurance Coverage by Age in Spencer
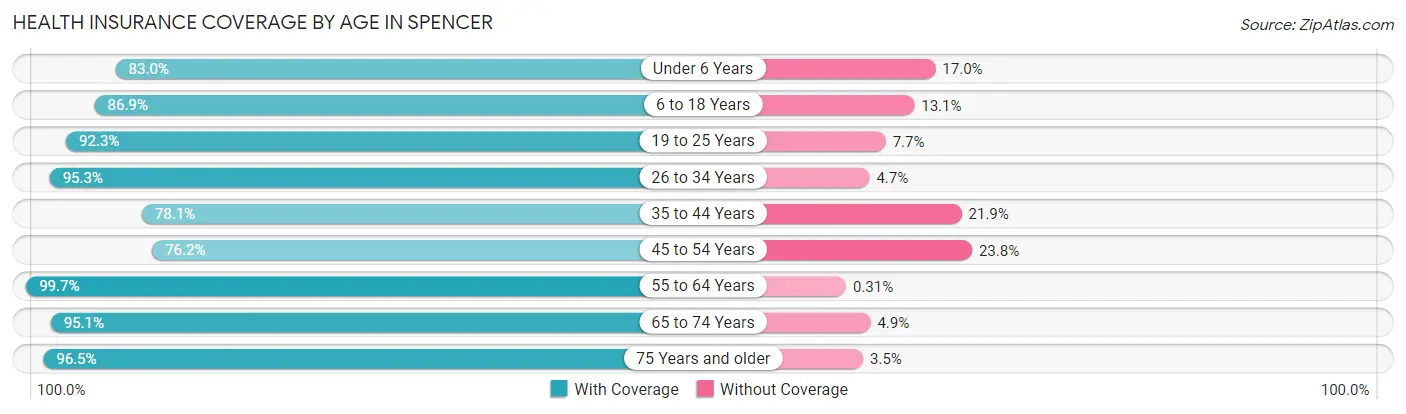
| Age Bracket | With Coverage | Without Coverage |
| Under 6 Years | 127 (83.0%) | 26 (17.0%) |
| 6 to 18 Years | 213 (86.9%) | 32 (13.1%) |
| 19 to 25 Years | 167 (92.3%) | 14 (7.7%) |
| 26 to 34 Years | 203 (95.3%) | 10 (4.7%) |
| 35 to 44 Years | 175 (78.1%) | 49 (21.9%) |
| 45 to 54 Years | 176 (76.2%) | 55 (23.8%) |
| 55 to 64 Years | 325 (99.7%) | 1 (0.3%) |
| 65 to 74 Years | 370 (95.1%) | 19 (4.9%) |
| 75 Years and older | 220 (96.5%) | 8 (3.5%) |
| Total | 1,976 (90.2%) | 214 (9.8%) |
Health Insurance Coverage by Citizenship Status in Spencer
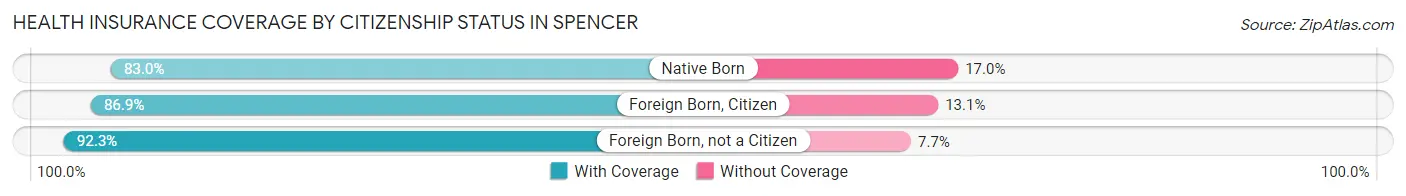
| Citizenship Status | With Coverage | Without Coverage |
| Native Born | 127 (83.0%) | 26 (17.0%) |
| Foreign Born, Citizen | 213 (86.9%) | 32 (13.1%) |
| Foreign Born, not a Citizen | 167 (92.3%) | 14 (7.7%) |
Health Insurance Coverage by Household Income in Spencer
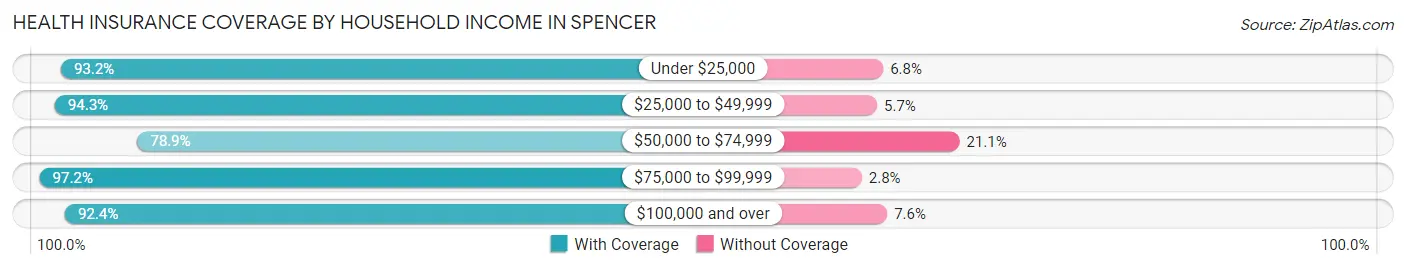
| Household Income | With Coverage | Without Coverage |
| Under $25,000 | 410 (93.2%) | 30 (6.8%) |
| $25,000 to $49,999 | 415 (94.3%) | 25 (5.7%) |
| $50,000 to $74,999 | 418 (78.9%) | 112 (21.1%) |
| $75,000 to $99,999 | 241 (97.2%) | 7 (2.8%) |
| $100,000 and over | 476 (92.4%) | 39 (7.6%) |
Public vs Private Health Insurance Coverage by Age in Spencer
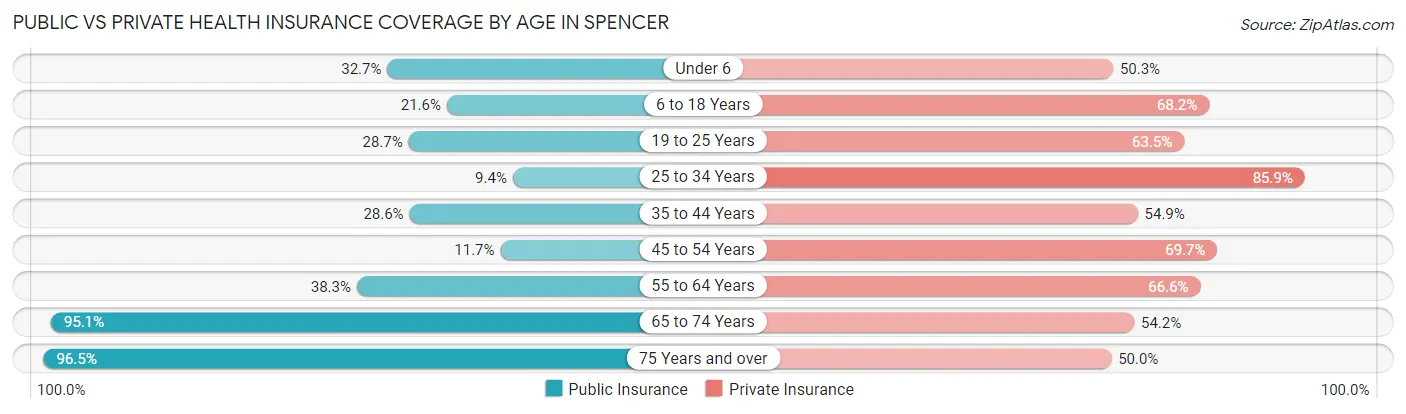
| Age Bracket | Public Insurance | Private Insurance |
| Under 6 | 50 (32.7%) | 77 (50.3%) |
| 6 to 18 Years | 53 (21.6%) | 167 (68.2%) |
| 19 to 25 Years | 52 (28.7%) | 115 (63.5%) |
| 25 to 34 Years | 20 (9.4%) | 183 (85.9%) |
| 35 to 44 Years | 64 (28.6%) | 123 (54.9%) |
| 45 to 54 Years | 27 (11.7%) | 161 (69.7%) |
| 55 to 64 Years | 125 (38.3%) | 217 (66.6%) |
| 65 to 74 Years | 370 (95.1%) | 211 (54.2%) |
| 75 Years and over | 220 (96.5%) | 114 (50.0%) |
| Total | 981 (44.8%) | 1,368 (62.5%) |
Disability Status by Sex by Age in Spencer
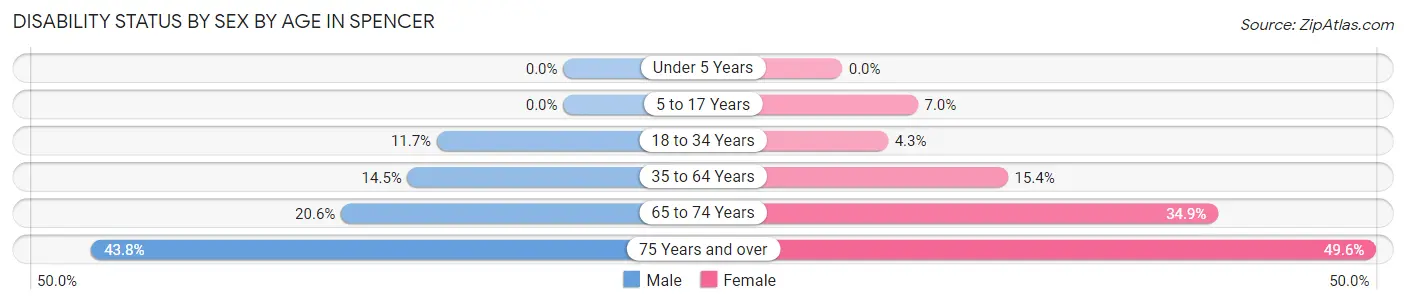
| Age Bracket | Male | Female |
| Under 5 Years | 0 (0.0%) | 0 (0.0%) |
| 5 to 17 Years | 0 (0.0%) | 9 (7.0%) |
| 18 to 34 Years | 23 (11.7%) | 10 (4.3%) |
| 35 to 64 Years | 64 (14.4%) | 52 (15.4%) |
| 65 to 74 Years | 33 (20.6%) | 80 (34.9%) |
| 75 Years and over | 46 (43.8%) | 61 (49.6%) |
Disability Class by Sex by Age in Spencer
Disability Class: Hearing Difficulty
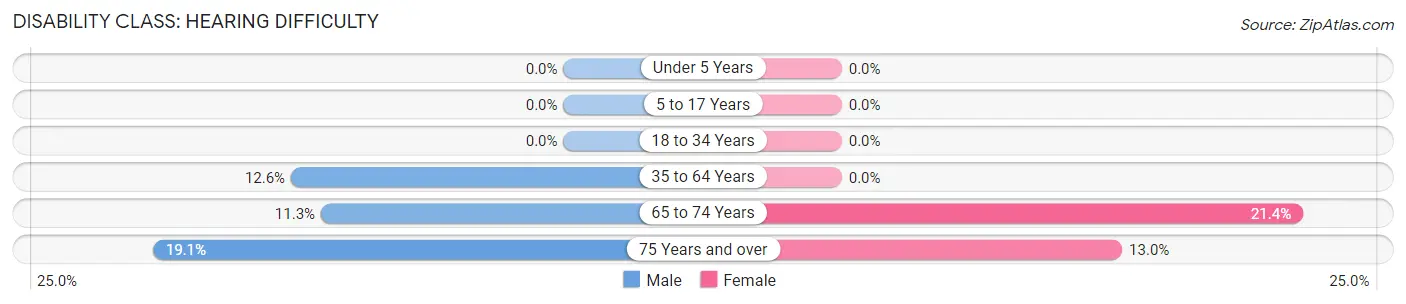
| Age Bracket | Male | Female |
| Under 5 Years | 0 (0.0%) | 0 (0.0%) |
| 5 to 17 Years | 0 (0.0%) | 0 (0.0%) |
| 18 to 34 Years | 0 (0.0%) | 0 (0.0%) |
| 35 to 64 Years | 56 (12.6%) | 0 (0.0%) |
| 65 to 74 Years | 18 (11.3%) | 49 (21.4%) |
| 75 Years and over | 20 (19.1%) | 16 (13.0%) |
Disability Class: Vision Difficulty
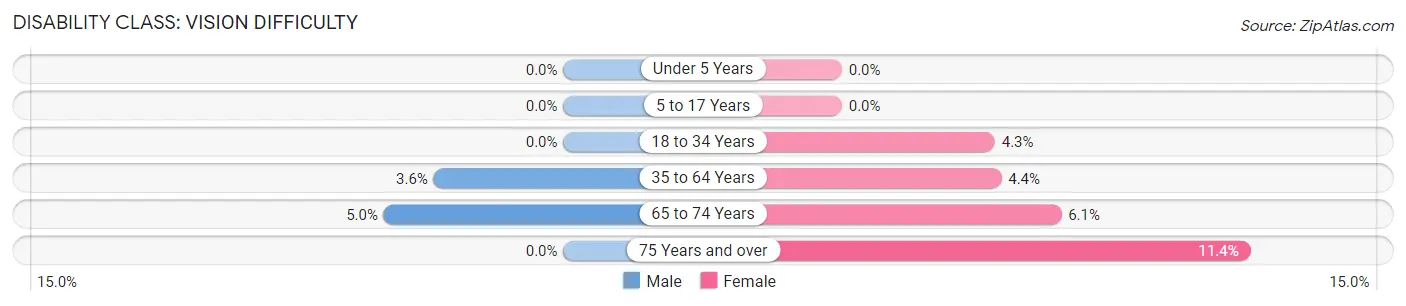
| Age Bracket | Male | Female |
| Under 5 Years | 0 (0.0%) | 0 (0.0%) |
| 5 to 17 Years | 0 (0.0%) | 0 (0.0%) |
| 18 to 34 Years | 0 (0.0%) | 10 (4.3%) |
| 35 to 64 Years | 16 (3.6%) | 15 (4.4%) |
| 65 to 74 Years | 8 (5.0%) | 14 (6.1%) |
| 75 Years and over | 0 (0.0%) | 14 (11.4%) |
Disability Class: Cognitive Difficulty
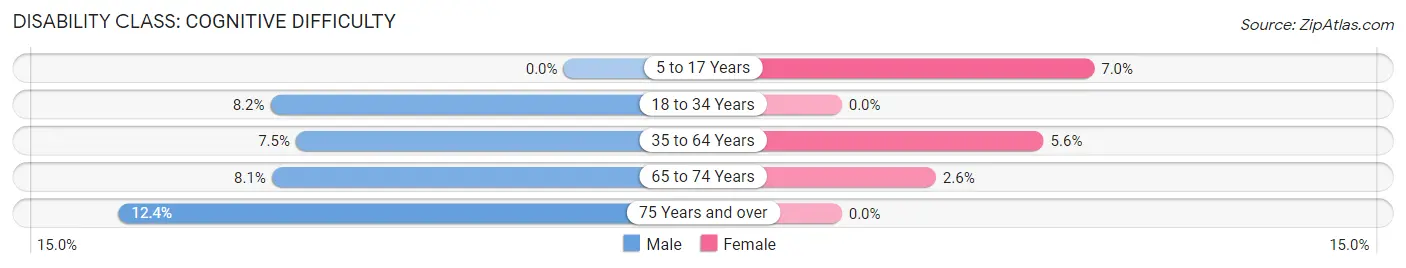
| Age Bracket | Male | Female |
| 5 to 17 Years | 0 (0.0%) | 9 (7.0%) |
| 18 to 34 Years | 16 (8.2%) | 0 (0.0%) |
| 35 to 64 Years | 33 (7.4%) | 19 (5.6%) |
| 65 to 74 Years | 13 (8.1%) | 6 (2.6%) |
| 75 Years and over | 13 (12.4%) | 0 (0.0%) |
Disability Class: Ambulatory Difficulty
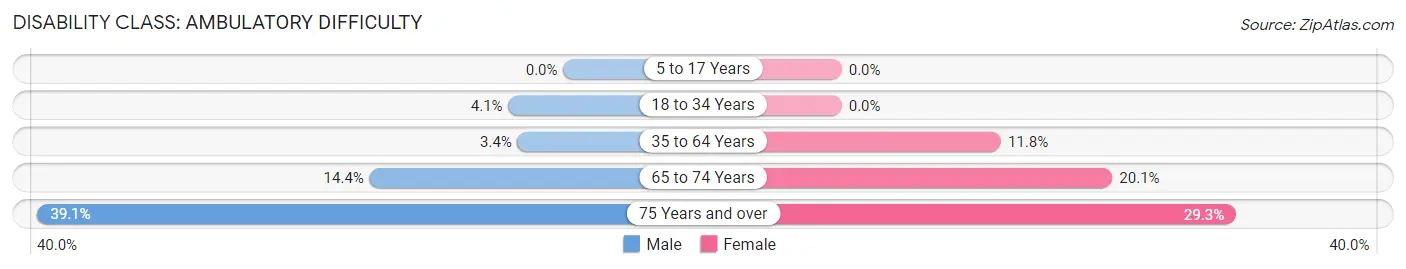
| Age Bracket | Male | Female |
| 5 to 17 Years | 0 (0.0%) | 0 (0.0%) |
| 18 to 34 Years | 8 (4.1%) | 0 (0.0%) |
| 35 to 64 Years | 15 (3.4%) | 40 (11.8%) |
| 65 to 74 Years | 23 (14.4%) | 46 (20.1%) |
| 75 Years and over | 41 (39.1%) | 36 (29.3%) |
Disability Class: Self-Care Difficulty
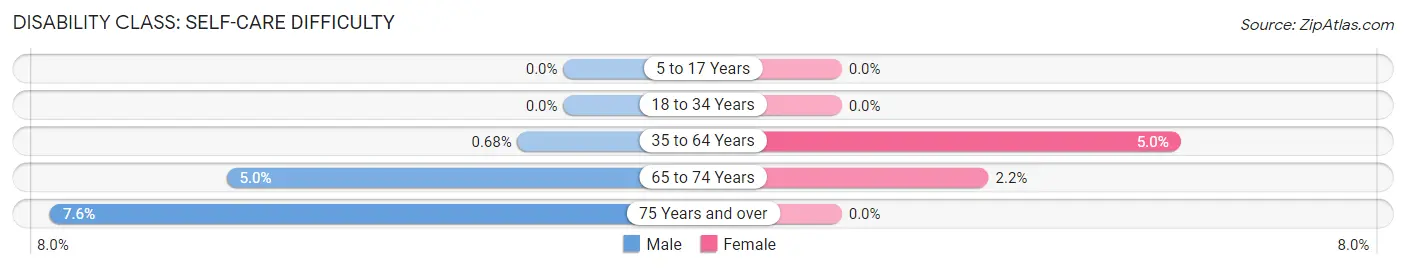
| Age Bracket | Male | Female |
| 5 to 17 Years | 0 (0.0%) | 0 (0.0%) |
| 18 to 34 Years | 0 (0.0%) | 0 (0.0%) |
| 35 to 64 Years | 3 (0.7%) | 17 (5.0%) |
| 65 to 74 Years | 8 (5.0%) | 5 (2.2%) |
| 75 Years and over | 8 (7.6%) | 0 (0.0%) |
Technology Access in Spencer
Computing Device Access in Spencer
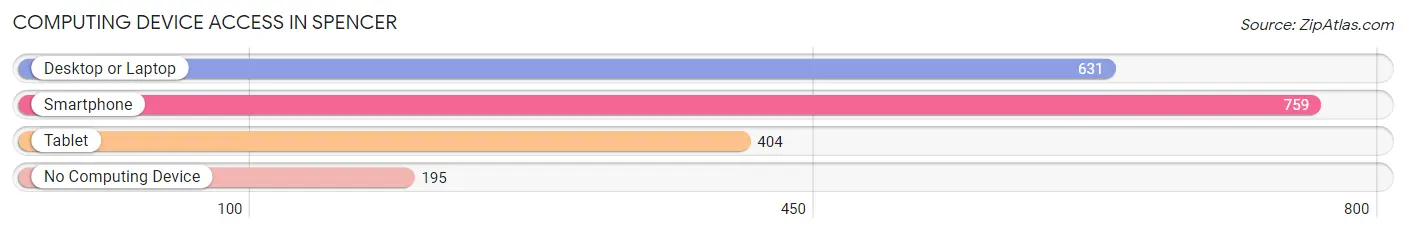
| Device Type | # Households | % Households |
| Desktop or Laptop | 631 | 58.5% |
| Smartphone | 759 | 70.3% |
| Tablet | 404 | 37.4% |
| No Computing Device | 195 | 18.1% |
| Total | 1,079 | 100.0% |
Internet Access in Spencer
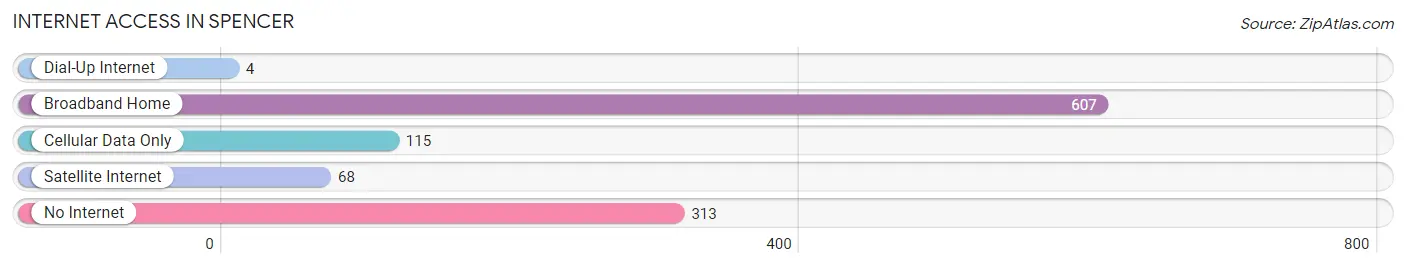
| Internet Type | # Households | % Households |
| Dial-Up Internet | 4 | 0.4% |
| Broadband Home | 607 | 56.3% |
| Cellular Data Only | 115 | 10.7% |
| Satellite Internet | 68 | 6.3% |
| No Internet | 313 | 29.0% |
| Total | 1,079 | 100.0% |
Spencer Summary
Spencer, Indiana is a small town located in Owen County, Indiana. It is situated in the western part of the state, approximately 50 miles southwest of Indianapolis. The town was founded in 1822 and has a population of approximately 2,500 people.
Geography
Spencer is located in the rolling hills of the Midwest, with an elevation of 890 feet above sea level. The town is situated on the banks of the White River, which flows through the center of town. The town is surrounded by farmland and is home to several small lakes. The climate in Spencer is typical of the Midwest, with hot summers and cold winters.
Economy
Spencer’s economy is largely based on agriculture and manufacturing. The town is home to several small businesses, including a feed mill, a furniture factory, and a printing company. The town also has a few retail stores, including a grocery store, a hardware store, and a few restaurants.
Demographics
As of the 2010 census, Spencer had a population of 2,500 people. The racial makeup of the town was 97.2% White, 0.8% African American, 0.4% Native American, 0.4% Asian, and 1.2% from other races. The median household income was $37,500, and the median age was 38.
History
Spencer was founded in 1822 by a group of settlers from North Carolina. The town was named after Spencer County, Kentucky, which was named after the Revolutionary War hero, Spencer County. The town grew slowly over the years, and by the late 19th century, it had become a thriving agricultural center. In the early 20th century, the town began to diversify its economy, and by the 1950s, it had become a manufacturing center.
Today, Spencer is a small town with a strong sense of community. The town is home to several churches, a library, and a museum. The town also hosts several annual events, including the Spencer County Fair and the Spencer County Music Festival.
Spencer is a small town with a rich history and a strong sense of community. The town is home to a diverse economy and a variety of businesses. The town is also home to several churches, a library, and a museum. The town is a great place to live and work, and it is a great place to visit.
Common Questions
What is Per Capita Income in Spencer?
Per Capita income in Spencer is $31,342.
What is the Median Family Income in Spencer?
Median Family Income in Spencer is $64,572.
What is the Median Household income in Spencer?
Median Household Income in Spencer is $45,536.
What is Income or Wage Gap in Spencer?
Income or Wage Gap in Spencer is 17.4%.
Women in Spencer earn 82.6 cents for every dollar earned by a man.
What is Inequality or Gini Index in Spencer?
Inequality or Gini Index in Spencer is 0.46.
What is the Total Population of Spencer?
Total Population of Spencer is 2,240.
What is the Total Male Population of Spencer?
Total Male Population of Spencer is 1,100.
What is the Total Female Population of Spencer?
Total Female Population of Spencer is 1,140.
What is the Ratio of Males per 100 Females in Spencer?
There are 96.49 Males per 100 Females in Spencer.
What is the Ratio of Females per 100 Males in Spencer?
There are 103.64 Females per 100 Males in Spencer.
What is the Median Population Age in Spencer?
Median Population Age in Spencer is 46.8 Years.
What is the Average Family Size in Spencer
Average Family Size in Spencer is 3.0 People.
What is the Average Household Size in Spencer
Average Household Size in Spencer is 2.0 People.
How Large is the Labor Force in Spencer?
There are 1,058 People in the Labor Forcein in Spencer.
What is the Percentage of People in the Labor Force in Spencer?
55.2% of People are in the Labor Force in Spencer.
What is the Unemployment Rate in Spencer?
Unemployment Rate in Spencer is 6.0%.