Zip Codes with the Highest Percentage of Population Employed in Agriculture, Fishing & Hunting in South Bend, IN
RELATED REPORTS & OPTIONS
Agriculture, Fishing & Hunting
South Bend
Compare Zip Codes
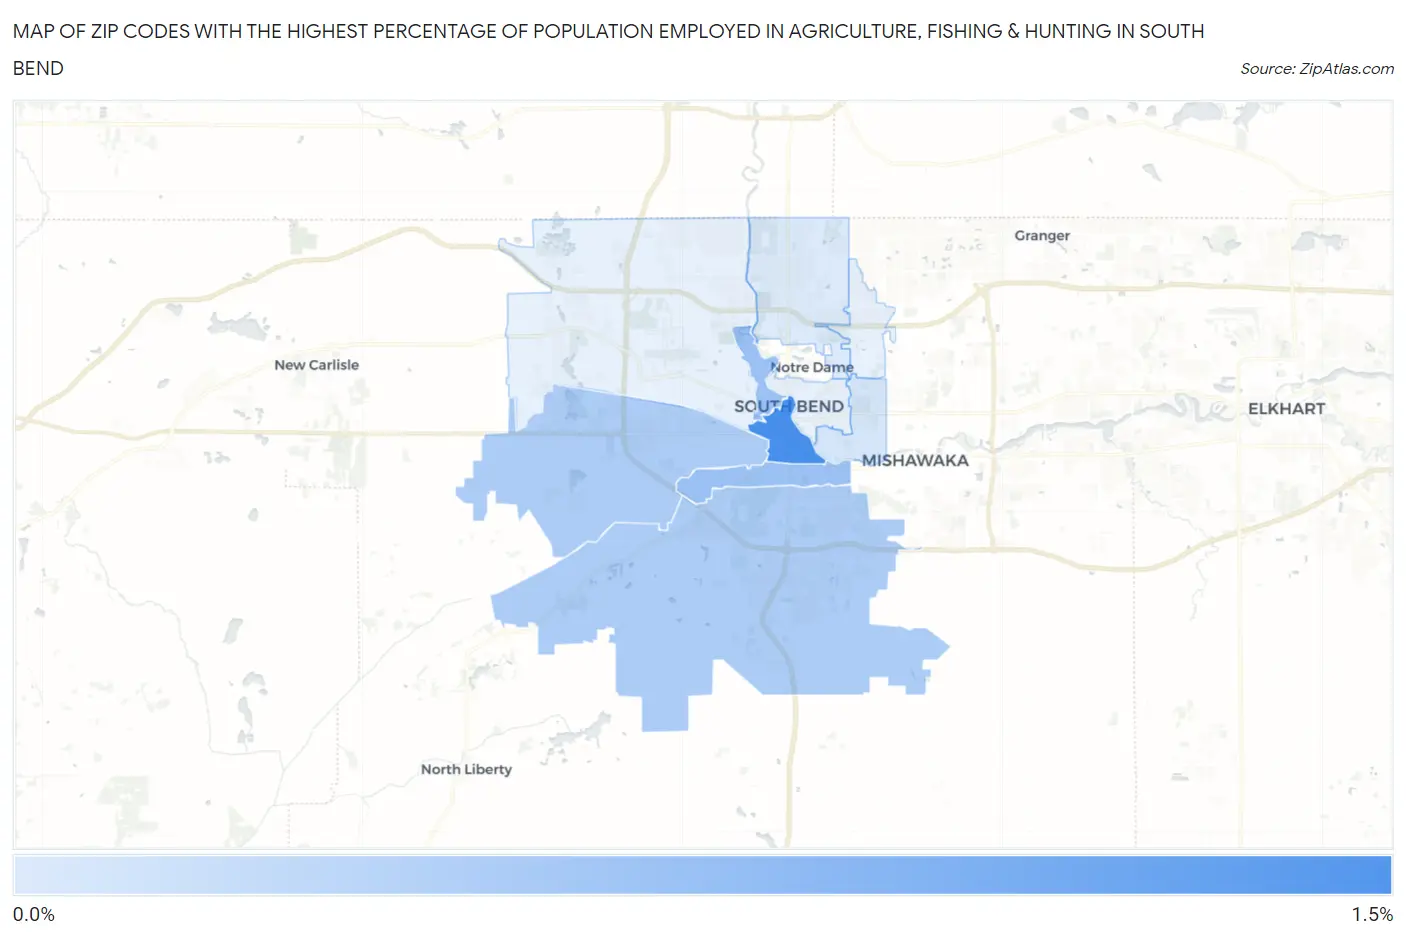
Map of Zip Codes with the Highest Percentage of Population Employed in Agriculture, Fishing & Hunting in South Bend
0.0%
1.5%
Zip Codes with the Highest Percentage of Population Employed in Agriculture, Fishing & Hunting in South Bend, IN
| Zip Code | % Employed | vs State | vs National | |
| 1. | 46601 | 1.0% | 1.1%(-0.018)#379 | 1.2%(-0.161)#16,050 |
| 2. | 46616 | 0.50% | 1.1%(-0.562)#470 | 1.2%(-0.704)#19,326 |
| 3. | 46613 | 0.48% | 1.1%(-0.573)#473 | 1.2%(-0.715)#19,414 |
| 4. | 46619 | 0.38% | 1.1%(-0.680)#498 | 1.2%(-0.822)#20,363 |
| 5. | 46614 | 0.38% | 1.1%(-0.680)#500 | 1.2%(-0.822)#20,368 |
| 6. | 46615 | 0.11% | 1.1%(-0.944)#581 | 1.2%(-1.09)#23,504 |
| 7. | 46637 | 0.065% | 1.1%(-0.992)#590 | 1.2%(-1.13)#24,168 |
1
Common Questions
What are the Top 5 Zip Codes with the Highest Percentage of Population Employed in Agriculture, Fishing & Hunting in South Bend, IN?
Top 5 Zip Codes with the Highest Percentage of Population Employed in Agriculture, Fishing & Hunting in South Bend, IN are:
What zip code has the Highest Percentage of Population Employed in Agriculture, Fishing & Hunting in South Bend, IN?
46601 has the Highest Percentage of Population Employed in Agriculture, Fishing & Hunting in South Bend, IN with 1.0%.
What is the Percentage of Population Employed in Agriculture, Fishing & Hunting in South Bend, IN?
Percentage of Population Employed in Agriculture, Fishing & Hunting in South Bend is 0.30%.
What is the Percentage of Population Employed in Agriculture, Fishing & Hunting in Indiana?
Percentage of Population Employed in Agriculture, Fishing & Hunting in Indiana is 1.1%.
What is the Percentage of Population Employed in Agriculture, Fishing & Hunting in the United States?
Percentage of Population Employed in Agriculture, Fishing & Hunting in the United States is 1.2%.