Zip Codes with the Highest Percentage of Population Employed in Business & Financial in South Bend, IN
RELATED REPORTS & OPTIONS
Business & Financial
South Bend
Compare Zip Codes
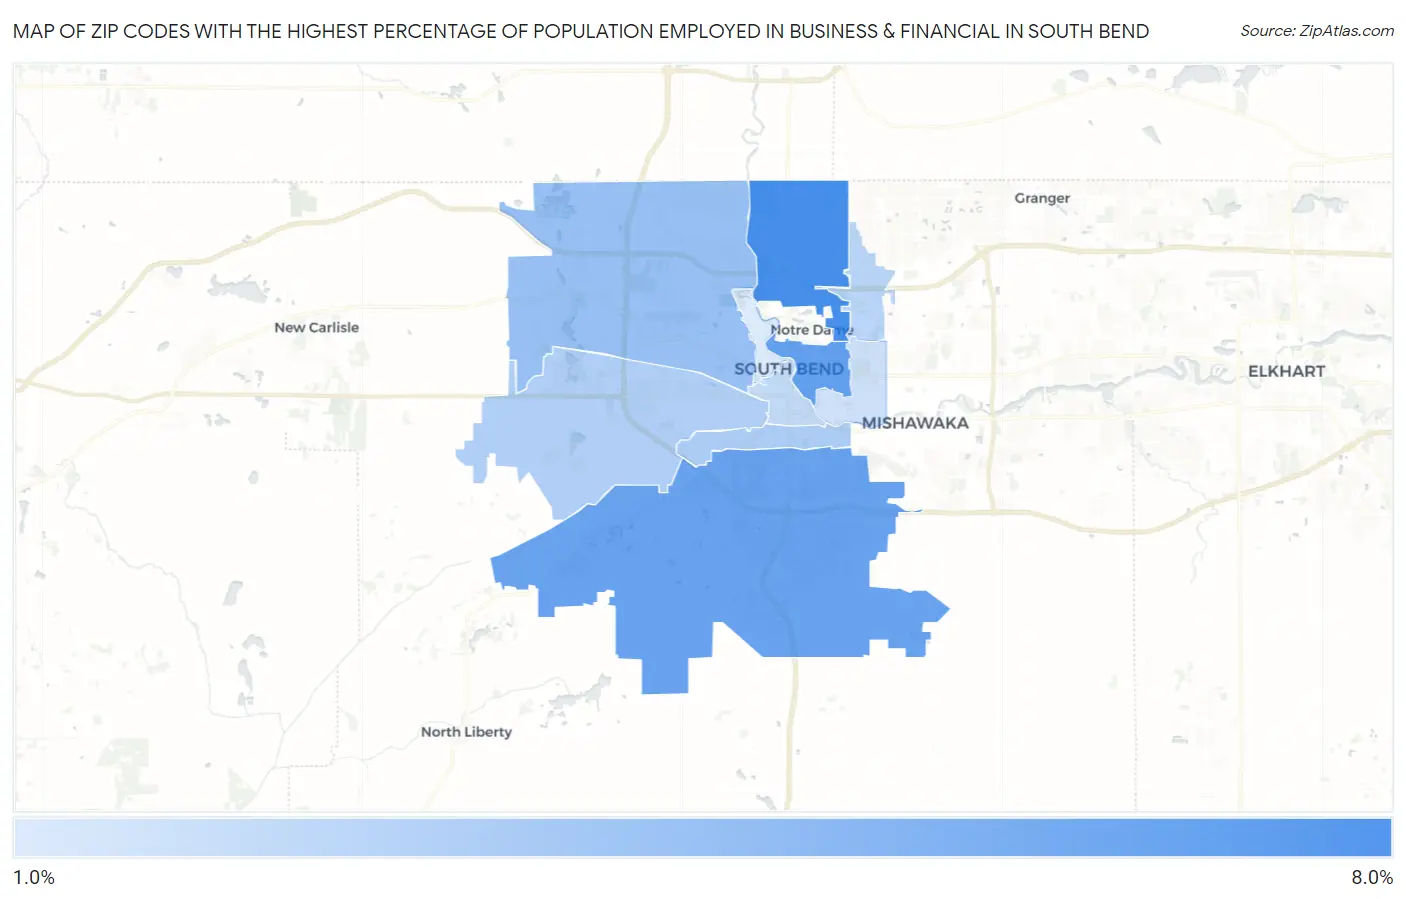
Map of Zip Codes with the Highest Percentage of Population Employed in Business & Financial in South Bend
2.0%
7.7%
Zip Codes with the Highest Percentage of Population Employed in Business & Financial in South Bend, IN
| Zip Code | % Employed | vs State | vs National | |
| 1. | 46637 | 7.7% | 4.8%(+2.93)#58 | 5.8%(+1.95)#4,662 |
| 2. | 46617 | 6.6% | 4.8%(+1.85)#97 | 5.8%(+0.863)#6,509 |
| 3. | 46614 | 6.4% | 4.8%(+1.65)#105 | 5.8%(+0.666)#6,905 |
| 4. | 46628 | 4.6% | 4.8%(-0.195)#226 | 5.8%(-1.18)#11,817 |
| 5. | 46613 | 3.8% | 4.8%(-0.966)#286 | 5.8%(-1.95)#14,551 |
| 6. | 46619 | 3.6% | 4.8%(-1.14)#312 | 5.8%(-2.13)#15,281 |
| 7. | 46635 | 3.3% | 4.8%(-1.51)#358 | 5.8%(-2.50)#16,794 |
| 8. | 46601 | 3.1% | 4.8%(-1.72)#385 | 5.8%(-2.70)#17,575 |
| 9. | 46615 | 2.5% | 4.8%(-2.25)#452 | 5.8%(-3.24)#19,735 |
| 10. | 46616 | 2.0% | 4.8%(-2.80)#515 | 5.8%(-3.78)#21,847 |
1
Common Questions
What are the Top 5 Zip Codes with the Highest Percentage of Population Employed in Business & Financial in South Bend, IN?
Top 5 Zip Codes with the Highest Percentage of Population Employed in Business & Financial in South Bend, IN are:
What zip code has the Highest Percentage of Population Employed in Business & Financial in South Bend, IN?
46637 has the Highest Percentage of Population Employed in Business & Financial in South Bend, IN with 7.7%.
What is the Percentage of Population Employed in Business & Financial in South Bend, IN?
Percentage of Population Employed in Business & Financial in South Bend is 4.2%.
What is the Percentage of Population Employed in Business & Financial in Indiana?
Percentage of Population Employed in Business & Financial in Indiana is 4.8%.
What is the Percentage of Population Employed in Business & Financial in the United States?
Percentage of Population Employed in Business & Financial in the United States is 5.8%.