Somerville, IN Map & Demographics
Somerville Map
Somerville Overview
$20,084
PER CAPITA INCOME
$58,750
AVG FAMILY INCOME
$50,357
AVG HOUSEHOLD INCOME
60.4%
WAGE / INCOME GAP [ % ]
39.6¢/ $1
WAGE / INCOME GAP [ $ ]
0.33
INEQUALITY / GINI INDEX
254
TOTAL POPULATION
109
MALE POPULATION
145
FEMALE POPULATION
75.17
MALES / 100 FEMALES
133.03
FEMALES / 100 MALES
33.5
MEDIAN AGE
3.4
AVG FAMILY SIZE
3.0
AVG HOUSEHOLD SIZE
100
LABOR FORCE [ PEOPLE ]
56.5%
PERCENT IN LABOR FORCE
3.0%
UNEMPLOYMENT RATE
Somerville Zip Codes
Somerville Area Codes
Income in Somerville
Income Overview in Somerville
Per Capita Income in Somerville is $20,084, while median incomes of families and households are $58,750 and $50,357 respectively.
| Characteristic | Number | Measure |
| Per Capita Income | 254 | $20,084 |
| Median Family Income | 58 | $58,750 |
| Mean Family Income | 58 | $62,166 |
| Median Household Income | 86 | $50,357 |
| Mean Household Income | 86 | $58,897 |
| Income Deficit | 58 | $0 |
| Wage / Income Gap (%) | 254 | 60.39% |
| Wage / Income Gap ($) | 254 | 39.61¢ per $1 |
| Gini / Inequality Index | 254 | 0.33 |
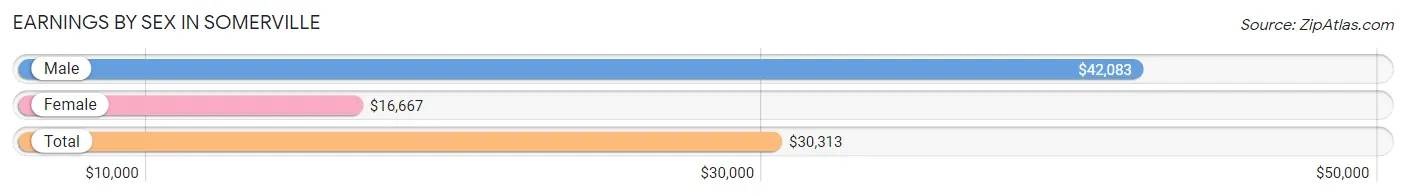
Earnings by Sex in Somerville
Average Earnings in Somerville are $30,313, $42,083 for men and $16,667 for women, a difference of 60.4%.
| Sex | Number | Average Earnings |
| Male | 55 (51.4%) | $42,083 |
| Female | 52 (48.6%) | $16,667 |
| Total | 107 (100.0%) | $30,313 |
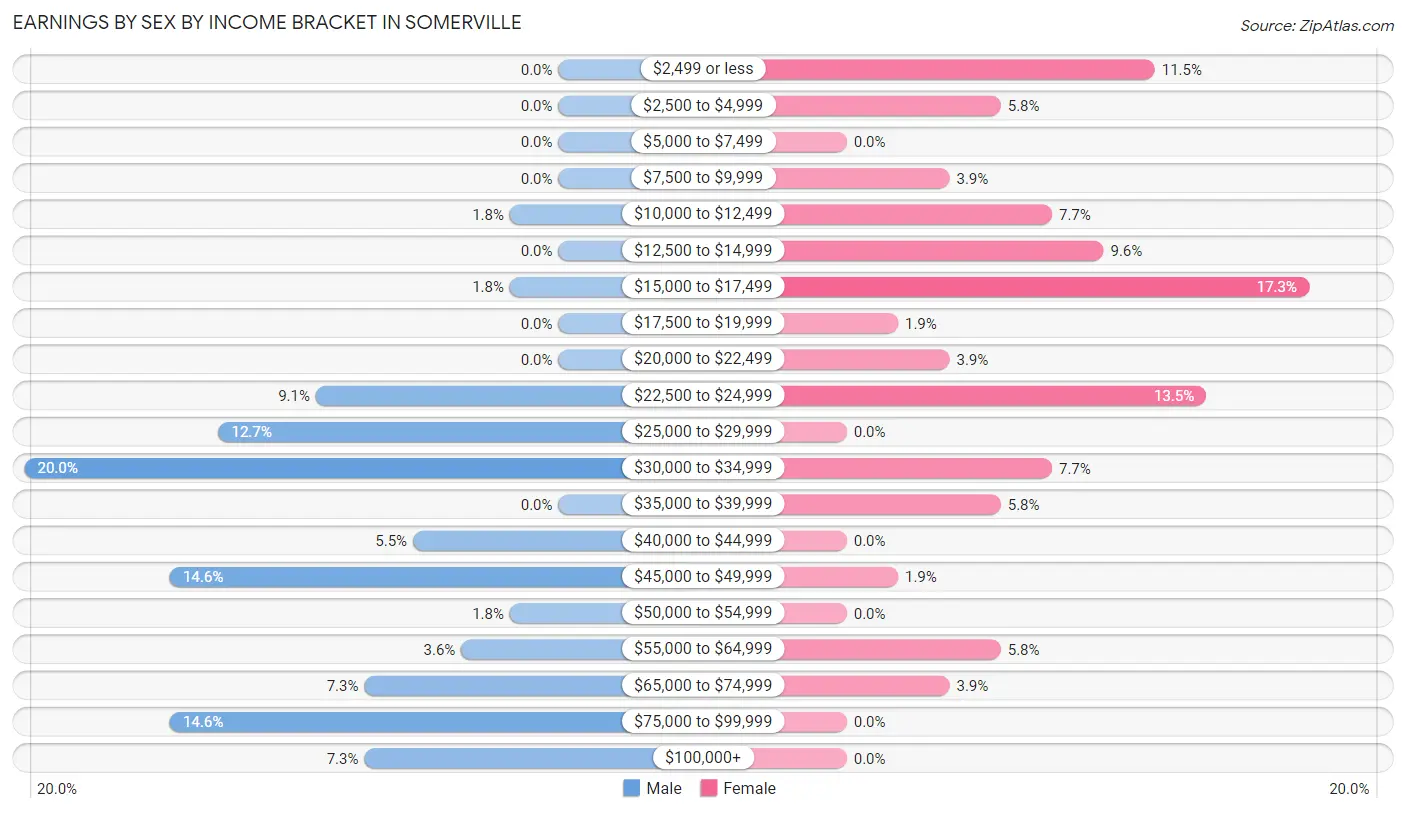
Earnings by Sex by Income Bracket in Somerville
The most common earnings brackets in Somerville are $30,000 to $34,999 for men (11 | 20.0%) and $15,000 to $17,499 for women (9 | 17.3%).
| Income | Male | Female |
| $2,499 or less | 0 (0.0%) | 6 (11.5%) |
| $2,500 to $4,999 | 0 (0.0%) | 3 (5.8%) |
| $5,000 to $7,499 | 0 (0.0%) | 0 (0.0%) |
| $7,500 to $9,999 | 0 (0.0%) | 2 (3.8%) |
| $10,000 to $12,499 | 1 (1.8%) | 4 (7.7%) |
| $12,500 to $14,999 | 0 (0.0%) | 5 (9.6%) |
| $15,000 to $17,499 | 1 (1.8%) | 9 (17.3%) |
| $17,500 to $19,999 | 0 (0.0%) | 1 (1.9%) |
| $20,000 to $22,499 | 0 (0.0%) | 2 (3.8%) |
| $22,500 to $24,999 | 5 (9.1%) | 7 (13.5%) |
| $25,000 to $29,999 | 7 (12.7%) | 0 (0.0%) |
| $30,000 to $34,999 | 11 (20.0%) | 4 (7.7%) |
| $35,000 to $39,999 | 0 (0.0%) | 3 (5.8%) |
| $40,000 to $44,999 | 3 (5.4%) | 0 (0.0%) |
| $45,000 to $49,999 | 8 (14.5%) | 1 (1.9%) |
| $50,000 to $54,999 | 1 (1.8%) | 0 (0.0%) |
| $55,000 to $64,999 | 2 (3.6%) | 3 (5.8%) |
| $65,000 to $74,999 | 4 (7.3%) | 2 (3.8%) |
| $75,000 to $99,999 | 8 (14.5%) | 0 (0.0%) |
| $100,000+ | 4 (7.3%) | 0 (0.0%) |
| Total | 55 (100.0%) | 52 (100.0%) |
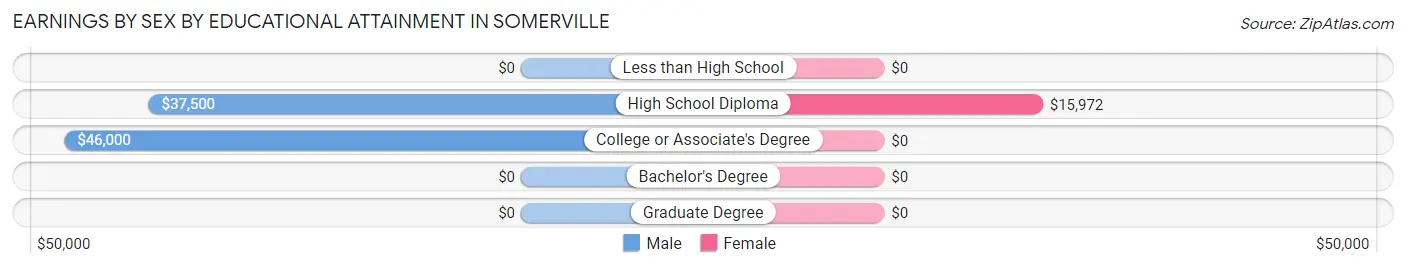
Earnings by Sex by Educational Attainment in Somerville
Average earnings in Somerville are $42,083 for men and $21,875 for women, a difference of 48.0%. Men with an educational attainment of college or associate's degree enjoy the highest average annual earnings of $46,000, while those with high school diploma education earn the least with $37,500. Women with an educational attainment of high school diploma earn the most with the average annual earnings of $15,972, while those with high school diploma education have the smallest earnings of $15,972.
| Educational Attainment | Male Income | Female Income |
| Less than High School | - | - |
| High School Diploma | $37,500 | $15,972 |
| College or Associate's Degree | $46,000 | $0 |
| Bachelor's Degree | - | - |
| Graduate Degree | - | - |
| Total | $42,083 | $21,875 |
Family Income in Somerville
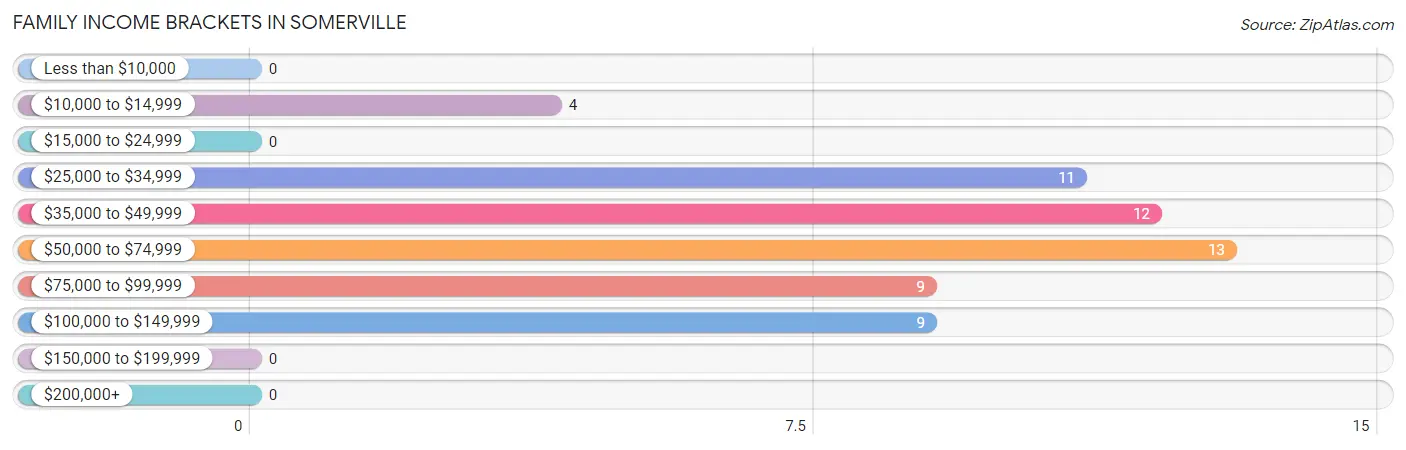
Family Income Brackets in Somerville
According to the Somerville family income data, there are 13 families falling into the $50,000 to $74,999 income range, which is the most common income bracket and makes up 22.4% of all families.
| Income Bracket | # Families | % Families |
| Less than $10,000 | 0 | 0.0% |
| $10,000 to $14,999 | 4 | 6.9% |
| $15,000 to $24,999 | 0 | 0.0% |
| $25,000 to $34,999 | 11 | 19.0% |
| $35,000 to $49,999 | 12 | 20.7% |
| $50,000 to $74,999 | 13 | 22.4% |
| $75,000 to $99,999 | 9 | 15.5% |
| $100,000 to $149,999 | 9 | 15.5% |
| $150,000 to $199,999 | 0 | 0.0% |
| $200,000+ | 0 | 0.0% |
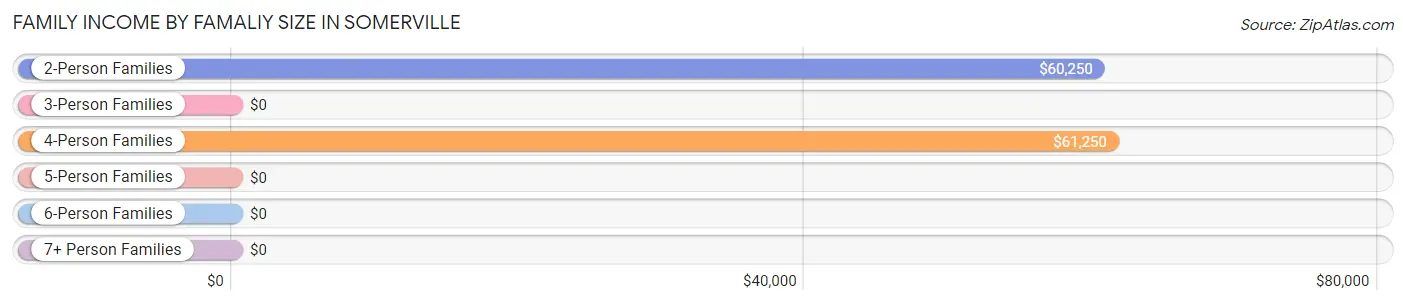
Family Income by Famaliy Size in Somerville
4-person families (25 | 43.1%) account for the highest median family income in Somerville with $61,250 per family, while 2-person families (21 | 36.2%) have the highest median income of $30,125 per family member.
| Income Bracket | # Families | Median Income |
| 2-Person Families | 21 (36.2%) | $60,250 |
| 3-Person Families | 8 (13.8%) | $0 |
| 4-Person Families | 25 (43.1%) | $61,250 |
| 5-Person Families | 4 (6.9%) | $0 |
| 6-Person Families | 0 (0.0%) | $0 |
| 7+ Person Families | 0 (0.0%) | $0 |
| Total | 58 (100.0%) | $58,750 |
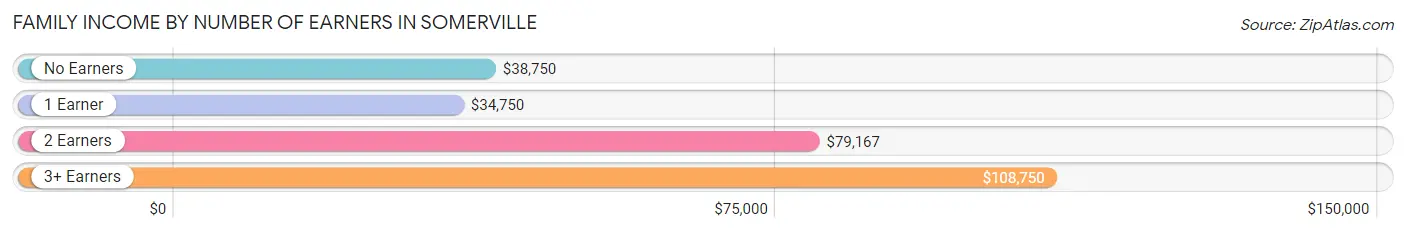
Family Income by Number of Earners in Somerville
The median family income in Somerville is $58,750, with families comprising 3+ earners (5) having the highest median family income of $108,750, while families with 1 earner (25) have the lowest median family income of $34,750, accounting for 8.6% and 43.1% of families, respectively.
| Number of Earners | # Families | Median Income |
| No Earners | 8 (13.8%) | $38,750 |
| 1 Earner | 25 (43.1%) | $34,750 |
| 2 Earners | 20 (34.5%) | $79,167 |
| 3+ Earners | 5 (8.6%) | $108,750 |
| Total | 58 (100.0%) | $58,750 |
Household Income in Somerville
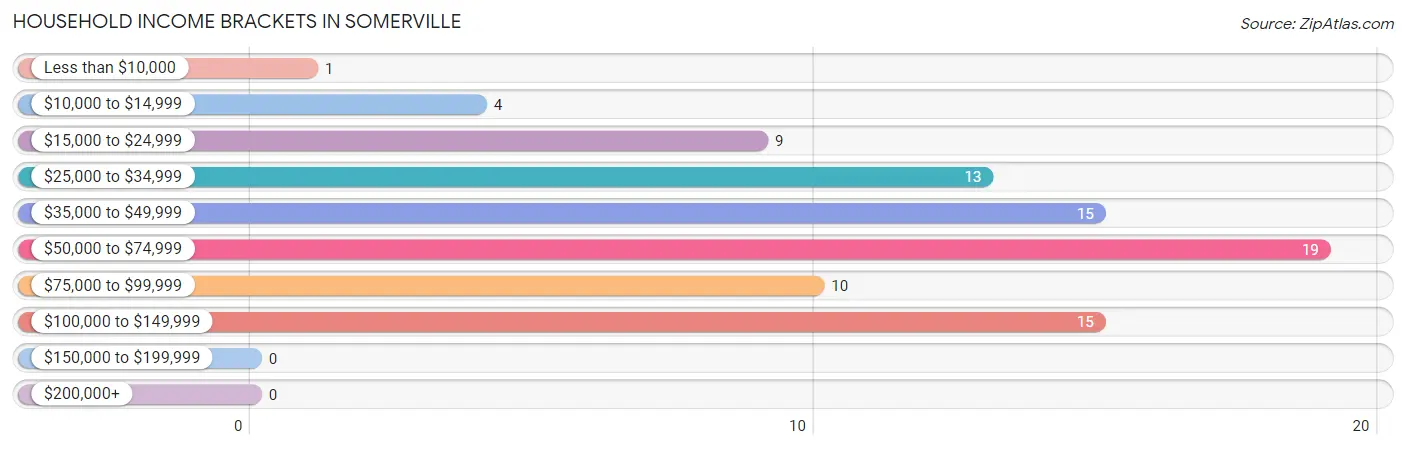
Household Income Brackets in Somerville
With 19 households falling in the category, the $50,000 to $74,999 income range is the most frequent in Somerville, accounting for 22.1% of all households.
| Income Bracket | # Households | % Households |
| Less than $10,000 | 1 | 1.2% |
| $10,000 to $14,999 | 4 | 4.7% |
| $15,000 to $24,999 | 9 | 10.5% |
| $25,000 to $34,999 | 13 | 15.1% |
| $35,000 to $49,999 | 15 | 17.4% |
| $50,000 to $74,999 | 19 | 22.1% |
| $75,000 to $99,999 | 10 | 11.6% |
| $100,000 to $149,999 | 15 | 17.4% |
| $150,000 to $199,999 | 0 | 0.0% |
| $200,000+ | 0 | 0.0% |
Household Income by Householder Age in Somerville
The median household income in Somerville is $50,357, with the highest median household income of $59,375 found in the 25 to 44 years age bracket for the primary householder. A total of 25 households (29.1%) fall into this category. Meanwhile, the 15 to 24 years age bracket for the primary householder has the lowest median household income of $0, with 1 households (1.2%) in this group.
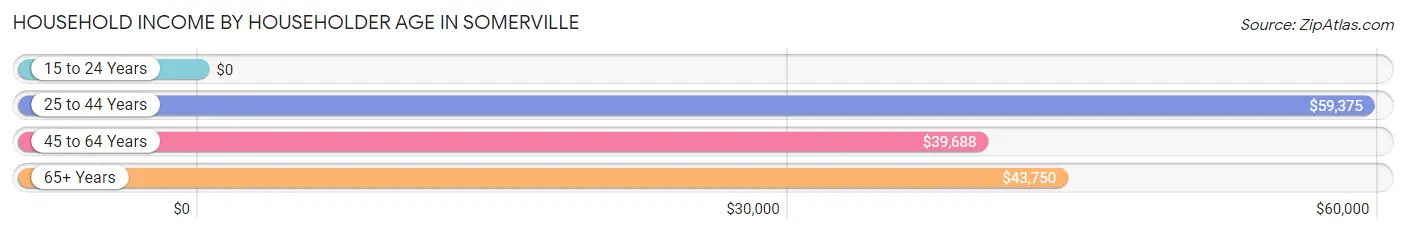
| Income Bracket | # Households | Median Income |
| 15 to 24 Years | 1 (1.2%) | $0 |
| 25 to 44 Years | 25 (29.1%) | $59,375 |
| 45 to 64 Years | 37 (43.0%) | $39,688 |
| 65+ Years | 23 (26.7%) | $43,750 |
| Total | 86 (100.0%) | $50,357 |
Poverty in Somerville
Income Below Poverty by Sex and Age in Somerville
With 7.5% poverty level for males and 17.3% for females among the residents of Somerville, 55 to 64 year old males and 18 to 24 year old females are the most vulnerable to poverty, with 7 males (33.3%) and 5 females (71.4%) in their respective age groups living below the poverty level.
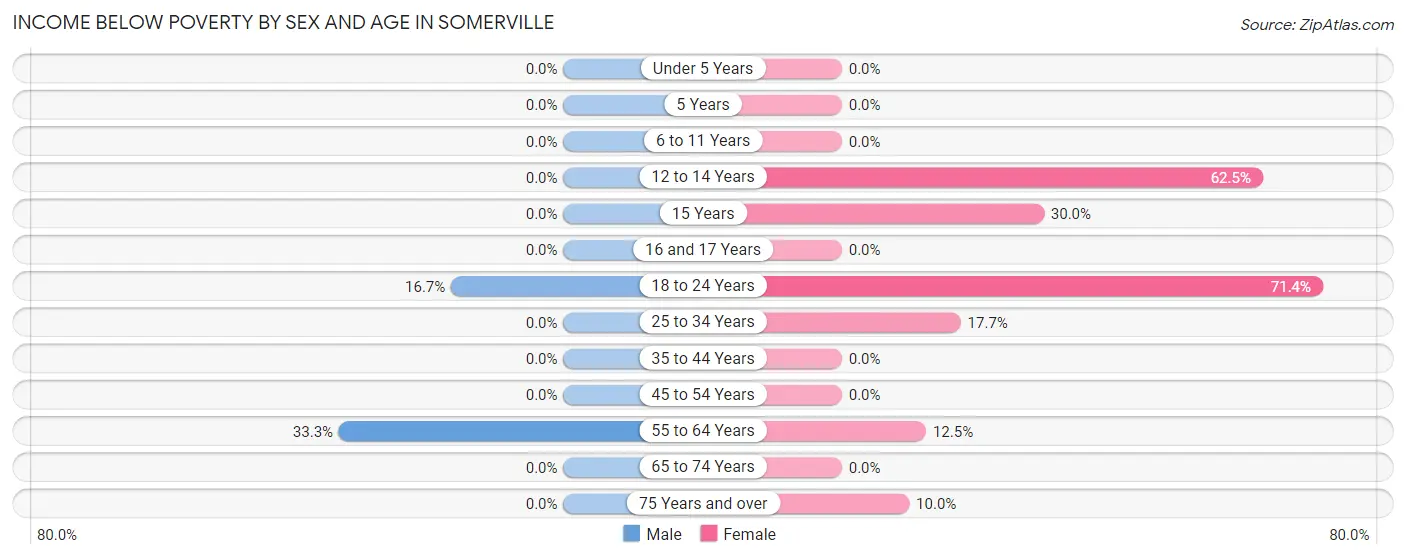
| Age Bracket | Male | Female |
| Under 5 Years | 0 (0.0%) | 0 (0.0%) |
| 5 Years | 0 (0.0%) | 0 (0.0%) |
| 6 to 11 Years | 0 (0.0%) | 0 (0.0%) |
| 12 to 14 Years | 0 (0.0%) | 5 (62.5%) |
| 15 Years | 0 (0.0%) | 6 (30.0%) |
| 16 and 17 Years | 0 (0.0%) | 0 (0.0%) |
| 18 to 24 Years | 1 (16.7%) | 5 (71.4%) |
| 25 to 34 Years | 0 (0.0%) | 3 (17.6%) |
| 35 to 44 Years | 0 (0.0%) | 0 (0.0%) |
| 45 to 54 Years | 0 (0.0%) | 0 (0.0%) |
| 55 to 64 Years | 7 (33.3%) | 4 (12.5%) |
| 65 to 74 Years | 0 (0.0%) | 0 (0.0%) |
| 75 Years and over | 0 (0.0%) | 1 (10.0%) |
| Total | 8 (7.5%) | 24 (17.3%) |
Income Above Poverty by Sex and Age in Somerville
According to the poverty statistics in Somerville, males aged under 5 years and females aged 5 years are the age groups that are most secure financially, with 100.0% of males and 100.0% of females in these age groups living above the poverty line.
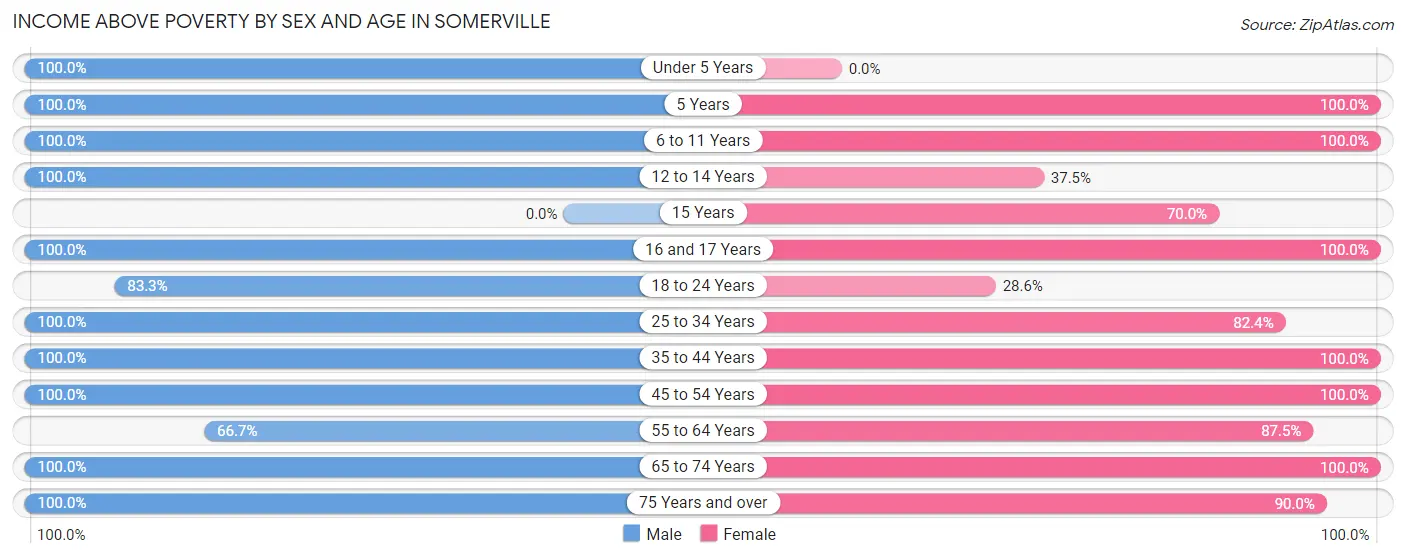
| Age Bracket | Male | Female |
| Under 5 Years | 8 (100.0%) | 0 (0.0%) |
| 5 Years | 4 (100.0%) | 6 (100.0%) |
| 6 to 11 Years | 5 (100.0%) | 14 (100.0%) |
| 12 to 14 Years | 4 (100.0%) | 3 (37.5%) |
| 15 Years | 0 (0.0%) | 14 (70.0%) |
| 16 and 17 Years | 2 (100.0%) | 4 (100.0%) |
| 18 to 24 Years | 5 (83.3%) | 2 (28.6%) |
| 25 to 34 Years | 17 (100.0%) | 14 (82.4%) |
| 35 to 44 Years | 8 (100.0%) | 4 (100.0%) |
| 45 to 54 Years | 12 (100.0%) | 12 (100.0%) |
| 55 to 64 Years | 14 (66.7%) | 28 (87.5%) |
| 65 to 74 Years | 12 (100.0%) | 5 (100.0%) |
| 75 Years and over | 8 (100.0%) | 9 (90.0%) |
| Total | 99 (92.5%) | 115 (82.7%) |
Income Below Poverty Among Married-Couple Families in Somerville
The poverty statistics for married-couple families in Somerville show that 8.7% or 4 of the total 46 families live below the poverty line. Families with 1 or 2 children have the highest poverty rate of 20.0%, comprising of 4 families. On the other hand, families with no children have the lowest poverty rate of 0.0%, which includes 0 families.
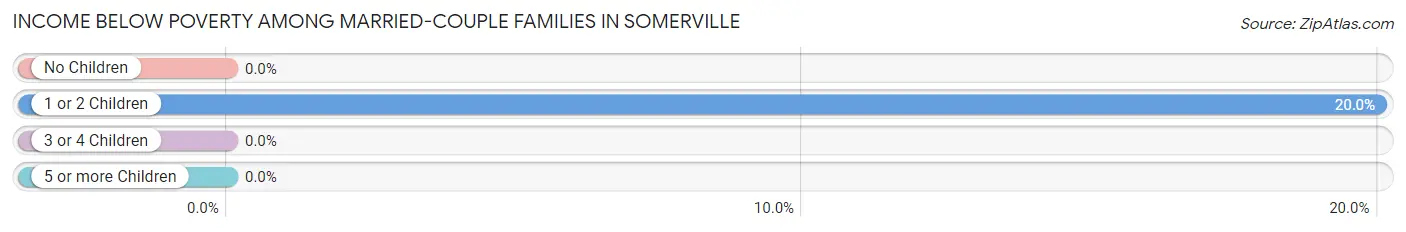
| Children | Above Poverty | Below Poverty |
| No Children | 26 (100.0%) | 0 (0.0%) |
| 1 or 2 Children | 16 (80.0%) | 4 (20.0%) |
| 3 or 4 Children | 0 (0.0%) | 0 (0.0%) |
| 5 or more Children | 0 (0.0%) | 0 (0.0%) |
| Total | 42 (91.3%) | 4 (8.7%) |
Income Below Poverty Among Single-Parent Households in Somerville
| Children | Single Father | Single Mother |
| No Children | 0 (0.0%) | 0 (0.0%) |
| 1 or 2 Children | 0 (0.0%) | 0 (0.0%) |
| 3 or 4 Children | 0 (0.0%) | 0 (0.0%) |
| 5 or more Children | 0 (0.0%) | 0 (0.0%) |
| Total | 0 (0.0%) | 0 (0.0%) |
Income Below Poverty Among Married-Couple vs Single-Parent Households in Somerville
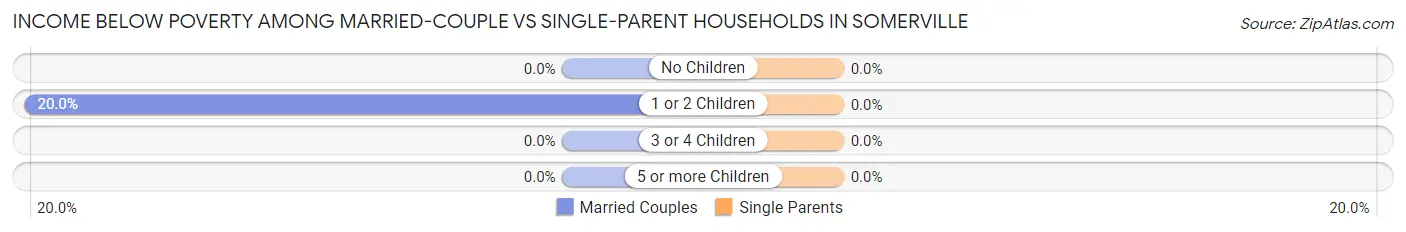
| Children | Married-Couple Families | Single-Parent Households |
| No Children | 0 (0.0%) | 0 (0.0%) |
| 1 or 2 Children | 4 (20.0%) | 0 (0.0%) |
| 3 or 4 Children | 0 (0.0%) | 0 (0.0%) |
| 5 or more Children | 0 (0.0%) | 0 (0.0%) |
| Total | 4 (8.7%) | 0 (0.0%) |
Race in Somerville
The most populous races in Somerville are White / Caucasian (245 | 96.5%), Some other Race (5 | 2.0%), and Black / African American (2 | 0.8%).
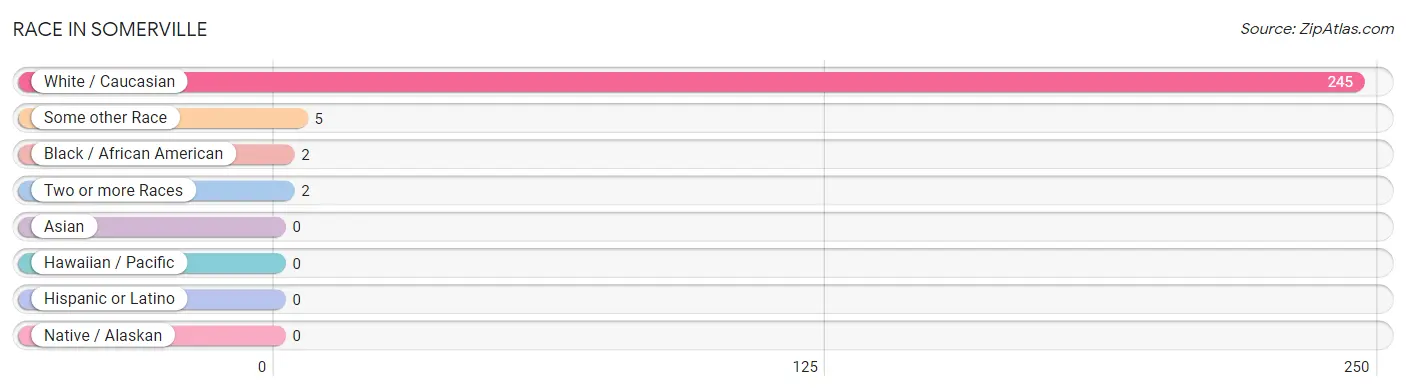
| Race | # Population | % Population |
| Asian | 0 | 0.0% |
| Black / African American | 2 | 0.8% |
| Hawaiian / Pacific | 0 | 0.0% |
| Hispanic or Latino | 0 | 0.0% |
| Native / Alaskan | 0 | 0.0% |
| White / Caucasian | 245 | 96.5% |
| Two or more Races | 2 | 0.8% |
| Some other Race | 5 | 2.0% |
| Total | 254 | 100.0% |
Ancestry in Somerville
The most populous ancestries reported in Somerville are German (86 | 33.9%), American (33 | 13.0%), English (25 | 9.8%), Irish (9 | 3.5%), and Scotch-Irish (7 | 2.8%), together accounting for 63.0% of all Somerville residents.
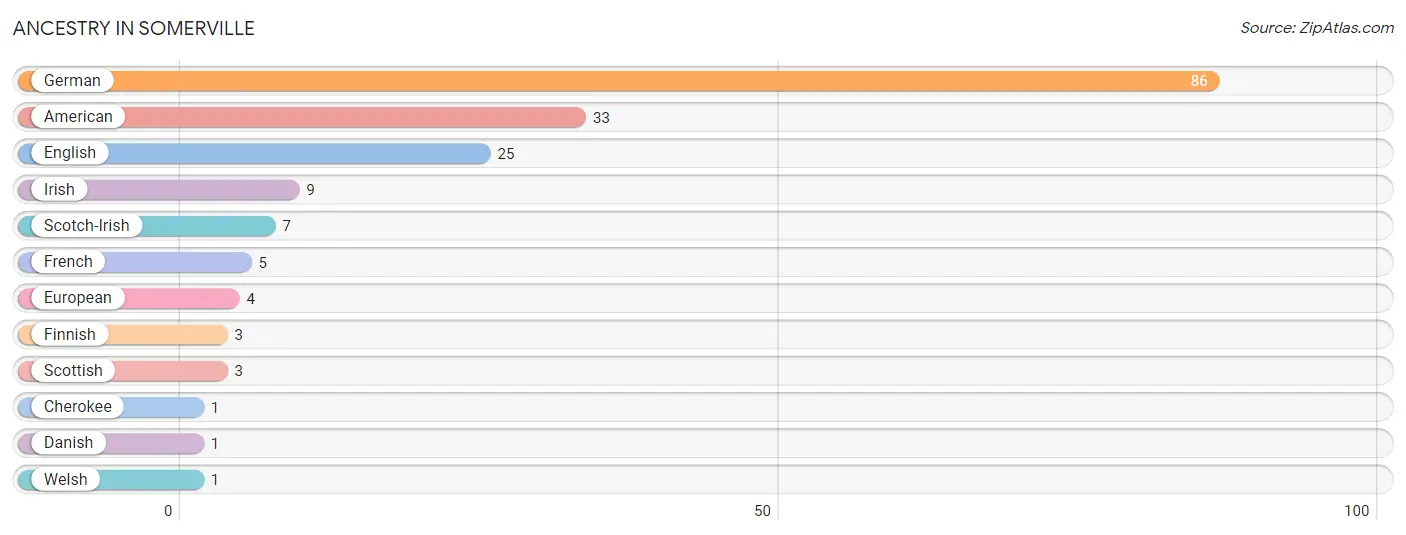
| Ancestry | # Population | % Population |
| American | 33 | 13.0% |
| Cherokee | 1 | 0.4% |
| Danish | 1 | 0.4% |
| English | 25 | 9.8% |
| European | 4 | 1.6% |
| Finnish | 3 | 1.2% |
| French | 5 | 2.0% |
| German | 86 | 33.9% |
| Irish | 9 | 3.5% |
| Scotch-Irish | 7 | 2.8% |
| Scottish | 3 | 1.2% |
| Welsh | 1 | 0.4% | View All 12 Rows |
Immigrants in Somerville

| Immigration Origin | # Population | % Population | View All 0 Rows |
Sex and Age in Somerville
Sex and Age in Somerville
The most populous age groups in Somerville are 55 to 59 Years (16 | 14.7%) for men and 15 to 19 Years (29 | 20.0%) for women.
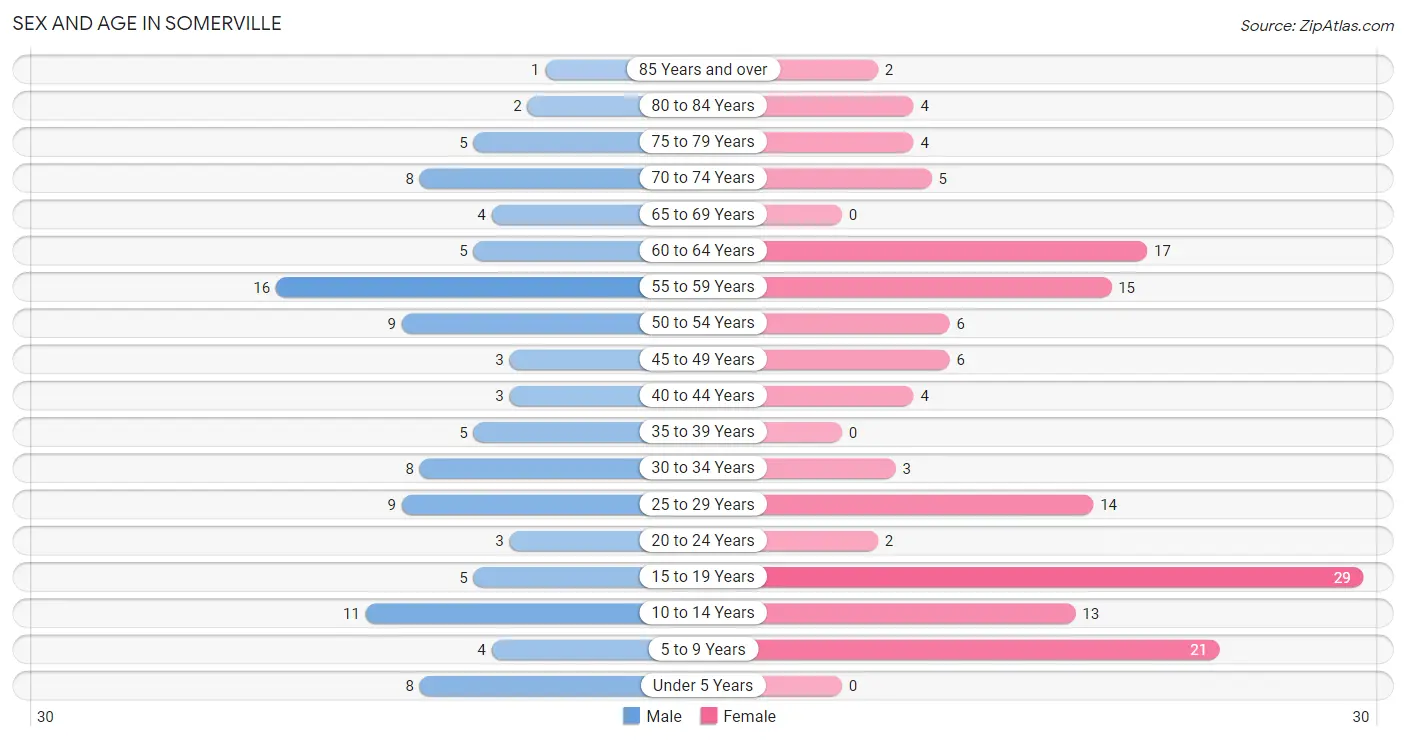
| Age Bracket | Male | Female |
| Under 5 Years | 8 (7.3%) | 0 (0.0%) |
| 5 to 9 Years | 4 (3.7%) | 21 (14.5%) |
| 10 to 14 Years | 11 (10.1%) | 13 (9.0%) |
| 15 to 19 Years | 5 (4.6%) | 29 (20.0%) |
| 20 to 24 Years | 3 (2.8%) | 2 (1.4%) |
| 25 to 29 Years | 9 (8.3%) | 14 (9.7%) |
| 30 to 34 Years | 8 (7.3%) | 3 (2.1%) |
| 35 to 39 Years | 5 (4.6%) | 0 (0.0%) |
| 40 to 44 Years | 3 (2.8%) | 4 (2.8%) |
| 45 to 49 Years | 3 (2.8%) | 6 (4.1%) |
| 50 to 54 Years | 9 (8.3%) | 6 (4.1%) |
| 55 to 59 Years | 16 (14.7%) | 15 (10.3%) |
| 60 to 64 Years | 5 (4.6%) | 17 (11.7%) |
| 65 to 69 Years | 4 (3.7%) | 0 (0.0%) |
| 70 to 74 Years | 8 (7.3%) | 5 (3.5%) |
| 75 to 79 Years | 5 (4.6%) | 4 (2.8%) |
| 80 to 84 Years | 2 (1.8%) | 4 (2.8%) |
| 85 Years and over | 1 (0.9%) | 2 (1.4%) |
| Total | 109 (100.0%) | 145 (100.0%) |
Families and Households in Somerville
Median Family Size in Somerville
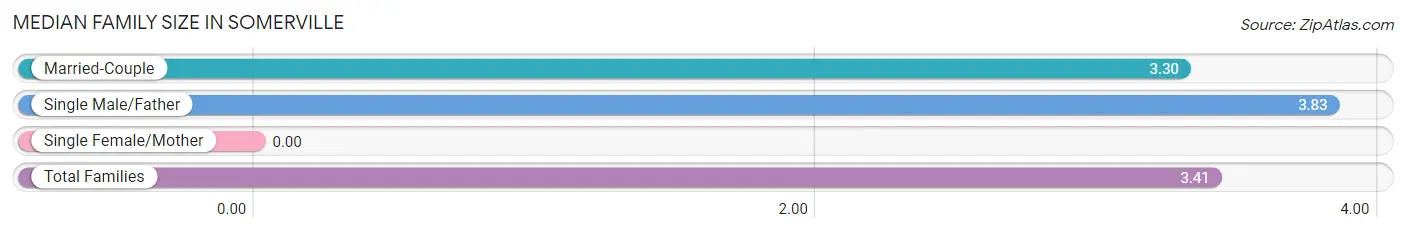
| Family Type | # Families | Family Size |
| Married-Couple | 46 (79.3%) | 3.30 |
| Single Male/Father | 12 (20.7%) | 3.83 |
| Single Female/Mother | 0 (0.0%) | - |
| Total Families | 58 (100.0%) | 3.41 |
Median Household Size in Somerville
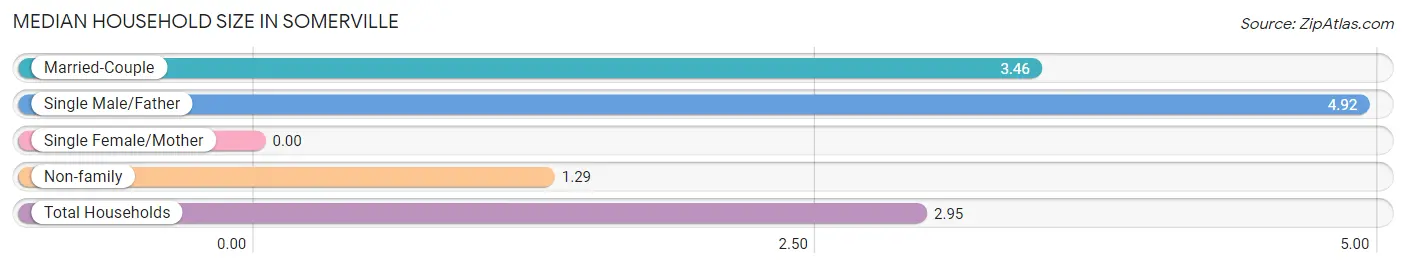
| Household Type | # Households | Household Size |
| Married-Couple | 46 (53.5%) | 3.46 |
| Single Male/Father | 12 (14.0%) | 4.92 |
| Single Female/Mother | 0 (0.0%) | - |
| Non-family | 28 (32.6%) | 1.29 |
| Total Households | 86 (100.0%) | 2.95 |
Household Size by Marriage Status in Somerville
Out of a total of 86 households in Somerville, 58 (67.4%) are family households, while 28 (32.6%) are nonfamily households. The most numerous type of family households are 2-person households, comprising 21, and the most common type of nonfamily households are 1-person households, comprising 20.
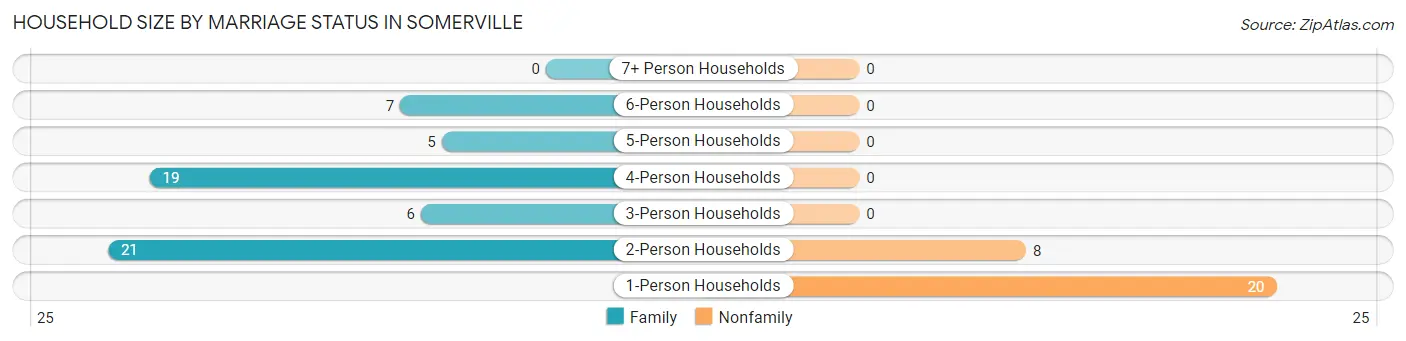
| Household Size | Family Households | Nonfamily Households |
| 1-Person Households | - | 20 (23.3%) |
| 2-Person Households | 21 (24.4%) | 8 (9.3%) |
| 3-Person Households | 6 (7.0%) | 0 (0.0%) |
| 4-Person Households | 19 (22.1%) | 0 (0.0%) |
| 5-Person Households | 5 (5.8%) | 0 (0.0%) |
| 6-Person Households | 7 (8.1%) | 0 (0.0%) |
| 7+ Person Households | 0 (0.0%) | 0 (0.0%) |
| Total | 58 (67.4%) | 28 (32.6%) |
Female Fertility in Somerville
Fertility by Age in Somerville
Average fertility rate in Somerville is 190.0 births per 1,000 women. Women in the age bracket of 20 to 34 years have the highest fertility rate with 579.0 births per 1,000 women. Women in the age bracket of 20 to 34 years acount for 100.0% of all women with births.
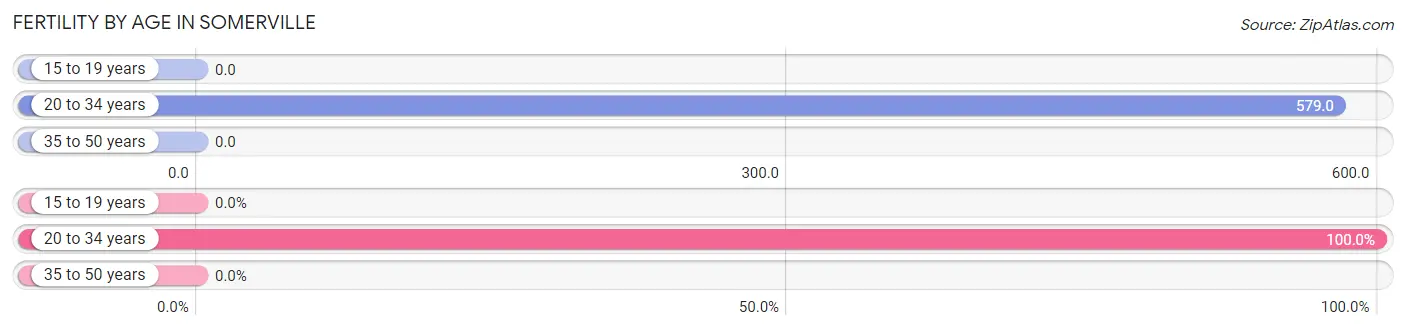
| Age Bracket | Women with Births | Births / 1,000 Women |
| 15 to 19 years | 0 (0.0%) | 0.0 |
| 20 to 34 years | 11 (100.0%) | 579.0 |
| 35 to 50 years | 0 (0.0%) | 0.0 |
| Total | 11 (100.0%) | 190.0 |
Fertility by Age by Marriage Status in Somerville
18.2% of women with births (11) in Somerville are married. The highest percentage of unmarried women with births falls into 20 to 34 years age bracket with 81.8% of them unmarried at the time of birth, while the lowest percentage of unmarried women with births belong to 20 to 34 years age bracket with 81.8% of them unmarried.
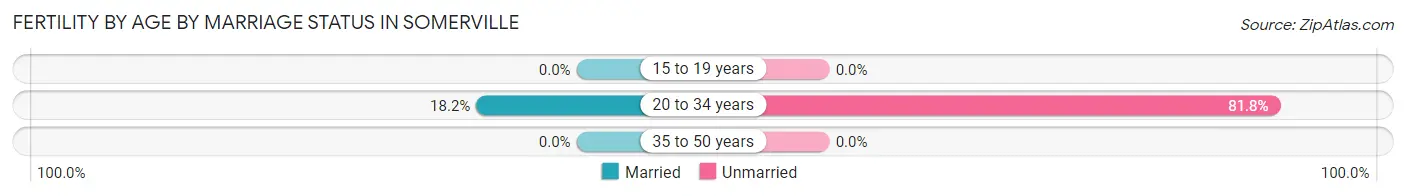
| Age Bracket | Married | Unmarried |
| 15 to 19 years | 0 (0.0%) | 0 (0.0%) |
| 20 to 34 years | 2 (18.2%) | 9 (81.8%) |
| 35 to 50 years | 0 (0.0%) | 0 (0.0%) |
| Total | 2 (18.2%) | 9 (81.8%) |
Fertility by Education in Somerville
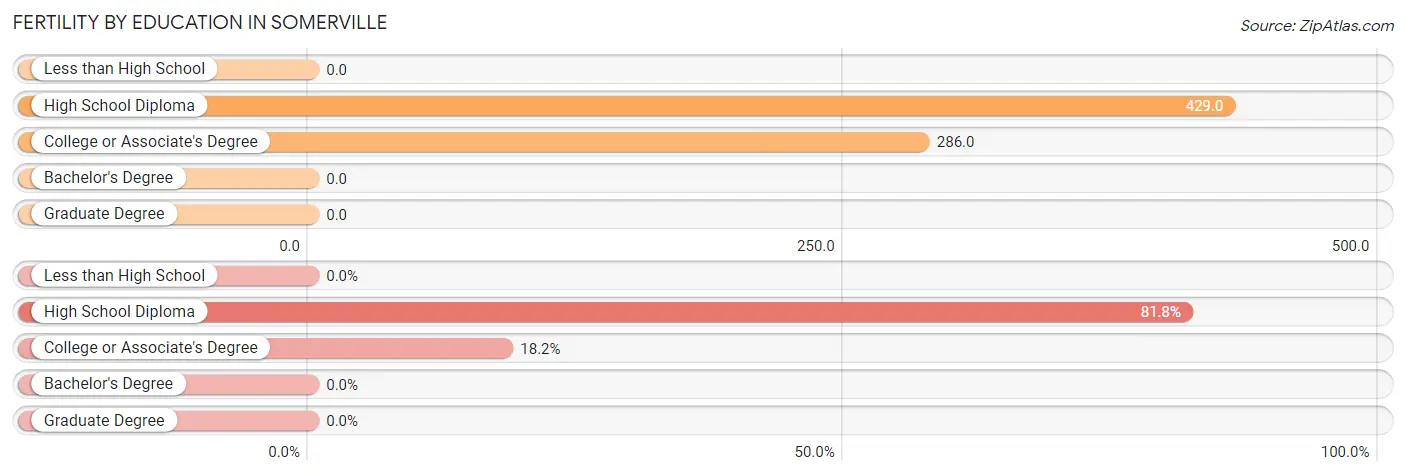
| Educational Attainment | Women with Births | Births / 1,000 Women |
| Less than High School | 0 (0.0%) | 0.0 |
| High School Diploma | 9 (81.8%) | 429.0 |
| College or Associate's Degree | 2 (18.2%) | 286.0 |
| Bachelor's Degree | 0 (0.0%) | 0.0 |
| Graduate Degree | 0 (0.0%) | 0.0 |
| Total | 11 (100.0%) | 190.0 |
Fertility by Education by Marriage Status in Somerville
81.8% of women with births in Somerville are unmarried. Women with the educational attainment of college or associate's degree are most likely to be married with 100.0% of them married at childbirth, while women with the educational attainment of high school diploma are least likely to be married with 100.0% of them unmarried at childbirth.
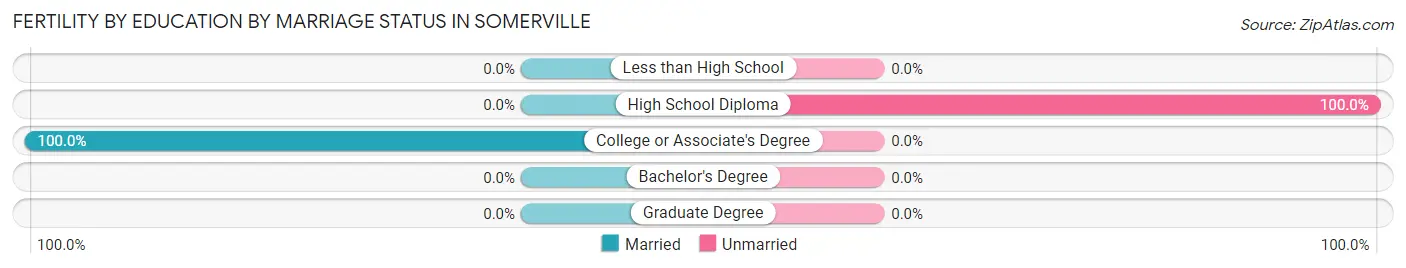
| Educational Attainment | Married | Unmarried |
| Less than High School | 0 (0.0%) | 0 (0.0%) |
| High School Diploma | 0 (0.0%) | 9 (100.0%) |
| College or Associate's Degree | 2 (100.0%) | 0 (0.0%) |
| Bachelor's Degree | 0 (0.0%) | 0 (0.0%) |
| Graduate Degree | 0 (0.0%) | 0 (0.0%) |
| Total | 2 (18.2%) | 9 (81.8%) |
Employment Characteristics in Somerville
Employment by Class of Employer in Somerville
Among the 95 employed individuals in Somerville, private company employees (65 | 68.4%), not-for-profit organizations (12 | 12.6%), and self-employed (not incorporated) (6 | 6.3%) make up the most common classes of employment.
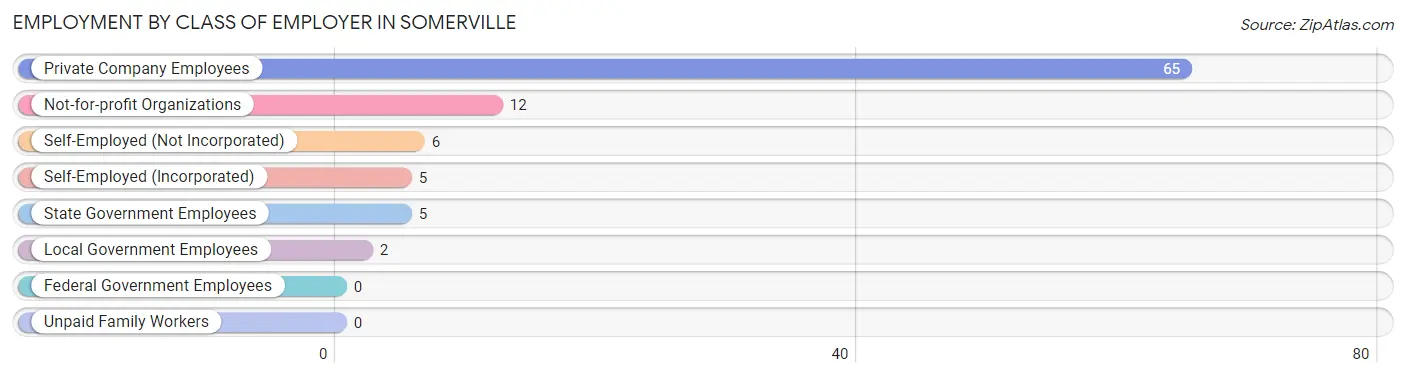
| Employer Class | # Employees | % Employees |
| Private Company Employees | 65 | 68.4% |
| Self-Employed (Incorporated) | 5 | 5.3% |
| Self-Employed (Not Incorporated) | 6 | 6.3% |
| Not-for-profit Organizations | 12 | 12.6% |
| Local Government Employees | 2 | 2.1% |
| State Government Employees | 5 | 5.3% |
| Federal Government Employees | 0 | 0.0% |
| Unpaid Family Workers | 0 | 0.0% |
| Total | 95 | 100.0% |
Employment Status by Age in Somerville
According to the labor force statistics for Somerville, out of the total population over 16 years of age (177), 56.5% or 100 individuals are in the labor force, with 3.0% or 3 of them unemployed. The age group with the highest labor force participation rate is 20 to 24 years, with 100.0% or 5 individuals in the labor force. Within the labor force, the 20 to 24 years age range has the highest percentage of unemployed individuals, with 40.0% or 2 of them being unemployed.
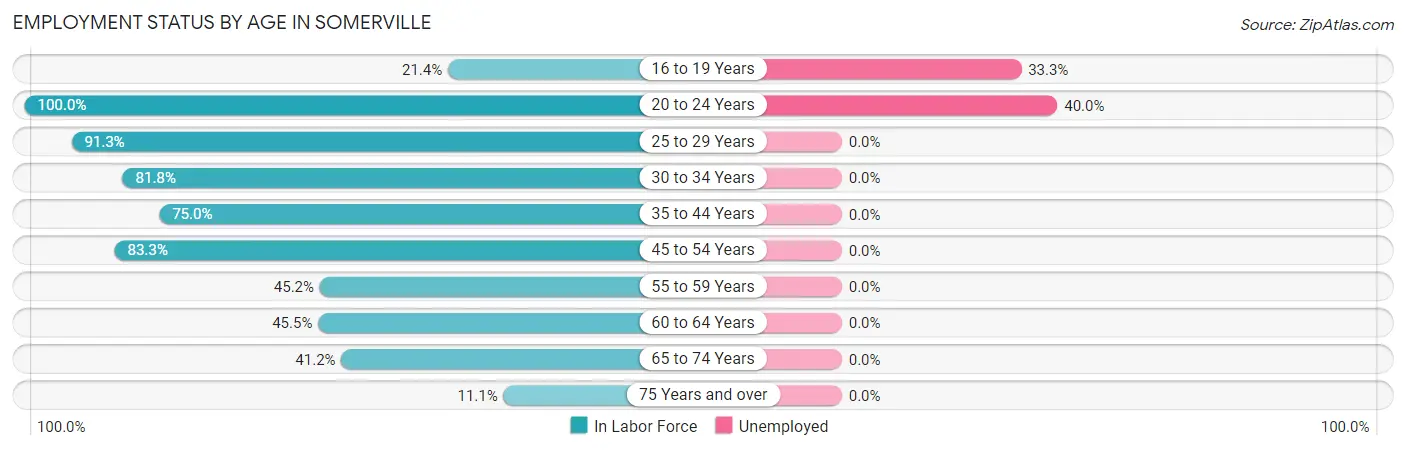
| Age Bracket | In Labor Force | Unemployed |
| 16 to 19 Years | 3 (21.4%) | 1 (33.3%) |
| 20 to 24 Years | 5 (100.0%) | 2 (40.0%) |
| 25 to 29 Years | 21 (91.3%) | 0 (0.0%) |
| 30 to 34 Years | 9 (81.8%) | 0 (0.0%) |
| 35 to 44 Years | 9 (75.0%) | 0 (0.0%) |
| 45 to 54 Years | 20 (83.3%) | 0 (0.0%) |
| 55 to 59 Years | 14 (45.2%) | 0 (0.0%) |
| 60 to 64 Years | 10 (45.5%) | 0 (0.0%) |
| 65 to 74 Years | 7 (41.2%) | 0 (0.0%) |
| 75 Years and over | 2 (11.1%) | 0 (0.0%) |
| Total | 100 (56.5%) | 3 (3.0%) |
Employment Status by Educational Attainment in Somerville
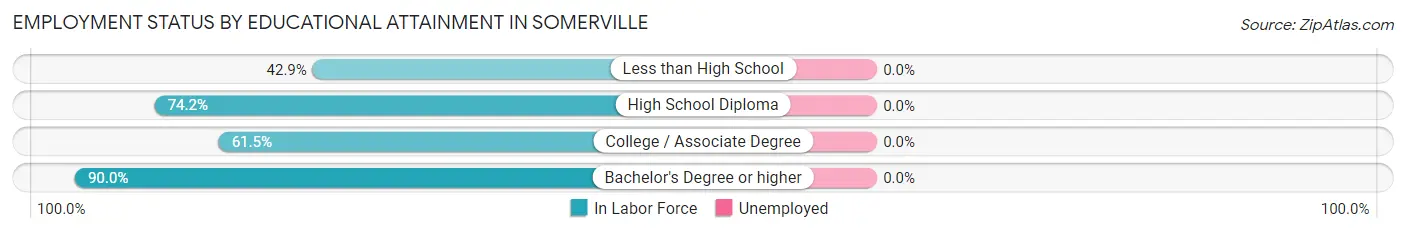
| Educational Attainment | In Labor Force | Unemployed |
| Less than High School | 9 (42.9%) | 0 (0.0%) |
| High School Diploma | 49 (74.2%) | 0 (0.0%) |
| College / Associate Degree | 16 (61.5%) | 0 (0.0%) |
| Bachelor's Degree or higher | 9 (90.0%) | 0 (0.0%) |
| Total | 83 (67.5%) | 0 (0.0%) |
Employment Occupations by Sex in Somerville
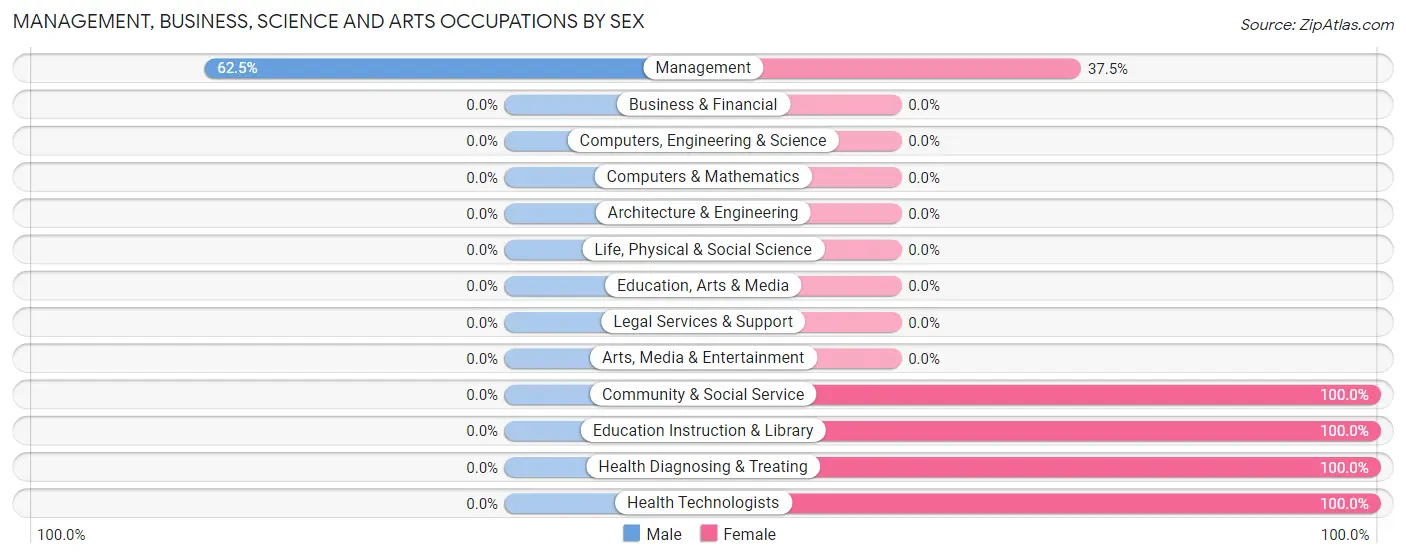
Management, Business, Science and Arts Occupations
The most common Management, Business, Science and Arts occupations in Somerville are Management (8 | 8.3%), Health Diagnosing & Treating (3 | 3.1%), Health Technologists (3 | 3.1%), Community & Social Service (2 | 2.1%), and Education Instruction & Library (2 | 2.1%).
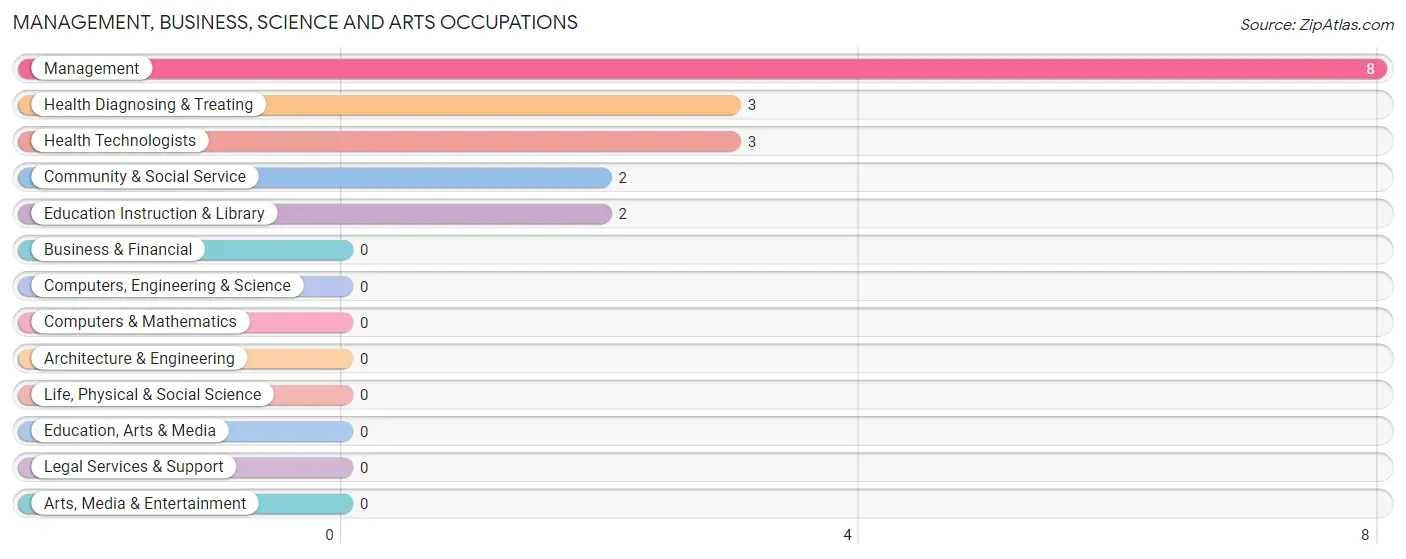
Management, Business, Science and Arts Occupations by Sex
| Occupation | Male | Female |
| Management | 5 (62.5%) | 3 (37.5%) |
| Business & Financial | 0 (0.0%) | 0 (0.0%) |
| Computers, Engineering & Science | 0 (0.0%) | 0 (0.0%) |
| Computers & Mathematics | 0 (0.0%) | 0 (0.0%) |
| Architecture & Engineering | 0 (0.0%) | 0 (0.0%) |
| Life, Physical & Social Science | 0 (0.0%) | 0 (0.0%) |
| Community & Social Service | 0 (0.0%) | 2 (100.0%) |
| Education, Arts & Media | 0 (0.0%) | 0 (0.0%) |
| Legal Services & Support | 0 (0.0%) | 0 (0.0%) |
| Education Instruction & Library | 0 (0.0%) | 2 (100.0%) |
| Arts, Media & Entertainment | 0 (0.0%) | 0 (0.0%) |
| Health Diagnosing & Treating | 0 (0.0%) | 3 (100.0%) |
| Health Technologists | 0 (0.0%) | 3 (100.0%) |
| Total (Category) | 5 (38.5%) | 8 (61.5%) |
| Total (Overall) | 53 (54.6%) | 44 (45.4%) |
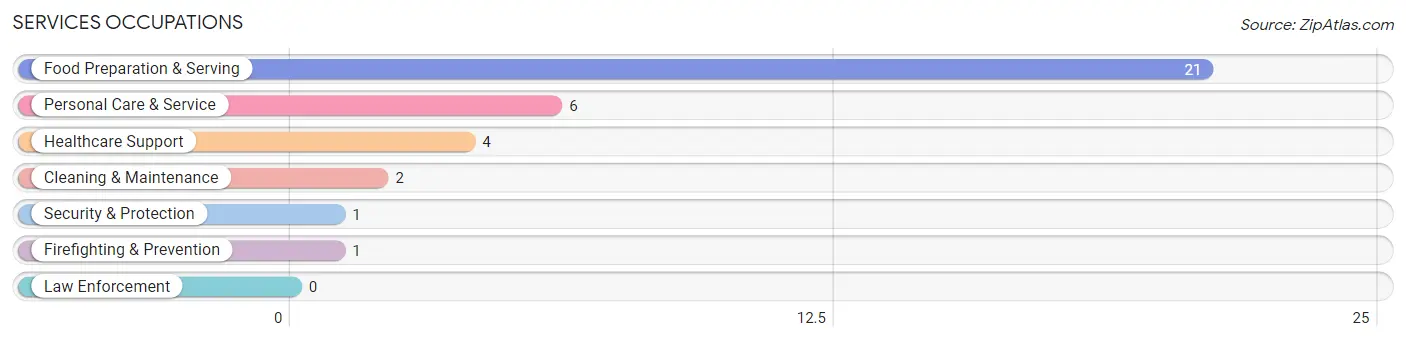
Services Occupations
The most common Services occupations in Somerville are Food Preparation & Serving (21 | 21.6%), Personal Care & Service (6 | 6.2%), Healthcare Support (4 | 4.1%), Cleaning & Maintenance (2 | 2.1%), and Security & Protection (1 | 1.0%).
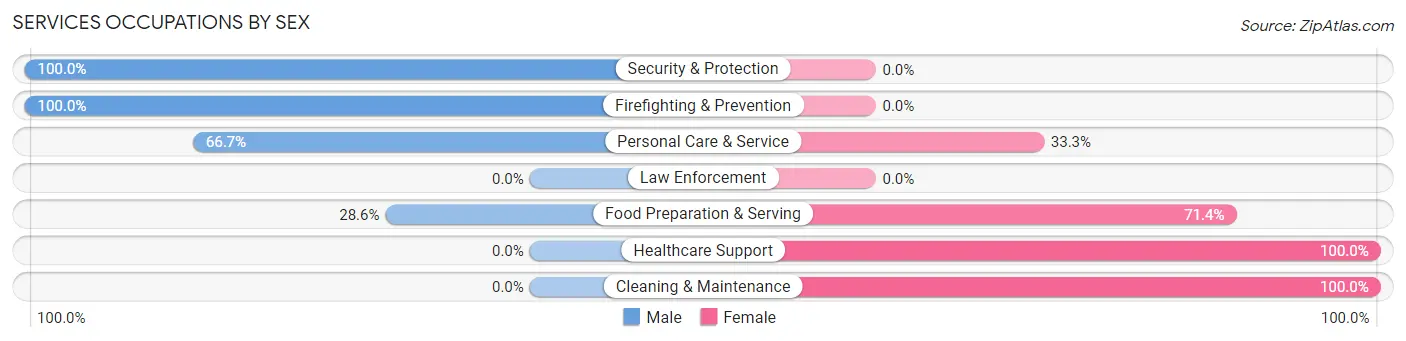
Services Occupations by Sex
Within the Services occupations in Somerville, the most male-oriented occupations are Security & Protection (100.0%), Firefighting & Prevention (100.0%), and Personal Care & Service (66.7%), while the most female-oriented occupations are Healthcare Support (100.0%), Cleaning & Maintenance (100.0%), and Food Preparation & Serving (71.4%).
| Occupation | Male | Female |
| Healthcare Support | 0 (0.0%) | 4 (100.0%) |
| Security & Protection | 1 (100.0%) | 0 (0.0%) |
| Firefighting & Prevention | 1 (100.0%) | 0 (0.0%) |
| Law Enforcement | 0 (0.0%) | 0 (0.0%) |
| Food Preparation & Serving | 6 (28.6%) | 15 (71.4%) |
| Cleaning & Maintenance | 0 (0.0%) | 2 (100.0%) |
| Personal Care & Service | 4 (66.7%) | 2 (33.3%) |
| Total (Category) | 11 (32.4%) | 23 (67.6%) |
| Total (Overall) | 53 (54.6%) | 44 (45.4%) |
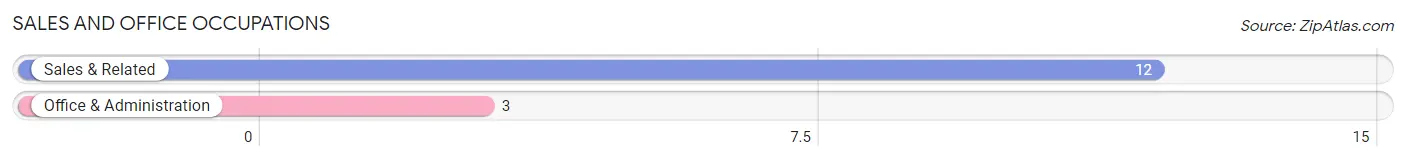
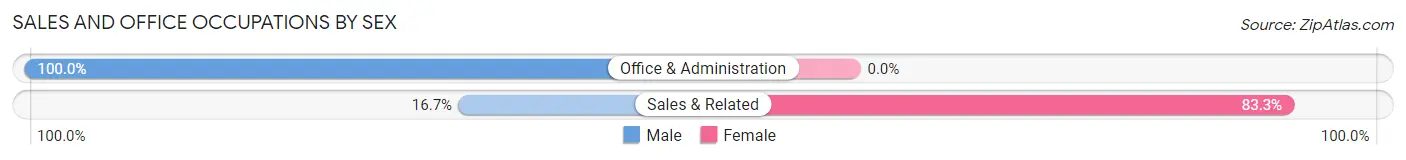
Sales and Office Occupations
The most common Sales and Office occupations in Somerville are Sales & Related (12 | 12.4%), and Office & Administration (3 | 3.1%).
Sales and Office Occupations by Sex
| Occupation | Male | Female |
| Sales & Related | 2 (16.7%) | 10 (83.3%) |
| Office & Administration | 3 (100.0%) | 0 (0.0%) |
| Total (Category) | 5 (33.3%) | 10 (66.7%) |
| Total (Overall) | 53 (54.6%) | 44 (45.4%) |
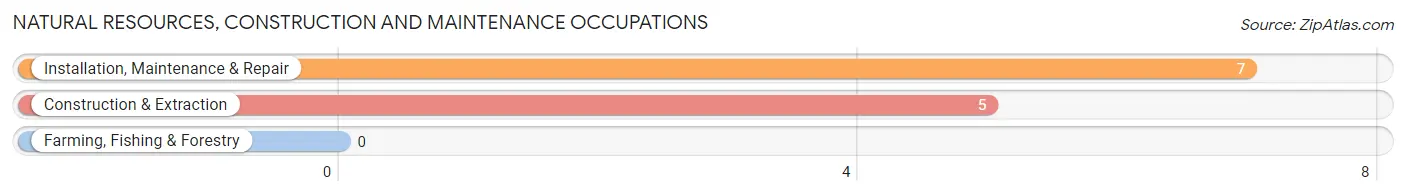
Natural Resources, Construction and Maintenance Occupations
The most common Natural Resources, Construction and Maintenance occupations in Somerville are Installation, Maintenance & Repair (7 | 7.2%), and Construction & Extraction (5 | 5.1%).
Natural Resources, Construction and Maintenance Occupations by Sex
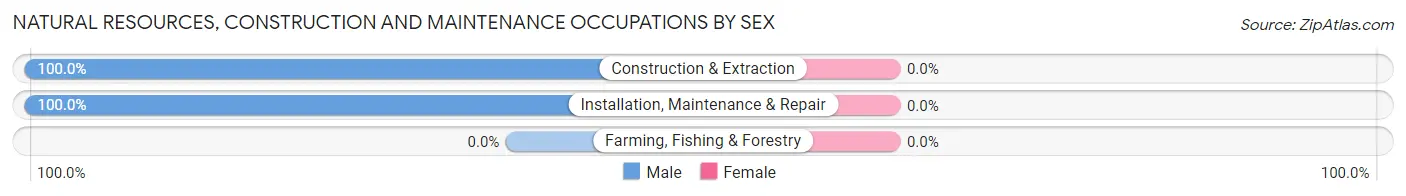
| Occupation | Male | Female |
| Farming, Fishing & Forestry | 0 (0.0%) | 0 (0.0%) |
| Construction & Extraction | 5 (100.0%) | 0 (0.0%) |
| Installation, Maintenance & Repair | 7 (100.0%) | 0 (0.0%) |
| Total (Category) | 12 (100.0%) | 0 (0.0%) |
| Total (Overall) | 53 (54.6%) | 44 (45.4%) |
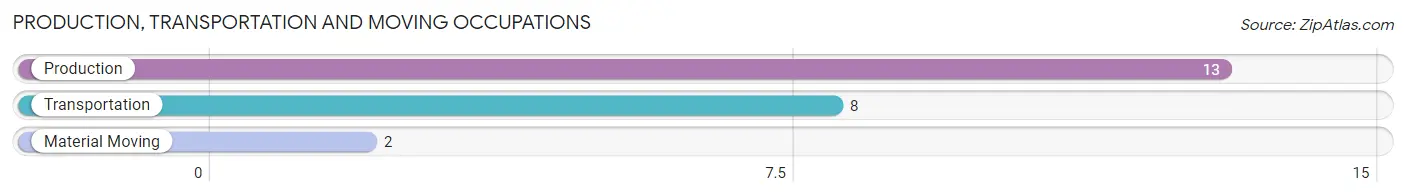
Production, Transportation and Moving Occupations
The most common Production, Transportation and Moving occupations in Somerville are Production (13 | 13.4%), Transportation (8 | 8.3%), and Material Moving (2 | 2.1%).
Production, Transportation and Moving Occupations by Sex
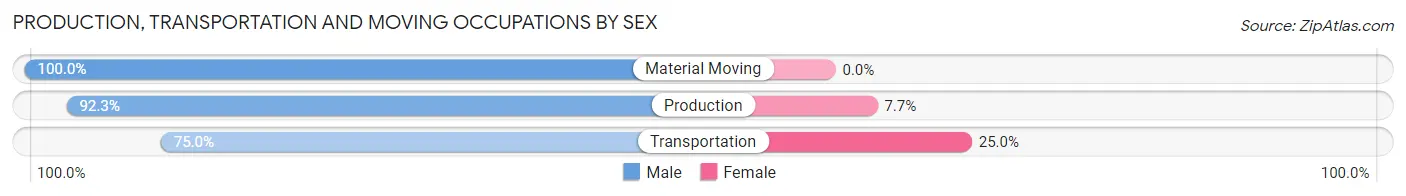
| Occupation | Male | Female |
| Production | 12 (92.3%) | 1 (7.7%) |
| Transportation | 6 (75.0%) | 2 (25.0%) |
| Material Moving | 2 (100.0%) | 0 (0.0%) |
| Total (Category) | 20 (87.0%) | 3 (13.0%) |
| Total (Overall) | 53 (54.6%) | 44 (45.4%) |
Employment Industries by Sex in Somerville
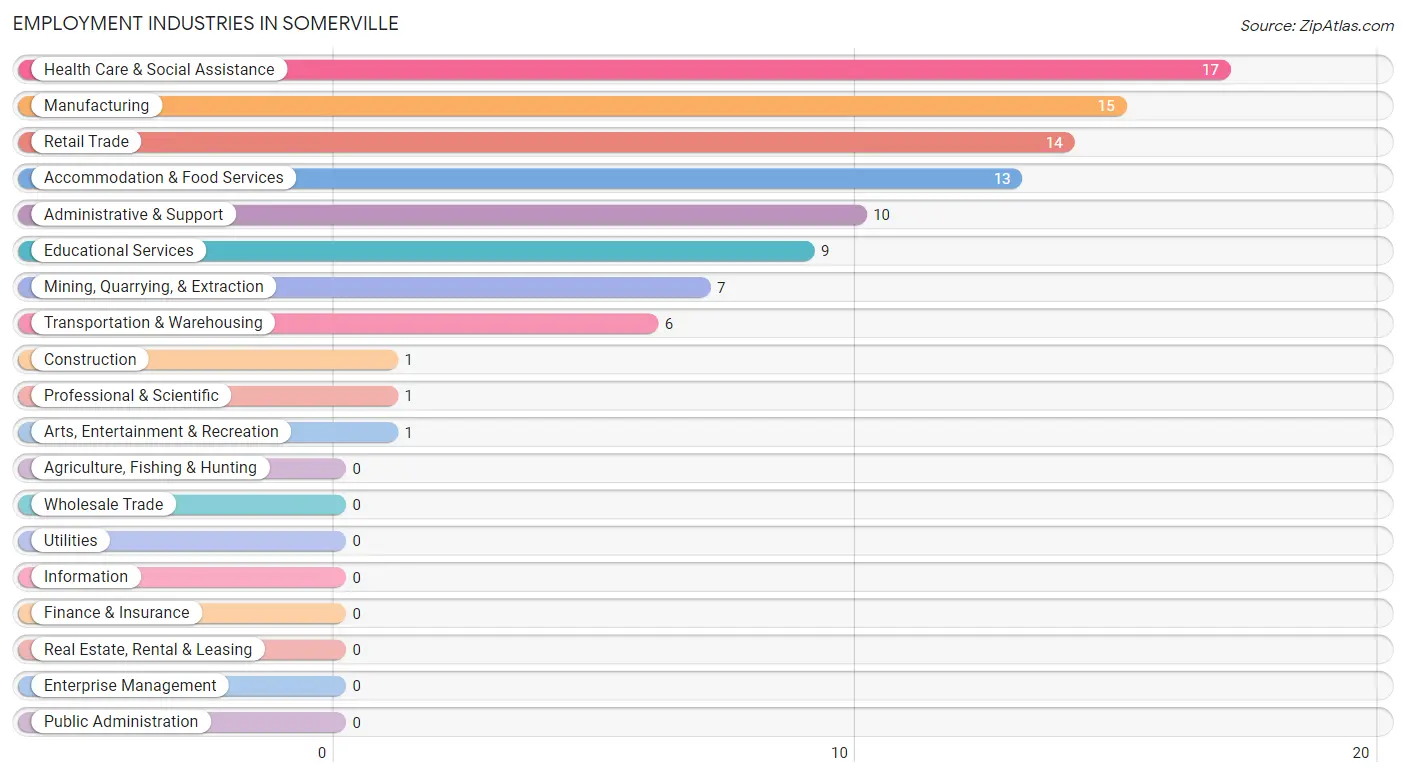
Employment Industries in Somerville
The major employment industries in Somerville include Health Care & Social Assistance (17 | 17.5%), Manufacturing (15 | 15.5%), Retail Trade (14 | 14.4%), Accommodation & Food Services (13 | 13.4%), and Administrative & Support (10 | 10.3%).
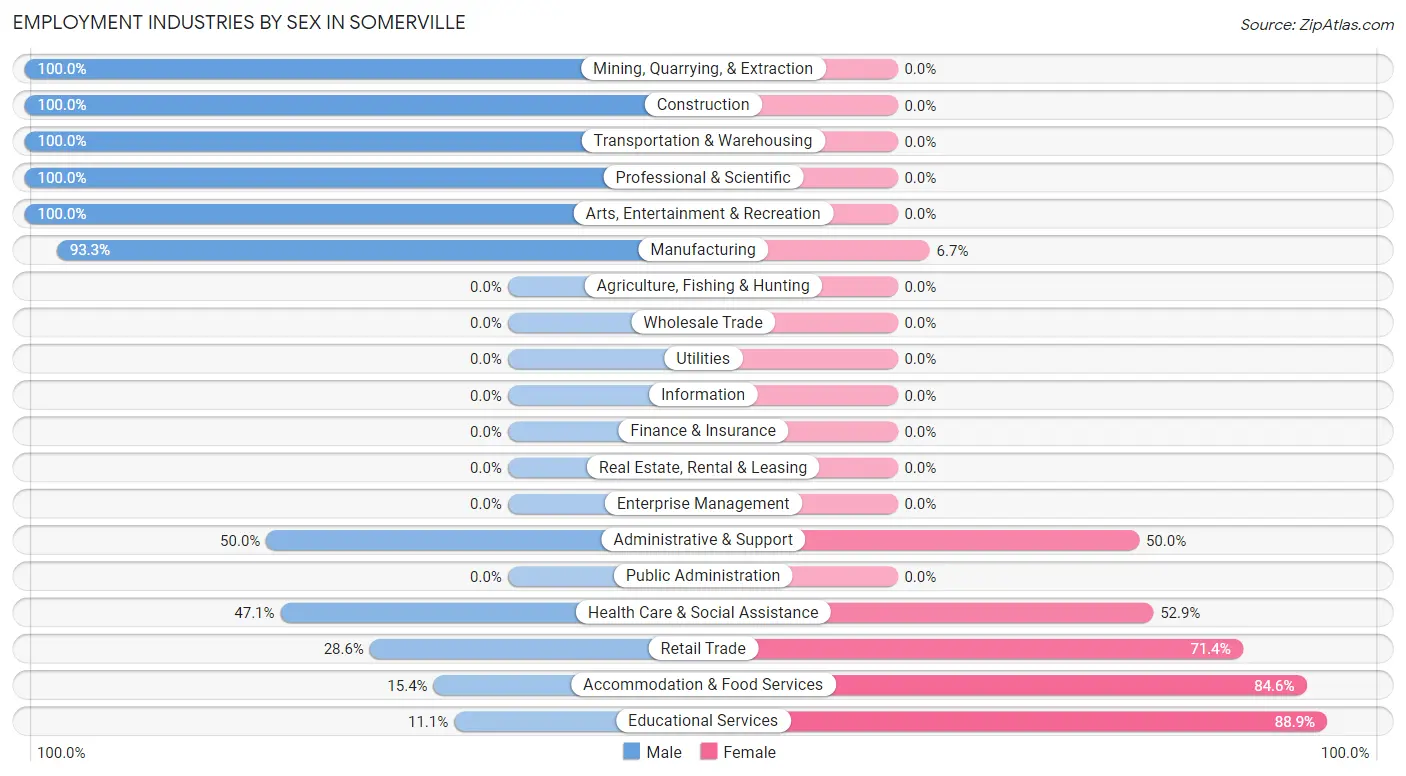
Employment Industries by Sex in Somerville
The Somerville industries that see more men than women are Mining, Quarrying, & Extraction (100.0%), Construction (100.0%), and Transportation & Warehousing (100.0%), whereas the industries that tend to have a higher number of women are Educational Services (88.9%), Accommodation & Food Services (84.6%), and Retail Trade (71.4%).
| Industry | Male | Female |
| Agriculture, Fishing & Hunting | 0 (0.0%) | 0 (0.0%) |
| Mining, Quarrying, & Extraction | 7 (100.0%) | 0 (0.0%) |
| Construction | 1 (100.0%) | 0 (0.0%) |
| Manufacturing | 14 (93.3%) | 1 (6.7%) |
| Wholesale Trade | 0 (0.0%) | 0 (0.0%) |
| Retail Trade | 4 (28.6%) | 10 (71.4%) |
| Transportation & Warehousing | 6 (100.0%) | 0 (0.0%) |
| Utilities | 0 (0.0%) | 0 (0.0%) |
| Information | 0 (0.0%) | 0 (0.0%) |
| Finance & Insurance | 0 (0.0%) | 0 (0.0%) |
| Real Estate, Rental & Leasing | 0 (0.0%) | 0 (0.0%) |
| Professional & Scientific | 1 (100.0%) | 0 (0.0%) |
| Enterprise Management | 0 (0.0%) | 0 (0.0%) |
| Administrative & Support | 5 (50.0%) | 5 (50.0%) |
| Educational Services | 1 (11.1%) | 8 (88.9%) |
| Health Care & Social Assistance | 8 (47.1%) | 9 (52.9%) |
| Arts, Entertainment & Recreation | 1 (100.0%) | 0 (0.0%) |
| Accommodation & Food Services | 2 (15.4%) | 11 (84.6%) |
| Public Administration | 0 (0.0%) | 0 (0.0%) |
| Total | 53 (54.6%) | 44 (45.4%) |
Education in Somerville
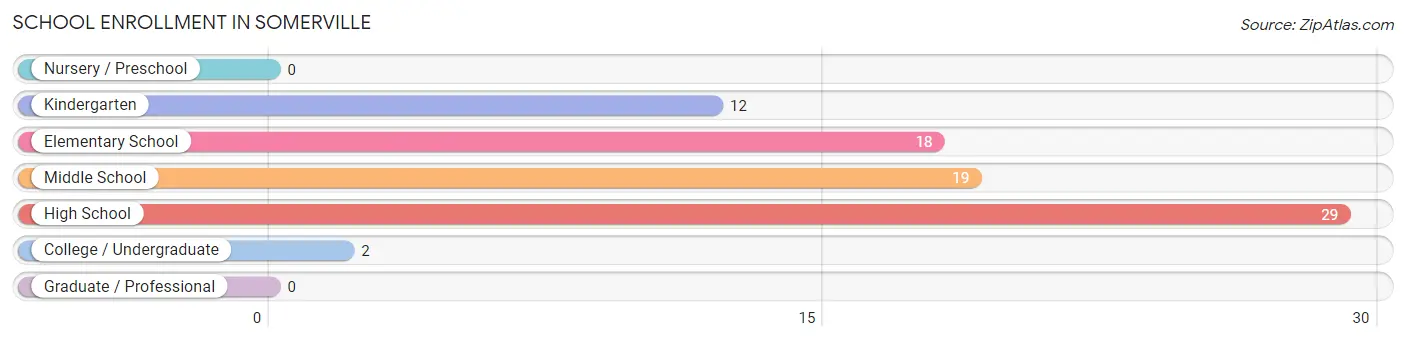
School Enrollment in Somerville
The most common levels of schooling among the 80 students in Somerville are high school (29 | 36.2%), middle school (19 | 23.7%), and elementary school (18 | 22.5%).
| School Level | # Students | % Students |
| Nursery / Preschool | 0 | 0.0% |
| Kindergarten | 12 | 15.0% |
| Elementary School | 18 | 22.5% |
| Middle School | 19 | 23.7% |
| High School | 29 | 36.2% |
| College / Undergraduate | 2 | 2.5% |
| Graduate / Professional | 0 | 0.0% |
| Total | 80 | 100.0% |
School Enrollment by Age by Funding Source in Somerville
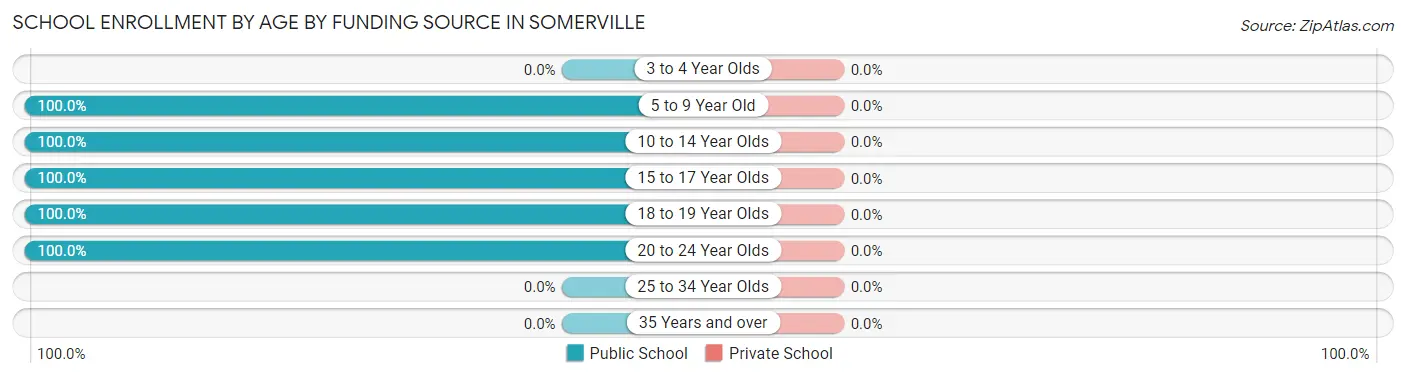
| Age Bracket | Public School | Private School |
| 3 to 4 Year Olds | 0 (0.0%) | 0 (0.0%) |
| 5 to 9 Year Old | 25 (100.0%) | 0 (0.0%) |
| 10 to 14 Year Olds | 24 (100.0%) | 0 (0.0%) |
| 15 to 17 Year Olds | 26 (100.0%) | 0 (0.0%) |
| 18 to 19 Year Olds | 4 (100.0%) | 0 (0.0%) |
| 20 to 24 Year Olds | 1 (100.0%) | 0 (0.0%) |
| 25 to 34 Year Olds | 0 (0.0%) | 0 (0.0%) |
| 35 Years and over | 0 (0.0%) | 0 (0.0%) |
| Total | 80 (100.0%) | 0 (0.0%) |
Educational Attainment by Field of Study in Somerville
Arts & humanities (4 | 28.6%), business (3 | 21.4%), social sciences (2 | 14.3%), liberal arts & history (2 | 14.3%), and computers & mathematics (1 | 7.1%) are the most common fields of study among 14 individuals in Somerville who have obtained a bachelor's degree or higher.
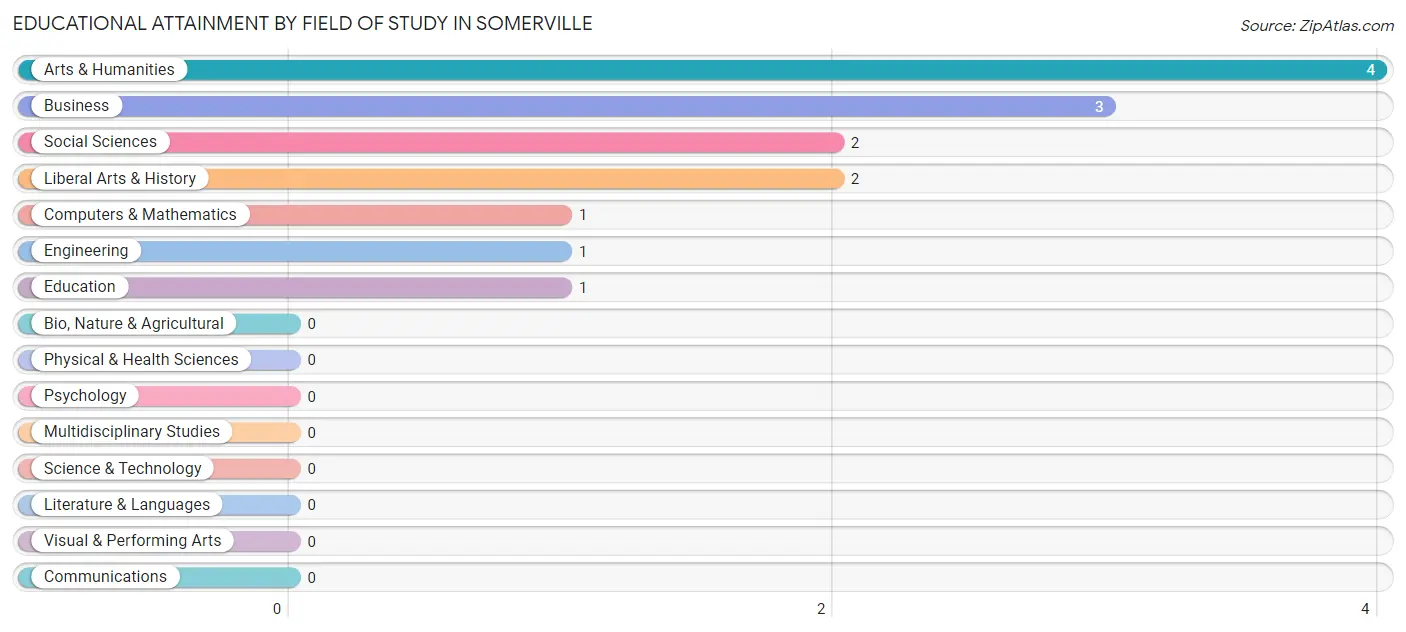
| Field of Study | # Graduates | % Graduates |
| Computers & Mathematics | 1 | 7.1% |
| Bio, Nature & Agricultural | 0 | 0.0% |
| Physical & Health Sciences | 0 | 0.0% |
| Psychology | 0 | 0.0% |
| Social Sciences | 2 | 14.3% |
| Engineering | 1 | 7.1% |
| Multidisciplinary Studies | 0 | 0.0% |
| Science & Technology | 0 | 0.0% |
| Business | 3 | 21.4% |
| Education | 1 | 7.1% |
| Literature & Languages | 0 | 0.0% |
| Liberal Arts & History | 2 | 14.3% |
| Visual & Performing Arts | 0 | 0.0% |
| Communications | 0 | 0.0% |
| Arts & Humanities | 4 | 28.6% |
| Total | 14 | 100.0% |
Transportation & Commute in Somerville
Vehicle Availability by Sex in Somerville
The most prevalent vehicle ownership categories in Somerville are males with 2 vehicles (23, accounting for 43.4%) and females with 2 vehicles (20, making up 54.8%).
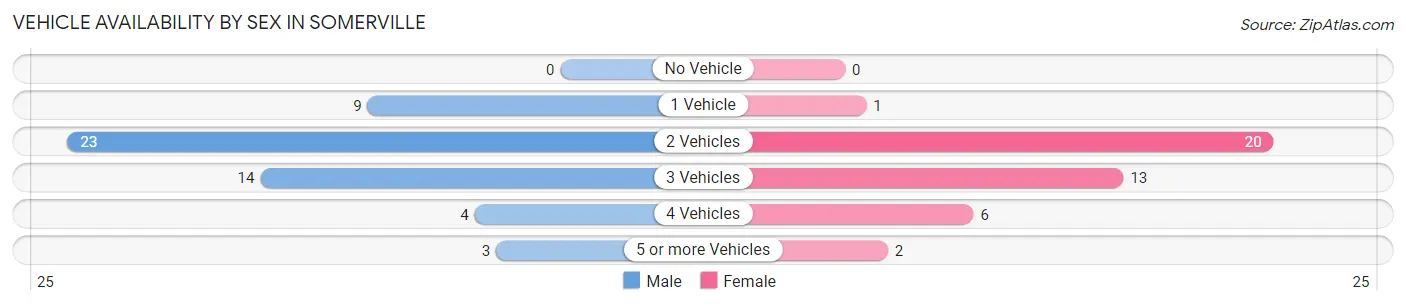
| Vehicles Available | Male | Female |
| No Vehicle | 0 (0.0%) | 0 (0.0%) |
| 1 Vehicle | 9 (17.0%) | 1 (2.4%) |
| 2 Vehicles | 23 (43.4%) | 20 (47.6%) |
| 3 Vehicles | 14 (26.4%) | 13 (30.9%) |
| 4 Vehicles | 4 (7.5%) | 6 (14.3%) |
| 5 or more Vehicles | 3 (5.7%) | 2 (4.8%) |
| Total | 53 (100.0%) | 42 (100.0%) |
Commute Time in Somerville
The most frequently occuring commute durations in Somerville are 20 to 24 minutes (19 commuters, 20.4%), 5 to 9 minutes (18 commuters, 19.4%), and 15 to 19 minutes (18 commuters, 19.4%).
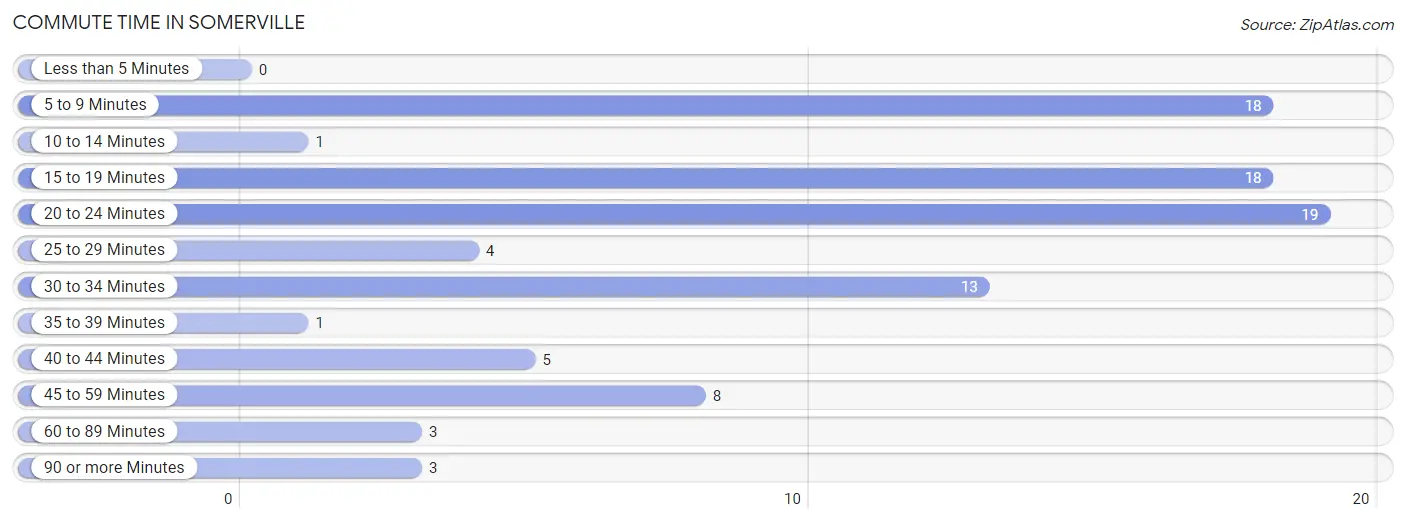
| Commute Time | # Commuters | % Commuters |
| Less than 5 Minutes | 0 | 0.0% |
| 5 to 9 Minutes | 18 | 19.4% |
| 10 to 14 Minutes | 1 | 1.1% |
| 15 to 19 Minutes | 18 | 19.4% |
| 20 to 24 Minutes | 19 | 20.4% |
| 25 to 29 Minutes | 4 | 4.3% |
| 30 to 34 Minutes | 13 | 14.0% |
| 35 to 39 Minutes | 1 | 1.1% |
| 40 to 44 Minutes | 5 | 5.4% |
| 45 to 59 Minutes | 8 | 8.6% |
| 60 to 89 Minutes | 3 | 3.2% |
| 90 or more Minutes | 3 | 3.2% |
Commute Time by Sex in Somerville
The most common commute times in Somerville are 20 to 24 minutes (19 commuters, 35.8%) for males and 5 to 9 minutes (10 commuters, 25.0%) for females.
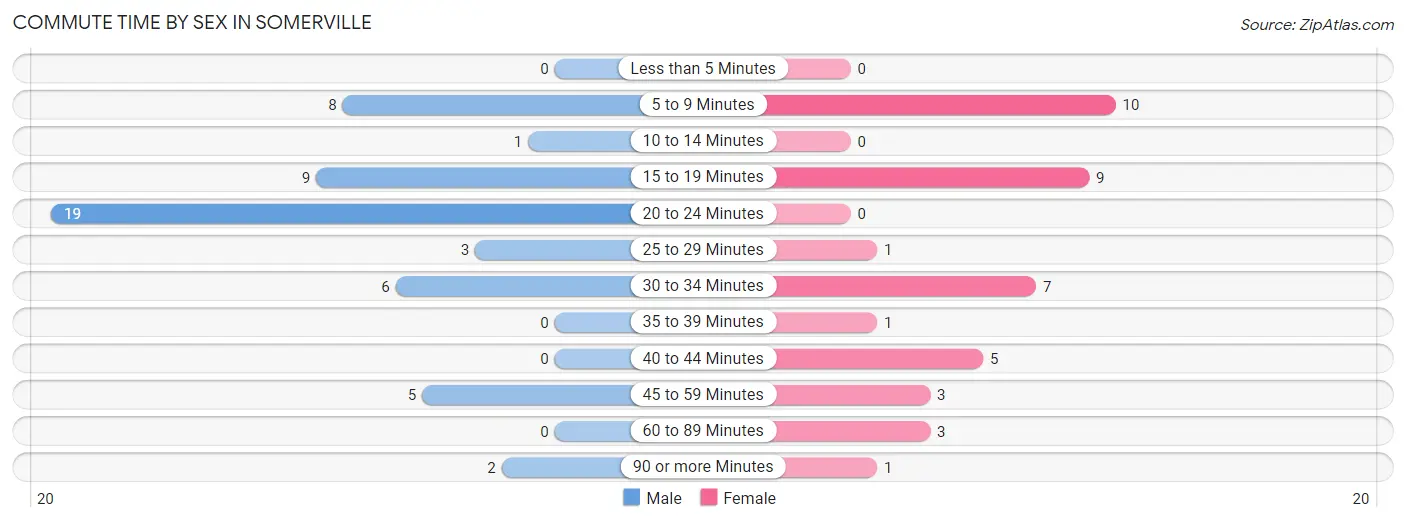
| Commute Time | Male | Female |
| Less than 5 Minutes | 0 (0.0%) | 0 (0.0%) |
| 5 to 9 Minutes | 8 (15.1%) | 10 (25.0%) |
| 10 to 14 Minutes | 1 (1.9%) | 0 (0.0%) |
| 15 to 19 Minutes | 9 (17.0%) | 9 (22.5%) |
| 20 to 24 Minutes | 19 (35.8%) | 0 (0.0%) |
| 25 to 29 Minutes | 3 (5.7%) | 1 (2.5%) |
| 30 to 34 Minutes | 6 (11.3%) | 7 (17.5%) |
| 35 to 39 Minutes | 0 (0.0%) | 1 (2.5%) |
| 40 to 44 Minutes | 0 (0.0%) | 5 (12.5%) |
| 45 to 59 Minutes | 5 (9.4%) | 3 (7.5%) |
| 60 to 89 Minutes | 0 (0.0%) | 3 (7.5%) |
| 90 or more Minutes | 2 (3.8%) | 1 (2.5%) |
Time of Departure to Work by Sex in Somerville
The most frequent times of departure to work in Somerville are 12:00 AM to 4:59 AM (11, 20.7%) for males and 7:00 AM to 7:29 AM (9, 22.5%) for females.
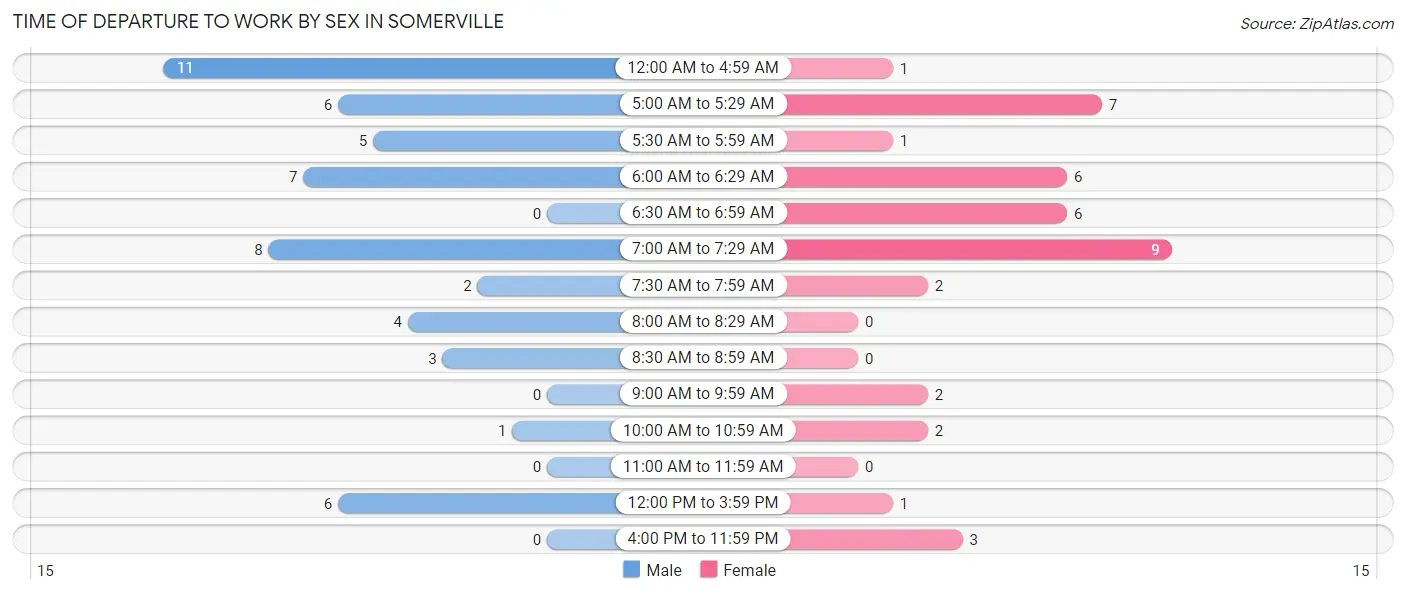
| Time of Departure | Male | Female |
| 12:00 AM to 4:59 AM | 11 (20.7%) | 1 (2.5%) |
| 5:00 AM to 5:29 AM | 6 (11.3%) | 7 (17.5%) |
| 5:30 AM to 5:59 AM | 5 (9.4%) | 1 (2.5%) |
| 6:00 AM to 6:29 AM | 7 (13.2%) | 6 (15.0%) |
| 6:30 AM to 6:59 AM | 0 (0.0%) | 6 (15.0%) |
| 7:00 AM to 7:29 AM | 8 (15.1%) | 9 (22.5%) |
| 7:30 AM to 7:59 AM | 2 (3.8%) | 2 (5.0%) |
| 8:00 AM to 8:29 AM | 4 (7.5%) | 0 (0.0%) |
| 8:30 AM to 8:59 AM | 3 (5.7%) | 0 (0.0%) |
| 9:00 AM to 9:59 AM | 0 (0.0%) | 2 (5.0%) |
| 10:00 AM to 10:59 AM | 1 (1.9%) | 2 (5.0%) |
| 11:00 AM to 11:59 AM | 0 (0.0%) | 0 (0.0%) |
| 12:00 PM to 3:59 PM | 6 (11.3%) | 1 (2.5%) |
| 4:00 PM to 11:59 PM | 0 (0.0%) | 3 (7.5%) |
| Total | 53 (100.0%) | 40 (100.0%) |
Housing Occupancy in Somerville
Occupancy by Ownership in Somerville
Of the total 86 dwellings in Somerville, owner-occupied units account for 80 (93.0%), while renter-occupied units make up 6 (7.0%).
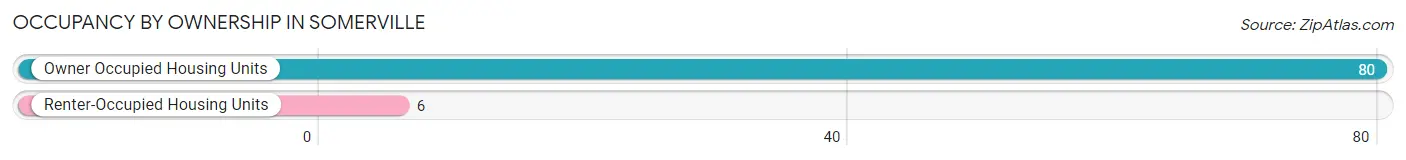
| Occupancy | # Housing Units | % Housing Units |
| Owner Occupied Housing Units | 80 | 93.0% |
| Renter-Occupied Housing Units | 6 | 7.0% |
| Total Occupied Housing Units | 86 | 100.0% |
Occupancy by Household Size in Somerville
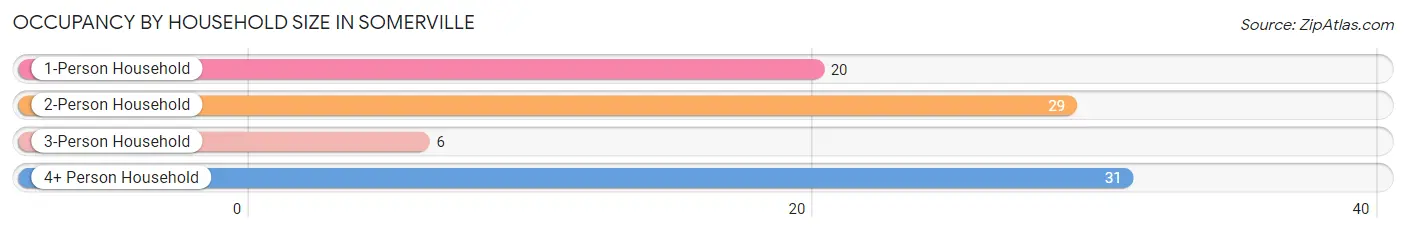
| Household Size | # Housing Units | % Housing Units |
| 1-Person Household | 20 | 23.3% |
| 2-Person Household | 29 | 33.7% |
| 3-Person Household | 6 | 7.0% |
| 4+ Person Household | 31 | 36.0% |
| Total Housing Units | 86 | 100.0% |
Occupancy by Ownership by Household Size in Somerville
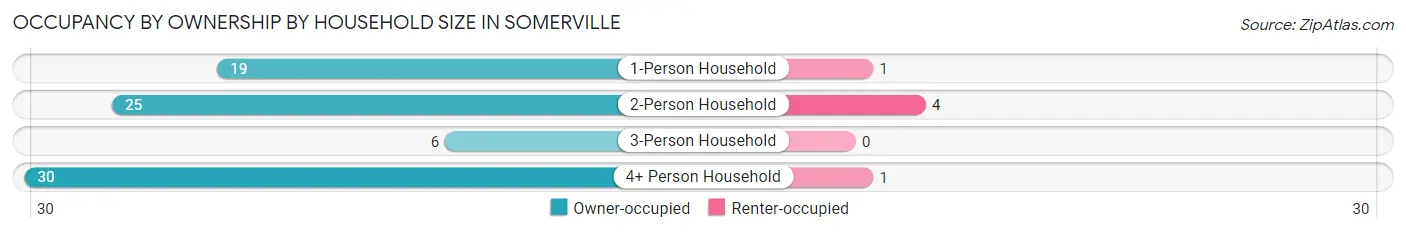
| Household Size | Owner-occupied | Renter-occupied |
| 1-Person Household | 19 (95.0%) | 1 (5.0%) |
| 2-Person Household | 25 (86.2%) | 4 (13.8%) |
| 3-Person Household | 6 (100.0%) | 0 (0.0%) |
| 4+ Person Household | 30 (96.8%) | 1 (3.2%) |
| Total Housing Units | 80 (93.0%) | 6 (7.0%) |
Occupancy by Educational Attainment in Somerville
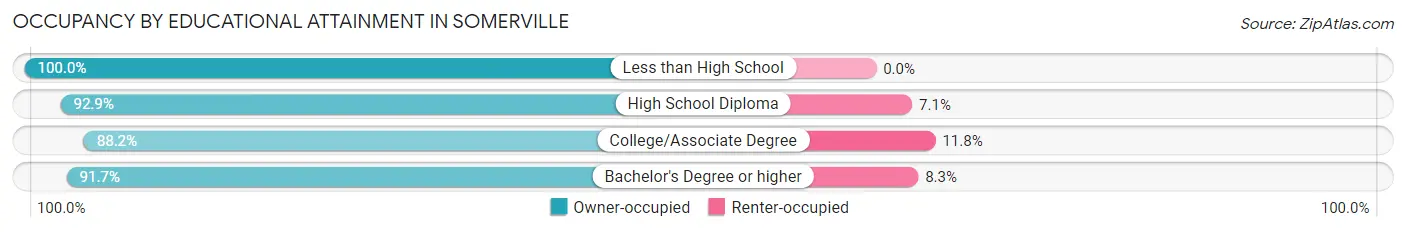
| Household Size | Owner-occupied | Renter-occupied |
| Less than High School | 15 (100.0%) | 0 (0.0%) |
| High School Diploma | 39 (92.9%) | 3 (7.1%) |
| College/Associate Degree | 15 (88.2%) | 2 (11.8%) |
| Bachelor's Degree or higher | 11 (91.7%) | 1 (8.3%) |
Occupancy by Age of Householder in Somerville
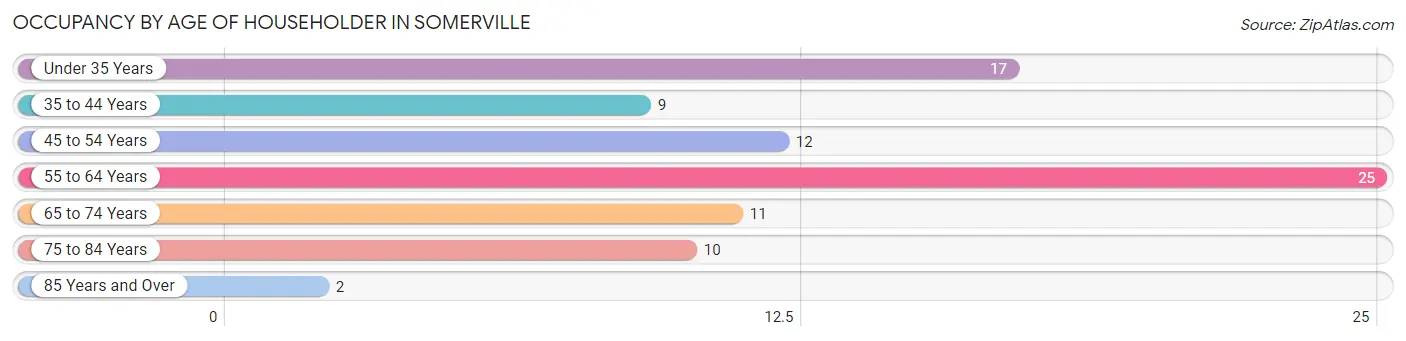
| Age Bracket | # Households | % Households |
| Under 35 Years | 17 | 19.8% |
| 35 to 44 Years | 9 | 10.5% |
| 45 to 54 Years | 12 | 14.0% |
| 55 to 64 Years | 25 | 29.1% |
| 65 to 74 Years | 11 | 12.8% |
| 75 to 84 Years | 10 | 11.6% |
| 85 Years and Over | 2 | 2.3% |
| Total | 86 | 100.0% |
Housing Finances in Somerville
Median Income by Occupancy in Somerville
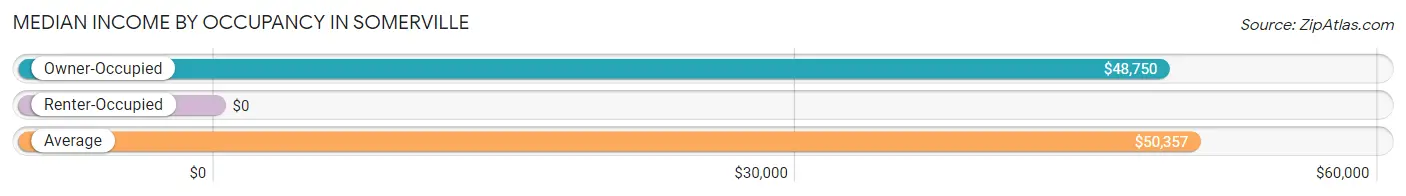
| Occupancy Type | # Households | Median Income |
| Owner-Occupied | 80 (93.0%) | $48,750 |
| Renter-Occupied | 6 (7.0%) | $0 |
| Average | 86 (100.0%) | $50,357 |
Occupancy by Householder Income Bracket in Somerville
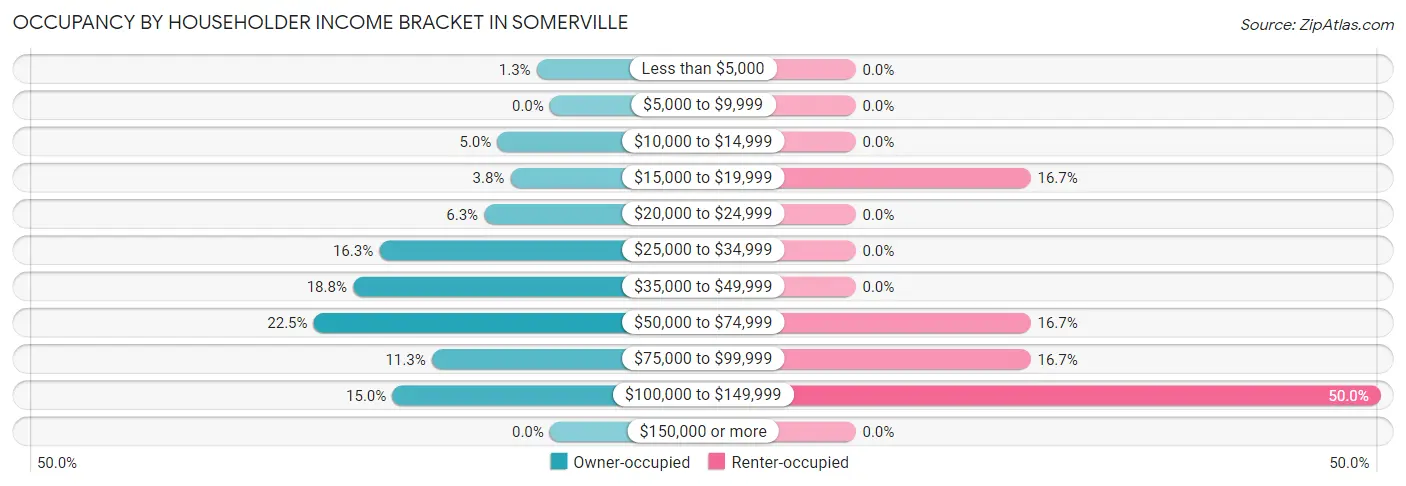
| Income Bracket | Owner-occupied | Renter-occupied |
| Less than $5,000 | 1 (1.3%) | 0 (0.0%) |
| $5,000 to $9,999 | 0 (0.0%) | 0 (0.0%) |
| $10,000 to $14,999 | 4 (5.0%) | 0 (0.0%) |
| $15,000 to $19,999 | 3 (3.7%) | 1 (16.7%) |
| $20,000 to $24,999 | 5 (6.2%) | 0 (0.0%) |
| $25,000 to $34,999 | 13 (16.3%) | 0 (0.0%) |
| $35,000 to $49,999 | 15 (18.8%) | 0 (0.0%) |
| $50,000 to $74,999 | 18 (22.5%) | 1 (16.7%) |
| $75,000 to $99,999 | 9 (11.3%) | 1 (16.7%) |
| $100,000 to $149,999 | 12 (15.0%) | 3 (50.0%) |
| $150,000 or more | 0 (0.0%) | 0 (0.0%) |
| Total | 80 (100.0%) | 6 (100.0%) |
Monthly Housing Cost Tiers in Somerville
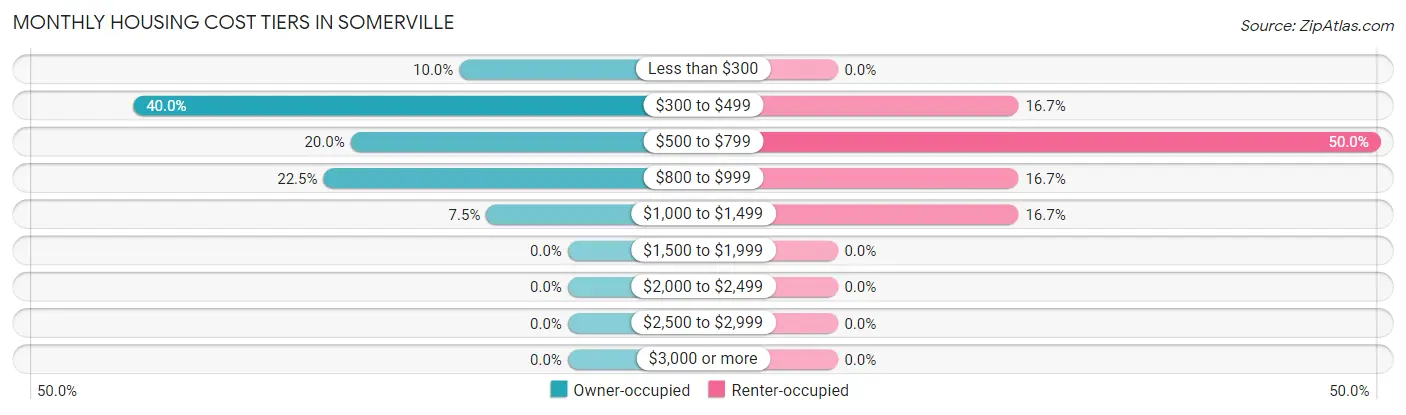
| Monthly Cost | Owner-occupied | Renter-occupied |
| Less than $300 | 8 (10.0%) | 0 (0.0%) |
| $300 to $499 | 32 (40.0%) | 1 (16.7%) |
| $500 to $799 | 16 (20.0%) | 3 (50.0%) |
| $800 to $999 | 18 (22.5%) | 1 (16.7%) |
| $1,000 to $1,499 | 6 (7.5%) | 1 (16.7%) |
| $1,500 to $1,999 | 0 (0.0%) | 0 (0.0%) |
| $2,000 to $2,499 | 0 (0.0%) | 0 (0.0%) |
| $2,500 to $2,999 | 0 (0.0%) | 0 (0.0%) |
| $3,000 or more | 0 (0.0%) | 0 (0.0%) |
| Total | 80 (100.0%) | 6 (100.0%) |
Physical Housing Characteristics in Somerville
Housing Structures in Somerville
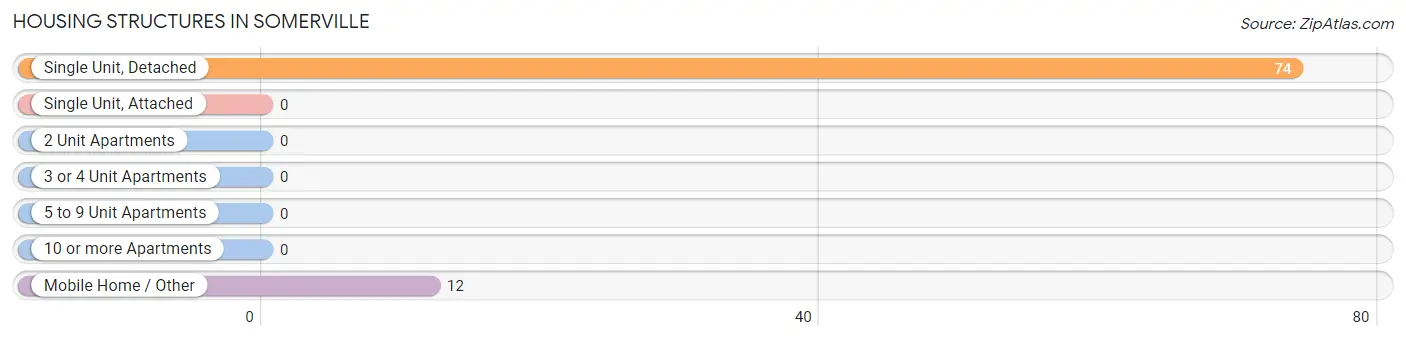
| Structure Type | # Housing Units | % Housing Units |
| Single Unit, Detached | 74 | 86.1% |
| Single Unit, Attached | 0 | 0.0% |
| 2 Unit Apartments | 0 | 0.0% |
| 3 or 4 Unit Apartments | 0 | 0.0% |
| 5 to 9 Unit Apartments | 0 | 0.0% |
| 10 or more Apartments | 0 | 0.0% |
| Mobile Home / Other | 12 | 14.0% |
| Total | 86 | 100.0% |
Housing Structures by Occupancy in Somerville
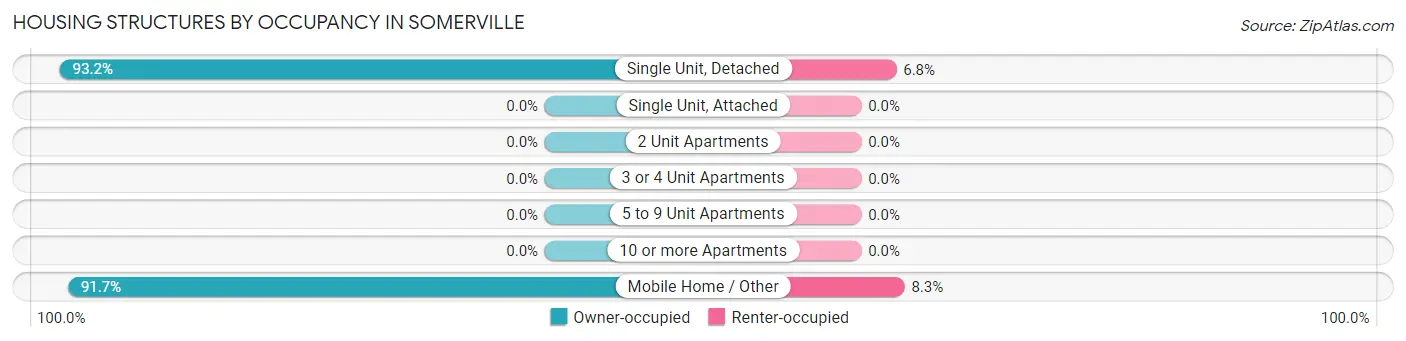
| Structure Type | Owner-occupied | Renter-occupied |
| Single Unit, Detached | 69 (93.2%) | 5 (6.8%) |
| Single Unit, Attached | 0 (0.0%) | 0 (0.0%) |
| 2 Unit Apartments | 0 (0.0%) | 0 (0.0%) |
| 3 or 4 Unit Apartments | 0 (0.0%) | 0 (0.0%) |
| 5 to 9 Unit Apartments | 0 (0.0%) | 0 (0.0%) |
| 10 or more Apartments | 0 (0.0%) | 0 (0.0%) |
| Mobile Home / Other | 11 (91.7%) | 1 (8.3%) |
| Total | 80 (93.0%) | 6 (7.0%) |
Housing Structures by Number of Rooms in Somerville
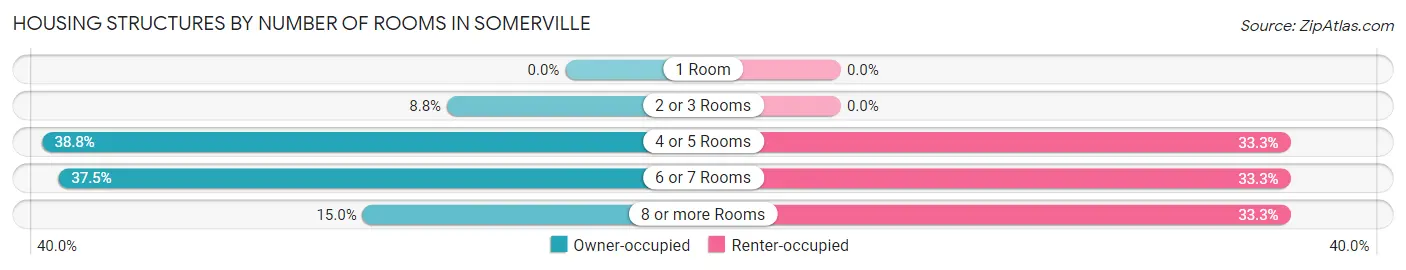
| Number of Rooms | Owner-occupied | Renter-occupied |
| 1 Room | 0 (0.0%) | 0 (0.0%) |
| 2 or 3 Rooms | 7 (8.7%) | 0 (0.0%) |
| 4 or 5 Rooms | 31 (38.8%) | 2 (33.3%) |
| 6 or 7 Rooms | 30 (37.5%) | 2 (33.3%) |
| 8 or more Rooms | 12 (15.0%) | 2 (33.3%) |
| Total | 80 (100.0%) | 6 (100.0%) |
Housing Structure by Heating Type in Somerville
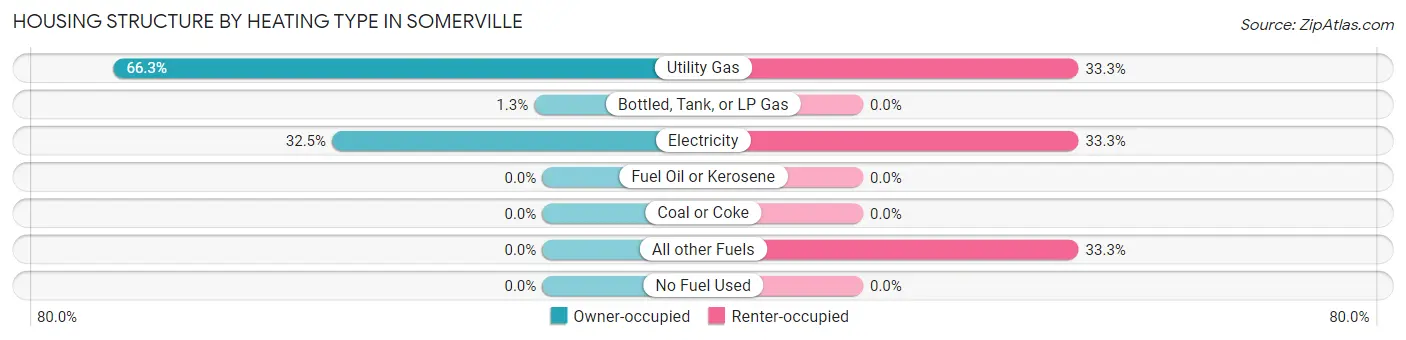
| Heating Type | Owner-occupied | Renter-occupied |
| Utility Gas | 53 (66.2%) | 2 (33.3%) |
| Bottled, Tank, or LP Gas | 1 (1.3%) | 0 (0.0%) |
| Electricity | 26 (32.5%) | 2 (33.3%) |
| Fuel Oil or Kerosene | 0 (0.0%) | 0 (0.0%) |
| Coal or Coke | 0 (0.0%) | 0 (0.0%) |
| All other Fuels | 0 (0.0%) | 2 (33.3%) |
| No Fuel Used | 0 (0.0%) | 0 (0.0%) |
| Total | 80 (100.0%) | 6 (100.0%) |
Household Vehicle Usage in Somerville
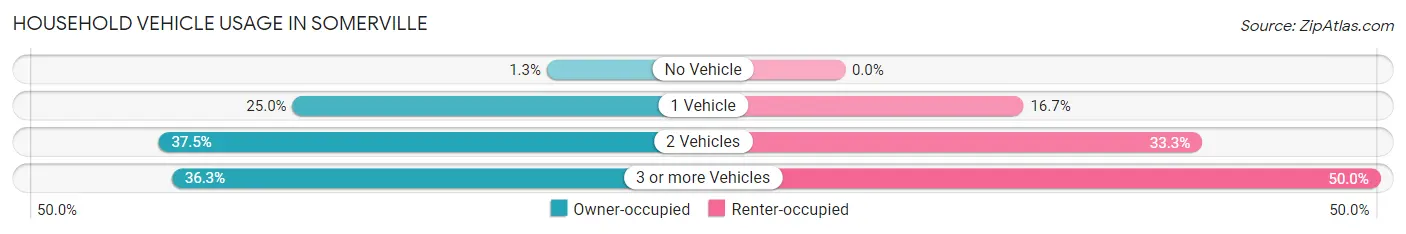
| Vehicles per Household | Owner-occupied | Renter-occupied |
| No Vehicle | 1 (1.3%) | 0 (0.0%) |
| 1 Vehicle | 20 (25.0%) | 1 (16.7%) |
| 2 Vehicles | 30 (37.5%) | 2 (33.3%) |
| 3 or more Vehicles | 29 (36.2%) | 3 (50.0%) |
| Total | 80 (100.0%) | 6 (100.0%) |
Real Estate & Mortgages in Somerville
Real Estate and Mortgage Overview in Somerville
| Characteristic | Without Mortgage | With Mortgage |
| Housing Units | 41 | 39 |
| Median Property Value | $77,500 | $95,000 |
| Median Household Income | $45,750 | $0 |
| Monthly Housing Costs | $409 | $0 |
| Real Estate Taxes | $650 | $2 |
Property Value by Mortgage Status in Somerville
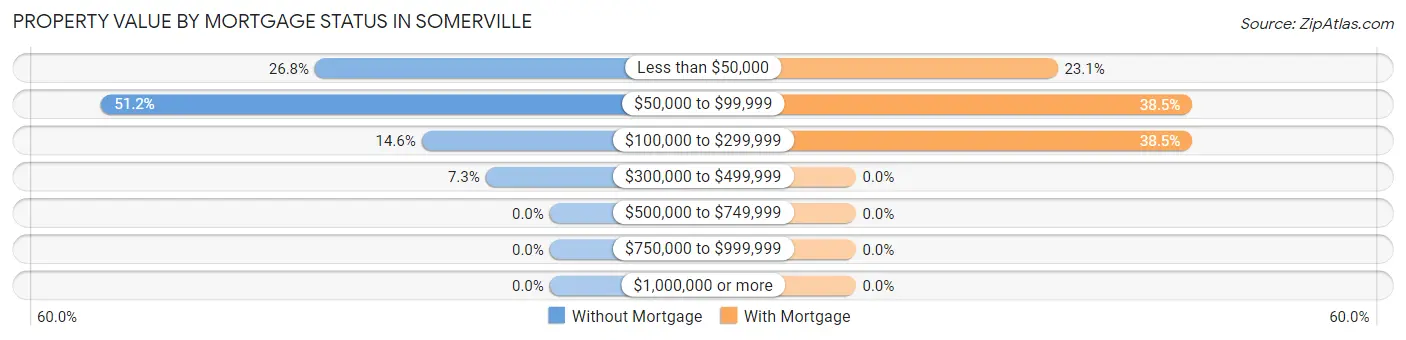
| Property Value | Without Mortgage | With Mortgage |
| Less than $50,000 | 11 (26.8%) | 9 (23.1%) |
| $50,000 to $99,999 | 21 (51.2%) | 15 (38.5%) |
| $100,000 to $299,999 | 6 (14.6%) | 15 (38.5%) |
| $300,000 to $499,999 | 3 (7.3%) | 0 (0.0%) |
| $500,000 to $749,999 | 0 (0.0%) | 0 (0.0%) |
| $750,000 to $999,999 | 0 (0.0%) | 0 (0.0%) |
| $1,000,000 or more | 0 (0.0%) | 0 (0.0%) |
| Total | 41 (100.0%) | 39 (100.0%) |
Household Income by Mortgage Status in Somerville
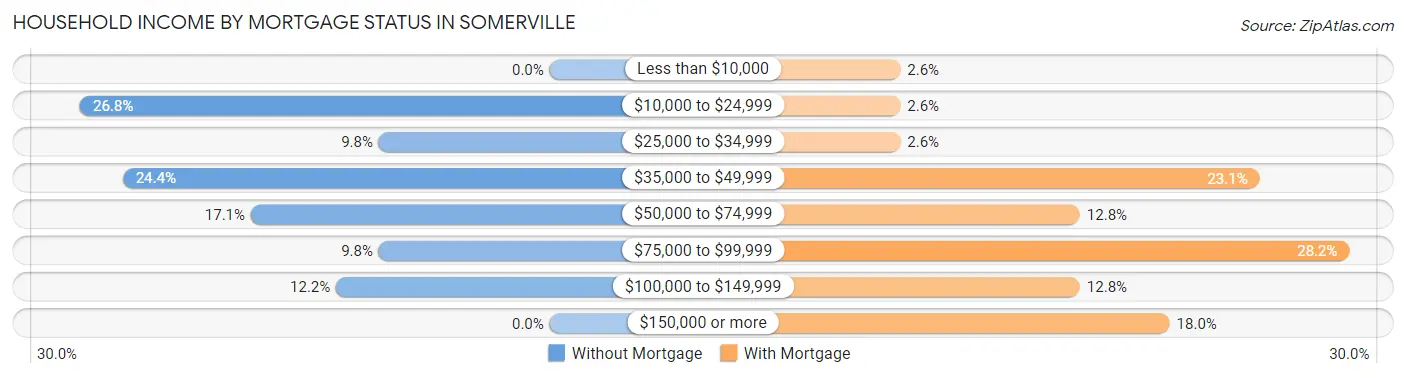
| Household Income | Without Mortgage | With Mortgage |
| Less than $10,000 | 0 (0.0%) | 1 (2.6%) |
| $10,000 to $24,999 | 11 (26.8%) | 1 (2.6%) |
| $25,000 to $34,999 | 4 (9.8%) | 1 (2.6%) |
| $35,000 to $49,999 | 10 (24.4%) | 9 (23.1%) |
| $50,000 to $74,999 | 7 (17.1%) | 5 (12.8%) |
| $75,000 to $99,999 | 4 (9.8%) | 11 (28.2%) |
| $100,000 to $149,999 | 5 (12.2%) | 5 (12.8%) |
| $150,000 or more | 0 (0.0%) | 7 (17.9%) |
| Total | 41 (100.0%) | 39 (100.0%) |
Property Value to Household Income Ratio in Somerville
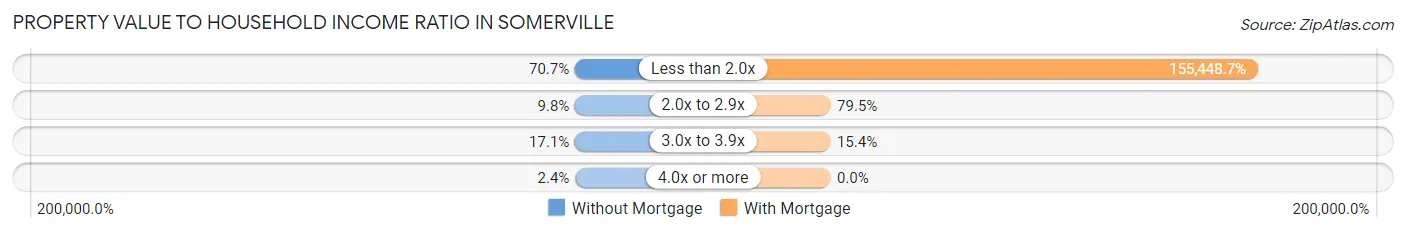
| Value-to-Income Ratio | Without Mortgage | With Mortgage |
| Less than 2.0x | 29 (70.7%) | 60,625 (155,448.7%) |
| 2.0x to 2.9x | 4 (9.8%) | 31 (79.5%) |
| 3.0x to 3.9x | 7 (17.1%) | 6 (15.4%) |
| 4.0x or more | 1 (2.4%) | 0 (0.0%) |
| Total | 41 (100.0%) | 39 (100.0%) |
Real Estate Taxes by Mortgage Status in Somerville
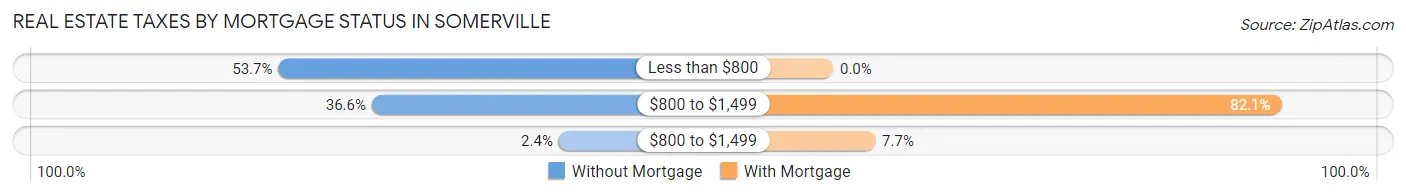
| Property Taxes | Without Mortgage | With Mortgage |
| Less than $800 | 22 (53.7%) | 0 (0.0%) |
| $800 to $1,499 | 15 (36.6%) | 32 (82.1%) |
| $800 to $1,499 | 1 (2.4%) | 3 (7.7%) |
| Total | 41 (100.0%) | 39 (100.0%) |
Health & Disability in Somerville
Health Insurance Coverage by Age in Somerville
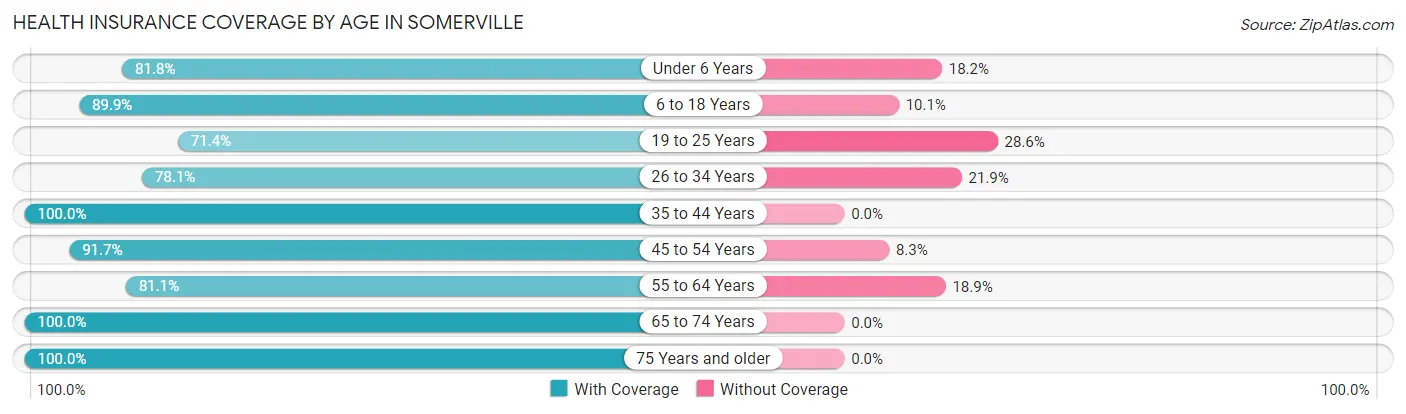
| Age Bracket | With Coverage | Without Coverage |
| Under 6 Years | 18 (81.8%) | 4 (18.2%) |
| 6 to 18 Years | 62 (89.9%) | 7 (10.1%) |
| 19 to 25 Years | 5 (71.4%) | 2 (28.6%) |
| 26 to 34 Years | 25 (78.1%) | 7 (21.9%) |
| 35 to 44 Years | 12 (100.0%) | 0 (0.0%) |
| 45 to 54 Years | 22 (91.7%) | 2 (8.3%) |
| 55 to 64 Years | 43 (81.1%) | 10 (18.9%) |
| 65 to 74 Years | 17 (100.0%) | 0 (0.0%) |
| 75 Years and older | 18 (100.0%) | 0 (0.0%) |
| Total | 222 (87.4%) | 32 (12.6%) |
Health Insurance Coverage by Citizenship Status in Somerville
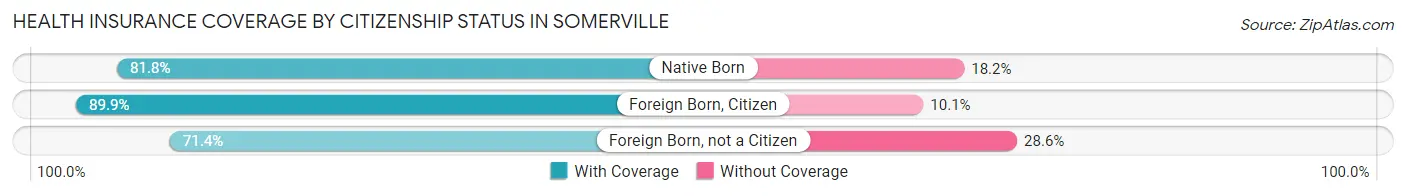
| Citizenship Status | With Coverage | Without Coverage |
| Native Born | 18 (81.8%) | 4 (18.2%) |
| Foreign Born, Citizen | 62 (89.9%) | 7 (10.1%) |
| Foreign Born, not a Citizen | 5 (71.4%) | 2 (28.6%) |
Health Insurance Coverage by Household Income in Somerville
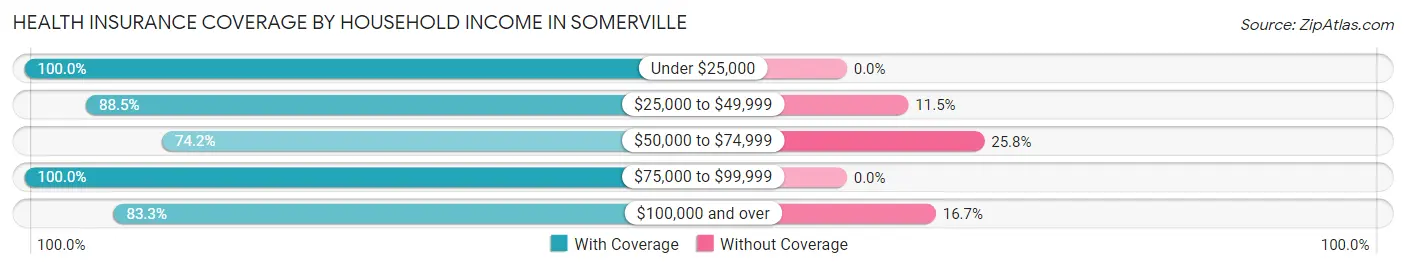
| Household Income | With Coverage | Without Coverage |
| Under $25,000 | 34 (100.0%) | 0 (0.0%) |
| $25,000 to $49,999 | 69 (88.5%) | 9 (11.5%) |
| $50,000 to $74,999 | 49 (74.2%) | 17 (25.8%) |
| $75,000 to $99,999 | 40 (100.0%) | 0 (0.0%) |
| $100,000 and over | 30 (83.3%) | 6 (16.7%) |
Public vs Private Health Insurance Coverage by Age in Somerville
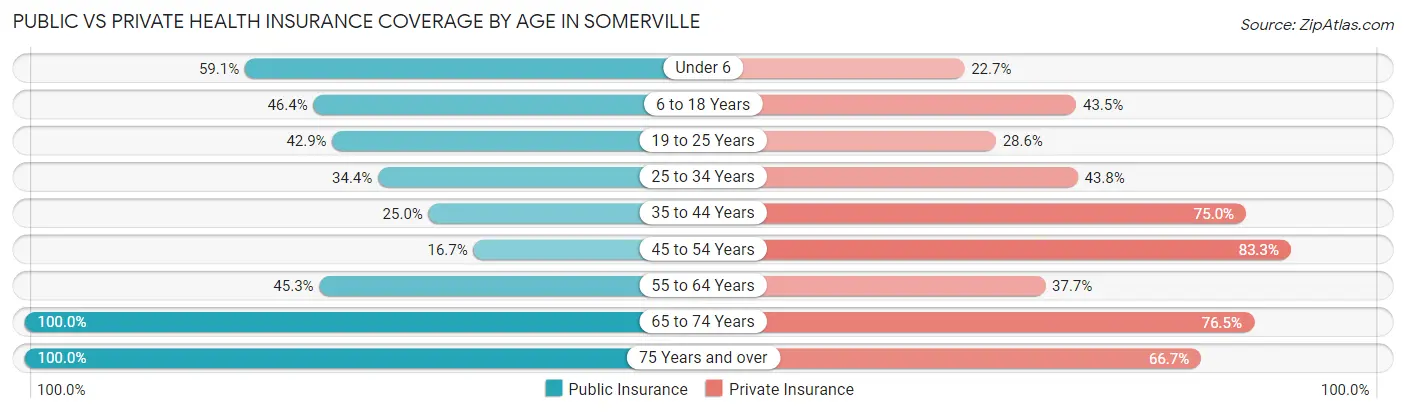
| Age Bracket | Public Insurance | Private Insurance |
| Under 6 | 13 (59.1%) | 5 (22.7%) |
| 6 to 18 Years | 32 (46.4%) | 30 (43.5%) |
| 19 to 25 Years | 3 (42.9%) | 2 (28.6%) |
| 25 to 34 Years | 11 (34.4%) | 14 (43.8%) |
| 35 to 44 Years | 3 (25.0%) | 9 (75.0%) |
| 45 to 54 Years | 4 (16.7%) | 20 (83.3%) |
| 55 to 64 Years | 24 (45.3%) | 20 (37.7%) |
| 65 to 74 Years | 17 (100.0%) | 13 (76.5%) |
| 75 Years and over | 18 (100.0%) | 12 (66.7%) |
| Total | 125 (49.2%) | 125 (49.2%) |
Disability Status by Sex by Age in Somerville
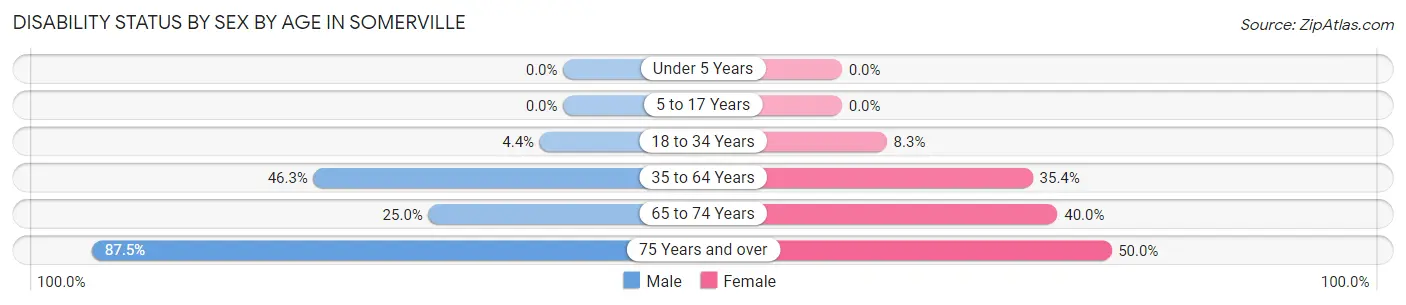
| Age Bracket | Male | Female |
| Under 5 Years | 0 (0.0%) | 0 (0.0%) |
| 5 to 17 Years | 0 (0.0%) | 0 (0.0%) |
| 18 to 34 Years | 1 (4.3%) | 2 (8.3%) |
| 35 to 64 Years | 19 (46.3%) | 17 (35.4%) |
| 65 to 74 Years | 3 (25.0%) | 2 (40.0%) |
| 75 Years and over | 7 (87.5%) | 5 (50.0%) |
Disability Class by Sex by Age in Somerville
Disability Class: Hearing Difficulty
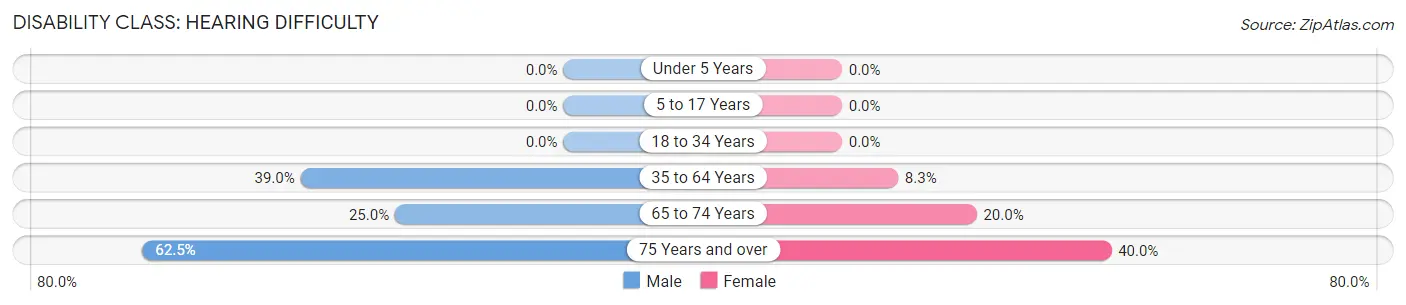
| Age Bracket | Male | Female |
| Under 5 Years | 0 (0.0%) | 0 (0.0%) |
| 5 to 17 Years | 0 (0.0%) | 0 (0.0%) |
| 18 to 34 Years | 0 (0.0%) | 0 (0.0%) |
| 35 to 64 Years | 16 (39.0%) | 4 (8.3%) |
| 65 to 74 Years | 3 (25.0%) | 1 (20.0%) |
| 75 Years and over | 5 (62.5%) | 4 (40.0%) |
Disability Class: Vision Difficulty
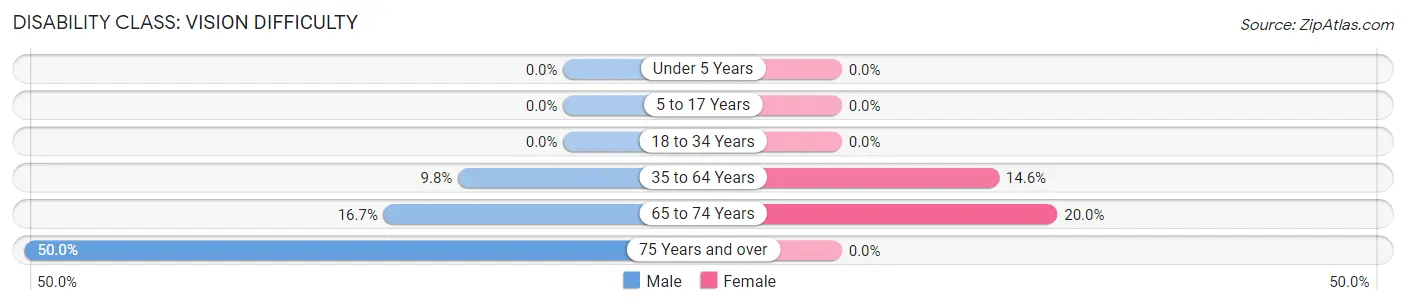
| Age Bracket | Male | Female |
| Under 5 Years | 0 (0.0%) | 0 (0.0%) |
| 5 to 17 Years | 0 (0.0%) | 0 (0.0%) |
| 18 to 34 Years | 0 (0.0%) | 0 (0.0%) |
| 35 to 64 Years | 4 (9.8%) | 7 (14.6%) |
| 65 to 74 Years | 2 (16.7%) | 1 (20.0%) |
| 75 Years and over | 4 (50.0%) | 0 (0.0%) |
Disability Class: Cognitive Difficulty
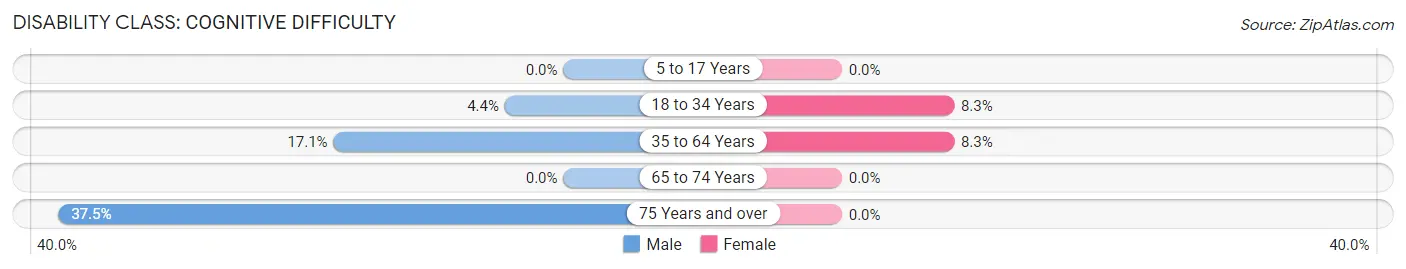
| Age Bracket | Male | Female |
| 5 to 17 Years | 0 (0.0%) | 0 (0.0%) |
| 18 to 34 Years | 1 (4.3%) | 2 (8.3%) |
| 35 to 64 Years | 7 (17.1%) | 4 (8.3%) |
| 65 to 74 Years | 0 (0.0%) | 0 (0.0%) |
| 75 Years and over | 3 (37.5%) | 0 (0.0%) |
Disability Class: Ambulatory Difficulty
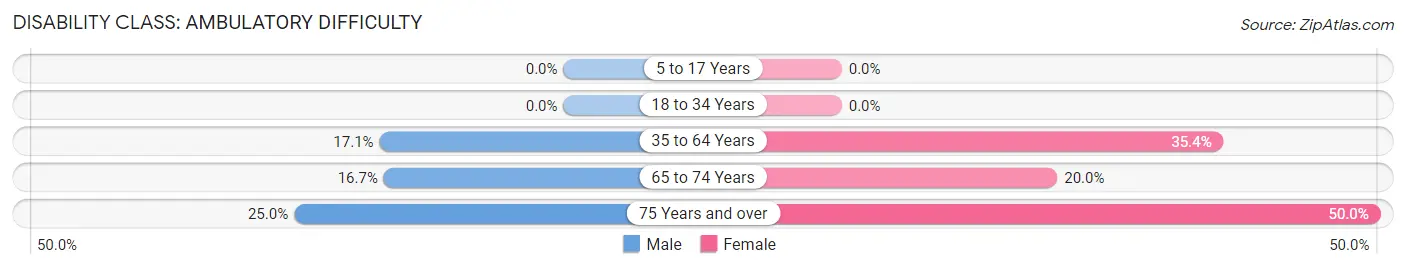
| Age Bracket | Male | Female |
| 5 to 17 Years | 0 (0.0%) | 0 (0.0%) |
| 18 to 34 Years | 0 (0.0%) | 0 (0.0%) |
| 35 to 64 Years | 7 (17.1%) | 17 (35.4%) |
| 65 to 74 Years | 2 (16.7%) | 1 (20.0%) |
| 75 Years and over | 2 (25.0%) | 5 (50.0%) |
Disability Class: Self-Care Difficulty
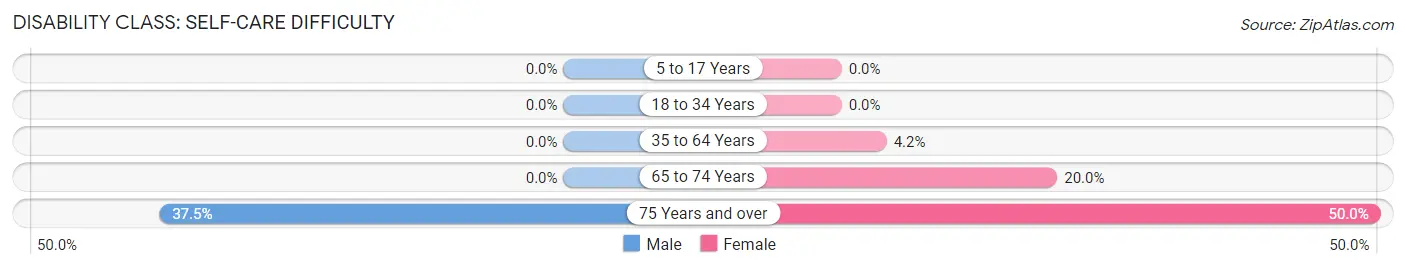
| Age Bracket | Male | Female |
| 5 to 17 Years | 0 (0.0%) | 0 (0.0%) |
| 18 to 34 Years | 0 (0.0%) | 0 (0.0%) |
| 35 to 64 Years | 0 (0.0%) | 2 (4.2%) |
| 65 to 74 Years | 0 (0.0%) | 1 (20.0%) |
| 75 Years and over | 3 (37.5%) | 5 (50.0%) |
Technology Access in Somerville
Computing Device Access in Somerville
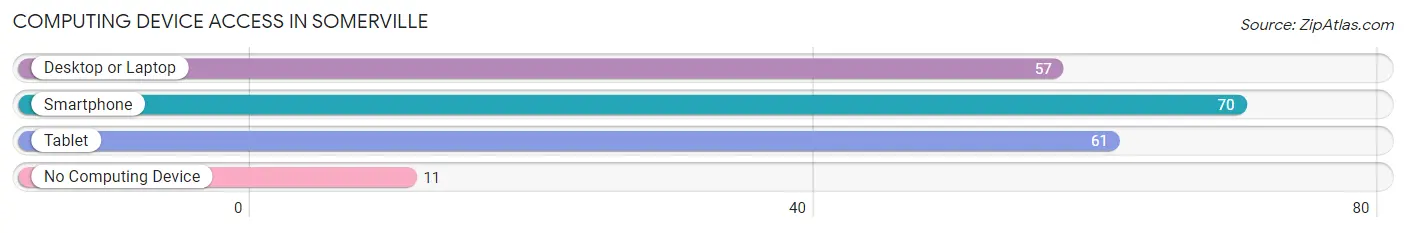
| Device Type | # Households | % Households |
| Desktop or Laptop | 57 | 66.3% |
| Smartphone | 70 | 81.4% |
| Tablet | 61 | 70.9% |
| No Computing Device | 11 | 12.8% |
| Total | 86 | 100.0% |
Internet Access in Somerville
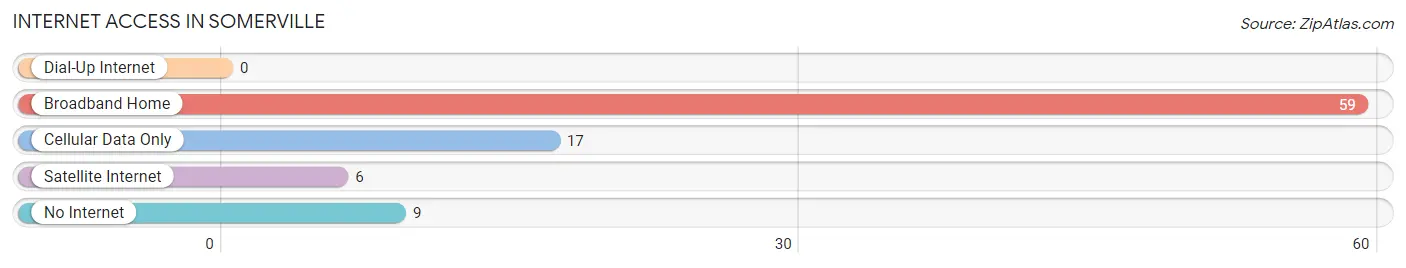
| Internet Type | # Households | % Households |
| Dial-Up Internet | 0 | 0.0% |
| Broadband Home | 59 | 68.6% |
| Cellular Data Only | 17 | 19.8% |
| Satellite Internet | 6 | 7.0% |
| No Internet | 9 | 10.5% |
| Total | 86 | 100.0% |
Somerville Summary
Somerville is a small town located in the state of Indiana, in the United States. It is situated in the southeastern part of the state, in Franklin Township, in Franklin County. The town is located about 25 miles south of Indianapolis, the state capital. As of the 2010 census, the population of Somerville was 1,845.
History
Somerville was founded in 1837 by a group of settlers from North Carolina. The town was named after the nearby Somerville Creek, which was named after a local family. The town was originally a farming community, and the first post office was established in 1838.
In the late 19th century, the town began to grow and develop. The first railroad line was built in 1881, connecting Somerville to Indianapolis. This allowed the town to become a major shipping center for the surrounding area. The town also became a popular tourist destination, with several hotels and resorts being built in the area.
Geography
Somerville is located in southeastern Indiana, in Franklin Township, in Franklin County. The town is situated on the banks of the White River, about 25 miles south of Indianapolis. The town has a total area of 1.2 square miles, all of which is land.
The town is located in a hilly region, with the highest point being the summit of a hill located just south of the town. The town is located in a temperate climate, with hot summers and cold winters.
Economy
Somerville’s economy is largely based on agriculture and tourism. The town is home to several farms, which produce a variety of crops, including corn, soybeans, and wheat. The town is also home to several tourist attractions, including the Somerville Speedway, which hosts auto racing events.
The town is also home to several small businesses, including restaurants, shops, and other services. The town is also home to several manufacturing companies, which produce a variety of products, including furniture, clothing, and automotive parts.
Demographics
As of the 2010 census, the population of Somerville was 1,845. The town has a population density of 1,521 people per square mile. The median age of the population is 38.7 years, and the median household income is $45,945.
The town is predominantly white, with 92.3% of the population being white. The town also has a small Hispanic population, with 4.2% of the population being Hispanic. The town also has a small African American population, with 1.3% of the population being African American.
Conclusion
Somerville is a small town located in southeastern Indiana. The town was founded in 1837 and has a population of 1,845 as of the 2010 census. The town’s economy is largely based on agriculture and tourism, and the town is home to several small businesses and manufacturing companies. The town is predominantly white, with 92.3% of the population being white.
Common Questions
What is Per Capita Income in Somerville?
Per Capita income in Somerville is $20,084.
What is the Median Family Income in Somerville?
Median Family Income in Somerville is $58,750.
What is the Median Household income in Somerville?
Median Household Income in Somerville is $50,357.
What is Income or Wage Gap in Somerville?
Income or Wage Gap in Somerville is 60.4%.
Women in Somerville earn 39.6 cents for every dollar earned by a man.
What is Inequality or Gini Index in Somerville?
Inequality or Gini Index in Somerville is 0.33.
What is the Total Population of Somerville?
Total Population of Somerville is 254.
What is the Total Male Population of Somerville?
Total Male Population of Somerville is 109.
What is the Total Female Population of Somerville?
Total Female Population of Somerville is 145.
What is the Ratio of Males per 100 Females in Somerville?
There are 75.17 Males per 100 Females in Somerville.
What is the Ratio of Females per 100 Males in Somerville?
There are 133.03 Females per 100 Males in Somerville.
What is the Median Population Age in Somerville?
Median Population Age in Somerville is 33.5 Years.
What is the Average Family Size in Somerville
Average Family Size in Somerville is 3.4 People.
What is the Average Household Size in Somerville
Average Household Size in Somerville is 3.0 People.
How Large is the Labor Force in Somerville?
There are 100 People in the Labor Forcein in Somerville.
What is the Percentage of People in the Labor Force in Somerville?
56.5% of People are in the Labor Force in Somerville.
What is the Unemployment Rate in Somerville?
Unemployment Rate in Somerville is 3.0%.