Rockport, IN Map & Demographics
Rockport Map
Rockport Overview
$25,582
PER CAPITA INCOME
$51,793
AVG FAMILY INCOME
$42,585
AVG HOUSEHOLD INCOME
38.4%
WAGE / INCOME GAP [ % ]
61.6¢/ $1
WAGE / INCOME GAP [ $ ]
0.46
INEQUALITY / GINI INDEX
2,183
TOTAL POPULATION
990
MALE POPULATION
1,193
FEMALE POPULATION
82.98
MALES / 100 FEMALES
120.51
FEMALES / 100 MALES
45.0
MEDIAN AGE
3.0
AVG FAMILY SIZE
2.1
AVG HOUSEHOLD SIZE
973
LABOR FORCE [ PEOPLE ]
53.1%
PERCENT IN LABOR FORCE
5.3%
UNEMPLOYMENT RATE
Rockport Zip Codes
Rockport Area Codes
Income in Rockport
Income Overview in Rockport
Per Capita Income in Rockport is $25,582, while median incomes of families and households are $51,793 and $42,585 respectively.
| Characteristic | Number | Measure |
| Per Capita Income | 2,183 | $25,582 |
| Median Family Income | 451 | $51,793 |
| Mean Family Income | 451 | $62,465 |
| Median Household Income | 973 | $42,585 |
| Mean Household Income | 973 | $52,851 |
| Income Deficit | 451 | $0 |
| Wage / Income Gap (%) | 2,183 | 38.43% |
| Wage / Income Gap ($) | 2,183 | 61.57¢ per $1 |
| Gini / Inequality Index | 2,183 | 0.46 |
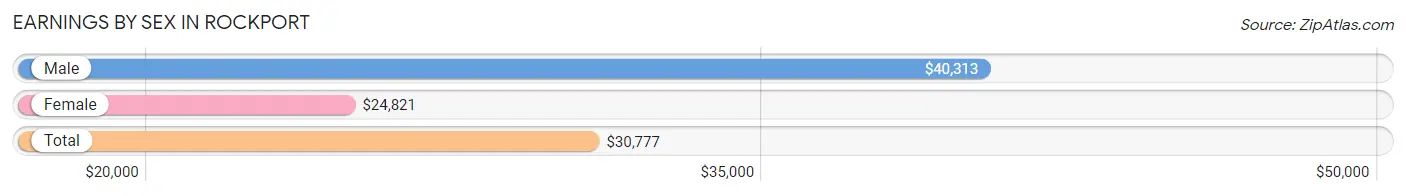
Earnings by Sex in Rockport
Average Earnings in Rockport are $30,777, $40,313 for men and $24,821 for women, a difference of 38.4%.
| Sex | Number | Average Earnings |
| Male | 527 (50.6%) | $40,313 |
| Female | 514 (49.4%) | $24,821 |
| Total | 1,041 (100.0%) | $30,777 |
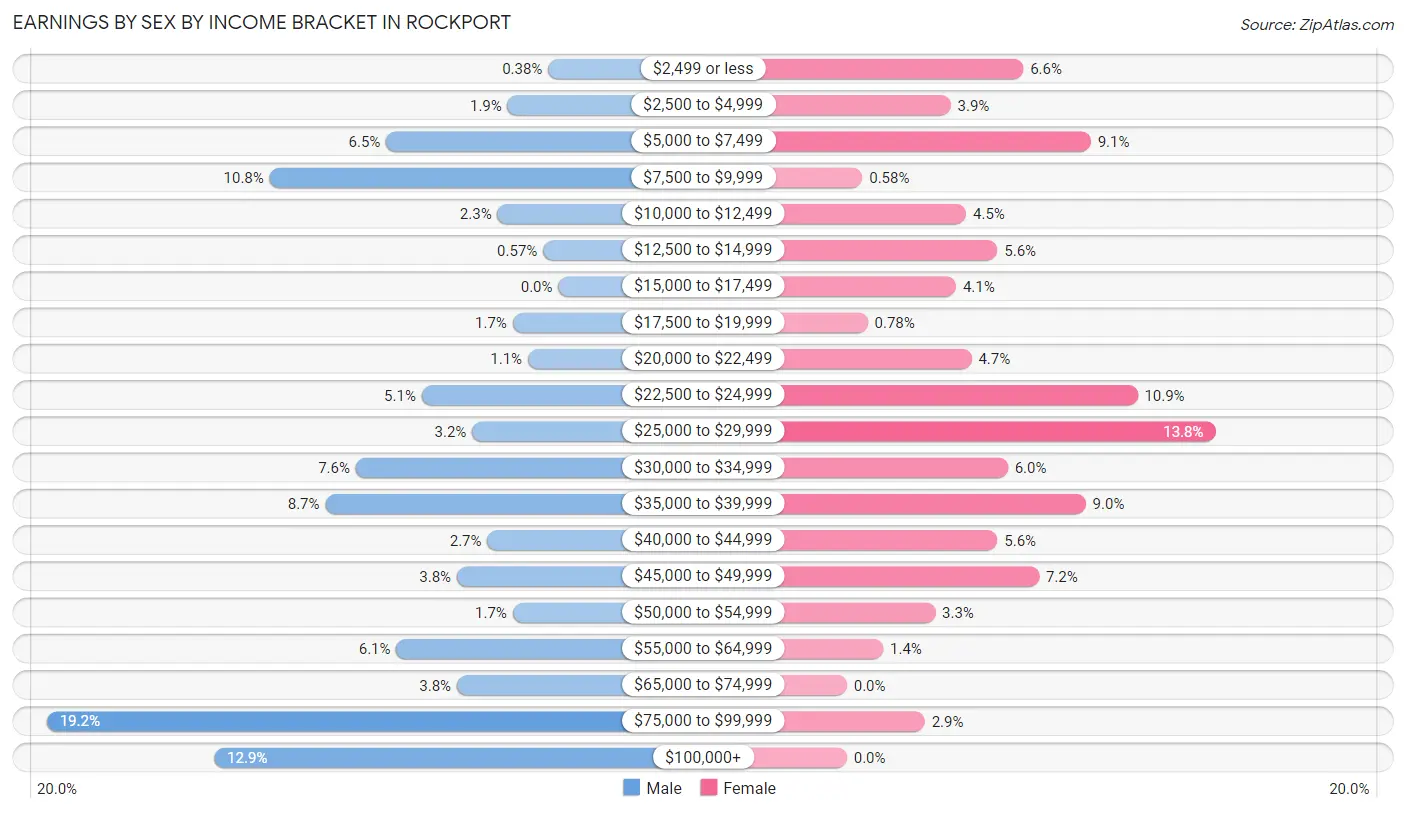
Earnings by Sex by Income Bracket in Rockport
The most common earnings brackets in Rockport are $75,000 to $99,999 for men (101 | 19.2%) and $25,000 to $29,999 for women (71 | 13.8%).
| Income | Male | Female |
| $2,499 or less | 2 (0.4%) | 34 (6.6%) |
| $2,500 to $4,999 | 10 (1.9%) | 20 (3.9%) |
| $5,000 to $7,499 | 34 (6.5%) | 47 (9.1%) |
| $7,500 to $9,999 | 57 (10.8%) | 3 (0.6%) |
| $10,000 to $12,499 | 12 (2.3%) | 23 (4.5%) |
| $12,500 to $14,999 | 3 (0.6%) | 29 (5.6%) |
| $15,000 to $17,499 | 0 (0.0%) | 21 (4.1%) |
| $17,500 to $19,999 | 9 (1.7%) | 4 (0.8%) |
| $20,000 to $22,499 | 6 (1.1%) | 24 (4.7%) |
| $22,500 to $24,999 | 27 (5.1%) | 56 (10.9%) |
| $25,000 to $29,999 | 17 (3.2%) | 71 (13.8%) |
| $30,000 to $34,999 | 40 (7.6%) | 31 (6.0%) |
| $35,000 to $39,999 | 46 (8.7%) | 46 (8.9%) |
| $40,000 to $44,999 | 14 (2.7%) | 29 (5.6%) |
| $45,000 to $49,999 | 20 (3.8%) | 37 (7.2%) |
| $50,000 to $54,999 | 9 (1.7%) | 17 (3.3%) |
| $55,000 to $64,999 | 32 (6.1%) | 7 (1.4%) |
| $65,000 to $74,999 | 20 (3.8%) | 0 (0.0%) |
| $75,000 to $99,999 | 101 (19.2%) | 15 (2.9%) |
| $100,000+ | 68 (12.9%) | 0 (0.0%) |
| Total | 527 (100.0%) | 514 (100.0%) |
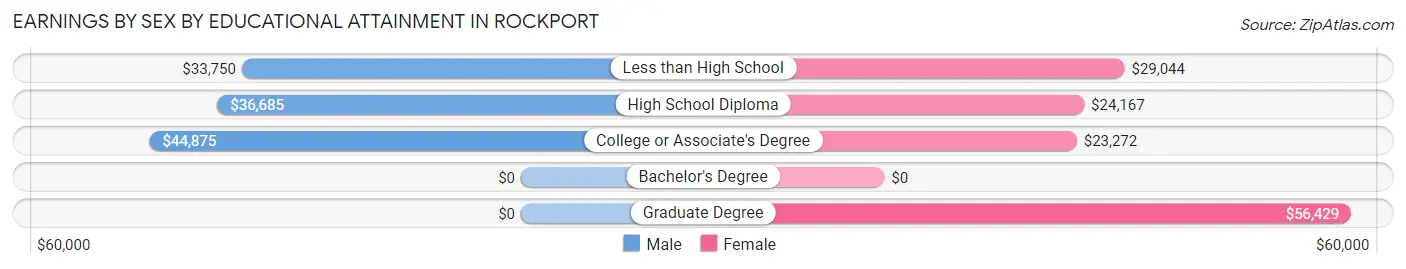
Earnings by Sex by Educational Attainment in Rockport
Average earnings in Rockport are $46,786 for men and $26,379 for women, a difference of 43.6%. Men with an educational attainment of college or associate's degree enjoy the highest average annual earnings of $44,875, while those with less than high school education earn the least with $33,750. Women with an educational attainment of graduate degree earn the most with the average annual earnings of $56,429, while those with college or associate's degree education have the smallest earnings of $23,272.
| Educational Attainment | Male Income | Female Income |
| Less than High School | $33,750 | $29,044 |
| High School Diploma | $36,685 | $24,167 |
| College or Associate's Degree | $44,875 | $23,272 |
| Bachelor's Degree | - | - |
| Graduate Degree | - | - |
| Total | $46,786 | $26,379 |
Family Income in Rockport
Family Income Brackets in Rockport
According to the Rockport family income data, there are 101 families falling into the $50,000 to $74,999 income range, which is the most common income bracket and makes up 22.4% of all families. Conversely, the $200,000+ income bracket is the least frequent group with only 4 families (0.9%) belonging to this category.
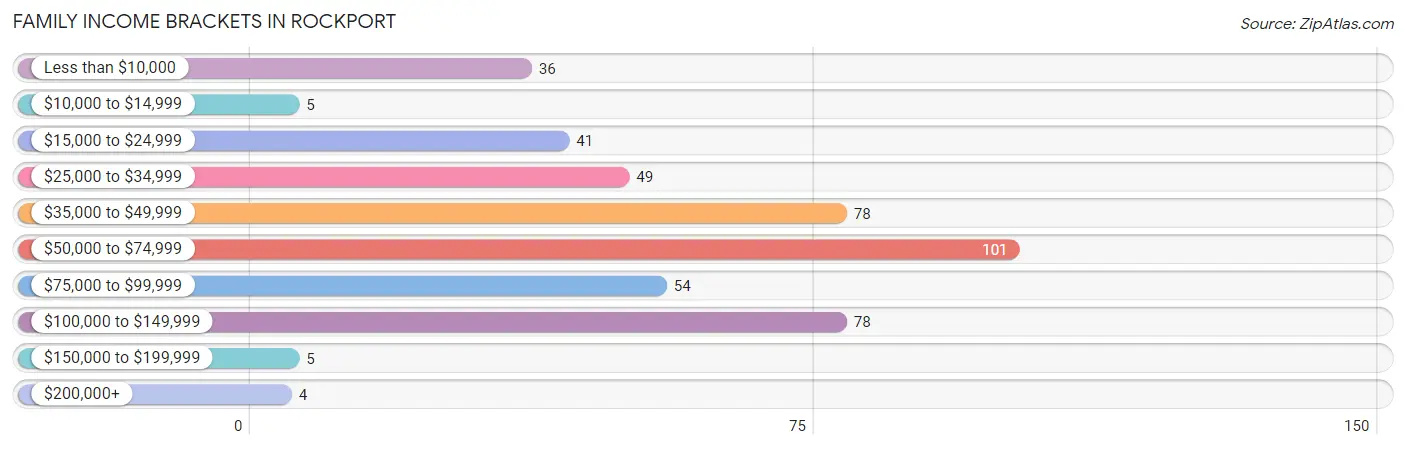
| Income Bracket | # Families | % Families |
| Less than $10,000 | 36 | 8.0% |
| $10,000 to $14,999 | 5 | 1.1% |
| $15,000 to $24,999 | 41 | 9.1% |
| $25,000 to $34,999 | 49 | 10.9% |
| $35,000 to $49,999 | 78 | 17.3% |
| $50,000 to $74,999 | 101 | 22.4% |
| $75,000 to $99,999 | 54 | 12.0% |
| $100,000 to $149,999 | 78 | 17.3% |
| $150,000 to $199,999 | 5 | 1.1% |
| $200,000+ | 4 | 0.9% |
Family Income by Famaliy Size in Rockport
4-person families (61 | 13.5%) account for the highest median family income in Rockport with $59,338 per family, while 2-person families (233 | 51.7%) have the highest median income of $26,920 per family member.
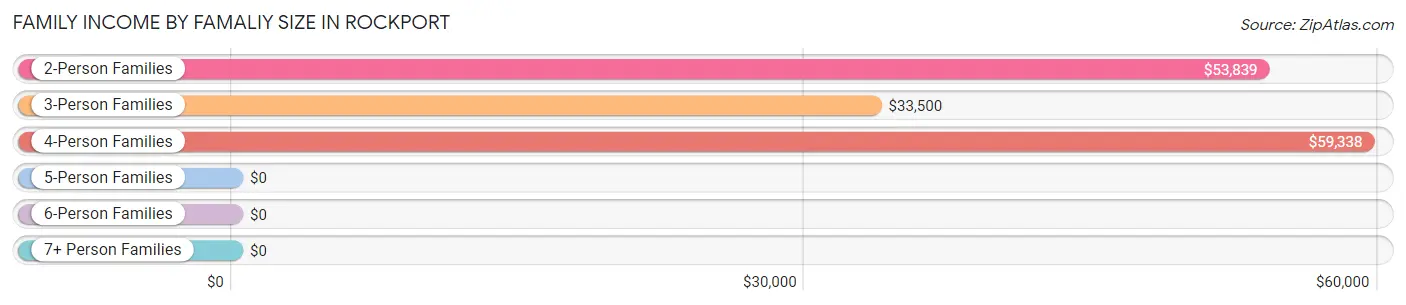
| Income Bracket | # Families | Median Income |
| 2-Person Families | 233 (51.7%) | $53,839 |
| 3-Person Families | 124 (27.5%) | $33,500 |
| 4-Person Families | 61 (13.5%) | $59,338 |
| 5-Person Families | 26 (5.8%) | $0 |
| 6-Person Families | 7 (1.5%) | $0 |
| 7+ Person Families | 0 (0.0%) | $0 |
| Total | 451 (100.0%) | $51,793 |
Family Income by Number of Earners in Rockport
The median family income in Rockport is $51,793, with families comprising 2 earners (148) having the highest median family income of $69,773, while families with no earners (74) have the lowest median family income of $23,281, accounting for 32.8% and 16.4% of families, respectively.
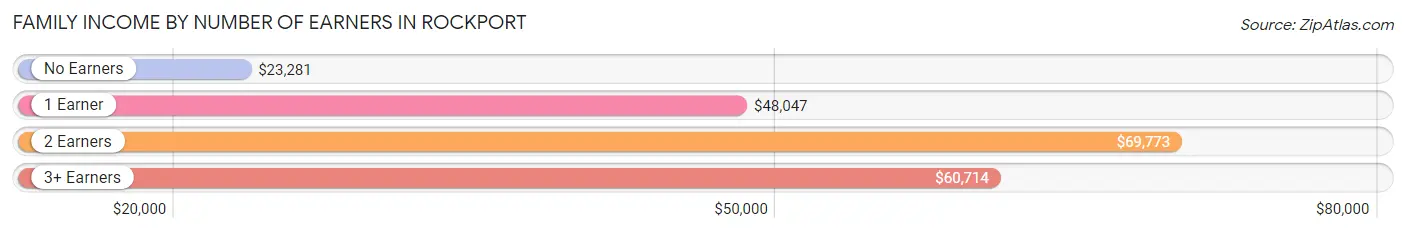
| Number of Earners | # Families | Median Income |
| No Earners | 74 (16.4%) | $23,281 |
| 1 Earner | 193 (42.8%) | $48,047 |
| 2 Earners | 148 (32.8%) | $69,773 |
| 3+ Earners | 36 (8.0%) | $60,714 |
| Total | 451 (100.0%) | $51,793 |
Household Income in Rockport
Household Income Brackets in Rockport
With 162 households falling in the category, the $35,000 to $49,999 income range is the most frequent in Rockport, accounting for 16.7% of all households. In contrast, only 4 households (0.4%) fall into the $200,000+ income bracket, making it the least populous group.
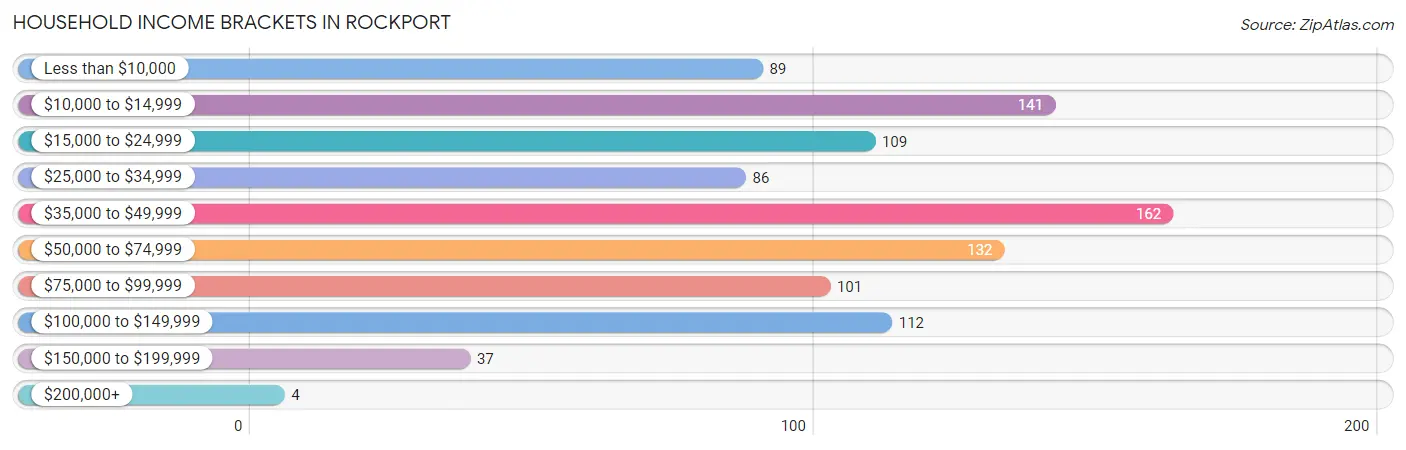
| Income Bracket | # Households | % Households |
| Less than $10,000 | 89 | 9.1% |
| $10,000 to $14,999 | 141 | 14.5% |
| $15,000 to $24,999 | 109 | 11.2% |
| $25,000 to $34,999 | 86 | 8.8% |
| $35,000 to $49,999 | 162 | 16.6% |
| $50,000 to $74,999 | 132 | 13.6% |
| $75,000 to $99,999 | 101 | 10.4% |
| $100,000 to $149,999 | 112 | 11.5% |
| $150,000 to $199,999 | 37 | 3.8% |
| $200,000+ | 4 | 0.4% |
Household Income by Householder Age in Rockport
The median household income in Rockport is $42,585, with the highest median household income of $53,304 found in the 25 to 44 years age bracket for the primary householder. A total of 257 households (26.4%) fall into this category. Meanwhile, the 15 to 24 years age bracket for the primary householder has the lowest median household income of $0, with 13 households (1.3%) in this group.
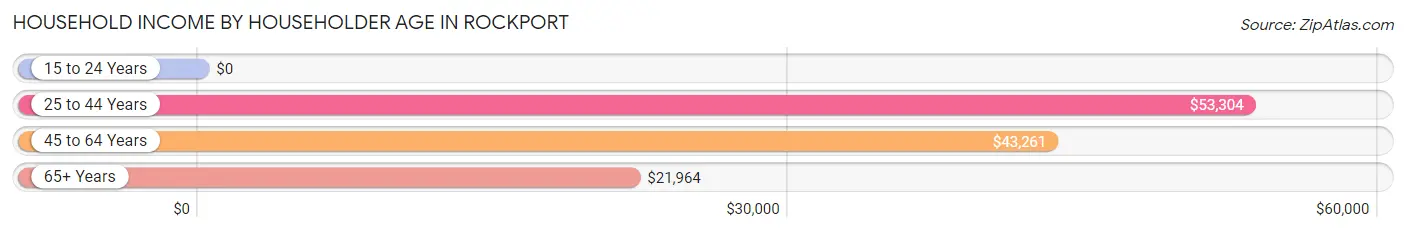
| Income Bracket | # Households | Median Income |
| 15 to 24 Years | 13 (1.3%) | $0 |
| 25 to 44 Years | 257 (26.4%) | $53,304 |
| 45 to 64 Years | 432 (44.4%) | $43,261 |
| 65+ Years | 271 (27.9%) | $21,964 |
| Total | 973 (100.0%) | $42,585 |
Poverty in Rockport
Income Below Poverty by Sex and Age in Rockport
With 14.2% poverty level for males and 24.5% for females among the residents of Rockport, 5 year old males and 18 to 24 year old females are the most vulnerable to poverty, with 15 males (100.0%) and 27 females (40.9%) in their respective age groups living below the poverty level.
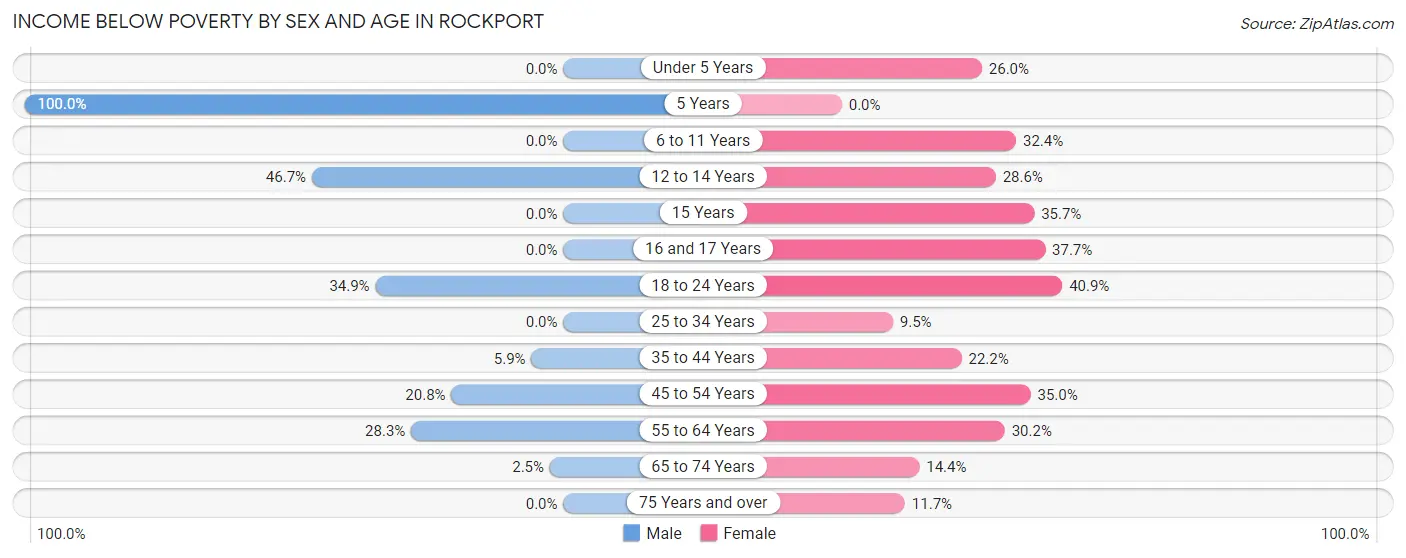
| Age Bracket | Male | Female |
| Under 5 Years | 0 (0.0%) | 13 (26.0%) |
| 5 Years | 15 (100.0%) | 0 (0.0%) |
| 6 to 11 Years | 0 (0.0%) | 11 (32.4%) |
| 12 to 14 Years | 14 (46.7%) | 12 (28.6%) |
| 15 Years | 0 (0.0%) | 5 (35.7%) |
| 16 and 17 Years | 0 (0.0%) | 20 (37.7%) |
| 18 to 24 Years | 15 (34.9%) | 27 (40.9%) |
| 25 to 34 Years | 0 (0.0%) | 11 (9.5%) |
| 35 to 44 Years | 8 (5.9%) | 28 (22.2%) |
| 45 to 54 Years | 16 (20.8%) | 55 (35.0%) |
| 55 to 64 Years | 63 (28.2%) | 62 (30.2%) |
| 65 to 74 Years | 2 (2.5%) | 19 (14.4%) |
| 75 Years and over | 0 (0.0%) | 13 (11.7%) |
| Total | 133 (14.2%) | 276 (24.5%) |
Income Above Poverty by Sex and Age in Rockport
According to the poverty statistics in Rockport, males aged under 5 years and females aged 5 years are the age groups that are most secure financially, with 100.0% of males and 100.0% of females in these age groups living above the poverty line.
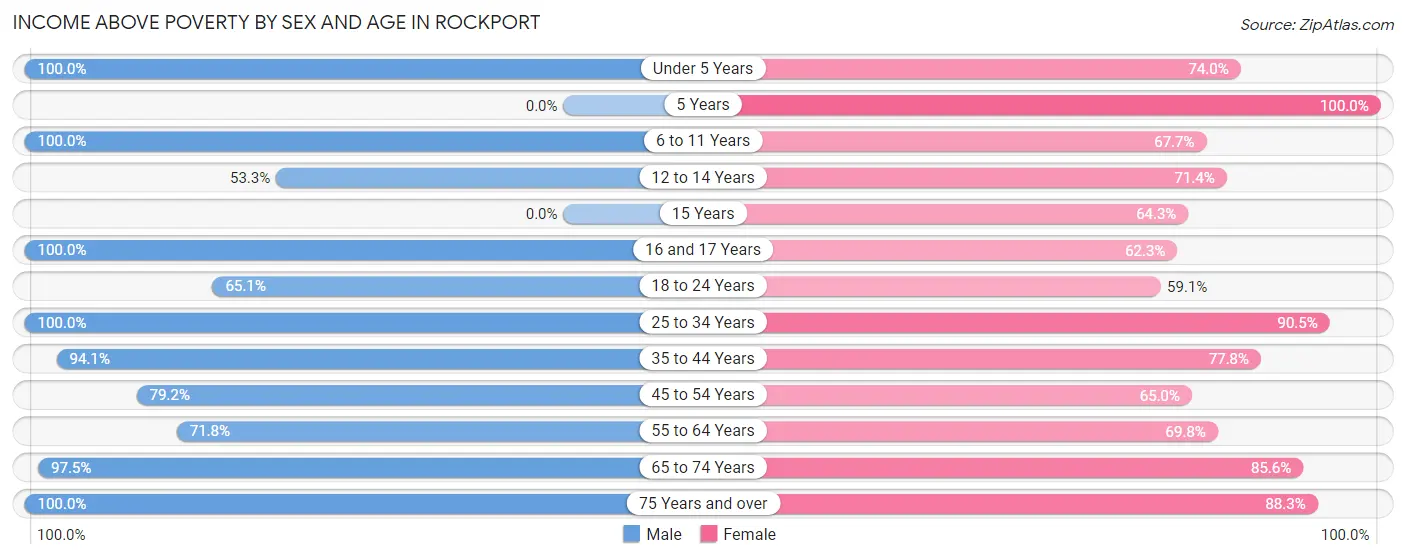
| Age Bracket | Male | Female |
| Under 5 Years | 50 (100.0%) | 37 (74.0%) |
| 5 Years | 0 (0.0%) | 19 (100.0%) |
| 6 to 11 Years | 78 (100.0%) | 23 (67.6%) |
| 12 to 14 Years | 16 (53.3%) | 30 (71.4%) |
| 15 Years | 0 (0.0%) | 9 (64.3%) |
| 16 and 17 Years | 20 (100.0%) | 33 (62.3%) |
| 18 to 24 Years | 28 (65.1%) | 39 (59.1%) |
| 25 to 34 Years | 139 (100.0%) | 105 (90.5%) |
| 35 to 44 Years | 127 (94.1%) | 98 (77.8%) |
| 45 to 54 Years | 61 (79.2%) | 102 (65.0%) |
| 55 to 64 Years | 160 (71.8%) | 143 (69.8%) |
| 65 to 74 Years | 78 (97.5%) | 113 (85.6%) |
| 75 Years and over | 44 (100.0%) | 98 (88.3%) |
| Total | 801 (85.8%) | 849 (75.5%) |
Income Below Poverty Among Married-Couple Families in Rockport
The poverty statistics for married-couple families in Rockport show that 3.2% or 7 of the total 220 families live below the poverty line. Families with 1 or 2 children have the highest poverty rate of 7.9%, comprising of 5 families. On the other hand, families with 3 or 4 children have the lowest poverty rate of 0.0%, which includes 0 families.
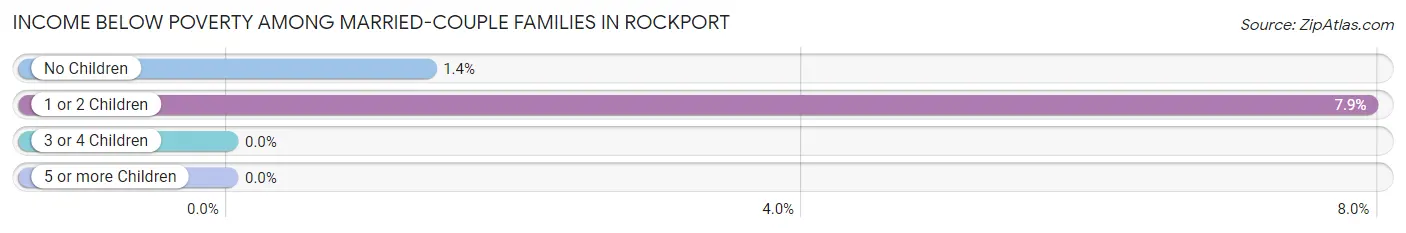
| Children | Above Poverty | Below Poverty |
| No Children | 143 (98.6%) | 2 (1.4%) |
| 1 or 2 Children | 58 (92.1%) | 5 (7.9%) |
| 3 or 4 Children | 12 (100.0%) | 0 (0.0%) |
| 5 or more Children | 0 (0.0%) | 0 (0.0%) |
| Total | 213 (96.8%) | 7 (3.2%) |
Income Below Poverty Among Single-Parent Households in Rockport
According to the poverty data in Rockport, 11.4% or 8 single-father households and 30.4% or 49 single-mother households are living below the poverty line. Among single-father households, those with 1 or 2 children have the highest poverty rate, with 8 households (17.4%) experiencing poverty. Likewise, among single-mother households, those with 1 or 2 children have the highest poverty rate, with 49 households (42.6%) falling below the poverty line.
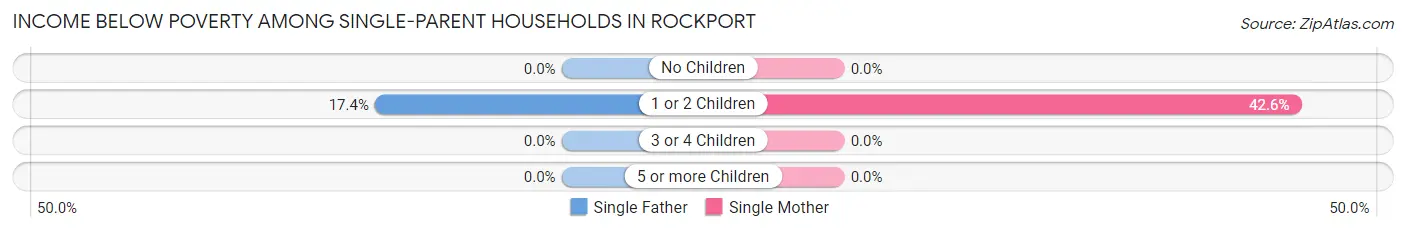
| Children | Single Father | Single Mother |
| No Children | 0 (0.0%) | 0 (0.0%) |
| 1 or 2 Children | 8 (17.4%) | 49 (42.6%) |
| 3 or 4 Children | 0 (0.0%) | 0 (0.0%) |
| 5 or more Children | 0 (0.0%) | 0 (0.0%) |
| Total | 8 (11.4%) | 49 (30.4%) |
Income Below Poverty Among Married-Couple vs Single-Parent Households in Rockport
The poverty data for Rockport shows that 7 of the married-couple family households (3.2%) and 57 of the single-parent households (24.7%) are living below the poverty level. Within the married-couple family households, those with 1 or 2 children have the highest poverty rate, with 5 households (7.9%) falling below the poverty line. Among the single-parent households, those with 1 or 2 children have the highest poverty rate, with 57 household (35.4%) living below poverty.
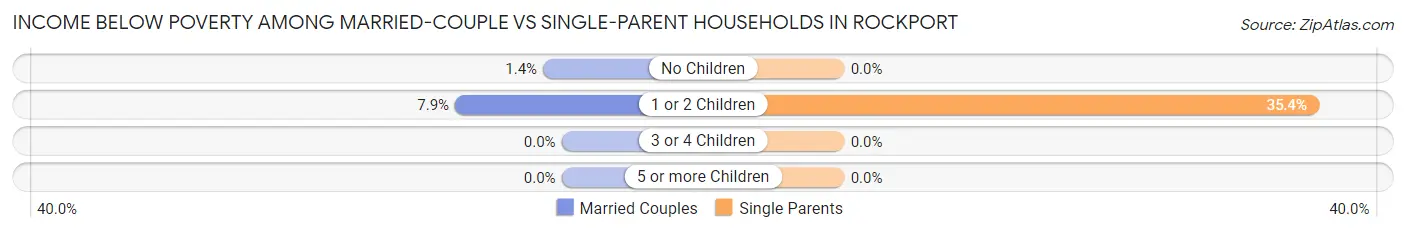
| Children | Married-Couple Families | Single-Parent Households |
| No Children | 2 (1.4%) | 0 (0.0%) |
| 1 or 2 Children | 5 (7.9%) | 57 (35.4%) |
| 3 or 4 Children | 0 (0.0%) | 0 (0.0%) |
| 5 or more Children | 0 (0.0%) | 0 (0.0%) |
| Total | 7 (3.2%) | 57 (24.7%) |
Race in Rockport
The most populous races in Rockport are White / Caucasian (1,995 | 91.4%), Two or more Races (103 | 4.7%), and Black / African American (64 | 2.9%).
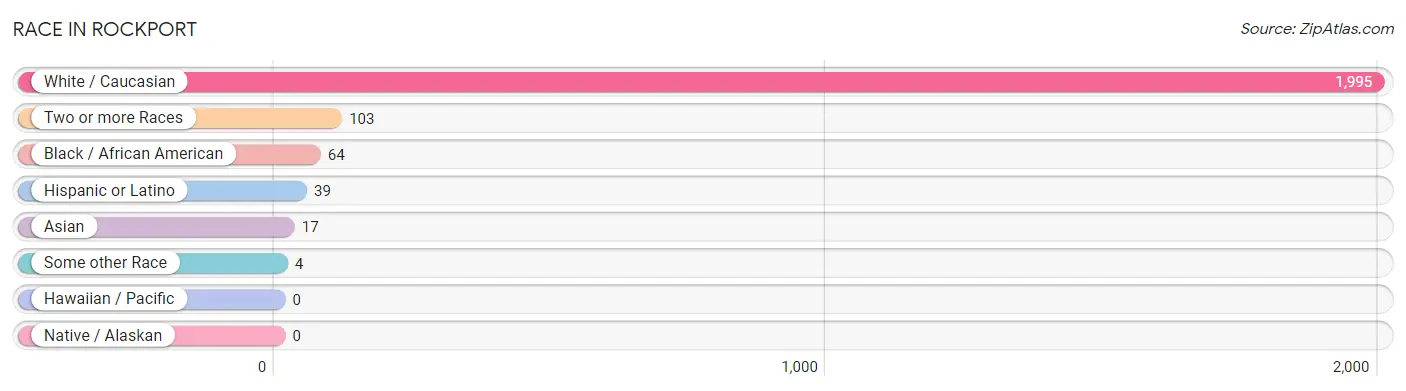
| Race | # Population | % Population |
| Asian | 17 | 0.8% |
| Black / African American | 64 | 2.9% |
| Hawaiian / Pacific | 0 | 0.0% |
| Hispanic or Latino | 39 | 1.8% |
| Native / Alaskan | 0 | 0.0% |
| White / Caucasian | 1,995 | 91.4% |
| Two or more Races | 103 | 4.7% |
| Some other Race | 4 | 0.2% |
| Total | 2,183 | 100.0% |
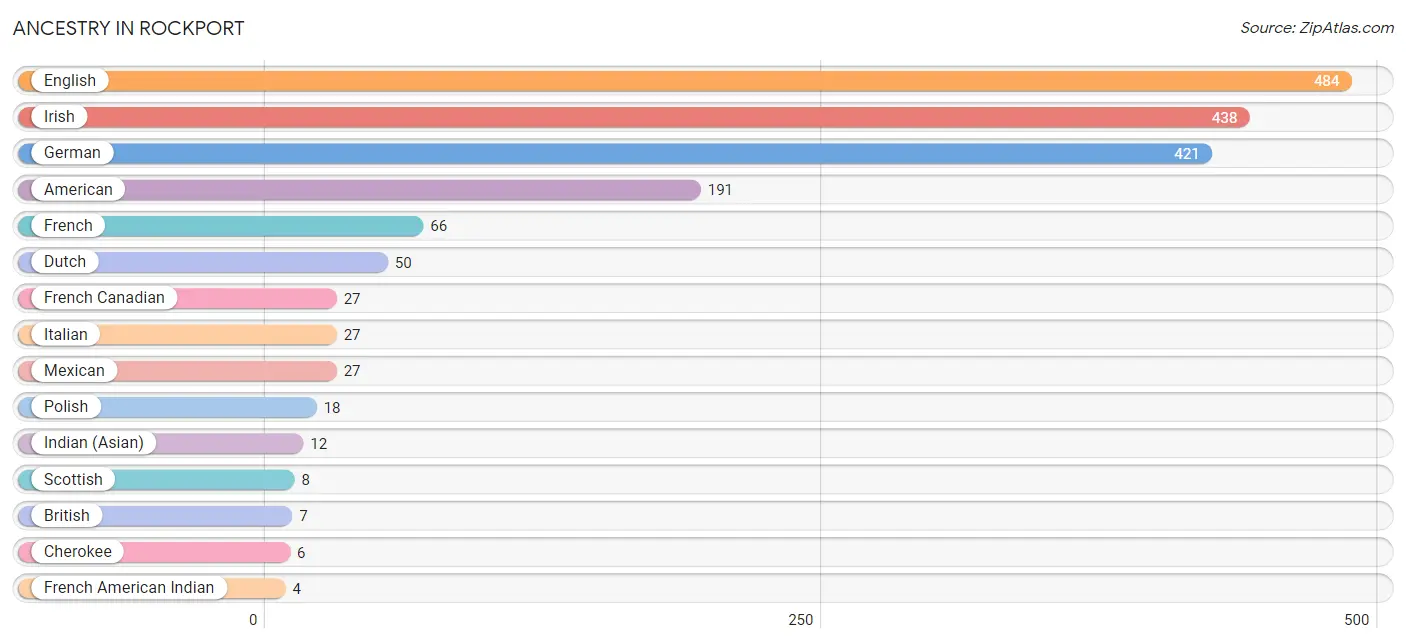
Ancestry in Rockport
The most populous ancestries reported in Rockport are English (484 | 22.2%), Irish (438 | 20.1%), German (421 | 19.3%), American (191 | 8.7%), and French (66 | 3.0%), together accounting for 73.3% of all Rockport residents.
| Ancestry | # Population | % Population |
| African | 3 | 0.1% |
| American | 191 | 8.7% |
| Apache | 2 | 0.1% |
| British | 7 | 0.3% |
| Cherokee | 6 | 0.3% |
| Dutch | 50 | 2.3% |
| English | 484 | 22.2% |
| European | 2 | 0.1% |
| Finnish | 2 | 0.1% |
| French | 66 | 3.0% |
| French American Indian | 4 | 0.2% |
| French Canadian | 27 | 1.2% |
| German | 421 | 19.3% |
| Hungarian | 4 | 0.2% |
| Indian (Asian) | 12 | 0.5% |
| Irish | 438 | 20.1% |
| Israeli | 2 | 0.1% |
| Italian | 27 | 1.2% |
| Mexican | 27 | 1.2% |
| Polish | 18 | 0.8% |
| Scottish | 8 | 0.4% |
| Serbian | 3 | 0.1% |
| Sri Lankan | 4 | 0.2% |
| Subsaharan African | 3 | 0.1% |
| Thai | 1 | 0.1% | View All 25 Rows |
Immigrants in Rockport
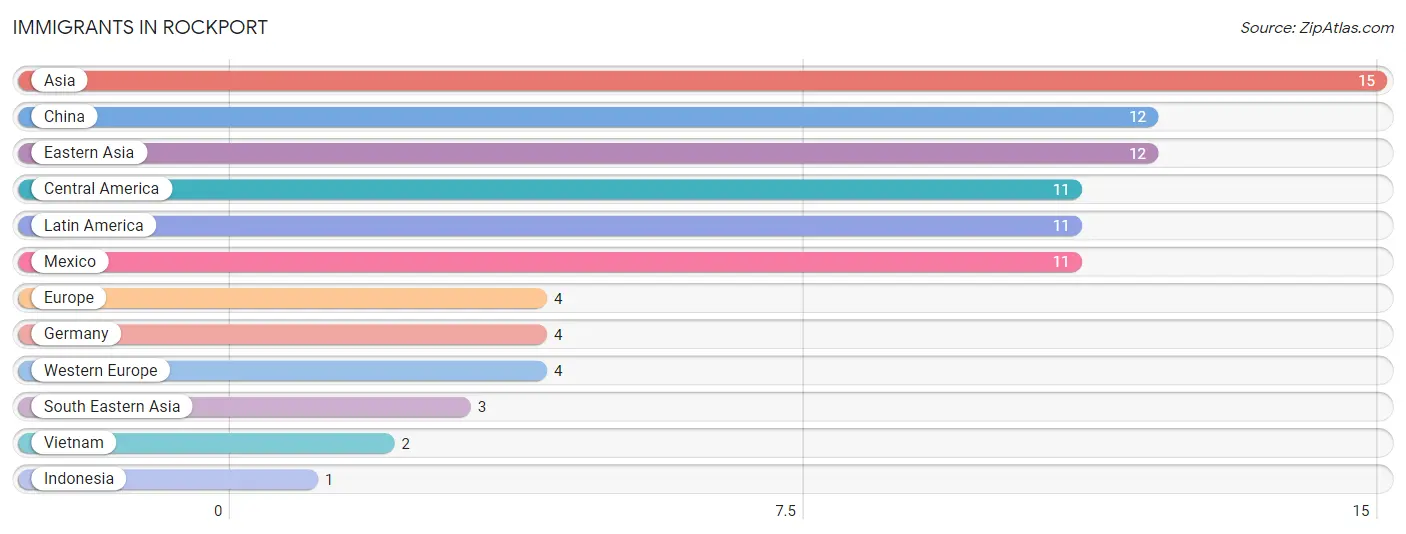
The most numerous immigrant groups reported in Rockport came from Asia (15 | 0.7%), China (12 | 0.5%), Eastern Asia (12 | 0.5%), Central America (11 | 0.5%), and Latin America (11 | 0.5%), together accounting for 2.8% of all Rockport residents.
| Immigration Origin | # Population | % Population |
| Asia | 15 | 0.7% |
| Central America | 11 | 0.5% |
| China | 12 | 0.5% |
| Eastern Asia | 12 | 0.5% |
| Europe | 4 | 0.2% |
| Germany | 4 | 0.2% |
| Indonesia | 1 | 0.1% |
| Latin America | 11 | 0.5% |
| Mexico | 11 | 0.5% |
| South Eastern Asia | 3 | 0.1% |
| Vietnam | 2 | 0.1% |
| Western Europe | 4 | 0.2% | View All 12 Rows |
Sex and Age in Rockport
Sex and Age in Rockport
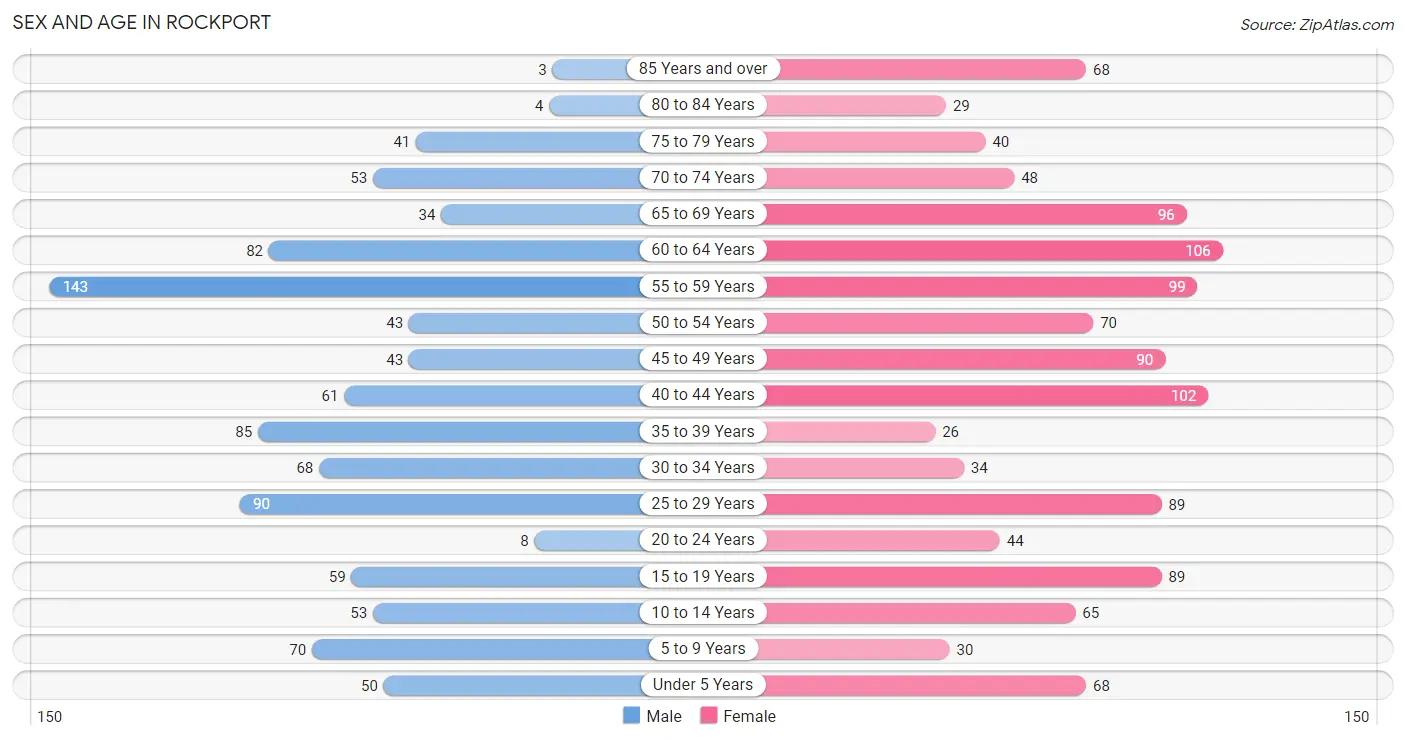
The most populous age groups in Rockport are 55 to 59 Years (143 | 14.4%) for men and 60 to 64 Years (106 | 8.9%) for women.
| Age Bracket | Male | Female |
| Under 5 Years | 50 (5.1%) | 68 (5.7%) |
| 5 to 9 Years | 70 (7.1%) | 30 (2.5%) |
| 10 to 14 Years | 53 (5.3%) | 65 (5.4%) |
| 15 to 19 Years | 59 (6.0%) | 89 (7.5%) |
| 20 to 24 Years | 8 (0.8%) | 44 (3.7%) |
| 25 to 29 Years | 90 (9.1%) | 89 (7.5%) |
| 30 to 34 Years | 68 (6.9%) | 34 (2.9%) |
| 35 to 39 Years | 85 (8.6%) | 26 (2.2%) |
| 40 to 44 Years | 61 (6.2%) | 102 (8.6%) |
| 45 to 49 Years | 43 (4.3%) | 90 (7.5%) |
| 50 to 54 Years | 43 (4.3%) | 70 (5.9%) |
| 55 to 59 Years | 143 (14.4%) | 99 (8.3%) |
| 60 to 64 Years | 82 (8.3%) | 106 (8.9%) |
| 65 to 69 Years | 34 (3.4%) | 96 (8.1%) |
| 70 to 74 Years | 53 (5.3%) | 48 (4.0%) |
| 75 to 79 Years | 41 (4.1%) | 40 (3.4%) |
| 80 to 84 Years | 4 (0.4%) | 29 (2.4%) |
| 85 Years and over | 3 (0.3%) | 68 (5.7%) |
| Total | 990 (100.0%) | 1,193 (100.0%) |
Families and Households in Rockport
Median Family Size in Rockport
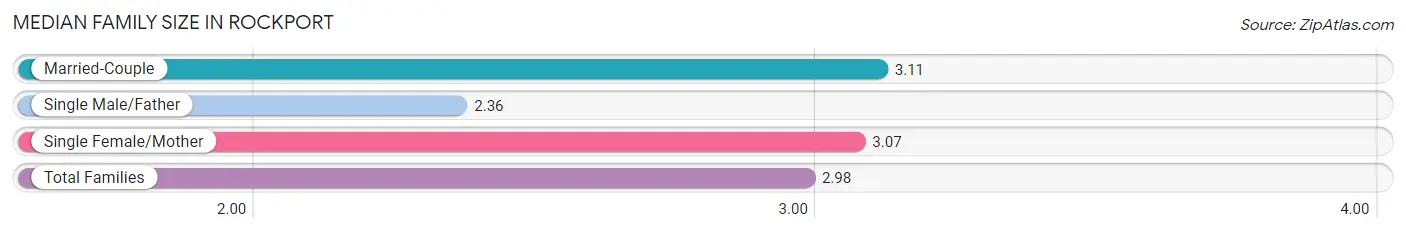
The median family size in Rockport is 2.98 persons per family, with married-couple families (220 | 48.8%) accounting for the largest median family size of 3.11 persons per family. On the other hand, single male/father families (70 | 15.5%) represent the smallest median family size with 2.36 persons per family.
| Family Type | # Families | Family Size |
| Married-Couple | 220 (48.8%) | 3.11 |
| Single Male/Father | 70 (15.5%) | 2.36 |
| Single Female/Mother | 161 (35.7%) | 3.07 |
| Total Families | 451 (100.0%) | 2.98 |
Median Household Size in Rockport
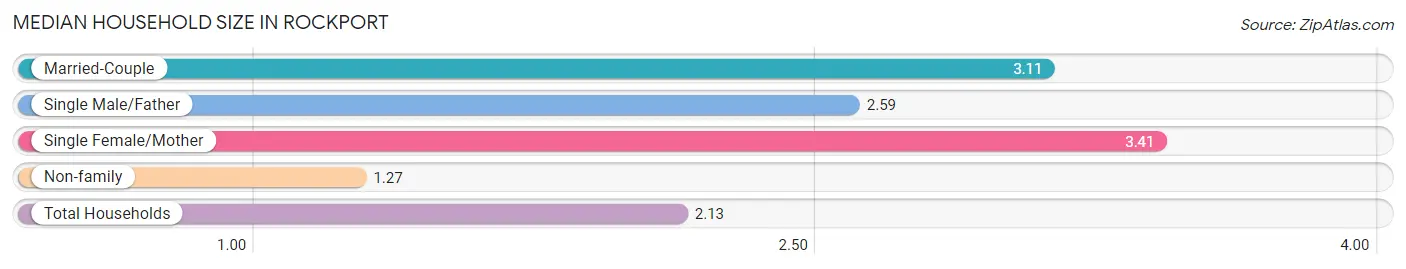
The median household size in Rockport is 2.13 persons per household, with single female/mother households (161 | 16.6%) accounting for the largest median household size of 3.41 persons per household. non-family households (522 | 53.6%) represent the smallest median household size with 1.27 persons per household.
| Household Type | # Households | Household Size |
| Married-Couple | 220 (22.6%) | 3.11 |
| Single Male/Father | 70 (7.2%) | 2.59 |
| Single Female/Mother | 161 (16.6%) | 3.41 |
| Non-family | 522 (53.6%) | 1.27 |
| Total Households | 973 (100.0%) | 2.13 |
Household Size by Marriage Status in Rockport
Out of a total of 973 households in Rockport, 451 (46.4%) are family households, while 522 (53.6%) are nonfamily households. The most numerous type of family households are 2-person households, comprising 218, and the most common type of nonfamily households are 1-person households, comprising 407.
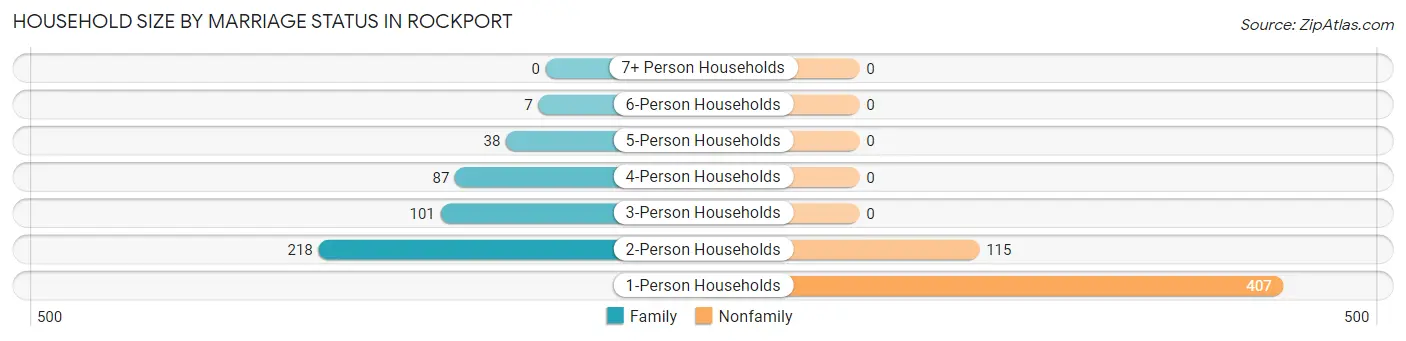
| Household Size | Family Households | Nonfamily Households |
| 1-Person Households | - | 407 (41.8%) |
| 2-Person Households | 218 (22.4%) | 115 (11.8%) |
| 3-Person Households | 101 (10.4%) | 0 (0.0%) |
| 4-Person Households | 87 (8.9%) | 0 (0.0%) |
| 5-Person Households | 38 (3.9%) | 0 (0.0%) |
| 6-Person Households | 7 (0.7%) | 0 (0.0%) |
| 7+ Person Households | 0 (0.0%) | 0 (0.0%) |
| Total | 451 (46.4%) | 522 (53.6%) |
Female Fertility in Rockport
Fertility by Age in Rockport
Average fertility rate in Rockport is 95.0 births per 1,000 women. Women in the age bracket of 20 to 34 years have the highest fertility rate with 210.0 births per 1,000 women. Women in the age bracket of 20 to 34 years acount for 72.9% of all women with births.
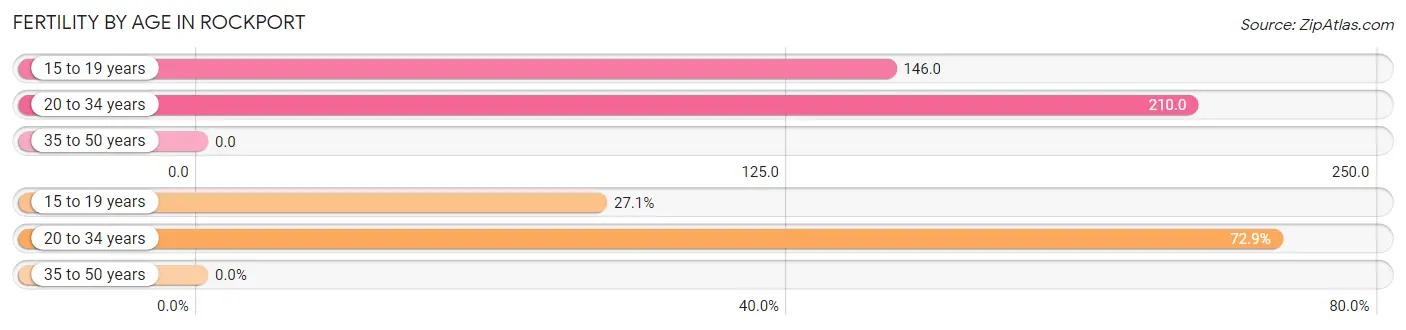
| Age Bracket | Women with Births | Births / 1,000 Women |
| 15 to 19 years | 13 (27.1%) | 146.0 |
| 20 to 34 years | 35 (72.9%) | 210.0 |
| 35 to 50 years | 0 (0.0%) | 0.0 |
| Total | 48 (100.0%) | 95.0 |
Fertility by Age by Marriage Status in Rockport
6.2% of women with births (48) in Rockport are married. The highest percentage of unmarried women with births falls into 15 to 19 years age bracket with 100.0% of them unmarried at the time of birth, while the lowest percentage of unmarried women with births belong to 20 to 34 years age bracket with 91.4% of them unmarried.
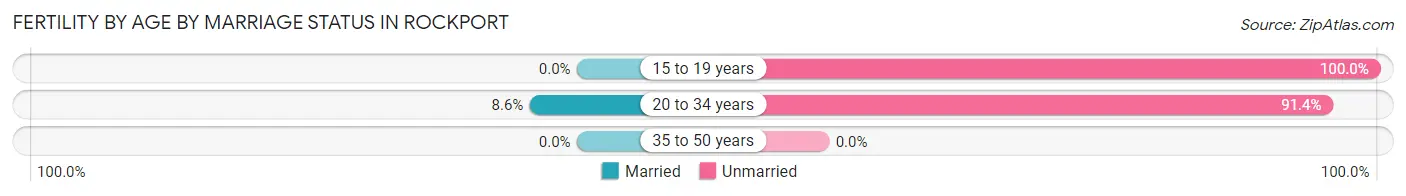
| Age Bracket | Married | Unmarried |
| 15 to 19 years | 0 (0.0%) | 13 (100.0%) |
| 20 to 34 years | 3 (8.6%) | 32 (91.4%) |
| 35 to 50 years | 0 (0.0%) | 0 (0.0%) |
| Total | 3 (6.2%) | 45 (93.8%) |
Fertility by Education in Rockport
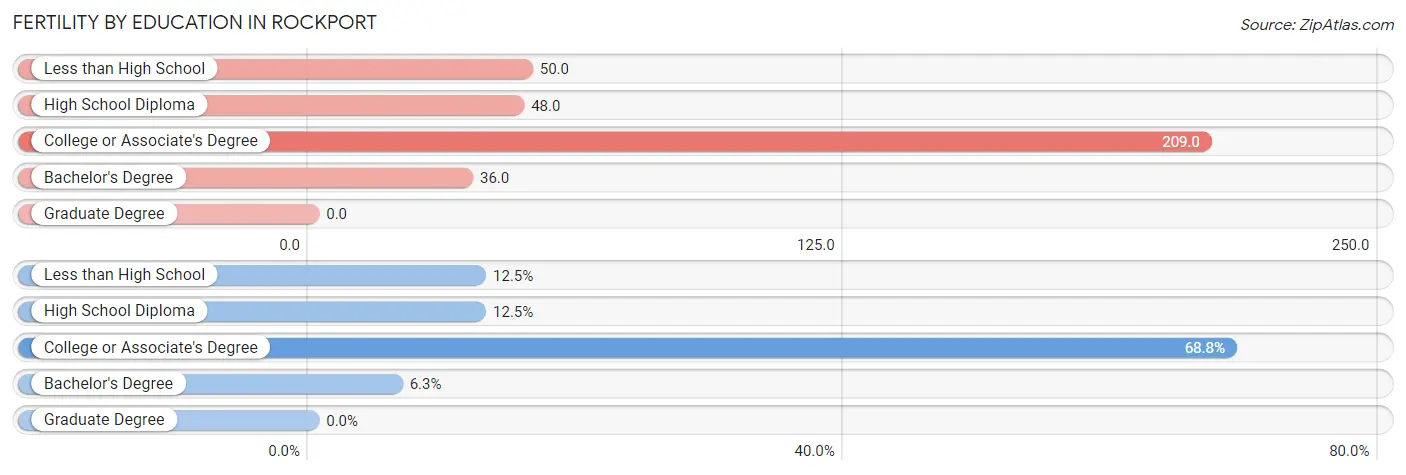
| Educational Attainment | Women with Births | Births / 1,000 Women |
| Less than High School | 6 (12.5%) | 50.0 |
| High School Diploma | 6 (12.5%) | 48.0 |
| College or Associate's Degree | 33 (68.8%) | 209.0 |
| Bachelor's Degree | 3 (6.2%) | 36.0 |
| Graduate Degree | 0 (0.0%) | 0.0 |
| Total | 48 (100.0%) | 95.0 |
Fertility by Education by Marriage Status in Rockport
93.8% of women with births in Rockport are unmarried. Women with the educational attainment of bachelor's degree are most likely to be married with 100.0% of them married at childbirth, while women with the educational attainment of less than high school are least likely to be married with 100.0% of them unmarried at childbirth.
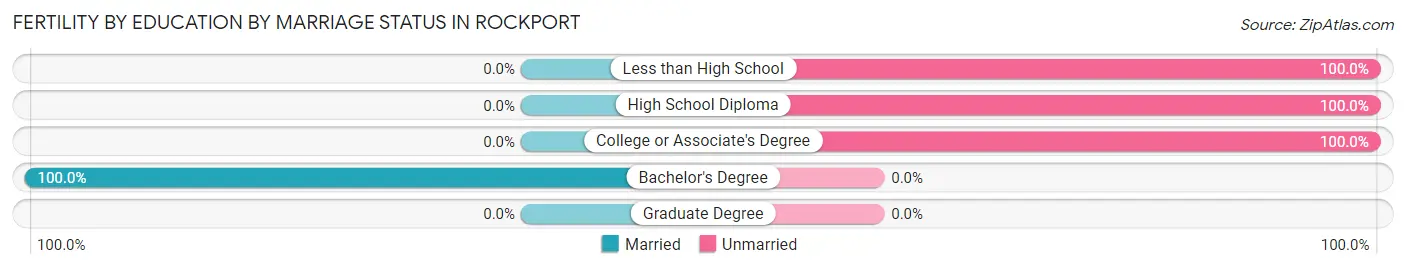
| Educational Attainment | Married | Unmarried |
| Less than High School | 0 (0.0%) | 6 (100.0%) |
| High School Diploma | 0 (0.0%) | 6 (100.0%) |
| College or Associate's Degree | 0 (0.0%) | 33 (100.0%) |
| Bachelor's Degree | 3 (100.0%) | 0 (0.0%) |
| Graduate Degree | 0 (0.0%) | 0 (0.0%) |
| Total | 3 (6.2%) | 45 (93.8%) |
Employment Characteristics in Rockport
Employment by Class of Employer in Rockport
Among the 903 employed individuals in Rockport, private company employees (667 | 73.9%), local government employees (76 | 8.4%), and not-for-profit organizations (66 | 7.3%) make up the most common classes of employment.
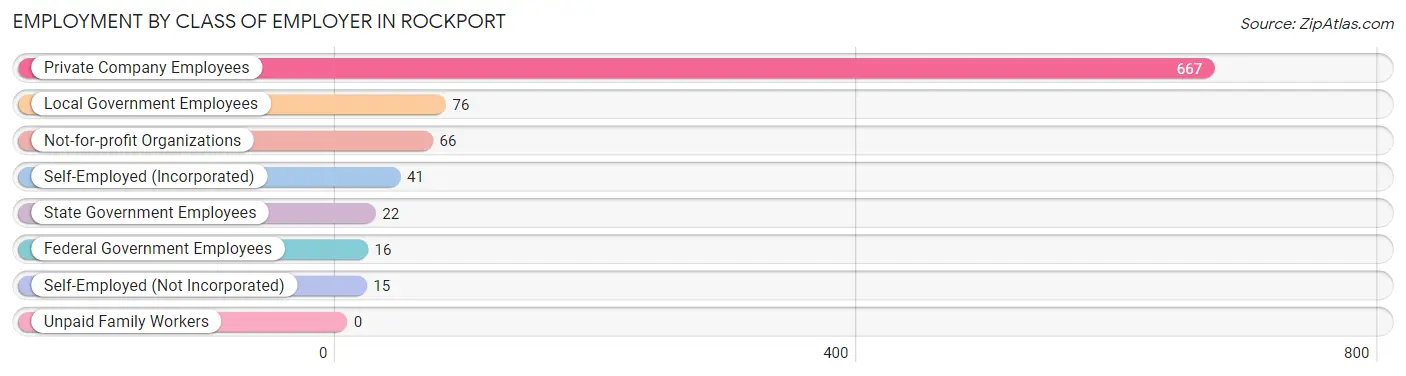
| Employer Class | # Employees | % Employees |
| Private Company Employees | 667 | 73.9% |
| Self-Employed (Incorporated) | 41 | 4.5% |
| Self-Employed (Not Incorporated) | 15 | 1.7% |
| Not-for-profit Organizations | 66 | 7.3% |
| Local Government Employees | 76 | 8.4% |
| State Government Employees | 22 | 2.4% |
| Federal Government Employees | 16 | 1.8% |
| Unpaid Family Workers | 0 | 0.0% |
| Total | 903 | 100.0% |
Employment Status by Age in Rockport
According to the labor force statistics for Rockport, out of the total population over 16 years of age (1,833), 53.1% or 973 individuals are in the labor force, with 5.3% or 52 of them unemployed. The age group with the highest labor force participation rate is 30 to 34 years, with 87.3% or 89 individuals in the labor force. Within the labor force, the 16 to 19 years age range has the highest percentage of unemployed individuals, with 37.6% or 32 of them being unemployed.
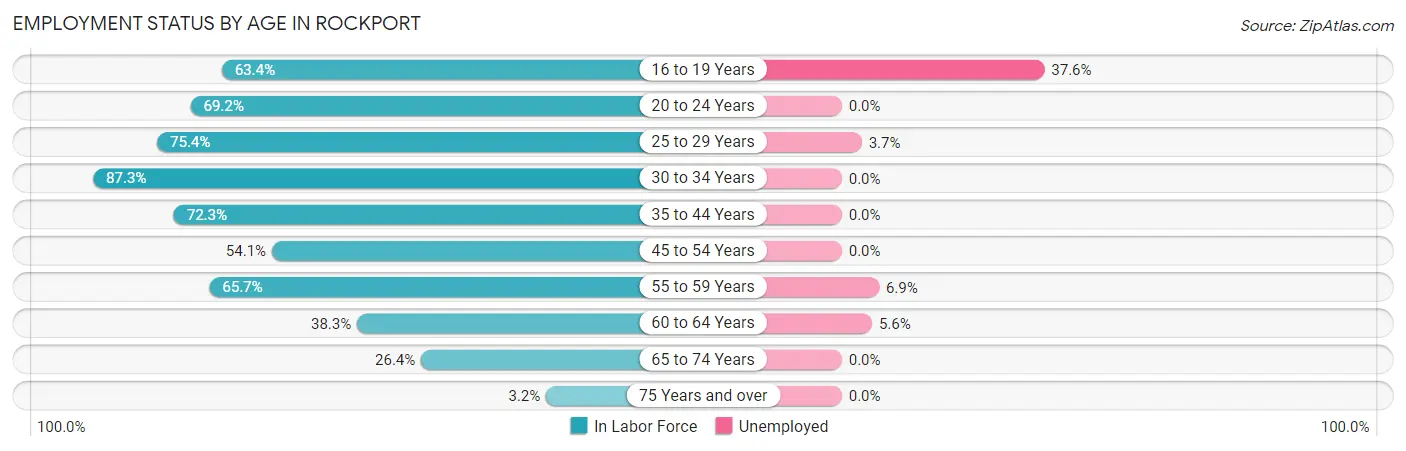
| Age Bracket | In Labor Force | Unemployed |
| 16 to 19 Years | 85 (63.4%) | 32 (37.6%) |
| 20 to 24 Years | 36 (69.2%) | 0 (0.0%) |
| 25 to 29 Years | 135 (75.4%) | 5 (3.7%) |
| 30 to 34 Years | 89 (87.3%) | 0 (0.0%) |
| 35 to 44 Years | 198 (72.3%) | 0 (0.0%) |
| 45 to 54 Years | 133 (54.1%) | 0 (0.0%) |
| 55 to 59 Years | 159 (65.7%) | 11 (6.9%) |
| 60 to 64 Years | 72 (38.3%) | 4 (5.6%) |
| 65 to 74 Years | 61 (26.4%) | 0 (0.0%) |
| 75 Years and over | 6 (3.2%) | 0 (0.0%) |
| Total | 973 (53.1%) | 52 (5.3%) |
Employment Status by Educational Attainment in Rockport
According to labor force statistics for Rockport, 63.9% of individuals (787) out of the total population between 25 and 64 years of age (1,231) are in the labor force, with 2.5% or 20 of them being unemployed. The group with the highest labor force participation rate are those with the educational attainment of college / associate degree, with 73.7% or 286 individuals in the labor force. Within the labor force, individuals with high school diploma education have the highest percentage of unemployment, with 6.9% or 20 of them being unemployed.
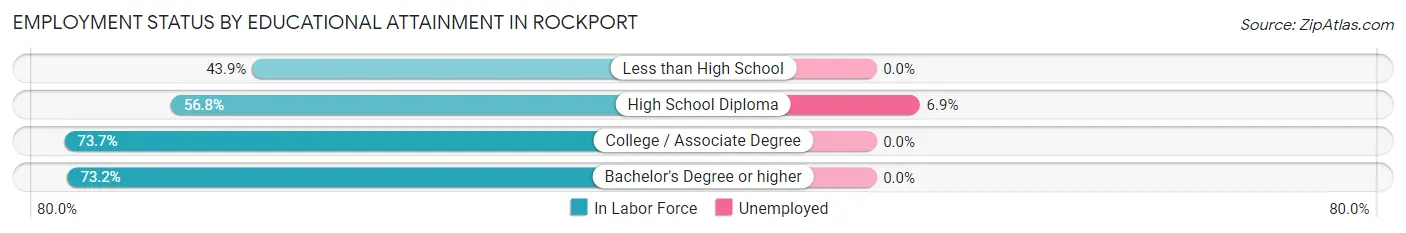
| Educational Attainment | In Labor Force | Unemployed |
| Less than High School | 50 (43.9%) | 0 (0.0%) |
| High School Diploma | 289 (56.8%) | 35 (6.9%) |
| College / Associate Degree | 286 (73.7%) | 0 (0.0%) |
| Bachelor's Degree or higher | 161 (73.2%) | 0 (0.0%) |
| Total | 787 (63.9%) | 31 (2.5%) |
Employment Occupations by Sex in Rockport
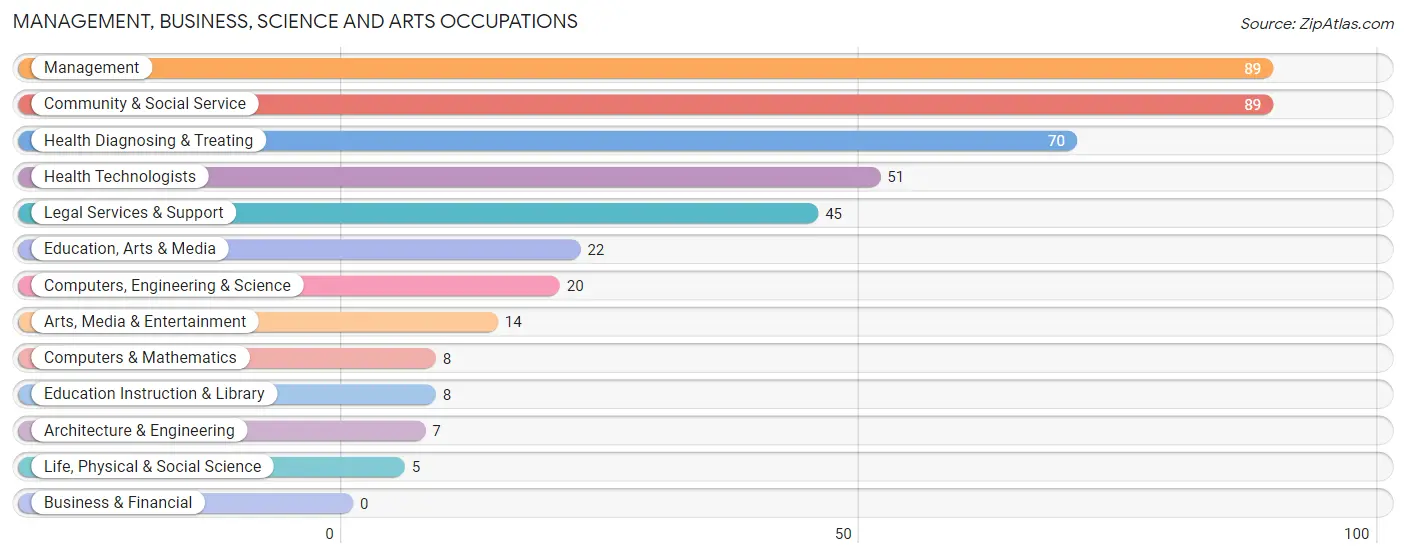
Management, Business, Science and Arts Occupations
The most common Management, Business, Science and Arts occupations in Rockport are Management (89 | 9.7%), Community & Social Service (89 | 9.7%), Health Diagnosing & Treating (70 | 7.6%), Health Technologists (51 | 5.5%), and Legal Services & Support (45 | 4.9%).
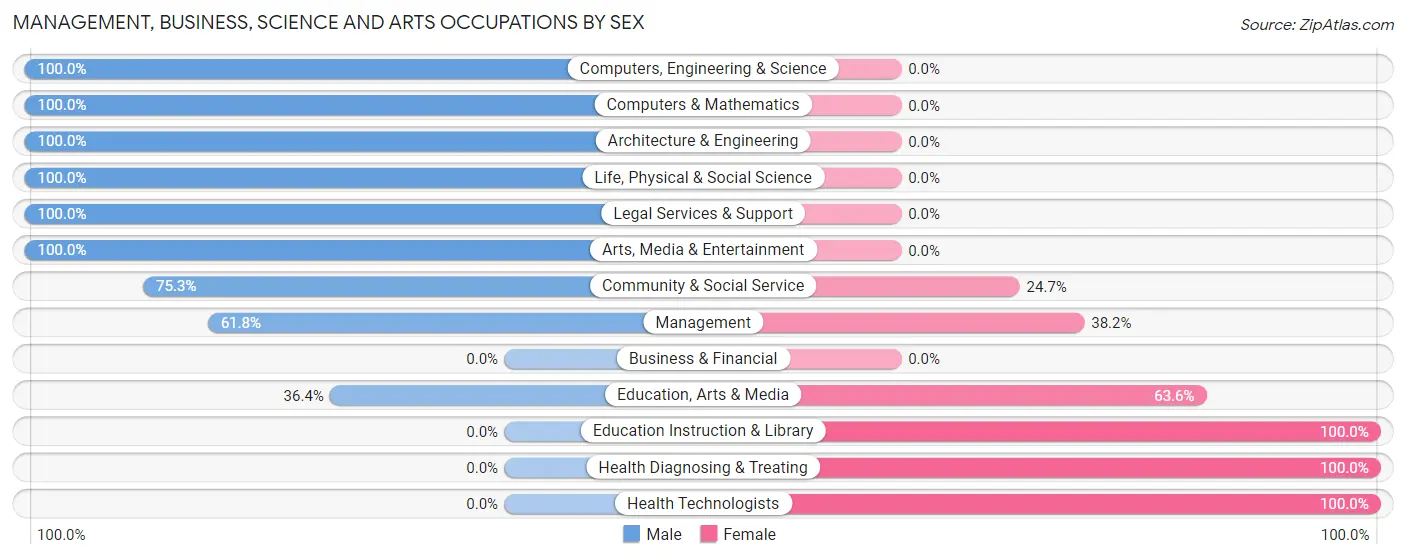
Management, Business, Science and Arts Occupations by Sex
Within the Management, Business, Science and Arts occupations in Rockport, the most male-oriented occupations are Computers, Engineering & Science (100.0%), Computers & Mathematics (100.0%), and Architecture & Engineering (100.0%), while the most female-oriented occupations are Education Instruction & Library (100.0%), Health Diagnosing & Treating (100.0%), and Health Technologists (100.0%).
| Occupation | Male | Female |
| Management | 55 (61.8%) | 34 (38.2%) |
| Business & Financial | 0 (0.0%) | 0 (0.0%) |
| Computers, Engineering & Science | 20 (100.0%) | 0 (0.0%) |
| Computers & Mathematics | 8 (100.0%) | 0 (0.0%) |
| Architecture & Engineering | 7 (100.0%) | 0 (0.0%) |
| Life, Physical & Social Science | 5 (100.0%) | 0 (0.0%) |
| Community & Social Service | 67 (75.3%) | 22 (24.7%) |
| Education, Arts & Media | 8 (36.4%) | 14 (63.6%) |
| Legal Services & Support | 45 (100.0%) | 0 (0.0%) |
| Education Instruction & Library | 0 (0.0%) | 8 (100.0%) |
| Arts, Media & Entertainment | 14 (100.0%) | 0 (0.0%) |
| Health Diagnosing & Treating | 0 (0.0%) | 70 (100.0%) |
| Health Technologists | 0 (0.0%) | 51 (100.0%) |
| Total (Category) | 142 (53.0%) | 126 (47.0%) |
| Total (Overall) | 442 (47.9%) | 480 (52.1%) |
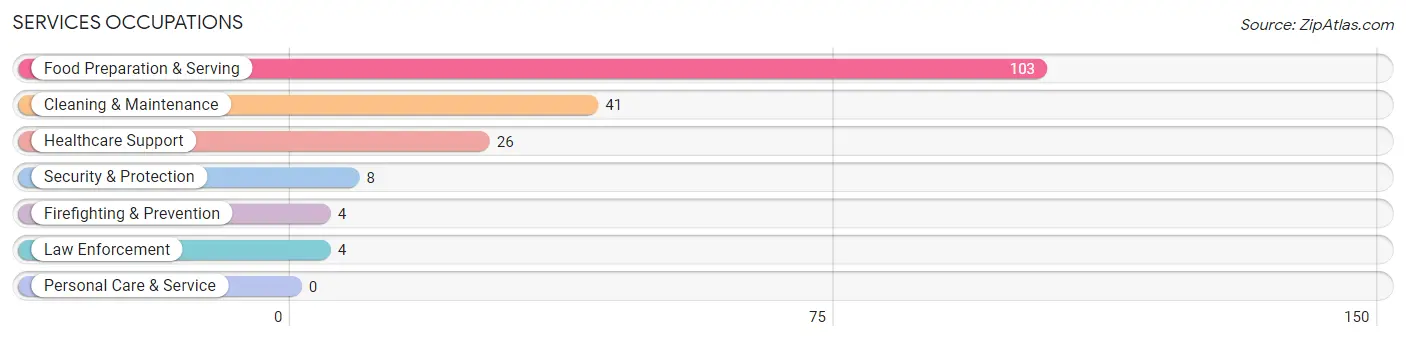
Services Occupations
The most common Services occupations in Rockport are Food Preparation & Serving (103 | 11.2%), Cleaning & Maintenance (41 | 4.4%), Healthcare Support (26 | 2.8%), Security & Protection (8 | 0.9%), and Firefighting & Prevention (4 | 0.4%).
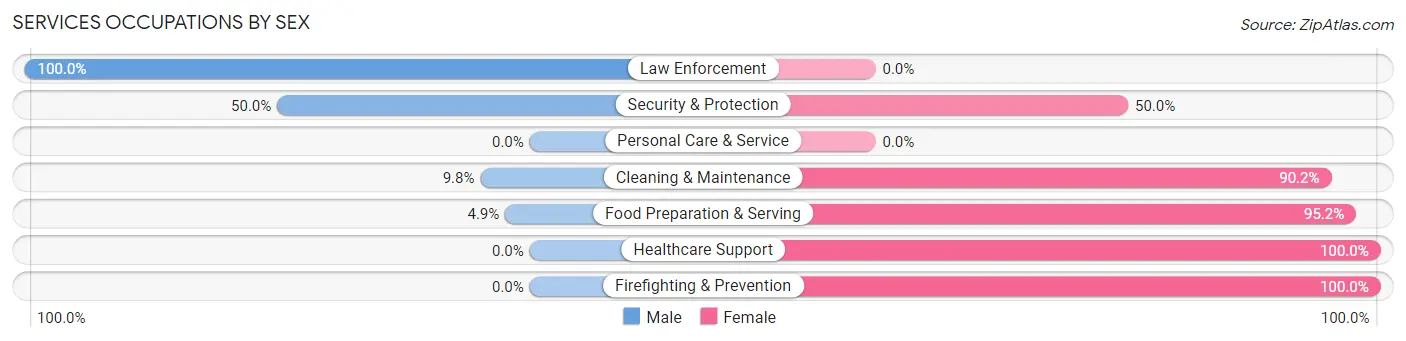
Services Occupations by Sex
Within the Services occupations in Rockport, the most male-oriented occupations are Law Enforcement (100.0%), Security & Protection (50.0%), and Cleaning & Maintenance (9.8%), while the most female-oriented occupations are Healthcare Support (100.0%), Firefighting & Prevention (100.0%), and Food Preparation & Serving (95.2%).
| Occupation | Male | Female |
| Healthcare Support | 0 (0.0%) | 26 (100.0%) |
| Security & Protection | 4 (50.0%) | 4 (50.0%) |
| Firefighting & Prevention | 0 (0.0%) | 4 (100.0%) |
| Law Enforcement | 4 (100.0%) | 0 (0.0%) |
| Food Preparation & Serving | 5 (4.9%) | 98 (95.2%) |
| Cleaning & Maintenance | 4 (9.8%) | 37 (90.2%) |
| Personal Care & Service | 0 (0.0%) | 0 (0.0%) |
| Total (Category) | 13 (7.3%) | 165 (92.7%) |
| Total (Overall) | 442 (47.9%) | 480 (52.1%) |
Sales and Office Occupations
The most common Sales and Office occupations in Rockport are Office & Administration (105 | 11.4%), and Sales & Related (71 | 7.7%).
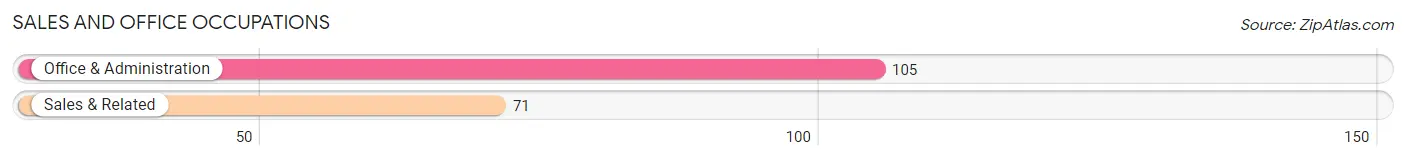
Sales and Office Occupations by Sex
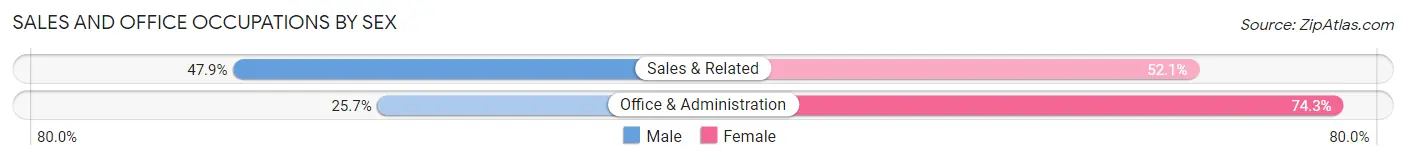
| Occupation | Male | Female |
| Sales & Related | 34 (47.9%) | 37 (52.1%) |
| Office & Administration | 27 (25.7%) | 78 (74.3%) |
| Total (Category) | 61 (34.7%) | 115 (65.3%) |
| Total (Overall) | 442 (47.9%) | 480 (52.1%) |
Natural Resources, Construction and Maintenance Occupations
The most common Natural Resources, Construction and Maintenance occupations in Rockport are Installation, Maintenance & Repair (61 | 6.6%), and Construction & Extraction (27 | 2.9%).
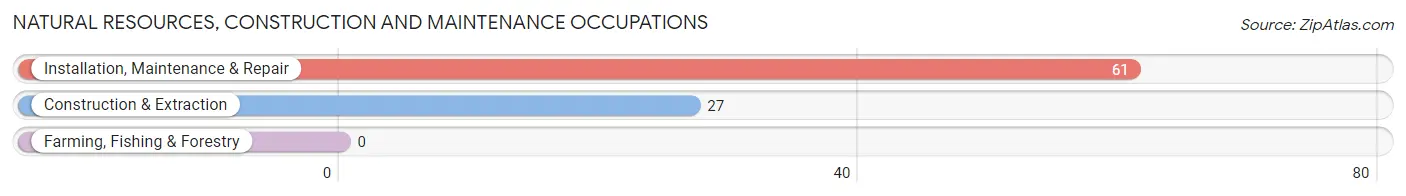
Natural Resources, Construction and Maintenance Occupations by Sex
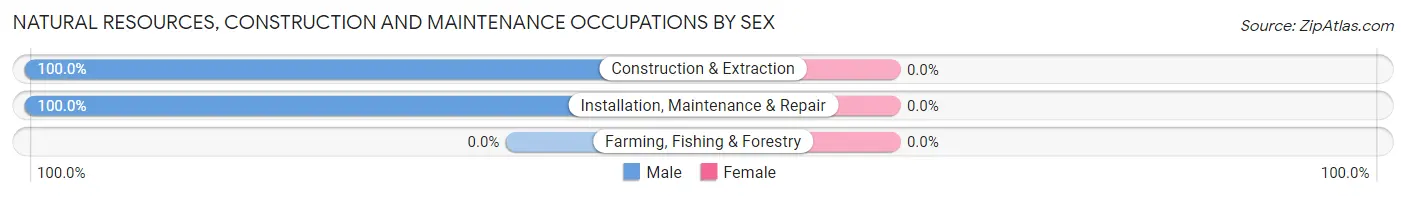
| Occupation | Male | Female |
| Farming, Fishing & Forestry | 0 (0.0%) | 0 (0.0%) |
| Construction & Extraction | 27 (100.0%) | 0 (0.0%) |
| Installation, Maintenance & Repair | 61 (100.0%) | 0 (0.0%) |
| Total (Category) | 88 (100.0%) | 0 (0.0%) |
| Total (Overall) | 442 (47.9%) | 480 (52.1%) |
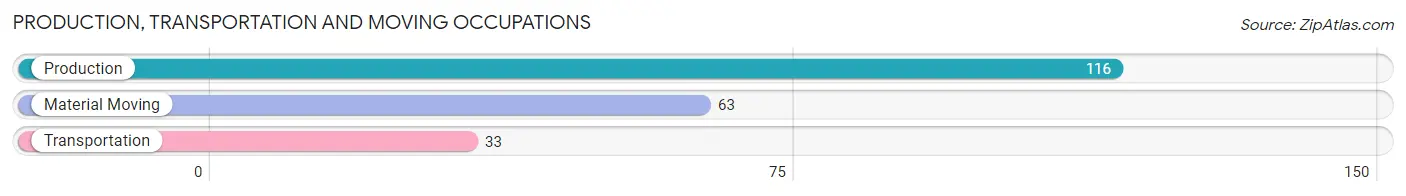
Production, Transportation and Moving Occupations
The most common Production, Transportation and Moving occupations in Rockport are Production (116 | 12.6%), Material Moving (63 | 6.8%), and Transportation (33 | 3.6%).
Production, Transportation and Moving Occupations by Sex
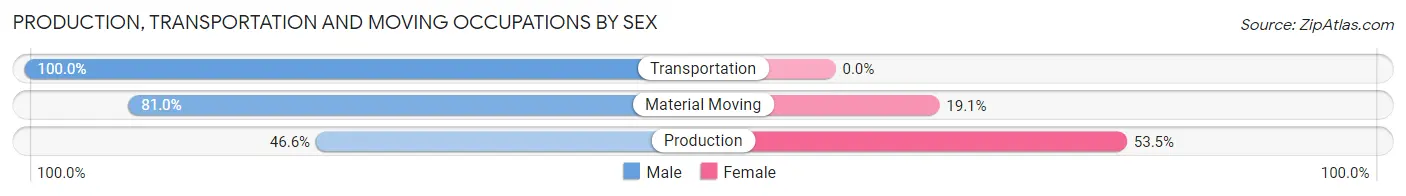
| Occupation | Male | Female |
| Production | 54 (46.6%) | 62 (53.4%) |
| Transportation | 33 (100.0%) | 0 (0.0%) |
| Material Moving | 51 (80.9%) | 12 (19.1%) |
| Total (Category) | 138 (65.1%) | 74 (34.9%) |
| Total (Overall) | 442 (47.9%) | 480 (52.1%) |
Employment Industries by Sex in Rockport
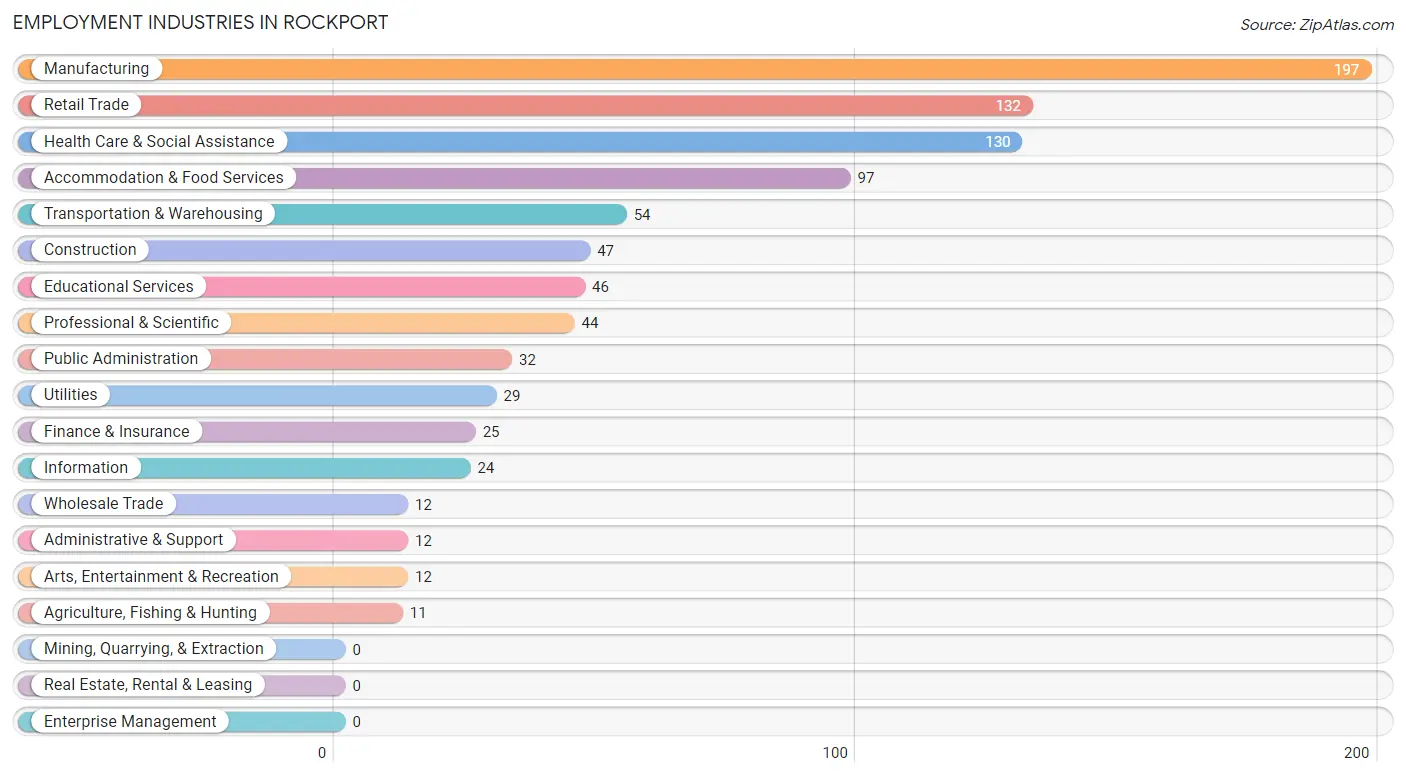
Employment Industries in Rockport
The major employment industries in Rockport include Manufacturing (197 | 21.4%), Retail Trade (132 | 14.3%), Health Care & Social Assistance (130 | 14.1%), Accommodation & Food Services (97 | 10.5%), and Transportation & Warehousing (54 | 5.9%).
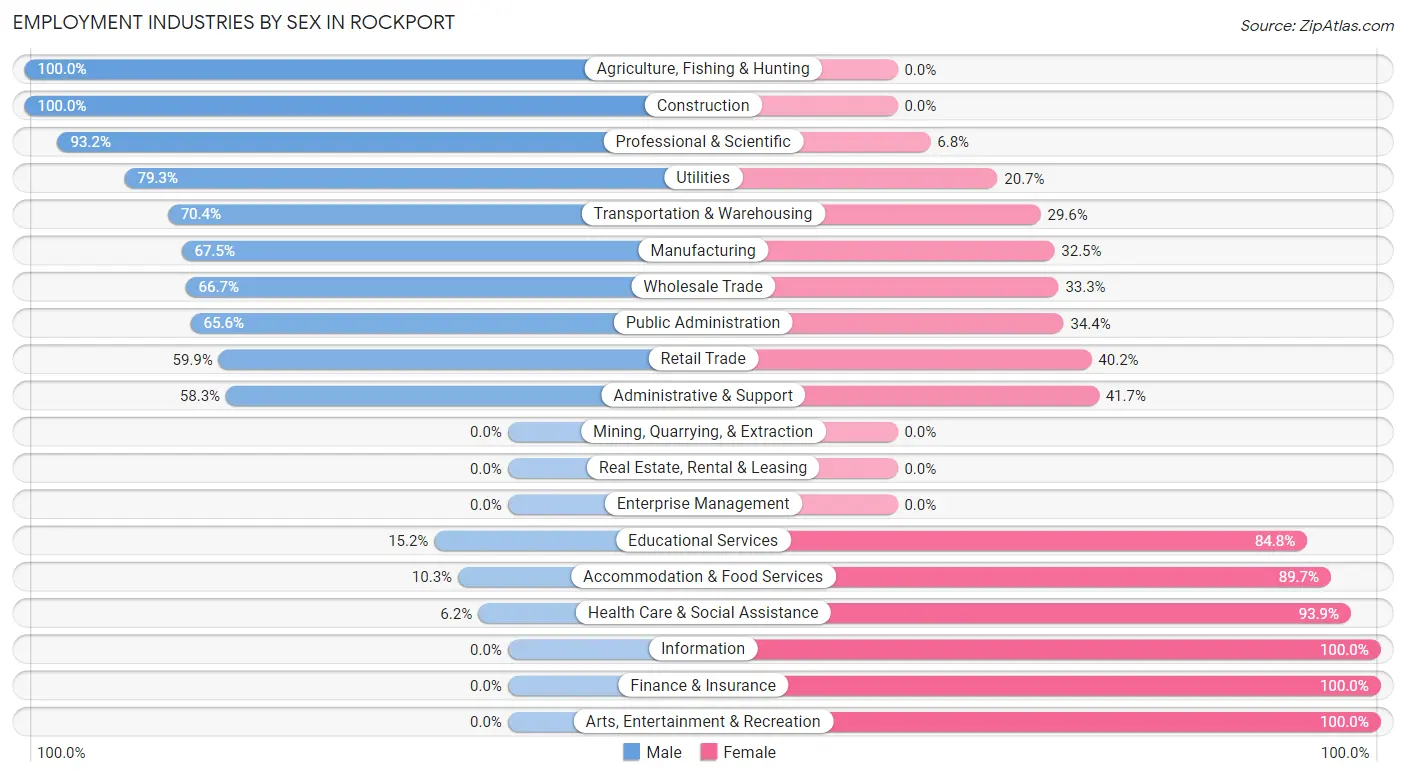
Employment Industries by Sex in Rockport
The Rockport industries that see more men than women are Agriculture, Fishing & Hunting (100.0%), Construction (100.0%), and Professional & Scientific (93.2%), whereas the industries that tend to have a higher number of women are Information (100.0%), Finance & Insurance (100.0%), and Arts, Entertainment & Recreation (100.0%).
| Industry | Male | Female |
| Agriculture, Fishing & Hunting | 11 (100.0%) | 0 (0.0%) |
| Mining, Quarrying, & Extraction | 0 (0.0%) | 0 (0.0%) |
| Construction | 47 (100.0%) | 0 (0.0%) |
| Manufacturing | 133 (67.5%) | 64 (32.5%) |
| Wholesale Trade | 8 (66.7%) | 4 (33.3%) |
| Retail Trade | 79 (59.9%) | 53 (40.2%) |
| Transportation & Warehousing | 38 (70.4%) | 16 (29.6%) |
| Utilities | 23 (79.3%) | 6 (20.7%) |
| Information | 0 (0.0%) | 24 (100.0%) |
| Finance & Insurance | 0 (0.0%) | 25 (100.0%) |
| Real Estate, Rental & Leasing | 0 (0.0%) | 0 (0.0%) |
| Professional & Scientific | 41 (93.2%) | 3 (6.8%) |
| Enterprise Management | 0 (0.0%) | 0 (0.0%) |
| Administrative & Support | 7 (58.3%) | 5 (41.7%) |
| Educational Services | 7 (15.2%) | 39 (84.8%) |
| Health Care & Social Assistance | 8 (6.1%) | 122 (93.9%) |
| Arts, Entertainment & Recreation | 0 (0.0%) | 12 (100.0%) |
| Accommodation & Food Services | 10 (10.3%) | 87 (89.7%) |
| Public Administration | 21 (65.6%) | 11 (34.4%) |
| Total | 442 (47.9%) | 480 (52.1%) |
Education in Rockport
School Enrollment in Rockport
The most common levels of schooling among the 376 students in Rockport are middle school (118 | 31.4%), high school (89 | 23.7%), and nursery / preschool (57 | 15.2%).
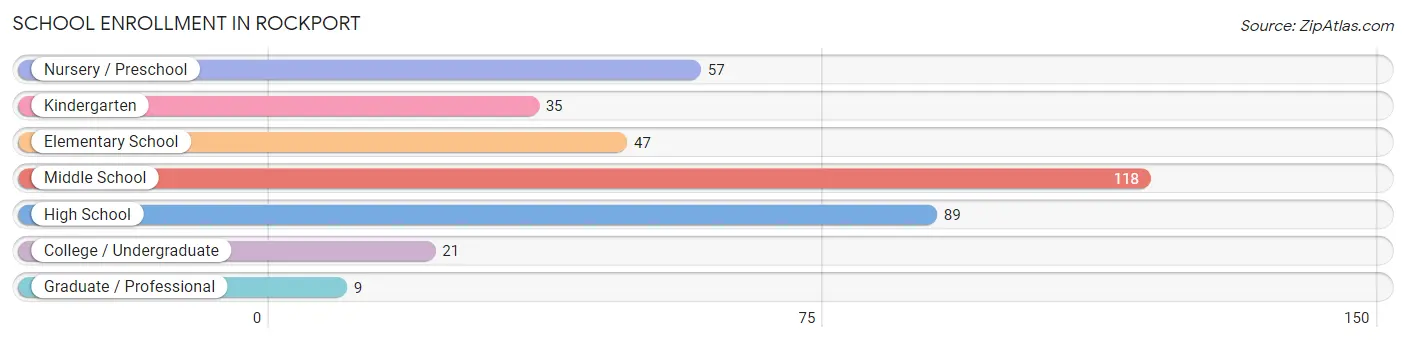
| School Level | # Students | % Students |
| Nursery / Preschool | 57 | 15.2% |
| Kindergarten | 35 | 9.3% |
| Elementary School | 47 | 12.5% |
| Middle School | 118 | 31.4% |
| High School | 89 | 23.7% |
| College / Undergraduate | 21 | 5.6% |
| Graduate / Professional | 9 | 2.4% |
| Total | 376 | 100.0% |
School Enrollment by Age by Funding Source in Rockport
Out of a total of 376 students who are enrolled in schools in Rockport, 38 (10.1%) attend a private institution, while the remaining 338 (89.9%) are enrolled in public schools. The age group of 25 to 34 year olds has the highest likelihood of being enrolled in private schools, with 9 (100.0% in the age bracket) enrolled. Conversely, the age group of 3 to 4 year olds has the lowest likelihood of being enrolled in a private school, with 39 (100.0% in the age bracket) attending a public institution.
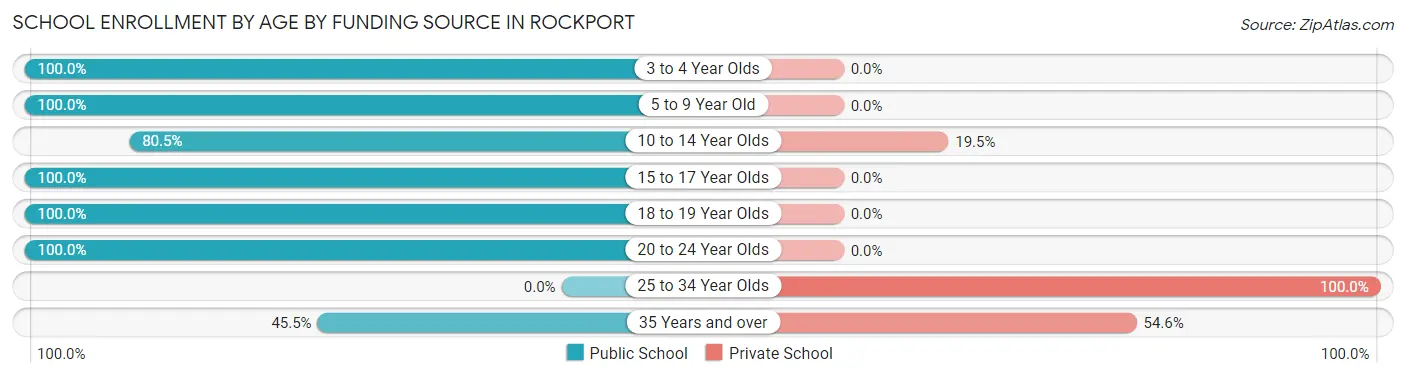
| Age Bracket | Public School | Private School |
| 3 to 4 Year Olds | 39 (100.0%) | 0 (0.0%) |
| 5 to 9 Year Old | 100 (100.0%) | 0 (0.0%) |
| 10 to 14 Year Olds | 95 (80.5%) | 23 (19.5%) |
| 15 to 17 Year Olds | 87 (100.0%) | 0 (0.0%) |
| 18 to 19 Year Olds | 2 (100.0%) | 0 (0.0%) |
| 20 to 24 Year Olds | 10 (100.0%) | 0 (0.0%) |
| 25 to 34 Year Olds | 0 (0.0%) | 9 (100.0%) |
| 35 Years and over | 5 (45.5%) | 6 (54.5%) |
| Total | 338 (89.9%) | 38 (10.1%) |
Educational Attainment by Field of Study in Rockport
Business (59 | 23.1%), science & technology (49 | 19.1%), education (44 | 17.2%), arts & humanities (37 | 14.4%), and engineering (20 | 7.8%) are the most common fields of study among 256 individuals in Rockport who have obtained a bachelor's degree or higher.
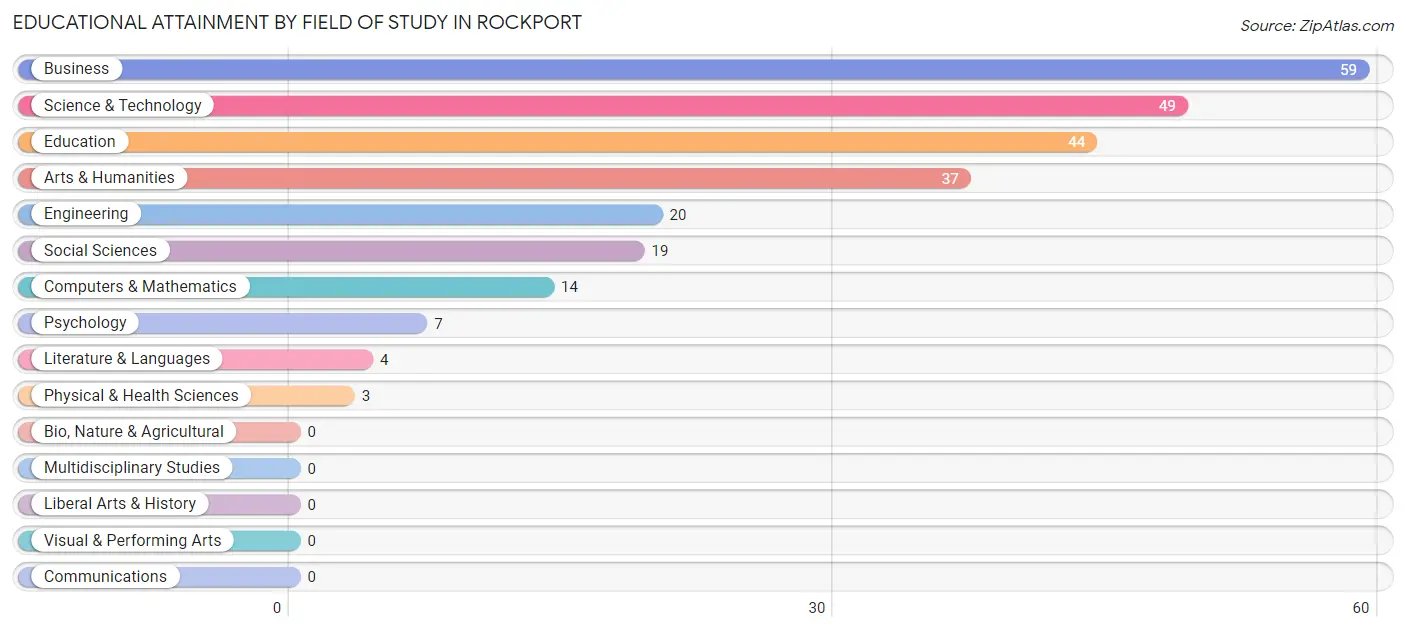
| Field of Study | # Graduates | % Graduates |
| Computers & Mathematics | 14 | 5.5% |
| Bio, Nature & Agricultural | 0 | 0.0% |
| Physical & Health Sciences | 3 | 1.2% |
| Psychology | 7 | 2.7% |
| Social Sciences | 19 | 7.4% |
| Engineering | 20 | 7.8% |
| Multidisciplinary Studies | 0 | 0.0% |
| Science & Technology | 49 | 19.1% |
| Business | 59 | 23.1% |
| Education | 44 | 17.2% |
| Literature & Languages | 4 | 1.6% |
| Liberal Arts & History | 0 | 0.0% |
| Visual & Performing Arts | 0 | 0.0% |
| Communications | 0 | 0.0% |
| Arts & Humanities | 37 | 14.4% |
| Total | 256 | 100.0% |
Transportation & Commute in Rockport
Vehicle Availability by Sex in Rockport
The most prevalent vehicle ownership categories in Rockport are males with 2 vehicles (192, accounting for 43.5%) and females with 2 vehicles (199, making up 41.6%).
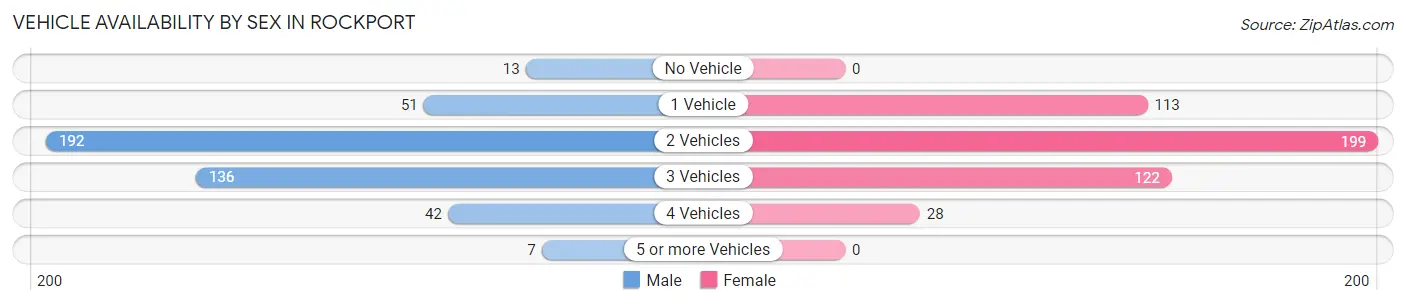
| Vehicles Available | Male | Female |
| No Vehicle | 13 (2.9%) | 0 (0.0%) |
| 1 Vehicle | 51 (11.6%) | 113 (24.5%) |
| 2 Vehicles | 192 (43.5%) | 199 (43.1%) |
| 3 Vehicles | 136 (30.8%) | 122 (26.4%) |
| 4 Vehicles | 42 (9.5%) | 28 (6.1%) |
| 5 or more Vehicles | 7 (1.6%) | 0 (0.0%) |
| Total | 441 (100.0%) | 462 (100.0%) |
Commute Time in Rockport
The most frequently occuring commute durations in Rockport are 20 to 24 minutes (149 commuters, 16.9%), 5 to 9 minutes (111 commuters, 12.6%), and 30 to 34 minutes (109 commuters, 12.3%).
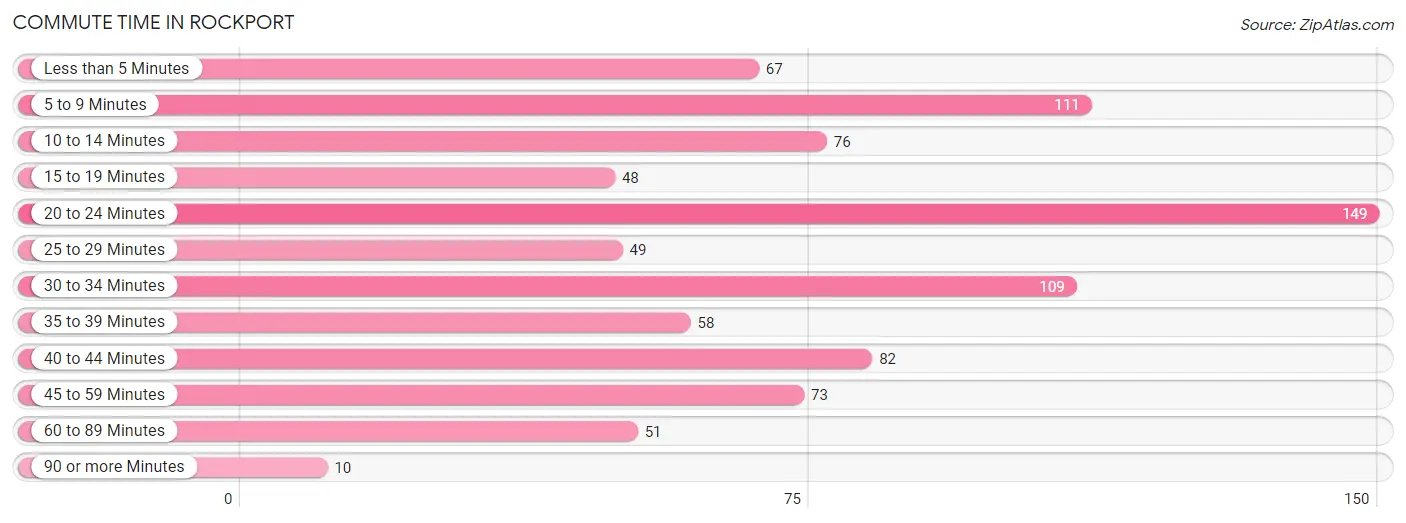
| Commute Time | # Commuters | % Commuters |
| Less than 5 Minutes | 67 | 7.6% |
| 5 to 9 Minutes | 111 | 12.6% |
| 10 to 14 Minutes | 76 | 8.6% |
| 15 to 19 Minutes | 48 | 5.4% |
| 20 to 24 Minutes | 149 | 16.9% |
| 25 to 29 Minutes | 49 | 5.6% |
| 30 to 34 Minutes | 109 | 12.3% |
| 35 to 39 Minutes | 58 | 6.6% |
| 40 to 44 Minutes | 82 | 9.3% |
| 45 to 59 Minutes | 73 | 8.3% |
| 60 to 89 Minutes | 51 | 5.8% |
| 90 or more Minutes | 10 | 1.1% |
Commute Time by Sex in Rockport
The most common commute times in Rockport are 20 to 24 minutes (78 commuters, 18.0%) for males and 20 to 24 minutes (71 commuters, 15.8%) for females.
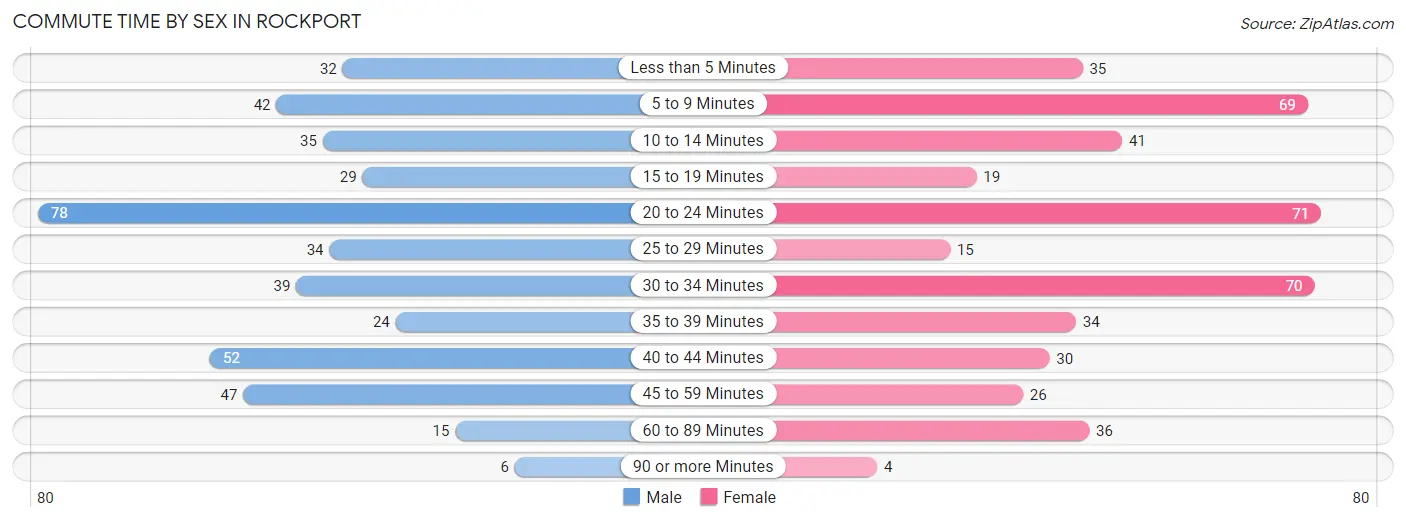
| Commute Time | Male | Female |
| Less than 5 Minutes | 32 (7.4%) | 35 (7.8%) |
| 5 to 9 Minutes | 42 (9.7%) | 69 (15.3%) |
| 10 to 14 Minutes | 35 (8.1%) | 41 (9.1%) |
| 15 to 19 Minutes | 29 (6.7%) | 19 (4.2%) |
| 20 to 24 Minutes | 78 (18.0%) | 71 (15.8%) |
| 25 to 29 Minutes | 34 (7.9%) | 15 (3.3%) |
| 30 to 34 Minutes | 39 (9.0%) | 70 (15.6%) |
| 35 to 39 Minutes | 24 (5.5%) | 34 (7.6%) |
| 40 to 44 Minutes | 52 (12.0%) | 30 (6.7%) |
| 45 to 59 Minutes | 47 (10.8%) | 26 (5.8%) |
| 60 to 89 Minutes | 15 (3.5%) | 36 (8.0%) |
| 90 or more Minutes | 6 (1.4%) | 4 (0.9%) |
Time of Departure to Work by Sex in Rockport
The most frequent times of departure to work in Rockport are 7:00 AM to 7:29 AM (110, 25.4%) for males and 7:00 AM to 7:29 AM (134, 29.8%) for females.
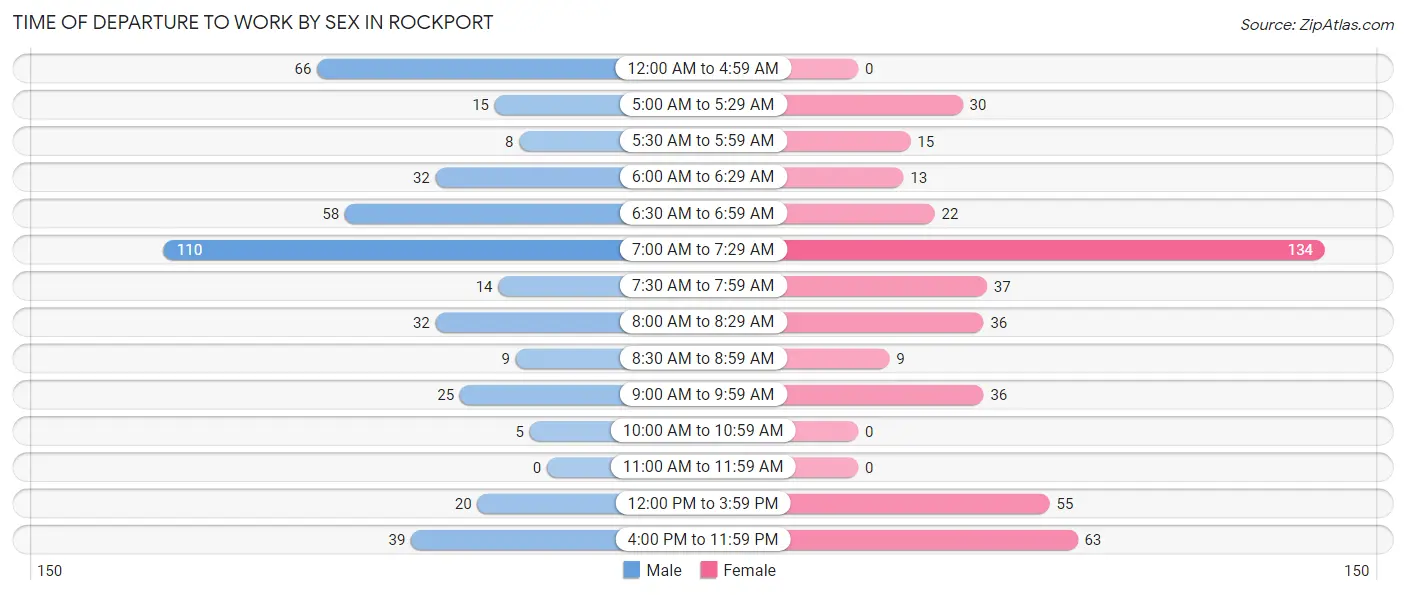
| Time of Departure | Male | Female |
| 12:00 AM to 4:59 AM | 66 (15.2%) | 0 (0.0%) |
| 5:00 AM to 5:29 AM | 15 (3.5%) | 30 (6.7%) |
| 5:30 AM to 5:59 AM | 8 (1.8%) | 15 (3.3%) |
| 6:00 AM to 6:29 AM | 32 (7.4%) | 13 (2.9%) |
| 6:30 AM to 6:59 AM | 58 (13.4%) | 22 (4.9%) |
| 7:00 AM to 7:29 AM | 110 (25.4%) | 134 (29.8%) |
| 7:30 AM to 7:59 AM | 14 (3.2%) | 37 (8.2%) |
| 8:00 AM to 8:29 AM | 32 (7.4%) | 36 (8.0%) |
| 8:30 AM to 8:59 AM | 9 (2.1%) | 9 (2.0%) |
| 9:00 AM to 9:59 AM | 25 (5.8%) | 36 (8.0%) |
| 10:00 AM to 10:59 AM | 5 (1.1%) | 0 (0.0%) |
| 11:00 AM to 11:59 AM | 0 (0.0%) | 0 (0.0%) |
| 12:00 PM to 3:59 PM | 20 (4.6%) | 55 (12.2%) |
| 4:00 PM to 11:59 PM | 39 (9.0%) | 63 (14.0%) |
| Total | 433 (100.0%) | 450 (100.0%) |
Housing Occupancy in Rockport
Occupancy by Ownership in Rockport
Of the total 973 dwellings in Rockport, owner-occupied units account for 513 (52.7%), while renter-occupied units make up 460 (47.3%).
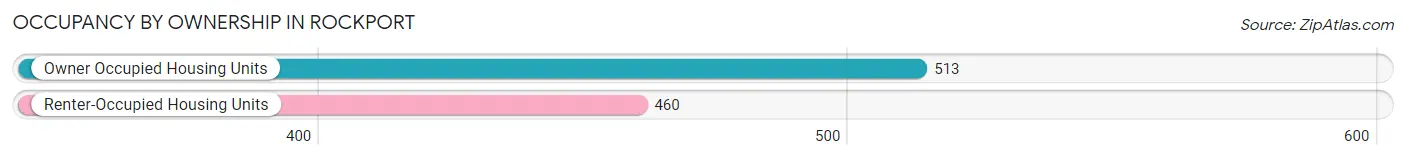
| Occupancy | # Housing Units | % Housing Units |
| Owner Occupied Housing Units | 513 | 52.7% |
| Renter-Occupied Housing Units | 460 | 47.3% |
| Total Occupied Housing Units | 973 | 100.0% |
Occupancy by Household Size in Rockport
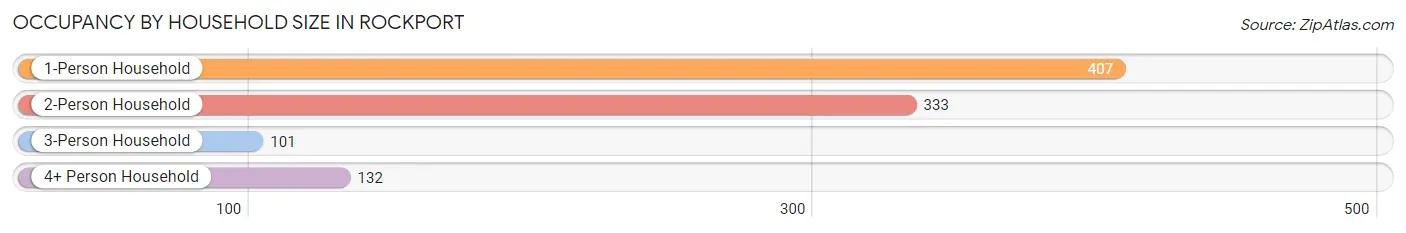
| Household Size | # Housing Units | % Housing Units |
| 1-Person Household | 407 | 41.8% |
| 2-Person Household | 333 | 34.2% |
| 3-Person Household | 101 | 10.4% |
| 4+ Person Household | 132 | 13.6% |
| Total Housing Units | 973 | 100.0% |
Occupancy by Ownership by Household Size in Rockport
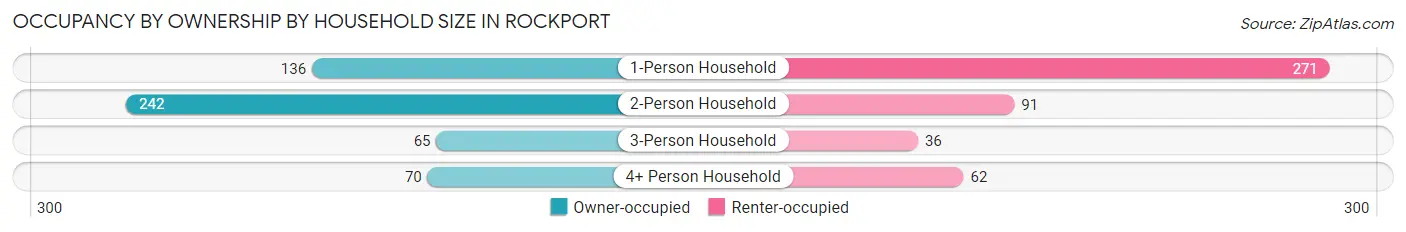
| Household Size | Owner-occupied | Renter-occupied |
| 1-Person Household | 136 (33.4%) | 271 (66.6%) |
| 2-Person Household | 242 (72.7%) | 91 (27.3%) |
| 3-Person Household | 65 (64.4%) | 36 (35.6%) |
| 4+ Person Household | 70 (53.0%) | 62 (47.0%) |
| Total Housing Units | 513 (52.7%) | 460 (47.3%) |
Occupancy by Educational Attainment in Rockport
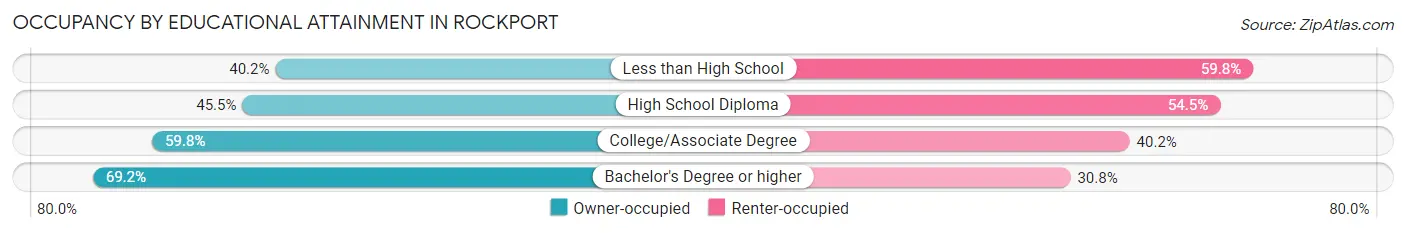
| Household Size | Owner-occupied | Renter-occupied |
| Less than High School | 33 (40.2%) | 49 (59.8%) |
| High School Diploma | 211 (45.5%) | 253 (54.5%) |
| College/Associate Degree | 168 (59.8%) | 113 (40.2%) |
| Bachelor's Degree or higher | 101 (69.2%) | 45 (30.8%) |
Occupancy by Age of Householder in Rockport
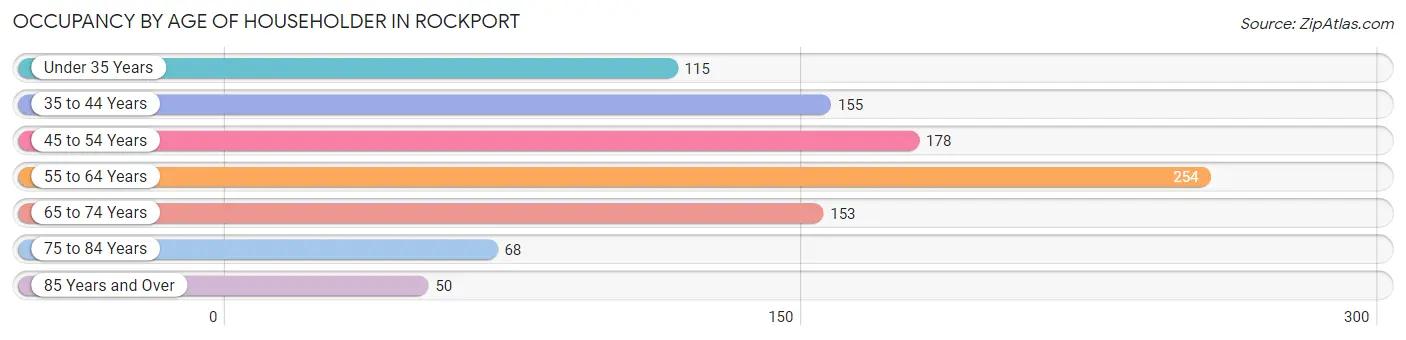
| Age Bracket | # Households | % Households |
| Under 35 Years | 115 | 11.8% |
| 35 to 44 Years | 155 | 15.9% |
| 45 to 54 Years | 178 | 18.3% |
| 55 to 64 Years | 254 | 26.1% |
| 65 to 74 Years | 153 | 15.7% |
| 75 to 84 Years | 68 | 7.0% |
| 85 Years and Over | 50 | 5.1% |
| Total | 973 | 100.0% |
Housing Finances in Rockport
Median Income by Occupancy in Rockport
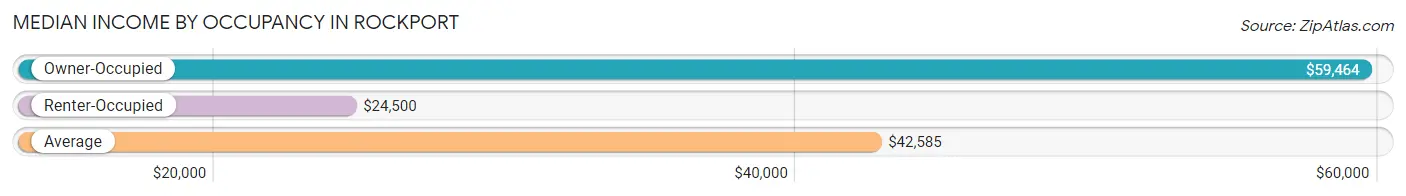
| Occupancy Type | # Households | Median Income |
| Owner-Occupied | 513 (52.7%) | $59,464 |
| Renter-Occupied | 460 (47.3%) | $24,500 |
| Average | 973 (100.0%) | $42,585 |
Occupancy by Householder Income Bracket in Rockport
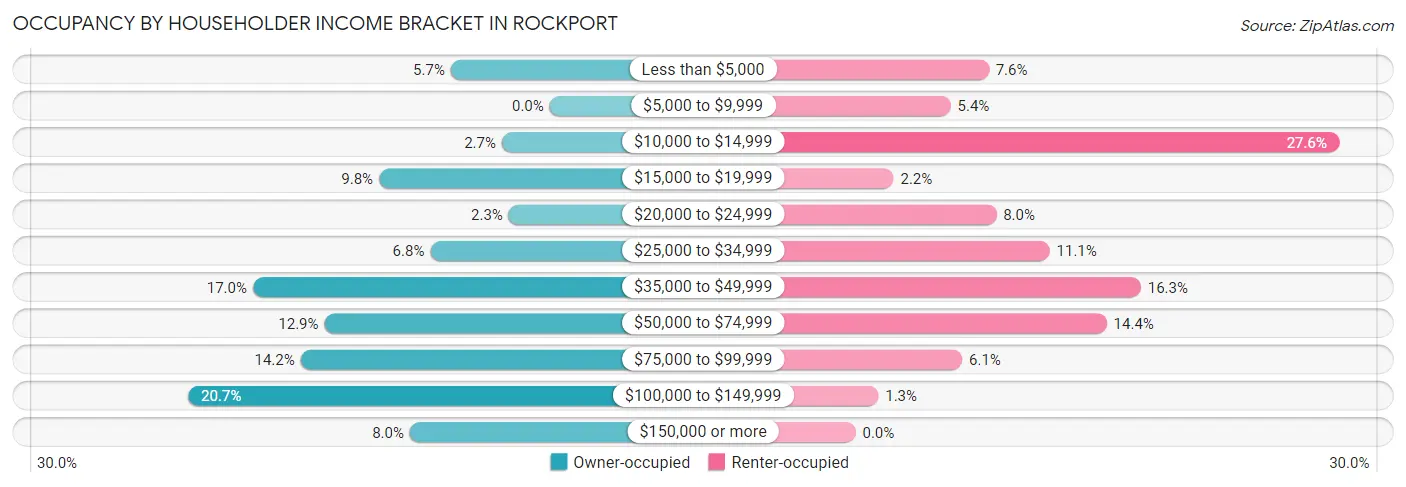
| Income Bracket | Owner-occupied | Renter-occupied |
| Less than $5,000 | 29 (5.7%) | 35 (7.6%) |
| $5,000 to $9,999 | 0 (0.0%) | 25 (5.4%) |
| $10,000 to $14,999 | 14 (2.7%) | 127 (27.6%) |
| $15,000 to $19,999 | 50 (9.8%) | 10 (2.2%) |
| $20,000 to $24,999 | 12 (2.3%) | 37 (8.0%) |
| $25,000 to $34,999 | 35 (6.8%) | 51 (11.1%) |
| $35,000 to $49,999 | 87 (17.0%) | 75 (16.3%) |
| $50,000 to $74,999 | 66 (12.9%) | 66 (14.3%) |
| $75,000 to $99,999 | 73 (14.2%) | 28 (6.1%) |
| $100,000 to $149,999 | 106 (20.7%) | 6 (1.3%) |
| $150,000 or more | 41 (8.0%) | 0 (0.0%) |
| Total | 513 (100.0%) | 460 (100.0%) |
Monthly Housing Cost Tiers in Rockport
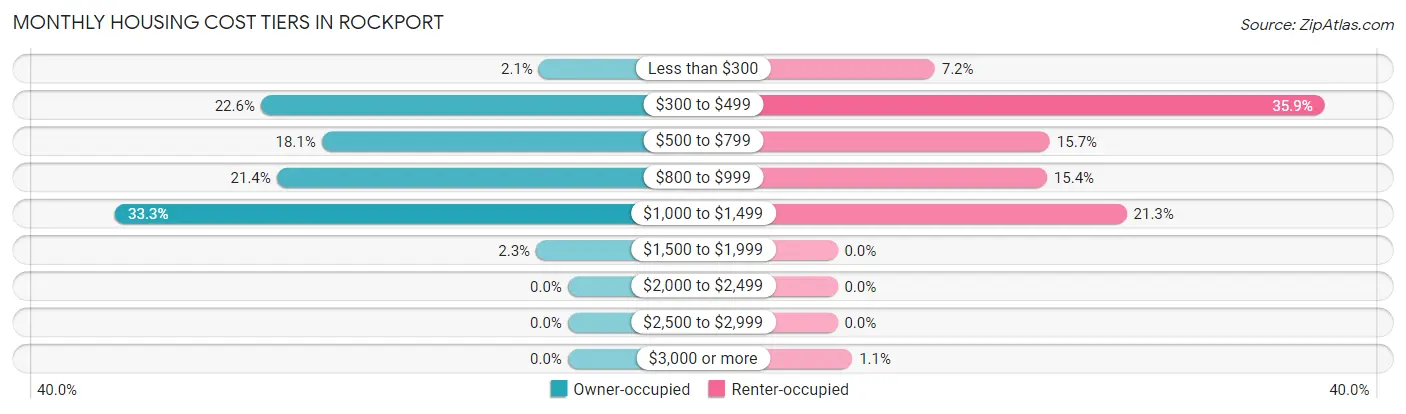
| Monthly Cost | Owner-occupied | Renter-occupied |
| Less than $300 | 11 (2.1%) | 33 (7.2%) |
| $300 to $499 | 116 (22.6%) | 165 (35.9%) |
| $500 to $799 | 93 (18.1%) | 72 (15.7%) |
| $800 to $999 | 110 (21.4%) | 71 (15.4%) |
| $1,000 to $1,499 | 171 (33.3%) | 98 (21.3%) |
| $1,500 to $1,999 | 12 (2.3%) | 0 (0.0%) |
| $2,000 to $2,499 | 0 (0.0%) | 0 (0.0%) |
| $2,500 to $2,999 | 0 (0.0%) | 0 (0.0%) |
| $3,000 or more | 0 (0.0%) | 5 (1.1%) |
| Total | 513 (100.0%) | 460 (100.0%) |
Physical Housing Characteristics in Rockport
Housing Structures in Rockport
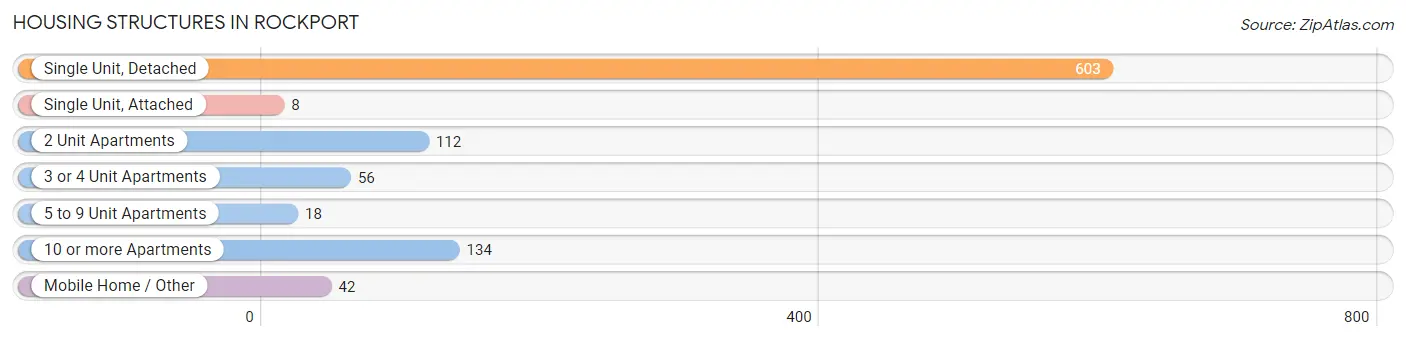
| Structure Type | # Housing Units | % Housing Units |
| Single Unit, Detached | 603 | 62.0% |
| Single Unit, Attached | 8 | 0.8% |
| 2 Unit Apartments | 112 | 11.5% |
| 3 or 4 Unit Apartments | 56 | 5.8% |
| 5 to 9 Unit Apartments | 18 | 1.8% |
| 10 or more Apartments | 134 | 13.8% |
| Mobile Home / Other | 42 | 4.3% |
| Total | 973 | 100.0% |
Housing Structures by Occupancy in Rockport
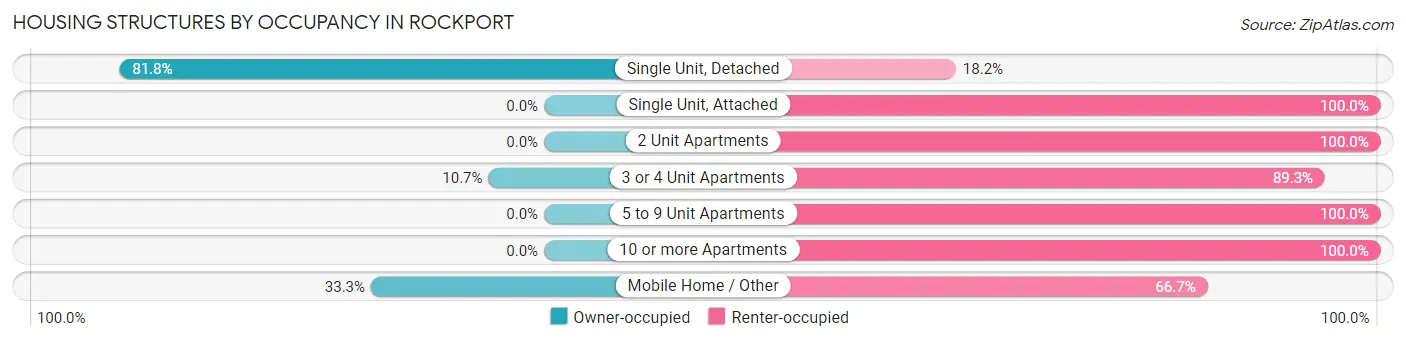
| Structure Type | Owner-occupied | Renter-occupied |
| Single Unit, Detached | 493 (81.8%) | 110 (18.2%) |
| Single Unit, Attached | 0 (0.0%) | 8 (100.0%) |
| 2 Unit Apartments | 0 (0.0%) | 112 (100.0%) |
| 3 or 4 Unit Apartments | 6 (10.7%) | 50 (89.3%) |
| 5 to 9 Unit Apartments | 0 (0.0%) | 18 (100.0%) |
| 10 or more Apartments | 0 (0.0%) | 134 (100.0%) |
| Mobile Home / Other | 14 (33.3%) | 28 (66.7%) |
| Total | 513 (52.7%) | 460 (47.3%) |
Housing Structures by Number of Rooms in Rockport
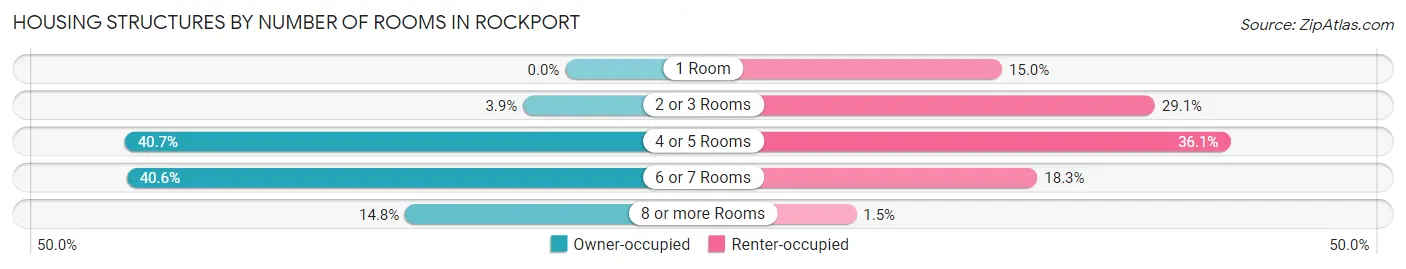
| Number of Rooms | Owner-occupied | Renter-occupied |
| 1 Room | 0 (0.0%) | 69 (15.0%) |
| 2 or 3 Rooms | 20 (3.9%) | 134 (29.1%) |
| 4 or 5 Rooms | 209 (40.7%) | 166 (36.1%) |
| 6 or 7 Rooms | 208 (40.6%) | 84 (18.3%) |
| 8 or more Rooms | 76 (14.8%) | 7 (1.5%) |
| Total | 513 (100.0%) | 460 (100.0%) |
Housing Structure by Heating Type in Rockport
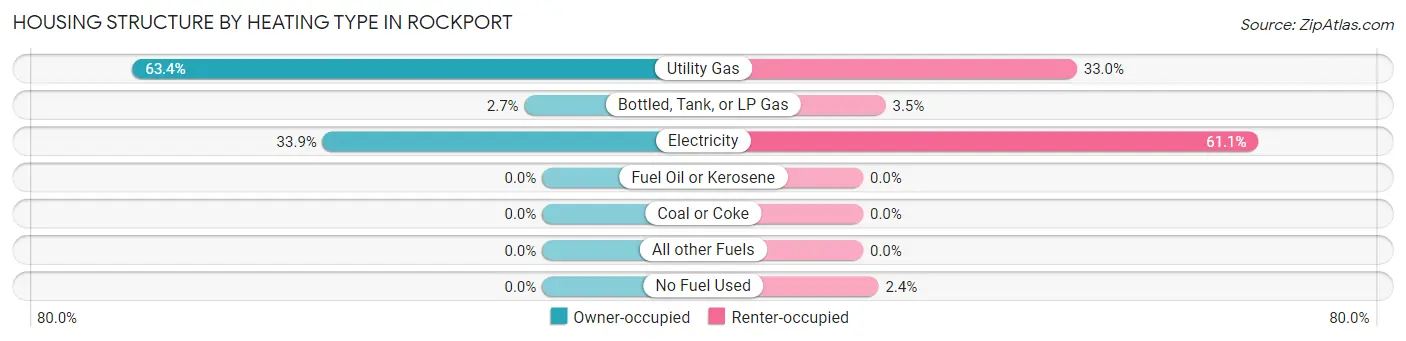
| Heating Type | Owner-occupied | Renter-occupied |
| Utility Gas | 325 (63.3%) | 152 (33.0%) |
| Bottled, Tank, or LP Gas | 14 (2.7%) | 16 (3.5%) |
| Electricity | 174 (33.9%) | 281 (61.1%) |
| Fuel Oil or Kerosene | 0 (0.0%) | 0 (0.0%) |
| Coal or Coke | 0 (0.0%) | 0 (0.0%) |
| All other Fuels | 0 (0.0%) | 0 (0.0%) |
| No Fuel Used | 0 (0.0%) | 11 (2.4%) |
| Total | 513 (100.0%) | 460 (100.0%) |
Household Vehicle Usage in Rockport
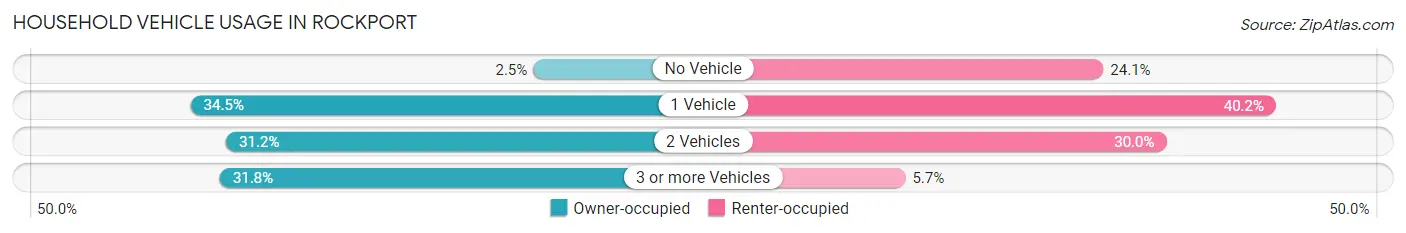
| Vehicles per Household | Owner-occupied | Renter-occupied |
| No Vehicle | 13 (2.5%) | 111 (24.1%) |
| 1 Vehicle | 177 (34.5%) | 185 (40.2%) |
| 2 Vehicles | 160 (31.2%) | 138 (30.0%) |
| 3 or more Vehicles | 163 (31.8%) | 26 (5.7%) |
| Total | 513 (100.0%) | 460 (100.0%) |
Real Estate & Mortgages in Rockport
Real Estate and Mortgage Overview in Rockport
| Characteristic | Without Mortgage | With Mortgage |
| Housing Units | 222 | 291 |
| Median Property Value | $125,000 | $108,000 |
| Median Household Income | $60,250 | $0 |
| Monthly Housing Costs | $464 | $0 |
| Real Estate Taxes | $794 | $59 |
Property Value by Mortgage Status in Rockport
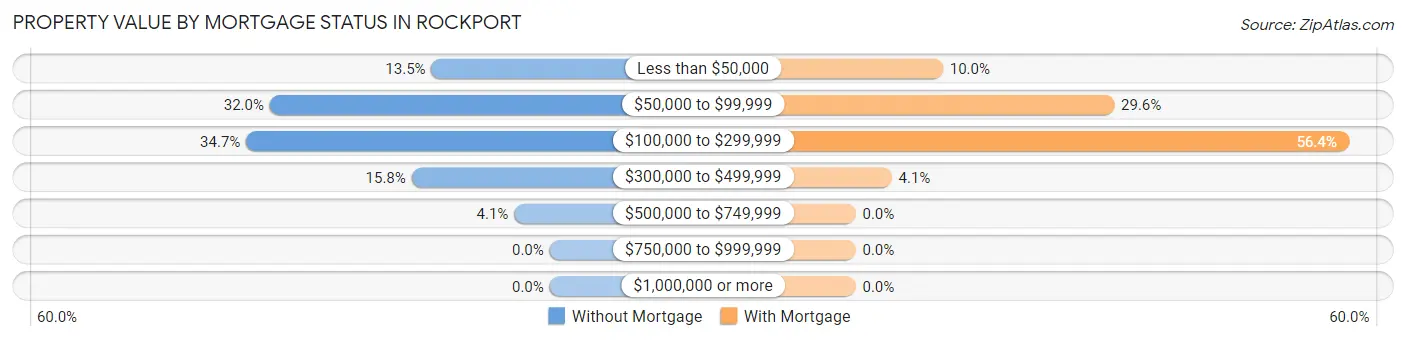
| Property Value | Without Mortgage | With Mortgage |
| Less than $50,000 | 30 (13.5%) | 29 (10.0%) |
| $50,000 to $99,999 | 71 (32.0%) | 86 (29.5%) |
| $100,000 to $299,999 | 77 (34.7%) | 164 (56.4%) |
| $300,000 to $499,999 | 35 (15.8%) | 12 (4.1%) |
| $500,000 to $749,999 | 9 (4.1%) | 0 (0.0%) |
| $750,000 to $999,999 | 0 (0.0%) | 0 (0.0%) |
| $1,000,000 or more | 0 (0.0%) | 0 (0.0%) |
| Total | 222 (100.0%) | 291 (100.0%) |
Household Income by Mortgage Status in Rockport
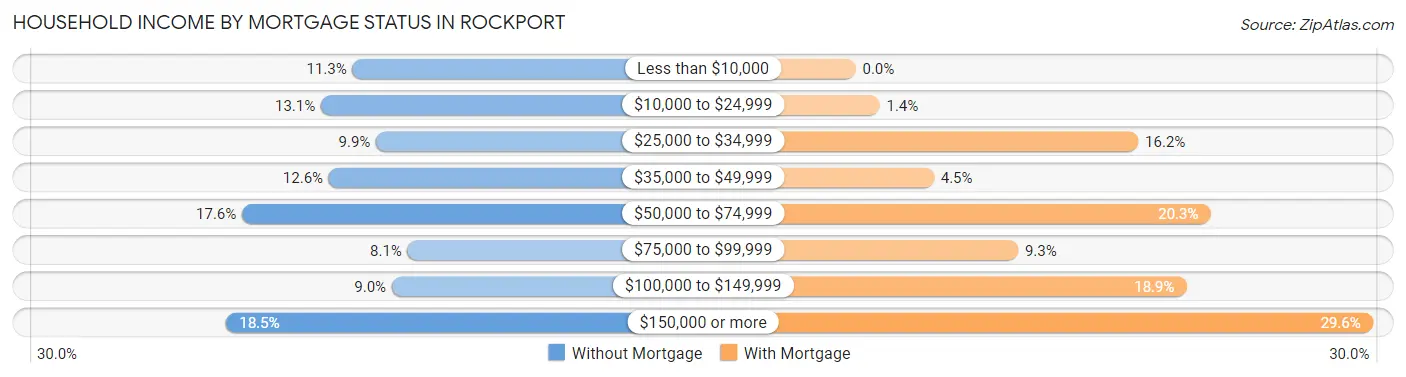
| Household Income | Without Mortgage | With Mortgage |
| Less than $10,000 | 25 (11.3%) | 0 (0.0%) |
| $10,000 to $24,999 | 29 (13.1%) | 4 (1.4%) |
| $25,000 to $34,999 | 22 (9.9%) | 47 (16.2%) |
| $35,000 to $49,999 | 28 (12.6%) | 13 (4.5%) |
| $50,000 to $74,999 | 39 (17.6%) | 59 (20.3%) |
| $75,000 to $99,999 | 18 (8.1%) | 27 (9.3%) |
| $100,000 to $149,999 | 20 (9.0%) | 55 (18.9%) |
| $150,000 or more | 41 (18.5%) | 86 (29.5%) |
| Total | 222 (100.0%) | 291 (100.0%) |
Property Value to Household Income Ratio in Rockport
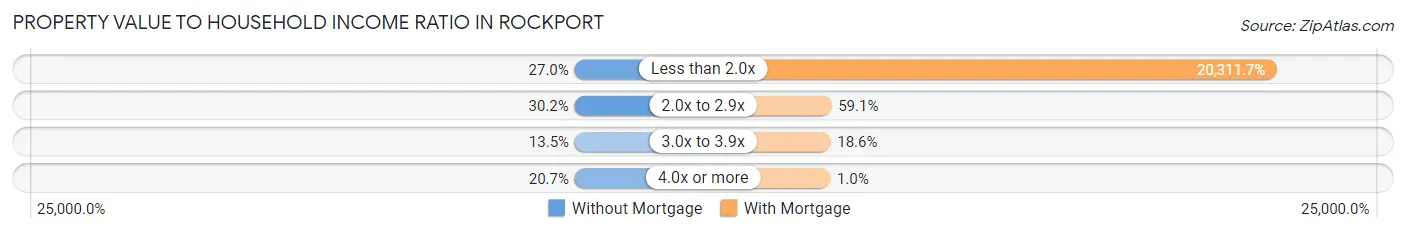
| Value-to-Income Ratio | Without Mortgage | With Mortgage |
| Less than 2.0x | 60 (27.0%) | 59,107 (20,311.7%) |
| 2.0x to 2.9x | 67 (30.2%) | 172 (59.1%) |
| 3.0x to 3.9x | 30 (13.5%) | 54 (18.6%) |
| 4.0x or more | 46 (20.7%) | 3 (1.0%) |
| Total | 222 (100.0%) | 291 (100.0%) |
Real Estate Taxes by Mortgage Status in Rockport
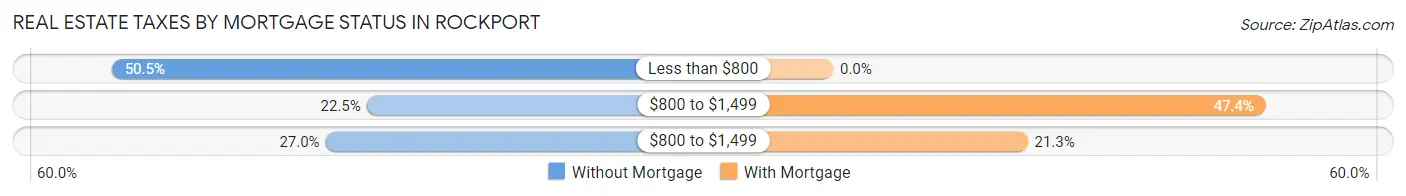
| Property Taxes | Without Mortgage | With Mortgage |
| Less than $800 | 112 (50.4%) | 0 (0.0%) |
| $800 to $1,499 | 50 (22.5%) | 138 (47.4%) |
| $800 to $1,499 | 60 (27.0%) | 62 (21.3%) |
| Total | 222 (100.0%) | 291 (100.0%) |
Health & Disability in Rockport
Health Insurance Coverage by Age in Rockport
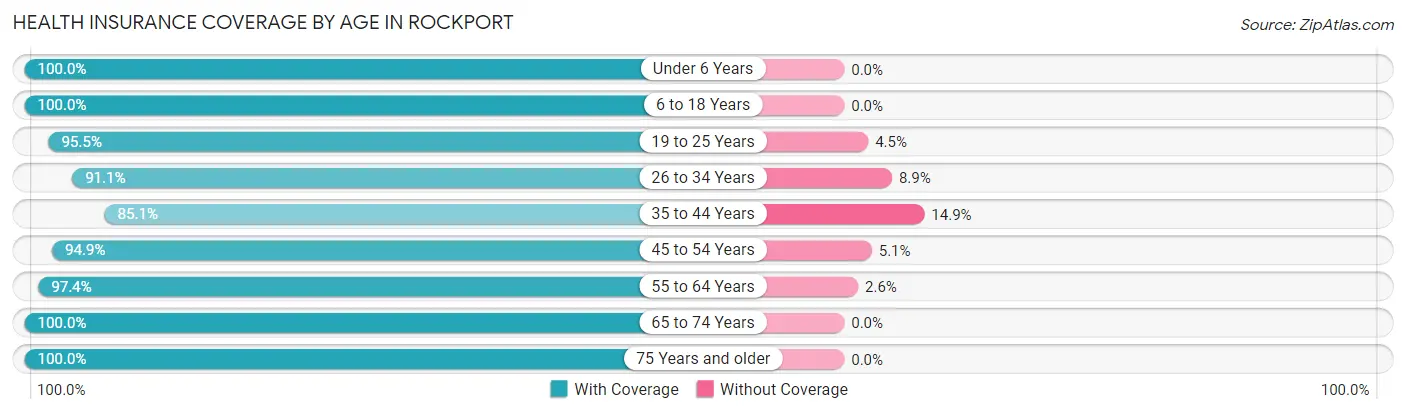
| Age Bracket | With Coverage | Without Coverage |
| Under 6 Years | 152 (100.0%) | 0 (0.0%) |
| 6 to 18 Years | 298 (100.0%) | 0 (0.0%) |
| 19 to 25 Years | 107 (95.5%) | 5 (4.5%) |
| 26 to 34 Years | 205 (91.1%) | 20 (8.9%) |
| 35 to 44 Years | 222 (85.1%) | 39 (14.9%) |
| 45 to 54 Years | 222 (94.9%) | 12 (5.1%) |
| 55 to 64 Years | 417 (97.4%) | 11 (2.6%) |
| 65 to 74 Years | 212 (100.0%) | 0 (0.0%) |
| 75 Years and older | 155 (100.0%) | 0 (0.0%) |
| Total | 1,990 (95.8%) | 87 (4.2%) |
Health Insurance Coverage by Citizenship Status in Rockport
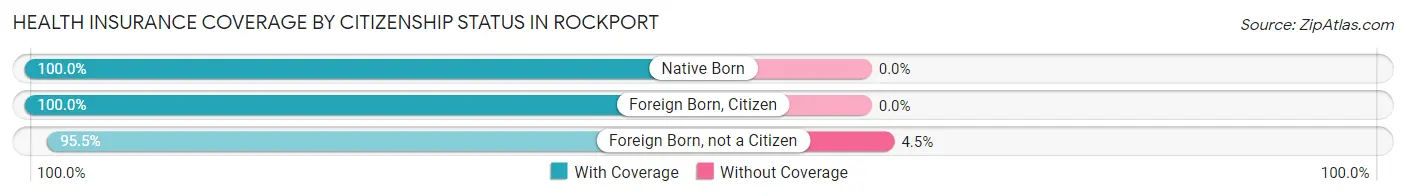
| Citizenship Status | With Coverage | Without Coverage |
| Native Born | 152 (100.0%) | 0 (0.0%) |
| Foreign Born, Citizen | 298 (100.0%) | 0 (0.0%) |
| Foreign Born, not a Citizen | 107 (95.5%) | 5 (4.5%) |
Health Insurance Coverage by Household Income in Rockport
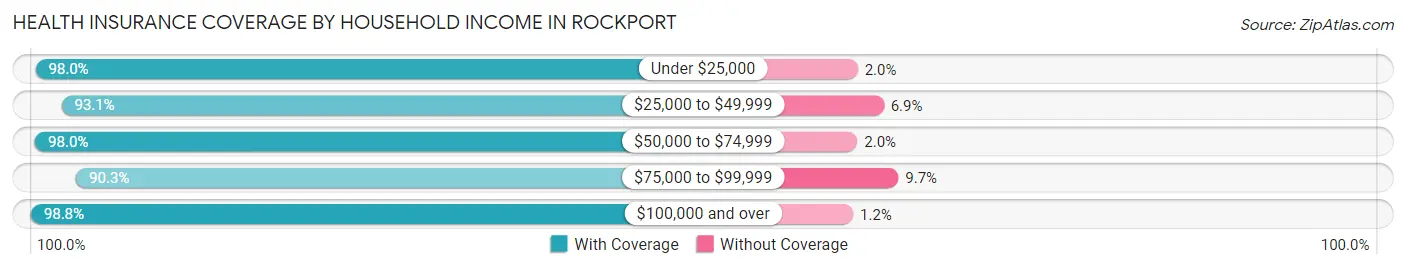
| Household Income | With Coverage | Without Coverage |
| Under $25,000 | 433 (98.0%) | 9 (2.0%) |
| $25,000 to $49,999 | 579 (93.1%) | 43 (6.9%) |
| $50,000 to $74,999 | 346 (98.0%) | 7 (2.0%) |
| $75,000 to $99,999 | 215 (90.3%) | 23 (9.7%) |
| $100,000 and over | 417 (98.8%) | 5 (1.2%) |
Public vs Private Health Insurance Coverage by Age in Rockport
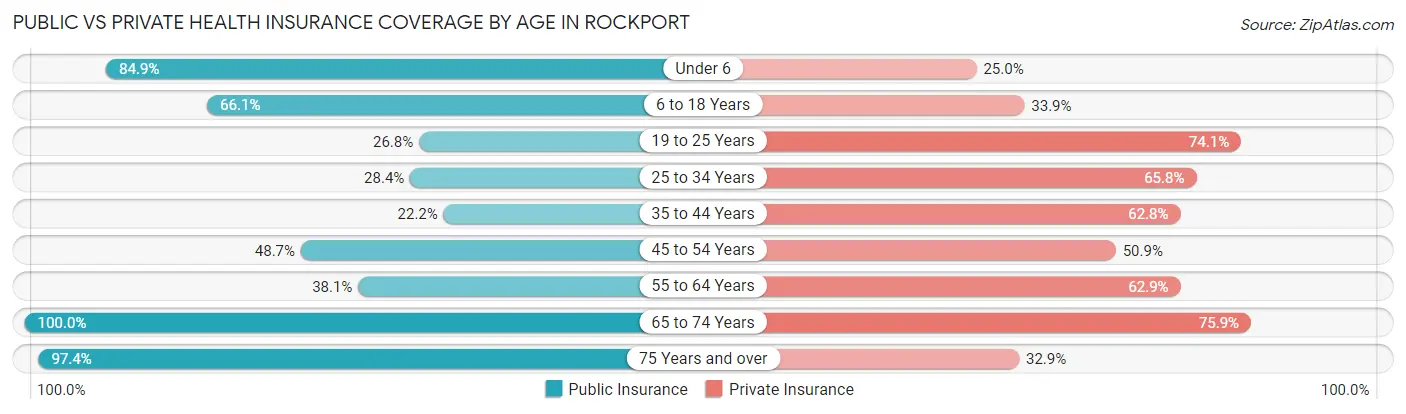
| Age Bracket | Public Insurance | Private Insurance |
| Under 6 | 129 (84.9%) | 38 (25.0%) |
| 6 to 18 Years | 197 (66.1%) | 101 (33.9%) |
| 19 to 25 Years | 30 (26.8%) | 83 (74.1%) |
| 25 to 34 Years | 64 (28.4%) | 148 (65.8%) |
| 35 to 44 Years | 58 (22.2%) | 164 (62.8%) |
| 45 to 54 Years | 114 (48.7%) | 119 (50.8%) |
| 55 to 64 Years | 163 (38.1%) | 269 (62.8%) |
| 65 to 74 Years | 212 (100.0%) | 161 (75.9%) |
| 75 Years and over | 151 (97.4%) | 51 (32.9%) |
| Total | 1,118 (53.8%) | 1,134 (54.6%) |
Disability Status by Sex by Age in Rockport
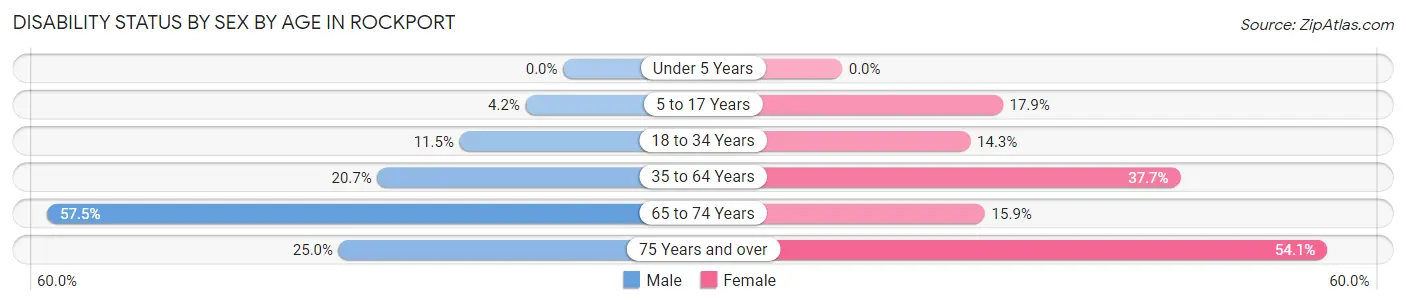
| Age Bracket | Male | Female |
| Under 5 Years | 0 (0.0%) | 0 (0.0%) |
| 5 to 17 Years | 6 (4.2%) | 29 (17.9%) |
| 18 to 34 Years | 21 (11.5%) | 26 (14.3%) |
| 35 to 64 Years | 90 (20.7%) | 184 (37.7%) |
| 65 to 74 Years | 46 (57.5%) | 21 (15.9%) |
| 75 Years and over | 11 (25.0%) | 60 (54.0%) |
Disability Class by Sex by Age in Rockport
Disability Class: Hearing Difficulty
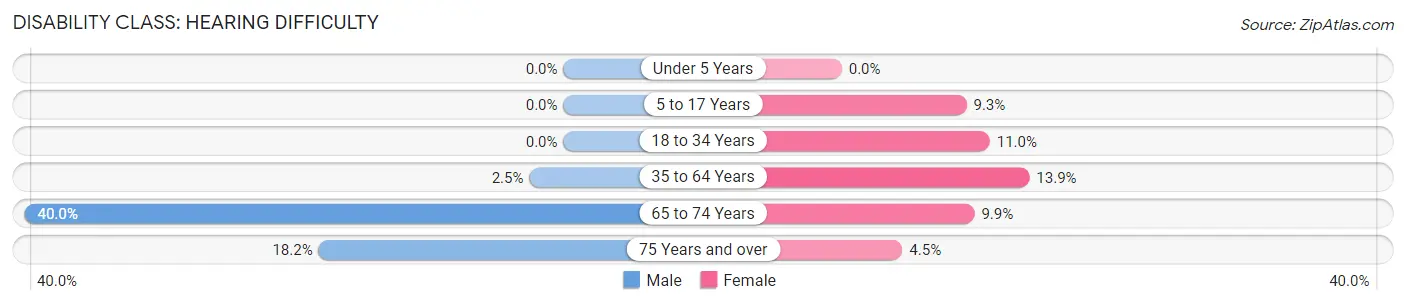
| Age Bracket | Male | Female |
| Under 5 Years | 0 (0.0%) | 0 (0.0%) |
| 5 to 17 Years | 0 (0.0%) | 15 (9.3%) |
| 18 to 34 Years | 0 (0.0%) | 20 (11.0%) |
| 35 to 64 Years | 11 (2.5%) | 68 (13.9%) |
| 65 to 74 Years | 32 (40.0%) | 13 (9.9%) |
| 75 Years and over | 8 (18.2%) | 5 (4.5%) |
Disability Class: Vision Difficulty
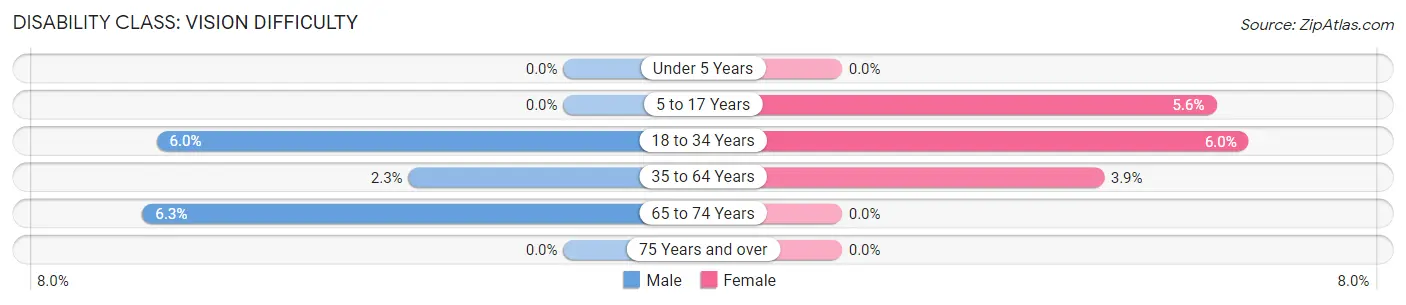
| Age Bracket | Male | Female |
| Under 5 Years | 0 (0.0%) | 0 (0.0%) |
| 5 to 17 Years | 0 (0.0%) | 9 (5.6%) |
| 18 to 34 Years | 11 (6.0%) | 11 (6.0%) |
| 35 to 64 Years | 10 (2.3%) | 19 (3.9%) |
| 65 to 74 Years | 5 (6.2%) | 0 (0.0%) |
| 75 Years and over | 0 (0.0%) | 0 (0.0%) |
Disability Class: Cognitive Difficulty
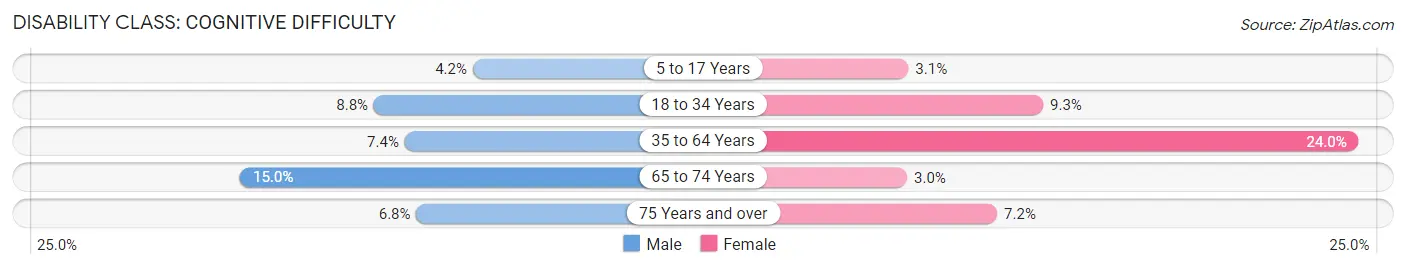
| Age Bracket | Male | Female |
| 5 to 17 Years | 6 (4.2%) | 5 (3.1%) |
| 18 to 34 Years | 16 (8.8%) | 17 (9.3%) |
| 35 to 64 Years | 32 (7.4%) | 117 (24.0%) |
| 65 to 74 Years | 12 (15.0%) | 4 (3.0%) |
| 75 Years and over | 3 (6.8%) | 8 (7.2%) |
Disability Class: Ambulatory Difficulty
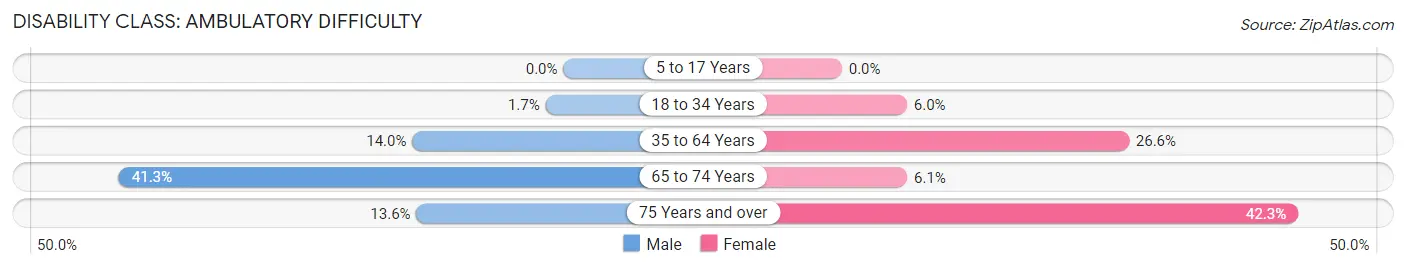
| Age Bracket | Male | Female |
| 5 to 17 Years | 0 (0.0%) | 0 (0.0%) |
| 18 to 34 Years | 3 (1.7%) | 11 (6.0%) |
| 35 to 64 Years | 61 (14.0%) | 130 (26.6%) |
| 65 to 74 Years | 33 (41.2%) | 8 (6.1%) |
| 75 Years and over | 6 (13.6%) | 47 (42.3%) |
Disability Class: Self-Care Difficulty
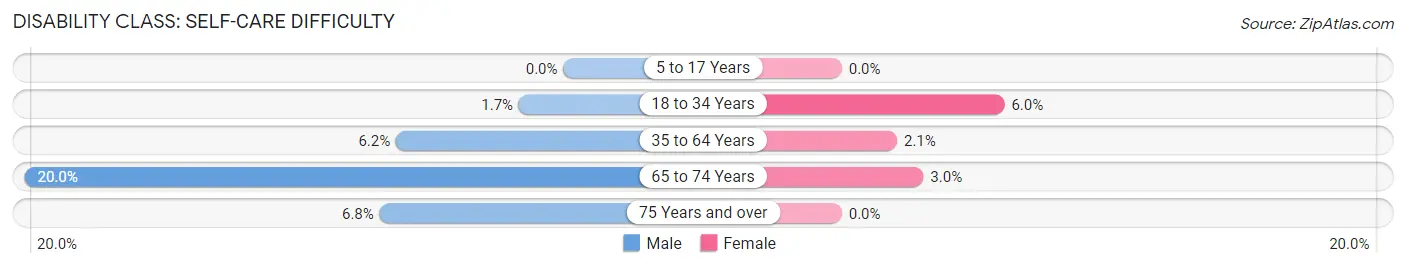
| Age Bracket | Male | Female |
| 5 to 17 Years | 0 (0.0%) | 0 (0.0%) |
| 18 to 34 Years | 3 (1.7%) | 11 (6.0%) |
| 35 to 64 Years | 27 (6.2%) | 10 (2.1%) |
| 65 to 74 Years | 16 (20.0%) | 4 (3.0%) |
| 75 Years and over | 3 (6.8%) | 0 (0.0%) |
Technology Access in Rockport
Computing Device Access in Rockport
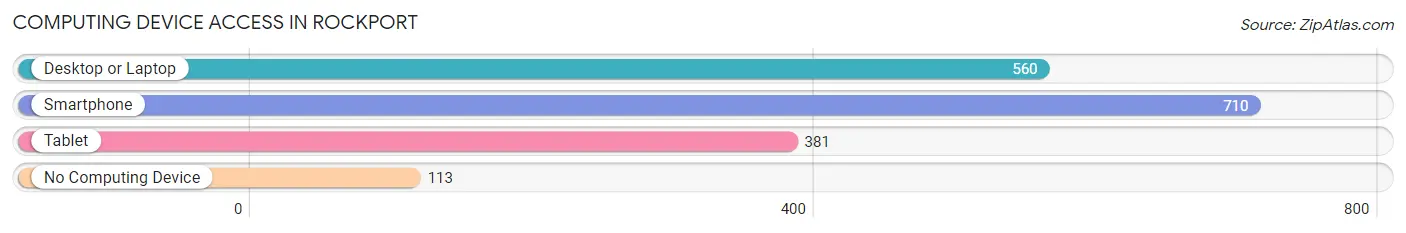
| Device Type | # Households | % Households |
| Desktop or Laptop | 560 | 57.6% |
| Smartphone | 710 | 73.0% |
| Tablet | 381 | 39.2% |
| No Computing Device | 113 | 11.6% |
| Total | 973 | 100.0% |
Internet Access in Rockport
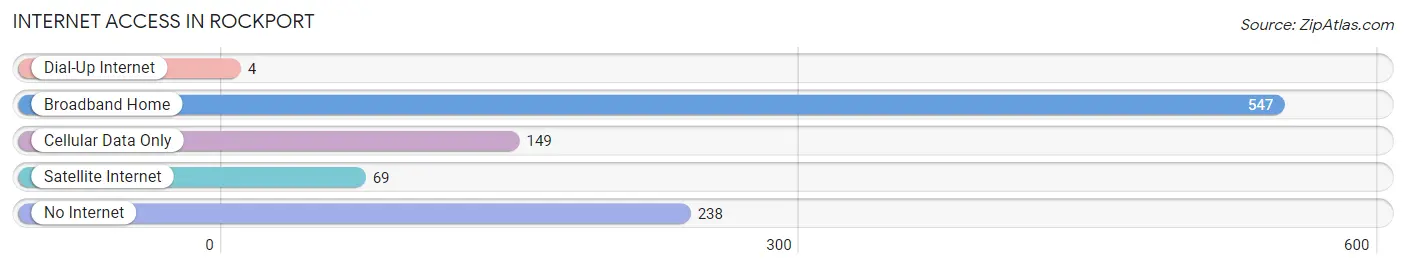
| Internet Type | # Households | % Households |
| Dial-Up Internet | 4 | 0.4% |
| Broadband Home | 547 | 56.2% |
| Cellular Data Only | 149 | 15.3% |
| Satellite Internet | 69 | 7.1% |
| No Internet | 238 | 24.5% |
| Total | 973 | 100.0% |
Rockport Summary
Rockport, Indiana is a small city located in the southwestern corner of the state, in Spencer County. It is situated on the banks of the Ohio River, and is the county seat of Spencer County. The city has a population of 2,717, according to the 2010 census.
History
Rockport was founded in 1818 by a group of settlers from Kentucky. The town was named after the rocky terrain of the area, and was originally known as Rockport Landing. The town was incorporated in 1851, and the first post office was established in 1852.
The city was an important port on the Ohio River, and was a major hub for the steamboat industry. The steamboats brought goods and passengers to the city, and the town grew rapidly. By the late 19th century, Rockport had become a major center for the lumber industry, and the city was home to several sawmills and other wood-related businesses.
In the early 20th century, the city was a major center for the coal mining industry. The coal mines provided jobs for many of the city's residents, and the city's economy was largely dependent on the coal industry.
Geography
Rockport is located in the southwestern corner of Indiana, in Spencer County. The city is situated on the banks of the Ohio River, and is bordered by the towns of Grandview, Chrisney, and Santa Claus. The city is located approximately 50 miles east of Evansville, Indiana, and is about 100 miles west of Louisville, Kentucky.
The city has a total area of 2.2 square miles, all of which is land. The terrain of the area is mostly flat, with some rolling hills. The climate of the area is humid continental, with hot summers and cold winters.
Economy
The economy of Rockport is largely based on the coal mining industry. The city is home to several coal mines, and the coal industry provides jobs for many of the city's residents. The city is also home to several manufacturing companies, including a furniture factory and a plastics factory.
The city is also home to several retail stores, restaurants, and other businesses. The city is served by the Rockport-Spencer County Airport, which provides air service to the city and the surrounding area.
Demographics
According to the 2010 census, the population of Rockport was 2,717. The racial makeup of the city was 97.3% White, 0.7% African American, 0.2% Native American, 0.3% Asian, 0.1% Pacific Islander, 0.4% from other races, and 1.0% from two or more races. Hispanic or Latino of any race were 1.2% of the population.
The median household income in Rockport was $37,917, and the median family income was $45,938. The per capita income for the city was $19,945. About 11.2% of families and 14.2% of the population were below the poverty line, including 19.2% of those under age 18 and 8.2% of those age 65 or over.
Common Questions
What is Per Capita Income in Rockport?
Per Capita income in Rockport is $25,582.
What is the Median Family Income in Rockport?
Median Family Income in Rockport is $51,793.
What is the Median Household income in Rockport?
Median Household Income in Rockport is $42,585.
What is Income or Wage Gap in Rockport?
Income or Wage Gap in Rockport is 38.4%.
Women in Rockport earn 61.6 cents for every dollar earned by a man.
What is Inequality or Gini Index in Rockport?
Inequality or Gini Index in Rockport is 0.46.
What is the Total Population of Rockport?
Total Population of Rockport is 2,183.
What is the Total Male Population of Rockport?
Total Male Population of Rockport is 990.
What is the Total Female Population of Rockport?
Total Female Population of Rockport is 1,193.
What is the Ratio of Males per 100 Females in Rockport?
There are 82.98 Males per 100 Females in Rockport.
What is the Ratio of Females per 100 Males in Rockport?
There are 120.51 Females per 100 Males in Rockport.
What is the Median Population Age in Rockport?
Median Population Age in Rockport is 45.0 Years.
What is the Average Family Size in Rockport
Average Family Size in Rockport is 3.0 People.
What is the Average Household Size in Rockport
Average Household Size in Rockport is 2.1 People.
How Large is the Labor Force in Rockport?
There are 973 People in the Labor Forcein in Rockport.
What is the Percentage of People in the Labor Force in Rockport?
53.1% of People are in the Labor Force in Rockport.
What is the Unemployment Rate in Rockport?
Unemployment Rate in Rockport is 5.3%.