Plainville, IN Map & Demographics
Plainville Map
Plainville Overview
$25,168
PER CAPITA INCOME
$60,313
AVG FAMILY INCOME
$46,477
AVG HOUSEHOLD INCOME
3.6%
WAGE / INCOME GAP [ % ]
96.4¢/ $1
WAGE / INCOME GAP [ $ ]
0.36
INEQUALITY / GINI INDEX
442
TOTAL POPULATION
227
MALE POPULATION
215
FEMALE POPULATION
105.58
MALES / 100 FEMALES
94.71
FEMALES / 100 MALES
34.5
MEDIAN AGE
3.2
AVG FAMILY SIZE
2.4
AVG HOUSEHOLD SIZE
215
LABOR FORCE [ PEOPLE ]
65.0%
PERCENT IN LABOR FORCE
9.8%
UNEMPLOYMENT RATE
Plainville Zip Codes
Plainville Area Codes
Income in Plainville
Income Overview in Plainville
Per Capita Income in Plainville is $25,168, while median incomes of families and households are $60,313 and $46,477 respectively.
| Characteristic | Number | Measure |
| Per Capita Income | 442 | $25,168 |
| Median Family Income | 109 | $60,313 |
| Mean Family Income | 109 | $70,967 |
| Median Household Income | 185 | $46,477 |
| Mean Household Income | 185 | $59,045 |
| Income Deficit | 109 | $0 |
| Wage / Income Gap (%) | 442 | 3.61% |
| Wage / Income Gap ($) | 442 | 96.39¢ per $1 |
| Gini / Inequality Index | 442 | 0.36 |
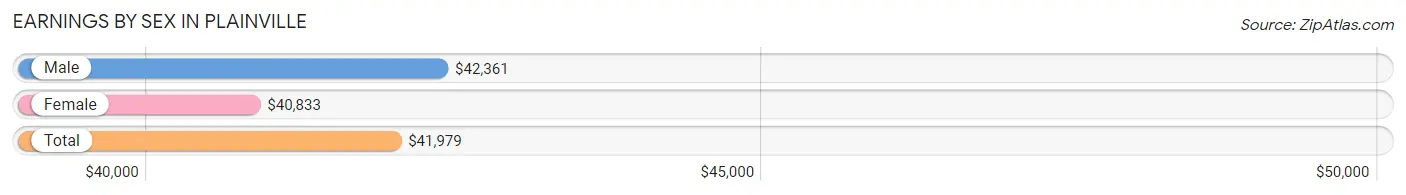
Earnings by Sex in Plainville
Average Earnings in Plainville are $41,979, $42,361 for men and $40,833 for women, a difference of 3.6%.
| Sex | Number | Average Earnings |
| Male | 123 (59.4%) | $42,361 |
| Female | 84 (40.6%) | $40,833 |
| Total | 207 (100.0%) | $41,979 |
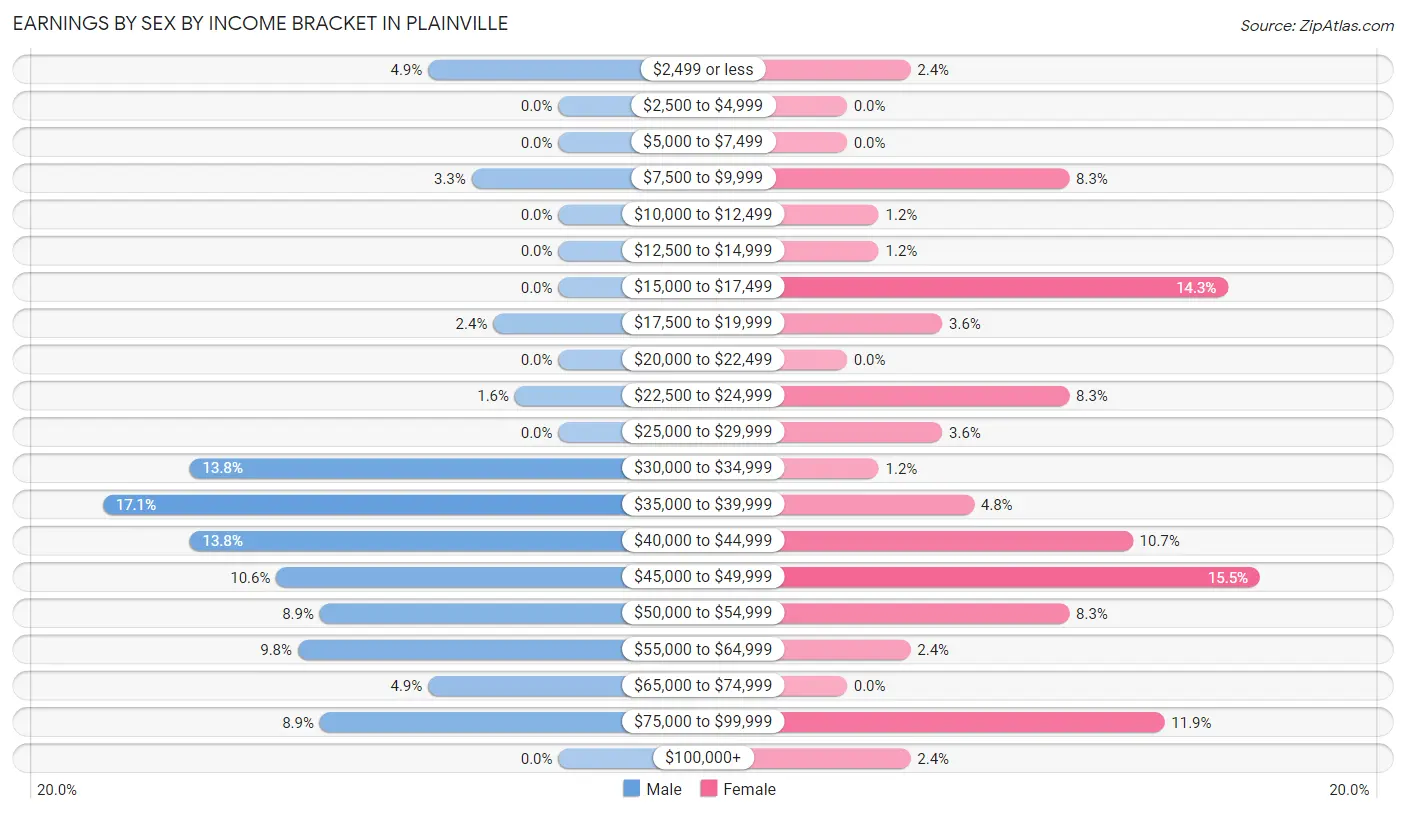
Earnings by Sex by Income Bracket in Plainville
The most common earnings brackets in Plainville are $35,000 to $39,999 for men (21 | 17.1%) and $45,000 to $49,999 for women (13 | 15.5%).
| Income | Male | Female |
| $2,499 or less | 6 (4.9%) | 2 (2.4%) |
| $2,500 to $4,999 | 0 (0.0%) | 0 (0.0%) |
| $5,000 to $7,499 | 0 (0.0%) | 0 (0.0%) |
| $7,500 to $9,999 | 4 (3.3%) | 7 (8.3%) |
| $10,000 to $12,499 | 0 (0.0%) | 1 (1.2%) |
| $12,500 to $14,999 | 0 (0.0%) | 1 (1.2%) |
| $15,000 to $17,499 | 0 (0.0%) | 12 (14.3%) |
| $17,500 to $19,999 | 3 (2.4%) | 3 (3.6%) |
| $20,000 to $22,499 | 0 (0.0%) | 0 (0.0%) |
| $22,500 to $24,999 | 2 (1.6%) | 7 (8.3%) |
| $25,000 to $29,999 | 0 (0.0%) | 3 (3.6%) |
| $30,000 to $34,999 | 17 (13.8%) | 1 (1.2%) |
| $35,000 to $39,999 | 21 (17.1%) | 4 (4.8%) |
| $40,000 to $44,999 | 17 (13.8%) | 9 (10.7%) |
| $45,000 to $49,999 | 13 (10.6%) | 13 (15.5%) |
| $50,000 to $54,999 | 11 (8.9%) | 7 (8.3%) |
| $55,000 to $64,999 | 12 (9.8%) | 2 (2.4%) |
| $65,000 to $74,999 | 6 (4.9%) | 0 (0.0%) |
| $75,000 to $99,999 | 11 (8.9%) | 10 (11.9%) |
| $100,000+ | 0 (0.0%) | 2 (2.4%) |
| Total | 123 (100.0%) | 84 (100.0%) |
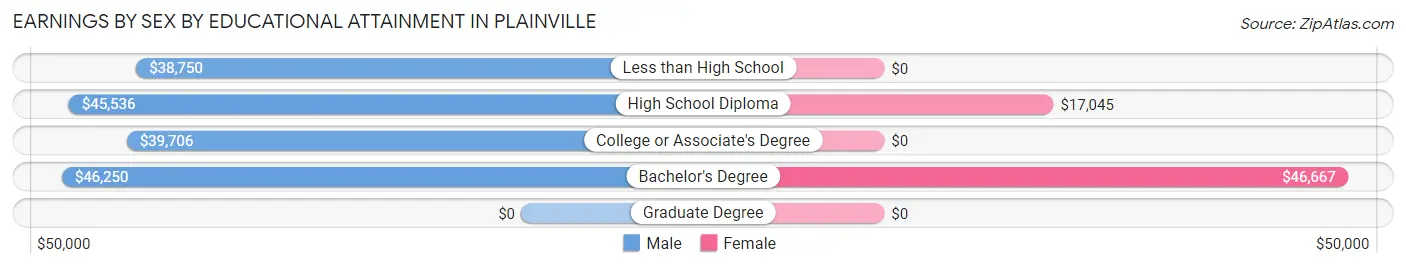
Earnings by Sex by Educational Attainment in Plainville
Average earnings in Plainville are $45,000 for men and $43,125 for women, a difference of 4.2%. Men with an educational attainment of bachelor's degree enjoy the highest average annual earnings of $46,250, while those with less than high school education earn the least with $38,750. Women with an educational attainment of bachelor's degree earn the most with the average annual earnings of $46,667, while those with high school diploma education have the smallest earnings of $17,045.
| Educational Attainment | Male Income | Female Income |
| Less than High School | $38,750 | $0 |
| High School Diploma | $45,536 | $17,045 |
| College or Associate's Degree | $39,706 | $0 |
| Bachelor's Degree | $46,250 | $46,667 |
| Graduate Degree | - | - |
| Total | $45,000 | $43,125 |
Family Income in Plainville
Family Income Brackets in Plainville
According to the Plainville family income data, there are 30 families falling into the $35,000 to $49,999 income range, which is the most common income bracket and makes up 27.5% of all families.
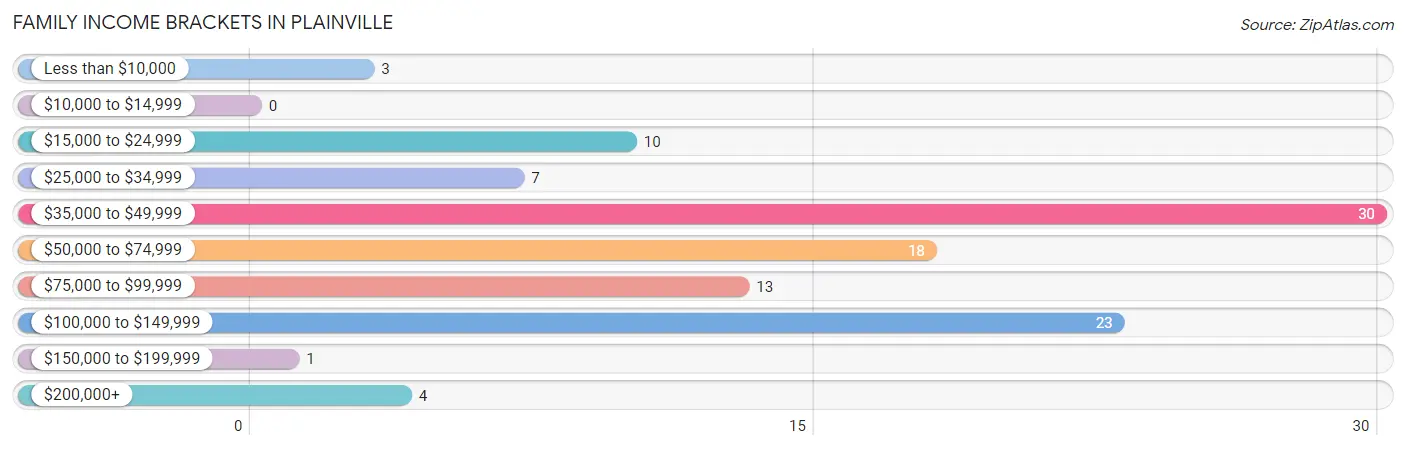
| Income Bracket | # Families | % Families |
| Less than $10,000 | 3 | 2.8% |
| $10,000 to $14,999 | 0 | 0.0% |
| $15,000 to $24,999 | 10 | 9.2% |
| $25,000 to $34,999 | 7 | 6.4% |
| $35,000 to $49,999 | 30 | 27.5% |
| $50,000 to $74,999 | 18 | 16.5% |
| $75,000 to $99,999 | 13 | 11.9% |
| $100,000 to $149,999 | 23 | 21.1% |
| $150,000 to $199,999 | 1 | 0.9% |
| $200,000+ | 4 | 3.7% |
Family Income by Famaliy Size in Plainville
3-person families (34 | 31.2%) account for the highest median family income in Plainville with $100,625 per family, while 3-person families (34 | 31.2%) have the highest median income of $33,542 per family member.
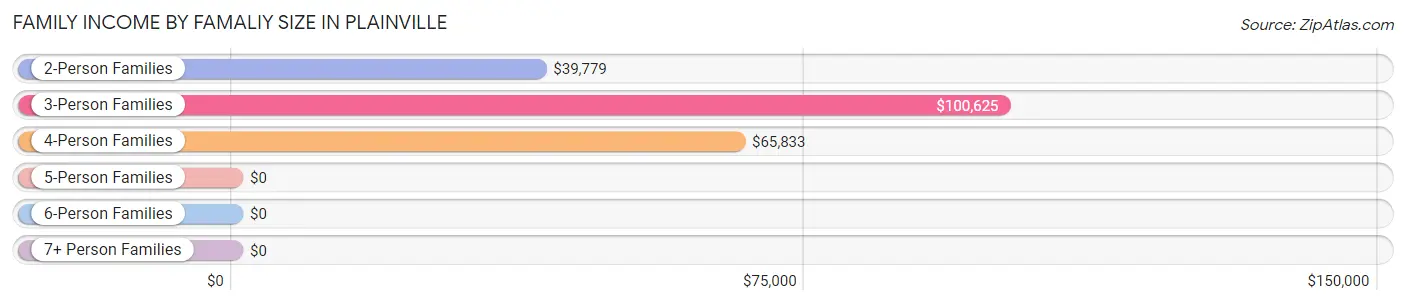
| Income Bracket | # Families | Median Income |
| 2-Person Families | 43 (39.5%) | $39,779 |
| 3-Person Families | 34 (31.2%) | $100,625 |
| 4-Person Families | 22 (20.2%) | $65,833 |
| 5-Person Families | 3 (2.8%) | $0 |
| 6-Person Families | 5 (4.6%) | $0 |
| 7+ Person Families | 2 (1.8%) | $0 |
| Total | 109 (100.0%) | $60,313 |
Family Income by Number of Earners in Plainville
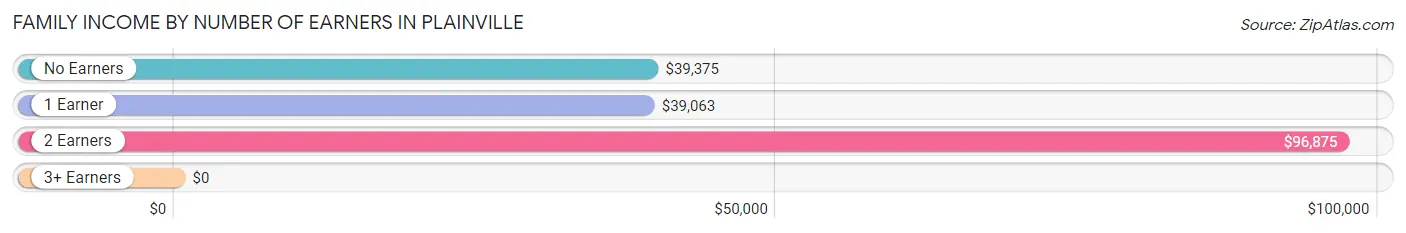
| Number of Earners | # Families | Median Income |
| No Earners | 13 (11.9%) | $39,375 |
| 1 Earner | 40 (36.7%) | $39,063 |
| 2 Earners | 49 (45.0%) | $96,875 |
| 3+ Earners | 7 (6.4%) | $0 |
| Total | 109 (100.0%) | $60,313 |
Household Income in Plainville
Household Income Brackets in Plainville
With 56 households falling in the category, the $35,000 to $49,999 income range is the most frequent in Plainville, accounting for 30.3% of all households. In contrast, only 1 households (0.5%) fall into the $150,000 to $199,999 income bracket, making it the least populous group.
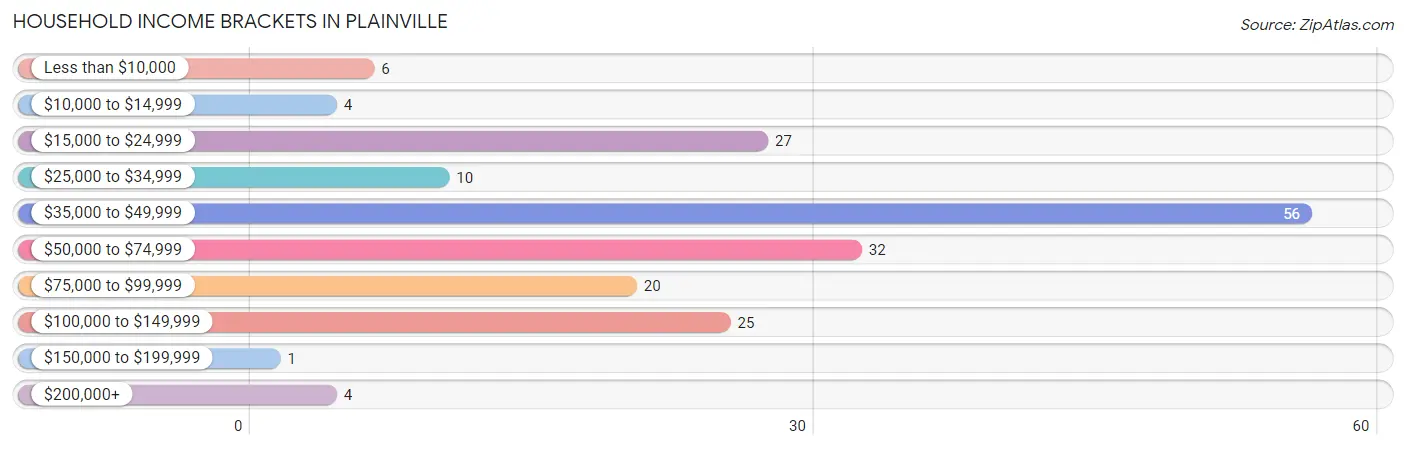
| Income Bracket | # Households | % Households |
| Less than $10,000 | 6 | 3.2% |
| $10,000 to $14,999 | 4 | 2.2% |
| $15,000 to $24,999 | 27 | 14.6% |
| $25,000 to $34,999 | 10 | 5.4% |
| $35,000 to $49,999 | 56 | 30.3% |
| $50,000 to $74,999 | 32 | 17.3% |
| $75,000 to $99,999 | 20 | 10.8% |
| $100,000 to $149,999 | 25 | 13.5% |
| $150,000 to $199,999 | 1 | 0.5% |
| $200,000+ | 4 | 2.2% |
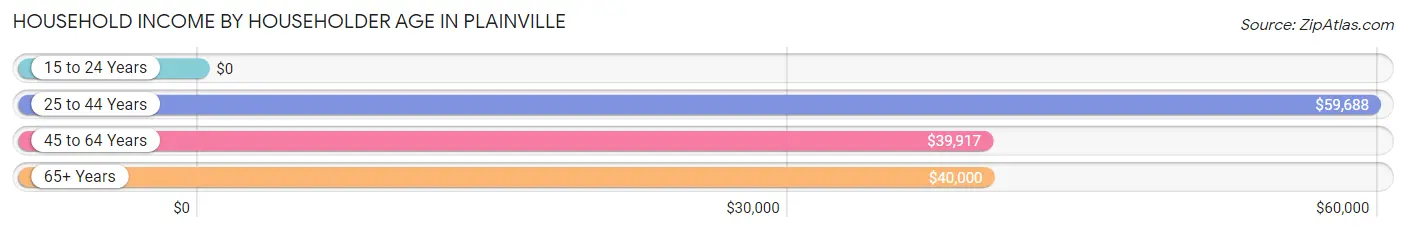
Household Income by Householder Age in Plainville
The median household income in Plainville is $46,477, with the highest median household income of $59,688 found in the 25 to 44 years age bracket for the primary householder. A total of 73 households (39.5%) fall into this category. Meanwhile, the 15 to 24 years age bracket for the primary householder has the lowest median household income of $0, with 1 households (0.5%) in this group.
| Income Bracket | # Households | Median Income |
| 15 to 24 Years | 1 (0.5%) | $0 |
| 25 to 44 Years | 73 (39.5%) | $59,688 |
| 45 to 64 Years | 71 (38.4%) | $39,917 |
| 65+ Years | 40 (21.6%) | $40,000 |
| Total | 185 (100.0%) | $46,477 |
Poverty in Plainville
Income Below Poverty by Sex and Age in Plainville
With 13.2% poverty level for males and 8.0% for females among the residents of Plainville, 45 to 54 year old males and 16 and 17 year old females are the most vulnerable to poverty, with 5 males (38.5%) and 2 females (33.3%) in their respective age groups living below the poverty level.
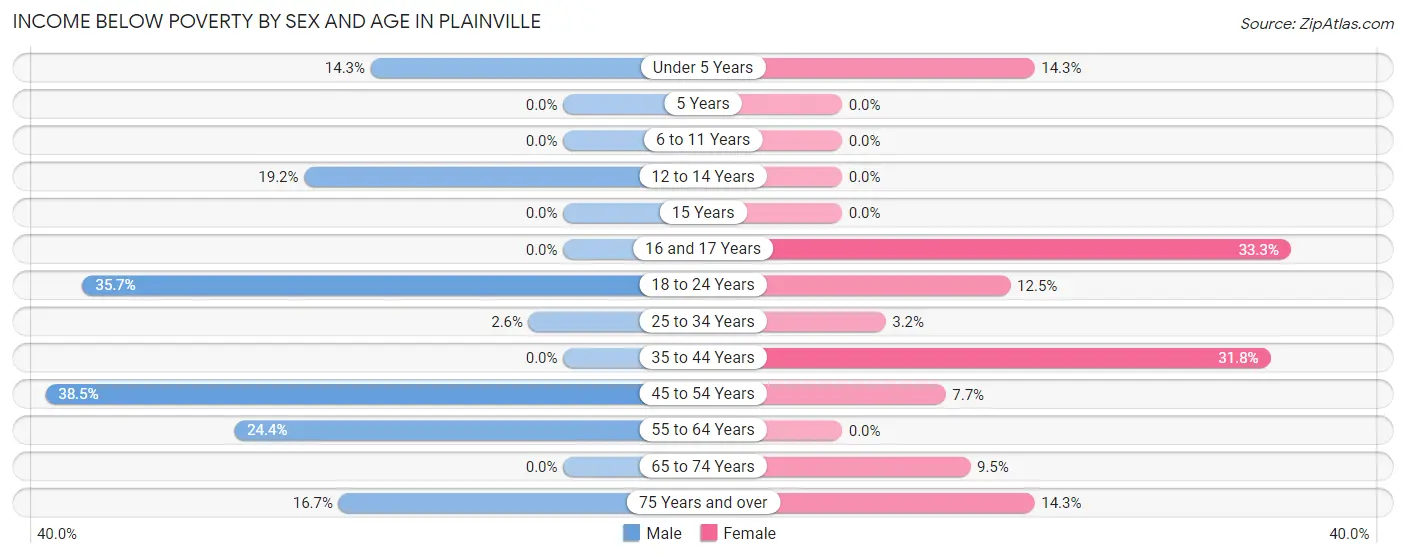
| Age Bracket | Male | Female |
| Under 5 Years | 2 (14.3%) | 2 (14.3%) |
| 5 Years | 0 (0.0%) | 0 (0.0%) |
| 6 to 11 Years | 0 (0.0%) | 0 (0.0%) |
| 12 to 14 Years | 5 (19.2%) | 0 (0.0%) |
| 15 Years | 0 (0.0%) | 0 (0.0%) |
| 16 and 17 Years | 0 (0.0%) | 2 (33.3%) |
| 18 to 24 Years | 5 (35.7%) | 1 (12.5%) |
| 25 to 34 Years | 1 (2.6%) | 1 (3.2%) |
| 35 to 44 Years | 0 (0.0%) | 7 (31.8%) |
| 45 to 54 Years | 5 (38.5%) | 1 (7.7%) |
| 55 to 64 Years | 11 (24.4%) | 0 (0.0%) |
| 65 to 74 Years | 0 (0.0%) | 2 (9.5%) |
| 75 Years and over | 1 (16.7%) | 1 (14.3%) |
| Total | 30 (13.2%) | 17 (8.0%) |
Income Above Poverty by Sex and Age in Plainville
According to the poverty statistics in Plainville, males aged 6 to 11 years and females aged 5 years are the age groups that are most secure financially, with 100.0% of males and 100.0% of females in these age groups living above the poverty line.
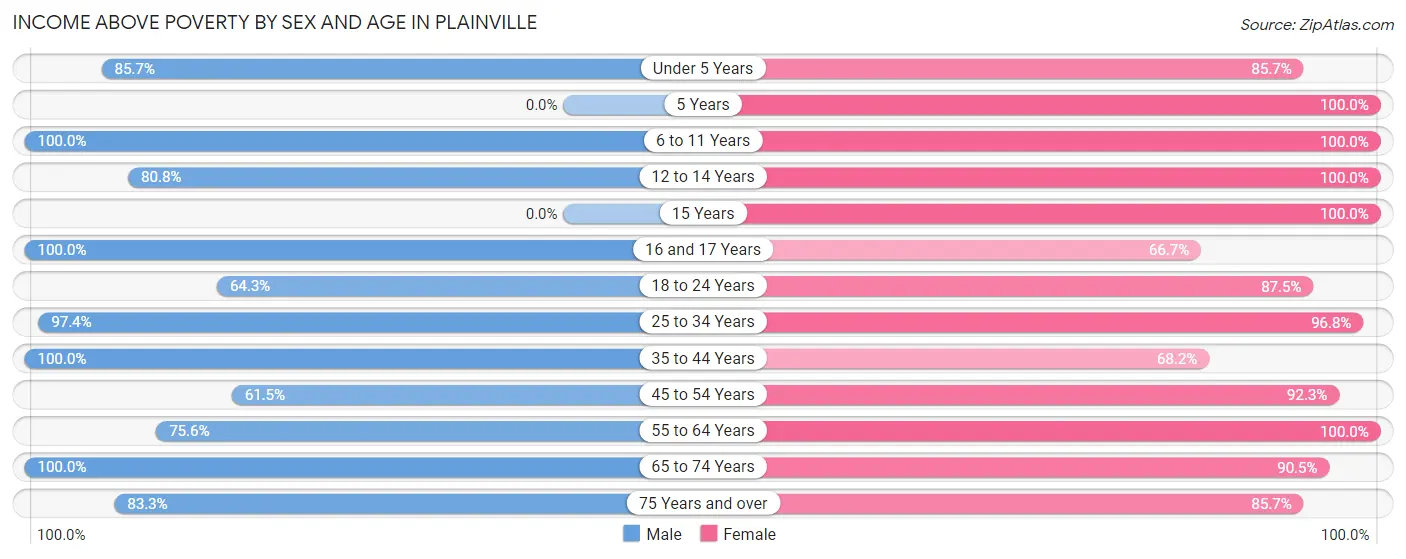
| Age Bracket | Male | Female |
| Under 5 Years | 12 (85.7%) | 12 (85.7%) |
| 5 Years | 0 (0.0%) | 2 (100.0%) |
| 6 to 11 Years | 10 (100.0%) | 15 (100.0%) |
| 12 to 14 Years | 21 (80.8%) | 7 (100.0%) |
| 15 Years | 0 (0.0%) | 21 (100.0%) |
| 16 and 17 Years | 12 (100.0%) | 4 (66.7%) |
| 18 to 24 Years | 9 (64.3%) | 7 (87.5%) |
| 25 to 34 Years | 38 (97.4%) | 30 (96.8%) |
| 35 to 44 Years | 34 (100.0%) | 15 (68.2%) |
| 45 to 54 Years | 8 (61.5%) | 12 (92.3%) |
| 55 to 64 Years | 34 (75.6%) | 46 (100.0%) |
| 65 to 74 Years | 14 (100.0%) | 19 (90.5%) |
| 75 Years and over | 5 (83.3%) | 6 (85.7%) |
| Total | 197 (86.8%) | 196 (92.0%) |
Income Below Poverty Among Married-Couple Families in Plainville
The poverty statistics for married-couple families in Plainville show that 1.2% or 1 of the total 85 families live below the poverty line. Families with no children have the highest poverty rate of 2.1%, comprising of 1 families. On the other hand, families with 1 or 2 children have the lowest poverty rate of 0.0%, which includes 0 families.
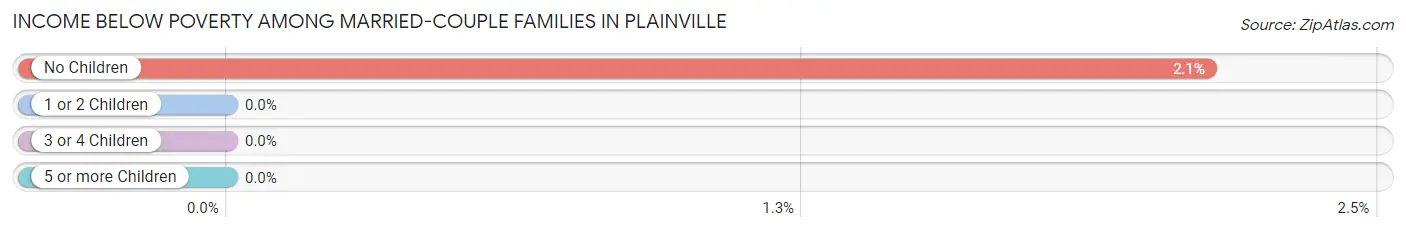
| Children | Above Poverty | Below Poverty |
| No Children | 46 (97.9%) | 1 (2.1%) |
| 1 or 2 Children | 32 (100.0%) | 0 (0.0%) |
| 3 or 4 Children | 6 (100.0%) | 0 (0.0%) |
| 5 or more Children | 0 (0.0%) | 0 (0.0%) |
| Total | 84 (98.8%) | 1 (1.2%) |
Income Below Poverty Among Single-Parent Households in Plainville
According to the poverty data in Plainville, 16.7% or 1 single-father households and 33.3% or 6 single-mother households are living below the poverty line. Among single-father households, those with 1 or 2 children have the highest poverty rate, with 1 households (33.3%) experiencing poverty. Likewise, among single-mother households, those with 3 or 4 children have the highest poverty rate, with 1 households (100.0%) falling below the poverty line.
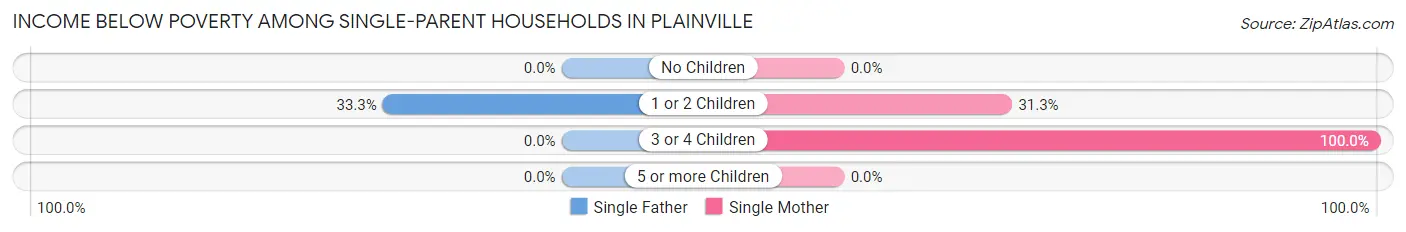
| Children | Single Father | Single Mother |
| No Children | 0 (0.0%) | 0 (0.0%) |
| 1 or 2 Children | 1 (33.3%) | 5 (31.2%) |
| 3 or 4 Children | 0 (0.0%) | 1 (100.0%) |
| 5 or more Children | 0 (0.0%) | 0 (0.0%) |
| Total | 1 (16.7%) | 6 (33.3%) |
Income Below Poverty Among Married-Couple vs Single-Parent Households in Plainville
The poverty data for Plainville shows that 1 of the married-couple family households (1.2%) and 7 of the single-parent households (29.2%) are living below the poverty level. Within the married-couple family households, those with no children have the highest poverty rate, with 1 households (2.1%) falling below the poverty line. Among the single-parent households, those with 1 or 2 children have the highest poverty rate, with 6 household (31.6%) living below poverty.
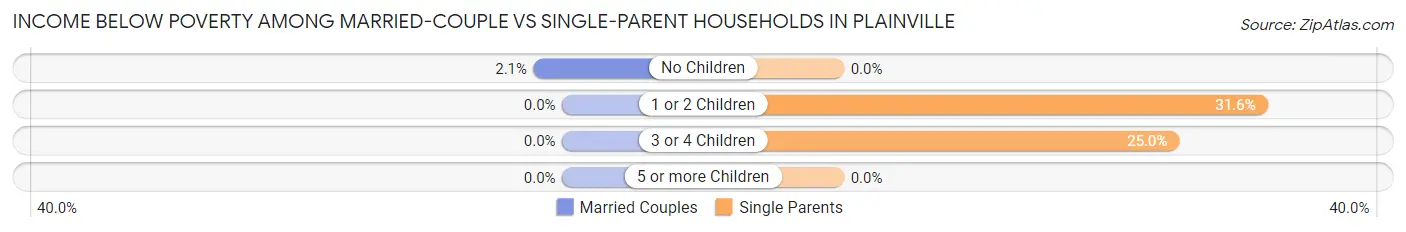
| Children | Married-Couple Families | Single-Parent Households |
| No Children | 1 (2.1%) | 0 (0.0%) |
| 1 or 2 Children | 0 (0.0%) | 6 (31.6%) |
| 3 or 4 Children | 0 (0.0%) | 1 (25.0%) |
| 5 or more Children | 0 (0.0%) | 0 (0.0%) |
| Total | 1 (1.2%) | 7 (29.2%) |
Race in Plainville
The most populous races in Plainville are White / Caucasian (356 | 80.5%), Two or more Races (84 | 19.0%), and Hispanic or Latino (75 | 17.0%).
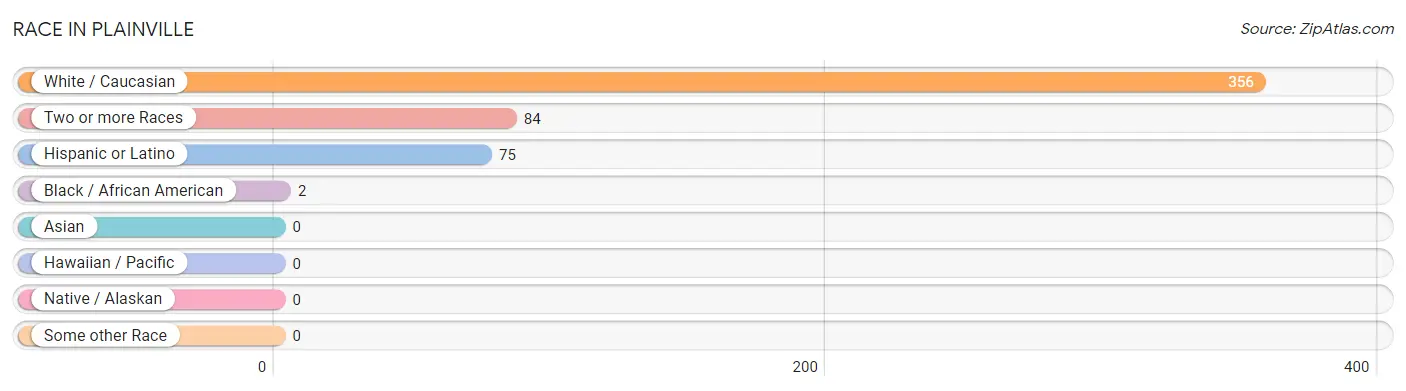
| Race | # Population | % Population |
| Asian | 0 | 0.0% |
| Black / African American | 2 | 0.4% |
| Hawaiian / Pacific | 0 | 0.0% |
| Hispanic or Latino | 75 | 17.0% |
| Native / Alaskan | 0 | 0.0% |
| White / Caucasian | 356 | 80.5% |
| Two or more Races | 84 | 19.0% |
| Some other Race | 0 | 0.0% |
| Total | 442 | 100.0% |
Ancestry in Plainville
The most populous ancestries reported in Plainville are Irish (88 | 19.9%), German (54 | 12.2%), Lumbee (45 | 10.2%), English (42 | 9.5%), and Mexican (35 | 7.9%), together accounting for 59.7% of all Plainville residents.
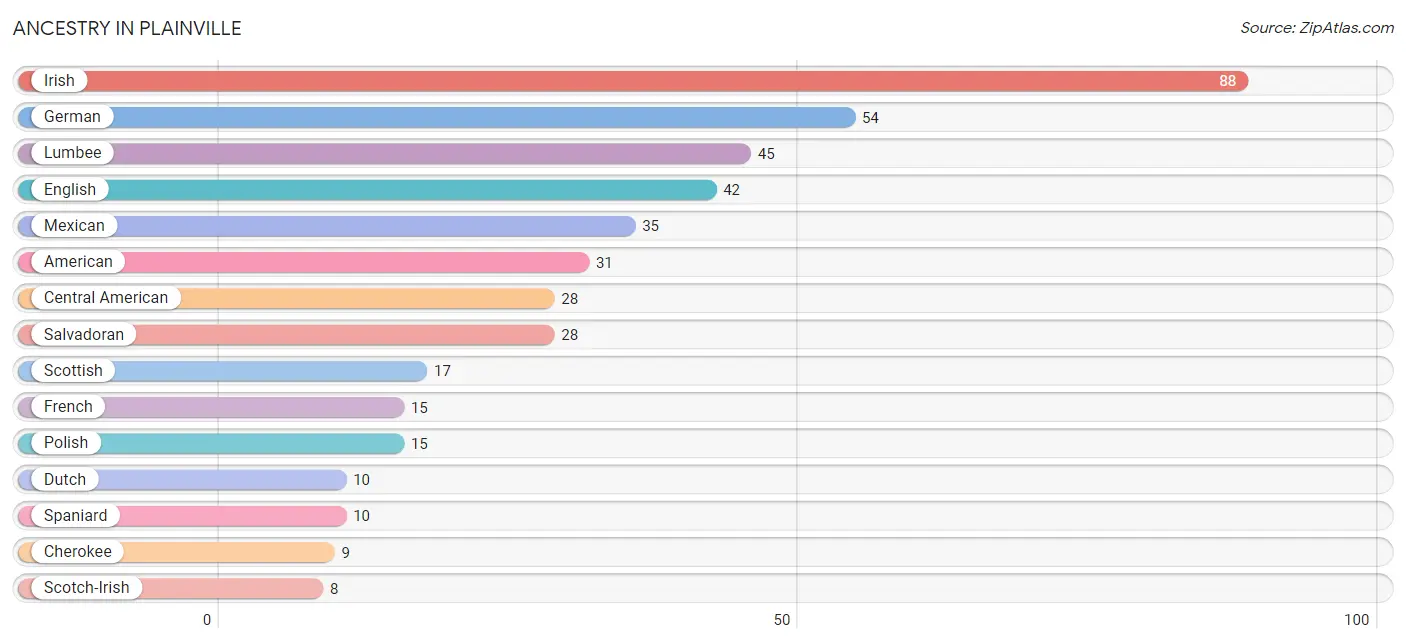
| Ancestry | # Population | % Population |
| American | 31 | 7.0% |
| Central American | 28 | 6.3% |
| Cherokee | 9 | 2.0% |
| Dutch | 10 | 2.3% |
| English | 42 | 9.5% |
| European | 3 | 0.7% |
| French | 15 | 3.4% |
| German | 54 | 12.2% |
| Irish | 88 | 19.9% |
| Lumbee | 45 | 10.2% |
| Mexican | 35 | 7.9% |
| Polish | 15 | 3.4% |
| Puerto Rican | 2 | 0.4% |
| Salvadoran | 28 | 6.3% |
| Scotch-Irish | 8 | 1.8% |
| Scottish | 17 | 3.8% |
| Spaniard | 10 | 2.3% |
| Swedish | 4 | 0.9% | View All 18 Rows |
Immigrants in Plainville
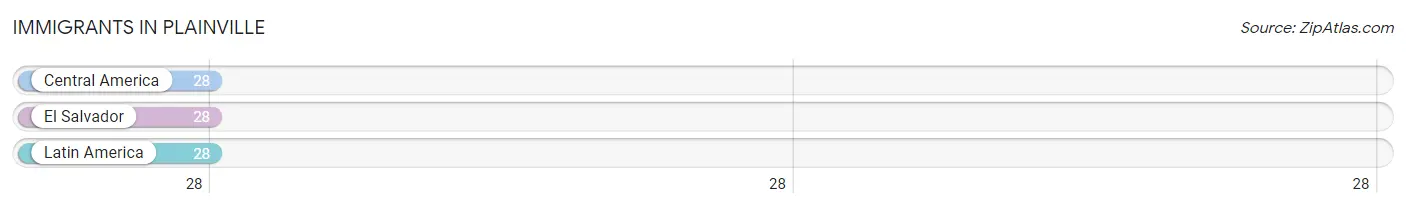
The most numerous immigrant groups reported in Plainville came from Central America (28 | 6.3%), El Salvador (28 | 6.3%), and Latin America (28 | 6.3%), together accounting for 19.0% of all Plainville residents.
| Immigration Origin | # Population | % Population |
| Central America | 28 | 6.3% |
| El Salvador | 28 | 6.3% |
| Latin America | 28 | 6.3% | View All 3 Rows |
Sex and Age in Plainville
Sex and Age in Plainville
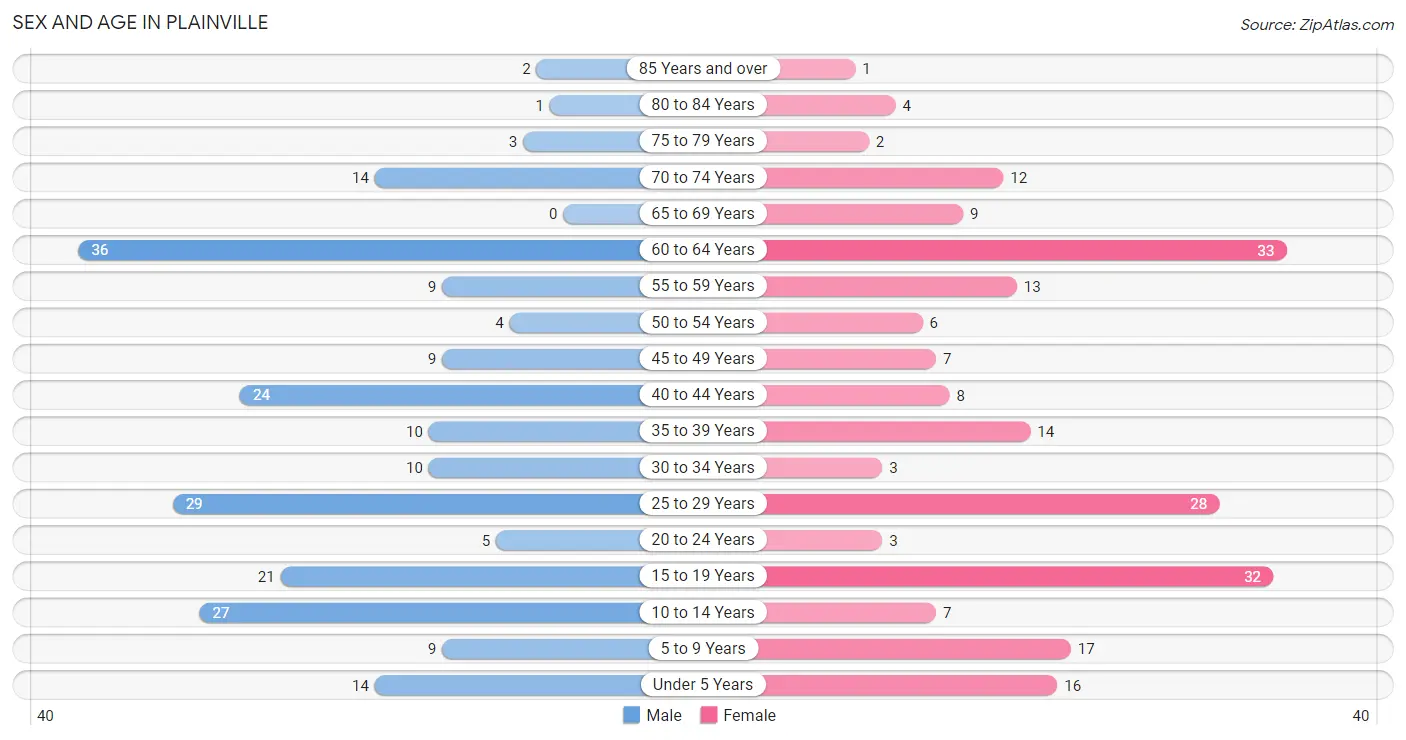
The most populous age groups in Plainville are 60 to 64 Years (36 | 15.9%) for men and 60 to 64 Years (33 | 15.3%) for women.
| Age Bracket | Male | Female |
| Under 5 Years | 14 (6.2%) | 16 (7.4%) |
| 5 to 9 Years | 9 (4.0%) | 17 (7.9%) |
| 10 to 14 Years | 27 (11.9%) | 7 (3.3%) |
| 15 to 19 Years | 21 (9.2%) | 32 (14.9%) |
| 20 to 24 Years | 5 (2.2%) | 3 (1.4%) |
| 25 to 29 Years | 29 (12.8%) | 28 (13.0%) |
| 30 to 34 Years | 10 (4.4%) | 3 (1.4%) |
| 35 to 39 Years | 10 (4.4%) | 14 (6.5%) |
| 40 to 44 Years | 24 (10.6%) | 8 (3.7%) |
| 45 to 49 Years | 9 (4.0%) | 7 (3.3%) |
| 50 to 54 Years | 4 (1.8%) | 6 (2.8%) |
| 55 to 59 Years | 9 (4.0%) | 13 (6.0%) |
| 60 to 64 Years | 36 (15.9%) | 33 (15.3%) |
| 65 to 69 Years | 0 (0.0%) | 9 (4.2%) |
| 70 to 74 Years | 14 (6.2%) | 12 (5.6%) |
| 75 to 79 Years | 3 (1.3%) | 2 (0.9%) |
| 80 to 84 Years | 1 (0.4%) | 4 (1.9%) |
| 85 Years and over | 2 (0.9%) | 1 (0.5%) |
| Total | 227 (100.0%) | 215 (100.0%) |
Families and Households in Plainville
Median Family Size in Plainville
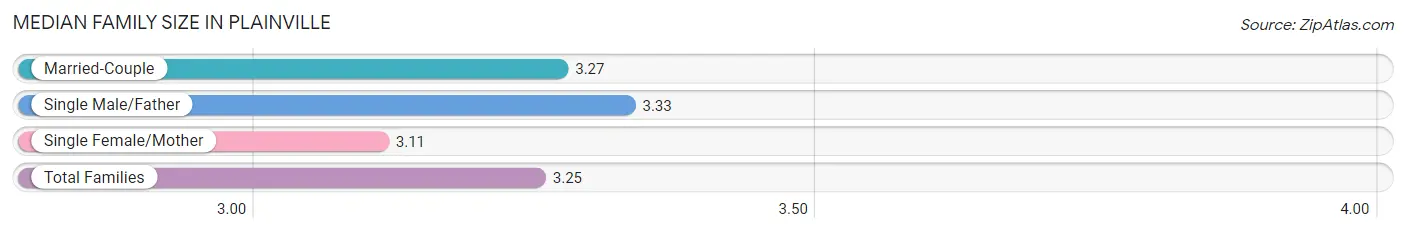
The median family size in Plainville is 3.25 persons per family, with single male/father families (6 | 5.5%) accounting for the largest median family size of 3.33 persons per family. On the other hand, single female/mother families (18 | 16.5%) represent the smallest median family size with 3.11 persons per family.
| Family Type | # Families | Family Size |
| Married-Couple | 85 (78.0%) | 3.27 |
| Single Male/Father | 6 (5.5%) | 3.33 |
| Single Female/Mother | 18 (16.5%) | 3.11 |
| Total Families | 109 (100.0%) | 3.25 |
Median Household Size in Plainville
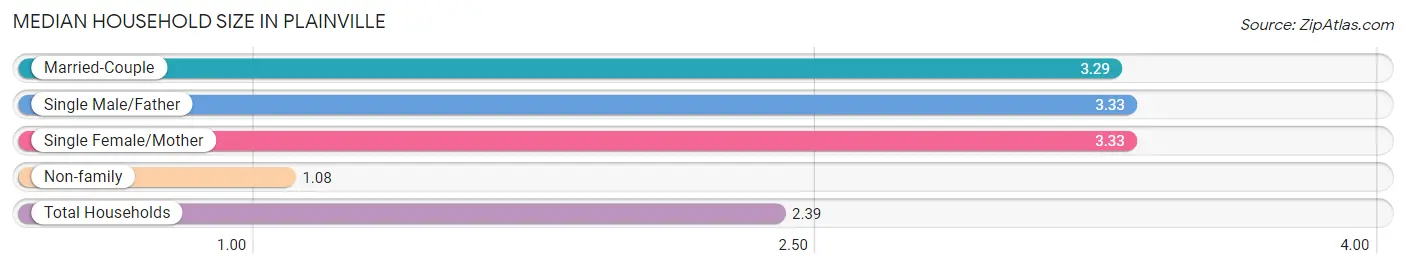
The median household size in Plainville is 2.39 persons per household, with single male/father households (6 | 3.2%) accounting for the largest median household size of 3.33 persons per household. non-family households (76 | 41.1%) represent the smallest median household size with 1.08 persons per household.
| Household Type | # Households | Household Size |
| Married-Couple | 85 (46.0%) | 3.29 |
| Single Male/Father | 6 (3.2%) | 3.33 |
| Single Female/Mother | 18 (9.7%) | 3.33 |
| Non-family | 76 (41.1%) | 1.08 |
| Total Households | 185 (100.0%) | 2.39 |
Household Size by Marriage Status in Plainville
Out of a total of 185 households in Plainville, 109 (58.9%) are family households, while 76 (41.1%) are nonfamily households. The most numerous type of family households are 2-person households, comprising 43, and the most common type of nonfamily households are 1-person households, comprising 70.
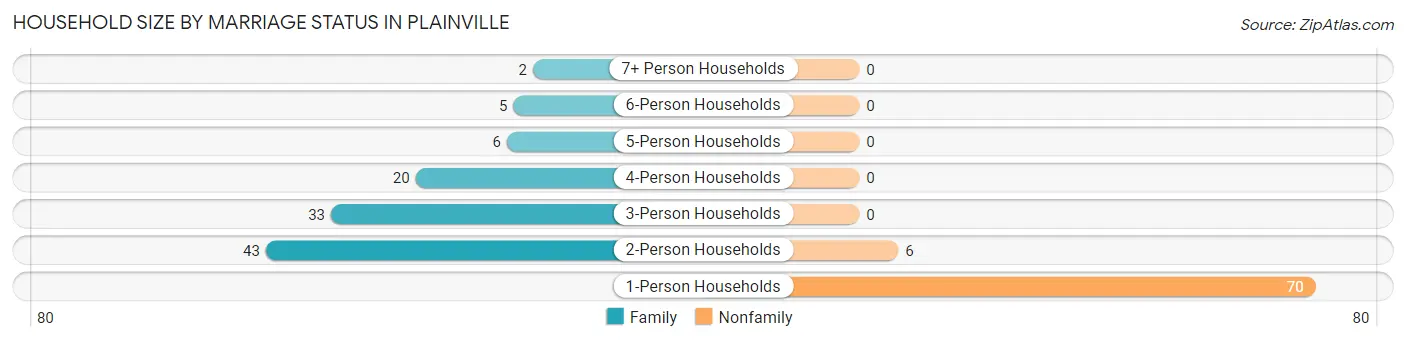
| Household Size | Family Households | Nonfamily Households |
| 1-Person Households | - | 70 (37.8%) |
| 2-Person Households | 43 (23.2%) | 6 (3.2%) |
| 3-Person Households | 33 (17.8%) | 0 (0.0%) |
| 4-Person Households | 20 (10.8%) | 0 (0.0%) |
| 5-Person Households | 6 (3.2%) | 0 (0.0%) |
| 6-Person Households | 5 (2.7%) | 0 (0.0%) |
| 7+ Person Households | 2 (1.1%) | 0 (0.0%) |
| Total | 109 (58.9%) | 76 (41.1%) |
Female Fertility in Plainville
Fertility by Age in Plainville
Average fertility rate in Plainville is 155.0 births per 1,000 women. Women in the age bracket of 20 to 34 years have the highest fertility rate with 441.0 births per 1,000 women. Women in the age bracket of 20 to 34 years acount for 100.0% of all women with births.
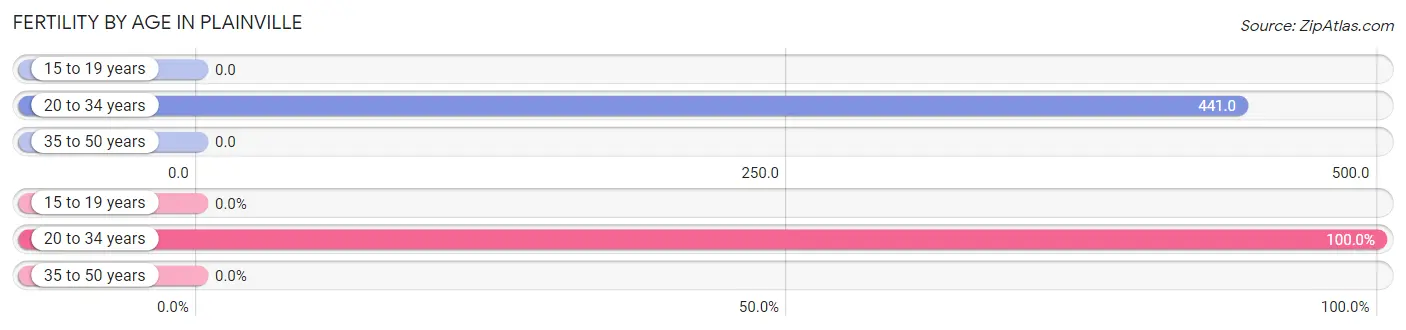
| Age Bracket | Women with Births | Births / 1,000 Women |
| 15 to 19 years | 0 (0.0%) | 0.0 |
| 20 to 34 years | 15 (100.0%) | 441.0 |
| 35 to 50 years | 0 (0.0%) | 0.0 |
| Total | 15 (100.0%) | 155.0 |
Fertility by Age by Marriage Status in Plainville
93.3% of women with births (15) in Plainville are married. The highest percentage of unmarried women with births falls into 20 to 34 years age bracket with 6.7% of them unmarried at the time of birth, while the lowest percentage of unmarried women with births belong to 20 to 34 years age bracket with 6.7% of them unmarried.
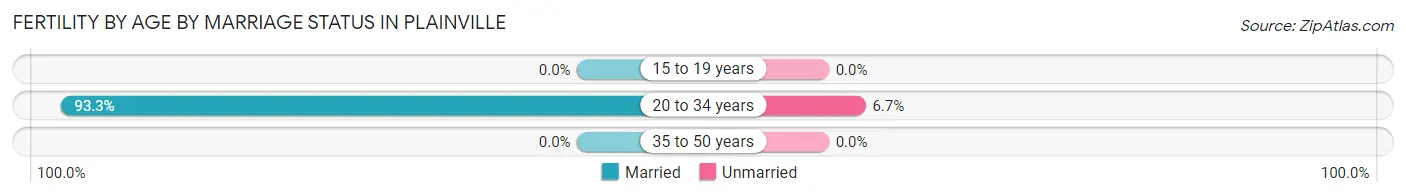
| Age Bracket | Married | Unmarried |
| 15 to 19 years | 0 (0.0%) | 0 (0.0%) |
| 20 to 34 years | 14 (93.3%) | 1 (6.7%) |
| 35 to 50 years | 0 (0.0%) | 0 (0.0%) |
| Total | 14 (93.3%) | 1 (6.7%) |
Fertility by Education in Plainville
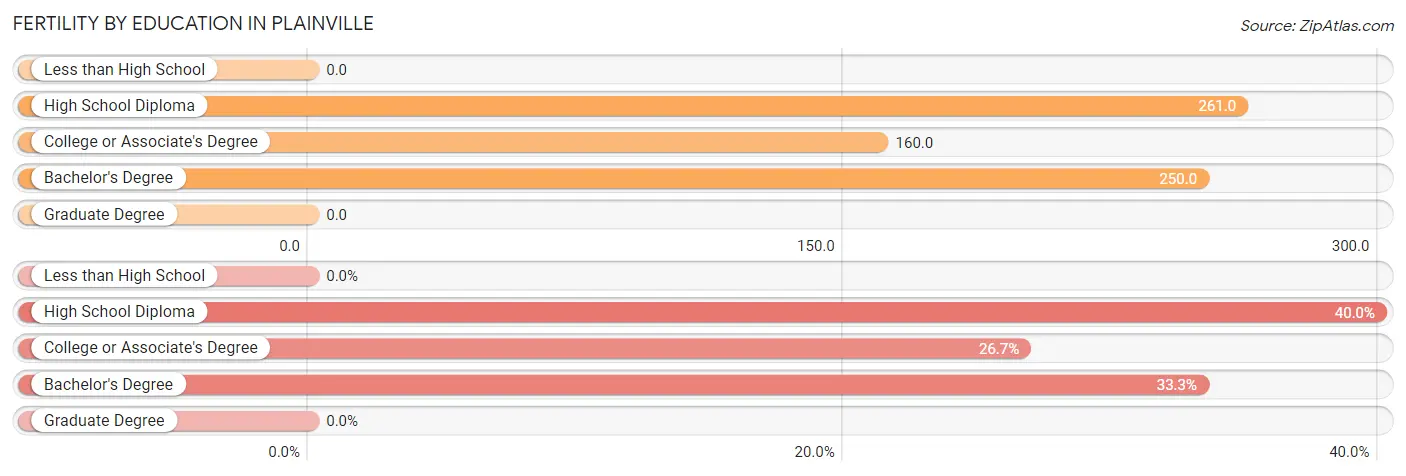
| Educational Attainment | Women with Births | Births / 1,000 Women |
| Less than High School | 0 (0.0%) | 0.0 |
| High School Diploma | 6 (40.0%) | 261.0 |
| College or Associate's Degree | 4 (26.7%) | 160.0 |
| Bachelor's Degree | 5 (33.3%) | 250.0 |
| Graduate Degree | 0 (0.0%) | 0.0 |
| Total | 15 (100.0%) | 155.0 |
Fertility by Education by Marriage Status in Plainville
6.7% of women with births in Plainville are unmarried. Women with the educational attainment of college or associate's degree are most likely to be married with 100.0% of them married at childbirth, while women with the educational attainment of high school diploma are least likely to be married with 16.7% of them unmarried at childbirth.
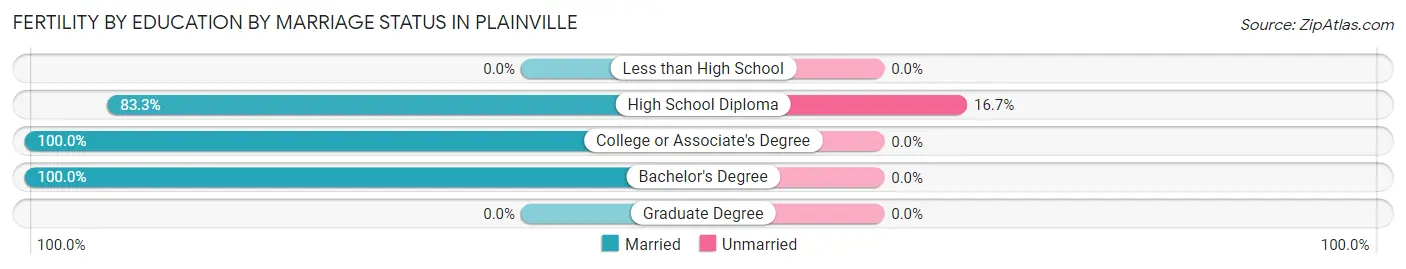
| Educational Attainment | Married | Unmarried |
| Less than High School | 0 (0.0%) | 0 (0.0%) |
| High School Diploma | 5 (83.3%) | 1 (16.7%) |
| College or Associate's Degree | 4 (100.0%) | 0 (0.0%) |
| Bachelor's Degree | 5 (100.0%) | 0 (0.0%) |
| Graduate Degree | 0 (0.0%) | 0 (0.0%) |
| Total | 14 (93.3%) | 1 (6.7%) |
Employment Characteristics in Plainville
Employment by Class of Employer in Plainville
Among the 194 employed individuals in Plainville, private company employees (138 | 71.1%), not-for-profit organizations (17 | 8.8%), and federal government employees (16 | 8.3%) make up the most common classes of employment.
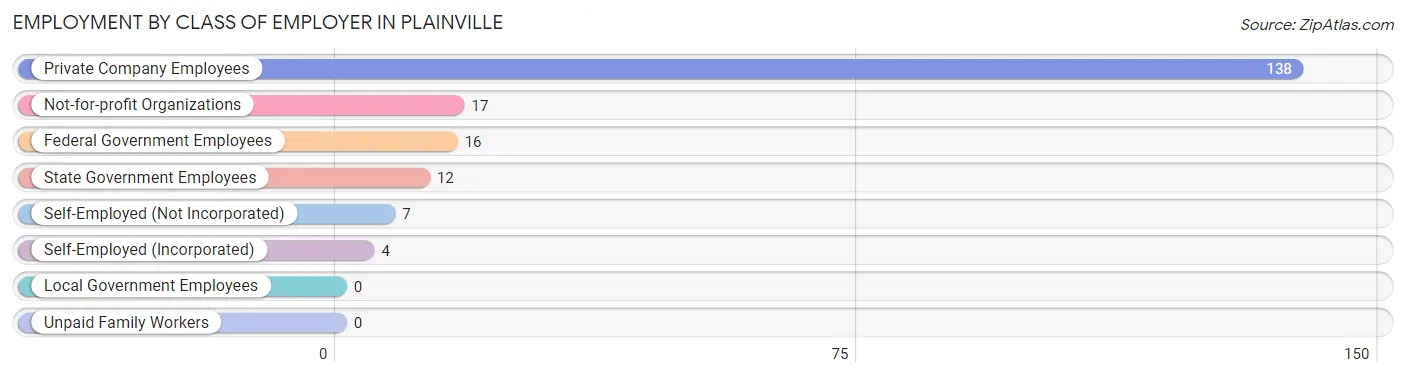
| Employer Class | # Employees | % Employees |
| Private Company Employees | 138 | 71.1% |
| Self-Employed (Incorporated) | 4 | 2.1% |
| Self-Employed (Not Incorporated) | 7 | 3.6% |
| Not-for-profit Organizations | 17 | 8.8% |
| Local Government Employees | 0 | 0.0% |
| State Government Employees | 12 | 6.2% |
| Federal Government Employees | 16 | 8.3% |
| Unpaid Family Workers | 0 | 0.0% |
| Total | 194 | 100.0% |
Employment Status by Age in Plainville
According to the labor force statistics for Plainville, out of the total population over 16 years of age (331), 65.0% or 215 individuals are in the labor force, with 9.8% or 21 of them unemployed. The age group with the highest labor force participation rate is 20 to 24 years, with 100.0% or 8 individuals in the labor force. Within the labor force, the 16 to 19 years age range has the highest percentage of unemployed individuals, with 76.2% or 16 of them being unemployed.
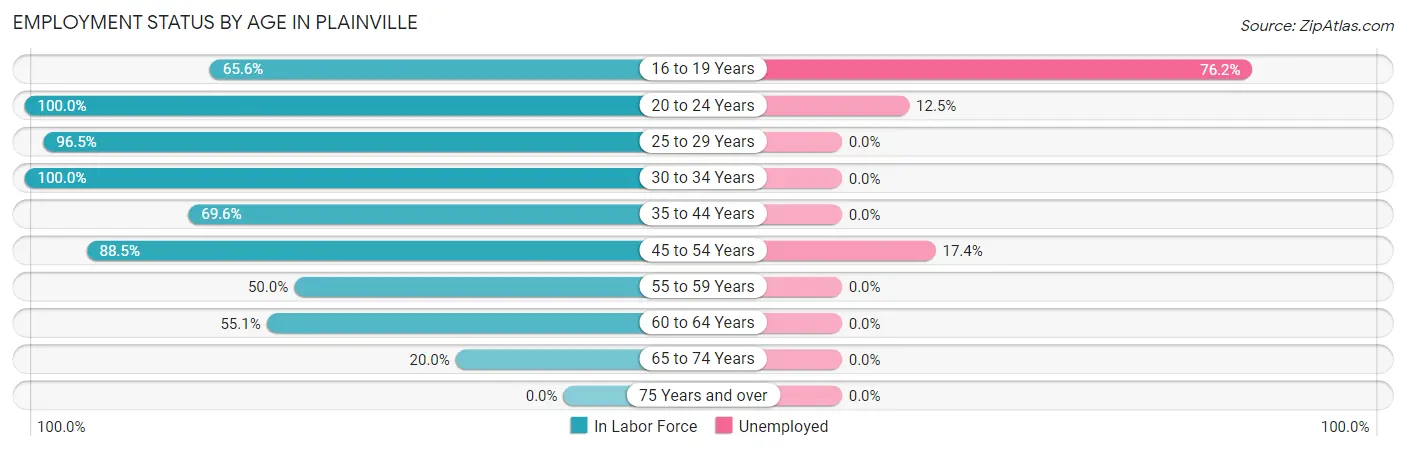
| Age Bracket | In Labor Force | Unemployed |
| 16 to 19 Years | 21 (65.6%) | 16 (76.2%) |
| 20 to 24 Years | 8 (100.0%) | 1 (12.5%) |
| 25 to 29 Years | 55 (96.5%) | 0 (0.0%) |
| 30 to 34 Years | 13 (100.0%) | 0 (0.0%) |
| 35 to 44 Years | 39 (69.6%) | 0 (0.0%) |
| 45 to 54 Years | 23 (88.5%) | 4 (17.4%) |
| 55 to 59 Years | 11 (50.0%) | 0 (0.0%) |
| 60 to 64 Years | 38 (55.1%) | 0 (0.0%) |
| 65 to 74 Years | 7 (20.0%) | 0 (0.0%) |
| 75 Years and over | 0 (0.0%) | 0 (0.0%) |
| Total | 215 (65.0%) | 21 (9.8%) |
Employment Status by Educational Attainment in Plainville
According to labor force statistics for Plainville, 73.7% of individuals (179) out of the total population between 25 and 64 years of age (243) are in the labor force, with 2.2% or 4 of them being unemployed. The group with the highest labor force participation rate are those with the educational attainment of bachelor's degree or higher, with 90.6% or 29 individuals in the labor force. Within the labor force, individuals with less than high school education have the highest percentage of unemployment, with 22.2% or 4 of them being unemployed.
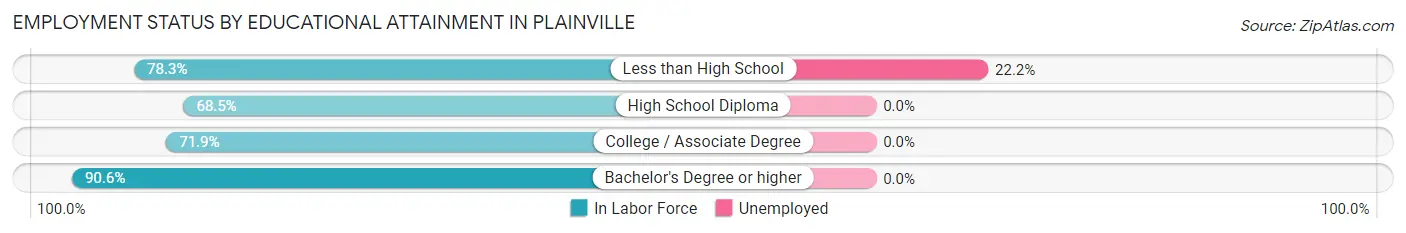
| Educational Attainment | In Labor Force | Unemployed |
| Less than High School | 18 (78.3%) | 5 (22.2%) |
| High School Diploma | 63 (68.5%) | 0 (0.0%) |
| College / Associate Degree | 69 (71.9%) | 0 (0.0%) |
| Bachelor's Degree or higher | 29 (90.6%) | 0 (0.0%) |
| Total | 179 (73.7%) | 5 (2.2%) |
Employment Occupations by Sex in Plainville
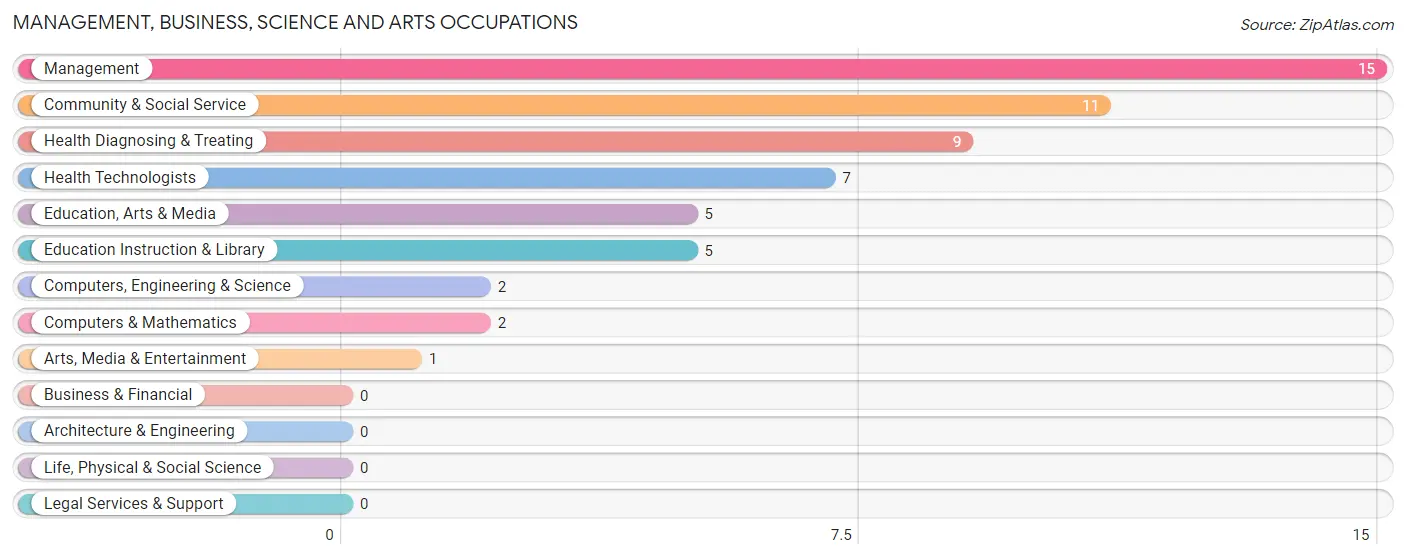
Management, Business, Science and Arts Occupations
The most common Management, Business, Science and Arts occupations in Plainville are Management (15 | 7.7%), Community & Social Service (11 | 5.7%), Health Diagnosing & Treating (9 | 4.6%), Health Technologists (7 | 3.6%), and Education, Arts & Media (5 | 2.6%).
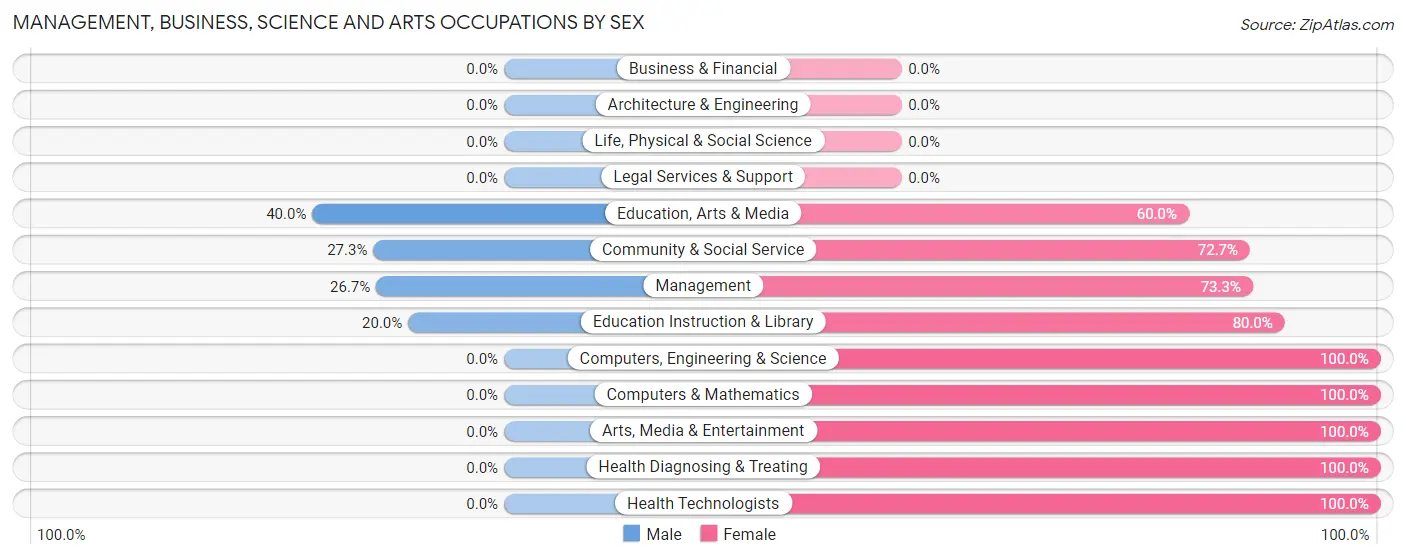
Management, Business, Science and Arts Occupations by Sex
Within the Management, Business, Science and Arts occupations in Plainville, the most male-oriented occupations are Education, Arts & Media (40.0%), Community & Social Service (27.3%), and Management (26.7%), while the most female-oriented occupations are Computers, Engineering & Science (100.0%), Computers & Mathematics (100.0%), and Arts, Media & Entertainment (100.0%).
| Occupation | Male | Female |
| Management | 4 (26.7%) | 11 (73.3%) |
| Business & Financial | 0 (0.0%) | 0 (0.0%) |
| Computers, Engineering & Science | 0 (0.0%) | 2 (100.0%) |
| Computers & Mathematics | 0 (0.0%) | 2 (100.0%) |
| Architecture & Engineering | 0 (0.0%) | 0 (0.0%) |
| Life, Physical & Social Science | 0 (0.0%) | 0 (0.0%) |
| Community & Social Service | 3 (27.3%) | 8 (72.7%) |
| Education, Arts & Media | 2 (40.0%) | 3 (60.0%) |
| Legal Services & Support | 0 (0.0%) | 0 (0.0%) |
| Education Instruction & Library | 1 (20.0%) | 4 (80.0%) |
| Arts, Media & Entertainment | 0 (0.0%) | 1 (100.0%) |
| Health Diagnosing & Treating | 0 (0.0%) | 9 (100.0%) |
| Health Technologists | 0 (0.0%) | 7 (100.0%) |
| Total (Category) | 7 (18.9%) | 30 (81.1%) |
| Total (Overall) | 111 (57.2%) | 83 (42.8%) |
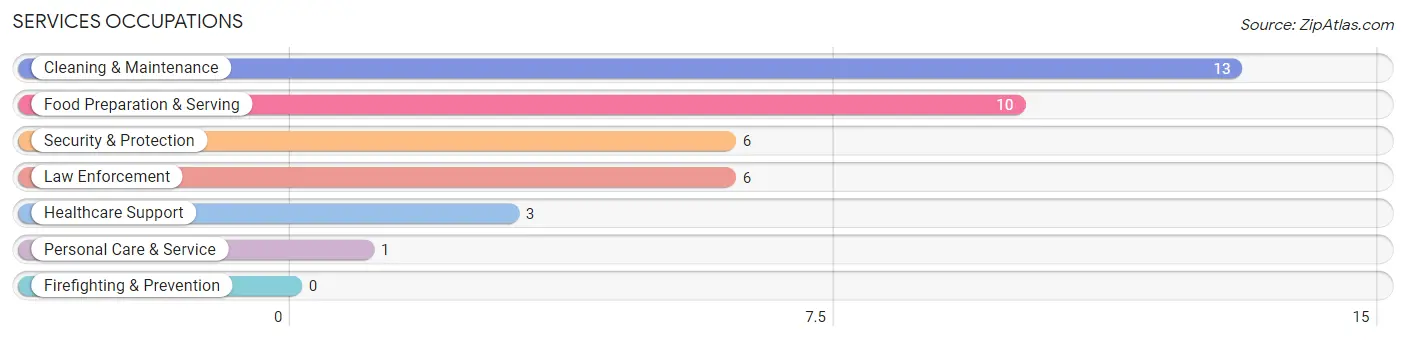
Services Occupations
The most common Services occupations in Plainville are Cleaning & Maintenance (13 | 6.7%), Food Preparation & Serving (10 | 5.1%), Security & Protection (6 | 3.1%), Law Enforcement (6 | 3.1%), and Healthcare Support (3 | 1.5%).
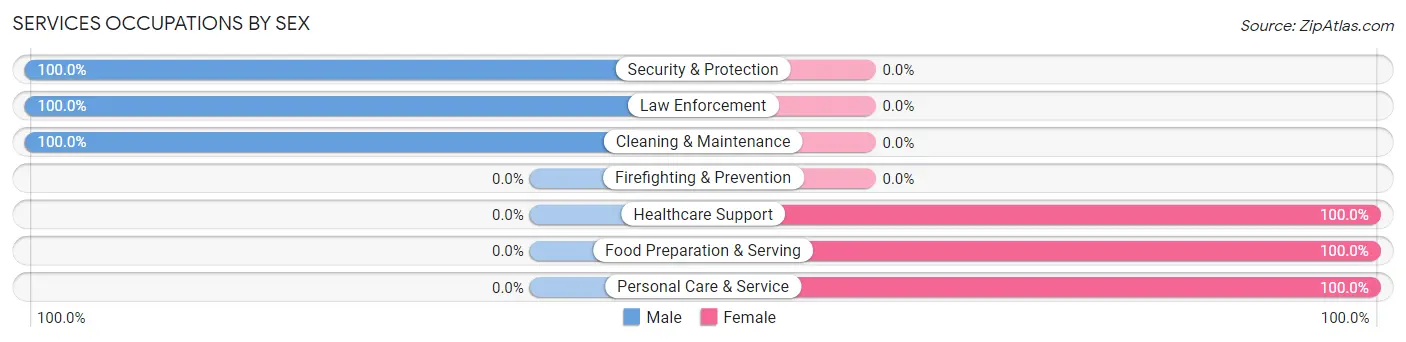
Services Occupations by Sex
Within the Services occupations in Plainville, the most male-oriented occupations are Security & Protection (100.0%), Law Enforcement (100.0%), and Cleaning & Maintenance (100.0%), while the most female-oriented occupations are Healthcare Support (100.0%), Food Preparation & Serving (100.0%), and Personal Care & Service (100.0%).
| Occupation | Male | Female |
| Healthcare Support | 0 (0.0%) | 3 (100.0%) |
| Security & Protection | 6 (100.0%) | 0 (0.0%) |
| Firefighting & Prevention | 0 (0.0%) | 0 (0.0%) |
| Law Enforcement | 6 (100.0%) | 0 (0.0%) |
| Food Preparation & Serving | 0 (0.0%) | 10 (100.0%) |
| Cleaning & Maintenance | 13 (100.0%) | 0 (0.0%) |
| Personal Care & Service | 0 (0.0%) | 1 (100.0%) |
| Total (Category) | 19 (57.6%) | 14 (42.4%) |
| Total (Overall) | 111 (57.2%) | 83 (42.8%) |
Sales and Office Occupations
The most common Sales and Office occupations in Plainville are Office & Administration (13 | 6.7%), and Sales & Related (11 | 5.7%).

Sales and Office Occupations by Sex
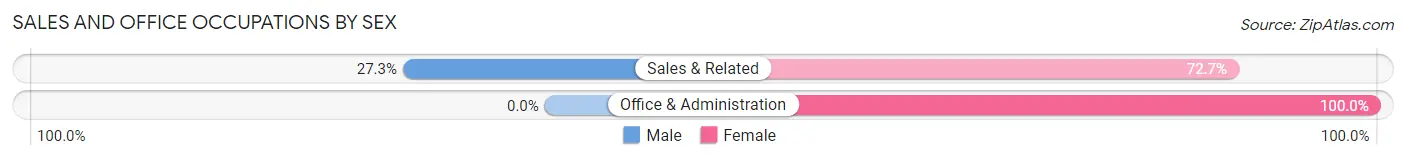
| Occupation | Male | Female |
| Sales & Related | 3 (27.3%) | 8 (72.7%) |
| Office & Administration | 0 (0.0%) | 13 (100.0%) |
| Total (Category) | 3 (12.5%) | 21 (87.5%) |
| Total (Overall) | 111 (57.2%) | 83 (42.8%) |
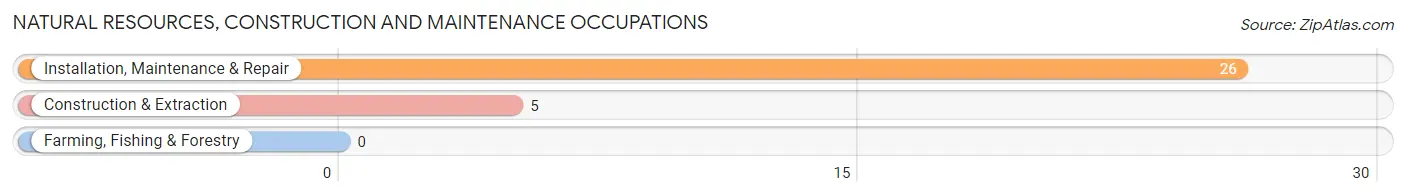
Natural Resources, Construction and Maintenance Occupations
The most common Natural Resources, Construction and Maintenance occupations in Plainville are Installation, Maintenance & Repair (26 | 13.4%), and Construction & Extraction (5 | 2.6%).
Natural Resources, Construction and Maintenance Occupations by Sex
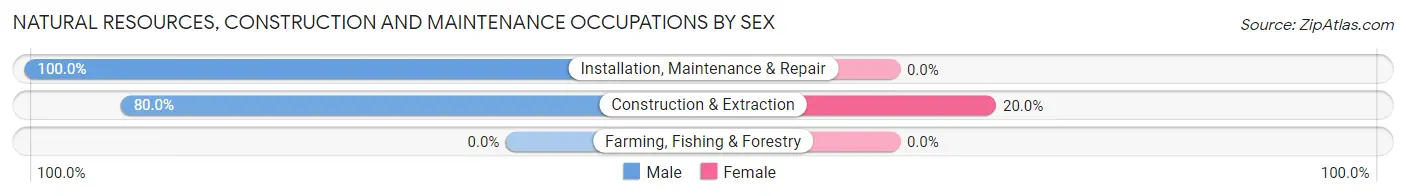
| Occupation | Male | Female |
| Farming, Fishing & Forestry | 0 (0.0%) | 0 (0.0%) |
| Construction & Extraction | 4 (80.0%) | 1 (20.0%) |
| Installation, Maintenance & Repair | 26 (100.0%) | 0 (0.0%) |
| Total (Category) | 30 (96.8%) | 1 (3.2%) |
| Total (Overall) | 111 (57.2%) | 83 (42.8%) |
Production, Transportation and Moving Occupations
The most common Production, Transportation and Moving occupations in Plainville are Production (29 | 14.9%), Transportation (20 | 10.3%), and Material Moving (20 | 10.3%).
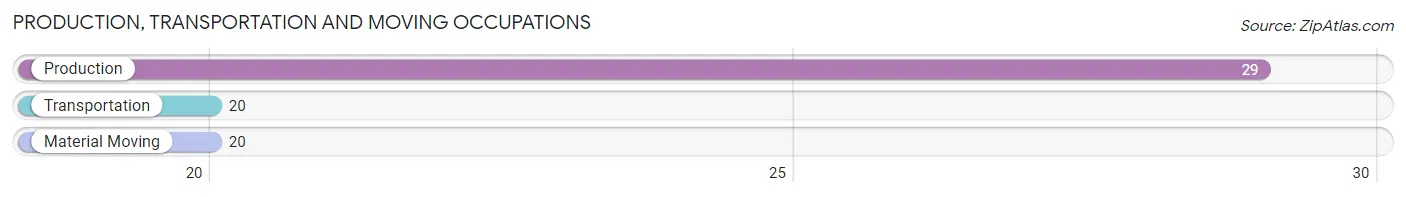
Production, Transportation and Moving Occupations by Sex
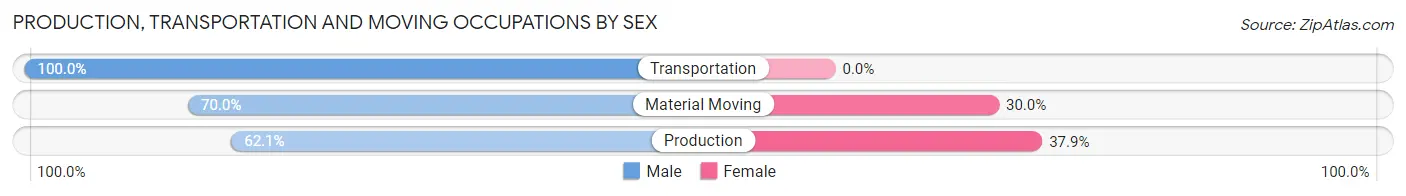
| Occupation | Male | Female |
| Production | 18 (62.1%) | 11 (37.9%) |
| Transportation | 20 (100.0%) | 0 (0.0%) |
| Material Moving | 14 (70.0%) | 6 (30.0%) |
| Total (Category) | 52 (75.4%) | 17 (24.6%) |
| Total (Overall) | 111 (57.2%) | 83 (42.8%) |
Employment Industries by Sex in Plainville
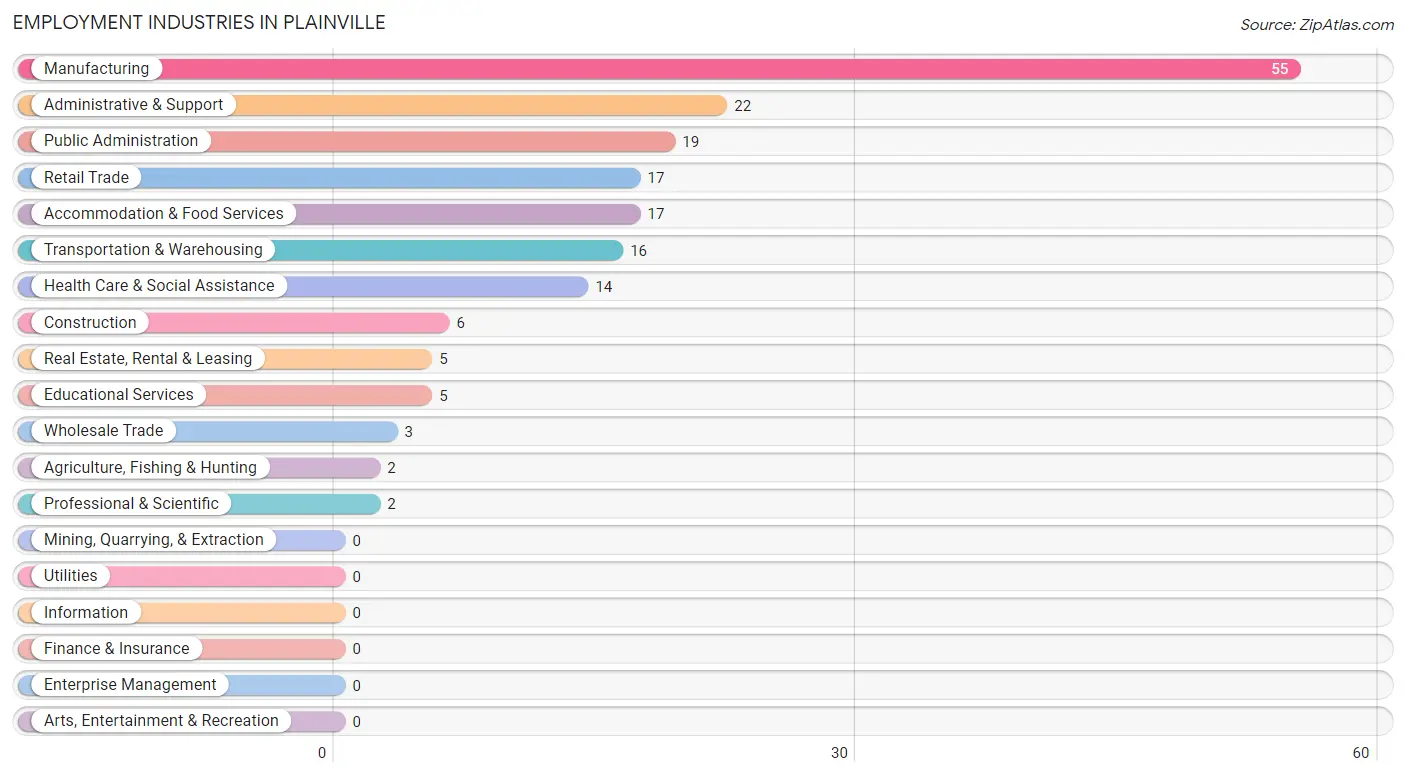
Employment Industries in Plainville
The major employment industries in Plainville include Manufacturing (55 | 28.3%), Administrative & Support (22 | 11.3%), Public Administration (19 | 9.8%), Retail Trade (17 | 8.8%), and Accommodation & Food Services (17 | 8.8%).
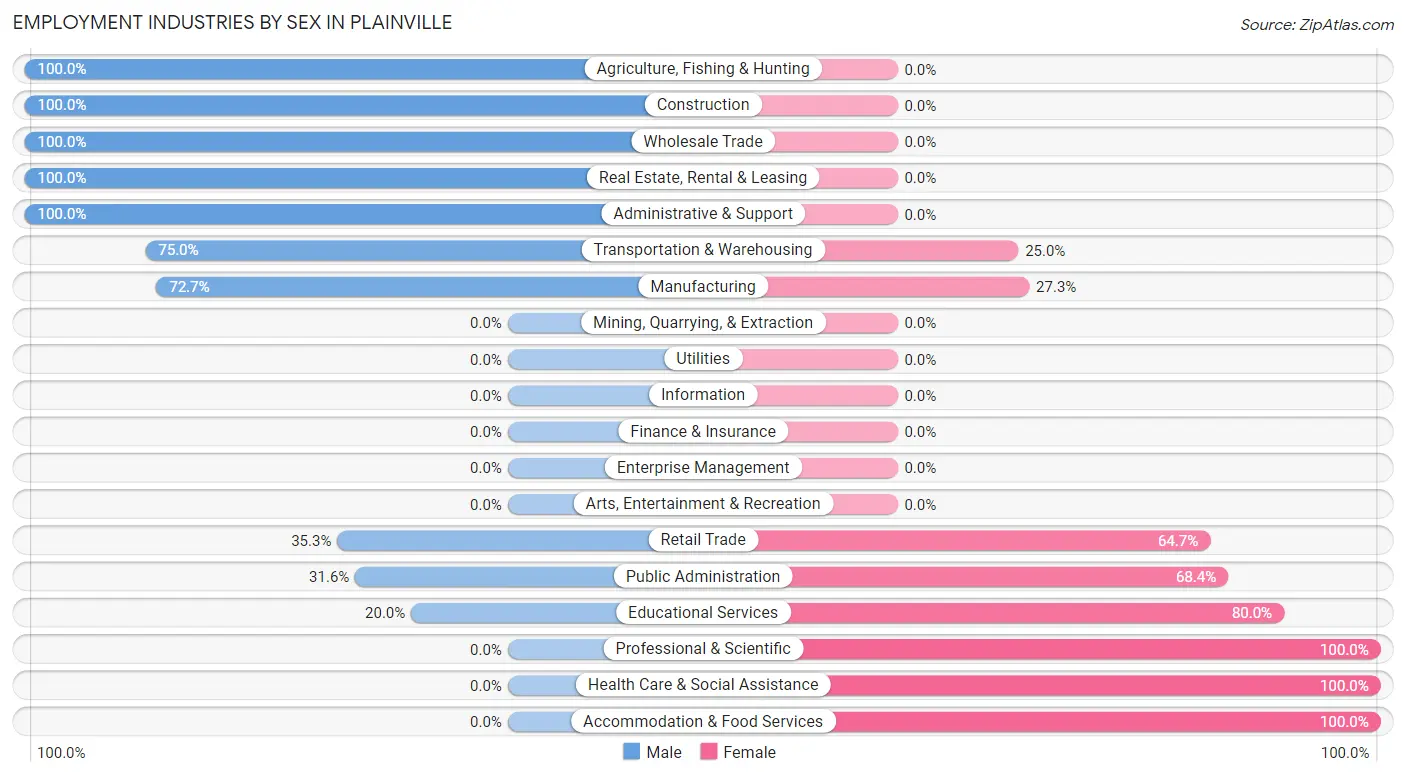
Employment Industries by Sex in Plainville
The Plainville industries that see more men than women are Agriculture, Fishing & Hunting (100.0%), Construction (100.0%), and Wholesale Trade (100.0%), whereas the industries that tend to have a higher number of women are Professional & Scientific (100.0%), Health Care & Social Assistance (100.0%), and Accommodation & Food Services (100.0%).
| Industry | Male | Female |
| Agriculture, Fishing & Hunting | 2 (100.0%) | 0 (0.0%) |
| Mining, Quarrying, & Extraction | 0 (0.0%) | 0 (0.0%) |
| Construction | 6 (100.0%) | 0 (0.0%) |
| Manufacturing | 40 (72.7%) | 15 (27.3%) |
| Wholesale Trade | 3 (100.0%) | 0 (0.0%) |
| Retail Trade | 6 (35.3%) | 11 (64.7%) |
| Transportation & Warehousing | 12 (75.0%) | 4 (25.0%) |
| Utilities | 0 (0.0%) | 0 (0.0%) |
| Information | 0 (0.0%) | 0 (0.0%) |
| Finance & Insurance | 0 (0.0%) | 0 (0.0%) |
| Real Estate, Rental & Leasing | 5 (100.0%) | 0 (0.0%) |
| Professional & Scientific | 0 (0.0%) | 2 (100.0%) |
| Enterprise Management | 0 (0.0%) | 0 (0.0%) |
| Administrative & Support | 22 (100.0%) | 0 (0.0%) |
| Educational Services | 1 (20.0%) | 4 (80.0%) |
| Health Care & Social Assistance | 0 (0.0%) | 14 (100.0%) |
| Arts, Entertainment & Recreation | 0 (0.0%) | 0 (0.0%) |
| Accommodation & Food Services | 0 (0.0%) | 17 (100.0%) |
| Public Administration | 6 (31.6%) | 13 (68.4%) |
| Total | 111 (57.2%) | 83 (42.8%) |
Education in Plainville
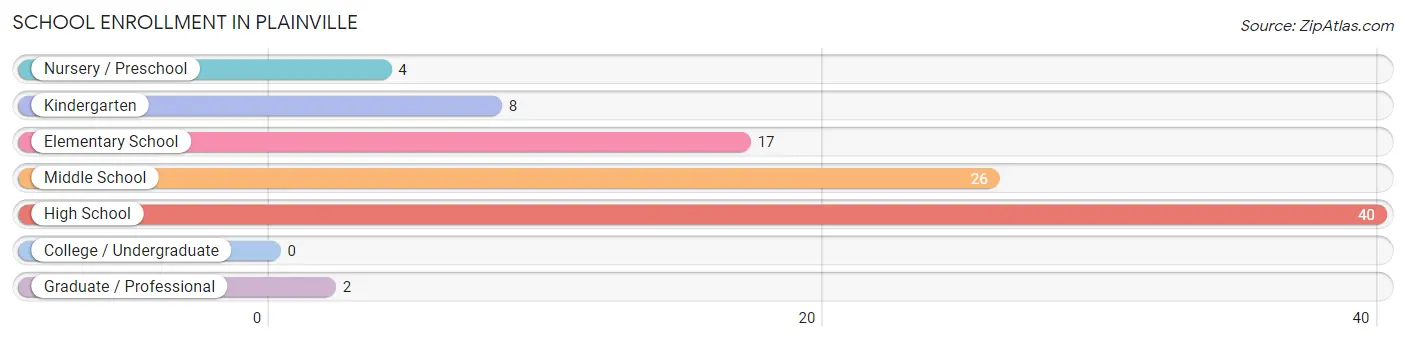
School Enrollment in Plainville
The most common levels of schooling among the 97 students in Plainville are high school (40 | 41.2%), middle school (26 | 26.8%), and elementary school (17 | 17.5%).
| School Level | # Students | % Students |
| Nursery / Preschool | 4 | 4.1% |
| Kindergarten | 8 | 8.3% |
| Elementary School | 17 | 17.5% |
| Middle School | 26 | 26.8% |
| High School | 40 | 41.2% |
| College / Undergraduate | 0 | 0.0% |
| Graduate / Professional | 2 | 2.1% |
| Total | 97 | 100.0% |
School Enrollment by Age by Funding Source in Plainville
Out of a total of 97 students who are enrolled in schools in Plainville, 4 (4.1%) attend a private institution, while the remaining 93 (95.9%) are enrolled in public schools. The age group of 3 to 4 year olds has the highest likelihood of being enrolled in private schools, with 2 (100.0% in the age bracket) enrolled. Conversely, the age group of 5 to 9 year old has the lowest likelihood of being enrolled in a private school, with 26 (100.0% in the age bracket) attending a public institution.
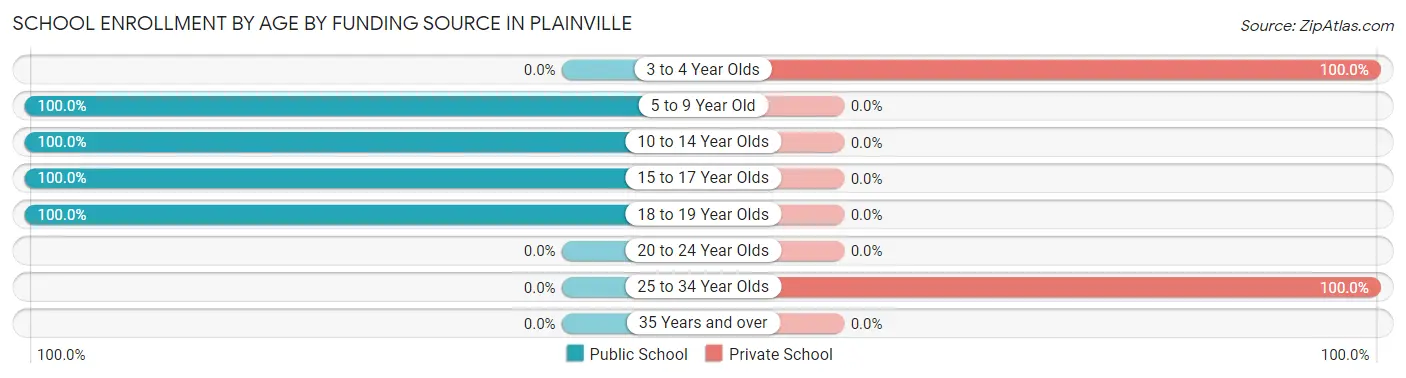
| Age Bracket | Public School | Private School |
| 3 to 4 Year Olds | 0 (0.0%) | 2 (100.0%) |
| 5 to 9 Year Old | 26 (100.0%) | 0 (0.0%) |
| 10 to 14 Year Olds | 34 (100.0%) | 0 (0.0%) |
| 15 to 17 Year Olds | 31 (100.0%) | 0 (0.0%) |
| 18 to 19 Year Olds | 2 (100.0%) | 0 (0.0%) |
| 20 to 24 Year Olds | 0 (0.0%) | 0 (0.0%) |
| 25 to 34 Year Olds | 0 (0.0%) | 2 (100.0%) |
| 35 Years and over | 0 (0.0%) | 0 (0.0%) |
| Total | 93 (95.9%) | 4 (4.1%) |
Educational Attainment by Field of Study in Plainville
Science & technology (13 | 26.0%), business (11 | 22.0%), education (9 | 18.0%), multidisciplinary studies (5 | 10.0%), and bio, nature & agricultural (3 | 6.0%) are the most common fields of study among 50 individuals in Plainville who have obtained a bachelor's degree or higher.
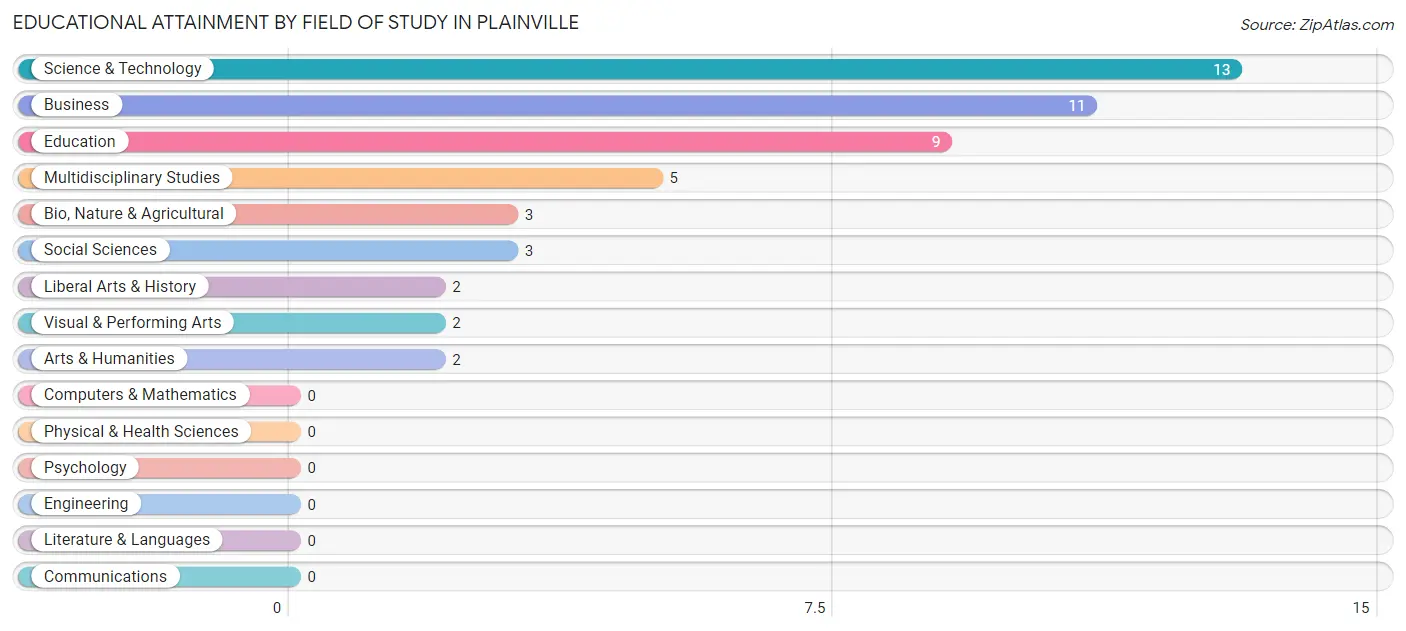
| Field of Study | # Graduates | % Graduates |
| Computers & Mathematics | 0 | 0.0% |
| Bio, Nature & Agricultural | 3 | 6.0% |
| Physical & Health Sciences | 0 | 0.0% |
| Psychology | 0 | 0.0% |
| Social Sciences | 3 | 6.0% |
| Engineering | 0 | 0.0% |
| Multidisciplinary Studies | 5 | 10.0% |
| Science & Technology | 13 | 26.0% |
| Business | 11 | 22.0% |
| Education | 9 | 18.0% |
| Literature & Languages | 0 | 0.0% |
| Liberal Arts & History | 2 | 4.0% |
| Visual & Performing Arts | 2 | 4.0% |
| Communications | 0 | 0.0% |
| Arts & Humanities | 2 | 4.0% |
| Total | 50 | 100.0% |
Transportation & Commute in Plainville
Vehicle Availability by Sex in Plainville
The most prevalent vehicle ownership categories in Plainville are males with 2 vehicles (64, accounting for 57.7%) and females with 2 vehicles (41, making up 77.1%).
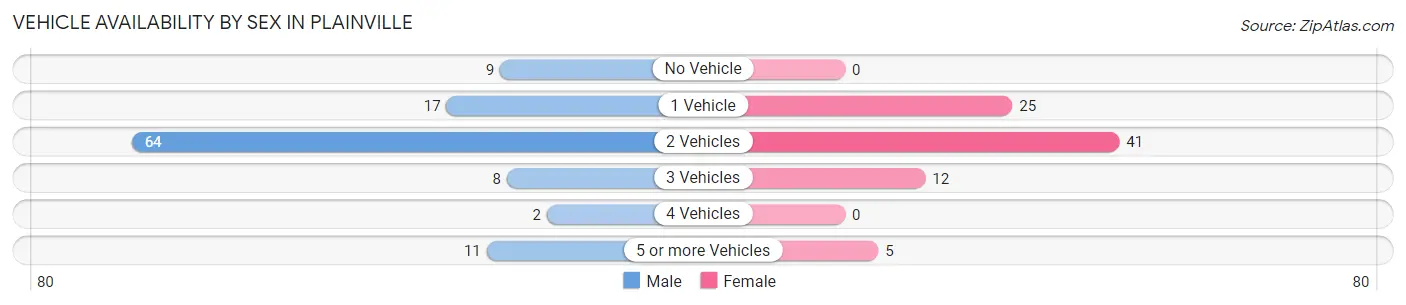
| Vehicles Available | Male | Female |
| No Vehicle | 9 (8.1%) | 0 (0.0%) |
| 1 Vehicle | 17 (15.3%) | 25 (30.1%) |
| 2 Vehicles | 64 (57.7%) | 41 (49.4%) |
| 3 Vehicles | 8 (7.2%) | 12 (14.5%) |
| 4 Vehicles | 2 (1.8%) | 0 (0.0%) |
| 5 or more Vehicles | 11 (9.9%) | 5 (6.0%) |
| Total | 111 (100.0%) | 83 (100.0%) |
Commute Time in Plainville
The most frequently occuring commute durations in Plainville are 15 to 19 minutes (39 commuters, 21.0%), 5 to 9 minutes (31 commuters, 16.7%), and 20 to 24 minutes (24 commuters, 12.9%).
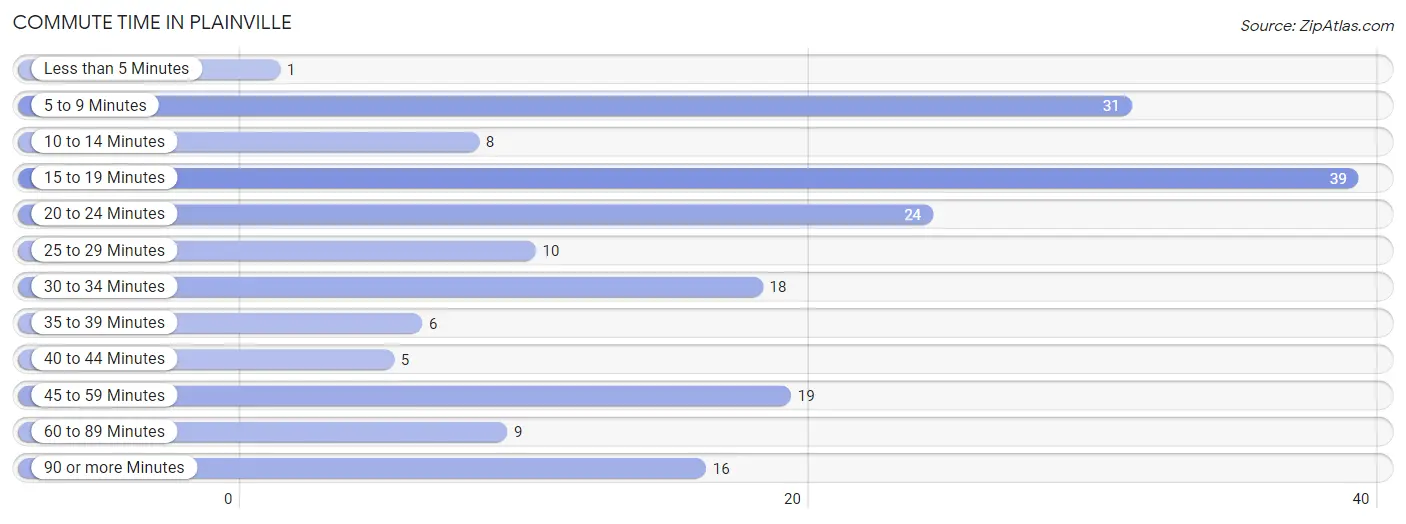
| Commute Time | # Commuters | % Commuters |
| Less than 5 Minutes | 1 | 0.5% |
| 5 to 9 Minutes | 31 | 16.7% |
| 10 to 14 Minutes | 8 | 4.3% |
| 15 to 19 Minutes | 39 | 21.0% |
| 20 to 24 Minutes | 24 | 12.9% |
| 25 to 29 Minutes | 10 | 5.4% |
| 30 to 34 Minutes | 18 | 9.7% |
| 35 to 39 Minutes | 6 | 3.2% |
| 40 to 44 Minutes | 5 | 2.7% |
| 45 to 59 Minutes | 19 | 10.2% |
| 60 to 89 Minutes | 9 | 4.8% |
| 90 or more Minutes | 16 | 8.6% |
Commute Time by Sex in Plainville
The most common commute times in Plainville are 5 to 9 minutes (22 commuters, 20.6%) for males and 15 to 19 minutes (20 commuters, 25.3%) for females.
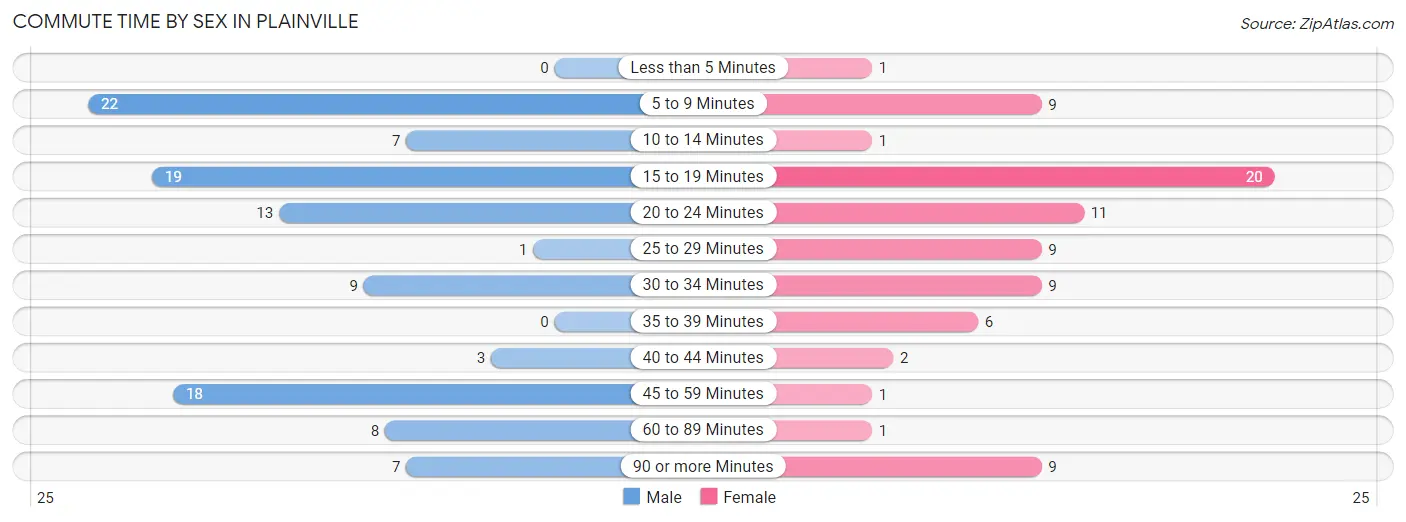
| Commute Time | Male | Female |
| Less than 5 Minutes | 0 (0.0%) | 1 (1.3%) |
| 5 to 9 Minutes | 22 (20.6%) | 9 (11.4%) |
| 10 to 14 Minutes | 7 (6.5%) | 1 (1.3%) |
| 15 to 19 Minutes | 19 (17.8%) | 20 (25.3%) |
| 20 to 24 Minutes | 13 (12.1%) | 11 (13.9%) |
| 25 to 29 Minutes | 1 (0.9%) | 9 (11.4%) |
| 30 to 34 Minutes | 9 (8.4%) | 9 (11.4%) |
| 35 to 39 Minutes | 0 (0.0%) | 6 (7.6%) |
| 40 to 44 Minutes | 3 (2.8%) | 2 (2.5%) |
| 45 to 59 Minutes | 18 (16.8%) | 1 (1.3%) |
| 60 to 89 Minutes | 8 (7.5%) | 1 (1.3%) |
| 90 or more Minutes | 7 (6.5%) | 9 (11.4%) |
Time of Departure to Work by Sex in Plainville
The most frequent times of departure to work in Plainville are 12:00 AM to 4:59 AM (20, 18.7%) for males and 7:30 AM to 7:59 AM (15, 19.0%) for females.
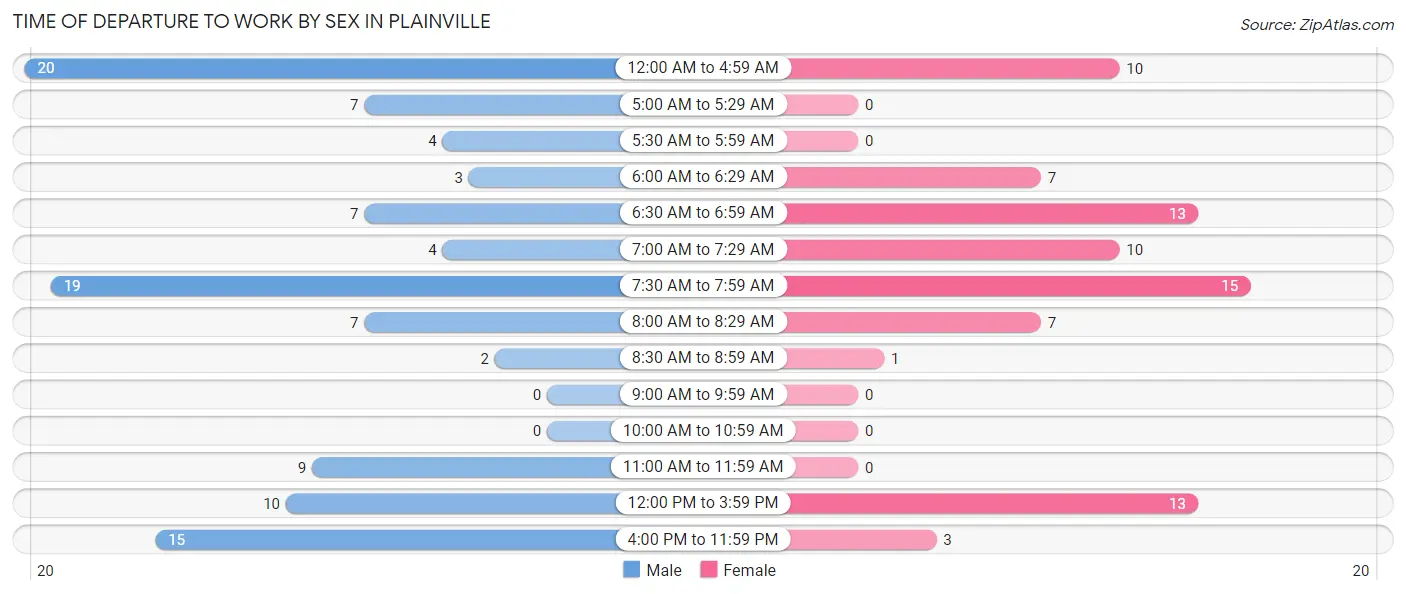
| Time of Departure | Male | Female |
| 12:00 AM to 4:59 AM | 20 (18.7%) | 10 (12.7%) |
| 5:00 AM to 5:29 AM | 7 (6.5%) | 0 (0.0%) |
| 5:30 AM to 5:59 AM | 4 (3.7%) | 0 (0.0%) |
| 6:00 AM to 6:29 AM | 3 (2.8%) | 7 (8.9%) |
| 6:30 AM to 6:59 AM | 7 (6.5%) | 13 (16.5%) |
| 7:00 AM to 7:29 AM | 4 (3.7%) | 10 (12.7%) |
| 7:30 AM to 7:59 AM | 19 (17.8%) | 15 (19.0%) |
| 8:00 AM to 8:29 AM | 7 (6.5%) | 7 (8.9%) |
| 8:30 AM to 8:59 AM | 2 (1.9%) | 1 (1.3%) |
| 9:00 AM to 9:59 AM | 0 (0.0%) | 0 (0.0%) |
| 10:00 AM to 10:59 AM | 0 (0.0%) | 0 (0.0%) |
| 11:00 AM to 11:59 AM | 9 (8.4%) | 0 (0.0%) |
| 12:00 PM to 3:59 PM | 10 (9.3%) | 13 (16.5%) |
| 4:00 PM to 11:59 PM | 15 (14.0%) | 3 (3.8%) |
| Total | 107 (100.0%) | 79 (100.0%) |
Housing Occupancy in Plainville
Occupancy by Ownership in Plainville
Of the total 185 dwellings in Plainville, owner-occupied units account for 106 (57.3%), while renter-occupied units make up 79 (42.7%).
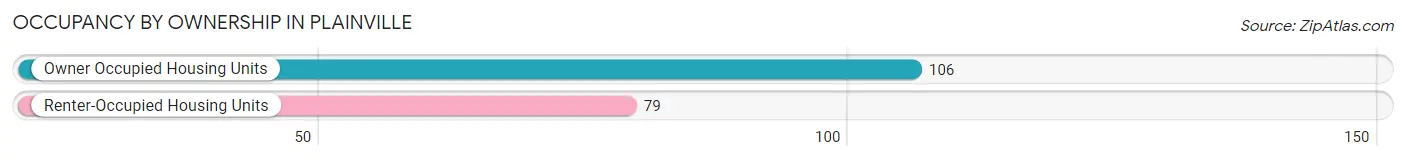
| Occupancy | # Housing Units | % Housing Units |
| Owner Occupied Housing Units | 106 | 57.3% |
| Renter-Occupied Housing Units | 79 | 42.7% |
| Total Occupied Housing Units | 185 | 100.0% |
Occupancy by Household Size in Plainville
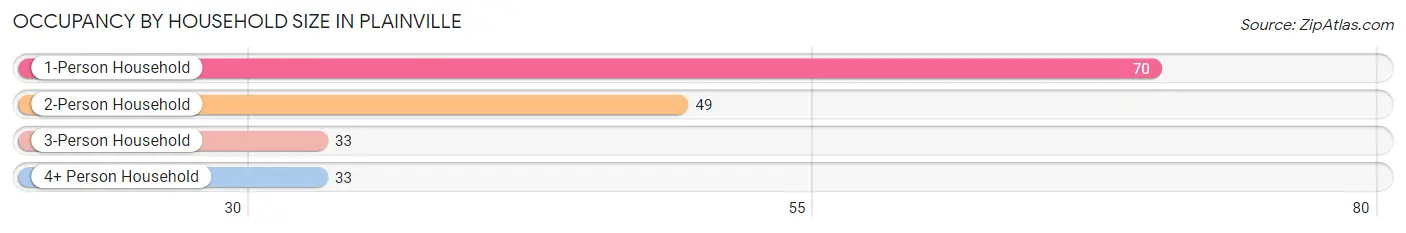
| Household Size | # Housing Units | % Housing Units |
| 1-Person Household | 70 | 37.8% |
| 2-Person Household | 49 | 26.5% |
| 3-Person Household | 33 | 17.8% |
| 4+ Person Household | 33 | 17.8% |
| Total Housing Units | 185 | 100.0% |
Occupancy by Ownership by Household Size in Plainville
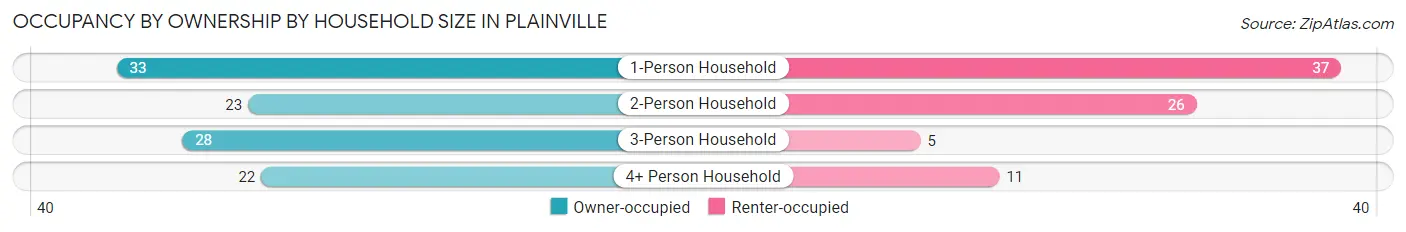
| Household Size | Owner-occupied | Renter-occupied |
| 1-Person Household | 33 (47.1%) | 37 (52.9%) |
| 2-Person Household | 23 (46.9%) | 26 (53.1%) |
| 3-Person Household | 28 (84.9%) | 5 (15.1%) |
| 4+ Person Household | 22 (66.7%) | 11 (33.3%) |
| Total Housing Units | 106 (57.3%) | 79 (42.7%) |
Occupancy by Educational Attainment in Plainville
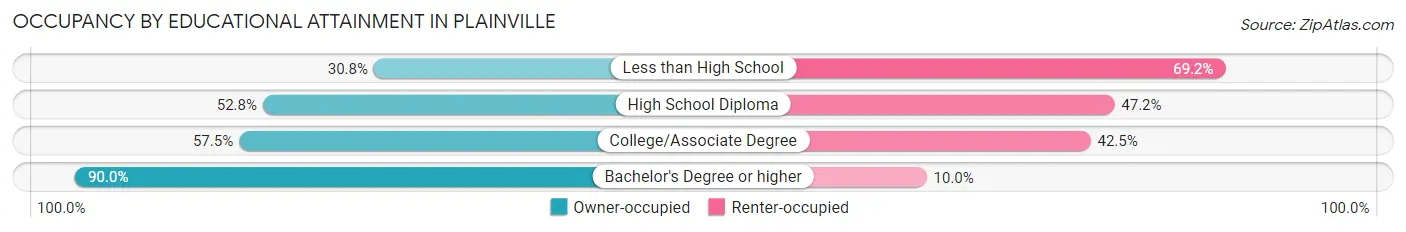
| Household Size | Owner-occupied | Renter-occupied |
| Less than High School | 4 (30.8%) | 9 (69.2%) |
| High School Diploma | 38 (52.8%) | 34 (47.2%) |
| College/Associate Degree | 46 (57.5%) | 34 (42.5%) |
| Bachelor's Degree or higher | 18 (90.0%) | 2 (10.0%) |
Occupancy by Age of Householder in Plainville
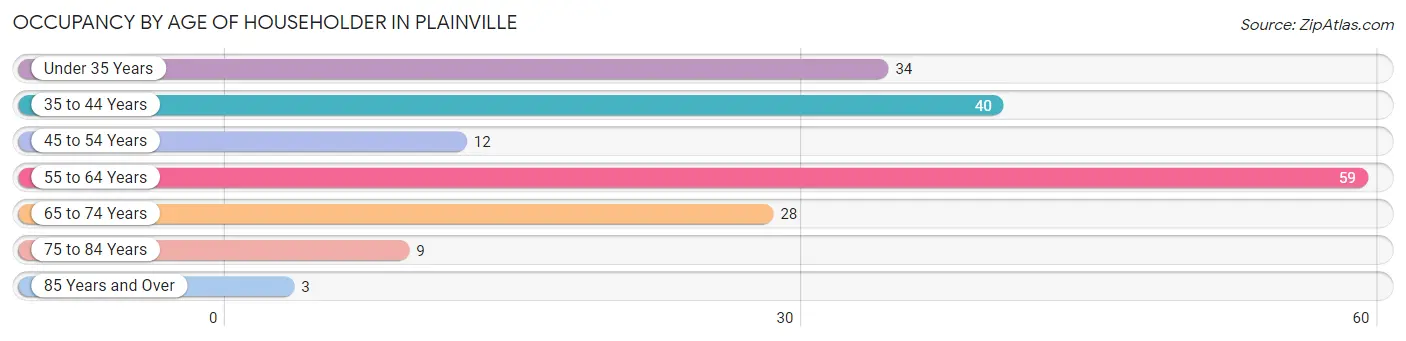
| Age Bracket | # Households | % Households |
| Under 35 Years | 34 | 18.4% |
| 35 to 44 Years | 40 | 21.6% |
| 45 to 54 Years | 12 | 6.5% |
| 55 to 64 Years | 59 | 31.9% |
| 65 to 74 Years | 28 | 15.1% |
| 75 to 84 Years | 9 | 4.9% |
| 85 Years and Over | 3 | 1.6% |
| Total | 185 | 100.0% |
Housing Finances in Plainville
Median Income by Occupancy in Plainville
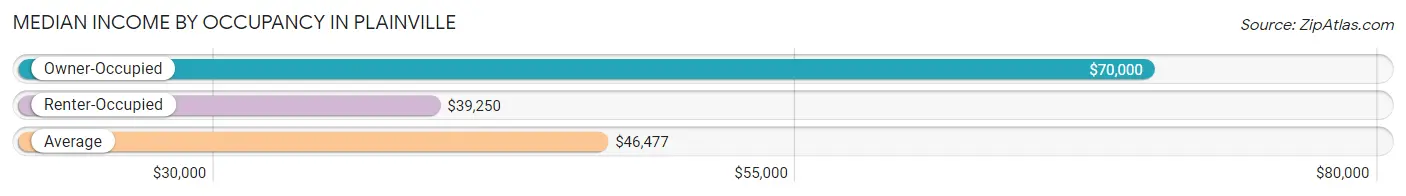
| Occupancy Type | # Households | Median Income |
| Owner-Occupied | 106 (57.3%) | $70,000 |
| Renter-Occupied | 79 (42.7%) | $39,250 |
| Average | 185 (100.0%) | $46,477 |
Occupancy by Householder Income Bracket in Plainville
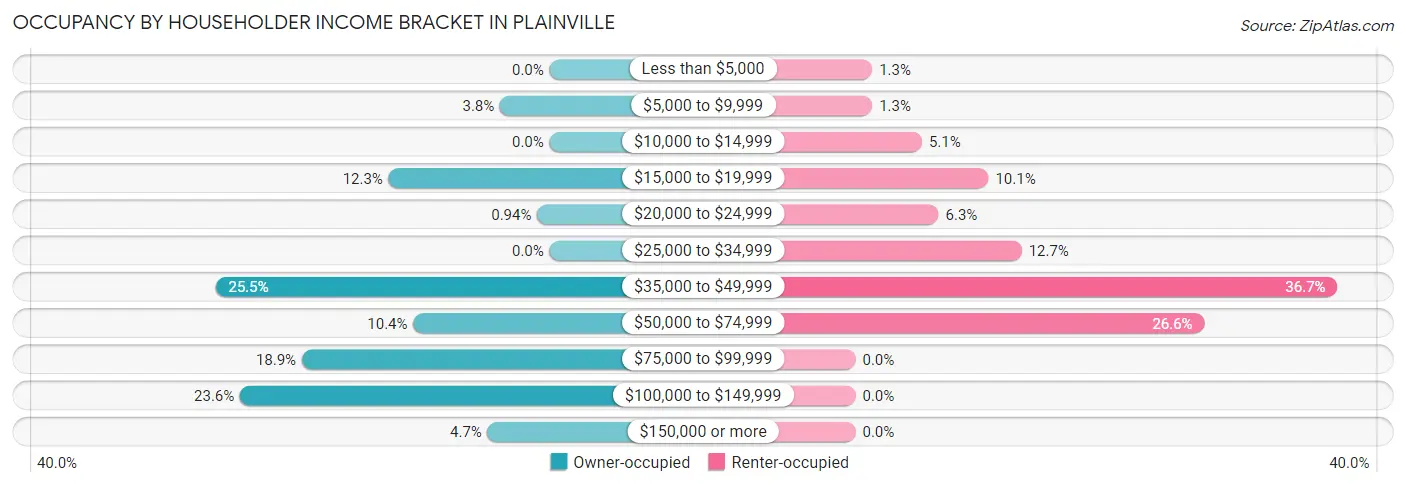
| Income Bracket | Owner-occupied | Renter-occupied |
| Less than $5,000 | 0 (0.0%) | 1 (1.3%) |
| $5,000 to $9,999 | 4 (3.8%) | 1 (1.3%) |
| $10,000 to $14,999 | 0 (0.0%) | 4 (5.1%) |
| $15,000 to $19,999 | 13 (12.3%) | 8 (10.1%) |
| $20,000 to $24,999 | 1 (0.9%) | 5 (6.3%) |
| $25,000 to $34,999 | 0 (0.0%) | 10 (12.7%) |
| $35,000 to $49,999 | 27 (25.5%) | 29 (36.7%) |
| $50,000 to $74,999 | 11 (10.4%) | 21 (26.6%) |
| $75,000 to $99,999 | 20 (18.9%) | 0 (0.0%) |
| $100,000 to $149,999 | 25 (23.6%) | 0 (0.0%) |
| $150,000 or more | 5 (4.7%) | 0 (0.0%) |
| Total | 106 (100.0%) | 79 (100.0%) |
Monthly Housing Cost Tiers in Plainville
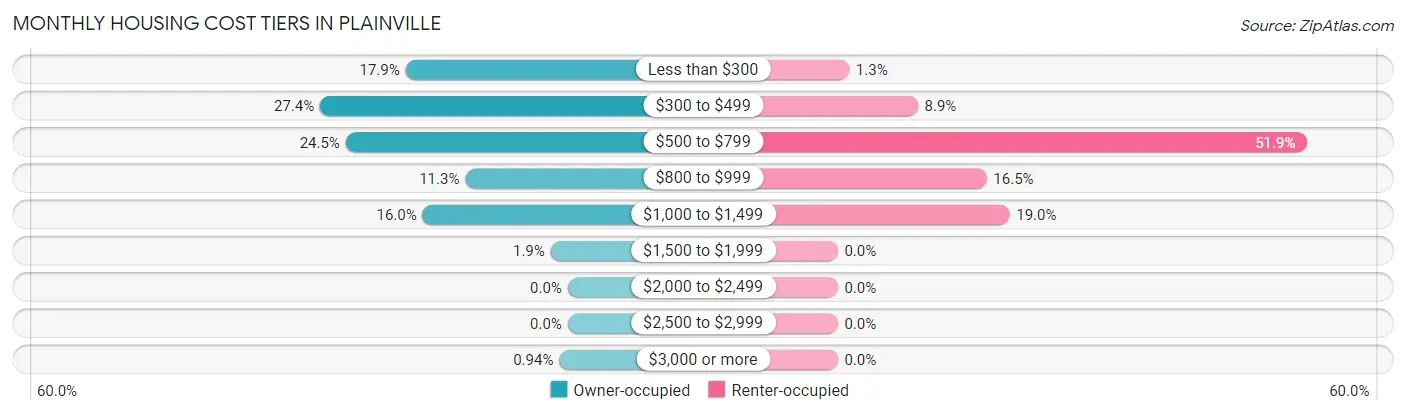
| Monthly Cost | Owner-occupied | Renter-occupied |
| Less than $300 | 19 (17.9%) | 1 (1.3%) |
| $300 to $499 | 29 (27.4%) | 7 (8.9%) |
| $500 to $799 | 26 (24.5%) | 41 (51.9%) |
| $800 to $999 | 12 (11.3%) | 13 (16.5%) |
| $1,000 to $1,499 | 17 (16.0%) | 15 (19.0%) |
| $1,500 to $1,999 | 2 (1.9%) | 0 (0.0%) |
| $2,000 to $2,499 | 0 (0.0%) | 0 (0.0%) |
| $2,500 to $2,999 | 0 (0.0%) | 0 (0.0%) |
| $3,000 or more | 1 (0.9%) | 0 (0.0%) |
| Total | 106 (100.0%) | 79 (100.0%) |
Physical Housing Characteristics in Plainville
Housing Structures in Plainville
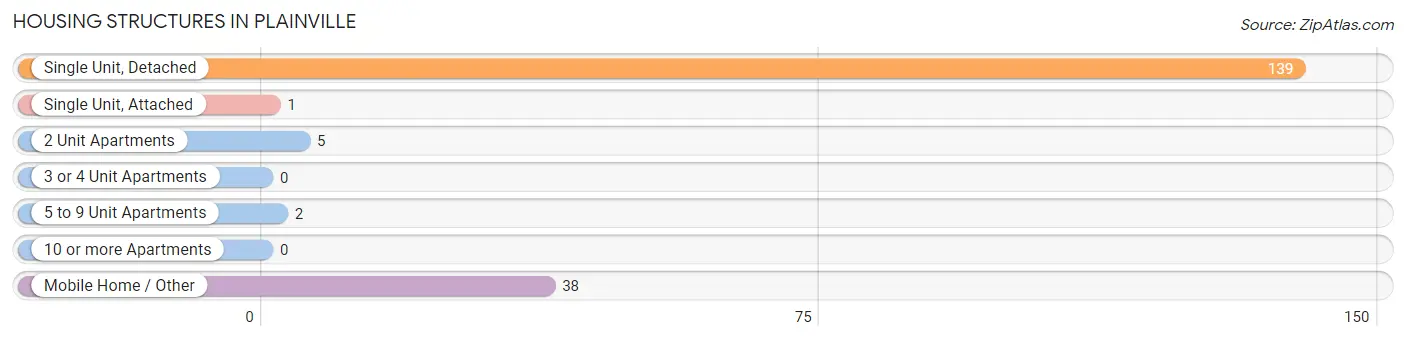
| Structure Type | # Housing Units | % Housing Units |
| Single Unit, Detached | 139 | 75.1% |
| Single Unit, Attached | 1 | 0.5% |
| 2 Unit Apartments | 5 | 2.7% |
| 3 or 4 Unit Apartments | 0 | 0.0% |
| 5 to 9 Unit Apartments | 2 | 1.1% |
| 10 or more Apartments | 0 | 0.0% |
| Mobile Home / Other | 38 | 20.5% |
| Total | 185 | 100.0% |
Housing Structures by Occupancy in Plainville
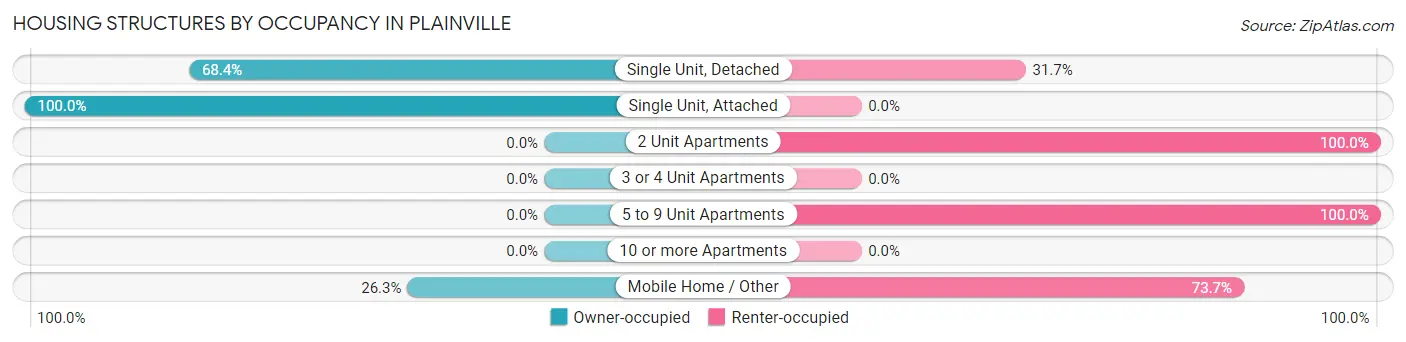
| Structure Type | Owner-occupied | Renter-occupied |
| Single Unit, Detached | 95 (68.3%) | 44 (31.7%) |
| Single Unit, Attached | 1 (100.0%) | 0 (0.0%) |
| 2 Unit Apartments | 0 (0.0%) | 5 (100.0%) |
| 3 or 4 Unit Apartments | 0 (0.0%) | 0 (0.0%) |
| 5 to 9 Unit Apartments | 0 (0.0%) | 2 (100.0%) |
| 10 or more Apartments | 0 (0.0%) | 0 (0.0%) |
| Mobile Home / Other | 10 (26.3%) | 28 (73.7%) |
| Total | 106 (57.3%) | 79 (42.7%) |
Housing Structures by Number of Rooms in Plainville
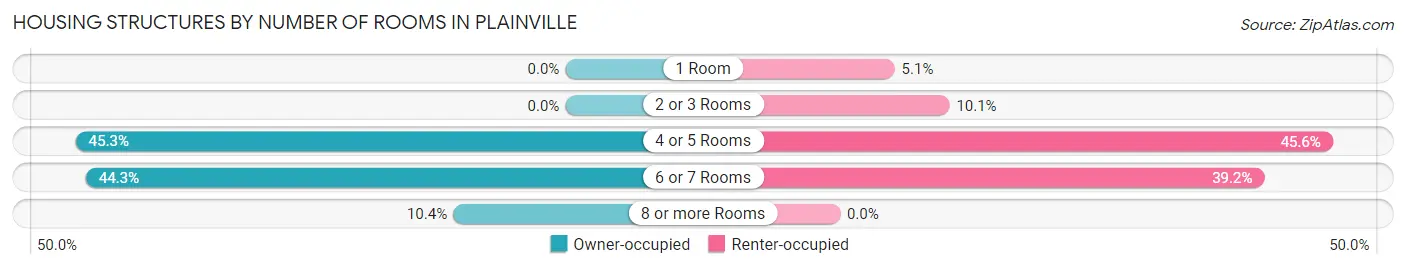
| Number of Rooms | Owner-occupied | Renter-occupied |
| 1 Room | 0 (0.0%) | 4 (5.1%) |
| 2 or 3 Rooms | 0 (0.0%) | 8 (10.1%) |
| 4 or 5 Rooms | 48 (45.3%) | 36 (45.6%) |
| 6 or 7 Rooms | 47 (44.3%) | 31 (39.2%) |
| 8 or more Rooms | 11 (10.4%) | 0 (0.0%) |
| Total | 106 (100.0%) | 79 (100.0%) |
Housing Structure by Heating Type in Plainville
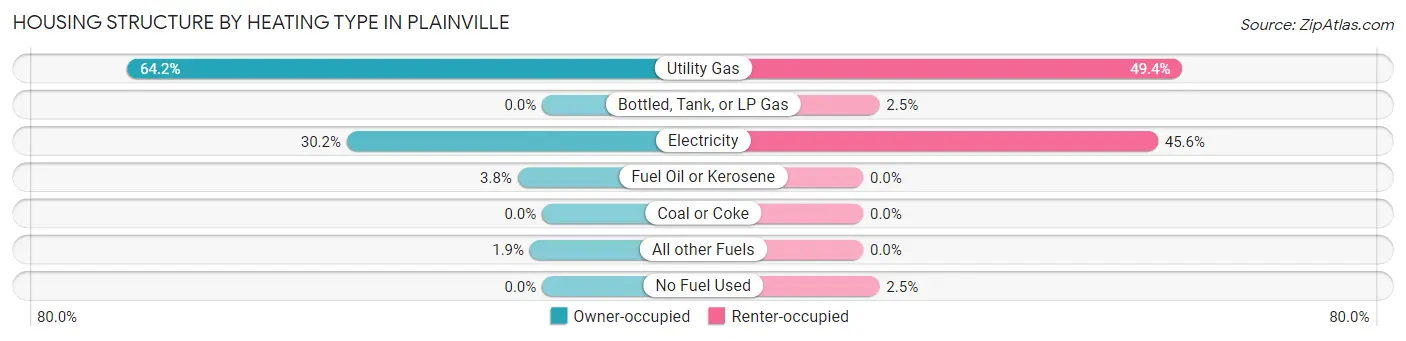
| Heating Type | Owner-occupied | Renter-occupied |
| Utility Gas | 68 (64.1%) | 39 (49.4%) |
| Bottled, Tank, or LP Gas | 0 (0.0%) | 2 (2.5%) |
| Electricity | 32 (30.2%) | 36 (45.6%) |
| Fuel Oil or Kerosene | 4 (3.8%) | 0 (0.0%) |
| Coal or Coke | 0 (0.0%) | 0 (0.0%) |
| All other Fuels | 2 (1.9%) | 0 (0.0%) |
| No Fuel Used | 0 (0.0%) | 2 (2.5%) |
| Total | 106 (100.0%) | 79 (100.0%) |
Household Vehicle Usage in Plainville
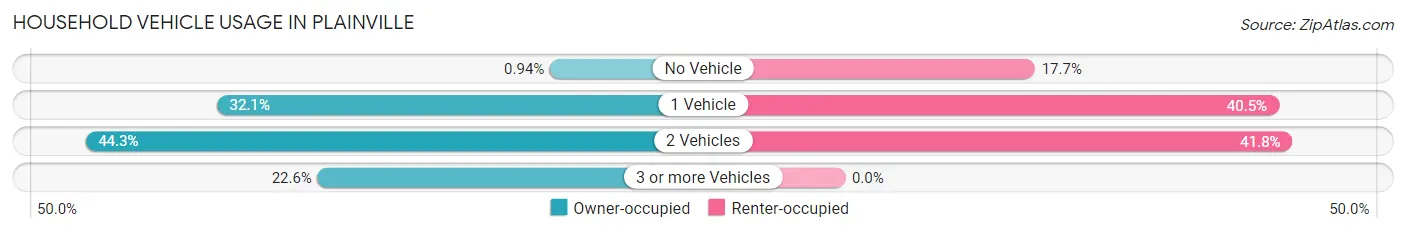
| Vehicles per Household | Owner-occupied | Renter-occupied |
| No Vehicle | 1 (0.9%) | 14 (17.7%) |
| 1 Vehicle | 34 (32.1%) | 32 (40.5%) |
| 2 Vehicles | 47 (44.3%) | 33 (41.8%) |
| 3 or more Vehicles | 24 (22.6%) | 0 (0.0%) |
| Total | 106 (100.0%) | 79 (100.0%) |
Real Estate & Mortgages in Plainville
Real Estate and Mortgage Overview in Plainville
| Characteristic | Without Mortgage | With Mortgage |
| Housing Units | 56 | 50 |
| Median Property Value | $87,100 | $77,300 |
| Median Household Income | - | - |
| Monthly Housing Costs | $350 | $0 |
| Real Estate Taxes | $644 | $2 |
Property Value by Mortgage Status in Plainville
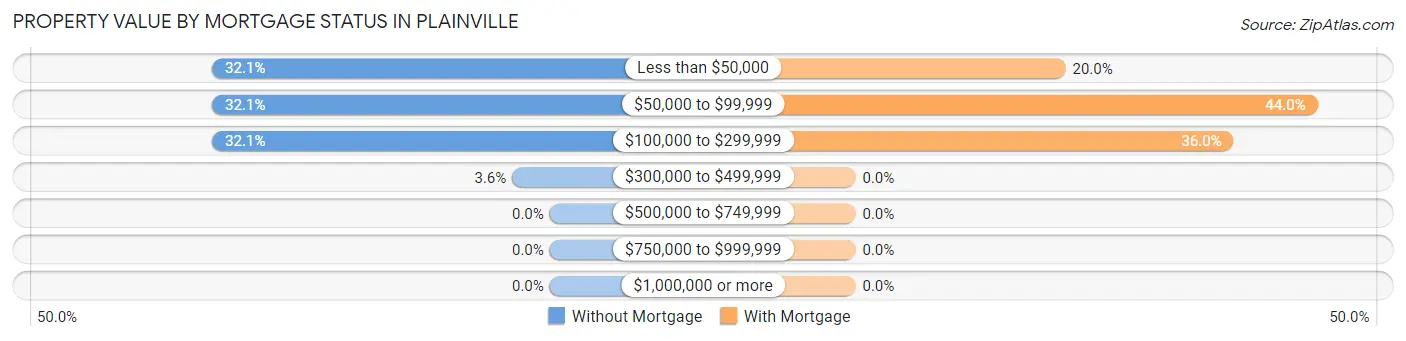
| Property Value | Without Mortgage | With Mortgage |
| Less than $50,000 | 18 (32.1%) | 10 (20.0%) |
| $50,000 to $99,999 | 18 (32.1%) | 22 (44.0%) |
| $100,000 to $299,999 | 18 (32.1%) | 18 (36.0%) |
| $300,000 to $499,999 | 2 (3.6%) | 0 (0.0%) |
| $500,000 to $749,999 | 0 (0.0%) | 0 (0.0%) |
| $750,000 to $999,999 | 0 (0.0%) | 0 (0.0%) |
| $1,000,000 or more | 0 (0.0%) | 0 (0.0%) |
| Total | 56 (100.0%) | 50 (100.0%) |
Household Income by Mortgage Status in Plainville
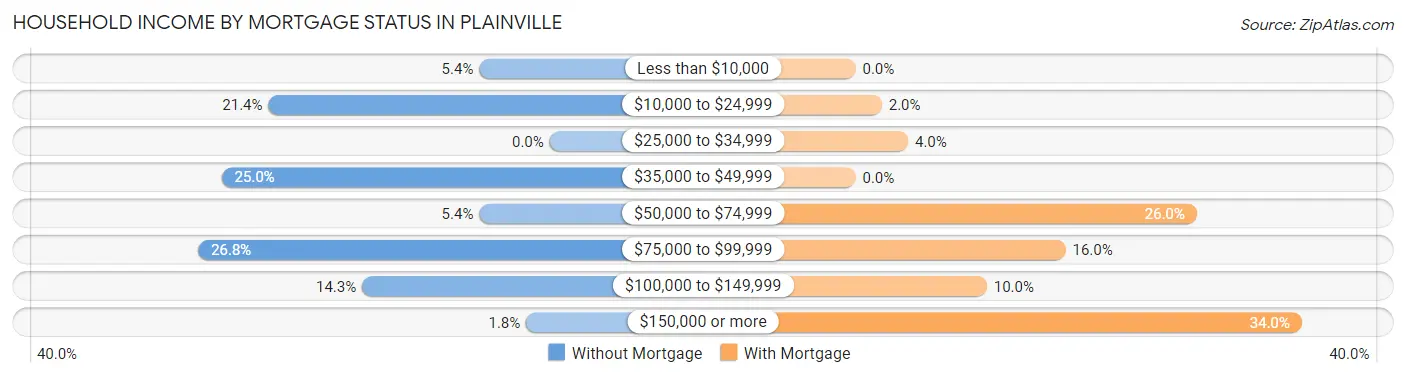
| Household Income | Without Mortgage | With Mortgage |
| Less than $10,000 | 3 (5.4%) | 0 (0.0%) |
| $10,000 to $24,999 | 12 (21.4%) | 1 (2.0%) |
| $25,000 to $34,999 | 0 (0.0%) | 2 (4.0%) |
| $35,000 to $49,999 | 14 (25.0%) | 0 (0.0%) |
| $50,000 to $74,999 | 3 (5.4%) | 13 (26.0%) |
| $75,000 to $99,999 | 15 (26.8%) | 8 (16.0%) |
| $100,000 to $149,999 | 8 (14.3%) | 5 (10.0%) |
| $150,000 or more | 1 (1.8%) | 17 (34.0%) |
| Total | 56 (100.0%) | 50 (100.0%) |
Property Value to Household Income Ratio in Plainville
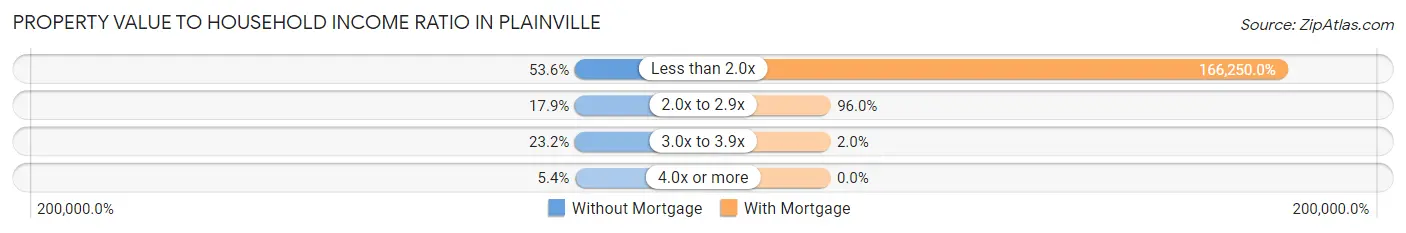
| Value-to-Income Ratio | Without Mortgage | With Mortgage |
| Less than 2.0x | 30 (53.6%) | 83,125 (166,250.0%) |
| 2.0x to 2.9x | 10 (17.9%) | 48 (96.0%) |
| 3.0x to 3.9x | 13 (23.2%) | 1 (2.0%) |
| 4.0x or more | 3 (5.4%) | 0 (0.0%) |
| Total | 56 (100.0%) | 50 (100.0%) |
Real Estate Taxes by Mortgage Status in Plainville
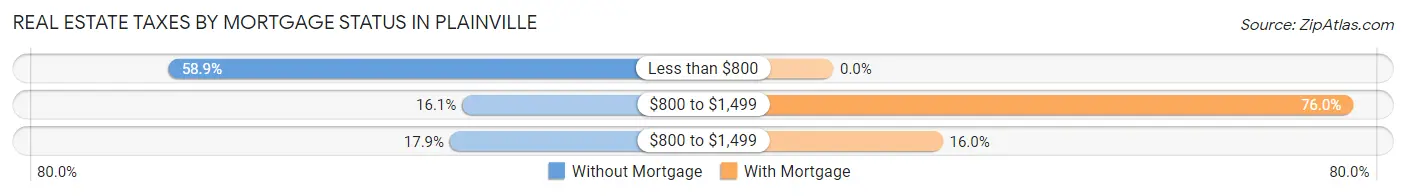
| Property Taxes | Without Mortgage | With Mortgage |
| Less than $800 | 33 (58.9%) | 0 (0.0%) |
| $800 to $1,499 | 9 (16.1%) | 38 (76.0%) |
| $800 to $1,499 | 10 (17.9%) | 8 (16.0%) |
| Total | 56 (100.0%) | 50 (100.0%) |
Health & Disability in Plainville
Health Insurance Coverage by Age in Plainville
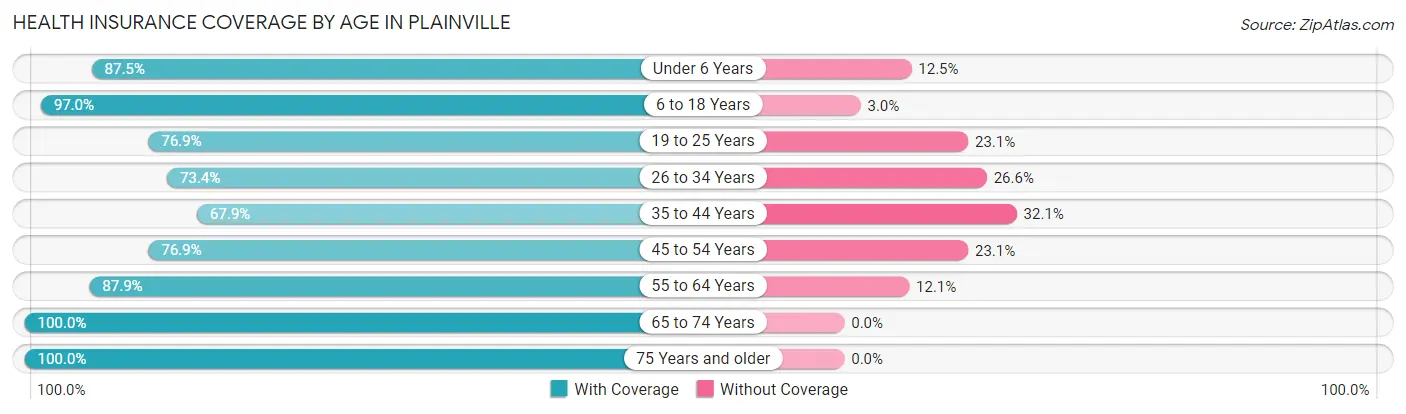
| Age Bracket | With Coverage | Without Coverage |
| Under 6 Years | 28 (87.5%) | 4 (12.5%) |
| 6 to 18 Years | 96 (97.0%) | 3 (3.0%) |
| 19 to 25 Years | 20 (76.9%) | 6 (23.1%) |
| 26 to 34 Years | 47 (73.4%) | 17 (26.6%) |
| 35 to 44 Years | 38 (67.9%) | 18 (32.1%) |
| 45 to 54 Years | 20 (76.9%) | 6 (23.1%) |
| 55 to 64 Years | 80 (87.9%) | 11 (12.1%) |
| 65 to 74 Years | 35 (100.0%) | 0 (0.0%) |
| 75 Years and older | 13 (100.0%) | 0 (0.0%) |
| Total | 377 (85.3%) | 65 (14.7%) |
Health Insurance Coverage by Citizenship Status in Plainville
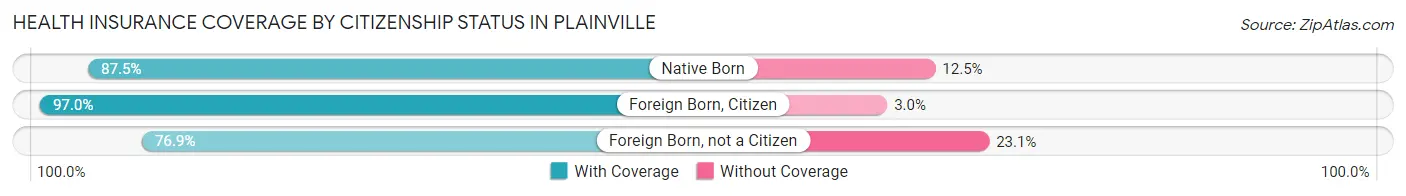
| Citizenship Status | With Coverage | Without Coverage |
| Native Born | 28 (87.5%) | 4 (12.5%) |
| Foreign Born, Citizen | 96 (97.0%) | 3 (3.0%) |
| Foreign Born, not a Citizen | 20 (76.9%) | 6 (23.1%) |
Health Insurance Coverage by Household Income in Plainville
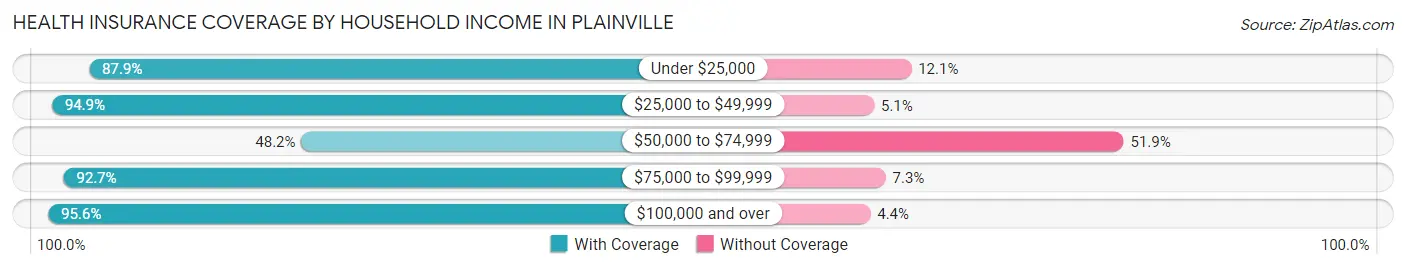
| Household Income | With Coverage | Without Coverage |
| Under $25,000 | 51 (87.9%) | 7 (12.1%) |
| $25,000 to $49,999 | 149 (94.9%) | 8 (5.1%) |
| $50,000 to $74,999 | 39 (48.1%) | 42 (51.8%) |
| $75,000 to $99,999 | 51 (92.7%) | 4 (7.3%) |
| $100,000 and over | 87 (95.6%) | 4 (4.4%) |
Public vs Private Health Insurance Coverage by Age in Plainville
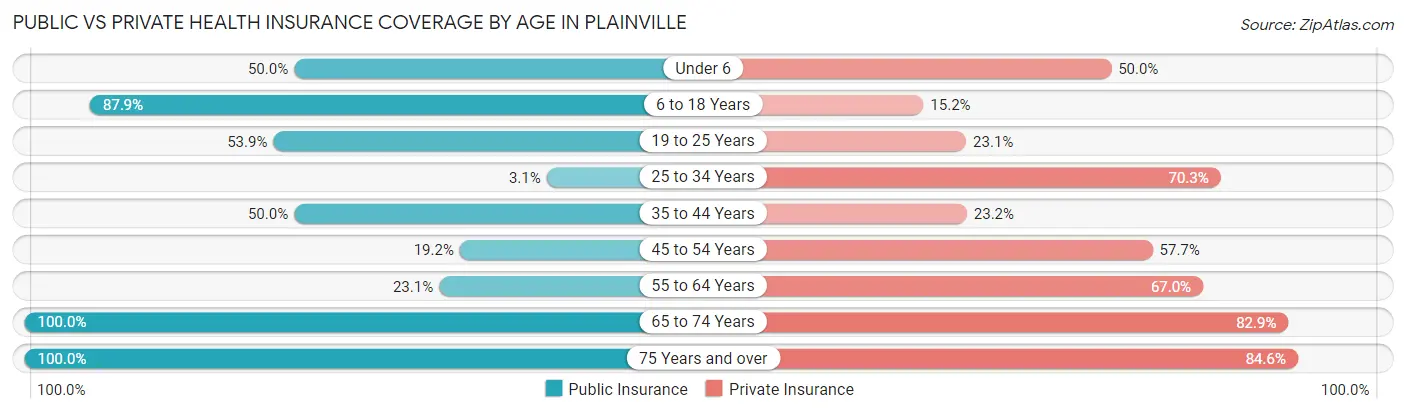
| Age Bracket | Public Insurance | Private Insurance |
| Under 6 | 16 (50.0%) | 16 (50.0%) |
| 6 to 18 Years | 87 (87.9%) | 15 (15.1%) |
| 19 to 25 Years | 14 (53.8%) | 6 (23.1%) |
| 25 to 34 Years | 2 (3.1%) | 45 (70.3%) |
| 35 to 44 Years | 28 (50.0%) | 13 (23.2%) |
| 45 to 54 Years | 5 (19.2%) | 15 (57.7%) |
| 55 to 64 Years | 21 (23.1%) | 61 (67.0%) |
| 65 to 74 Years | 35 (100.0%) | 29 (82.9%) |
| 75 Years and over | 13 (100.0%) | 11 (84.6%) |
| Total | 221 (50.0%) | 211 (47.7%) |
Disability Status by Sex by Age in Plainville
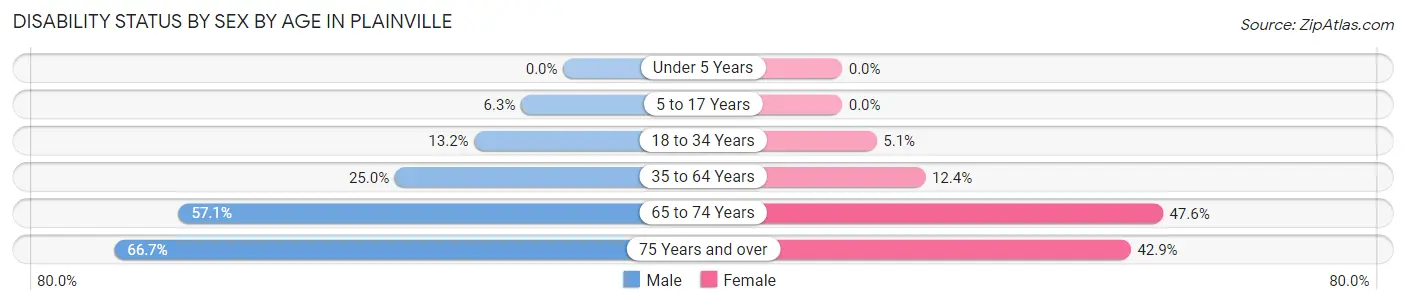
| Age Bracket | Male | Female |
| Under 5 Years | 0 (0.0%) | 0 (0.0%) |
| 5 to 17 Years | 3 (6.2%) | 0 (0.0%) |
| 18 to 34 Years | 7 (13.2%) | 2 (5.1%) |
| 35 to 64 Years | 23 (25.0%) | 10 (12.3%) |
| 65 to 74 Years | 8 (57.1%) | 10 (47.6%) |
| 75 Years and over | 4 (66.7%) | 3 (42.9%) |
Disability Class by Sex by Age in Plainville
Disability Class: Hearing Difficulty
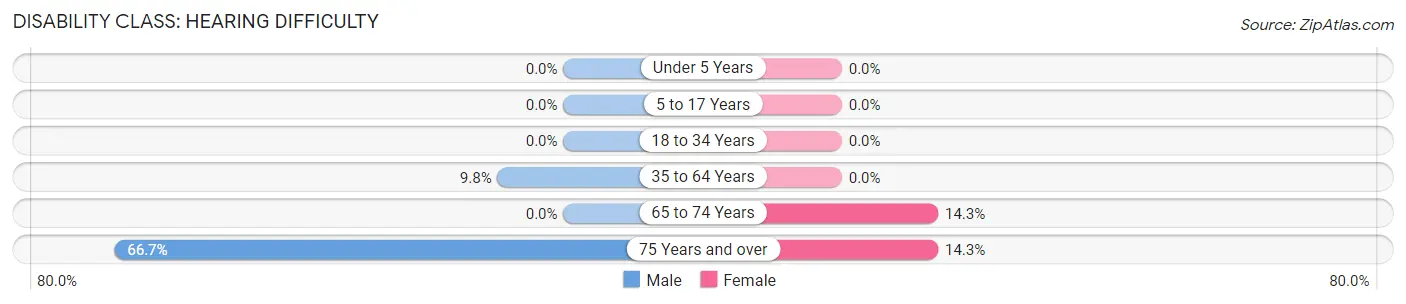
| Age Bracket | Male | Female |
| Under 5 Years | 0 (0.0%) | 0 (0.0%) |
| 5 to 17 Years | 0 (0.0%) | 0 (0.0%) |
| 18 to 34 Years | 0 (0.0%) | 0 (0.0%) |
| 35 to 64 Years | 9 (9.8%) | 0 (0.0%) |
| 65 to 74 Years | 0 (0.0%) | 3 (14.3%) |
| 75 Years and over | 4 (66.7%) | 1 (14.3%) |
Disability Class: Vision Difficulty
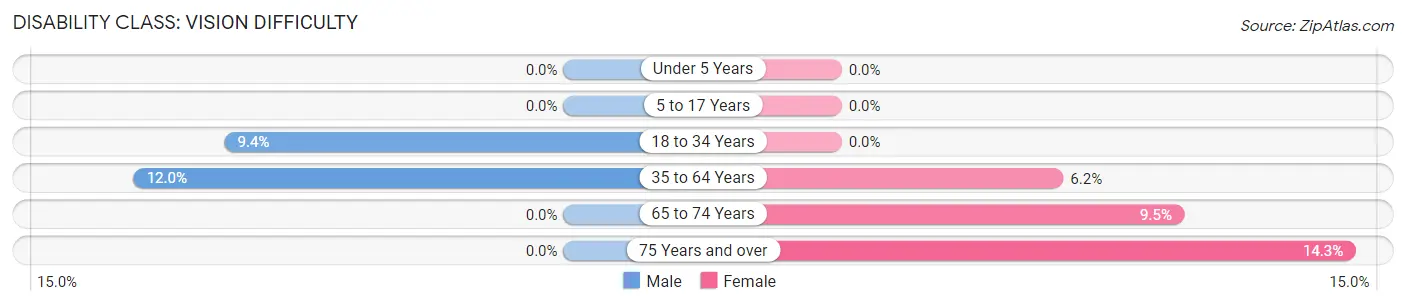
| Age Bracket | Male | Female |
| Under 5 Years | 0 (0.0%) | 0 (0.0%) |
| 5 to 17 Years | 0 (0.0%) | 0 (0.0%) |
| 18 to 34 Years | 5 (9.4%) | 0 (0.0%) |
| 35 to 64 Years | 11 (12.0%) | 5 (6.2%) |
| 65 to 74 Years | 0 (0.0%) | 2 (9.5%) |
| 75 Years and over | 0 (0.0%) | 1 (14.3%) |
Disability Class: Cognitive Difficulty
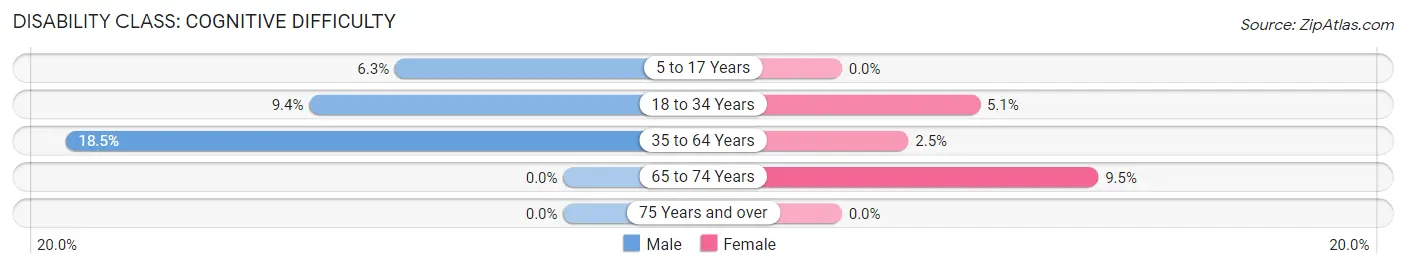
| Age Bracket | Male | Female |
| 5 to 17 Years | 3 (6.2%) | 0 (0.0%) |
| 18 to 34 Years | 5 (9.4%) | 2 (5.1%) |
| 35 to 64 Years | 17 (18.5%) | 2 (2.5%) |
| 65 to 74 Years | 0 (0.0%) | 2 (9.5%) |
| 75 Years and over | 0 (0.0%) | 0 (0.0%) |
Disability Class: Ambulatory Difficulty
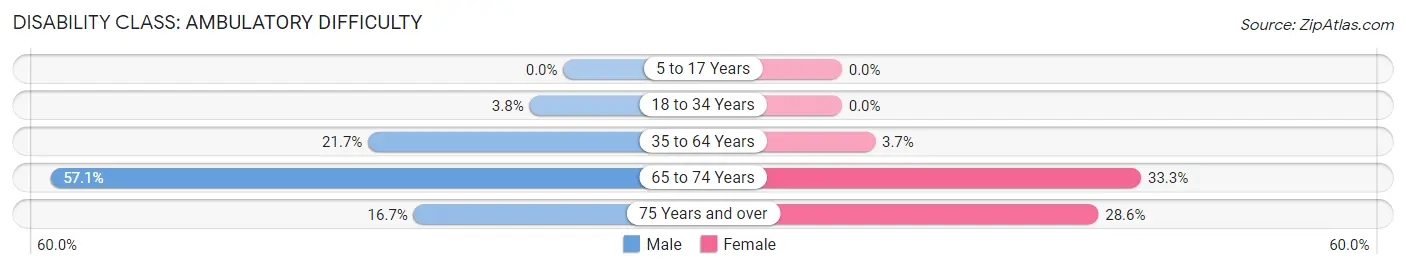
| Age Bracket | Male | Female |
| 5 to 17 Years | 0 (0.0%) | 0 (0.0%) |
| 18 to 34 Years | 2 (3.8%) | 0 (0.0%) |
| 35 to 64 Years | 20 (21.7%) | 3 (3.7%) |
| 65 to 74 Years | 8 (57.1%) | 7 (33.3%) |
| 75 Years and over | 1 (16.7%) | 2 (28.6%) |
Disability Class: Self-Care Difficulty
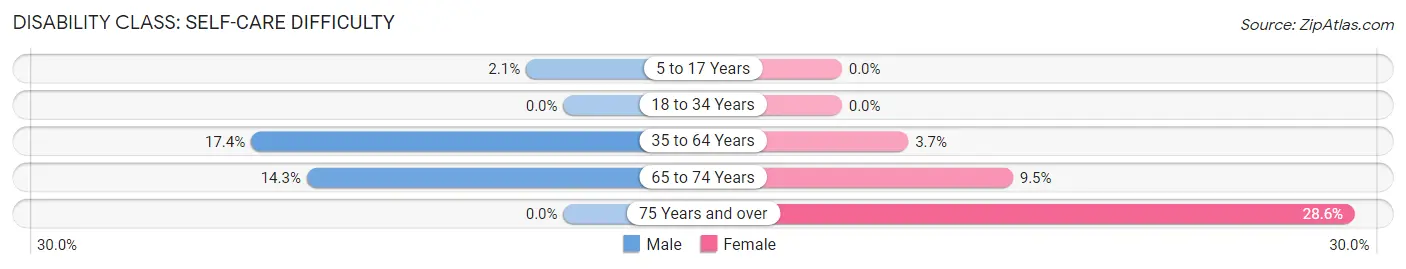
| Age Bracket | Male | Female |
| 5 to 17 Years | 1 (2.1%) | 0 (0.0%) |
| 18 to 34 Years | 0 (0.0%) | 0 (0.0%) |
| 35 to 64 Years | 16 (17.4%) | 3 (3.7%) |
| 65 to 74 Years | 2 (14.3%) | 2 (9.5%) |
| 75 Years and over | 0 (0.0%) | 2 (28.6%) |
Technology Access in Plainville
Computing Device Access in Plainville
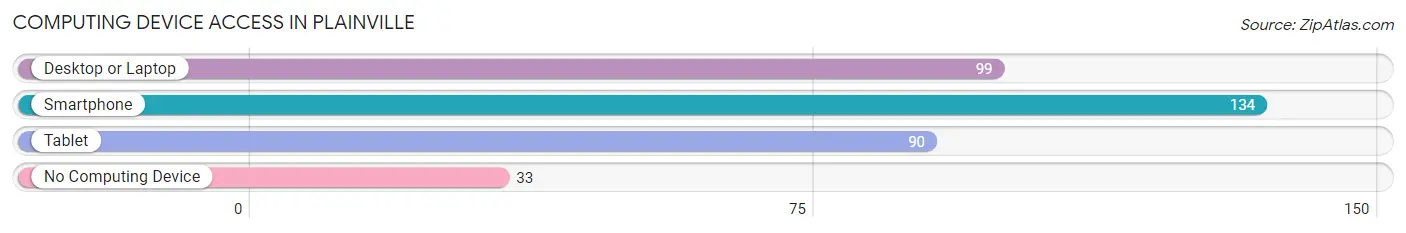
| Device Type | # Households | % Households |
| Desktop or Laptop | 99 | 53.5% |
| Smartphone | 134 | 72.4% |
| Tablet | 90 | 48.6% |
| No Computing Device | 33 | 17.8% |
| Total | 185 | 100.0% |
Internet Access in Plainville
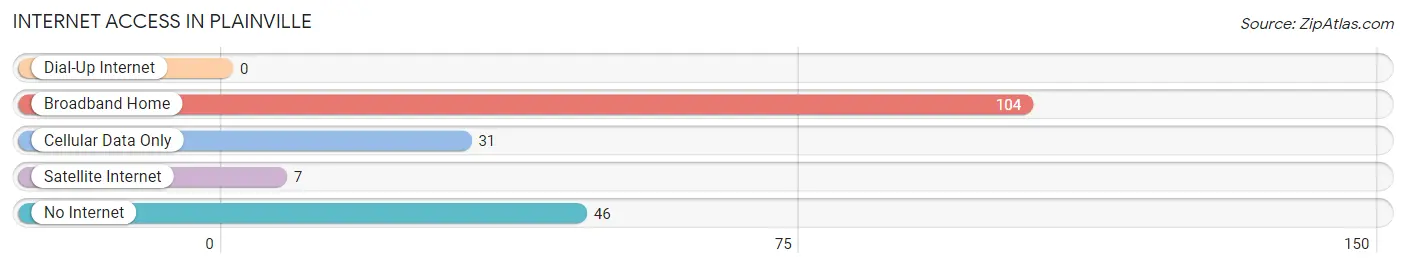
| Internet Type | # Households | % Households |
| Dial-Up Internet | 0 | 0.0% |
| Broadband Home | 104 | 56.2% |
| Cellular Data Only | 31 | 16.8% |
| Satellite Internet | 7 | 3.8% |
| No Internet | 46 | 24.9% |
| Total | 185 | 100.0% |
Plainville Summary
Plainville is a small town located in the state of Indiana, in the United States. It is situated in the northern part of the state, in the county of Knox. The town has a population of approximately 1,000 people, and is located about 30 miles south of the state capital, Indianapolis.
History
The area that is now Plainville was first settled in the early 1800s by a group of settlers from North Carolina. The town was originally known as “Plainville” due to its flat terrain. The town was officially incorporated in 1837, and the first post office was established in 1838.
In the late 1800s, the town began to grow and develop. The railroad was extended to Plainville in 1883, and the town became a hub for the surrounding agricultural communities. The town also became a popular destination for tourists, as it was located near several lakes and rivers.
In the early 1900s, the town experienced a period of growth and prosperity. Several businesses were established, including a bank, a hotel, and a general store. The town also had a movie theater, a library, and a school.
Geography
Plainville is located in the northern part of Indiana, in the county of Knox. The town is situated on the banks of the White River, and is surrounded by rolling hills and farmland. The town is located about 30 miles south of the state capital, Indianapolis.
The climate in Plainville is generally mild, with hot summers and cold winters. The average temperature in the summer is around 75 degrees Fahrenheit, and the average temperature in the winter is around 30 degrees Fahrenheit.
Economy
The economy of Plainville is largely based on agriculture. The town is home to several farms, which produce a variety of crops, including corn, soybeans, and wheat. The town also has several businesses, including a bank, a hotel, and a general store.
The town is also home to several manufacturing companies, which produce a variety of products, including furniture, clothing, and automotive parts. The town also has several restaurants, bars, and other businesses.
Demographics
As of the 2010 census, the population of Plainville was 1,000 people. The racial makeup of the town was 97.7% White, 0.7% African American, 0.2% Native American, 0.2% Asian, and 1.2% from other races. The median household income was $37,500, and the median age was 38 years.
Conclusion
Plainville is a small town located in the northern part of Indiana. The town has a population of approximately 1,000 people, and is located about 30 miles south of the state capital, Indianapolis. The economy of Plainville is largely based on agriculture, and the town is home to several businesses, including a bank, a hotel, and a general store. The racial makeup of the town is 97.7% White, 0.7% African American, 0.2% Native American, 0.2% Asian, and 1.2% from other races. The median household income was $37,500, and the median age was 38 years.
Common Questions
What is Per Capita Income in Plainville?
Per Capita income in Plainville is $25,168.
What is the Median Family Income in Plainville?
Median Family Income in Plainville is $60,313.
What is the Median Household income in Plainville?
Median Household Income in Plainville is $46,477.
What is Income or Wage Gap in Plainville?
Income or Wage Gap in Plainville is 3.6%.
Women in Plainville earn 96.4 cents for every dollar earned by a man.
What is Inequality or Gini Index in Plainville?
Inequality or Gini Index in Plainville is 0.36.
What is the Total Population of Plainville?
Total Population of Plainville is 442.
What is the Total Male Population of Plainville?
Total Male Population of Plainville is 227.
What is the Total Female Population of Plainville?
Total Female Population of Plainville is 215.
What is the Ratio of Males per 100 Females in Plainville?
There are 105.58 Males per 100 Females in Plainville.
What is the Ratio of Females per 100 Males in Plainville?
There are 94.71 Females per 100 Males in Plainville.
What is the Median Population Age in Plainville?
Median Population Age in Plainville is 34.5 Years.
What is the Average Family Size in Plainville
Average Family Size in Plainville is 3.2 People.
What is the Average Household Size in Plainville
Average Household Size in Plainville is 2.4 People.
How Large is the Labor Force in Plainville?
There are 215 People in the Labor Forcein in Plainville.
What is the Percentage of People in the Labor Force in Plainville?
65.0% of People are in the Labor Force in Plainville.
What is the Unemployment Rate in Plainville?
Unemployment Rate in Plainville is 9.8%.