Paoli, IN Map & Demographics
Paoli Map
Paoli Overview
$28,823
PER CAPITA INCOME
$47,200
AVG FAMILY INCOME
$36,858
AVG HOUSEHOLD INCOME
0.63
INEQUALITY / GINI INDEX
3,286
TOTAL POPULATION
1,512
MALE POPULATION
1,774
FEMALE POPULATION
85.23
MALES / 100 FEMALES
117.33
FEMALES / 100 MALES
36.3
MEDIAN AGE
2.9
AVG FAMILY SIZE
2.2
AVG HOUSEHOLD SIZE
1,377
LABOR FORCE [ PEOPLE ]
53.9%
PERCENT IN LABOR FORCE
4.1%
UNEMPLOYMENT RATE
Paoli Zip Codes
Paoli Area Codes
Income in Paoli
Income Overview in Paoli
Per Capita Income in Paoli is $28,823, while median incomes of families and households are $47,200 and $36,858 respectively.
| Characteristic | Number | Measure |
| Per Capita Income | 3,286 | $28,823 |
| Median Family Income | 748 | $47,200 |
| Mean Family Income | 748 | $113,606 |
| Median Household Income | 1,374 | $36,858 |
| Mean Household Income | 1,374 | $76,318 |
| Income Deficit | 748 | $0 |
| Wage / Income Gap (%) | 3,286 | 0.00% |
| Wage / Income Gap ($) | 3,286 | 100.00¢ per $1 |
| Gini / Inequality Index | 3,286 | 0.63 |
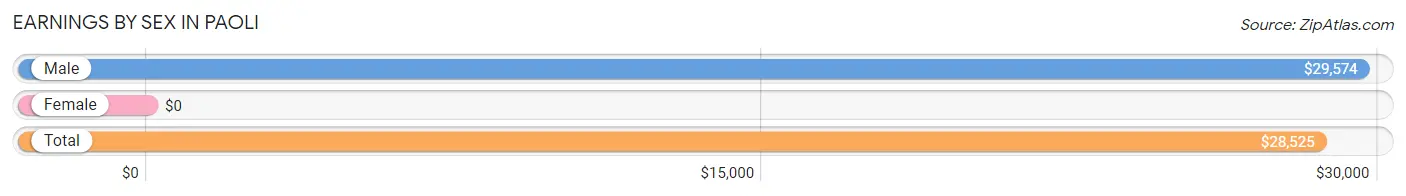
Earnings by Sex in Paoli
| Sex | Number | Average Earnings |
| Male | 740 (48.5%) | $29,574 |
| Female | 785 (51.5%) | $0 |
| Total | 1,525 (100.0%) | $28,525 |
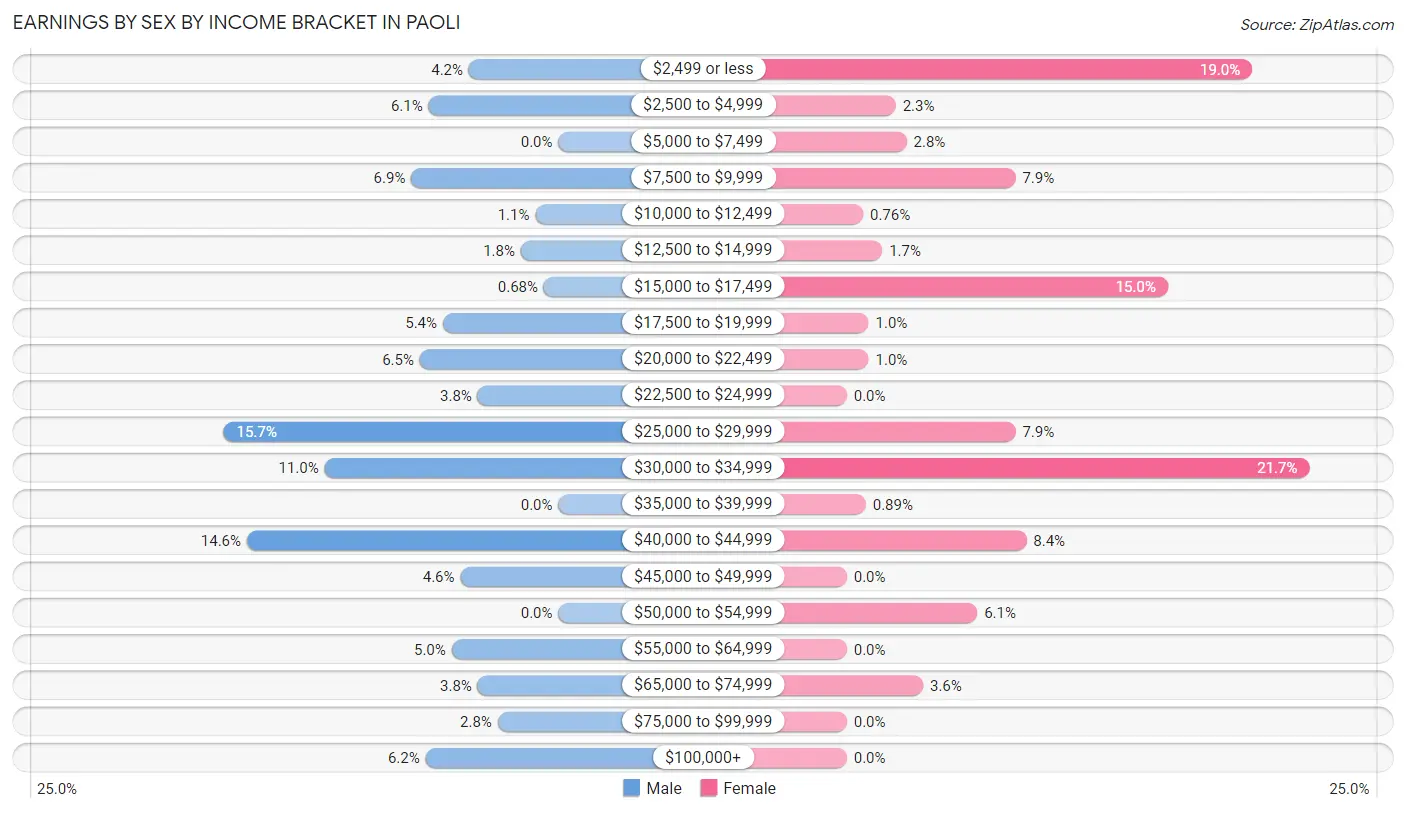
Earnings by Sex by Income Bracket in Paoli
The most common earnings brackets in Paoli are $25,000 to $29,999 for men (116 | 15.7%) and $30,000 to $34,999 for women (170 | 21.7%).
| Income | Male | Female |
| $2,499 or less | 31 (4.2%) | 149 (19.0%) |
| $2,500 to $4,999 | 45 (6.1%) | 18 (2.3%) |
| $5,000 to $7,499 | 0 (0.0%) | 22 (2.8%) |
| $7,500 to $9,999 | 51 (6.9%) | 62 (7.9%) |
| $10,000 to $12,499 | 8 (1.1%) | 6 (0.8%) |
| $12,500 to $14,999 | 13 (1.8%) | 13 (1.7%) |
| $15,000 to $17,499 | 5 (0.7%) | 118 (15.0%) |
| $17,500 to $19,999 | 40 (5.4%) | 8 (1.0%) |
| $20,000 to $22,499 | 48 (6.5%) | 8 (1.0%) |
| $22,500 to $24,999 | 28 (3.8%) | 0 (0.0%) |
| $25,000 to $29,999 | 116 (15.7%) | 62 (7.9%) |
| $30,000 to $34,999 | 81 (11.0%) | 170 (21.7%) |
| $35,000 to $39,999 | 0 (0.0%) | 7 (0.9%) |
| $40,000 to $44,999 | 108 (14.6%) | 66 (8.4%) |
| $45,000 to $49,999 | 34 (4.6%) | 0 (0.0%) |
| $50,000 to $54,999 | 0 (0.0%) | 48 (6.1%) |
| $55,000 to $64,999 | 37 (5.0%) | 0 (0.0%) |
| $65,000 to $74,999 | 28 (3.8%) | 28 (3.6%) |
| $75,000 to $99,999 | 21 (2.8%) | 0 (0.0%) |
| $100,000+ | 46 (6.2%) | 0 (0.0%) |
| Total | 740 (100.0%) | 785 (100.0%) |
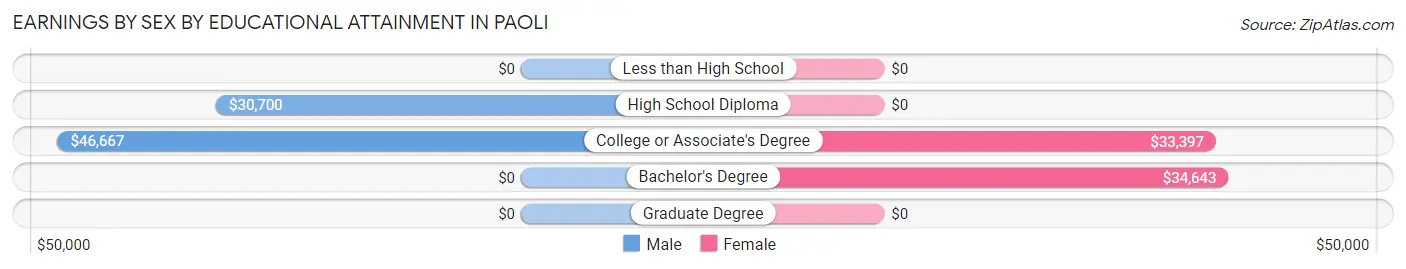
Earnings by Sex by Educational Attainment in Paoli
Average earnings in Paoli are $34,417 for men and $27,743 for women, a difference of 19.4%. Men with an educational attainment of college or associate's degree enjoy the highest average annual earnings of $46,667, while those with high school diploma education earn the least with $30,700. Women with an educational attainment of bachelor's degree earn the most with the average annual earnings of $34,643, while those with college or associate's degree education have the smallest earnings of $33,397.
| Educational Attainment | Male Income | Female Income |
| Less than High School | - | - |
| High School Diploma | $30,700 | $0 |
| College or Associate's Degree | $46,667 | $33,397 |
| Bachelor's Degree | - | - |
| Graduate Degree | - | - |
| Total | $34,417 | $27,743 |
Family Income in Paoli
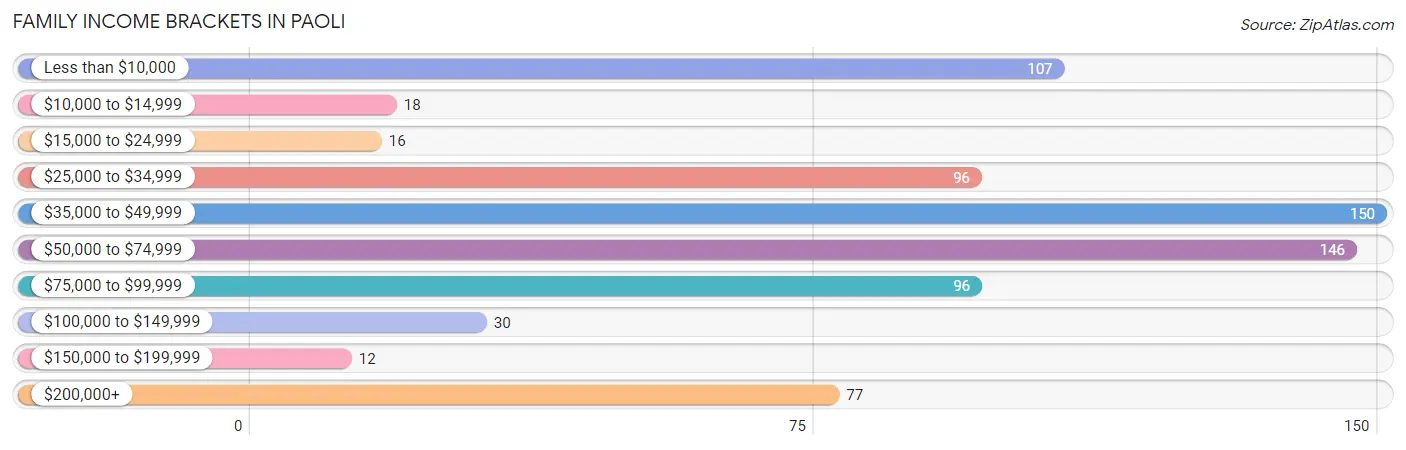
Family Income Brackets in Paoli
According to the Paoli family income data, there are 150 families falling into the $35,000 to $49,999 income range, which is the most common income bracket and makes up 20.1% of all families. Conversely, the $150,000 to $199,999 income bracket is the least frequent group with only 12 families (1.6%) belonging to this category.
| Income Bracket | # Families | % Families |
| Less than $10,000 | 107 | 14.3% |
| $10,000 to $14,999 | 18 | 2.4% |
| $15,000 to $24,999 | 16 | 2.1% |
| $25,000 to $34,999 | 96 | 12.8% |
| $35,000 to $49,999 | 150 | 20.1% |
| $50,000 to $74,999 | 146 | 19.5% |
| $75,000 to $99,999 | 96 | 12.8% |
| $100,000 to $149,999 | 30 | 4.0% |
| $150,000 to $199,999 | 12 | 1.6% |
| $200,000+ | 77 | 10.3% |
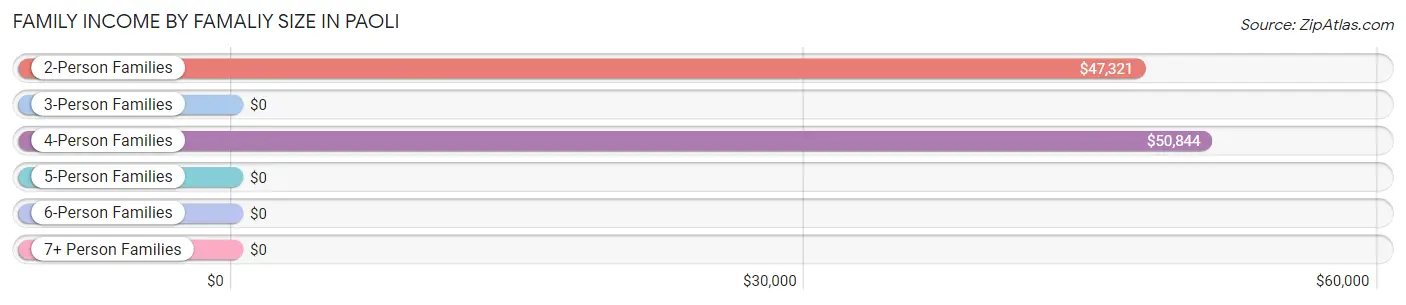
Family Income by Famaliy Size in Paoli
4-person families (153 | 20.4%) account for the highest median family income in Paoli with $50,844 per family, while 2-person families (463 | 61.9%) have the highest median income of $23,660 per family member.
| Income Bracket | # Families | Median Income |
| 2-Person Families | 463 (61.9%) | $47,321 |
| 3-Person Families | 65 (8.7%) | $0 |
| 4-Person Families | 153 (20.4%) | $50,844 |
| 5-Person Families | 39 (5.2%) | $0 |
| 6-Person Families | 19 (2.5%) | $0 |
| 7+ Person Families | 9 (1.2%) | $0 |
| Total | 748 (100.0%) | $47,200 |
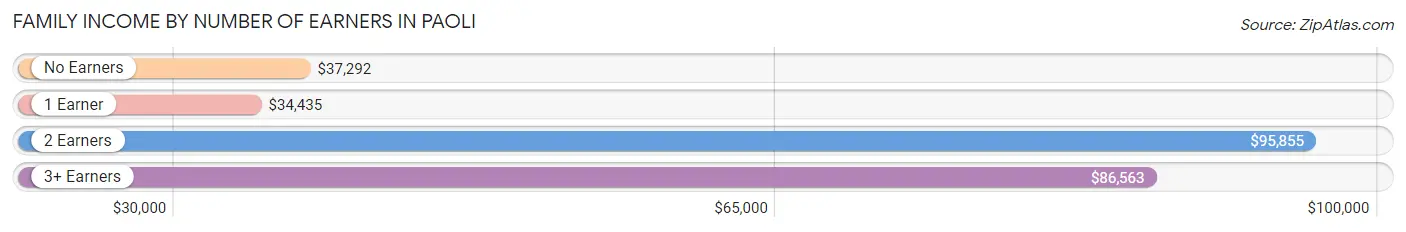
Family Income by Number of Earners in Paoli
The median family income in Paoli is $47,200, with families comprising 2 earners (237) having the highest median family income of $95,855, while families with 1 earner (334) have the lowest median family income of $34,435, accounting for 31.7% and 44.7% of families, respectively.
| Number of Earners | # Families | Median Income |
| No Earners | 129 (17.2%) | $37,292 |
| 1 Earner | 334 (44.7%) | $34,435 |
| 2 Earners | 237 (31.7%) | $95,855 |
| 3+ Earners | 48 (6.4%) | $86,563 |
| Total | 748 (100.0%) | $47,200 |
Household Income in Paoli
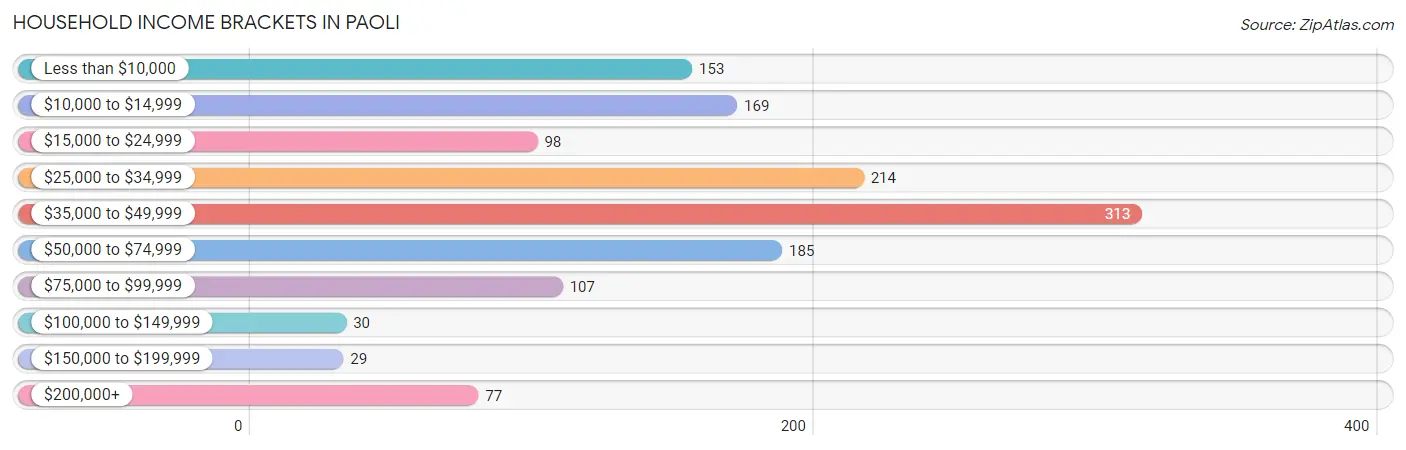
Household Income Brackets in Paoli
With 313 households falling in the category, the $35,000 to $49,999 income range is the most frequent in Paoli, accounting for 22.8% of all households. In contrast, only 29 households (2.1%) fall into the $150,000 to $199,999 income bracket, making it the least populous group.
| Income Bracket | # Households | % Households |
| Less than $10,000 | 153 | 11.1% |
| $10,000 to $14,999 | 169 | 12.3% |
| $15,000 to $24,999 | 98 | 7.1% |
| $25,000 to $34,999 | 214 | 15.6% |
| $35,000 to $49,999 | 313 | 22.8% |
| $50,000 to $74,999 | 185 | 13.5% |
| $75,000 to $99,999 | 107 | 7.8% |
| $100,000 to $149,999 | 30 | 2.2% |
| $150,000 to $199,999 | 29 | 2.1% |
| $200,000+ | 77 | 5.6% |
Household Income by Householder Age in Paoli
The median household income in Paoli is $36,858, with the highest median household income of $42,930 found in the 45 to 64 years age bracket for the primary householder. A total of 363 households (26.4%) fall into this category. Meanwhile, the 65+ years age bracket for the primary householder has the lowest median household income of $30,066, with 423 households (30.8%) in this group.
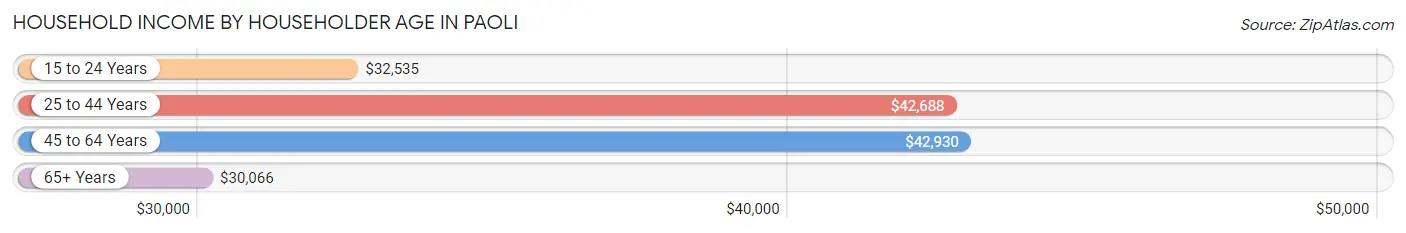
| Income Bracket | # Households | Median Income |
| 15 to 24 Years | 95 (6.9%) | $32,535 |
| 25 to 44 Years | 493 (35.9%) | $42,688 |
| 45 to 64 Years | 363 (26.4%) | $42,930 |
| 65+ Years | 423 (30.8%) | $30,066 |
| Total | 1,374 (100.0%) | $36,858 |
Poverty in Paoli
Income Below Poverty by Sex and Age in Paoli
With 15.3% poverty level for males and 32.7% for females among the residents of Paoli, 55 to 64 year old males and 5 year old females are the most vulnerable to poverty, with 54 males (38.0%) and 22 females (100.0%) in their respective age groups living below the poverty level.
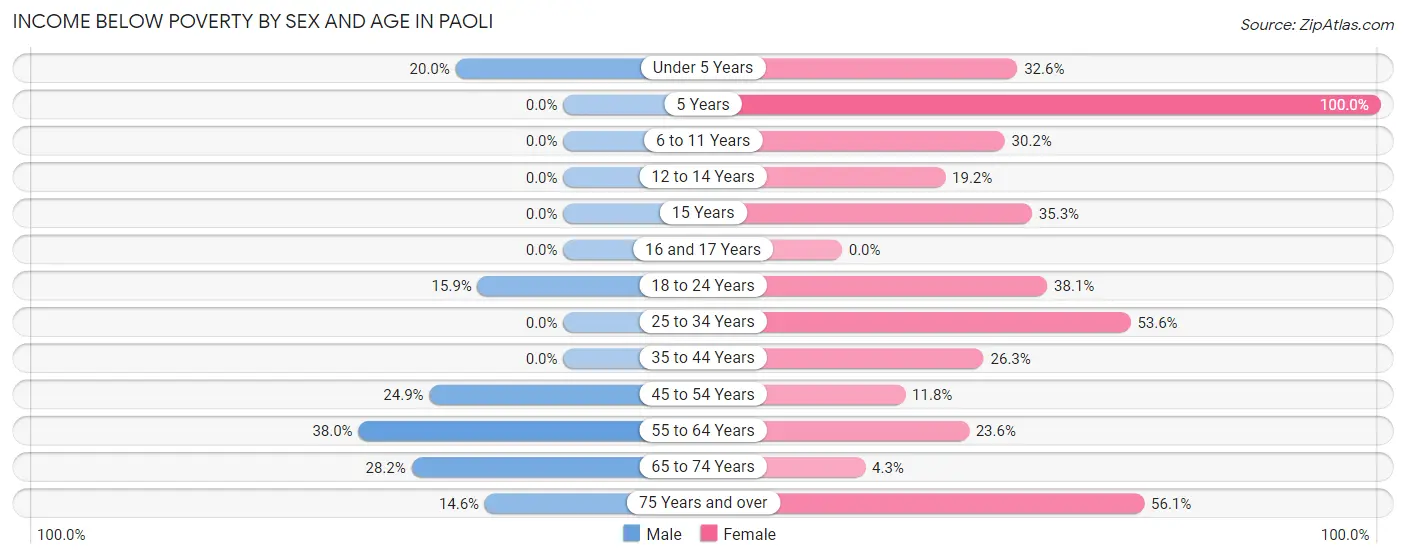
| Age Bracket | Male | Female |
| Under 5 Years | 26 (20.0%) | 14 (32.6%) |
| 5 Years | 0 (0.0%) | 22 (100.0%) |
| 6 to 11 Years | 0 (0.0%) | 55 (30.2%) |
| 12 to 14 Years | 0 (0.0%) | 14 (19.2%) |
| 15 Years | 0 (0.0%) | 12 (35.3%) |
| 16 and 17 Years | 0 (0.0%) | 0 (0.0%) |
| 18 to 24 Years | 28 (15.9%) | 61 (38.1%) |
| 25 to 34 Years | 0 (0.0%) | 142 (53.6%) |
| 35 to 44 Years | 0 (0.0%) | 50 (26.3%) |
| 45 to 54 Years | 45 (24.9%) | 10 (11.8%) |
| 55 to 64 Years | 54 (38.0%) | 45 (23.6%) |
| 65 to 74 Years | 51 (28.2%) | 9 (4.3%) |
| 75 Years and over | 8 (14.5%) | 124 (56.1%) |
| Total | 212 (15.3%) | 558 (32.7%) |
Income Above Poverty by Sex and Age in Paoli
According to the poverty statistics in Paoli, males aged 5 years and females aged 16 and 17 years are the age groups that are most secure financially, with 100.0% of males and 100.0% of females in these age groups living above the poverty line.
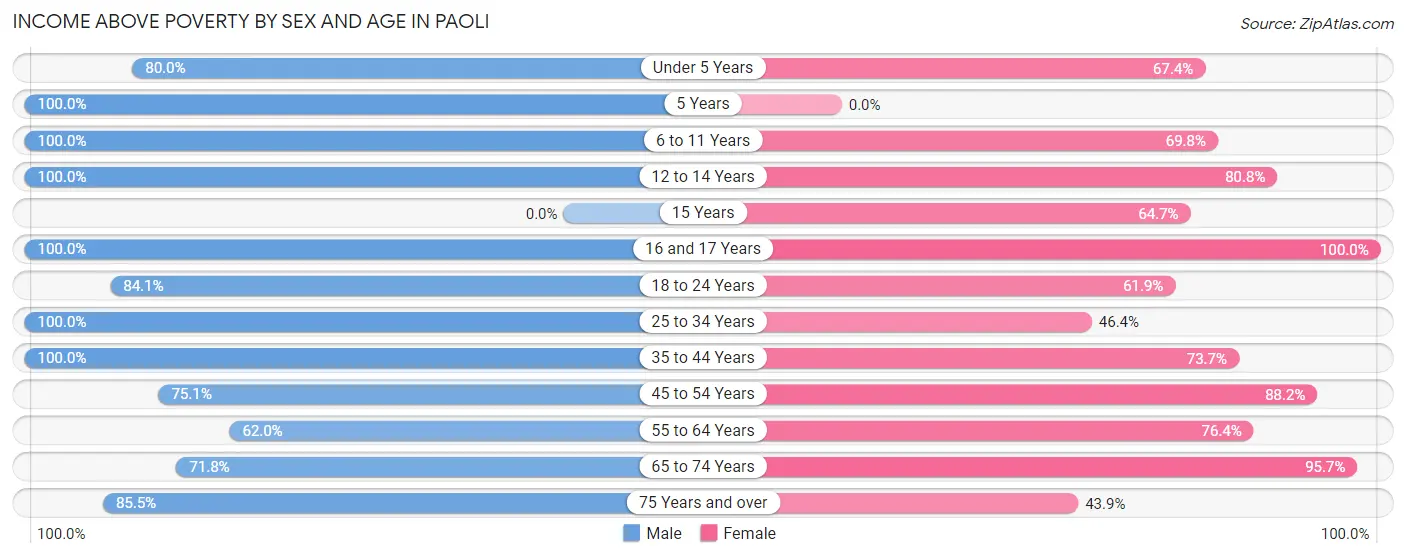
| Age Bracket | Male | Female |
| Under 5 Years | 104 (80.0%) | 29 (67.4%) |
| 5 Years | 109 (100.0%) | 0 (0.0%) |
| 6 to 11 Years | 131 (100.0%) | 127 (69.8%) |
| 12 to 14 Years | 7 (100.0%) | 59 (80.8%) |
| 15 Years | 0 (0.0%) | 22 (64.7%) |
| 16 and 17 Years | 15 (100.0%) | 35 (100.0%) |
| 18 to 24 Years | 148 (84.1%) | 99 (61.9%) |
| 25 to 34 Years | 176 (100.0%) | 123 (46.4%) |
| 35 to 44 Years | 79 (100.0%) | 140 (73.7%) |
| 45 to 54 Years | 136 (75.1%) | 75 (88.2%) |
| 55 to 64 Years | 88 (62.0%) | 146 (76.4%) |
| 65 to 74 Years | 130 (71.8%) | 199 (95.7%) |
| 75 Years and over | 47 (85.5%) | 97 (43.9%) |
| Total | 1,170 (84.7%) | 1,151 (67.3%) |
Income Below Poverty Among Married-Couple Families in Paoli
The poverty statistics for married-couple families in Paoli show that 4.6% or 18 of the total 394 families live below the poverty line. Families with no children have the highest poverty rate of 7.1%, comprising of 18 families. On the other hand, families with 1 or 2 children have the lowest poverty rate of 0.0%, which includes 0 families.
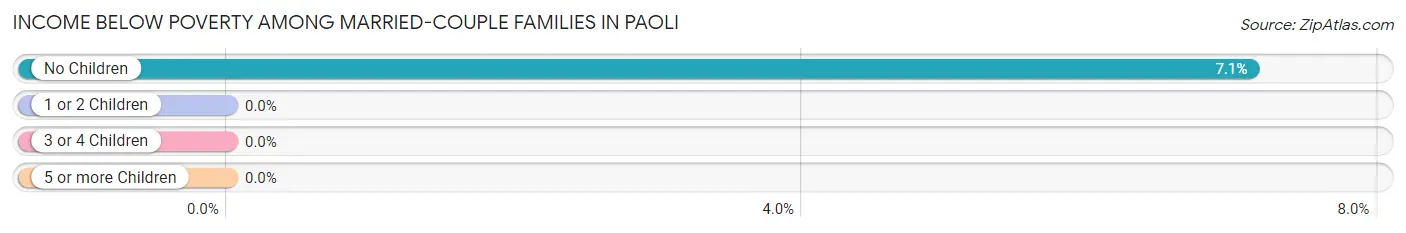
| Children | Above Poverty | Below Poverty |
| No Children | 235 (92.9%) | 18 (7.1%) |
| 1 or 2 Children | 99 (100.0%) | 0 (0.0%) |
| 3 or 4 Children | 42 (100.0%) | 0 (0.0%) |
| 5 or more Children | 0 (0.0%) | 0 (0.0%) |
| Total | 376 (95.4%) | 18 (4.6%) |
Income Below Poverty Among Single-Parent Households in Paoli
According to the poverty data in Paoli, 11.0% or 8 single-father households and 43.1% or 121 single-mother households are living below the poverty line. Among single-father households, those with no children have the highest poverty rate, with 8 households (100.0%) experiencing poverty. Likewise, among single-mother households, those with no children have the highest poverty rate, with 32 households (46.4%) falling below the poverty line.
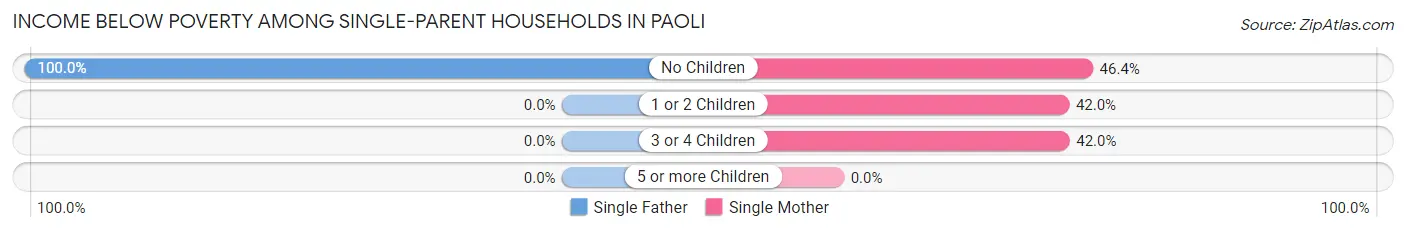
| Children | Single Father | Single Mother |
| No Children | 8 (100.0%) | 32 (46.4%) |
| 1 or 2 Children | 0 (0.0%) | 60 (42.0%) |
| 3 or 4 Children | 0 (0.0%) | 29 (42.0%) |
| 5 or more Children | 0 (0.0%) | 0 (0.0%) |
| Total | 8 (11.0%) | 121 (43.1%) |
Income Below Poverty Among Married-Couple vs Single-Parent Households in Paoli
The poverty data for Paoli shows that 18 of the married-couple family households (4.6%) and 129 of the single-parent households (36.4%) are living below the poverty level. Within the married-couple family households, those with no children have the highest poverty rate, with 18 households (7.1%) falling below the poverty line. Among the single-parent households, those with no children have the highest poverty rate, with 40 household (51.9%) living below poverty.
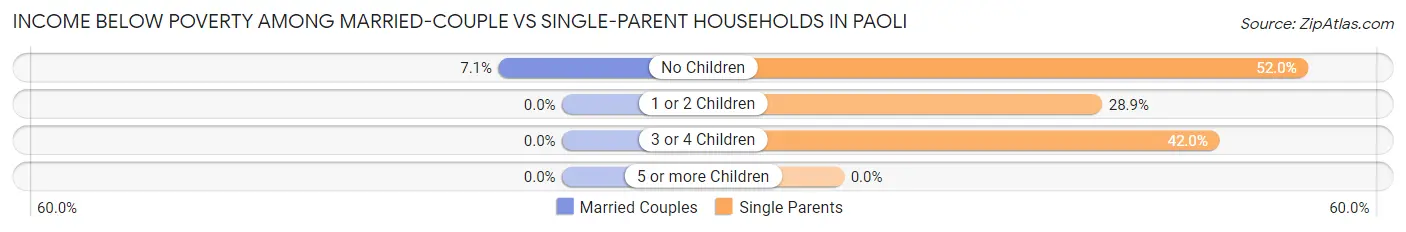
| Children | Married-Couple Families | Single-Parent Households |
| No Children | 18 (7.1%) | 40 (51.9%) |
| 1 or 2 Children | 0 (0.0%) | 60 (28.8%) |
| 3 or 4 Children | 0 (0.0%) | 29 (42.0%) |
| 5 or more Children | 0 (0.0%) | 0 (0.0%) |
| Total | 18 (4.6%) | 129 (36.4%) |
Race in Paoli
The most populous races in Paoli are White / Caucasian (2,906 | 88.4%), Two or more Races (369 | 11.2%), and Hispanic or Latino (131 | 4.0%).
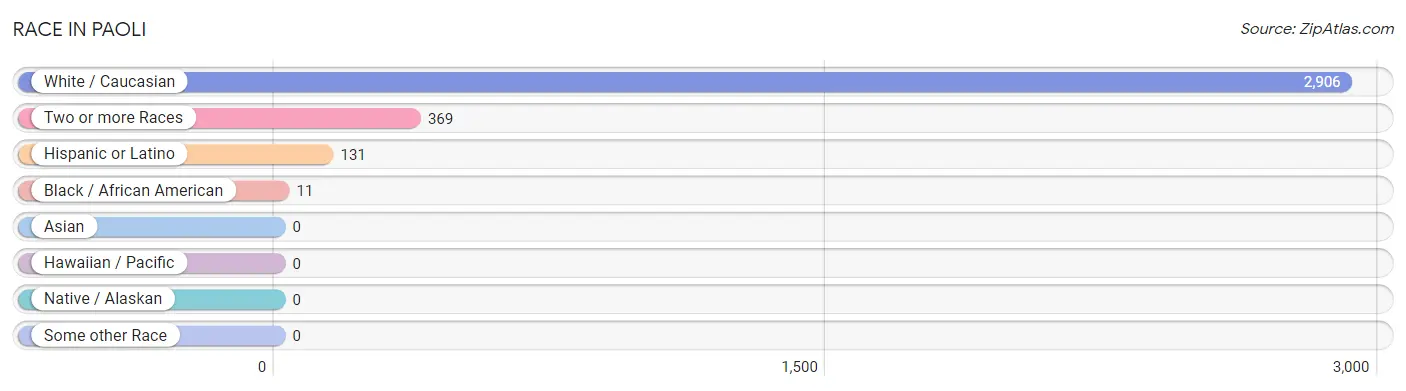
| Race | # Population | % Population |
| Asian | 0 | 0.0% |
| Black / African American | 11 | 0.3% |
| Hawaiian / Pacific | 0 | 0.0% |
| Hispanic or Latino | 131 | 4.0% |
| Native / Alaskan | 0 | 0.0% |
| White / Caucasian | 2,906 | 88.4% |
| Two or more Races | 369 | 11.2% |
| Some other Race | 0 | 0.0% |
| Total | 3,286 | 100.0% |
Ancestry in Paoli
The most populous ancestries reported in Paoli are German (511 | 15.5%), English (418 | 12.7%), American (411 | 12.5%), Irish (256 | 7.8%), and Scottish (124 | 3.8%), together accounting for 52.3% of all Paoli residents.
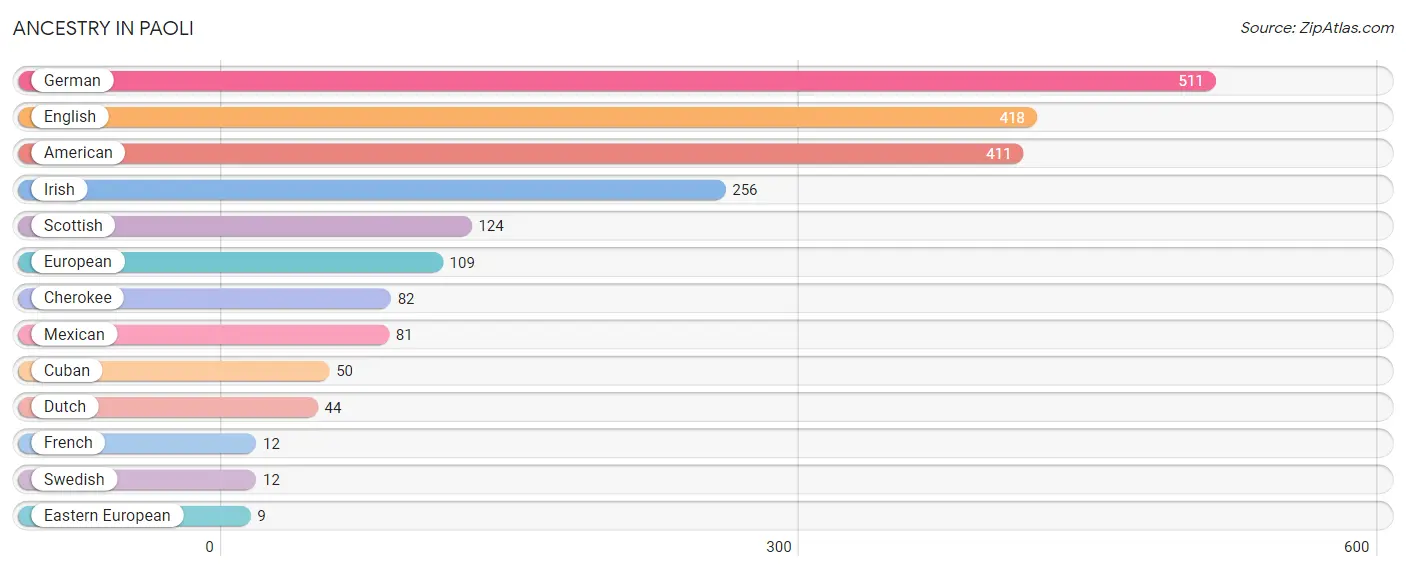
| Ancestry | # Population | % Population |
| American | 411 | 12.5% |
| Cherokee | 82 | 2.5% |
| Cuban | 50 | 1.5% |
| Dutch | 44 | 1.3% |
| Eastern European | 9 | 0.3% |
| English | 418 | 12.7% |
| European | 109 | 3.3% |
| French | 12 | 0.4% |
| German | 511 | 15.5% |
| Irish | 256 | 7.8% |
| Mexican | 81 | 2.5% |
| Scottish | 124 | 3.8% |
| Swedish | 12 | 0.4% | View All 13 Rows |
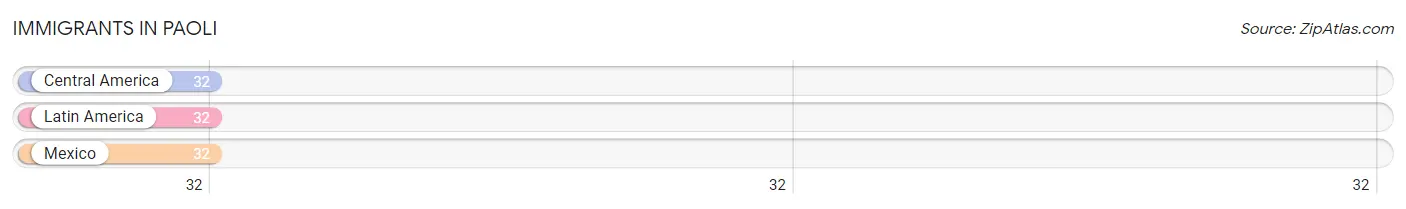
Immigrants in Paoli
The most numerous immigrant groups reported in Paoli came from Central America (32 | 1.0%), Latin America (32 | 1.0%), and Mexico (32 | 1.0%), together accounting for 2.9% of all Paoli residents.
| Immigration Origin | # Population | % Population |
| Central America | 32 | 1.0% |
| Latin America | 32 | 1.0% |
| Mexico | 32 | 1.0% | View All 3 Rows |
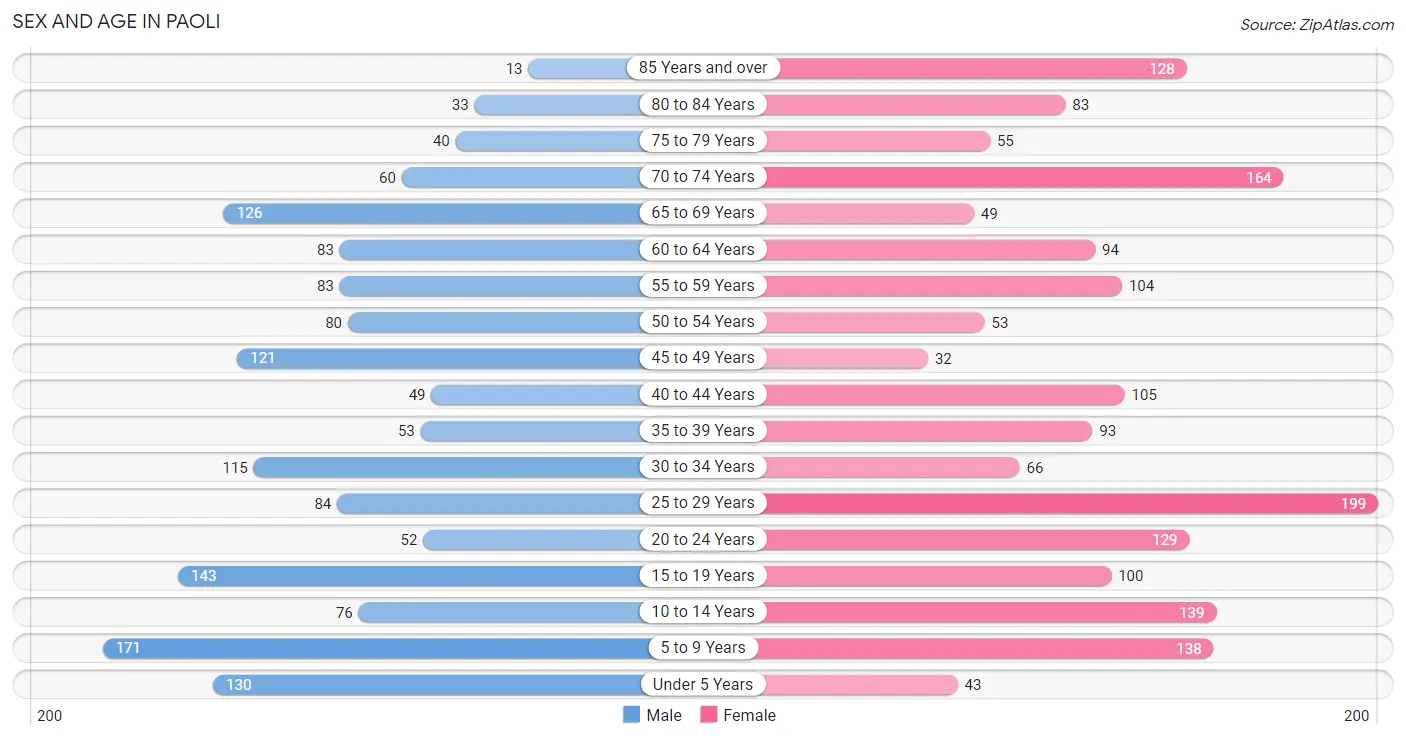
Sex and Age in Paoli
Sex and Age in Paoli
The most populous age groups in Paoli are 5 to 9 Years (171 | 11.3%) for men and 25 to 29 Years (199 | 11.2%) for women.
| Age Bracket | Male | Female |
| Under 5 Years | 130 (8.6%) | 43 (2.4%) |
| 5 to 9 Years | 171 (11.3%) | 138 (7.8%) |
| 10 to 14 Years | 76 (5.0%) | 139 (7.8%) |
| 15 to 19 Years | 143 (9.5%) | 100 (5.6%) |
| 20 to 24 Years | 52 (3.4%) | 129 (7.3%) |
| 25 to 29 Years | 84 (5.6%) | 199 (11.2%) |
| 30 to 34 Years | 115 (7.6%) | 66 (3.7%) |
| 35 to 39 Years | 53 (3.5%) | 93 (5.2%) |
| 40 to 44 Years | 49 (3.2%) | 105 (5.9%) |
| 45 to 49 Years | 121 (8.0%) | 32 (1.8%) |
| 50 to 54 Years | 80 (5.3%) | 53 (3.0%) |
| 55 to 59 Years | 83 (5.5%) | 104 (5.9%) |
| 60 to 64 Years | 83 (5.5%) | 94 (5.3%) |
| 65 to 69 Years | 126 (8.3%) | 49 (2.8%) |
| 70 to 74 Years | 60 (4.0%) | 164 (9.2%) |
| 75 to 79 Years | 40 (2.6%) | 55 (3.1%) |
| 80 to 84 Years | 33 (2.2%) | 83 (4.7%) |
| 85 Years and over | 13 (0.9%) | 128 (7.2%) |
| Total | 1,512 (100.0%) | 1,774 (100.0%) |
Families and Households in Paoli
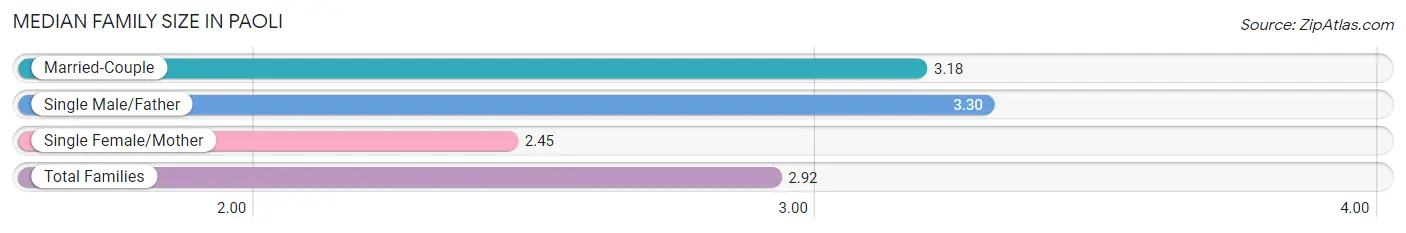
Median Family Size in Paoli
The median family size in Paoli is 2.92 persons per family, with single male/father families (73 | 9.8%) accounting for the largest median family size of 3.3 persons per family. On the other hand, single female/mother families (281 | 37.6%) represent the smallest median family size with 2.45 persons per family.
| Family Type | # Families | Family Size |
| Married-Couple | 394 (52.7%) | 3.18 |
| Single Male/Father | 73 (9.8%) | 3.30 |
| Single Female/Mother | 281 (37.6%) | 2.45 |
| Total Families | 748 (100.0%) | 2.92 |
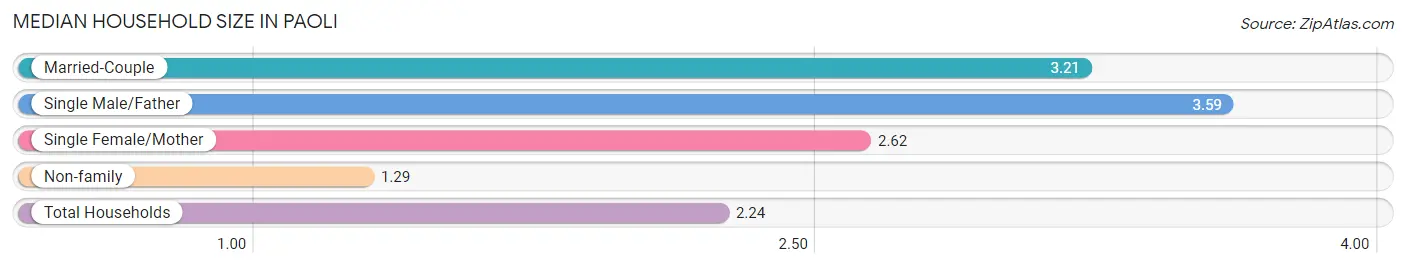
Median Household Size in Paoli
The median household size in Paoli is 2.24 persons per household, with single male/father households (73 | 5.3%) accounting for the largest median household size of 3.59 persons per household. non-family households (626 | 45.6%) represent the smallest median household size with 1.29 persons per household.
| Household Type | # Households | Household Size |
| Married-Couple | 394 (28.7%) | 3.21 |
| Single Male/Father | 73 (5.3%) | 3.59 |
| Single Female/Mother | 281 (20.4%) | 2.62 |
| Non-family | 626 (45.6%) | 1.29 |
| Total Households | 1,374 (100.0%) | 2.24 |
Household Size by Marriage Status in Paoli
Out of a total of 1,374 households in Paoli, 748 (54.4%) are family households, while 626 (45.6%) are nonfamily households. The most numerous type of family households are 2-person households, comprising 424, and the most common type of nonfamily households are 1-person households, comprising 484.
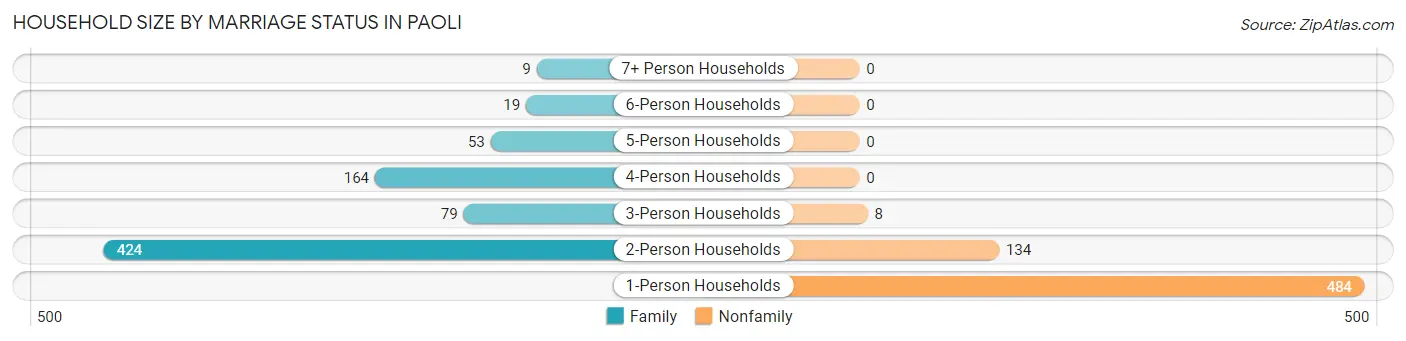
| Household Size | Family Households | Nonfamily Households |
| 1-Person Households | - | 484 (35.2%) |
| 2-Person Households | 424 (30.9%) | 134 (9.8%) |
| 3-Person Households | 79 (5.8%) | 8 (0.6%) |
| 4-Person Households | 164 (11.9%) | 0 (0.0%) |
| 5-Person Households | 53 (3.9%) | 0 (0.0%) |
| 6-Person Households | 19 (1.4%) | 0 (0.0%) |
| 7+ Person Households | 9 (0.7%) | 0 (0.0%) |
| Total | 748 (54.4%) | 626 (45.6%) |
Female Fertility in Paoli
Fertility by Age in Paoli
Average fertility rate in Paoli is 55.0 births per 1,000 women. Women in the age bracket of 20 to 34 years have the highest fertility rate with 102.0 births per 1,000 women. Women in the age bracket of 20 to 34 years acount for 100.0% of all women with births.
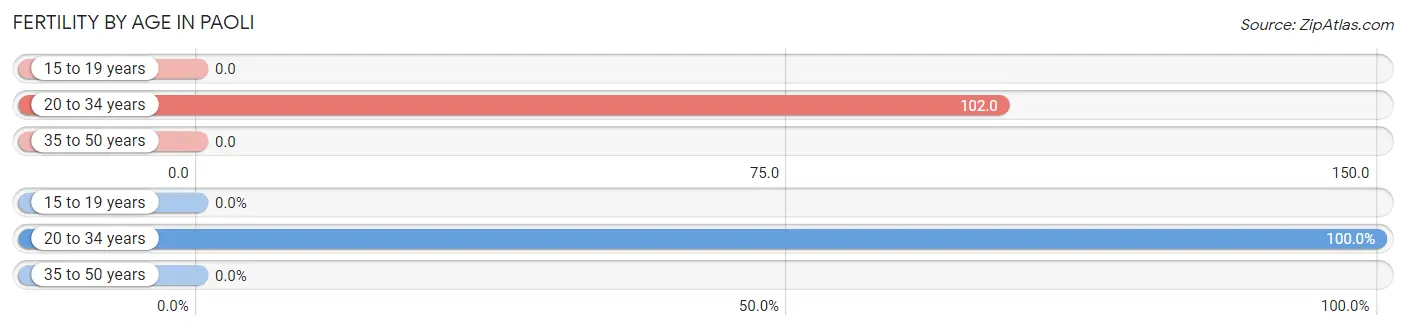
| Age Bracket | Women with Births | Births / 1,000 Women |
| 15 to 19 years | 0 (0.0%) | 0.0 |
| 20 to 34 years | 40 (100.0%) | 102.0 |
| 35 to 50 years | 0 (0.0%) | 0.0 |
| Total | 40 (100.0%) | 55.0 |
Fertility by Age by Marriage Status in Paoli
65.0% of women with births (40) in Paoli are married. The highest percentage of unmarried women with births falls into 20 to 34 years age bracket with 35.0% of them unmarried at the time of birth, while the lowest percentage of unmarried women with births belong to 20 to 34 years age bracket with 35.0% of them unmarried.
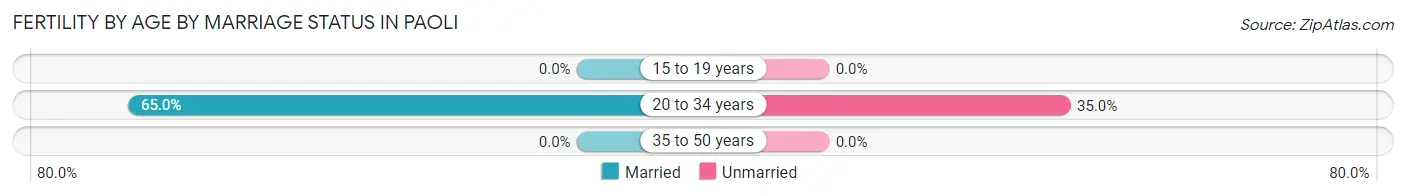
| Age Bracket | Married | Unmarried |
| 15 to 19 years | 0 (0.0%) | 0 (0.0%) |
| 20 to 34 years | 26 (65.0%) | 14 (35.0%) |
| 35 to 50 years | 0 (0.0%) | 0 (0.0%) |
| Total | 26 (65.0%) | 14 (35.0%) |
Fertility by Education in Paoli
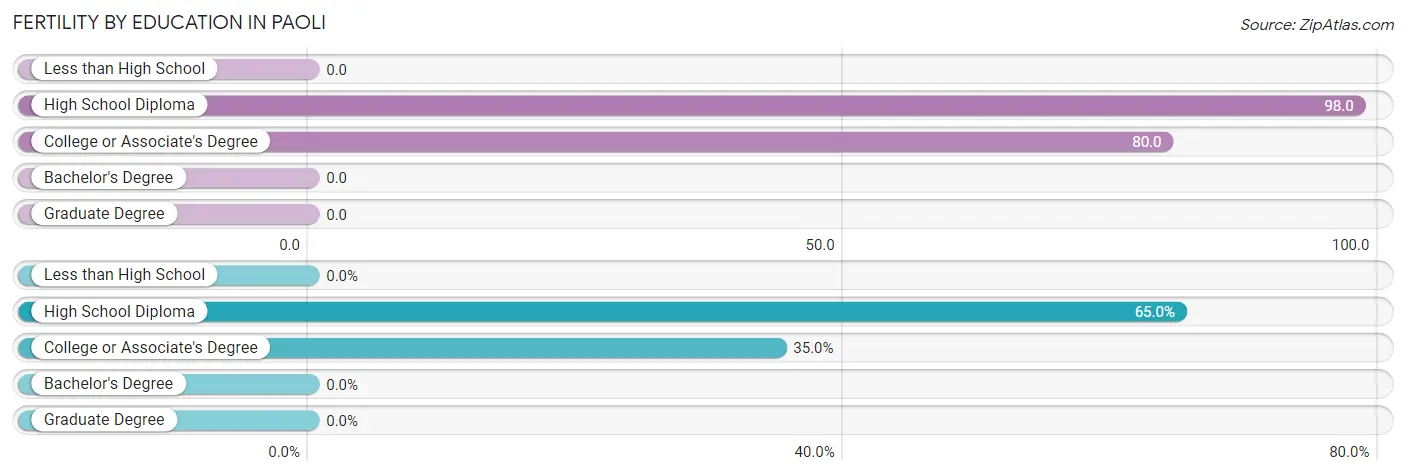
| Educational Attainment | Women with Births | Births / 1,000 Women |
| Less than High School | 0 (0.0%) | 0.0 |
| High School Diploma | 26 (65.0%) | 98.0 |
| College or Associate's Degree | 14 (35.0%) | 80.0 |
| Bachelor's Degree | 0 (0.0%) | 0.0 |
| Graduate Degree | 0 (0.0%) | 0.0 |
| Total | 40 (100.0%) | 55.0 |
Fertility by Education by Marriage Status in Paoli
35.0% of women with births in Paoli are unmarried. Women with the educational attainment of high school diploma are most likely to be married with 100.0% of them married at childbirth, while women with the educational attainment of college or associate's degree are least likely to be married with 100.0% of them unmarried at childbirth.
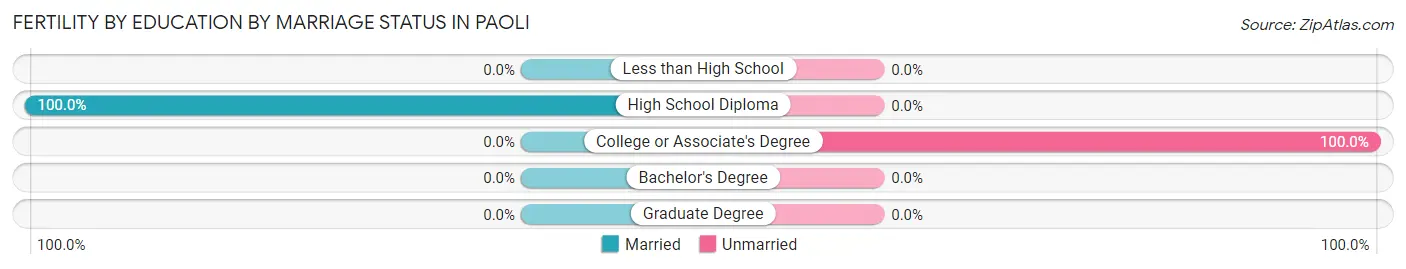
| Educational Attainment | Married | Unmarried |
| Less than High School | 0 (0.0%) | 0 (0.0%) |
| High School Diploma | 26 (100.0%) | 0 (0.0%) |
| College or Associate's Degree | 0 (0.0%) | 14 (100.0%) |
| Bachelor's Degree | 0 (0.0%) | 0 (0.0%) |
| Graduate Degree | 0 (0.0%) | 0 (0.0%) |
| Total | 26 (65.0%) | 14 (35.0%) |
Employment Characteristics in Paoli
Employment by Class of Employer in Paoli
Among the 1,307 employed individuals in Paoli, private company employees (890 | 68.1%), self-employed (not incorporated) (105 | 8.0%), and self-employed (incorporated) (98 | 7.5%) make up the most common classes of employment.
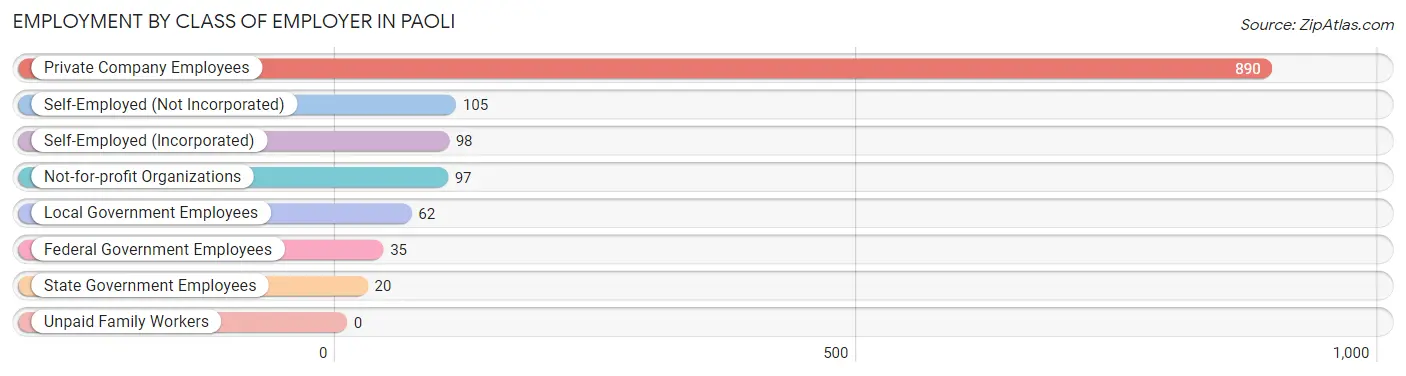
| Employer Class | # Employees | % Employees |
| Private Company Employees | 890 | 68.1% |
| Self-Employed (Incorporated) | 98 | 7.5% |
| Self-Employed (Not Incorporated) | 105 | 8.0% |
| Not-for-profit Organizations | 97 | 7.4% |
| Local Government Employees | 62 | 4.7% |
| State Government Employees | 20 | 1.5% |
| Federal Government Employees | 35 | 2.7% |
| Unpaid Family Workers | 0 | 0.0% |
| Total | 1,307 | 100.0% |
Employment Status by Age in Paoli
According to the labor force statistics for Paoli, out of the total population over 16 years of age (2,555), 53.9% or 1,377 individuals are in the labor force, with 4.1% or 56 of them unemployed. The age group with the highest labor force participation rate is 30 to 34 years, with 89.5% or 162 individuals in the labor force. Within the labor force, the 30 to 34 years age range has the highest percentage of unemployed individuals, with 18.5% or 30 of them being unemployed.
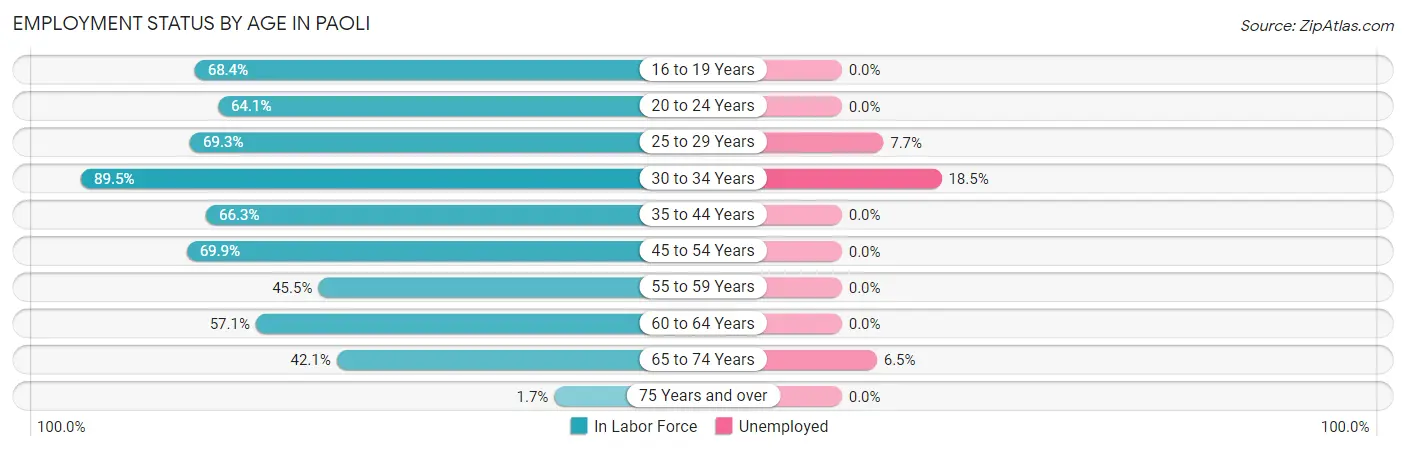
| Age Bracket | In Labor Force | Unemployed |
| 16 to 19 Years | 143 (68.4%) | 0 (0.0%) |
| 20 to 24 Years | 116 (64.1%) | 0 (0.0%) |
| 25 to 29 Years | 196 (69.3%) | 15 (7.7%) |
| 30 to 34 Years | 162 (89.5%) | 30 (18.5%) |
| 35 to 44 Years | 199 (66.3%) | 0 (0.0%) |
| 45 to 54 Years | 200 (69.9%) | 0 (0.0%) |
| 55 to 59 Years | 85 (45.5%) | 0 (0.0%) |
| 60 to 64 Years | 101 (57.1%) | 0 (0.0%) |
| 65 to 74 Years | 168 (42.1%) | 11 (6.5%) |
| 75 Years and over | 6 (1.7%) | 0 (0.0%) |
| Total | 1,377 (53.9%) | 56 (4.1%) |
Employment Status by Educational Attainment in Paoli
According to labor force statistics for Paoli, 66.7% of individuals (943) out of the total population between 25 and 64 years of age (1,414) are in the labor force, with 4.8% or 45 of them being unemployed. The group with the highest labor force participation rate are those with the educational attainment of bachelor's degree or higher, with 89.3% or 109 individuals in the labor force. Within the labor force, individuals with bachelor's degree or higher education have the highest percentage of unemployment, with 27.5% or 30 of them being unemployed.
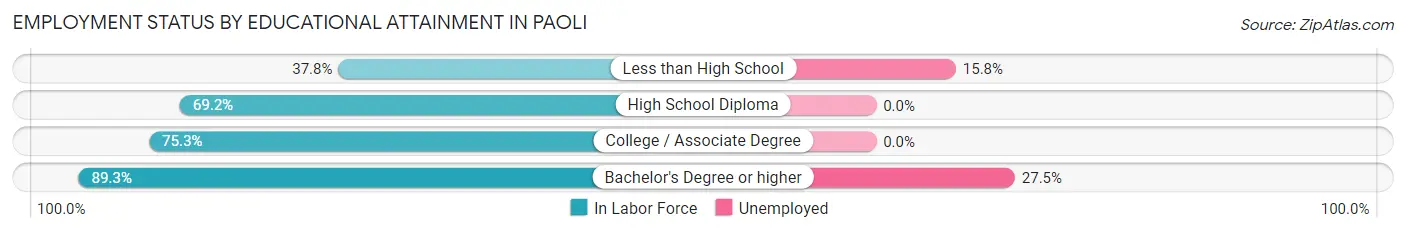
| Educational Attainment | In Labor Force | Unemployed |
| Less than High School | 95 (37.8%) | 40 (15.8%) |
| High School Diploma | 507 (69.2%) | 0 (0.0%) |
| College / Associate Degree | 232 (75.3%) | 0 (0.0%) |
| Bachelor's Degree or higher | 109 (89.3%) | 34 (27.5%) |
| Total | 943 (66.7%) | 68 (4.8%) |
Employment Occupations by Sex in Paoli
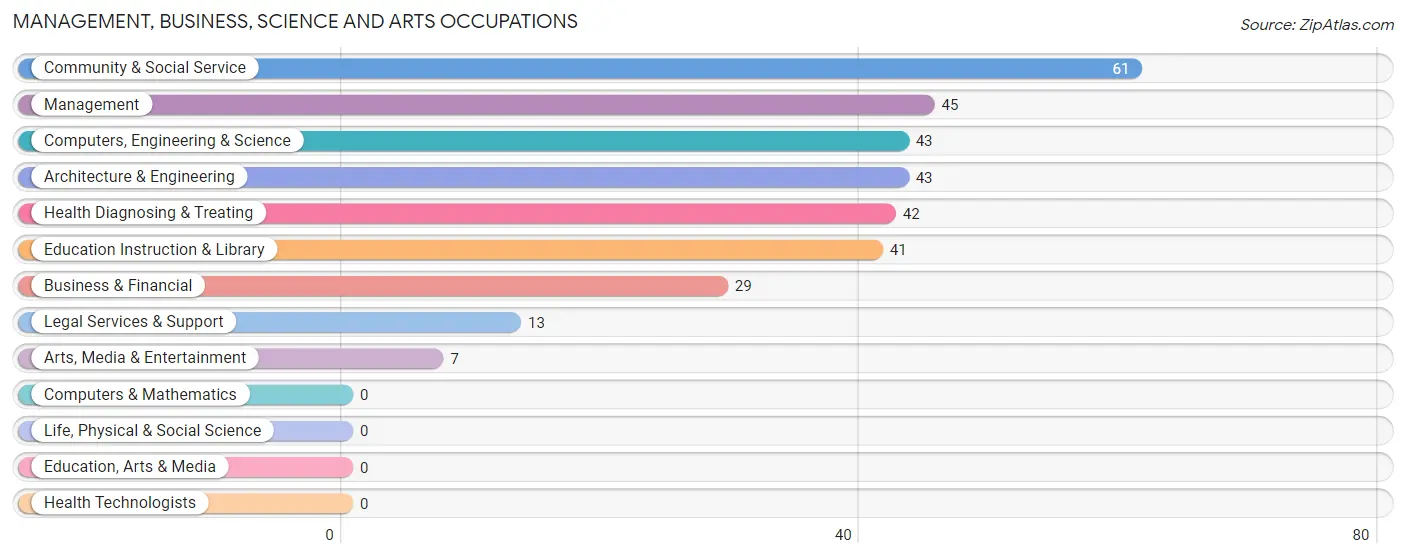
Management, Business, Science and Arts Occupations
The most common Management, Business, Science and Arts occupations in Paoli are Community & Social Service (61 | 4.6%), Management (45 | 3.4%), Computers, Engineering & Science (43 | 3.3%), Architecture & Engineering (43 | 3.3%), and Health Diagnosing & Treating (42 | 3.2%).
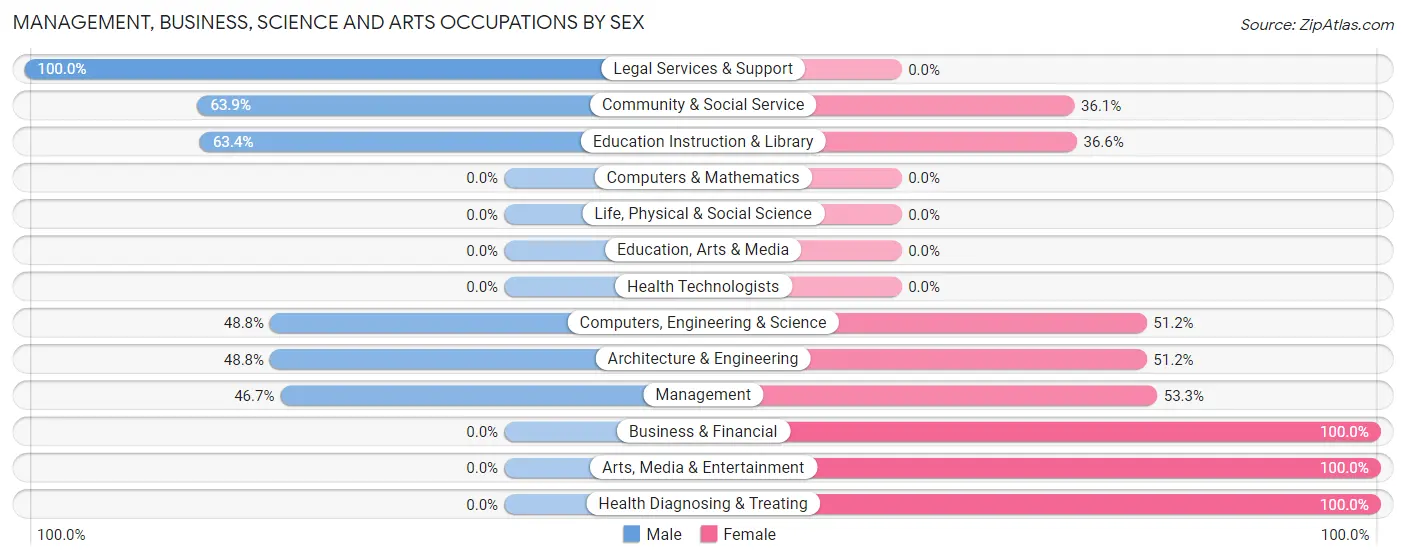
Management, Business, Science and Arts Occupations by Sex
Within the Management, Business, Science and Arts occupations in Paoli, the most male-oriented occupations are Legal Services & Support (100.0%), Community & Social Service (63.9%), and Education Instruction & Library (63.4%), while the most female-oriented occupations are Business & Financial (100.0%), Arts, Media & Entertainment (100.0%), and Health Diagnosing & Treating (100.0%).
| Occupation | Male | Female |
| Management | 21 (46.7%) | 24 (53.3%) |
| Business & Financial | 0 (0.0%) | 29 (100.0%) |
| Computers, Engineering & Science | 21 (48.8%) | 22 (51.2%) |
| Computers & Mathematics | 0 (0.0%) | 0 (0.0%) |
| Architecture & Engineering | 21 (48.8%) | 22 (51.2%) |
| Life, Physical & Social Science | 0 (0.0%) | 0 (0.0%) |
| Community & Social Service | 39 (63.9%) | 22 (36.1%) |
| Education, Arts & Media | 0 (0.0%) | 0 (0.0%) |
| Legal Services & Support | 13 (100.0%) | 0 (0.0%) |
| Education Instruction & Library | 26 (63.4%) | 15 (36.6%) |
| Arts, Media & Entertainment | 0 (0.0%) | 7 (100.0%) |
| Health Diagnosing & Treating | 0 (0.0%) | 42 (100.0%) |
| Health Technologists | 0 (0.0%) | 0 (0.0%) |
| Total (Category) | 81 (36.8%) | 139 (63.2%) |
| Total (Overall) | 640 (48.5%) | 680 (51.5%) |
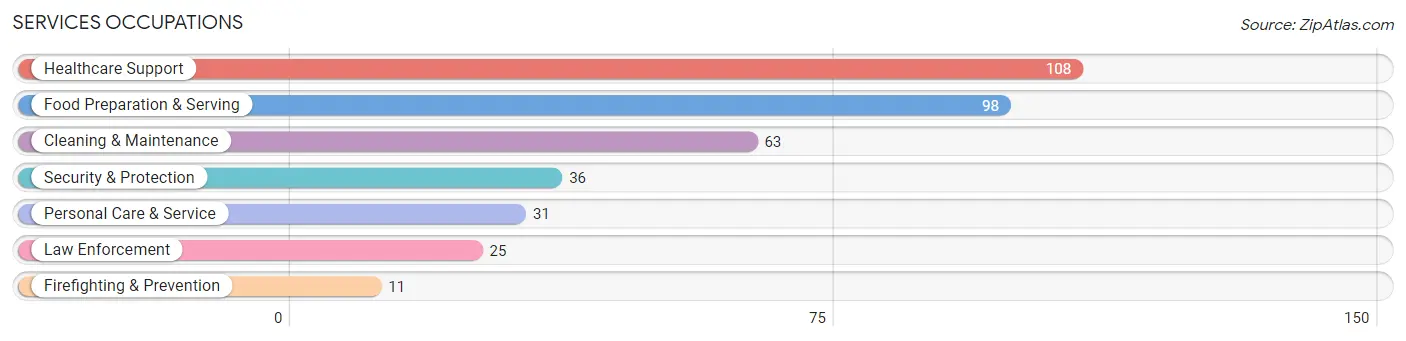
Services Occupations
The most common Services occupations in Paoli are Healthcare Support (108 | 8.2%), Food Preparation & Serving (98 | 7.4%), Cleaning & Maintenance (63 | 4.8%), Security & Protection (36 | 2.7%), and Personal Care & Service (31 | 2.4%).
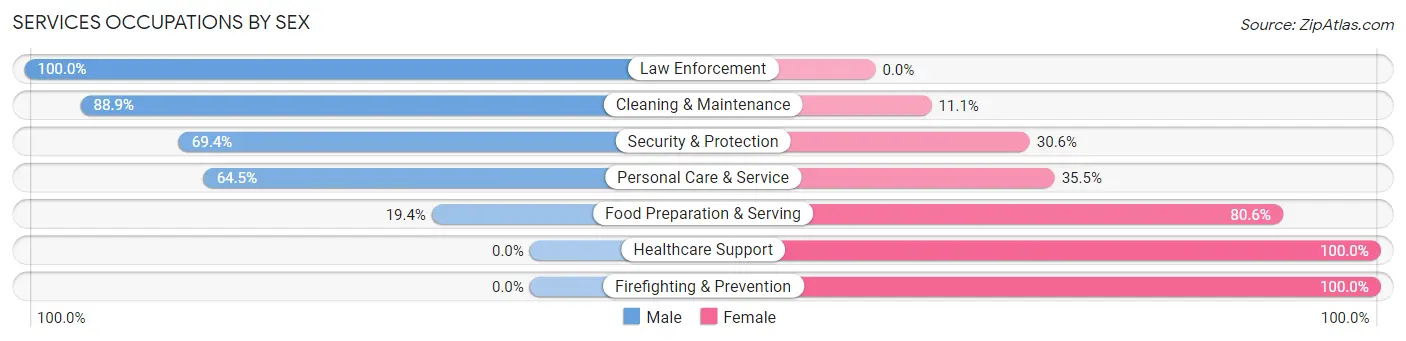
Services Occupations by Sex
Within the Services occupations in Paoli, the most male-oriented occupations are Law Enforcement (100.0%), Cleaning & Maintenance (88.9%), and Security & Protection (69.4%), while the most female-oriented occupations are Healthcare Support (100.0%), Firefighting & Prevention (100.0%), and Food Preparation & Serving (80.6%).
| Occupation | Male | Female |
| Healthcare Support | 0 (0.0%) | 108 (100.0%) |
| Security & Protection | 25 (69.4%) | 11 (30.6%) |
| Firefighting & Prevention | 0 (0.0%) | 11 (100.0%) |
| Law Enforcement | 25 (100.0%) | 0 (0.0%) |
| Food Preparation & Serving | 19 (19.4%) | 79 (80.6%) |
| Cleaning & Maintenance | 56 (88.9%) | 7 (11.1%) |
| Personal Care & Service | 20 (64.5%) | 11 (35.5%) |
| Total (Category) | 120 (35.7%) | 216 (64.3%) |
| Total (Overall) | 640 (48.5%) | 680 (51.5%) |
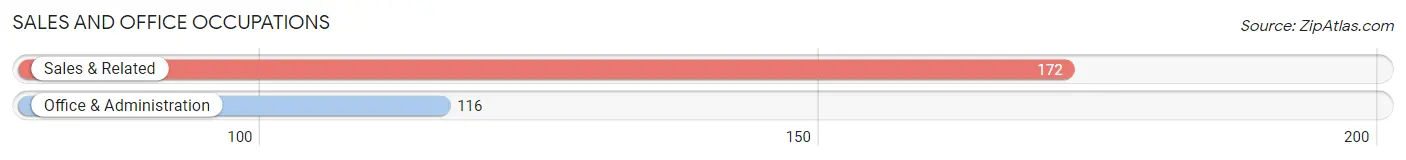
Sales and Office Occupations
The most common Sales and Office occupations in Paoli are Sales & Related (172 | 13.0%), and Office & Administration (116 | 8.8%).
Sales and Office Occupations by Sex
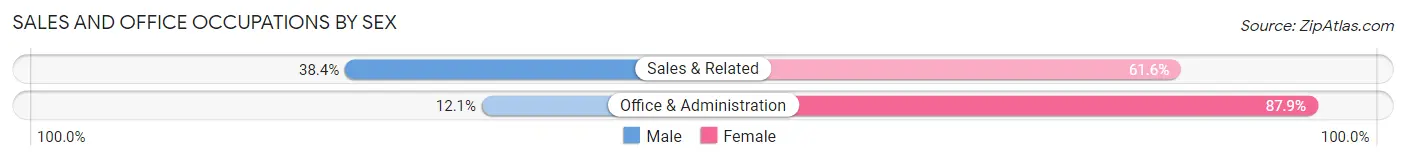
| Occupation | Male | Female |
| Sales & Related | 66 (38.4%) | 106 (61.6%) |
| Office & Administration | 14 (12.1%) | 102 (87.9%) |
| Total (Category) | 80 (27.8%) | 208 (72.2%) |
| Total (Overall) | 640 (48.5%) | 680 (51.5%) |
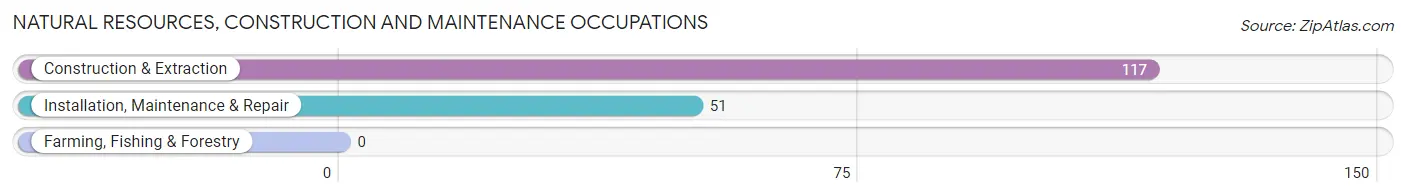
Natural Resources, Construction and Maintenance Occupations
The most common Natural Resources, Construction and Maintenance occupations in Paoli are Construction & Extraction (117 | 8.9%), and Installation, Maintenance & Repair (51 | 3.9%).
Natural Resources, Construction and Maintenance Occupations by Sex
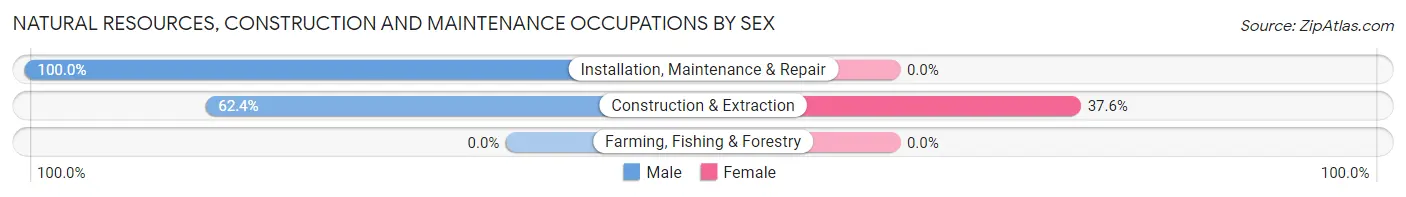
| Occupation | Male | Female |
| Farming, Fishing & Forestry | 0 (0.0%) | 0 (0.0%) |
| Construction & Extraction | 73 (62.4%) | 44 (37.6%) |
| Installation, Maintenance & Repair | 51 (100.0%) | 0 (0.0%) |
| Total (Category) | 124 (73.8%) | 44 (26.2%) |
| Total (Overall) | 640 (48.5%) | 680 (51.5%) |
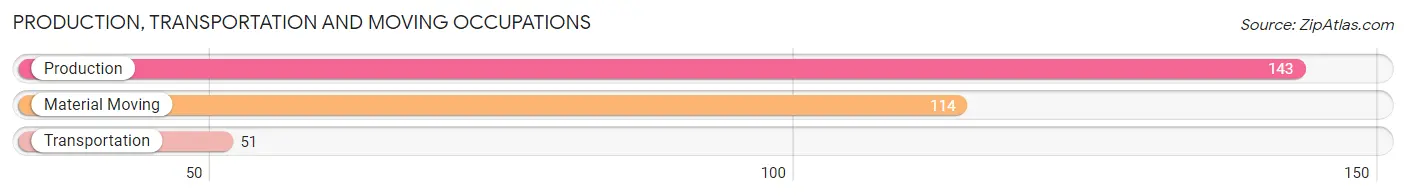
Production, Transportation and Moving Occupations
The most common Production, Transportation and Moving occupations in Paoli are Production (143 | 10.8%), Material Moving (114 | 8.6%), and Transportation (51 | 3.9%).
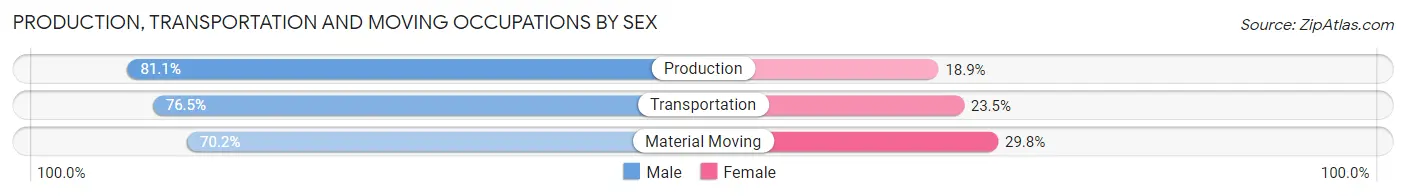
Production, Transportation and Moving Occupations by Sex
| Occupation | Male | Female |
| Production | 116 (81.1%) | 27 (18.9%) |
| Transportation | 39 (76.5%) | 12 (23.5%) |
| Material Moving | 80 (70.2%) | 34 (29.8%) |
| Total (Category) | 235 (76.3%) | 73 (23.7%) |
| Total (Overall) | 640 (48.5%) | 680 (51.5%) |
Employment Industries by Sex in Paoli
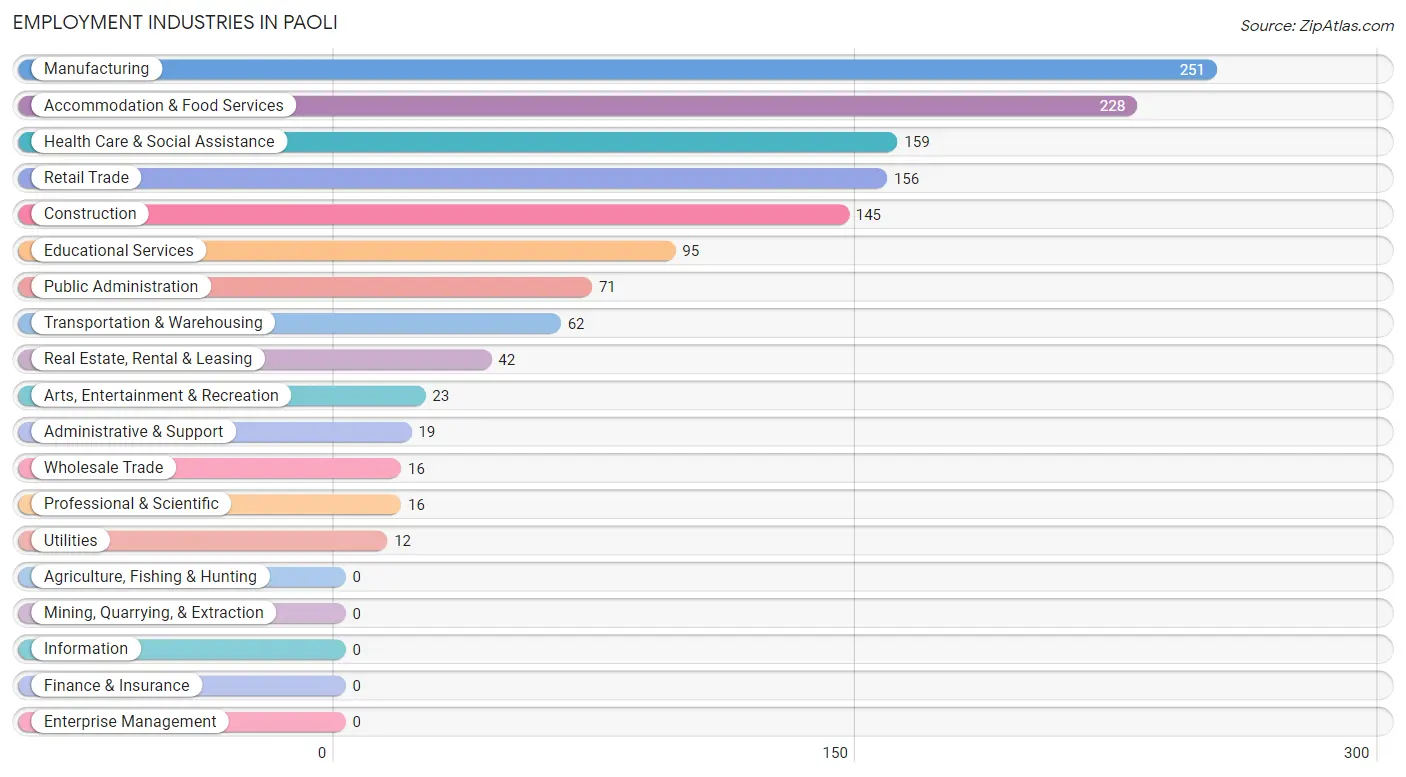
Employment Industries in Paoli
The major employment industries in Paoli include Manufacturing (251 | 19.0%), Accommodation & Food Services (228 | 17.3%), Health Care & Social Assistance (159 | 12.0%), Retail Trade (156 | 11.8%), and Construction (145 | 11.0%).
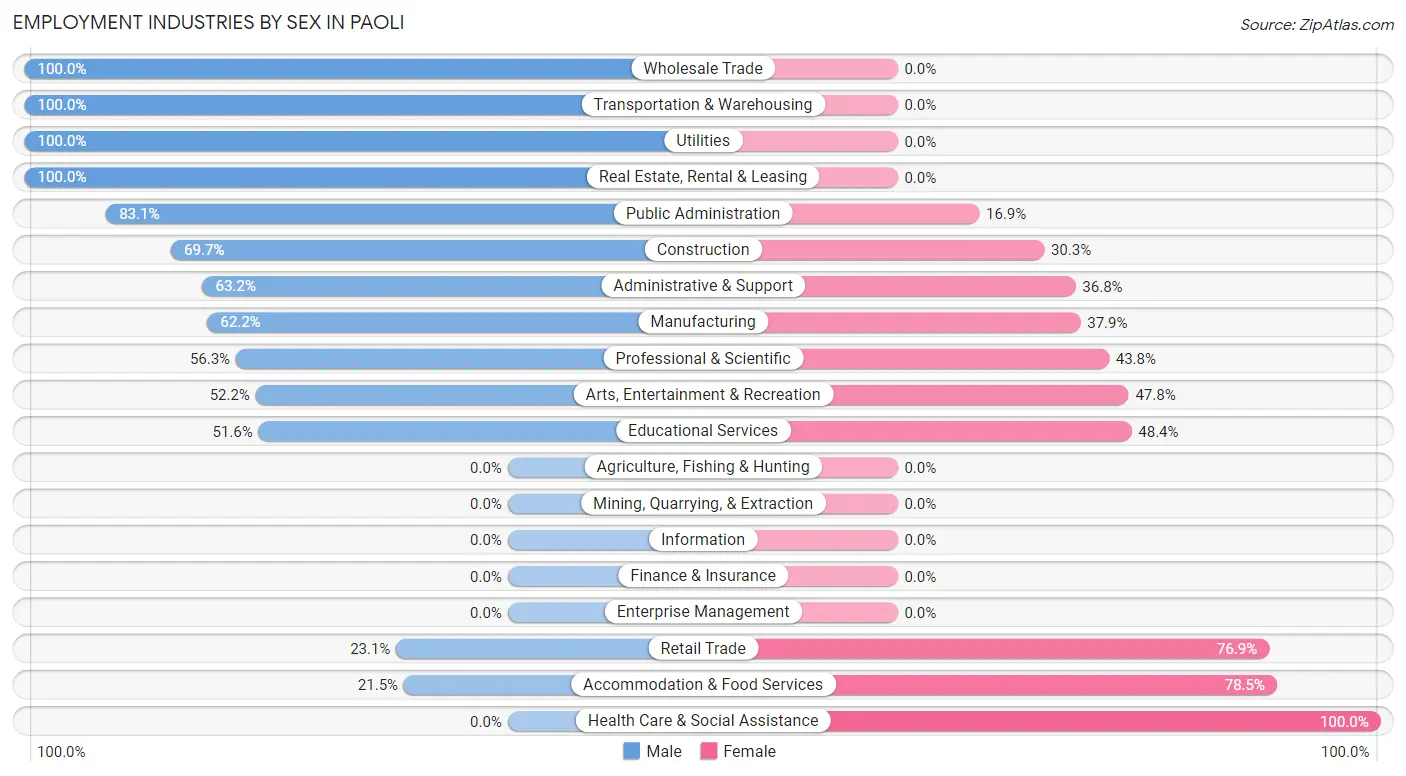
Employment Industries by Sex in Paoli
The Paoli industries that see more men than women are Wholesale Trade (100.0%), Transportation & Warehousing (100.0%), and Utilities (100.0%), whereas the industries that tend to have a higher number of women are Health Care & Social Assistance (100.0%), Accommodation & Food Services (78.5%), and Retail Trade (76.9%).
| Industry | Male | Female |
| Agriculture, Fishing & Hunting | 0 (0.0%) | 0 (0.0%) |
| Mining, Quarrying, & Extraction | 0 (0.0%) | 0 (0.0%) |
| Construction | 101 (69.7%) | 44 (30.3%) |
| Manufacturing | 156 (62.2%) | 95 (37.9%) |
| Wholesale Trade | 16 (100.0%) | 0 (0.0%) |
| Retail Trade | 36 (23.1%) | 120 (76.9%) |
| Transportation & Warehousing | 62 (100.0%) | 0 (0.0%) |
| Utilities | 12 (100.0%) | 0 (0.0%) |
| Information | 0 (0.0%) | 0 (0.0%) |
| Finance & Insurance | 0 (0.0%) | 0 (0.0%) |
| Real Estate, Rental & Leasing | 42 (100.0%) | 0 (0.0%) |
| Professional & Scientific | 9 (56.2%) | 7 (43.8%) |
| Enterprise Management | 0 (0.0%) | 0 (0.0%) |
| Administrative & Support | 12 (63.2%) | 7 (36.8%) |
| Educational Services | 49 (51.6%) | 46 (48.4%) |
| Health Care & Social Assistance | 0 (0.0%) | 159 (100.0%) |
| Arts, Entertainment & Recreation | 12 (52.2%) | 11 (47.8%) |
| Accommodation & Food Services | 49 (21.5%) | 179 (78.5%) |
| Public Administration | 59 (83.1%) | 12 (16.9%) |
| Total | 640 (48.5%) | 680 (51.5%) |
Education in Paoli
School Enrollment in Paoli
The most common levels of schooling among the 822 students in Paoli are elementary school (198 | 24.1%), middle school (190 | 23.1%), and high school (140 | 17.0%).
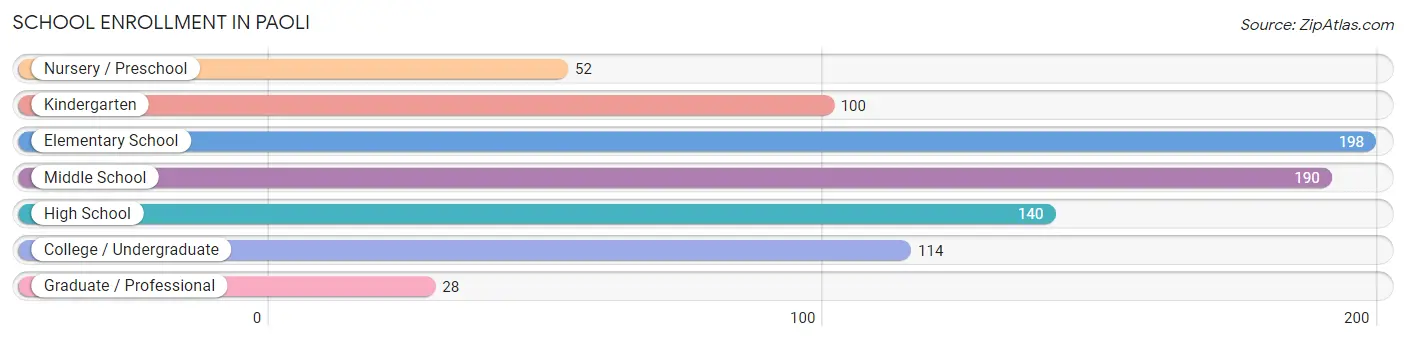
| School Level | # Students | % Students |
| Nursery / Preschool | 52 | 6.3% |
| Kindergarten | 100 | 12.2% |
| Elementary School | 198 | 24.1% |
| Middle School | 190 | 23.1% |
| High School | 140 | 17.0% |
| College / Undergraduate | 114 | 13.9% |
| Graduate / Professional | 28 | 3.4% |
| Total | 822 | 100.0% |
School Enrollment by Age by Funding Source in Paoli
Out of a total of 822 students who are enrolled in schools in Paoli, 52 (6.3%) attend a private institution, while the remaining 770 (93.7%) are enrolled in public schools. The age group of 35 years and over has the highest likelihood of being enrolled in private schools, with 6 (100.0% in the age bracket) enrolled. Conversely, the age group of 10 to 14 year olds has the lowest likelihood of being enrolled in a private school, with 215 (100.0% in the age bracket) attending a public institution.
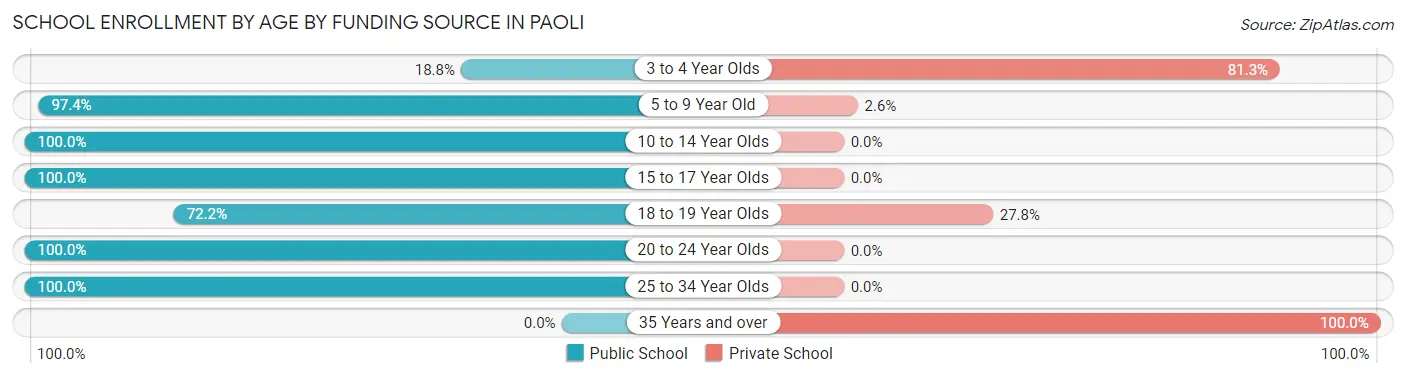
| Age Bracket | Public School | Private School |
| 3 to 4 Year Olds | 3 (18.8%) | 13 (81.2%) |
| 5 to 9 Year Old | 301 (97.4%) | 8 (2.6%) |
| 10 to 14 Year Olds | 215 (100.0%) | 0 (0.0%) |
| 15 to 17 Year Olds | 84 (100.0%) | 0 (0.0%) |
| 18 to 19 Year Olds | 65 (72.2%) | 25 (27.8%) |
| 20 to 24 Year Olds | 47 (100.0%) | 0 (0.0%) |
| 25 to 34 Year Olds | 55 (100.0%) | 0 (0.0%) |
| 35 Years and over | 0 (0.0%) | 6 (100.0%) |
| Total | 770 (93.7%) | 52 (6.3%) |
Educational Attainment by Field of Study in Paoli
Business (129 | 56.3%), education (72 | 31.4%), physical & health sciences (15 | 6.6%), and liberal arts & history (13 | 5.7%) are the most common fields of study among 229 individuals in Paoli who have obtained a bachelor's degree or higher.
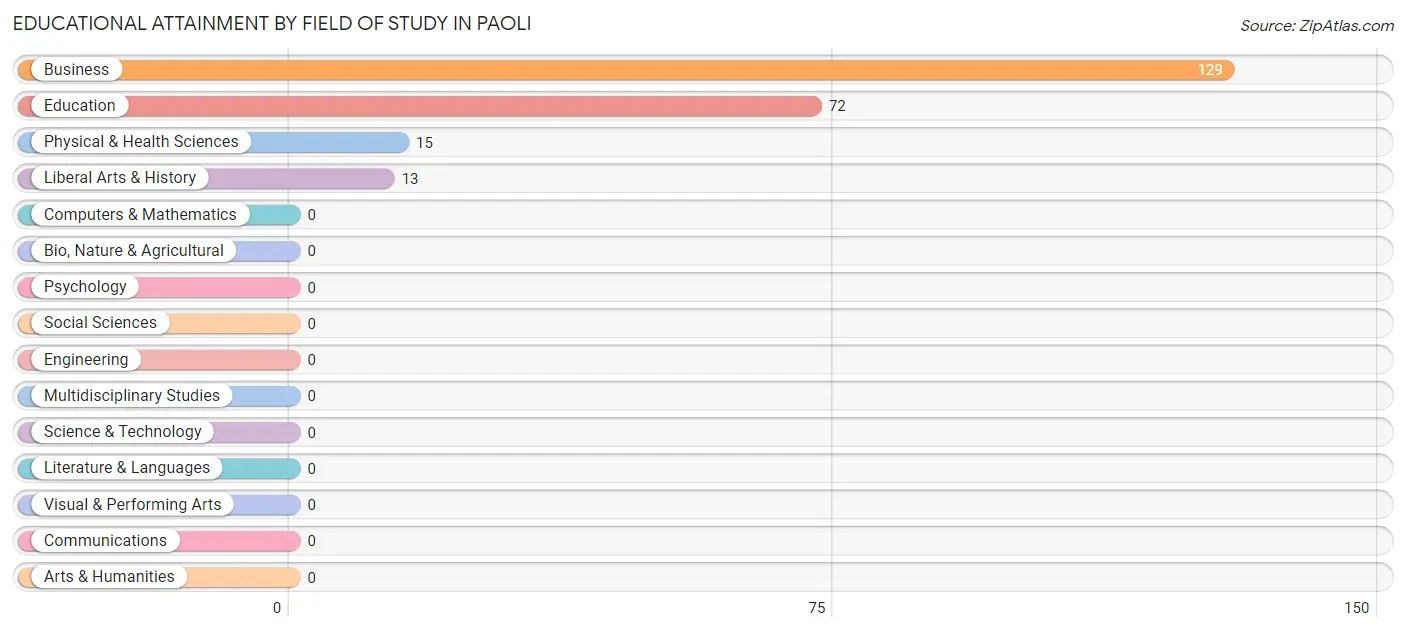
| Field of Study | # Graduates | % Graduates |
| Computers & Mathematics | 0 | 0.0% |
| Bio, Nature & Agricultural | 0 | 0.0% |
| Physical & Health Sciences | 15 | 6.6% |
| Psychology | 0 | 0.0% |
| Social Sciences | 0 | 0.0% |
| Engineering | 0 | 0.0% |
| Multidisciplinary Studies | 0 | 0.0% |
| Science & Technology | 0 | 0.0% |
| Business | 129 | 56.3% |
| Education | 72 | 31.4% |
| Literature & Languages | 0 | 0.0% |
| Liberal Arts & History | 13 | 5.7% |
| Visual & Performing Arts | 0 | 0.0% |
| Communications | 0 | 0.0% |
| Arts & Humanities | 0 | 0.0% |
| Total | 229 | 100.0% |
Transportation & Commute in Paoli
Vehicle Availability by Sex in Paoli
The most prevalent vehicle ownership categories in Paoli are males with 2 vehicles (322, accounting for 51.4%) and females with 2 vehicles (271, making up 47.3%).
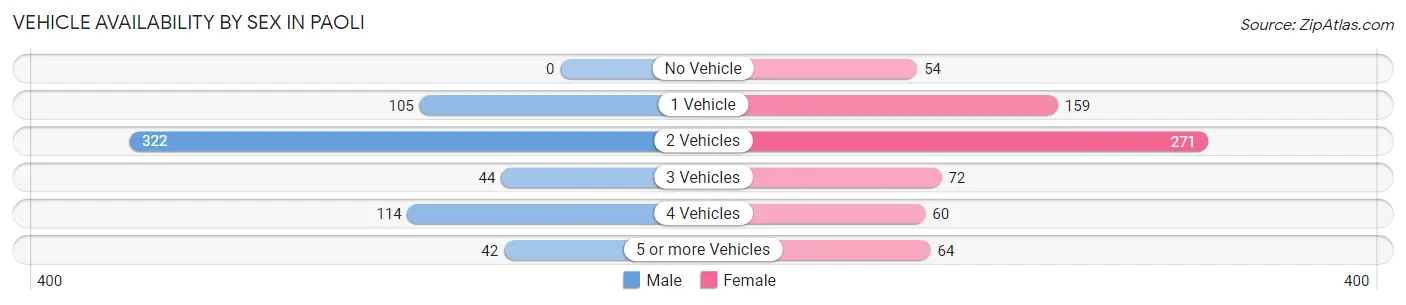
| Vehicles Available | Male | Female |
| No Vehicle | 0 (0.0%) | 54 (7.9%) |
| 1 Vehicle | 105 (16.8%) | 159 (23.4%) |
| 2 Vehicles | 322 (51.4%) | 271 (39.9%) |
| 3 Vehicles | 44 (7.0%) | 72 (10.6%) |
| 4 Vehicles | 114 (18.2%) | 60 (8.8%) |
| 5 or more Vehicles | 42 (6.7%) | 64 (9.4%) |
| Total | 627 (100.0%) | 680 (100.0%) |
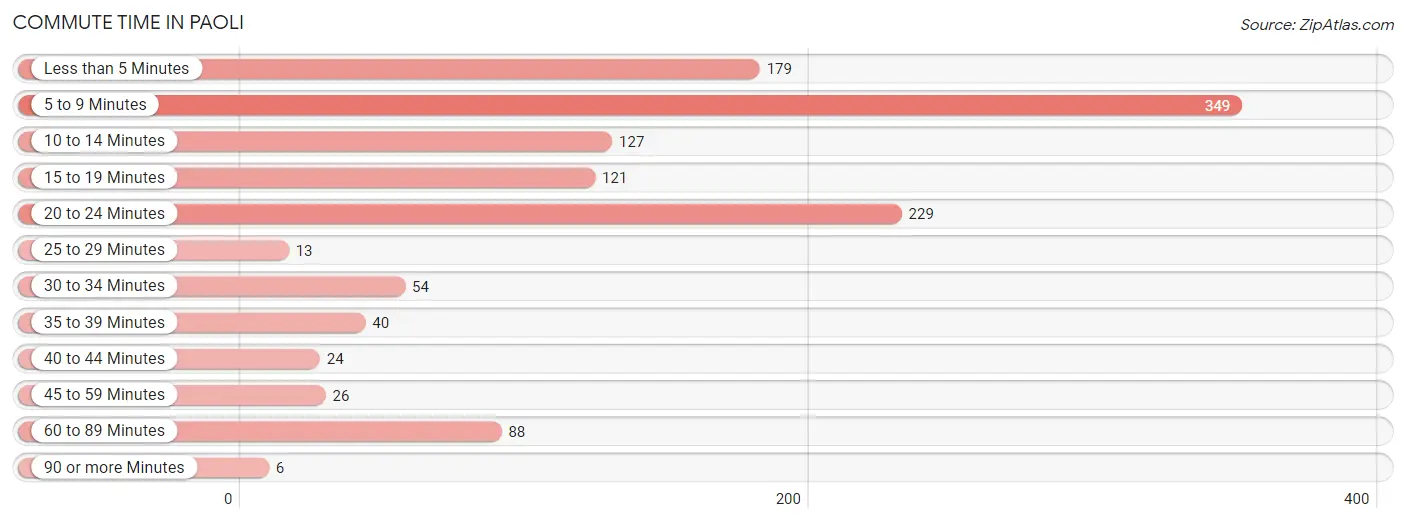
Commute Time in Paoli
The most frequently occuring commute durations in Paoli are 5 to 9 minutes (349 commuters, 27.8%), 20 to 24 minutes (229 commuters, 18.2%), and less than 5 minutes (179 commuters, 14.2%).
| Commute Time | # Commuters | % Commuters |
| Less than 5 Minutes | 179 | 14.2% |
| 5 to 9 Minutes | 349 | 27.8% |
| 10 to 14 Minutes | 127 | 10.1% |
| 15 to 19 Minutes | 121 | 9.6% |
| 20 to 24 Minutes | 229 | 18.2% |
| 25 to 29 Minutes | 13 | 1.0% |
| 30 to 34 Minutes | 54 | 4.3% |
| 35 to 39 Minutes | 40 | 3.2% |
| 40 to 44 Minutes | 24 | 1.9% |
| 45 to 59 Minutes | 26 | 2.1% |
| 60 to 89 Minutes | 88 | 7.0% |
| 90 or more Minutes | 6 | 0.5% |
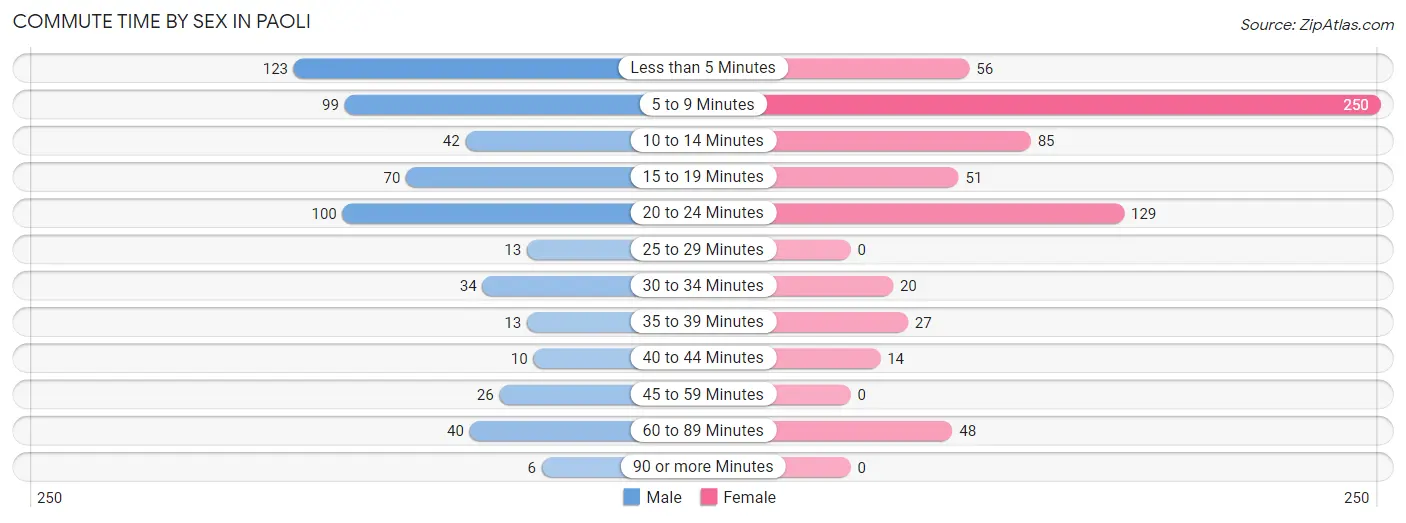
Commute Time by Sex in Paoli
The most common commute times in Paoli are less than 5 minutes (123 commuters, 21.3%) for males and 5 to 9 minutes (250 commuters, 36.8%) for females.
| Commute Time | Male | Female |
| Less than 5 Minutes | 123 (21.3%) | 56 (8.2%) |
| 5 to 9 Minutes | 99 (17.2%) | 250 (36.8%) |
| 10 to 14 Minutes | 42 (7.3%) | 85 (12.5%) |
| 15 to 19 Minutes | 70 (12.1%) | 51 (7.5%) |
| 20 to 24 Minutes | 100 (17.4%) | 129 (19.0%) |
| 25 to 29 Minutes | 13 (2.3%) | 0 (0.0%) |
| 30 to 34 Minutes | 34 (5.9%) | 20 (2.9%) |
| 35 to 39 Minutes | 13 (2.3%) | 27 (4.0%) |
| 40 to 44 Minutes | 10 (1.7%) | 14 (2.1%) |
| 45 to 59 Minutes | 26 (4.5%) | 0 (0.0%) |
| 60 to 89 Minutes | 40 (6.9%) | 48 (7.1%) |
| 90 or more Minutes | 6 (1.0%) | 0 (0.0%) |
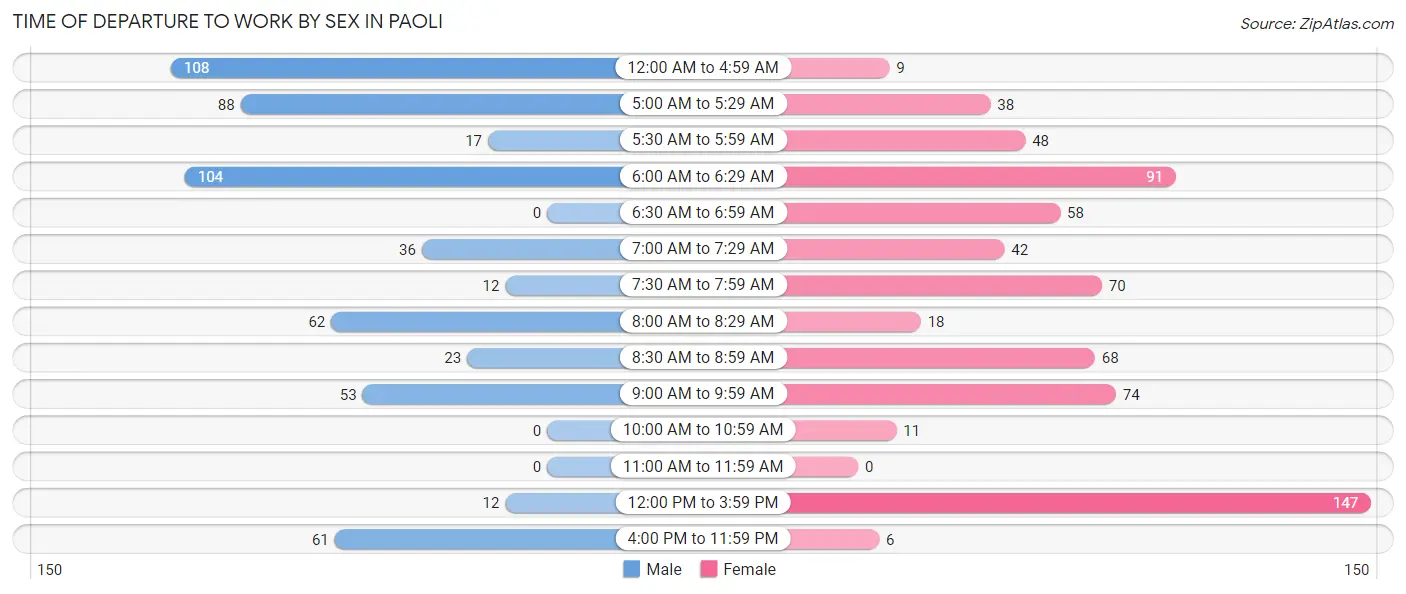
Time of Departure to Work by Sex in Paoli
The most frequent times of departure to work in Paoli are 12:00 AM to 4:59 AM (108, 18.8%) for males and 12:00 PM to 3:59 PM (147, 21.6%) for females.
| Time of Departure | Male | Female |
| 12:00 AM to 4:59 AM | 108 (18.8%) | 9 (1.3%) |
| 5:00 AM to 5:29 AM | 88 (15.3%) | 38 (5.6%) |
| 5:30 AM to 5:59 AM | 17 (2.9%) | 48 (7.1%) |
| 6:00 AM to 6:29 AM | 104 (18.1%) | 91 (13.4%) |
| 6:30 AM to 6:59 AM | 0 (0.0%) | 58 (8.5%) |
| 7:00 AM to 7:29 AM | 36 (6.2%) | 42 (6.2%) |
| 7:30 AM to 7:59 AM | 12 (2.1%) | 70 (10.3%) |
| 8:00 AM to 8:29 AM | 62 (10.8%) | 18 (2.6%) |
| 8:30 AM to 8:59 AM | 23 (4.0%) | 68 (10.0%) |
| 9:00 AM to 9:59 AM | 53 (9.2%) | 74 (10.9%) |
| 10:00 AM to 10:59 AM | 0 (0.0%) | 11 (1.6%) |
| 11:00 AM to 11:59 AM | 0 (0.0%) | 0 (0.0%) |
| 12:00 PM to 3:59 PM | 12 (2.1%) | 147 (21.6%) |
| 4:00 PM to 11:59 PM | 61 (10.6%) | 6 (0.9%) |
| Total | 576 (100.0%) | 680 (100.0%) |
Housing Occupancy in Paoli
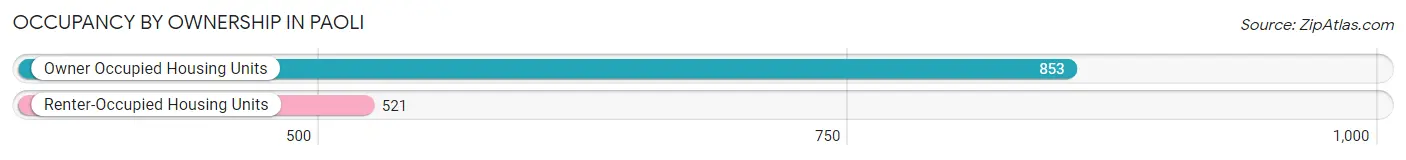
Occupancy by Ownership in Paoli
Of the total 1,374 dwellings in Paoli, owner-occupied units account for 853 (62.1%), while renter-occupied units make up 521 (37.9%).
| Occupancy | # Housing Units | % Housing Units |
| Owner Occupied Housing Units | 853 | 62.1% |
| Renter-Occupied Housing Units | 521 | 37.9% |
| Total Occupied Housing Units | 1,374 | 100.0% |
Occupancy by Household Size in Paoli
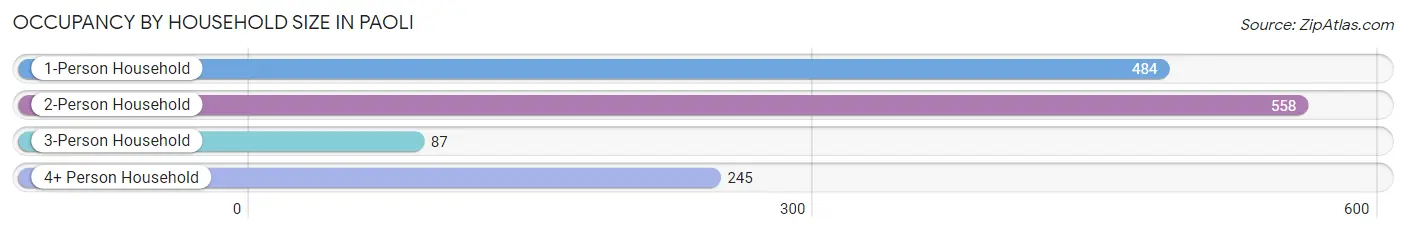
| Household Size | # Housing Units | % Housing Units |
| 1-Person Household | 484 | 35.2% |
| 2-Person Household | 558 | 40.6% |
| 3-Person Household | 87 | 6.3% |
| 4+ Person Household | 245 | 17.8% |
| Total Housing Units | 1,374 | 100.0% |
Occupancy by Ownership by Household Size in Paoli
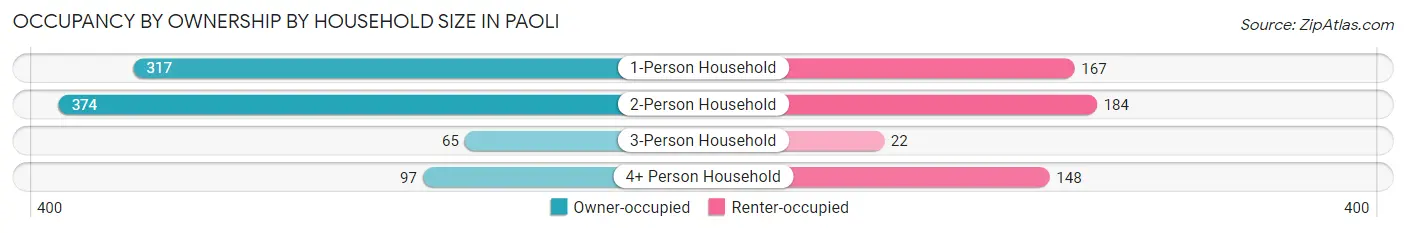
| Household Size | Owner-occupied | Renter-occupied |
| 1-Person Household | 317 (65.5%) | 167 (34.5%) |
| 2-Person Household | 374 (67.0%) | 184 (33.0%) |
| 3-Person Household | 65 (74.7%) | 22 (25.3%) |
| 4+ Person Household | 97 (39.6%) | 148 (60.4%) |
| Total Housing Units | 853 (62.1%) | 521 (37.9%) |
Occupancy by Educational Attainment in Paoli
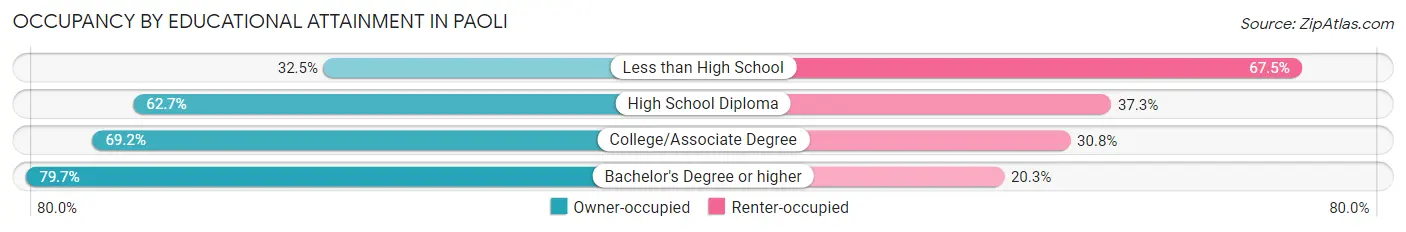
| Household Size | Owner-occupied | Renter-occupied |
| Less than High School | 55 (32.5%) | 114 (67.5%) |
| High School Diploma | 500 (62.7%) | 297 (37.3%) |
| College/Associate Degree | 180 (69.2%) | 80 (30.8%) |
| Bachelor's Degree or higher | 118 (79.7%) | 30 (20.3%) |
Occupancy by Age of Householder in Paoli
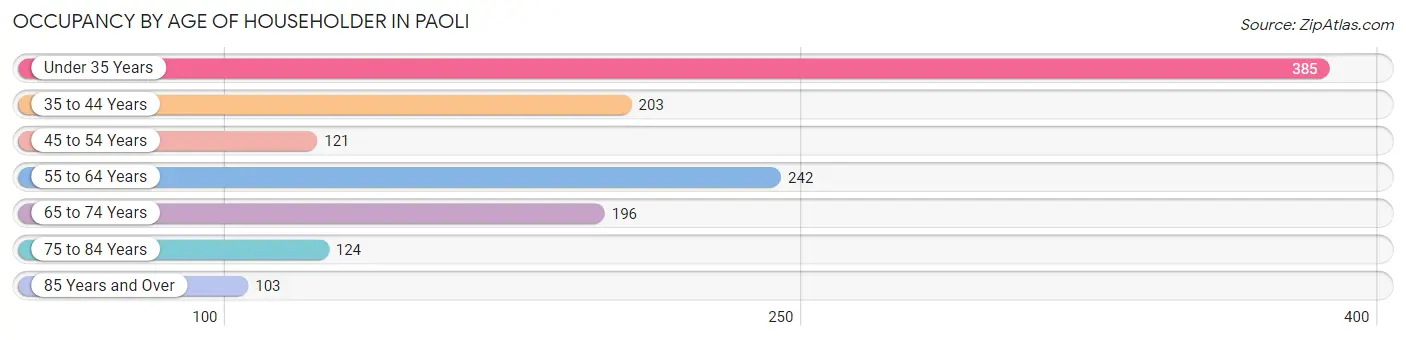
| Age Bracket | # Households | % Households |
| Under 35 Years | 385 | 28.0% |
| 35 to 44 Years | 203 | 14.8% |
| 45 to 54 Years | 121 | 8.8% |
| 55 to 64 Years | 242 | 17.6% |
| 65 to 74 Years | 196 | 14.3% |
| 75 to 84 Years | 124 | 9.0% |
| 85 Years and Over | 103 | 7.5% |
| Total | 1,374 | 100.0% |
Housing Finances in Paoli
Median Income by Occupancy in Paoli
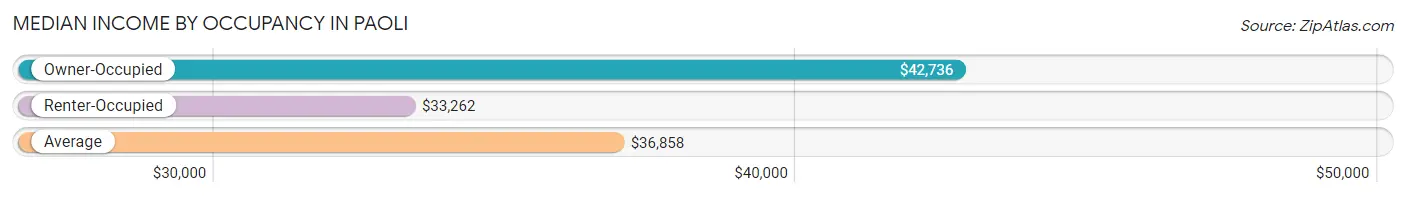
| Occupancy Type | # Households | Median Income |
| Owner-Occupied | 853 (62.1%) | $42,736 |
| Renter-Occupied | 521 (37.9%) | $33,262 |
| Average | 1,374 (100.0%) | $36,858 |
Occupancy by Householder Income Bracket in Paoli
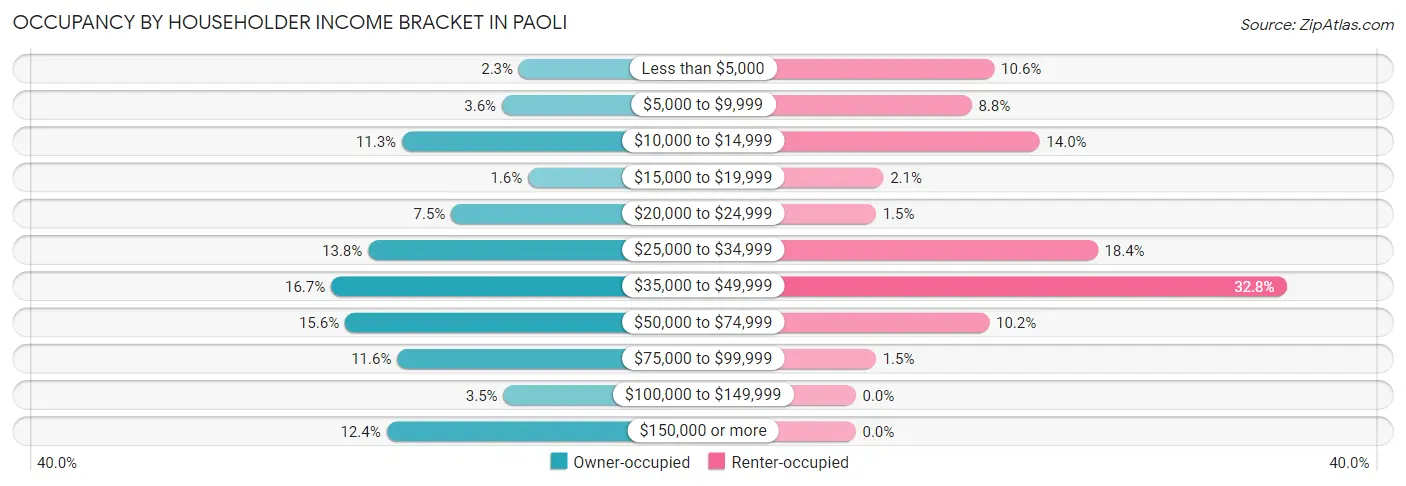
| Income Bracket | Owner-occupied | Renter-occupied |
| Less than $5,000 | 20 (2.3%) | 55 (10.6%) |
| $5,000 to $9,999 | 31 (3.6%) | 46 (8.8%) |
| $10,000 to $14,999 | 96 (11.3%) | 73 (14.0%) |
| $15,000 to $19,999 | 14 (1.6%) | 11 (2.1%) |
| $20,000 to $24,999 | 64 (7.5%) | 8 (1.5%) |
| $25,000 to $34,999 | 118 (13.8%) | 96 (18.4%) |
| $35,000 to $49,999 | 142 (16.7%) | 171 (32.8%) |
| $50,000 to $74,999 | 133 (15.6%) | 53 (10.2%) |
| $75,000 to $99,999 | 99 (11.6%) | 8 (1.5%) |
| $100,000 to $149,999 | 30 (3.5%) | 0 (0.0%) |
| $150,000 or more | 106 (12.4%) | 0 (0.0%) |
| Total | 853 (100.0%) | 521 (100.0%) |
Monthly Housing Cost Tiers in Paoli
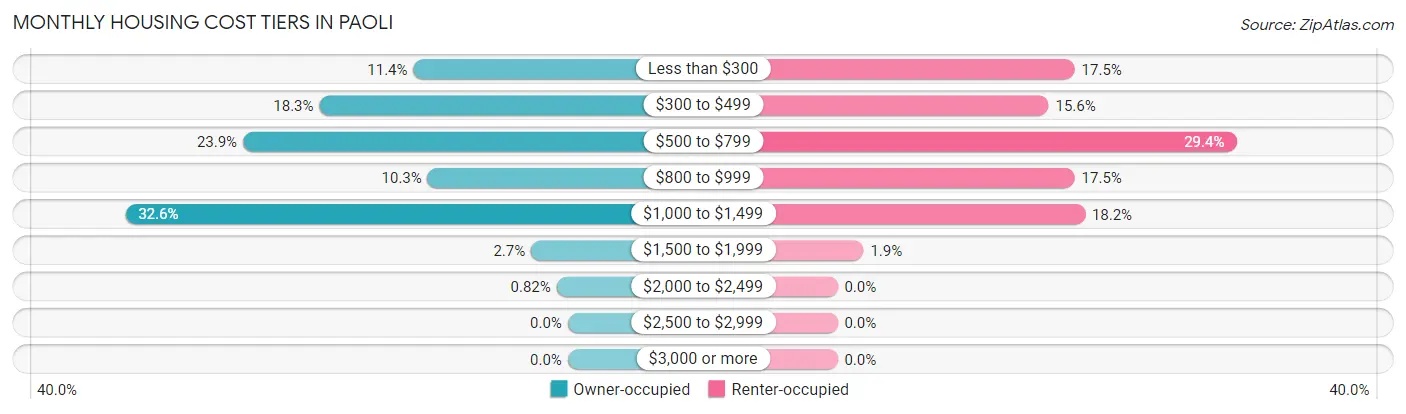
| Monthly Cost | Owner-occupied | Renter-occupied |
| Less than $300 | 97 (11.4%) | 91 (17.5%) |
| $300 to $499 | 156 (18.3%) | 81 (15.5%) |
| $500 to $799 | 204 (23.9%) | 153 (29.4%) |
| $800 to $999 | 88 (10.3%) | 91 (17.5%) |
| $1,000 to $1,499 | 278 (32.6%) | 95 (18.2%) |
| $1,500 to $1,999 | 23 (2.7%) | 10 (1.9%) |
| $2,000 to $2,499 | 7 (0.8%) | 0 (0.0%) |
| $2,500 to $2,999 | 0 (0.0%) | 0 (0.0%) |
| $3,000 or more | 0 (0.0%) | 0 (0.0%) |
| Total | 853 (100.0%) | 521 (100.0%) |
Physical Housing Characteristics in Paoli
Housing Structures in Paoli
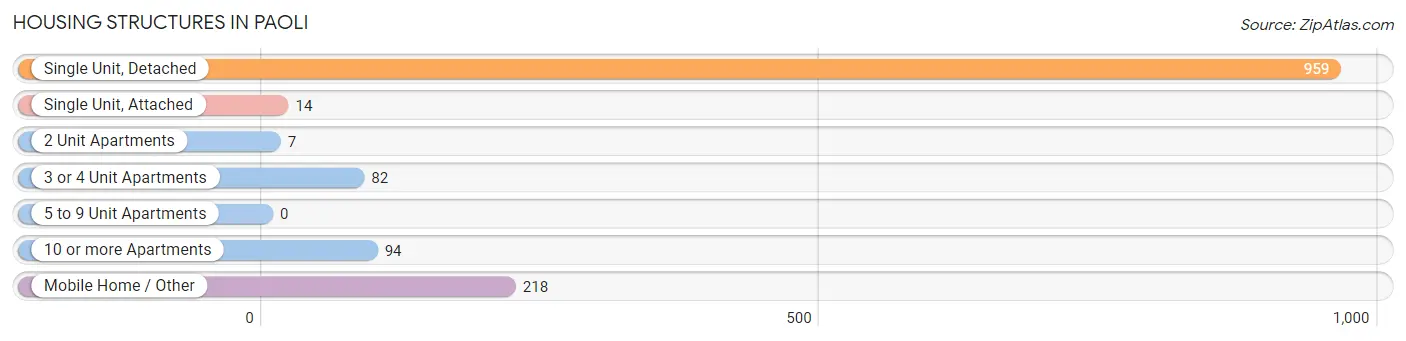
| Structure Type | # Housing Units | % Housing Units |
| Single Unit, Detached | 959 | 69.8% |
| Single Unit, Attached | 14 | 1.0% |
| 2 Unit Apartments | 7 | 0.5% |
| 3 or 4 Unit Apartments | 82 | 6.0% |
| 5 to 9 Unit Apartments | 0 | 0.0% |
| 10 or more Apartments | 94 | 6.8% |
| Mobile Home / Other | 218 | 15.9% |
| Total | 1,374 | 100.0% |
Housing Structures by Occupancy in Paoli
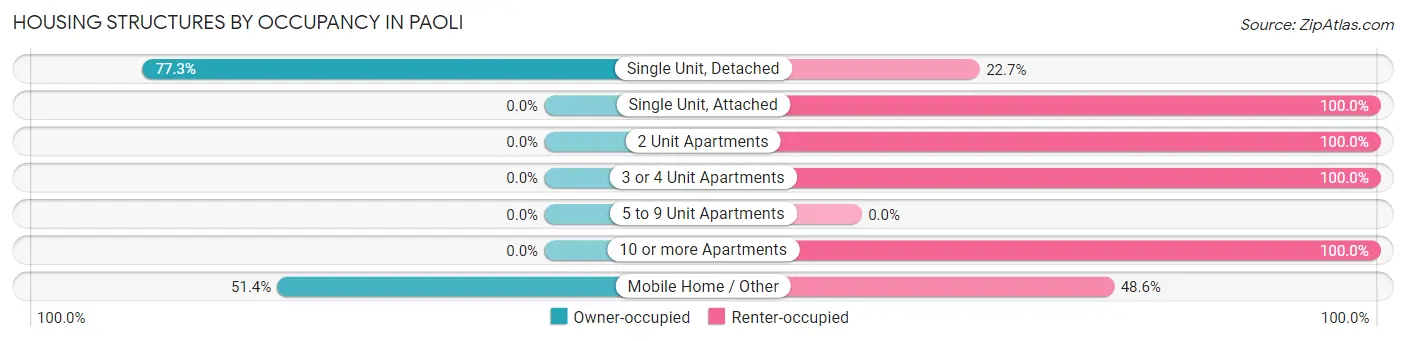
| Structure Type | Owner-occupied | Renter-occupied |
| Single Unit, Detached | 741 (77.3%) | 218 (22.7%) |
| Single Unit, Attached | 0 (0.0%) | 14 (100.0%) |
| 2 Unit Apartments | 0 (0.0%) | 7 (100.0%) |
| 3 or 4 Unit Apartments | 0 (0.0%) | 82 (100.0%) |
| 5 to 9 Unit Apartments | 0 (0.0%) | 0 (0.0%) |
| 10 or more Apartments | 0 (0.0%) | 94 (100.0%) |
| Mobile Home / Other | 112 (51.4%) | 106 (48.6%) |
| Total | 853 (62.1%) | 521 (37.9%) |
Housing Structures by Number of Rooms in Paoli
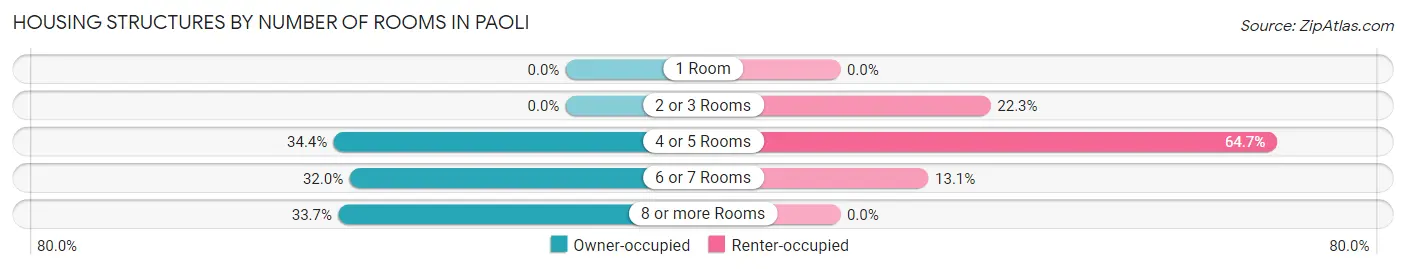
| Number of Rooms | Owner-occupied | Renter-occupied |
| 1 Room | 0 (0.0%) | 0 (0.0%) |
| 2 or 3 Rooms | 0 (0.0%) | 116 (22.3%) |
| 4 or 5 Rooms | 293 (34.4%) | 337 (64.7%) |
| 6 or 7 Rooms | 273 (32.0%) | 68 (13.1%) |
| 8 or more Rooms | 287 (33.7%) | 0 (0.0%) |
| Total | 853 (100.0%) | 521 (100.0%) |
Housing Structure by Heating Type in Paoli
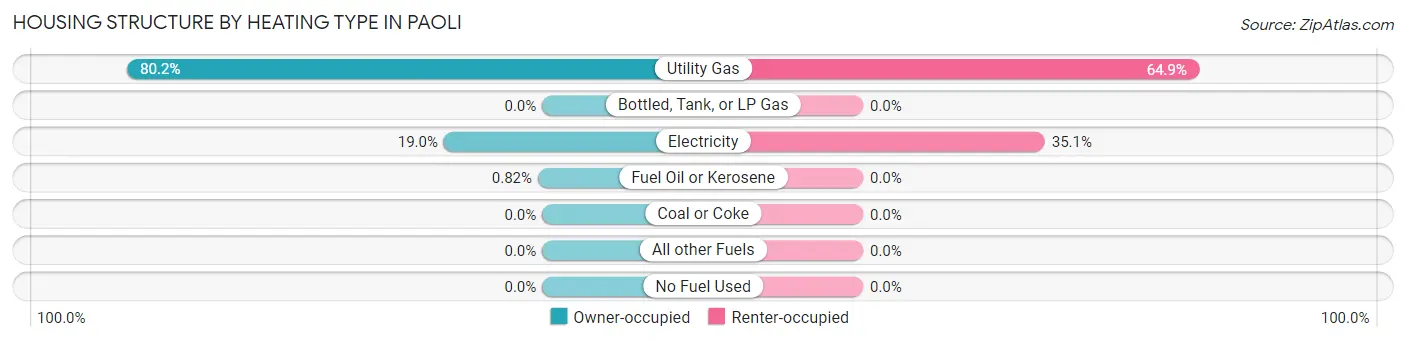
| Heating Type | Owner-occupied | Renter-occupied |
| Utility Gas | 684 (80.2%) | 338 (64.9%) |
| Bottled, Tank, or LP Gas | 0 (0.0%) | 0 (0.0%) |
| Electricity | 162 (19.0%) | 183 (35.1%) |
| Fuel Oil or Kerosene | 7 (0.8%) | 0 (0.0%) |
| Coal or Coke | 0 (0.0%) | 0 (0.0%) |
| All other Fuels | 0 (0.0%) | 0 (0.0%) |
| No Fuel Used | 0 (0.0%) | 0 (0.0%) |
| Total | 853 (100.0%) | 521 (100.0%) |
Household Vehicle Usage in Paoli
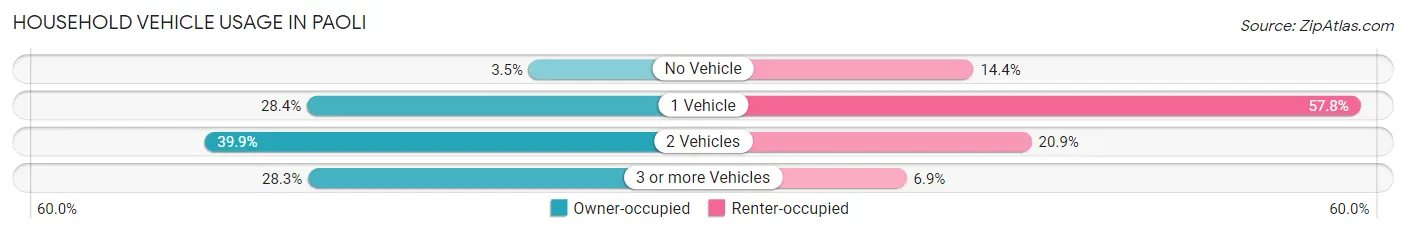
| Vehicles per Household | Owner-occupied | Renter-occupied |
| No Vehicle | 30 (3.5%) | 75 (14.4%) |
| 1 Vehicle | 242 (28.4%) | 301 (57.8%) |
| 2 Vehicles | 340 (39.9%) | 109 (20.9%) |
| 3 or more Vehicles | 241 (28.2%) | 36 (6.9%) |
| Total | 853 (100.0%) | 521 (100.0%) |
Real Estate & Mortgages in Paoli
Real Estate and Mortgage Overview in Paoli
| Characteristic | Without Mortgage | With Mortgage |
| Housing Units | 380 | 473 |
| Median Property Value | $104,200 | $98,300 |
| Median Household Income | $39,167 | $42 |
| Monthly Housing Costs | $395 | $0 |
| Real Estate Taxes | $706 | $40 |
Property Value by Mortgage Status in Paoli
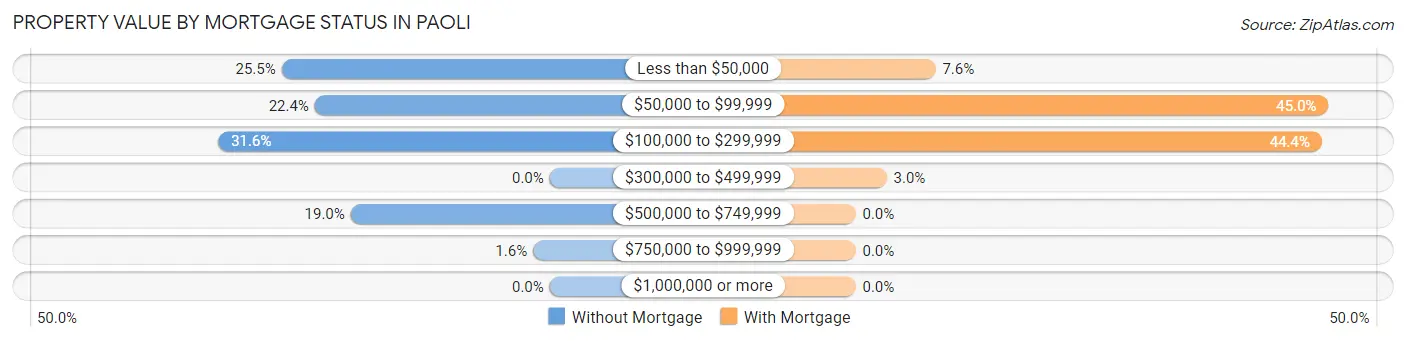
| Property Value | Without Mortgage | With Mortgage |
| Less than $50,000 | 97 (25.5%) | 36 (7.6%) |
| $50,000 to $99,999 | 85 (22.4%) | 213 (45.0%) |
| $100,000 to $299,999 | 120 (31.6%) | 210 (44.4%) |
| $300,000 to $499,999 | 0 (0.0%) | 14 (3.0%) |
| $500,000 to $749,999 | 72 (19.0%) | 0 (0.0%) |
| $750,000 to $999,999 | 6 (1.6%) | 0 (0.0%) |
| $1,000,000 or more | 0 (0.0%) | 0 (0.0%) |
| Total | 380 (100.0%) | 473 (100.0%) |
Household Income by Mortgage Status in Paoli
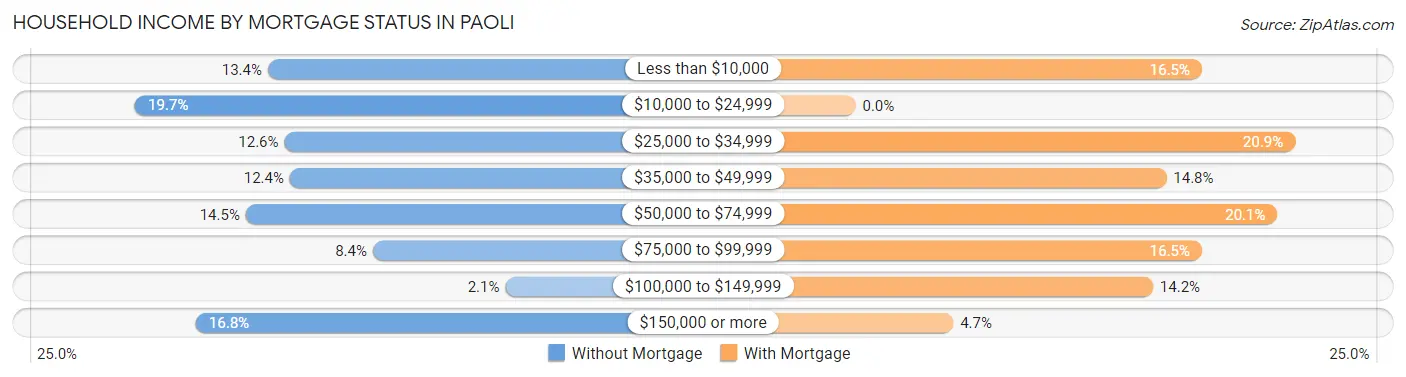
| Household Income | Without Mortgage | With Mortgage |
| Less than $10,000 | 51 (13.4%) | 78 (16.5%) |
| $10,000 to $24,999 | 75 (19.7%) | 0 (0.0%) |
| $25,000 to $34,999 | 48 (12.6%) | 99 (20.9%) |
| $35,000 to $49,999 | 47 (12.4%) | 70 (14.8%) |
| $50,000 to $74,999 | 55 (14.5%) | 95 (20.1%) |
| $75,000 to $99,999 | 32 (8.4%) | 78 (16.5%) |
| $100,000 to $149,999 | 8 (2.1%) | 67 (14.2%) |
| $150,000 or more | 64 (16.8%) | 22 (4.6%) |
| Total | 380 (100.0%) | 473 (100.0%) |
Property Value to Household Income Ratio in Paoli
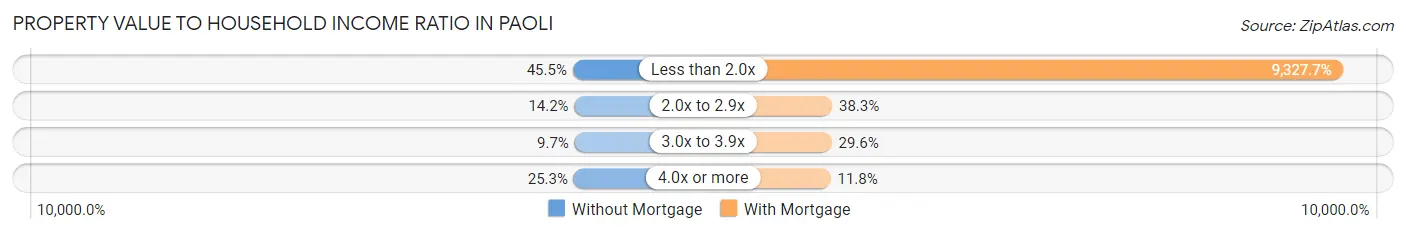
| Value-to-Income Ratio | Without Mortgage | With Mortgage |
| Less than 2.0x | 173 (45.5%) | 44,120 (9,327.7%) |
| 2.0x to 2.9x | 54 (14.2%) | 181 (38.3%) |
| 3.0x to 3.9x | 37 (9.7%) | 140 (29.6%) |
| 4.0x or more | 96 (25.3%) | 56 (11.8%) |
| Total | 380 (100.0%) | 473 (100.0%) |
Real Estate Taxes by Mortgage Status in Paoli
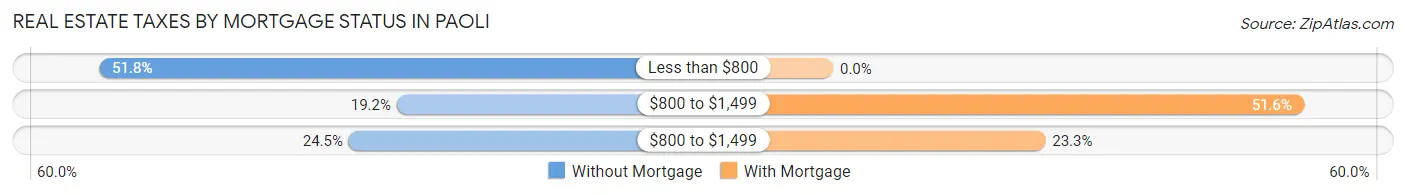
| Property Taxes | Without Mortgage | With Mortgage |
| Less than $800 | 197 (51.8%) | 0 (0.0%) |
| $800 to $1,499 | 73 (19.2%) | 244 (51.6%) |
| $800 to $1,499 | 93 (24.5%) | 110 (23.3%) |
| Total | 380 (100.0%) | 473 (100.0%) |
Health & Disability in Paoli
Health Insurance Coverage by Age in Paoli
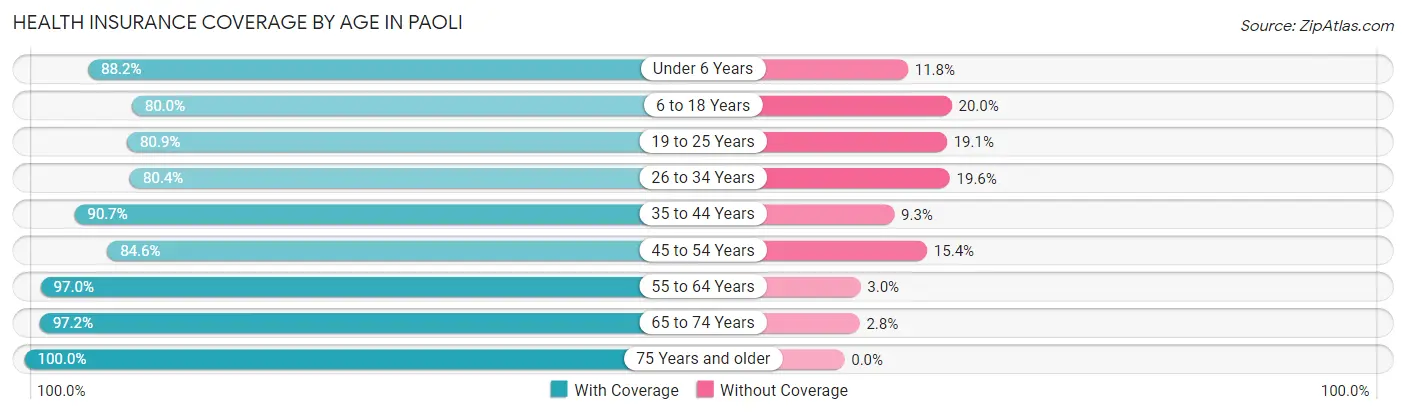
| Age Bracket | With Coverage | Without Coverage |
| Under 6 Years | 268 (88.2%) | 36 (11.8%) |
| 6 to 18 Years | 504 (80.0%) | 126 (20.0%) |
| 19 to 25 Years | 233 (80.9%) | 55 (19.1%) |
| 26 to 34 Years | 270 (80.4%) | 66 (19.6%) |
| 35 to 44 Years | 244 (90.7%) | 25 (9.3%) |
| 45 to 54 Years | 225 (84.6%) | 41 (15.4%) |
| 55 to 64 Years | 323 (97.0%) | 10 (3.0%) |
| 65 to 74 Years | 378 (97.2%) | 11 (2.8%) |
| 75 Years and older | 276 (100.0%) | 0 (0.0%) |
| Total | 2,721 (88.0%) | 370 (12.0%) |
Health Insurance Coverage by Citizenship Status in Paoli
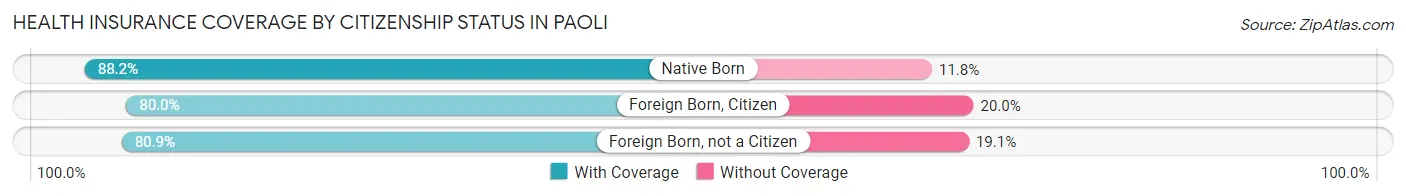
| Citizenship Status | With Coverage | Without Coverage |
| Native Born | 268 (88.2%) | 36 (11.8%) |
| Foreign Born, Citizen | 504 (80.0%) | 126 (20.0%) |
| Foreign Born, not a Citizen | 233 (80.9%) | 55 (19.1%) |
Health Insurance Coverage by Household Income in Paoli
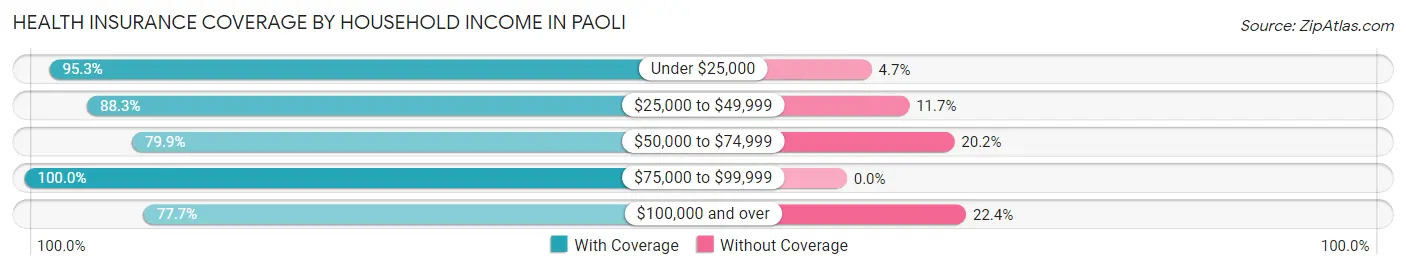
| Household Income | With Coverage | Without Coverage |
| Under $25,000 | 593 (95.3%) | 29 (4.7%) |
| $25,000 to $49,999 | 1,147 (88.3%) | 152 (11.7%) |
| $50,000 to $74,999 | 432 (79.8%) | 109 (20.2%) |
| $75,000 to $99,999 | 252 (100.0%) | 0 (0.0%) |
| $100,000 and over | 278 (77.6%) | 80 (22.4%) |
Public vs Private Health Insurance Coverage by Age in Paoli
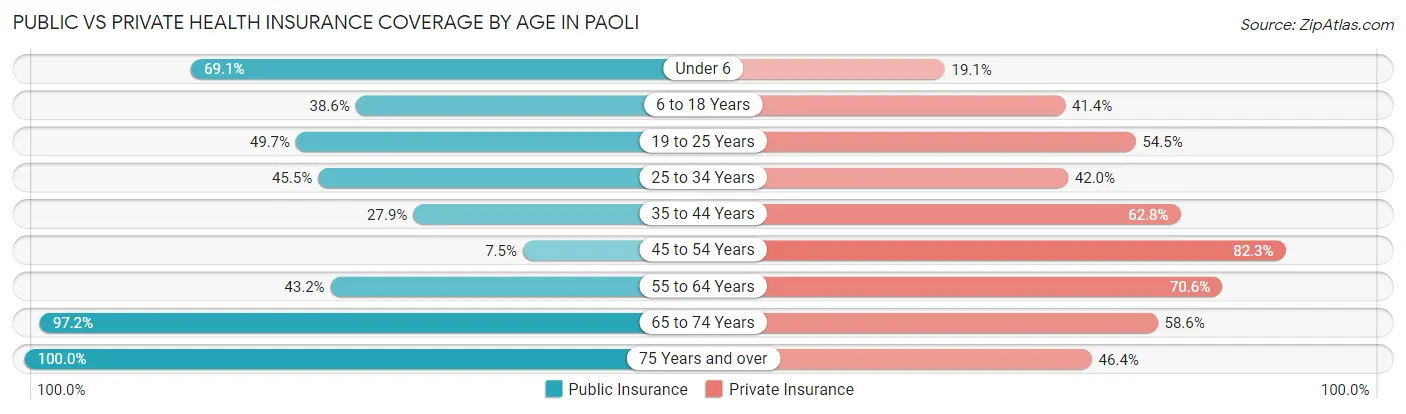
| Age Bracket | Public Insurance | Private Insurance |
| Under 6 | 210 (69.1%) | 58 (19.1%) |
| 6 to 18 Years | 243 (38.6%) | 261 (41.4%) |
| 19 to 25 Years | 143 (49.6%) | 157 (54.5%) |
| 25 to 34 Years | 153 (45.5%) | 141 (42.0%) |
| 35 to 44 Years | 75 (27.9%) | 169 (62.8%) |
| 45 to 54 Years | 20 (7.5%) | 219 (82.3%) |
| 55 to 64 Years | 144 (43.2%) | 235 (70.6%) |
| 65 to 74 Years | 378 (97.2%) | 228 (58.6%) |
| 75 Years and over | 276 (100.0%) | 128 (46.4%) |
| Total | 1,642 (53.1%) | 1,596 (51.6%) |
Disability Status by Sex by Age in Paoli
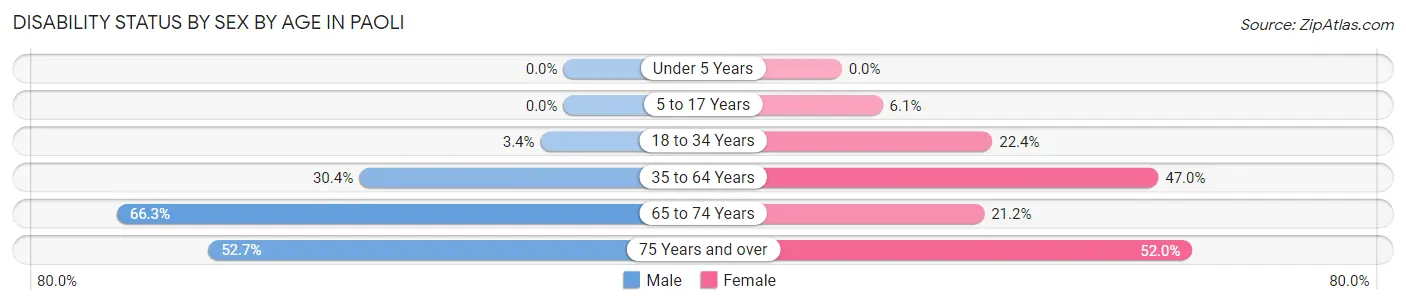
| Age Bracket | Male | Female |
| Under 5 Years | 0 (0.0%) | 0 (0.0%) |
| 5 to 17 Years | 0 (0.0%) | 21 (6.1%) |
| 18 to 34 Years | 12 (3.4%) | 95 (22.4%) |
| 35 to 64 Years | 122 (30.3%) | 219 (47.0%) |
| 65 to 74 Years | 120 (66.3%) | 44 (21.1%) |
| 75 Years and over | 29 (52.7%) | 115 (52.0%) |
Disability Class by Sex by Age in Paoli
Disability Class: Hearing Difficulty
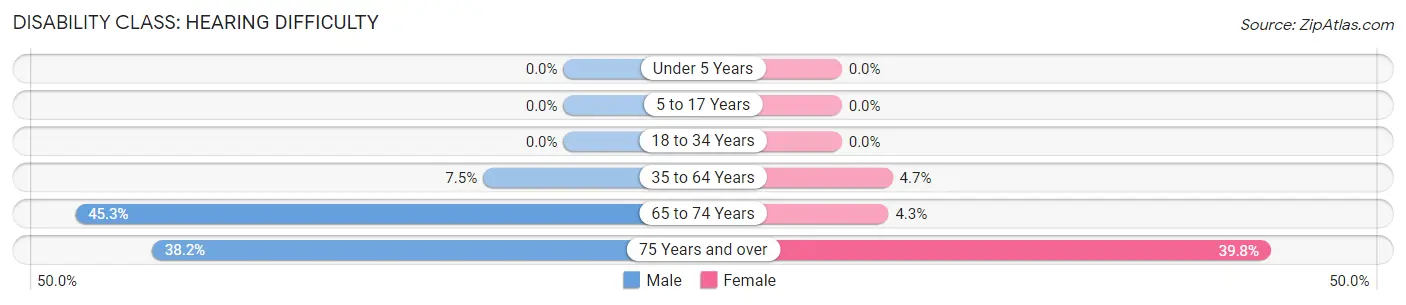
| Age Bracket | Male | Female |
| Under 5 Years | 0 (0.0%) | 0 (0.0%) |
| 5 to 17 Years | 0 (0.0%) | 0 (0.0%) |
| 18 to 34 Years | 0 (0.0%) | 0 (0.0%) |
| 35 to 64 Years | 30 (7.5%) | 22 (4.7%) |
| 65 to 74 Years | 82 (45.3%) | 9 (4.3%) |
| 75 Years and over | 21 (38.2%) | 88 (39.8%) |
Disability Class: Vision Difficulty
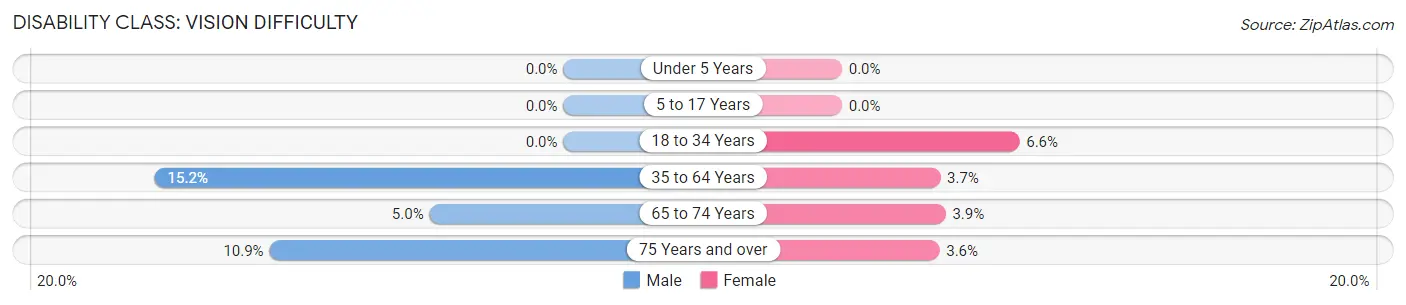
| Age Bracket | Male | Female |
| Under 5 Years | 0 (0.0%) | 0 (0.0%) |
| 5 to 17 Years | 0 (0.0%) | 0 (0.0%) |
| 18 to 34 Years | 0 (0.0%) | 28 (6.6%) |
| 35 to 64 Years | 61 (15.2%) | 17 (3.6%) |
| 65 to 74 Years | 9 (5.0%) | 8 (3.8%) |
| 75 Years and over | 6 (10.9%) | 8 (3.6%) |
Disability Class: Cognitive Difficulty
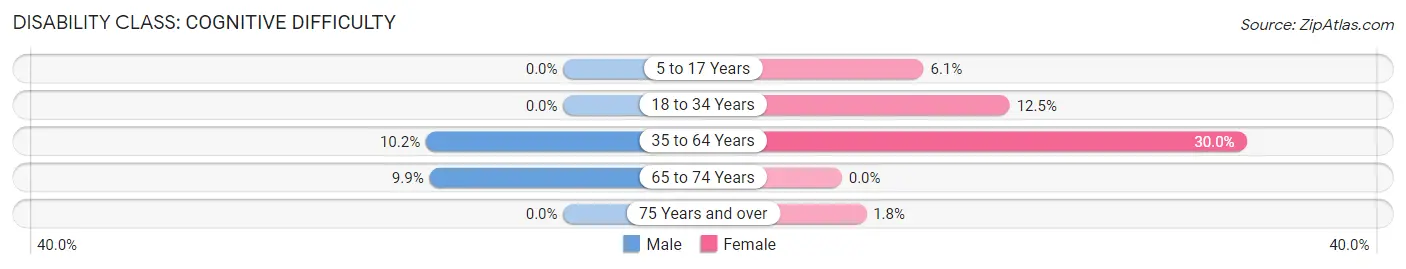
| Age Bracket | Male | Female |
| 5 to 17 Years | 0 (0.0%) | 21 (6.1%) |
| 18 to 34 Years | 0 (0.0%) | 53 (12.5%) |
| 35 to 64 Years | 41 (10.2%) | 140 (30.0%) |
| 65 to 74 Years | 18 (9.9%) | 0 (0.0%) |
| 75 Years and over | 0 (0.0%) | 4 (1.8%) |
Disability Class: Ambulatory Difficulty
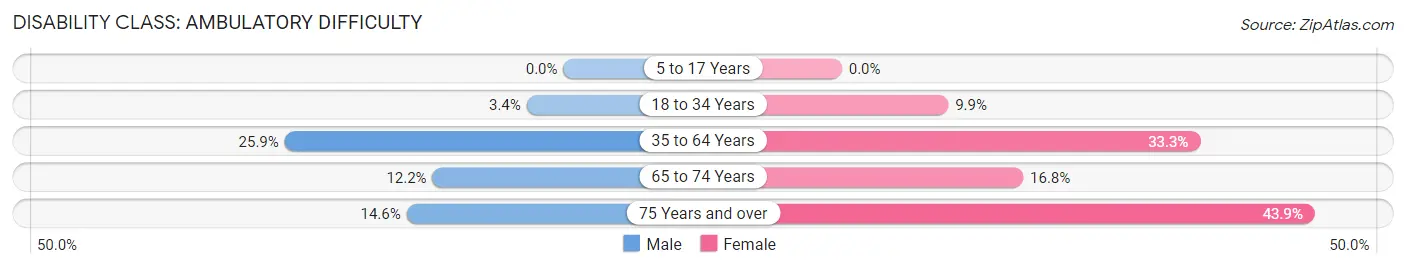
| Age Bracket | Male | Female |
| 5 to 17 Years | 0 (0.0%) | 0 (0.0%) |
| 18 to 34 Years | 12 (3.4%) | 42 (9.9%) |
| 35 to 64 Years | 104 (25.9%) | 155 (33.3%) |
| 65 to 74 Years | 22 (12.1%) | 35 (16.8%) |
| 75 Years and over | 8 (14.5%) | 97 (43.9%) |
Disability Class: Self-Care Difficulty
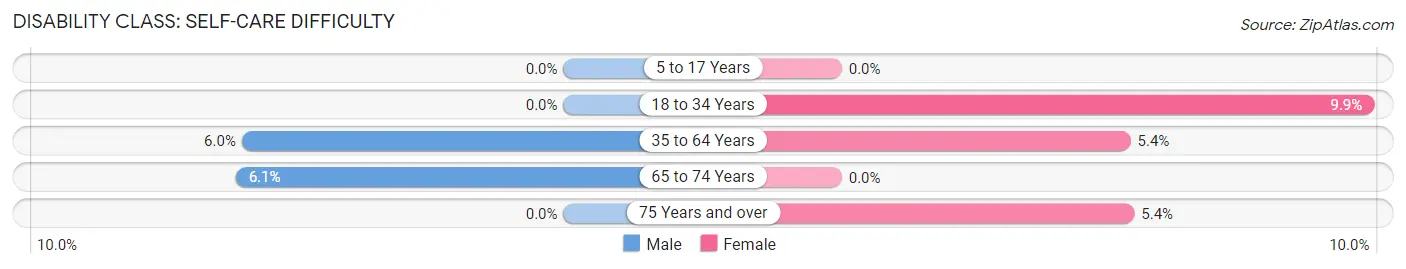
| Age Bracket | Male | Female |
| 5 to 17 Years | 0 (0.0%) | 0 (0.0%) |
| 18 to 34 Years | 0 (0.0%) | 42 (9.9%) |
| 35 to 64 Years | 24 (6.0%) | 25 (5.4%) |
| 65 to 74 Years | 11 (6.1%) | 0 (0.0%) |
| 75 Years and over | 0 (0.0%) | 12 (5.4%) |
Technology Access in Paoli
Computing Device Access in Paoli
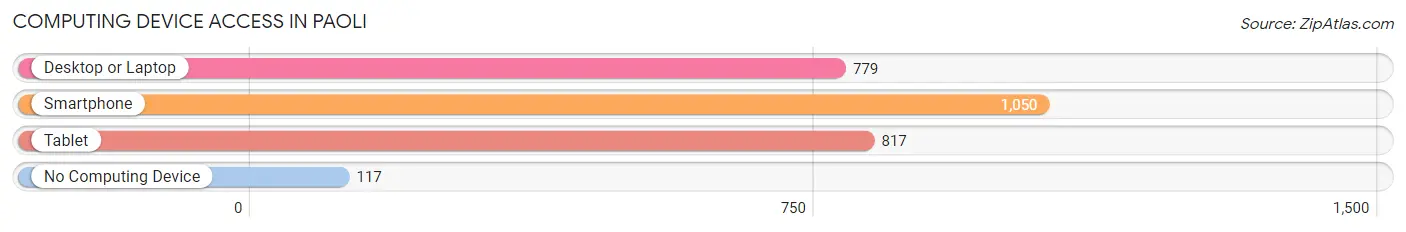
| Device Type | # Households | % Households |
| Desktop or Laptop | 779 | 56.7% |
| Smartphone | 1,050 | 76.4% |
| Tablet | 817 | 59.5% |
| No Computing Device | 117 | 8.5% |
| Total | 1,374 | 100.0% |
Internet Access in Paoli
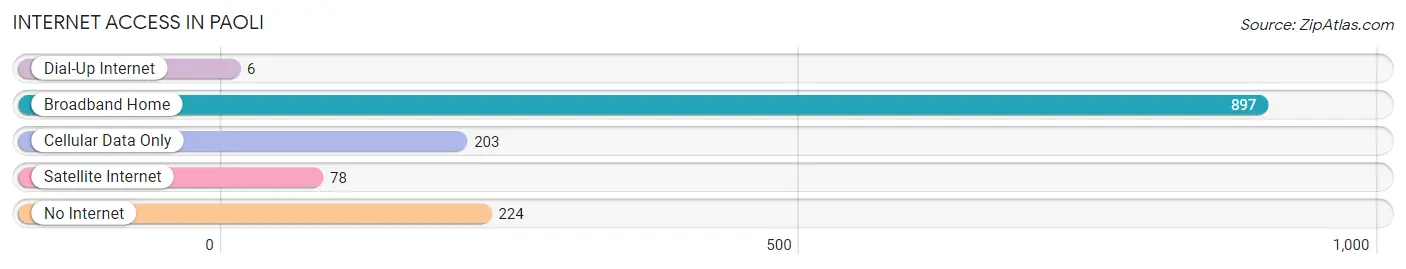
| Internet Type | # Households | % Households |
| Dial-Up Internet | 6 | 0.4% |
| Broadband Home | 897 | 65.3% |
| Cellular Data Only | 203 | 14.8% |
| Satellite Internet | 78 | 5.7% |
| No Internet | 224 | 16.3% |
| Total | 1,374 | 100.0% |
Paoli Summary
Paoli, Indiana is a small town located in Orange County, Indiana. It is situated in the rolling hills of the Hoosier National Forest, about 30 miles northwest of Louisville, Kentucky. The town has a population of 2,845 people, according to the 2010 census.
History
Paoli was founded in 1816 by a group of settlers from North Carolina. The town was named after General Francis Marion, a Revolutionary War hero who was known as the “Swamp Fox”. The town was originally a trading post and a stop on the stagecoach route between Louisville and Vincennes.
In 1837, the first railroad line was built through Paoli, connecting it to the larger cities of Louisville and Vincennes. This allowed for the growth of the town, and it soon became a popular destination for travelers.
In the late 1800s, Paoli was a thriving agricultural community. The town was known for its production of apples, peaches, and other fruits. The town also had a thriving lumber industry, and the local sawmill was one of the largest in the state.
Geography
Paoli is located in the rolling hills of the Hoosier National Forest. The town is situated on the banks of the Patoka River, which flows through the town. The town is surrounded by farmland and wooded areas, and is home to several parks and recreational areas.
The climate in Paoli is humid continental, with hot summers and cold winters. The average temperature in the summer is around 75 degrees Fahrenheit, and the average temperature in the winter is around 30 degrees Fahrenheit.
Economy
The economy of Paoli is largely based on agriculture and tourism. The town is home to several farms, which produce a variety of fruits and vegetables. The town is also home to several wineries, which produce a variety of wines.
The town is also home to several small businesses, including restaurants, shops, and other services. The town is also home to several manufacturing companies, which produce a variety of products.
Demographics
According to the 2010 census, the population of Paoli was 2,845 people. The racial makeup of the town was 97.3% White, 0.7% African American, 0.2% Native American, 0.3% Asian, 0.1% Pacific Islander, 0.7% from other races, and 0.9% from two or more races. Hispanic or Latino of any race were 1.7% of the population.
The median household income in Paoli was $37,917, and the median family income was $45,938. The per capita income for the town was $19,945. About 11.2% of families and 14.2% of the population were below the poverty line, including 18.2% of those under age 18 and 8.2% of those age 65 or over.
Paoli is a small town with a rich history and a vibrant economy. The town is home to several farms, wineries, and businesses, and is a popular destination for tourists. The town is also home to a diverse population, with a variety of racial and ethnic backgrounds.
Common Questions
What is Per Capita Income in Paoli?
Per Capita income in Paoli is $28,823.
What is the Median Family Income in Paoli?
Median Family Income in Paoli is $47,200.
What is the Median Household income in Paoli?
Median Household Income in Paoli is $36,858.
What is Inequality or Gini Index in Paoli?
Inequality or Gini Index in Paoli is 0.63.
What is the Total Population of Paoli?
Total Population of Paoli is 3,286.
What is the Total Male Population of Paoli?
Total Male Population of Paoli is 1,512.
What is the Total Female Population of Paoli?
Total Female Population of Paoli is 1,774.
What is the Ratio of Males per 100 Females in Paoli?
There are 85.23 Males per 100 Females in Paoli.
What is the Ratio of Females per 100 Males in Paoli?
There are 117.33 Females per 100 Males in Paoli.
What is the Median Population Age in Paoli?
Median Population Age in Paoli is 36.3 Years.
What is the Average Family Size in Paoli
Average Family Size in Paoli is 2.9 People.
What is the Average Household Size in Paoli
Average Household Size in Paoli is 2.2 People.
How Large is the Labor Force in Paoli?
There are 1,377 People in the Labor Forcein in Paoli.
What is the Percentage of People in the Labor Force in Paoli?
53.9% of People are in the Labor Force in Paoli.
What is the Unemployment Rate in Paoli?
Unemployment Rate in Paoli is 4.1%.