North Judson, IN Map & Demographics
North Judson Map
North Judson Overview
$22,669
PER CAPITA INCOME
$56,758
AVG FAMILY INCOME
$51,071
AVG HOUSEHOLD INCOME
34.3%
WAGE / INCOME GAP [ % ]
65.7¢/ $1
WAGE / INCOME GAP [ $ ]
0.37
INEQUALITY / GINI INDEX
2,100
TOTAL POPULATION
1,067
MALE POPULATION
1,033
FEMALE POPULATION
103.29
MALES / 100 FEMALES
96.81
FEMALES / 100 MALES
36.9
MEDIAN AGE
3.2
AVG FAMILY SIZE
2.8
AVG HOUSEHOLD SIZE
894
LABOR FORCE [ PEOPLE ]
55.2%
PERCENT IN LABOR FORCE
5.3%
UNEMPLOYMENT RATE
North Judson Zip Codes
North Judson Area Codes
Income in North Judson
Income Overview in North Judson
Per Capita Income in North Judson is $22,669, while median incomes of families and households are $56,758 and $51,071 respectively.
| Characteristic | Number | Measure |
| Per Capita Income | 2,100 | $22,669 |
| Median Family Income | 493 | $56,758 |
| Mean Family Income | 493 | $63,166 |
| Median Household Income | 750 | $51,071 |
| Mean Household Income | 750 | $59,529 |
| Income Deficit | 493 | $0 |
| Wage / Income Gap (%) | 2,100 | 34.29% |
| Wage / Income Gap ($) | 2,100 | 65.71¢ per $1 |
| Gini / Inequality Index | 2,100 | 0.37 |
Earnings by Sex in North Judson
Average Earnings in North Judson are $33,934, $41,115 for men and $27,016 for women, a difference of 34.3%.
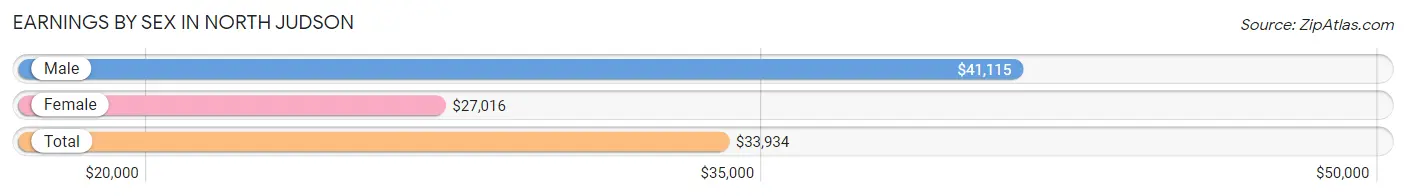
| Sex | Number | Average Earnings |
| Male | 479 (51.9%) | $41,115 |
| Female | 444 (48.1%) | $27,016 |
| Total | 923 (100.0%) | $33,934 |
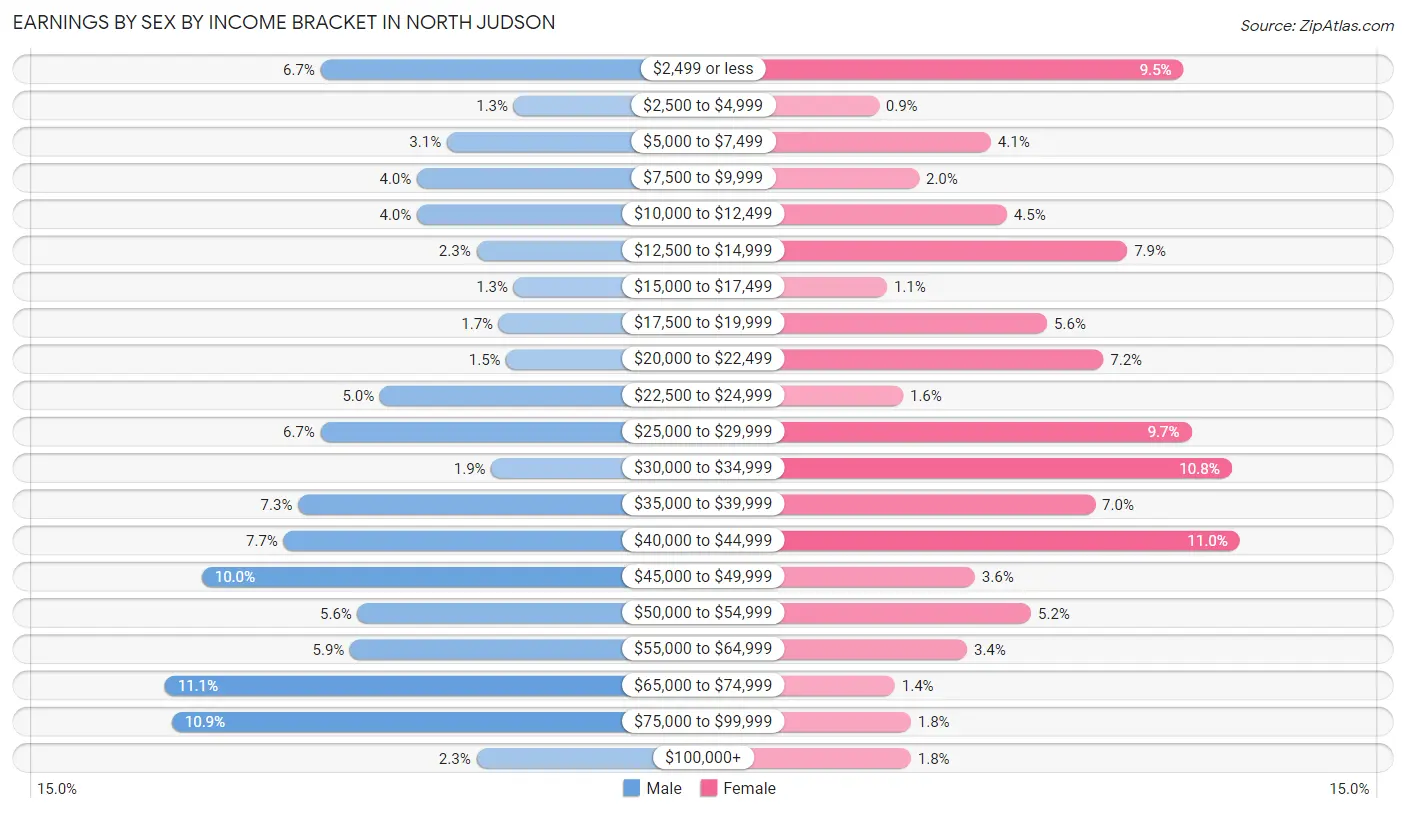
Earnings by Sex by Income Bracket in North Judson
The most common earnings brackets in North Judson are $65,000 to $74,999 for men (53 | 11.1%) and $40,000 to $44,999 for women (49 | 11.0%).
| Income | Male | Female |
| $2,499 or less | 32 (6.7%) | 42 (9.5%) |
| $2,500 to $4,999 | 6 (1.3%) | 4 (0.9%) |
| $5,000 to $7,499 | 15 (3.1%) | 18 (4.1%) |
| $7,500 to $9,999 | 19 (4.0%) | 9 (2.0%) |
| $10,000 to $12,499 | 19 (4.0%) | 20 (4.5%) |
| $12,500 to $14,999 | 11 (2.3%) | 35 (7.9%) |
| $15,000 to $17,499 | 6 (1.3%) | 5 (1.1%) |
| $17,500 to $19,999 | 8 (1.7%) | 25 (5.6%) |
| $20,000 to $22,499 | 7 (1.5%) | 32 (7.2%) |
| $22,500 to $24,999 | 24 (5.0%) | 7 (1.6%) |
| $25,000 to $29,999 | 32 (6.7%) | 43 (9.7%) |
| $30,000 to $34,999 | 9 (1.9%) | 48 (10.8%) |
| $35,000 to $39,999 | 35 (7.3%) | 31 (7.0%) |
| $40,000 to $44,999 | 37 (7.7%) | 49 (11.0%) |
| $45,000 to $49,999 | 48 (10.0%) | 16 (3.6%) |
| $50,000 to $54,999 | 27 (5.6%) | 23 (5.2%) |
| $55,000 to $64,999 | 28 (5.9%) | 15 (3.4%) |
| $65,000 to $74,999 | 53 (11.1%) | 6 (1.3%) |
| $75,000 to $99,999 | 52 (10.9%) | 8 (1.8%) |
| $100,000+ | 11 (2.3%) | 8 (1.8%) |
| Total | 479 (100.0%) | 444 (100.0%) |
Earnings by Sex by Educational Attainment in North Judson
Average earnings in North Judson are $45,114 for men and $30,625 for women, a difference of 32.1%. Men with an educational attainment of graduate degree enjoy the highest average annual earnings of $77,778, while those with high school diploma education earn the least with $39,659. Women with an educational attainment of graduate degree earn the most with the average annual earnings of $58,750, while those with college or associate's degree education have the smallest earnings of $31,875.

| Educational Attainment | Male Income | Female Income |
| Less than High School | $40,667 | $0 |
| High School Diploma | $39,659 | $0 |
| College or Associate's Degree | $41,932 | $31,875 |
| Bachelor's Degree | $51,500 | $43,448 |
| Graduate Degree | $77,778 | $58,750 |
| Total | $45,114 | $30,625 |
Family Income in North Judson
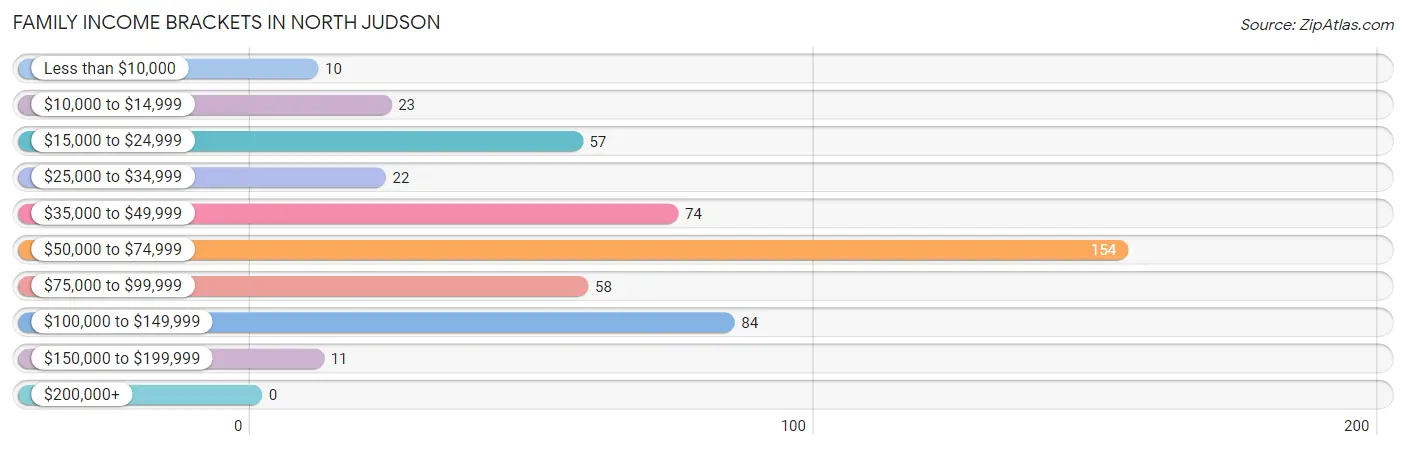
Family Income Brackets in North Judson
According to the North Judson family income data, there are 154 families falling into the $50,000 to $74,999 income range, which is the most common income bracket and makes up 31.2% of all families.
| Income Bracket | # Families | % Families |
| Less than $10,000 | 10 | 2.0% |
| $10,000 to $14,999 | 23 | 4.7% |
| $15,000 to $24,999 | 57 | 11.6% |
| $25,000 to $34,999 | 22 | 4.5% |
| $35,000 to $49,999 | 74 | 15.0% |
| $50,000 to $74,999 | 154 | 31.2% |
| $75,000 to $99,999 | 58 | 11.8% |
| $100,000 to $149,999 | 84 | 17.0% |
| $150,000 to $199,999 | 11 | 2.2% |
| $200,000+ | 0 | 0.0% |
Family Income by Famaliy Size in North Judson
4-person families (28 | 5.7%) account for the highest median family income in North Judson with $103,500 per family, while 4-person families (28 | 5.7%) have the highest median income of $25,875 per family member.
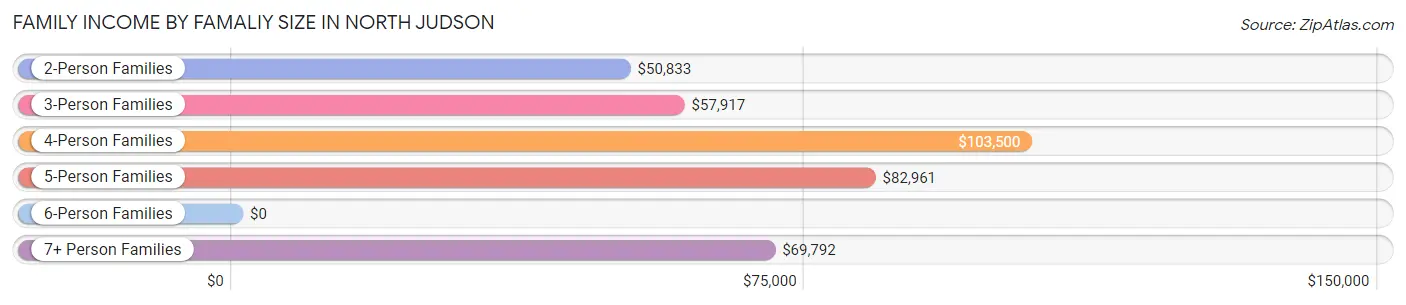
| Income Bracket | # Families | Median Income |
| 2-Person Families | 310 (62.9%) | $50,833 |
| 3-Person Families | 64 (13.0%) | $57,917 |
| 4-Person Families | 28 (5.7%) | $103,500 |
| 5-Person Families | 47 (9.5%) | $82,961 |
| 6-Person Families | 9 (1.8%) | $0 |
| 7+ Person Families | 35 (7.1%) | $69,792 |
| Total | 493 (100.0%) | $56,758 |
Family Income by Number of Earners in North Judson
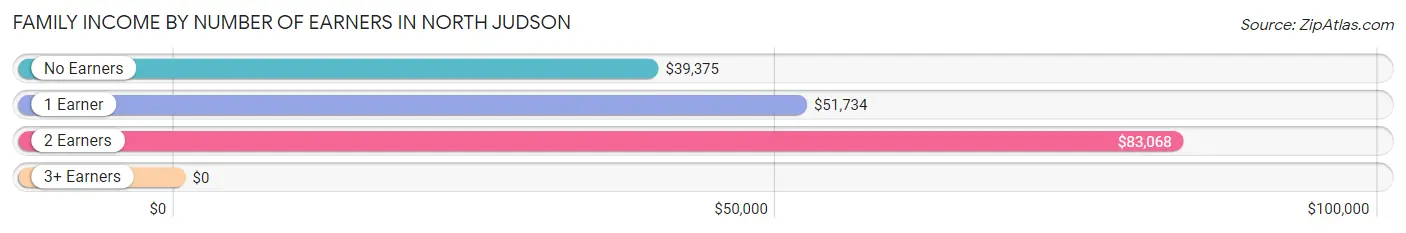
| Number of Earners | # Families | Median Income |
| No Earners | 117 (23.7%) | $39,375 |
| 1 Earner | 211 (42.8%) | $51,734 |
| 2 Earners | 149 (30.2%) | $83,068 |
| 3+ Earners | 16 (3.3%) | $0 |
| Total | 493 (100.0%) | $56,758 |
Household Income in North Judson
Household Income Brackets in North Judson
With 177 households falling in the category, the $50,000 to $74,999 income range is the most frequent in North Judson, accounting for 23.6% of all households. In contrast, only 5 households (0.7%) fall into the $200,000+ income bracket, making it the least populous group.
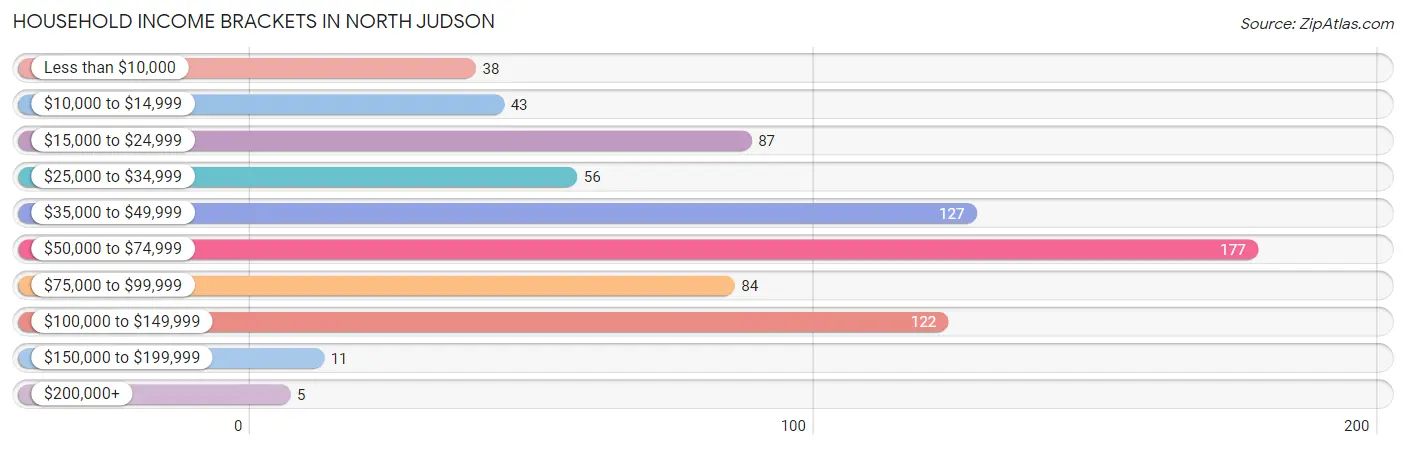
| Income Bracket | # Households | % Households |
| Less than $10,000 | 38 | 5.1% |
| $10,000 to $14,999 | 43 | 5.7% |
| $15,000 to $24,999 | 87 | 11.6% |
| $25,000 to $34,999 | 56 | 7.5% |
| $35,000 to $49,999 | 127 | 16.9% |
| $50,000 to $74,999 | 177 | 23.6% |
| $75,000 to $99,999 | 84 | 11.2% |
| $100,000 to $149,999 | 122 | 16.3% |
| $150,000 to $199,999 | 11 | 1.5% |
| $200,000+ | 5 | 0.7% |
Household Income by Householder Age in North Judson
The median household income in North Judson is $51,071, with the highest median household income of $59,219 found in the 25 to 44 years age bracket for the primary householder. A total of 233 households (31.1%) fall into this category. Meanwhile, the 15 to 24 years age bracket for the primary householder has the lowest median household income of $34,519, with 27 households (3.6%) in this group.
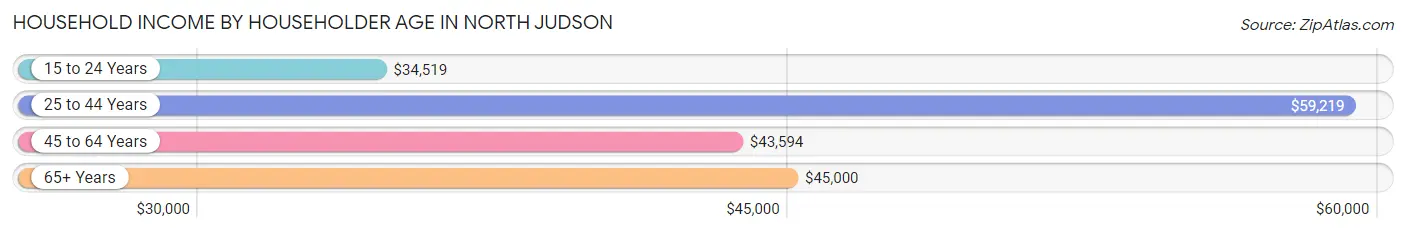
| Income Bracket | # Households | Median Income |
| 15 to 24 Years | 27 (3.6%) | $34,519 |
| 25 to 44 Years | 233 (31.1%) | $59,219 |
| 45 to 64 Years | 232 (30.9%) | $43,594 |
| 65+ Years | 258 (34.4%) | $45,000 |
| Total | 750 (100.0%) | $51,071 |
Poverty in North Judson
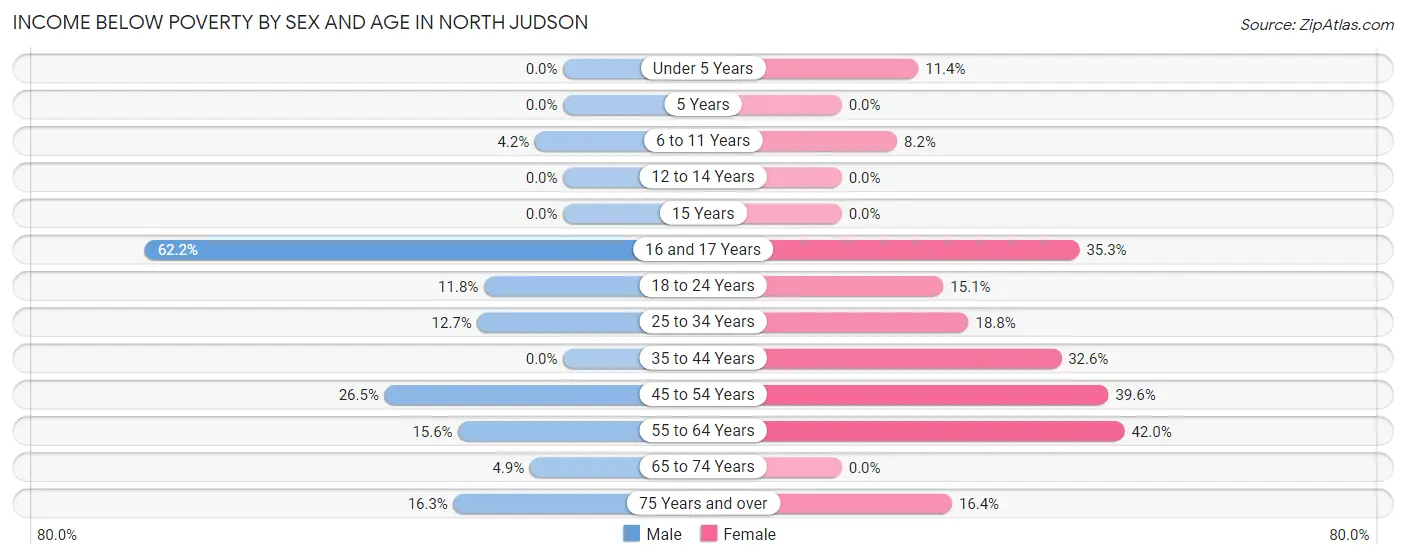
Income Below Poverty by Sex and Age in North Judson
With 12.0% poverty level for males and 21.1% for females among the residents of North Judson, 16 and 17 year old males and 55 to 64 year old females are the most vulnerable to poverty, with 23 males (62.2%) and 55 females (42.0%) in their respective age groups living below the poverty level.
| Age Bracket | Male | Female |
| Under 5 Years | 0 (0.0%) | 5 (11.4%) |
| 5 Years | 0 (0.0%) | 0 (0.0%) |
| 6 to 11 Years | 6 (4.2%) | 6 (8.2%) |
| 12 to 14 Years | 0 (0.0%) | 0 (0.0%) |
| 15 Years | 0 (0.0%) | 0 (0.0%) |
| 16 and 17 Years | 23 (62.2%) | 6 (35.3%) |
| 18 to 24 Years | 12 (11.8%) | 8 (15.1%) |
| 25 to 34 Years | 14 (12.7%) | 35 (18.8%) |
| 35 to 44 Years | 0 (0.0%) | 43 (32.6%) |
| 45 to 54 Years | 35 (26.5%) | 40 (39.6%) |
| 55 to 64 Years | 12 (15.6%) | 55 (42.0%) |
| 65 to 74 Years | 4 (4.9%) | 0 (0.0%) |
| 75 Years and over | 21 (16.3%) | 18 (16.4%) |
| Total | 127 (12.0%) | 216 (21.1%) |
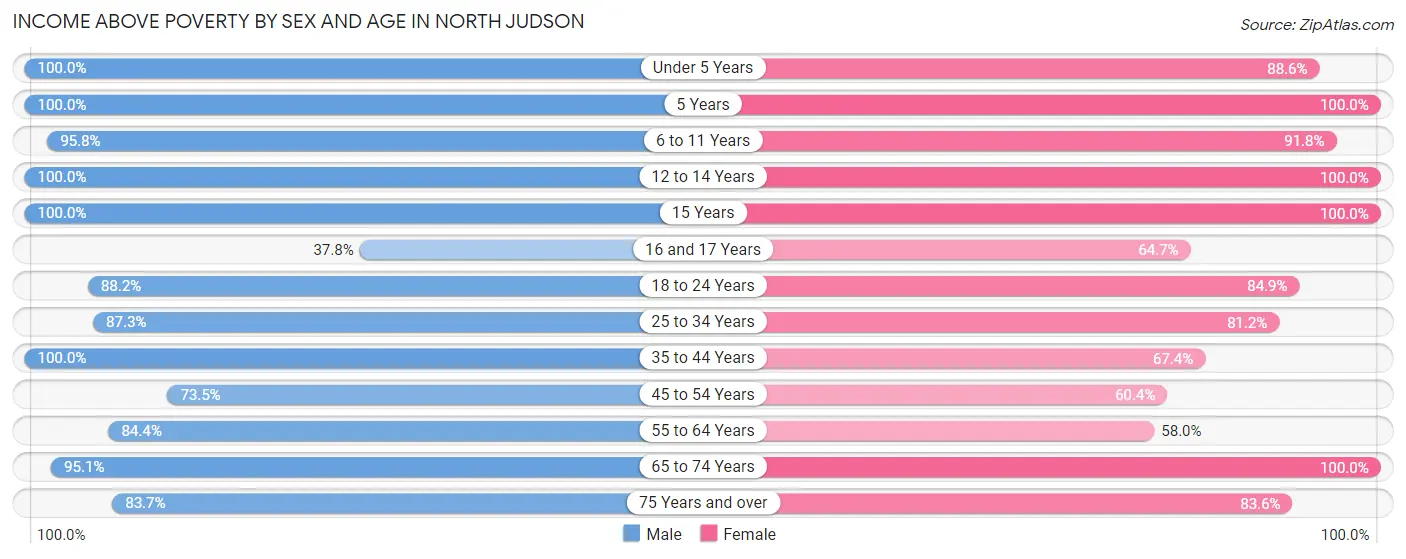
Income Above Poverty by Sex and Age in North Judson
According to the poverty statistics in North Judson, males aged under 5 years and females aged 5 years are the age groups that are most secure financially, with 100.0% of males and 100.0% of females in these age groups living above the poverty line.
| Age Bracket | Male | Female |
| Under 5 Years | 61 (100.0%) | 39 (88.6%) |
| 5 Years | 12 (100.0%) | 10 (100.0%) |
| 6 to 11 Years | 137 (95.8%) | 67 (91.8%) |
| 12 to 14 Years | 51 (100.0%) | 35 (100.0%) |
| 15 Years | 20 (100.0%) | 15 (100.0%) |
| 16 and 17 Years | 14 (37.8%) | 11 (64.7%) |
| 18 to 24 Years | 90 (88.2%) | 45 (84.9%) |
| 25 to 34 Years | 96 (87.3%) | 151 (81.2%) |
| 35 to 44 Years | 103 (100.0%) | 89 (67.4%) |
| 45 to 54 Years | 97 (73.5%) | 61 (60.4%) |
| 55 to 64 Years | 65 (84.4%) | 76 (58.0%) |
| 65 to 74 Years | 77 (95.1%) | 118 (100.0%) |
| 75 Years and over | 108 (83.7%) | 92 (83.6%) |
| Total | 931 (88.0%) | 809 (78.9%) |
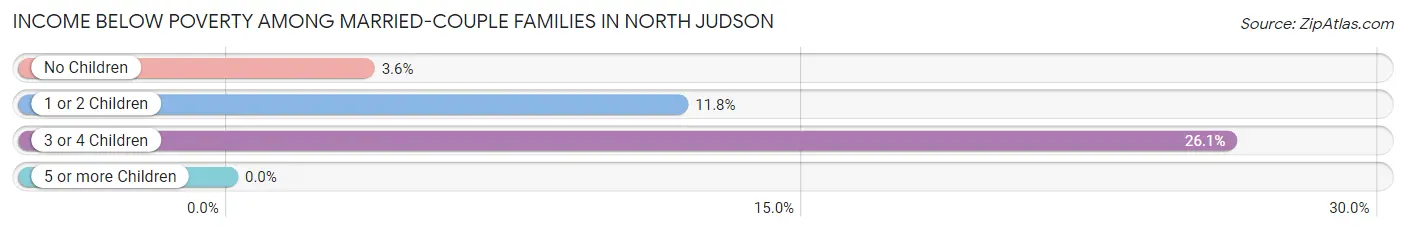
Income Below Poverty Among Married-Couple Families in North Judson
The poverty statistics for married-couple families in North Judson show that 8.2% or 27 of the total 328 families live below the poverty line. Families with 3 or 4 children have the highest poverty rate of 26.1%, comprising of 12 families. On the other hand, families with 5 or more children have the lowest poverty rate of 0.0%, which includes 0 families.
| Children | Above Poverty | Below Poverty |
| No Children | 189 (96.4%) | 7 (3.6%) |
| 1 or 2 Children | 60 (88.2%) | 8 (11.8%) |
| 3 or 4 Children | 34 (73.9%) | 12 (26.1%) |
| 5 or more Children | 18 (100.0%) | 0 (0.0%) |
| Total | 301 (91.8%) | 27 (8.2%) |
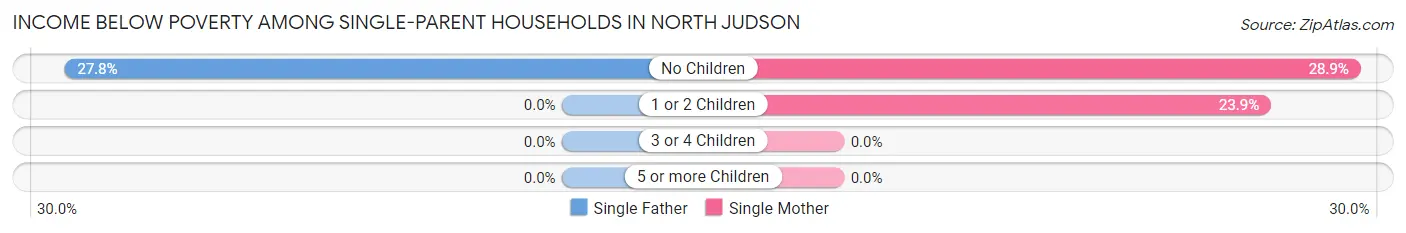
Income Below Poverty Among Single-Parent Households in North Judson
According to the poverty data in North Judson, 10.6% or 5 single-father households and 24.6% or 29 single-mother households are living below the poverty line. Among single-father households, those with no children have the highest poverty rate, with 5 households (27.8%) experiencing poverty. Likewise, among single-mother households, those with no children have the highest poverty rate, with 13 households (28.9%) falling below the poverty line.
| Children | Single Father | Single Mother |
| No Children | 5 (27.8%) | 13 (28.9%) |
| 1 or 2 Children | 0 (0.0%) | 16 (23.9%) |
| 3 or 4 Children | 0 (0.0%) | 0 (0.0%) |
| 5 or more Children | 0 (0.0%) | 0 (0.0%) |
| Total | 5 (10.6%) | 29 (24.6%) |
Income Below Poverty Among Married-Couple vs Single-Parent Households in North Judson
The poverty data for North Judson shows that 27 of the married-couple family households (8.2%) and 34 of the single-parent households (20.6%) are living below the poverty level. Within the married-couple family households, those with 3 or 4 children have the highest poverty rate, with 12 households (26.1%) falling below the poverty line. Among the single-parent households, those with no children have the highest poverty rate, with 18 household (28.6%) living below poverty.
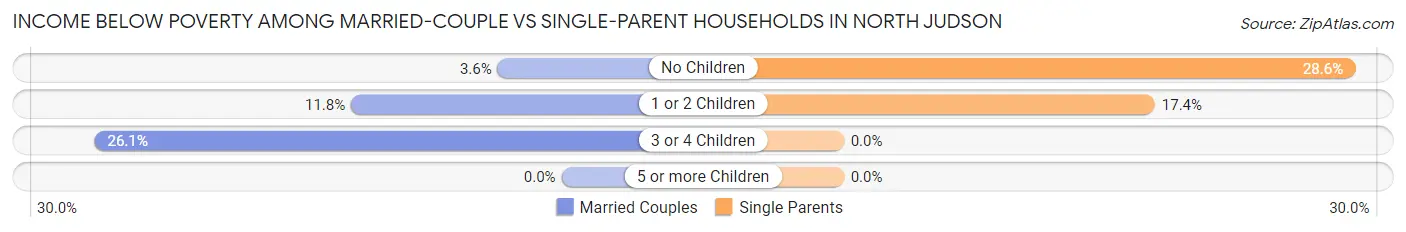
| Children | Married-Couple Families | Single-Parent Households |
| No Children | 7 (3.6%) | 18 (28.6%) |
| 1 or 2 Children | 8 (11.8%) | 16 (17.4%) |
| 3 or 4 Children | 12 (26.1%) | 0 (0.0%) |
| 5 or more Children | 0 (0.0%) | 0 (0.0%) |
| Total | 27 (8.2%) | 34 (20.6%) |
Race in North Judson
The most populous races in North Judson are White / Caucasian (2,005 | 95.5%), Hispanic or Latino (108 | 5.1%), and Asian (45 | 2.1%).
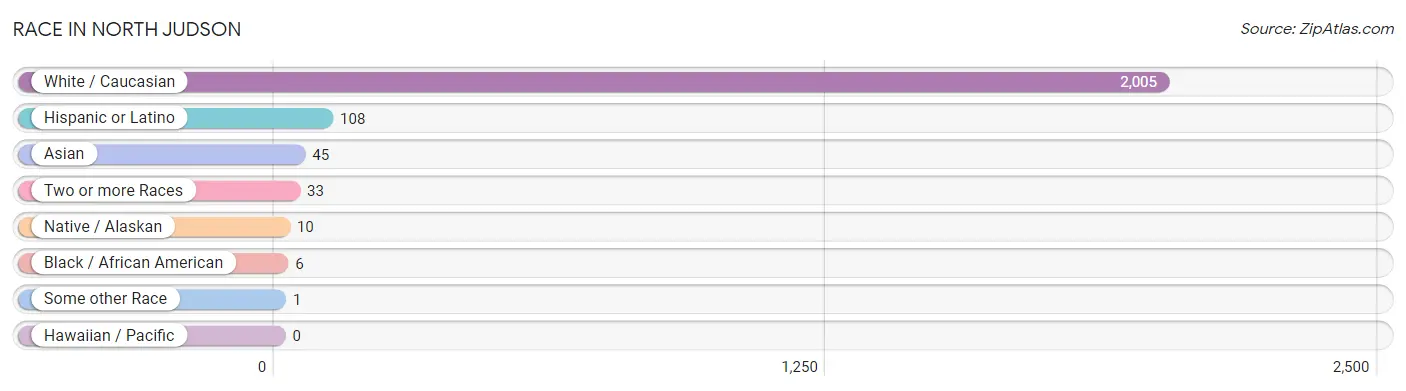
| Race | # Population | % Population |
| Asian | 45 | 2.1% |
| Black / African American | 6 | 0.3% |
| Hawaiian / Pacific | 0 | 0.0% |
| Hispanic or Latino | 108 | 5.1% |
| Native / Alaskan | 10 | 0.5% |
| White / Caucasian | 2,005 | 95.5% |
| Two or more Races | 33 | 1.6% |
| Some other Race | 1 | 0.1% |
| Total | 2,100 | 100.0% |
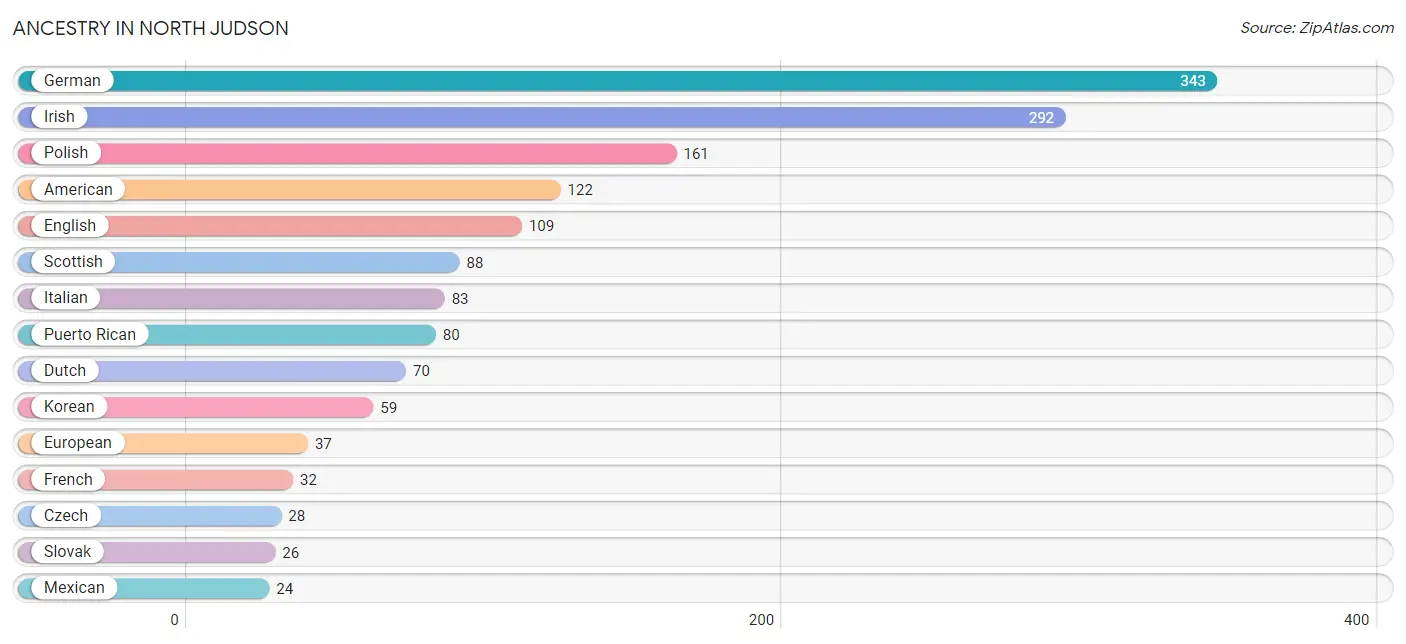
Ancestry in North Judson
The most populous ancestries reported in North Judson are German (343 | 16.3%), Irish (292 | 13.9%), Polish (161 | 7.7%), American (122 | 5.8%), and English (109 | 5.2%), together accounting for 48.9% of all North Judson residents.
| Ancestry | # Population | % Population |
| American | 122 | 5.8% |
| British | 12 | 0.6% |
| Cherokee | 10 | 0.5% |
| Croatian | 13 | 0.6% |
| Czech | 28 | 1.3% |
| Danish | 2 | 0.1% |
| Dutch | 70 | 3.3% |
| English | 109 | 5.2% |
| European | 37 | 1.8% |
| French | 32 | 1.5% |
| German | 343 | 16.3% |
| Hungarian | 9 | 0.4% |
| Irish | 292 | 13.9% |
| Italian | 83 | 4.0% |
| Korean | 59 | 2.8% |
| Lithuanian | 8 | 0.4% |
| Mexican | 24 | 1.1% |
| Mexican American Indian | 4 | 0.2% |
| Norwegian | 7 | 0.3% |
| Polish | 161 | 7.7% |
| Portuguese | 3 | 0.1% |
| Puerto Rican | 80 | 3.8% |
| Russian | 2 | 0.1% |
| Scandinavian | 8 | 0.4% |
| Scotch-Irish | 4 | 0.2% |
| Scottish | 88 | 4.2% |
| Slovak | 26 | 1.2% |
| Swedish | 4 | 0.2% | View All 28 Rows |
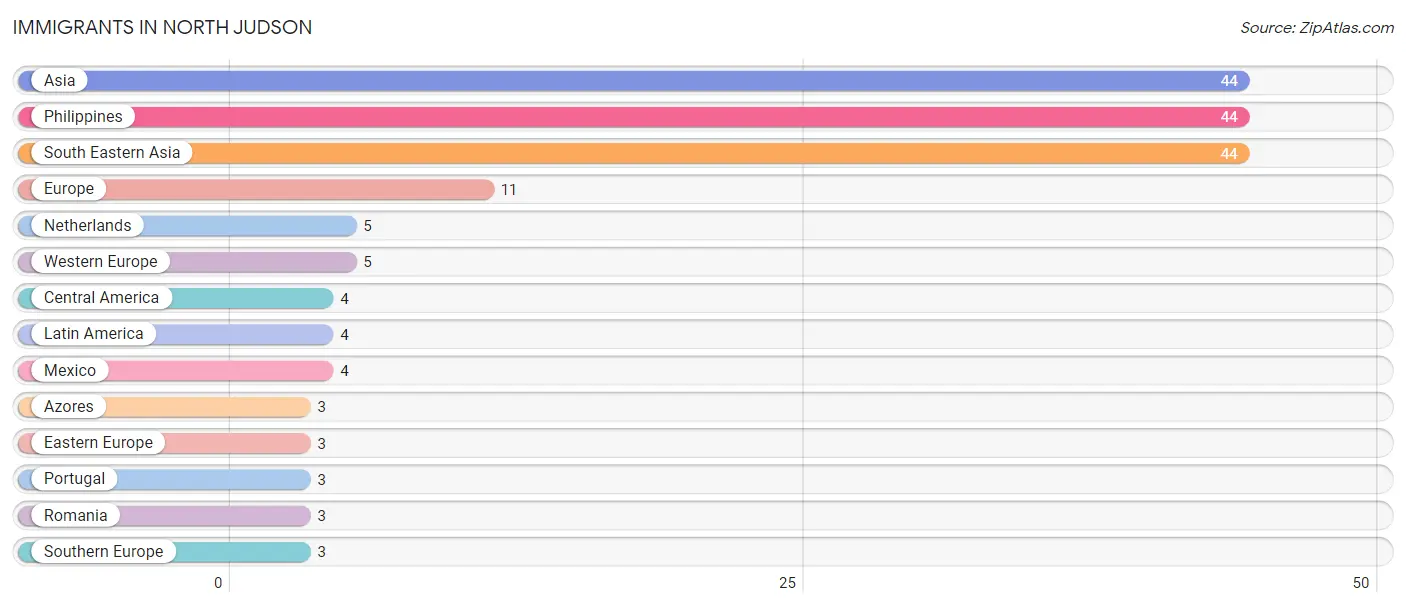
Immigrants in North Judson
The most numerous immigrant groups reported in North Judson came from Asia (44 | 2.1%), Philippines (44 | 2.1%), South Eastern Asia (44 | 2.1%), Europe (11 | 0.5%), and Netherlands (5 | 0.2%), together accounting for 7.1% of all North Judson residents.
| Immigration Origin | # Population | % Population |
| Asia | 44 | 2.1% |
| Azores | 3 | 0.1% |
| Central America | 4 | 0.2% |
| Eastern Europe | 3 | 0.1% |
| Europe | 11 | 0.5% |
| Latin America | 4 | 0.2% |
| Mexico | 4 | 0.2% |
| Netherlands | 5 | 0.2% |
| Philippines | 44 | 2.1% |
| Portugal | 3 | 0.1% |
| Romania | 3 | 0.1% |
| South Eastern Asia | 44 | 2.1% |
| Southern Europe | 3 | 0.1% |
| Western Europe | 5 | 0.2% | View All 14 Rows |
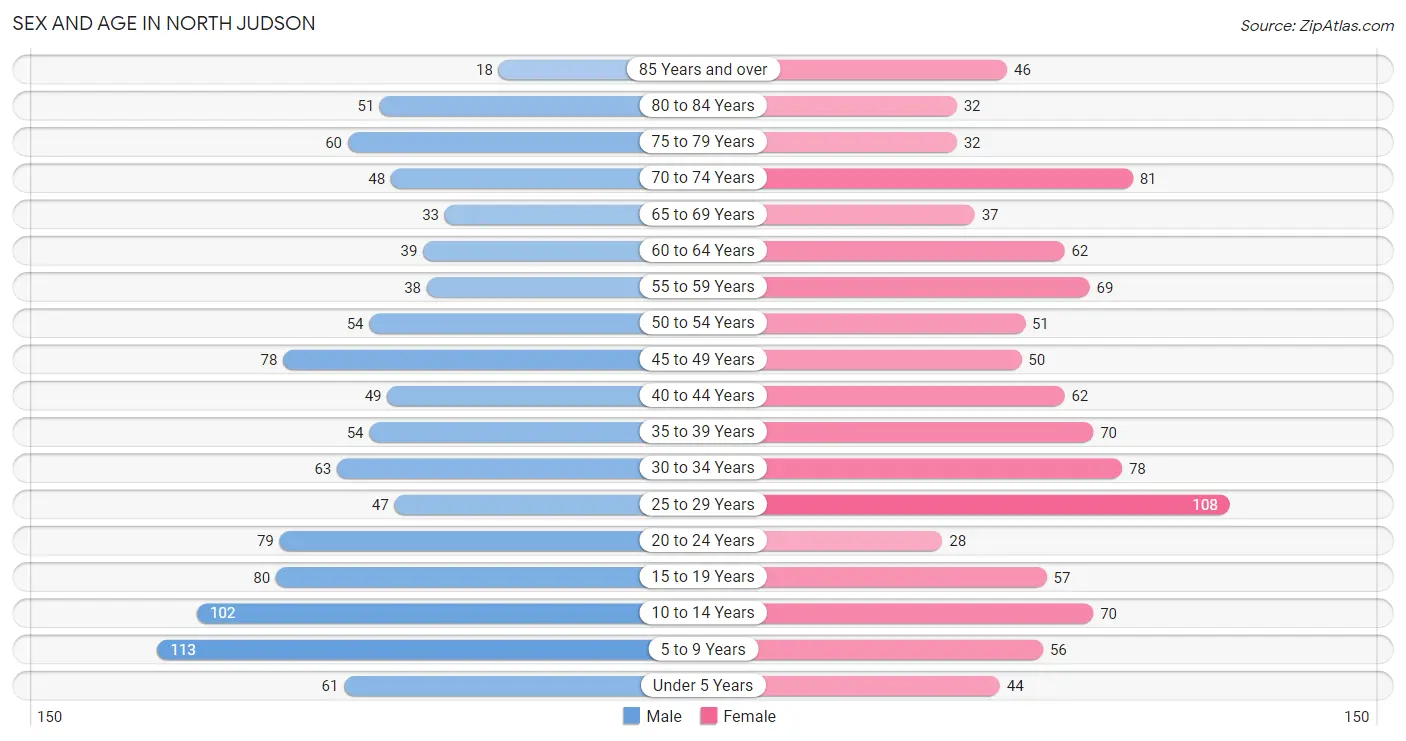
Sex and Age in North Judson
Sex and Age in North Judson
The most populous age groups in North Judson are 5 to 9 Years (113 | 10.6%) for men and 25 to 29 Years (108 | 10.4%) for women.
| Age Bracket | Male | Female |
| Under 5 Years | 61 (5.7%) | 44 (4.3%) |
| 5 to 9 Years | 113 (10.6%) | 56 (5.4%) |
| 10 to 14 Years | 102 (9.6%) | 70 (6.8%) |
| 15 to 19 Years | 80 (7.5%) | 57 (5.5%) |
| 20 to 24 Years | 79 (7.4%) | 28 (2.7%) |
| 25 to 29 Years | 47 (4.4%) | 108 (10.4%) |
| 30 to 34 Years | 63 (5.9%) | 78 (7.5%) |
| 35 to 39 Years | 54 (5.1%) | 70 (6.8%) |
| 40 to 44 Years | 49 (4.6%) | 62 (6.0%) |
| 45 to 49 Years | 78 (7.3%) | 50 (4.8%) |
| 50 to 54 Years | 54 (5.1%) | 51 (4.9%) |
| 55 to 59 Years | 38 (3.6%) | 69 (6.7%) |
| 60 to 64 Years | 39 (3.7%) | 62 (6.0%) |
| 65 to 69 Years | 33 (3.1%) | 37 (3.6%) |
| 70 to 74 Years | 48 (4.5%) | 81 (7.8%) |
| 75 to 79 Years | 60 (5.6%) | 32 (3.1%) |
| 80 to 84 Years | 51 (4.8%) | 32 (3.1%) |
| 85 Years and over | 18 (1.7%) | 46 (4.4%) |
| Total | 1,067 (100.0%) | 1,033 (100.0%) |
Families and Households in North Judson
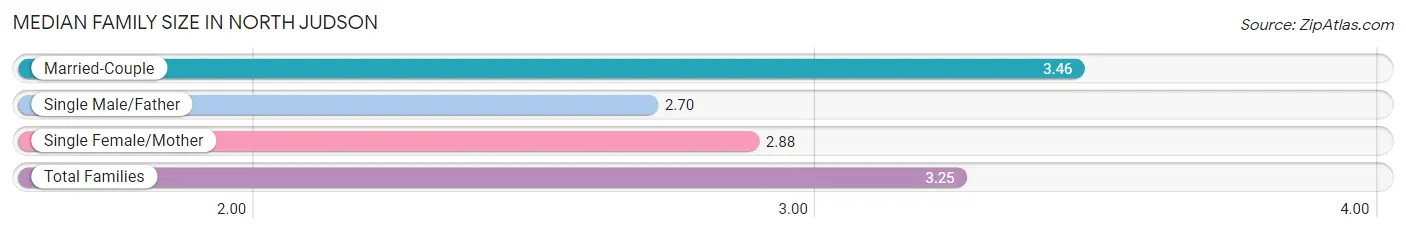
Median Family Size in North Judson
The median family size in North Judson is 3.25 persons per family, with married-couple families (328 | 66.5%) accounting for the largest median family size of 3.46 persons per family. On the other hand, single male/father families (47 | 9.5%) represent the smallest median family size with 2.70 persons per family.
| Family Type | # Families | Family Size |
| Married-Couple | 328 (66.5%) | 3.46 |
| Single Male/Father | 47 (9.5%) | 2.70 |
| Single Female/Mother | 118 (23.9%) | 2.88 |
| Total Families | 493 (100.0%) | 3.25 |
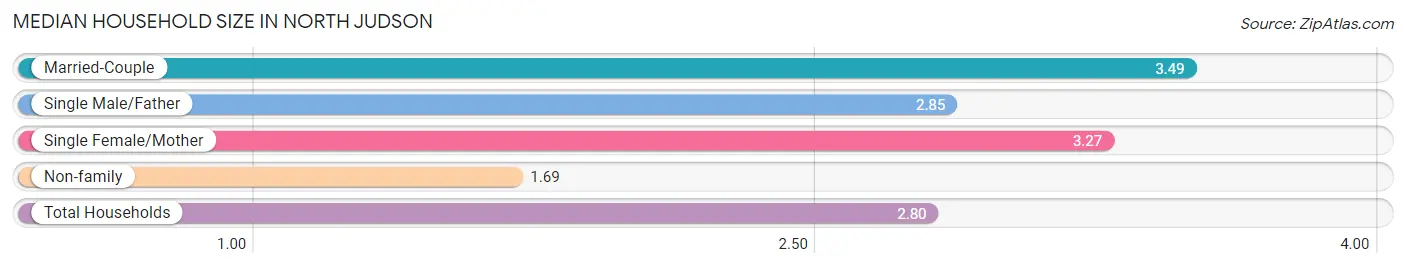
Median Household Size in North Judson
The median household size in North Judson is 2.80 persons per household, with married-couple households (328 | 43.7%) accounting for the largest median household size of 3.49 persons per household. non-family households (257 | 34.3%) represent the smallest median household size with 1.69 persons per household.
| Household Type | # Households | Household Size |
| Married-Couple | 328 (43.7%) | 3.49 |
| Single Male/Father | 47 (6.3%) | 2.85 |
| Single Female/Mother | 118 (15.7%) | 3.27 |
| Non-family | 257 (34.3%) | 1.69 |
| Total Households | 750 (100.0%) | 2.80 |
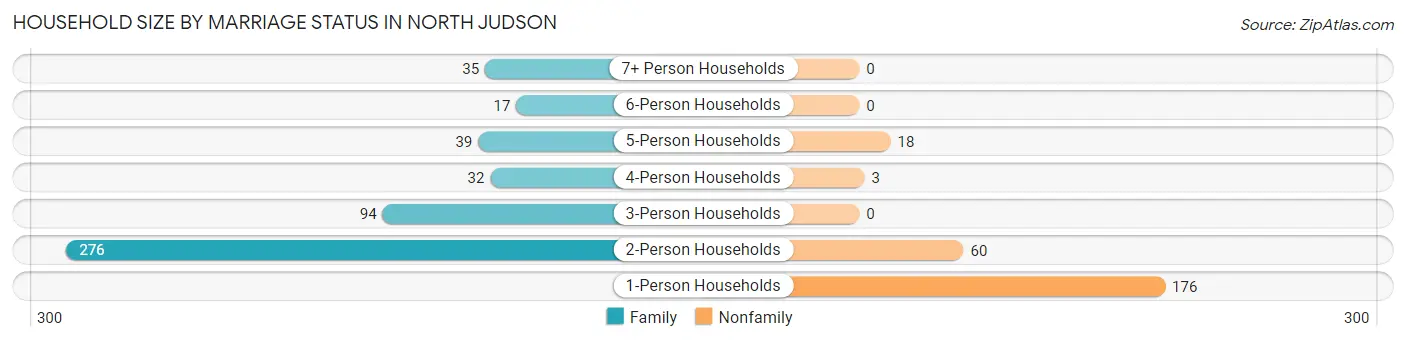
Household Size by Marriage Status in North Judson
Out of a total of 750 households in North Judson, 493 (65.7%) are family households, while 257 (34.3%) are nonfamily households. The most numerous type of family households are 2-person households, comprising 276, and the most common type of nonfamily households are 1-person households, comprising 176.
| Household Size | Family Households | Nonfamily Households |
| 1-Person Households | - | 176 (23.5%) |
| 2-Person Households | 276 (36.8%) | 60 (8.0%) |
| 3-Person Households | 94 (12.5%) | 0 (0.0%) |
| 4-Person Households | 32 (4.3%) | 3 (0.4%) |
| 5-Person Households | 39 (5.2%) | 18 (2.4%) |
| 6-Person Households | 17 (2.3%) | 0 (0.0%) |
| 7+ Person Households | 35 (4.7%) | 0 (0.0%) |
| Total | 493 (65.7%) | 257 (34.3%) |
Female Fertility in North Judson
Fertility by Age in North Judson
Average fertility rate in North Judson is 86.0 births per 1,000 women. Women in the age bracket of 20 to 34 years have the highest fertility rate with 117.0 births per 1,000 women. Women in the age bracket of 20 to 34 years acount for 62.5% of all women with births.
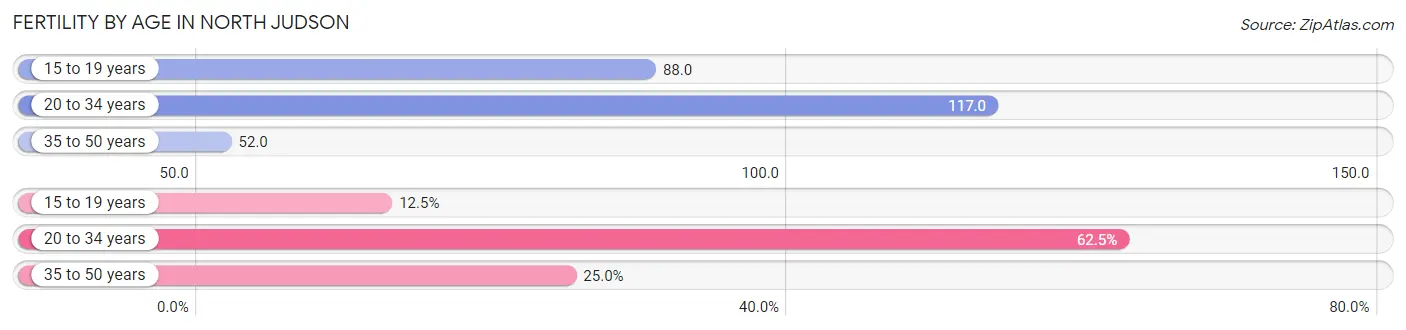
| Age Bracket | Women with Births | Births / 1,000 Women |
| 15 to 19 years | 5 (12.5%) | 88.0 |
| 20 to 34 years | 25 (62.5%) | 117.0 |
| 35 to 50 years | 10 (25.0%) | 52.0 |
| Total | 40 (100.0%) | 86.0 |
Fertility by Age by Marriage Status in North Judson
82.5% of women with births (40) in North Judson are married. The highest percentage of unmarried women with births falls into 20 to 34 years age bracket with 28.0% of them unmarried at the time of birth, while the lowest percentage of unmarried women with births belong to 15 to 19 years age bracket with 0.0% of them unmarried.
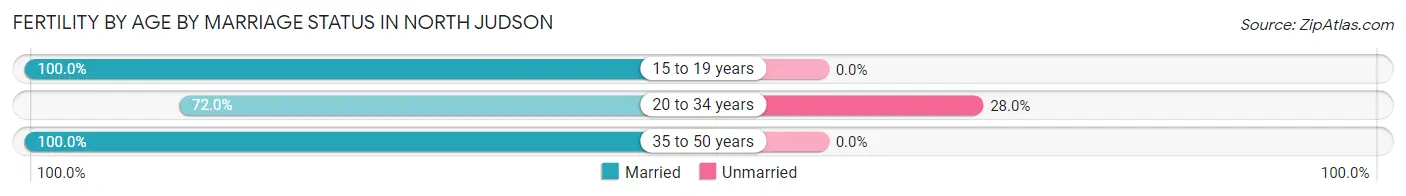
| Age Bracket | Married | Unmarried |
| 15 to 19 years | 5 (100.0%) | 0 (0.0%) |
| 20 to 34 years | 18 (72.0%) | 7 (28.0%) |
| 35 to 50 years | 10 (100.0%) | 0 (0.0%) |
| Total | 33 (82.5%) | 7 (17.5%) |
Fertility by Education in North Judson
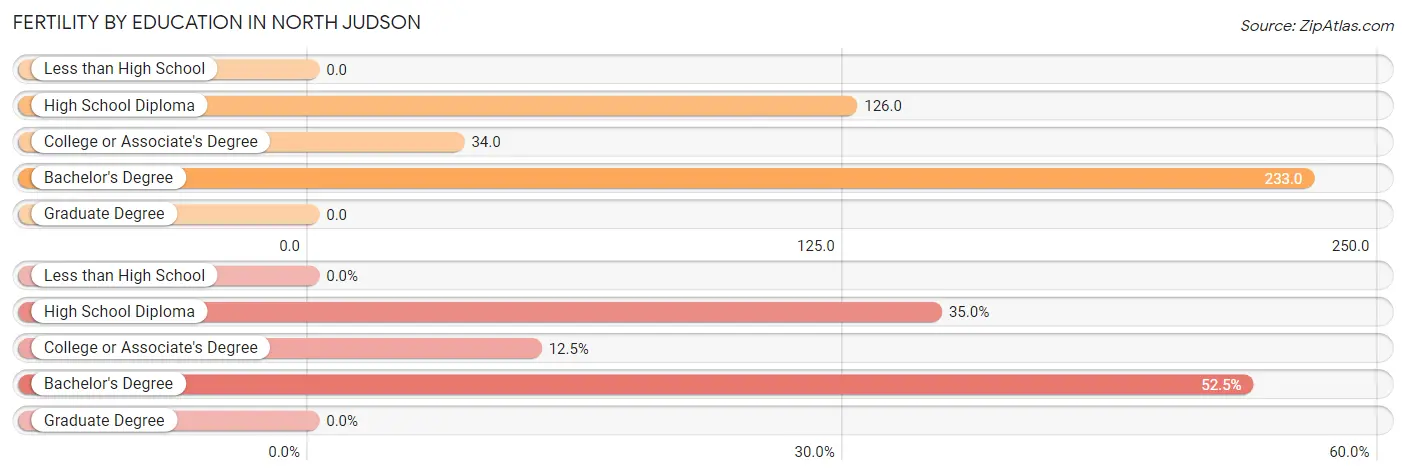
| Educational Attainment | Women with Births | Births / 1,000 Women |
| Less than High School | 0 (0.0%) | 0.0 |
| High School Diploma | 14 (35.0%) | 126.0 |
| College or Associate's Degree | 5 (12.5%) | 34.0 |
| Bachelor's Degree | 21 (52.5%) | 233.0 |
| Graduate Degree | 0 (0.0%) | 0.0 |
| Total | 40 (100.0%) | 86.0 |
Fertility by Education by Marriage Status in North Judson
17.5% of women with births in North Judson are unmarried. Women with the educational attainment of college or associate's degree are most likely to be married with 100.0% of them married at childbirth, while women with the educational attainment of high school diploma are least likely to be married with 50.0% of them unmarried at childbirth.
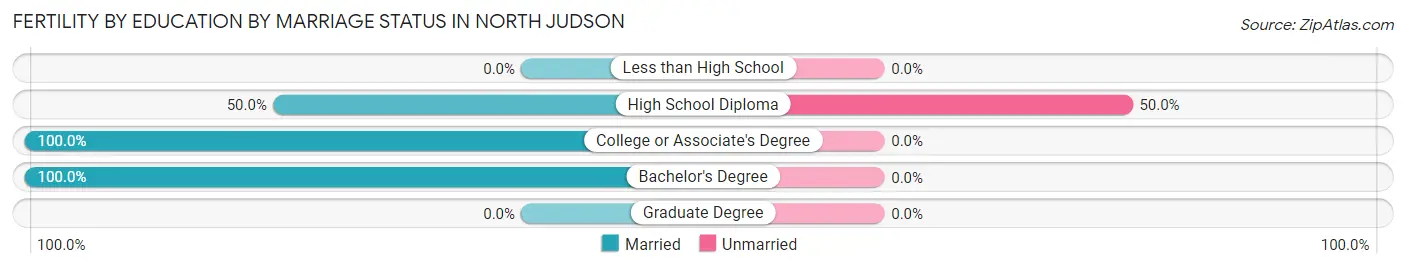
| Educational Attainment | Married | Unmarried |
| Less than High School | 0 (0.0%) | 0 (0.0%) |
| High School Diploma | 7 (50.0%) | 7 (50.0%) |
| College or Associate's Degree | 5 (100.0%) | 0 (0.0%) |
| Bachelor's Degree | 21 (100.0%) | 0 (0.0%) |
| Graduate Degree | 0 (0.0%) | 0 (0.0%) |
| Total | 33 (82.5%) | 7 (17.5%) |
Employment Characteristics in North Judson
Employment by Class of Employer in North Judson
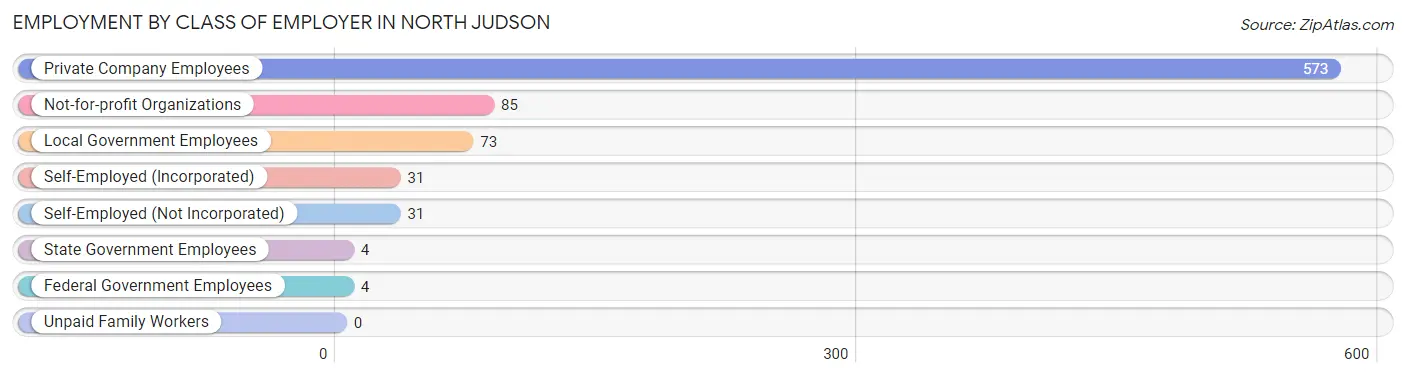
Among the 801 employed individuals in North Judson, private company employees (573 | 71.5%), not-for-profit organizations (85 | 10.6%), and local government employees (73 | 9.1%) make up the most common classes of employment.
| Employer Class | # Employees | % Employees |
| Private Company Employees | 573 | 71.5% |
| Self-Employed (Incorporated) | 31 | 3.9% |
| Self-Employed (Not Incorporated) | 31 | 3.9% |
| Not-for-profit Organizations | 85 | 10.6% |
| Local Government Employees | 73 | 9.1% |
| State Government Employees | 4 | 0.5% |
| Federal Government Employees | 4 | 0.5% |
| Unpaid Family Workers | 0 | 0.0% |
| Total | 801 | 100.0% |
Employment Status by Age in North Judson
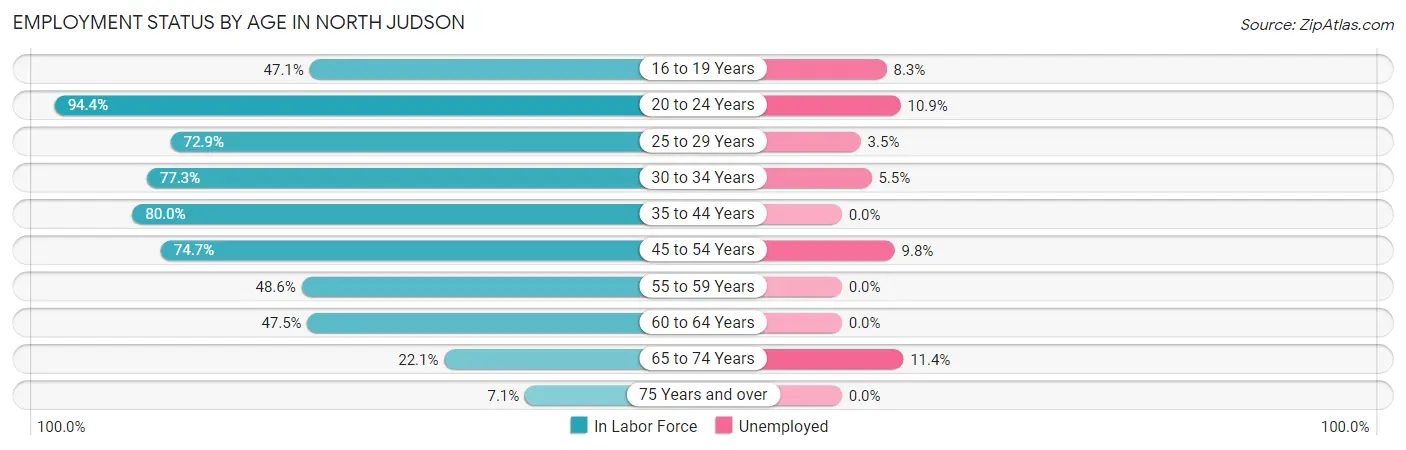
According to the labor force statistics for North Judson, out of the total population over 16 years of age (1,619), 55.2% or 894 individuals are in the labor force, with 5.3% or 47 of them unemployed. The age group with the highest labor force participation rate is 20 to 24 years, with 94.4% or 101 individuals in the labor force. Within the labor force, the 65 to 74 years age range has the highest percentage of unemployed individuals, with 11.4% or 5 of them being unemployed.
| Age Bracket | In Labor Force | Unemployed |
| 16 to 19 Years | 48 (47.1%) | 4 (8.3%) |
| 20 to 24 Years | 101 (94.4%) | 11 (10.9%) |
| 25 to 29 Years | 113 (72.9%) | 4 (3.5%) |
| 30 to 34 Years | 109 (77.3%) | 6 (5.5%) |
| 35 to 44 Years | 188 (80.0%) | 0 (0.0%) |
| 45 to 54 Years | 174 (74.7%) | 17 (9.8%) |
| 55 to 59 Years | 52 (48.6%) | 0 (0.0%) |
| 60 to 64 Years | 48 (47.5%) | 0 (0.0%) |
| 65 to 74 Years | 44 (22.1%) | 5 (11.4%) |
| 75 Years and over | 17 (7.1%) | 0 (0.0%) |
| Total | 894 (55.2%) | 47 (5.3%) |
Employment Status by Educational Attainment in North Judson
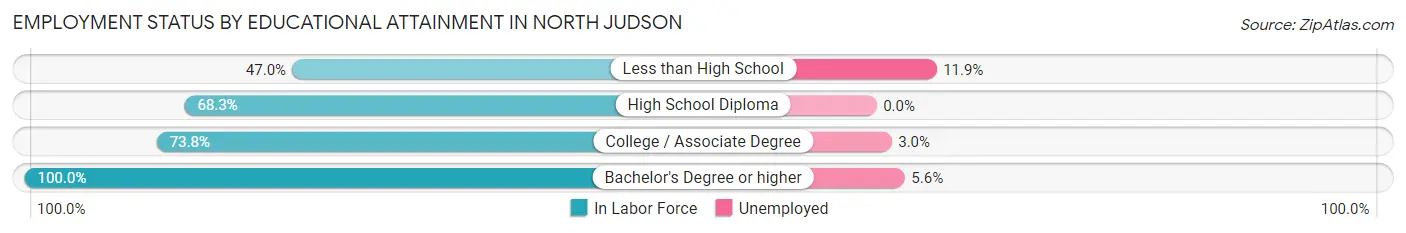
According to labor force statistics for North Judson, 70.4% of individuals (684) out of the total population between 25 and 64 years of age (972) are in the labor force, with 3.9% or 27 of them being unemployed. The group with the highest labor force participation rate are those with the educational attainment of bachelor's degree or higher, with 100.0% or 161 individuals in the labor force. Within the labor force, individuals with less than high school education have the highest percentage of unemployment, with 11.9% or 12 of them being unemployed.
| Educational Attainment | In Labor Force | Unemployed |
| Less than High School | 101 (47.0%) | 26 (11.9%) |
| High School Diploma | 222 (68.3%) | 0 (0.0%) |
| College / Associate Degree | 200 (73.8%) | 8 (3.0%) |
| Bachelor's Degree or higher | 161 (100.0%) | 9 (5.6%) |
| Total | 684 (70.4%) | 38 (3.9%) |
Employment Occupations by Sex in North Judson
Management, Business, Science and Arts Occupations
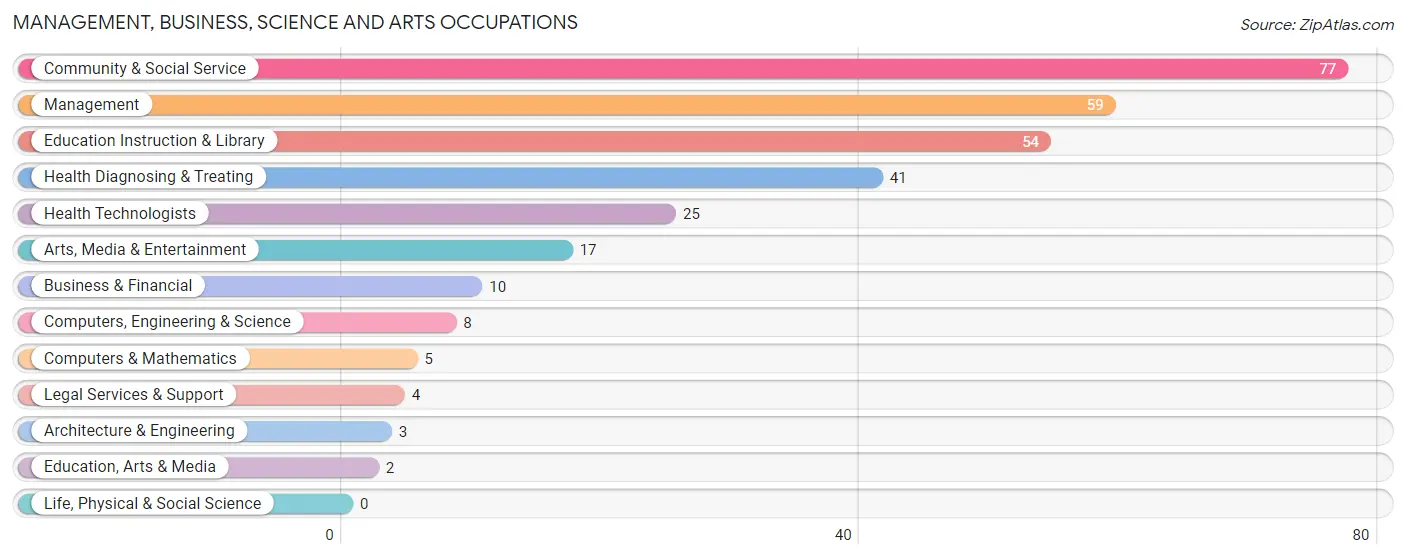
The most common Management, Business, Science and Arts occupations in North Judson are Community & Social Service (77 | 9.1%), Management (59 | 7.0%), Education Instruction & Library (54 | 6.4%), Health Diagnosing & Treating (41 | 4.8%), and Health Technologists (25 | 2.9%).
Management, Business, Science and Arts Occupations by Sex
Within the Management, Business, Science and Arts occupations in North Judson, the most male-oriented occupations are Computers, Engineering & Science (100.0%), Computers & Mathematics (100.0%), and Architecture & Engineering (100.0%), while the most female-oriented occupations are Business & Financial (100.0%), Education, Arts & Media (100.0%), and Health Diagnosing & Treating (82.9%).
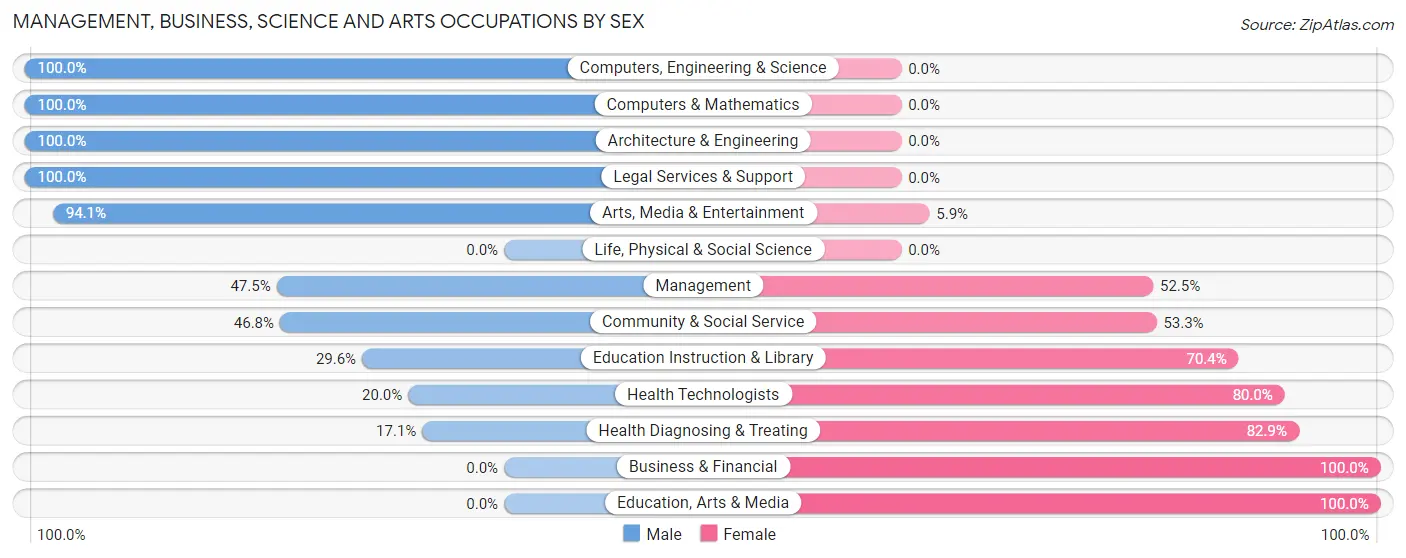
| Occupation | Male | Female |
| Management | 28 (47.5%) | 31 (52.5%) |
| Business & Financial | 0 (0.0%) | 10 (100.0%) |
| Computers, Engineering & Science | 8 (100.0%) | 0 (0.0%) |
| Computers & Mathematics | 5 (100.0%) | 0 (0.0%) |
| Architecture & Engineering | 3 (100.0%) | 0 (0.0%) |
| Life, Physical & Social Science | 0 (0.0%) | 0 (0.0%) |
| Community & Social Service | 36 (46.8%) | 41 (53.2%) |
| Education, Arts & Media | 0 (0.0%) | 2 (100.0%) |
| Legal Services & Support | 4 (100.0%) | 0 (0.0%) |
| Education Instruction & Library | 16 (29.6%) | 38 (70.4%) |
| Arts, Media & Entertainment | 16 (94.1%) | 1 (5.9%) |
| Health Diagnosing & Treating | 7 (17.1%) | 34 (82.9%) |
| Health Technologists | 5 (20.0%) | 20 (80.0%) |
| Total (Category) | 79 (40.5%) | 116 (59.5%) |
| Total (Overall) | 457 (54.0%) | 390 (46.0%) |
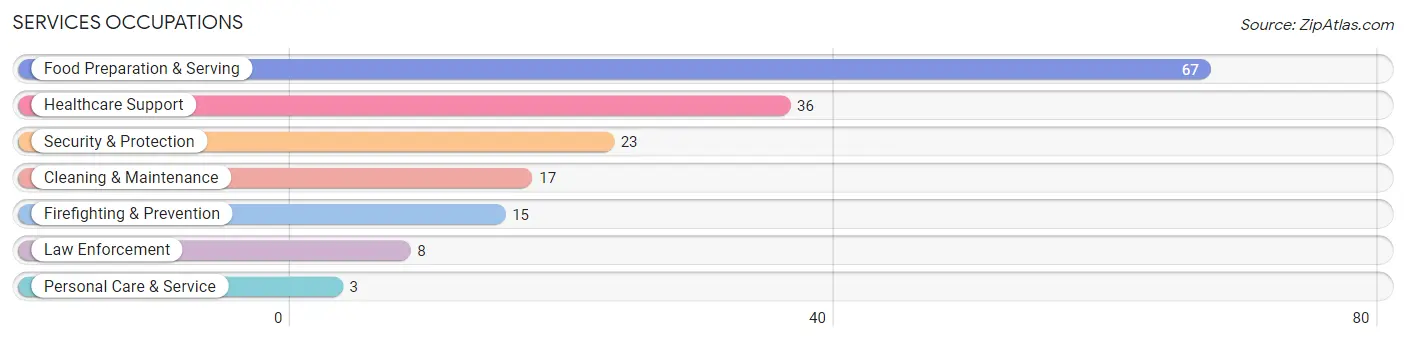
Services Occupations
The most common Services occupations in North Judson are Food Preparation & Serving (67 | 7.9%), Healthcare Support (36 | 4.3%), Security & Protection (23 | 2.7%), Cleaning & Maintenance (17 | 2.0%), and Firefighting & Prevention (15 | 1.8%).
Services Occupations by Sex
Within the Services occupations in North Judson, the most male-oriented occupations are Firefighting & Prevention (86.7%), Security & Protection (73.9%), and Law Enforcement (50.0%), while the most female-oriented occupations are Healthcare Support (100.0%), Personal Care & Service (100.0%), and Cleaning & Maintenance (64.7%).
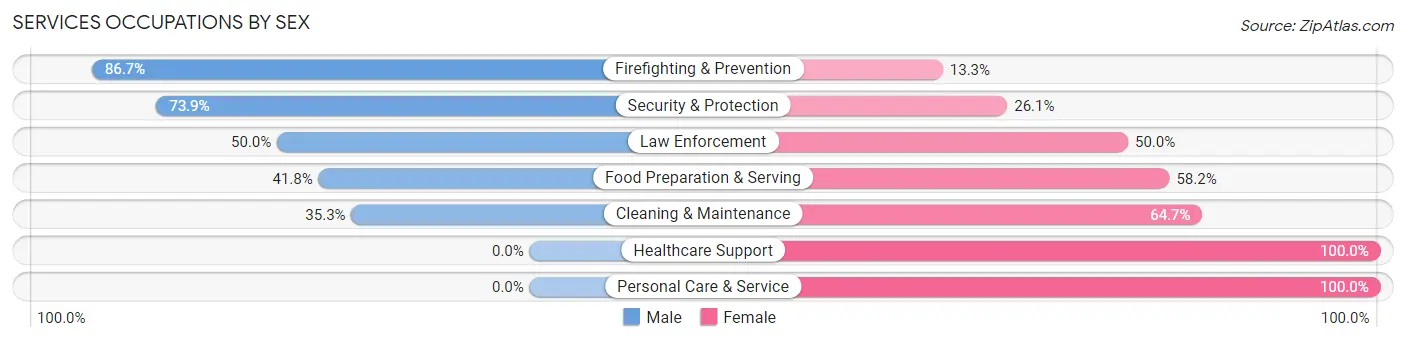
| Occupation | Male | Female |
| Healthcare Support | 0 (0.0%) | 36 (100.0%) |
| Security & Protection | 17 (73.9%) | 6 (26.1%) |
| Firefighting & Prevention | 13 (86.7%) | 2 (13.3%) |
| Law Enforcement | 4 (50.0%) | 4 (50.0%) |
| Food Preparation & Serving | 28 (41.8%) | 39 (58.2%) |
| Cleaning & Maintenance | 6 (35.3%) | 11 (64.7%) |
| Personal Care & Service | 0 (0.0%) | 3 (100.0%) |
| Total (Category) | 51 (34.9%) | 95 (65.1%) |
| Total (Overall) | 457 (54.0%) | 390 (46.0%) |
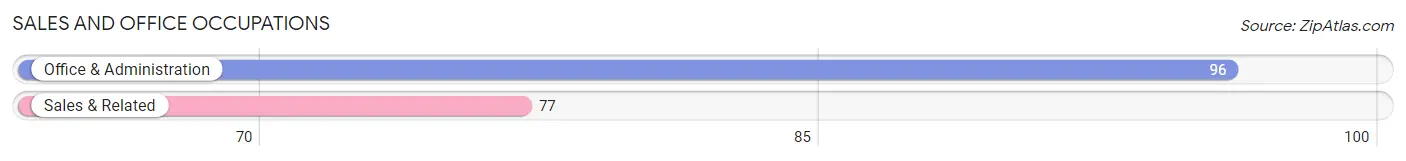
Sales and Office Occupations
The most common Sales and Office occupations in North Judson are Office & Administration (96 | 11.3%), and Sales & Related (77 | 9.1%).
Sales and Office Occupations by Sex

| Occupation | Male | Female |
| Sales & Related | 23 (29.9%) | 54 (70.1%) |
| Office & Administration | 25 (26.0%) | 71 (74.0%) |
| Total (Category) | 48 (27.8%) | 125 (72.3%) |
| Total (Overall) | 457 (54.0%) | 390 (46.0%) |
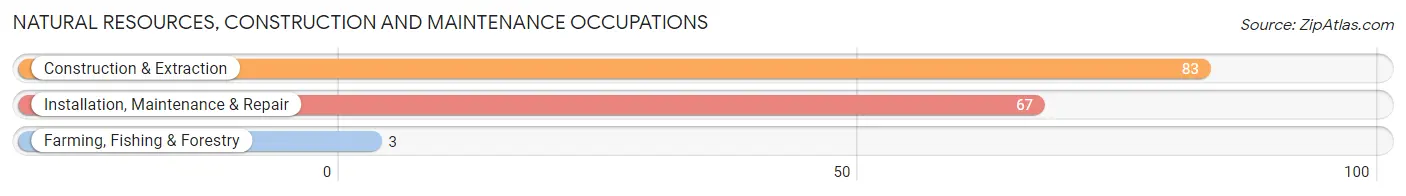
Natural Resources, Construction and Maintenance Occupations
The most common Natural Resources, Construction and Maintenance occupations in North Judson are Construction & Extraction (83 | 9.8%), Installation, Maintenance & Repair (67 | 7.9%), and Farming, Fishing & Forestry (3 | 0.4%).
Natural Resources, Construction and Maintenance Occupations by Sex
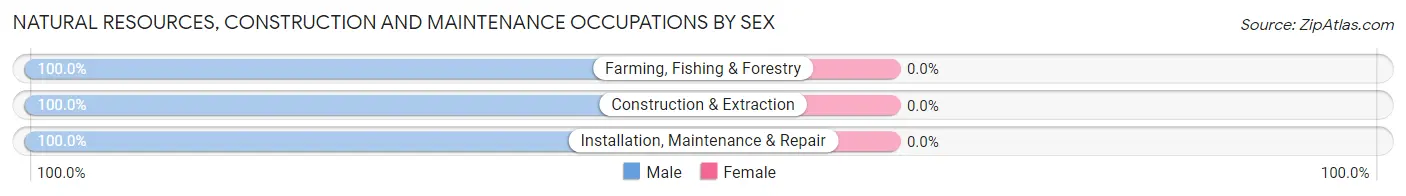
| Occupation | Male | Female |
| Farming, Fishing & Forestry | 3 (100.0%) | 0 (0.0%) |
| Construction & Extraction | 83 (100.0%) | 0 (0.0%) |
| Installation, Maintenance & Repair | 67 (100.0%) | 0 (0.0%) |
| Total (Category) | 153 (100.0%) | 0 (0.0%) |
| Total (Overall) | 457 (54.0%) | 390 (46.0%) |
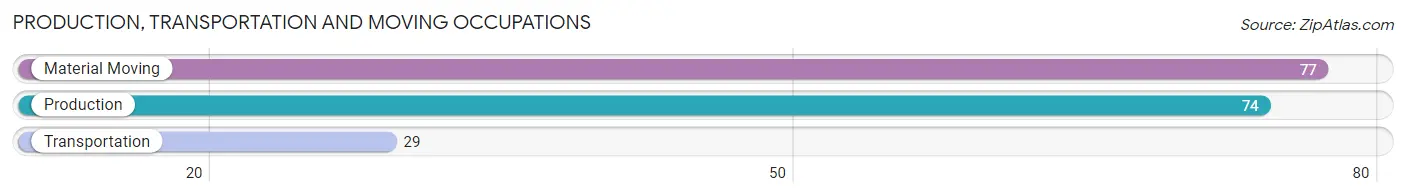
Production, Transportation and Moving Occupations
The most common Production, Transportation and Moving occupations in North Judson are Material Moving (77 | 9.1%), Production (74 | 8.7%), and Transportation (29 | 3.4%).
Production, Transportation and Moving Occupations by Sex
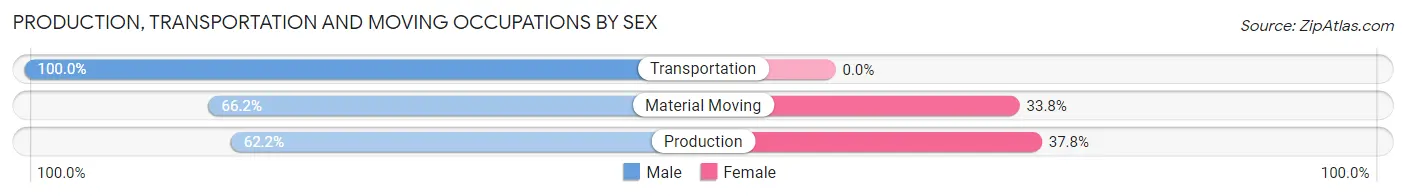
| Occupation | Male | Female |
| Production | 46 (62.2%) | 28 (37.8%) |
| Transportation | 29 (100.0%) | 0 (0.0%) |
| Material Moving | 51 (66.2%) | 26 (33.8%) |
| Total (Category) | 126 (70.0%) | 54 (30.0%) |
| Total (Overall) | 457 (54.0%) | 390 (46.0%) |
Employment Industries by Sex in North Judson
Employment Industries in North Judson
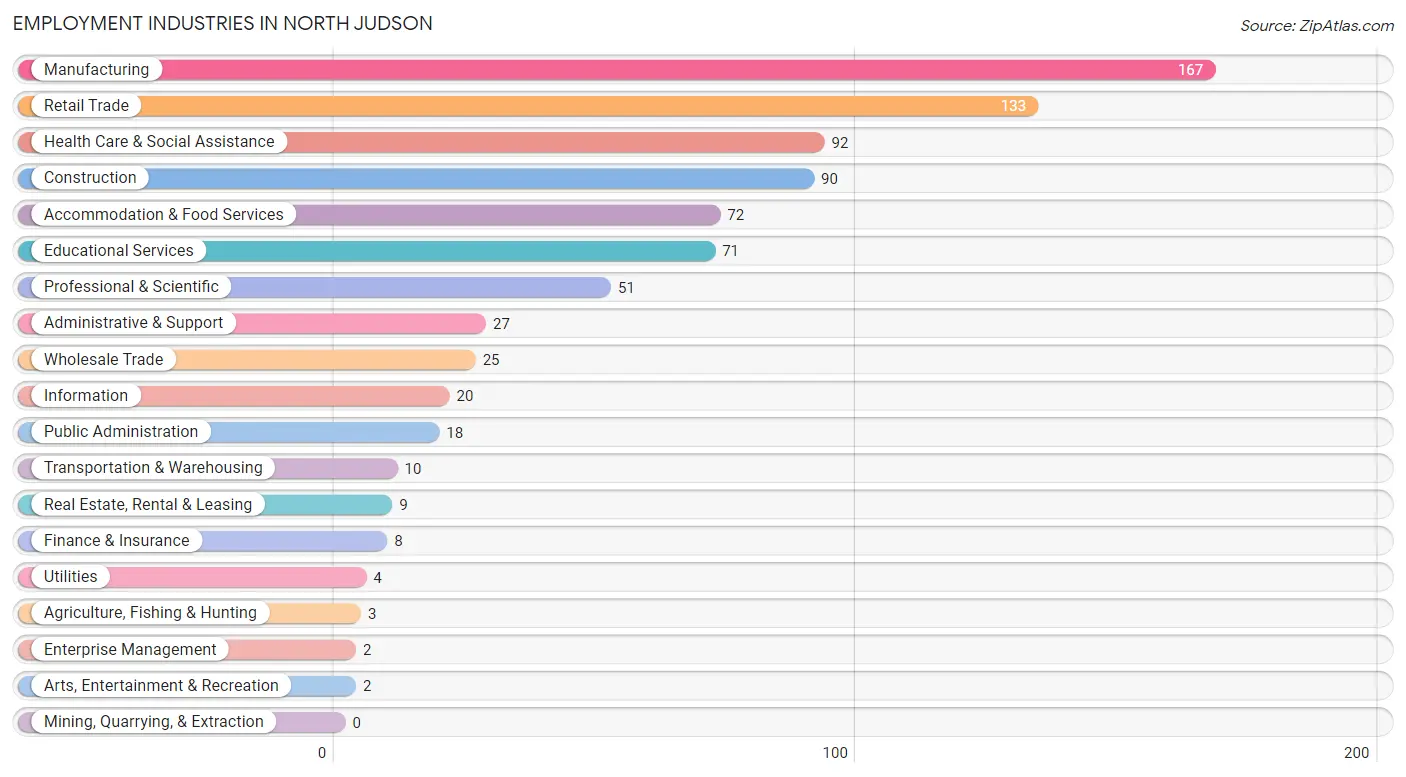
The major employment industries in North Judson include Manufacturing (167 | 19.7%), Retail Trade (133 | 15.7%), Health Care & Social Assistance (92 | 10.9%), Construction (90 | 10.6%), and Accommodation & Food Services (72 | 8.5%).
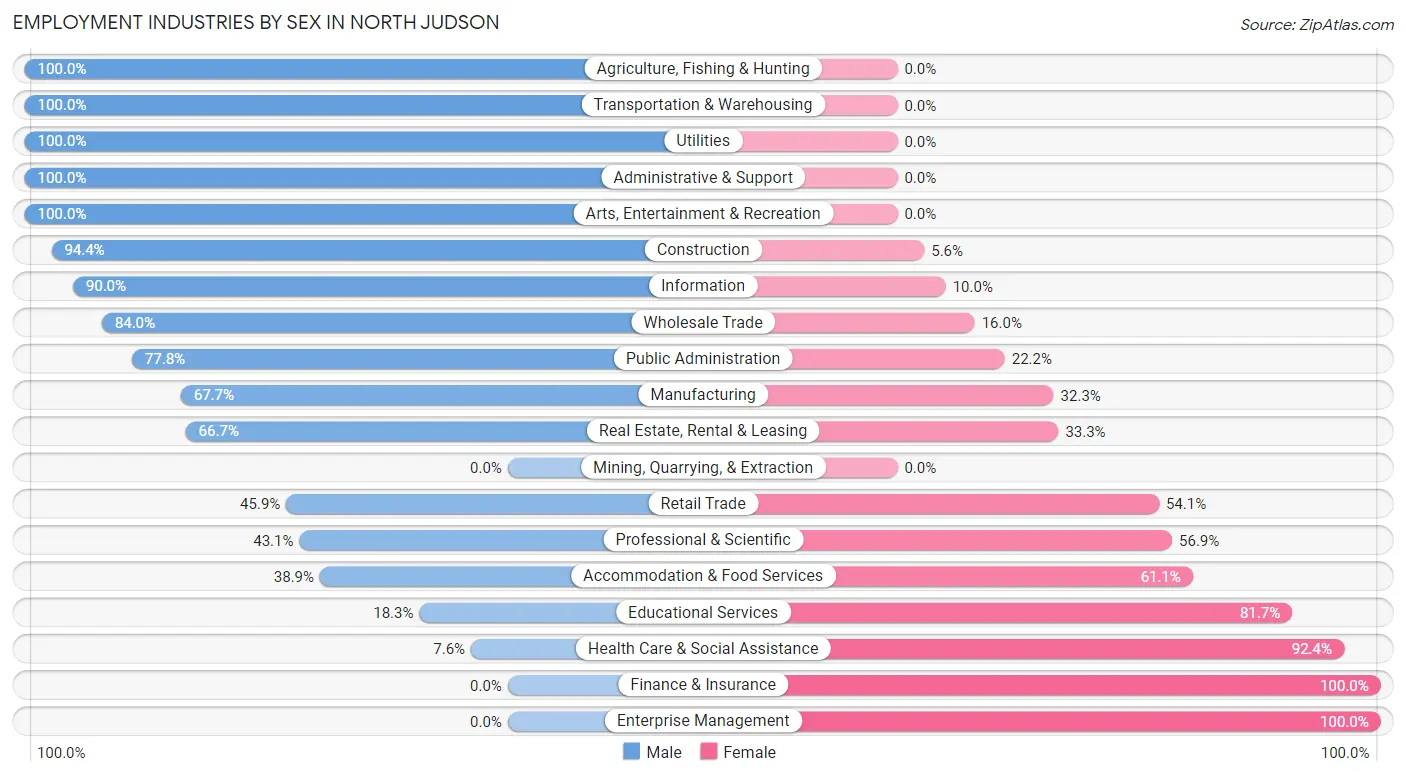
Employment Industries by Sex in North Judson
The North Judson industries that see more men than women are Agriculture, Fishing & Hunting (100.0%), Transportation & Warehousing (100.0%), and Utilities (100.0%), whereas the industries that tend to have a higher number of women are Finance & Insurance (100.0%), Enterprise Management (100.0%), and Health Care & Social Assistance (92.4%).
| Industry | Male | Female |
| Agriculture, Fishing & Hunting | 3 (100.0%) | 0 (0.0%) |
| Mining, Quarrying, & Extraction | 0 (0.0%) | 0 (0.0%) |
| Construction | 85 (94.4%) | 5 (5.6%) |
| Manufacturing | 113 (67.7%) | 54 (32.3%) |
| Wholesale Trade | 21 (84.0%) | 4 (16.0%) |
| Retail Trade | 61 (45.9%) | 72 (54.1%) |
| Transportation & Warehousing | 10 (100.0%) | 0 (0.0%) |
| Utilities | 4 (100.0%) | 0 (0.0%) |
| Information | 18 (90.0%) | 2 (10.0%) |
| Finance & Insurance | 0 (0.0%) | 8 (100.0%) |
| Real Estate, Rental & Leasing | 6 (66.7%) | 3 (33.3%) |
| Professional & Scientific | 22 (43.1%) | 29 (56.9%) |
| Enterprise Management | 0 (0.0%) | 2 (100.0%) |
| Administrative & Support | 27 (100.0%) | 0 (0.0%) |
| Educational Services | 13 (18.3%) | 58 (81.7%) |
| Health Care & Social Assistance | 7 (7.6%) | 85 (92.4%) |
| Arts, Entertainment & Recreation | 2 (100.0%) | 0 (0.0%) |
| Accommodation & Food Services | 28 (38.9%) | 44 (61.1%) |
| Public Administration | 14 (77.8%) | 4 (22.2%) |
| Total | 457 (54.0%) | 390 (46.0%) |
Education in North Judson
School Enrollment in North Judson
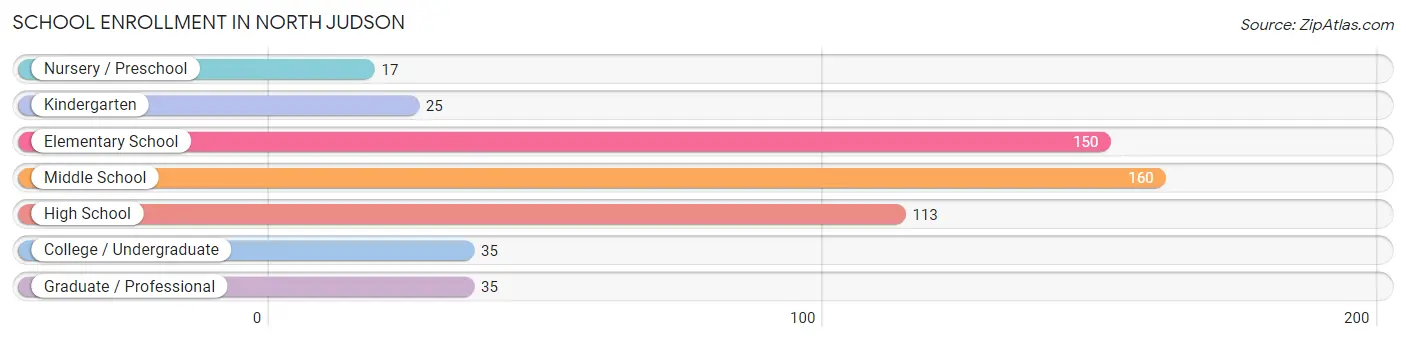
The most common levels of schooling among the 535 students in North Judson are middle school (160 | 29.9%), elementary school (150 | 28.0%), and high school (113 | 21.1%).
| School Level | # Students | % Students |
| Nursery / Preschool | 17 | 3.2% |
| Kindergarten | 25 | 4.7% |
| Elementary School | 150 | 28.0% |
| Middle School | 160 | 29.9% |
| High School | 113 | 21.1% |
| College / Undergraduate | 35 | 6.5% |
| Graduate / Professional | 35 | 6.5% |
| Total | 535 | 100.0% |
School Enrollment by Age by Funding Source in North Judson
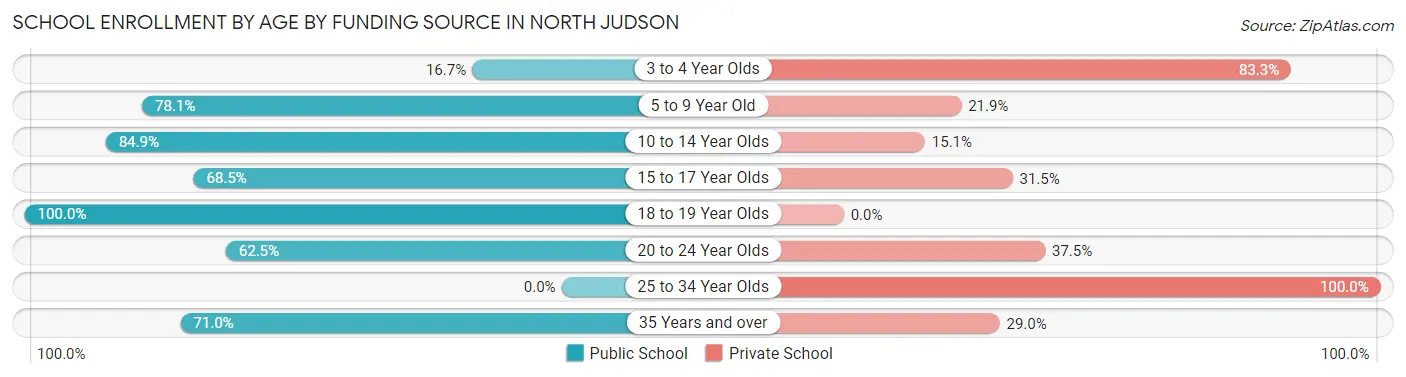
Out of a total of 535 students who are enrolled in schools in North Judson, 134 (25.0%) attend a private institution, while the remaining 401 (75.0%) are enrolled in public schools. The age group of 25 to 34 year olds has the highest likelihood of being enrolled in private schools, with 15 (100.0% in the age bracket) enrolled. Conversely, the age group of 18 to 19 year olds has the lowest likelihood of being enrolled in a private school, with 23 (100.0% in the age bracket) attending a public institution.
| Age Bracket | Public School | Private School |
| 3 to 4 Year Olds | 2 (16.7%) | 10 (83.3%) |
| 5 to 9 Year Old | 132 (78.1%) | 37 (21.9%) |
| 10 to 14 Year Olds | 146 (84.9%) | 26 (15.1%) |
| 15 to 17 Year Olds | 61 (68.5%) | 28 (31.5%) |
| 18 to 19 Year Olds | 23 (100.0%) | 0 (0.0%) |
| 20 to 24 Year Olds | 15 (62.5%) | 9 (37.5%) |
| 25 to 34 Year Olds | 0 (0.0%) | 15 (100.0%) |
| 35 Years and over | 22 (71.0%) | 9 (29.0%) |
| Total | 401 (75.0%) | 134 (25.0%) |
Educational Attainment by Field of Study in North Judson
Business (56 | 25.2%), education (53 | 23.9%), science & technology (31 | 14.0%), liberal arts & history (26 | 11.7%), and visual & performing arts (16 | 7.2%) are the most common fields of study among 222 individuals in North Judson who have obtained a bachelor's degree or higher.
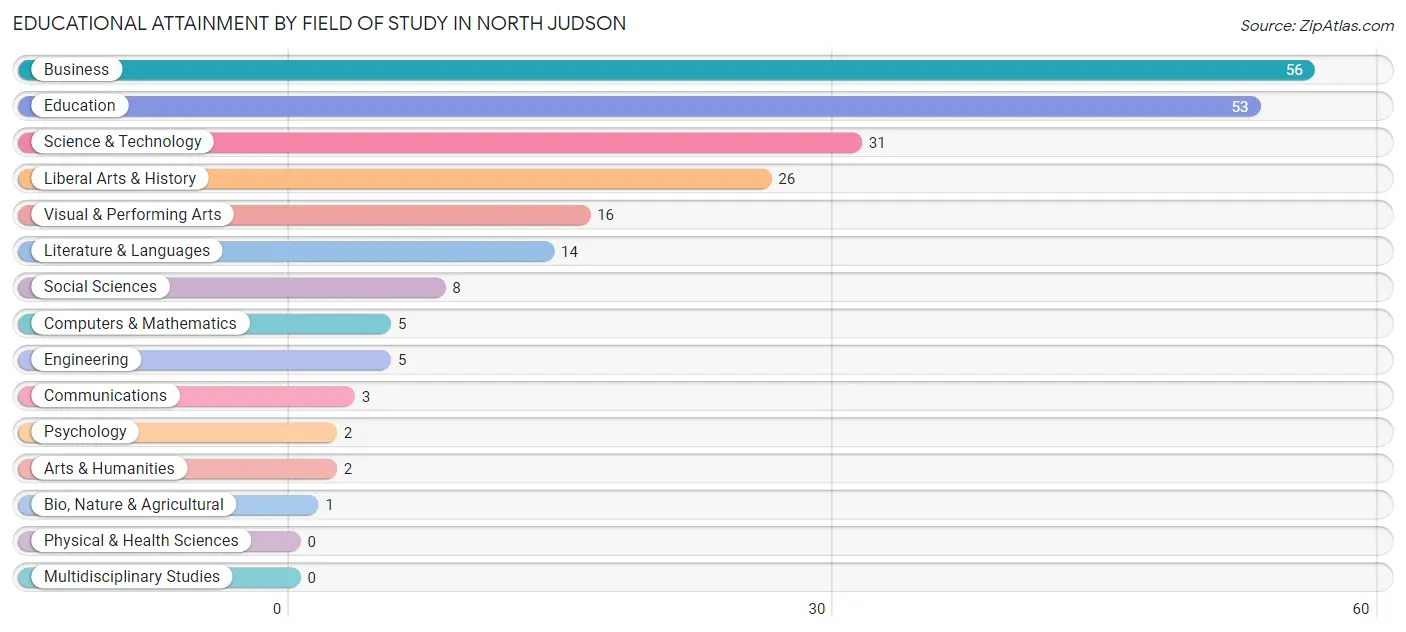
| Field of Study | # Graduates | % Graduates |
| Computers & Mathematics | 5 | 2.2% |
| Bio, Nature & Agricultural | 1 | 0.4% |
| Physical & Health Sciences | 0 | 0.0% |
| Psychology | 2 | 0.9% |
| Social Sciences | 8 | 3.6% |
| Engineering | 5 | 2.2% |
| Multidisciplinary Studies | 0 | 0.0% |
| Science & Technology | 31 | 14.0% |
| Business | 56 | 25.2% |
| Education | 53 | 23.9% |
| Literature & Languages | 14 | 6.3% |
| Liberal Arts & History | 26 | 11.7% |
| Visual & Performing Arts | 16 | 7.2% |
| Communications | 3 | 1.3% |
| Arts & Humanities | 2 | 0.9% |
| Total | 222 | 100.0% |
Transportation & Commute in North Judson
Vehicle Availability by Sex in North Judson
The most prevalent vehicle ownership categories in North Judson are males with 2 vehicles (171, accounting for 40.9%) and females with 2 vehicles (162, making up 44.7%).
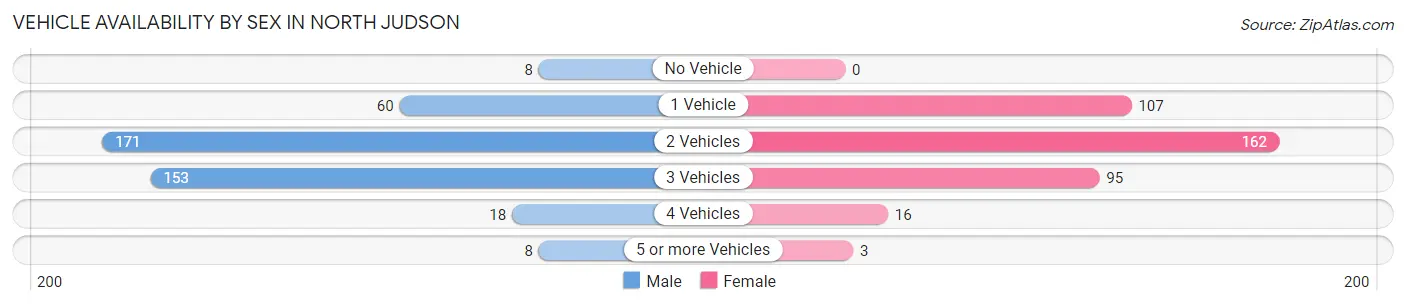
| Vehicles Available | Male | Female |
| No Vehicle | 8 (1.9%) | 0 (0.0%) |
| 1 Vehicle | 60 (14.3%) | 107 (27.9%) |
| 2 Vehicles | 171 (40.9%) | 162 (42.3%) |
| 3 Vehicles | 153 (36.6%) | 95 (24.8%) |
| 4 Vehicles | 18 (4.3%) | 16 (4.2%) |
| 5 or more Vehicles | 8 (1.9%) | 3 (0.8%) |
| Total | 418 (100.0%) | 383 (100.0%) |
Commute Time in North Judson
The most frequently occuring commute durations in North Judson are 5 to 9 minutes (172 commuters, 21.6%), 30 to 34 minutes (88 commuters, 11.1%), and 45 to 59 minutes (84 commuters, 10.6%).
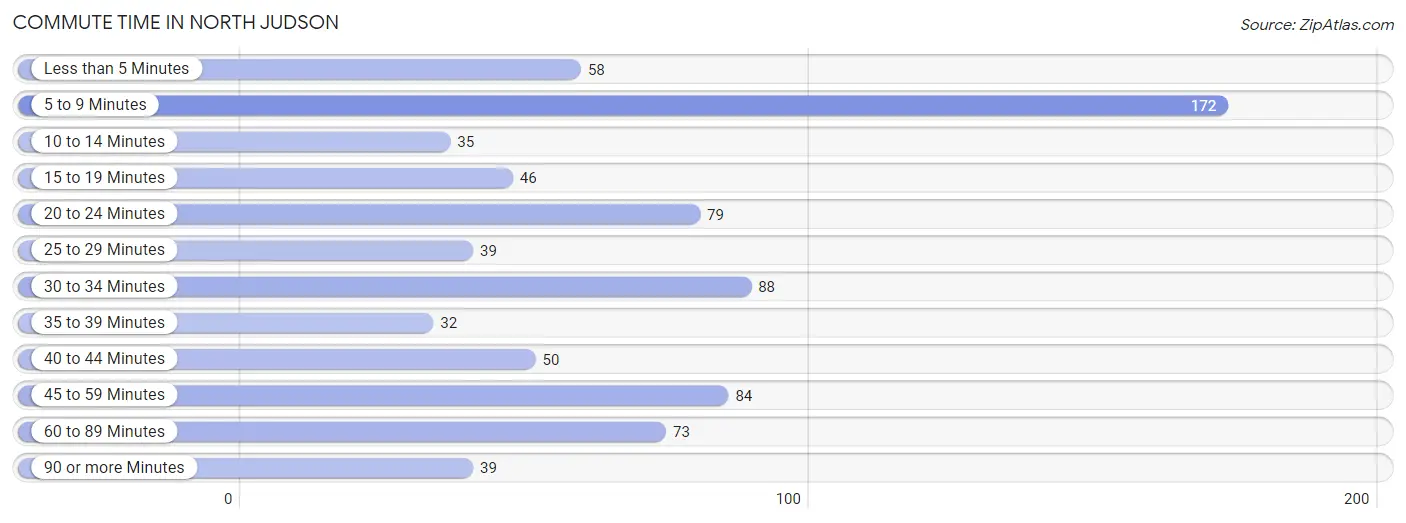
| Commute Time | # Commuters | % Commuters |
| Less than 5 Minutes | 58 | 7.3% |
| 5 to 9 Minutes | 172 | 21.6% |
| 10 to 14 Minutes | 35 | 4.4% |
| 15 to 19 Minutes | 46 | 5.8% |
| 20 to 24 Minutes | 79 | 9.9% |
| 25 to 29 Minutes | 39 | 4.9% |
| 30 to 34 Minutes | 88 | 11.1% |
| 35 to 39 Minutes | 32 | 4.0% |
| 40 to 44 Minutes | 50 | 6.3% |
| 45 to 59 Minutes | 84 | 10.6% |
| 60 to 89 Minutes | 73 | 9.2% |
| 90 or more Minutes | 39 | 4.9% |
Commute Time by Sex in North Judson
The most common commute times in North Judson are 5 to 9 minutes (110 commuters, 26.3%) for males and 5 to 9 minutes (62 commuters, 16.5%) for females.
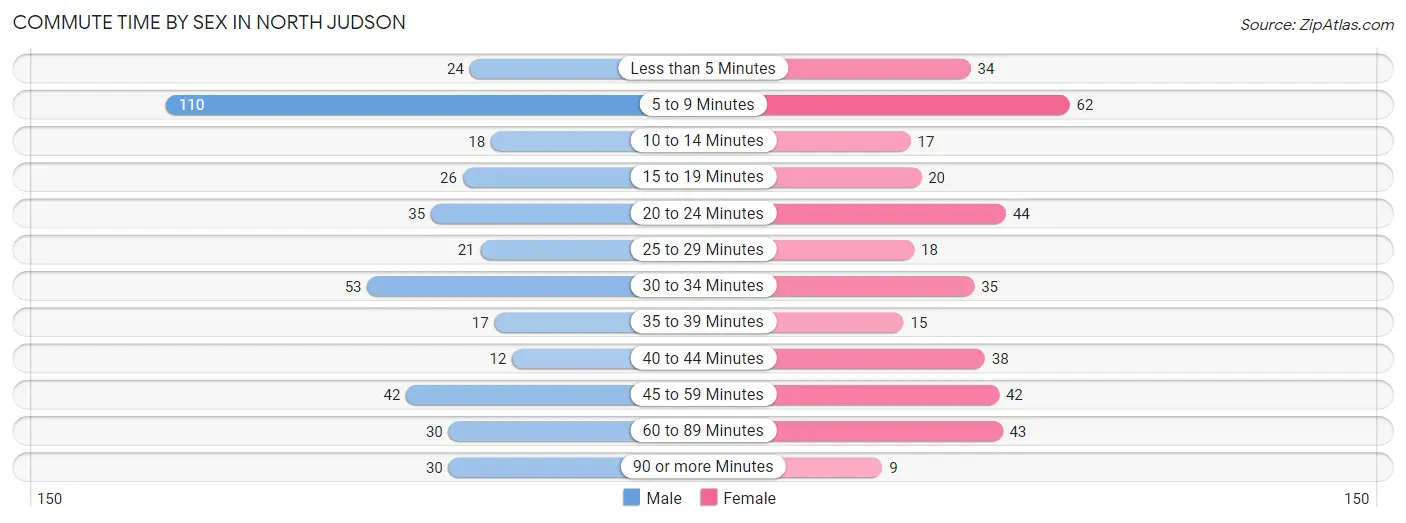
| Commute Time | Male | Female |
| Less than 5 Minutes | 24 (5.7%) | 34 (9.0%) |
| 5 to 9 Minutes | 110 (26.3%) | 62 (16.5%) |
| 10 to 14 Minutes | 18 (4.3%) | 17 (4.5%) |
| 15 to 19 Minutes | 26 (6.2%) | 20 (5.3%) |
| 20 to 24 Minutes | 35 (8.4%) | 44 (11.7%) |
| 25 to 29 Minutes | 21 (5.0%) | 18 (4.8%) |
| 30 to 34 Minutes | 53 (12.7%) | 35 (9.3%) |
| 35 to 39 Minutes | 17 (4.1%) | 15 (4.0%) |
| 40 to 44 Minutes | 12 (2.9%) | 38 (10.1%) |
| 45 to 59 Minutes | 42 (10.1%) | 42 (11.1%) |
| 60 to 89 Minutes | 30 (7.2%) | 43 (11.4%) |
| 90 or more Minutes | 30 (7.2%) | 9 (2.4%) |
Time of Departure to Work by Sex in North Judson
The most frequent times of departure to work in North Judson are 5:30 AM to 5:59 AM (69, 16.5%) for males and 6:00 AM to 6:29 AM (78, 20.7%) for females.
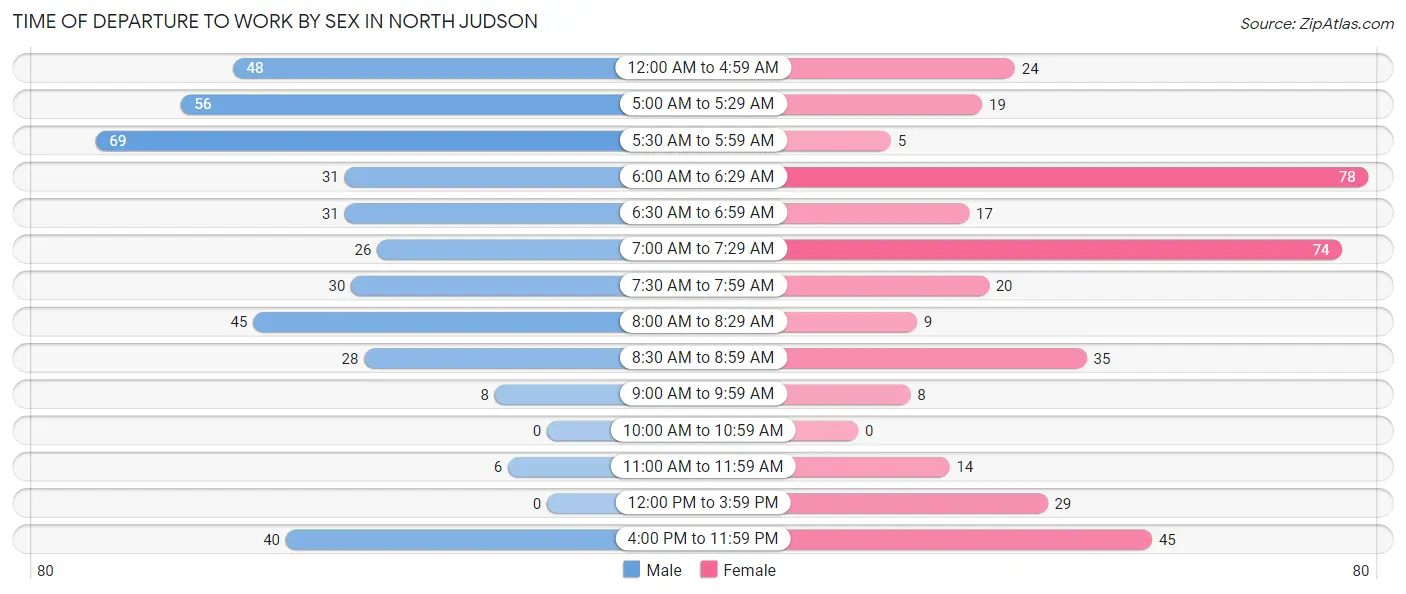
| Time of Departure | Male | Female |
| 12:00 AM to 4:59 AM | 48 (11.5%) | 24 (6.4%) |
| 5:00 AM to 5:29 AM | 56 (13.4%) | 19 (5.0%) |
| 5:30 AM to 5:59 AM | 69 (16.5%) | 5 (1.3%) |
| 6:00 AM to 6:29 AM | 31 (7.4%) | 78 (20.7%) |
| 6:30 AM to 6:59 AM | 31 (7.4%) | 17 (4.5%) |
| 7:00 AM to 7:29 AM | 26 (6.2%) | 74 (19.6%) |
| 7:30 AM to 7:59 AM | 30 (7.2%) | 20 (5.3%) |
| 8:00 AM to 8:29 AM | 45 (10.8%) | 9 (2.4%) |
| 8:30 AM to 8:59 AM | 28 (6.7%) | 35 (9.3%) |
| 9:00 AM to 9:59 AM | 8 (1.9%) | 8 (2.1%) |
| 10:00 AM to 10:59 AM | 0 (0.0%) | 0 (0.0%) |
| 11:00 AM to 11:59 AM | 6 (1.4%) | 14 (3.7%) |
| 12:00 PM to 3:59 PM | 0 (0.0%) | 29 (7.7%) |
| 4:00 PM to 11:59 PM | 40 (9.6%) | 45 (11.9%) |
| Total | 418 (100.0%) | 377 (100.0%) |
Housing Occupancy in North Judson
Occupancy by Ownership in North Judson
Of the total 750 dwellings in North Judson, owner-occupied units account for 526 (70.1%), while renter-occupied units make up 224 (29.9%).
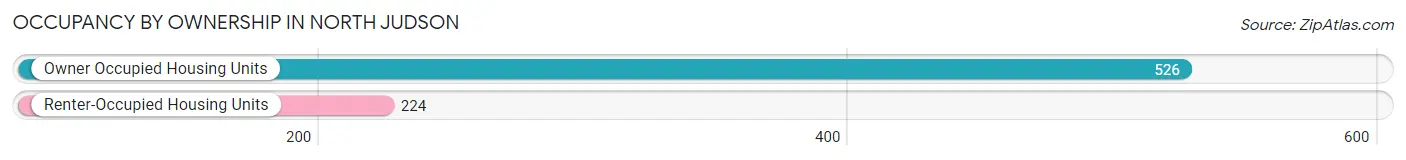
| Occupancy | # Housing Units | % Housing Units |
| Owner Occupied Housing Units | 526 | 70.1% |
| Renter-Occupied Housing Units | 224 | 29.9% |
| Total Occupied Housing Units | 750 | 100.0% |
Occupancy by Household Size in North Judson
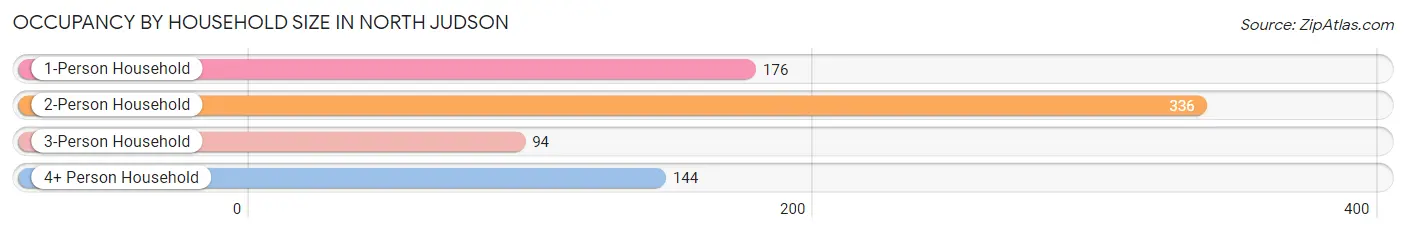
| Household Size | # Housing Units | % Housing Units |
| 1-Person Household | 176 | 23.5% |
| 2-Person Household | 336 | 44.8% |
| 3-Person Household | 94 | 12.5% |
| 4+ Person Household | 144 | 19.2% |
| Total Housing Units | 750 | 100.0% |
Occupancy by Ownership by Household Size in North Judson
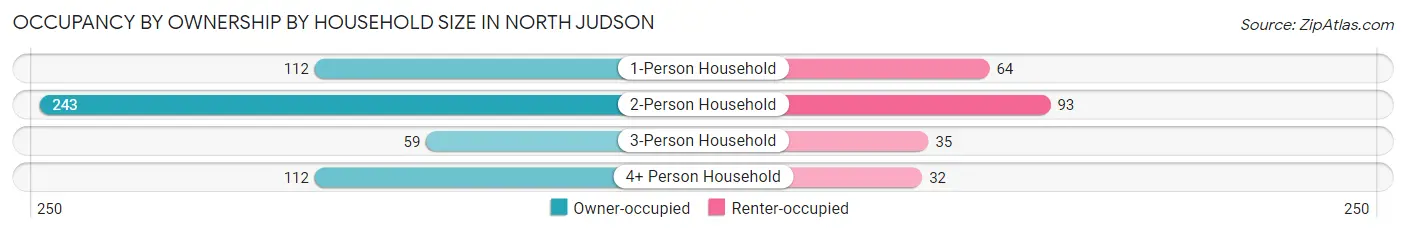
| Household Size | Owner-occupied | Renter-occupied |
| 1-Person Household | 112 (63.6%) | 64 (36.4%) |
| 2-Person Household | 243 (72.3%) | 93 (27.7%) |
| 3-Person Household | 59 (62.8%) | 35 (37.2%) |
| 4+ Person Household | 112 (77.8%) | 32 (22.2%) |
| Total Housing Units | 526 (70.1%) | 224 (29.9%) |
Occupancy by Educational Attainment in North Judson
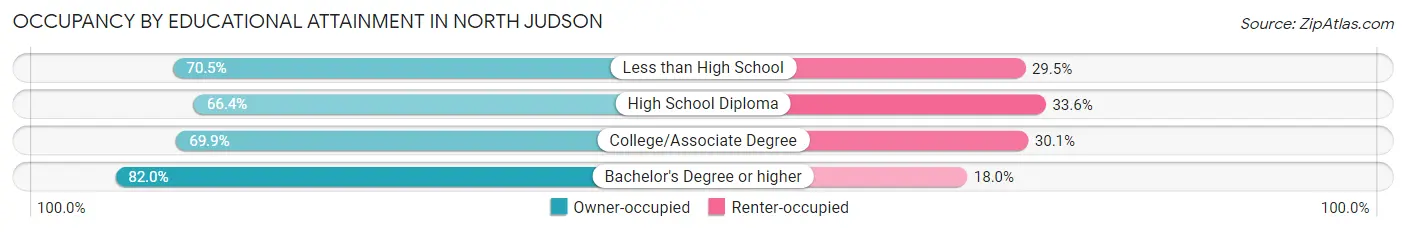
| Household Size | Owner-occupied | Renter-occupied |
| Less than High School | 98 (70.5%) | 41 (29.5%) |
| High School Diploma | 190 (66.4%) | 96 (33.6%) |
| College/Associate Degree | 165 (69.9%) | 71 (30.1%) |
| Bachelor's Degree or higher | 73 (82.0%) | 16 (18.0%) |
Occupancy by Age of Householder in North Judson
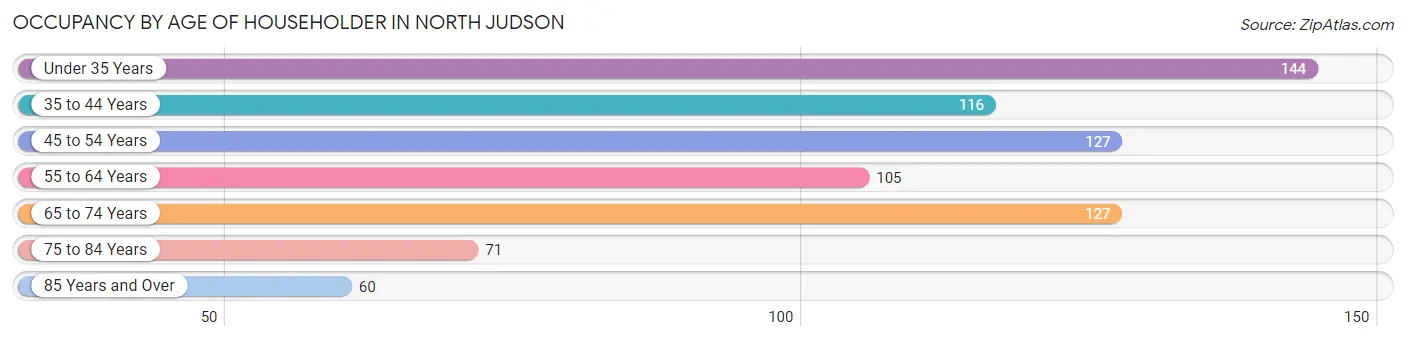
| Age Bracket | # Households | % Households |
| Under 35 Years | 144 | 19.2% |
| 35 to 44 Years | 116 | 15.5% |
| 45 to 54 Years | 127 | 16.9% |
| 55 to 64 Years | 105 | 14.0% |
| 65 to 74 Years | 127 | 16.9% |
| 75 to 84 Years | 71 | 9.5% |
| 85 Years and Over | 60 | 8.0% |
| Total | 750 | 100.0% |
Housing Finances in North Judson
Median Income by Occupancy in North Judson
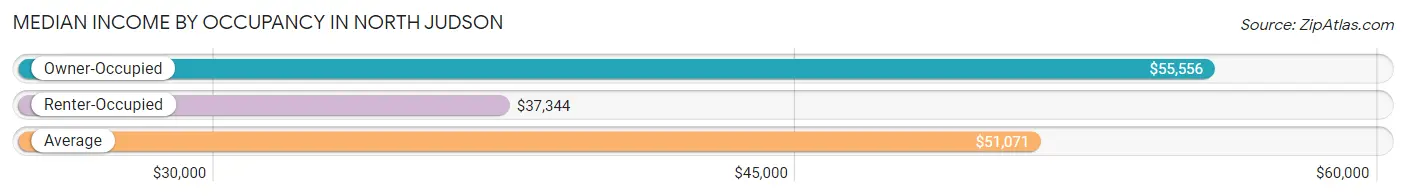
| Occupancy Type | # Households | Median Income |
| Owner-Occupied | 526 (70.1%) | $55,556 |
| Renter-Occupied | 224 (29.9%) | $37,344 |
| Average | 750 (100.0%) | $51,071 |
Occupancy by Householder Income Bracket in North Judson
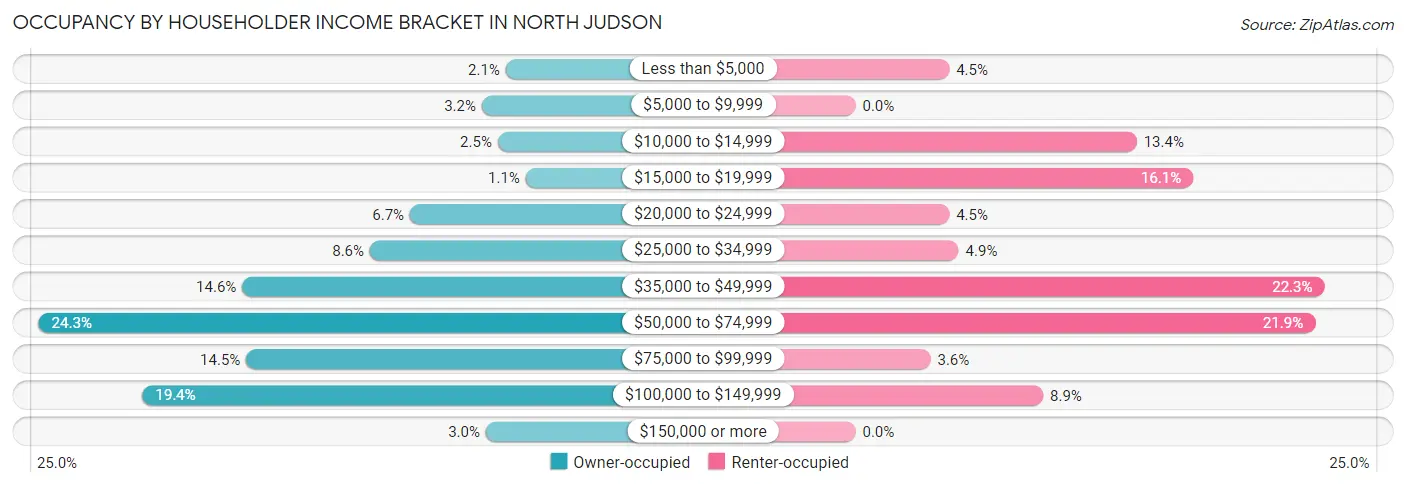
| Income Bracket | Owner-occupied | Renter-occupied |
| Less than $5,000 | 11 (2.1%) | 10 (4.5%) |
| $5,000 to $9,999 | 17 (3.2%) | 0 (0.0%) |
| $10,000 to $14,999 | 13 (2.5%) | 30 (13.4%) |
| $15,000 to $19,999 | 6 (1.1%) | 36 (16.1%) |
| $20,000 to $24,999 | 35 (6.7%) | 10 (4.5%) |
| $25,000 to $34,999 | 45 (8.6%) | 11 (4.9%) |
| $35,000 to $49,999 | 77 (14.6%) | 50 (22.3%) |
| $50,000 to $74,999 | 128 (24.3%) | 49 (21.9%) |
| $75,000 to $99,999 | 76 (14.4%) | 8 (3.6%) |
| $100,000 to $149,999 | 102 (19.4%) | 20 (8.9%) |
| $150,000 or more | 16 (3.0%) | 0 (0.0%) |
| Total | 526 (100.0%) | 224 (100.0%) |
Monthly Housing Cost Tiers in North Judson
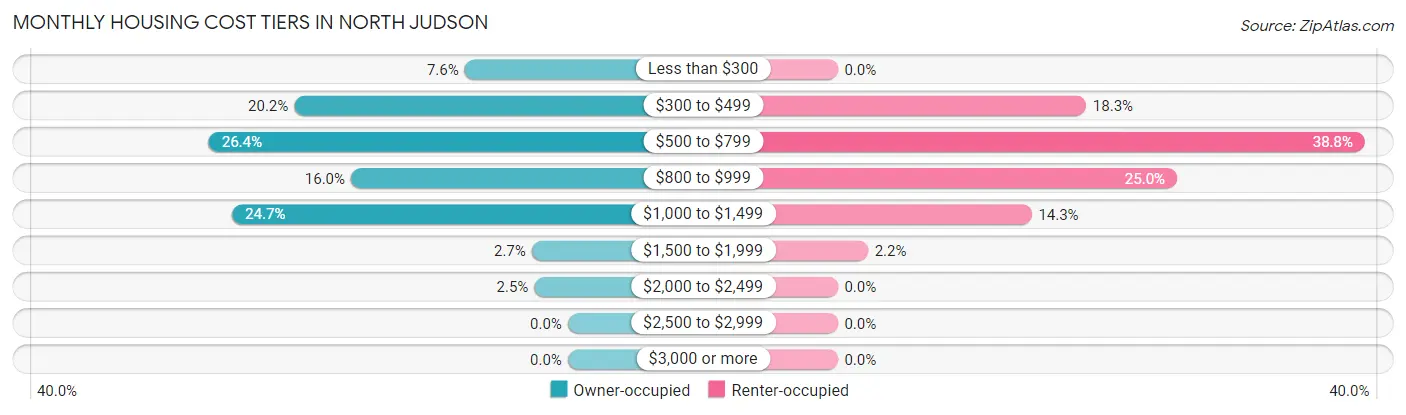
| Monthly Cost | Owner-occupied | Renter-occupied |
| Less than $300 | 40 (7.6%) | 0 (0.0%) |
| $300 to $499 | 106 (20.2%) | 41 (18.3%) |
| $500 to $799 | 139 (26.4%) | 87 (38.8%) |
| $800 to $999 | 84 (16.0%) | 56 (25.0%) |
| $1,000 to $1,499 | 130 (24.7%) | 32 (14.3%) |
| $1,500 to $1,999 | 14 (2.7%) | 5 (2.2%) |
| $2,000 to $2,499 | 13 (2.5%) | 0 (0.0%) |
| $2,500 to $2,999 | 0 (0.0%) | 0 (0.0%) |
| $3,000 or more | 0 (0.0%) | 0 (0.0%) |
| Total | 526 (100.0%) | 224 (100.0%) |
Physical Housing Characteristics in North Judson
Housing Structures in North Judson
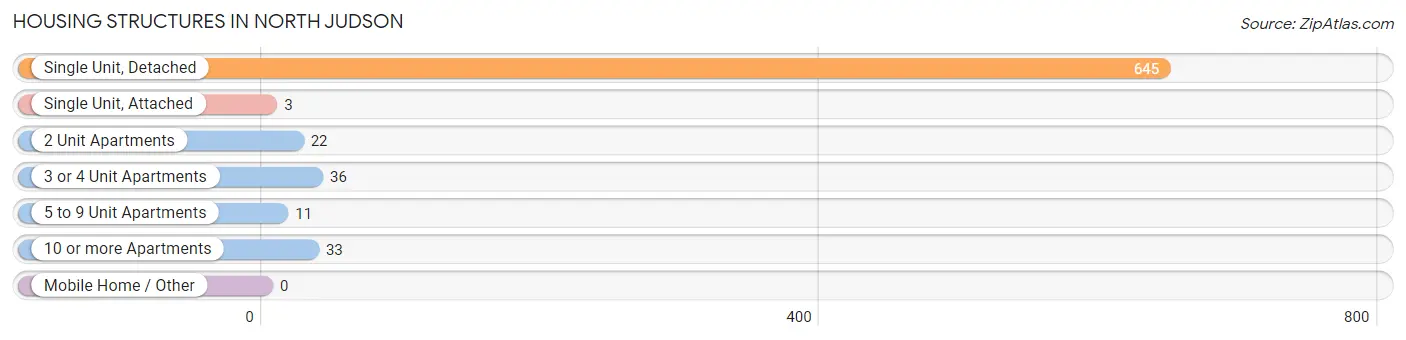
| Structure Type | # Housing Units | % Housing Units |
| Single Unit, Detached | 645 | 86.0% |
| Single Unit, Attached | 3 | 0.4% |
| 2 Unit Apartments | 22 | 2.9% |
| 3 or 4 Unit Apartments | 36 | 4.8% |
| 5 to 9 Unit Apartments | 11 | 1.5% |
| 10 or more Apartments | 33 | 4.4% |
| Mobile Home / Other | 0 | 0.0% |
| Total | 750 | 100.0% |
Housing Structures by Occupancy in North Judson
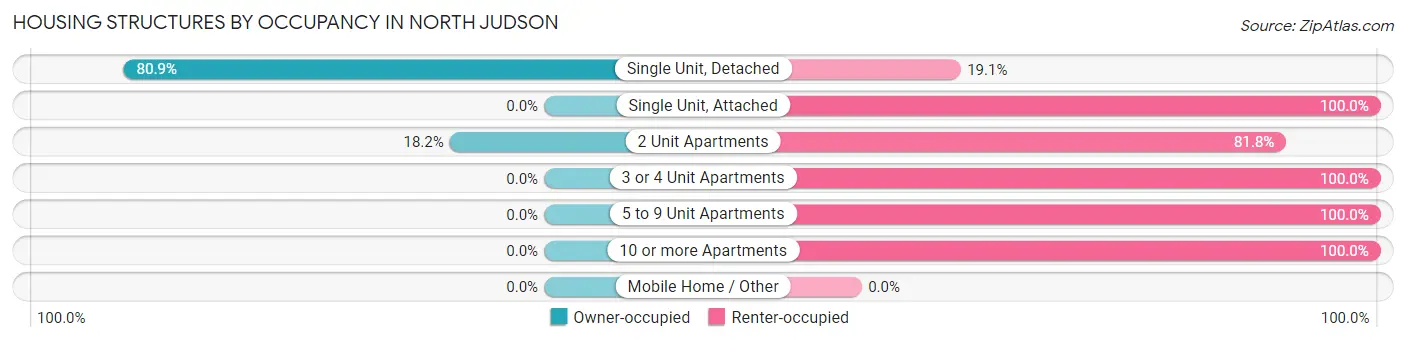
| Structure Type | Owner-occupied | Renter-occupied |
| Single Unit, Detached | 522 (80.9%) | 123 (19.1%) |
| Single Unit, Attached | 0 (0.0%) | 3 (100.0%) |
| 2 Unit Apartments | 4 (18.2%) | 18 (81.8%) |
| 3 or 4 Unit Apartments | 0 (0.0%) | 36 (100.0%) |
| 5 to 9 Unit Apartments | 0 (0.0%) | 11 (100.0%) |
| 10 or more Apartments | 0 (0.0%) | 33 (100.0%) |
| Mobile Home / Other | 0 (0.0%) | 0 (0.0%) |
| Total | 526 (70.1%) | 224 (29.9%) |
Housing Structures by Number of Rooms in North Judson
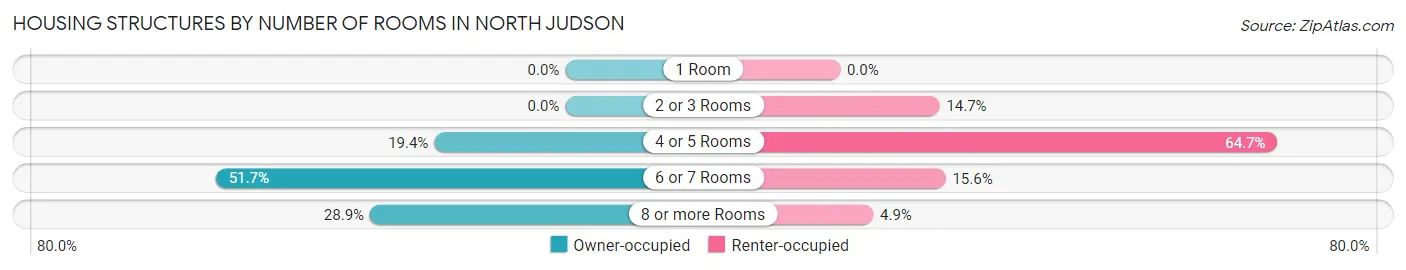
| Number of Rooms | Owner-occupied | Renter-occupied |
| 1 Room | 0 (0.0%) | 0 (0.0%) |
| 2 or 3 Rooms | 0 (0.0%) | 33 (14.7%) |
| 4 or 5 Rooms | 102 (19.4%) | 145 (64.7%) |
| 6 or 7 Rooms | 272 (51.7%) | 35 (15.6%) |
| 8 or more Rooms | 152 (28.9%) | 11 (4.9%) |
| Total | 526 (100.0%) | 224 (100.0%) |
Housing Structure by Heating Type in North Judson
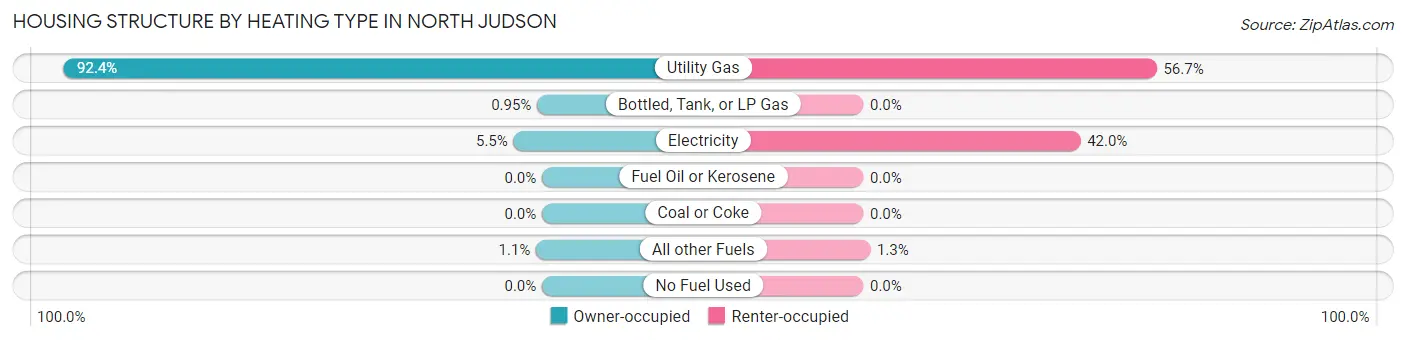
| Heating Type | Owner-occupied | Renter-occupied |
| Utility Gas | 486 (92.4%) | 127 (56.7%) |
| Bottled, Tank, or LP Gas | 5 (0.9%) | 0 (0.0%) |
| Electricity | 29 (5.5%) | 94 (42.0%) |
| Fuel Oil or Kerosene | 0 (0.0%) | 0 (0.0%) |
| Coal or Coke | 0 (0.0%) | 0 (0.0%) |
| All other Fuels | 6 (1.1%) | 3 (1.3%) |
| No Fuel Used | 0 (0.0%) | 0 (0.0%) |
| Total | 526 (100.0%) | 224 (100.0%) |
Household Vehicle Usage in North Judson
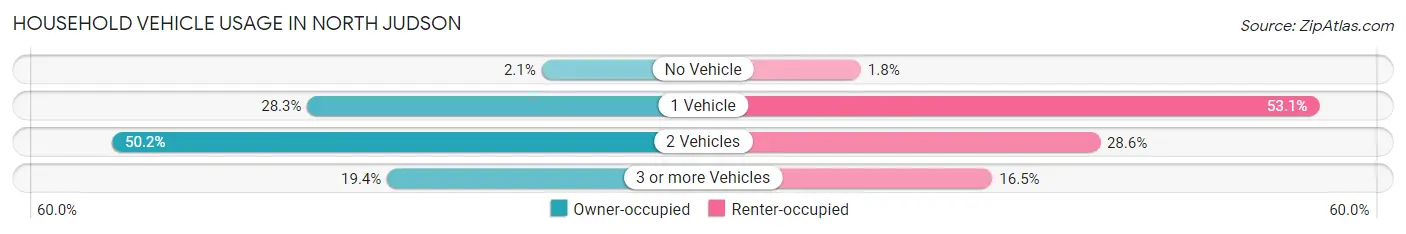
| Vehicles per Household | Owner-occupied | Renter-occupied |
| No Vehicle | 11 (2.1%) | 4 (1.8%) |
| 1 Vehicle | 149 (28.3%) | 119 (53.1%) |
| 2 Vehicles | 264 (50.2%) | 64 (28.6%) |
| 3 or more Vehicles | 102 (19.4%) | 37 (16.5%) |
| Total | 526 (100.0%) | 224 (100.0%) |
Real Estate & Mortgages in North Judson
Real Estate and Mortgage Overview in North Judson
| Characteristic | Without Mortgage | With Mortgage |
| Housing Units | 233 | 293 |
| Median Property Value | $100,500 | $128,000 |
| Median Household Income | $44,018 | $6 |
| Monthly Housing Costs | $446 | $0 |
| Real Estate Taxes | $654 | $17 |
Property Value by Mortgage Status in North Judson
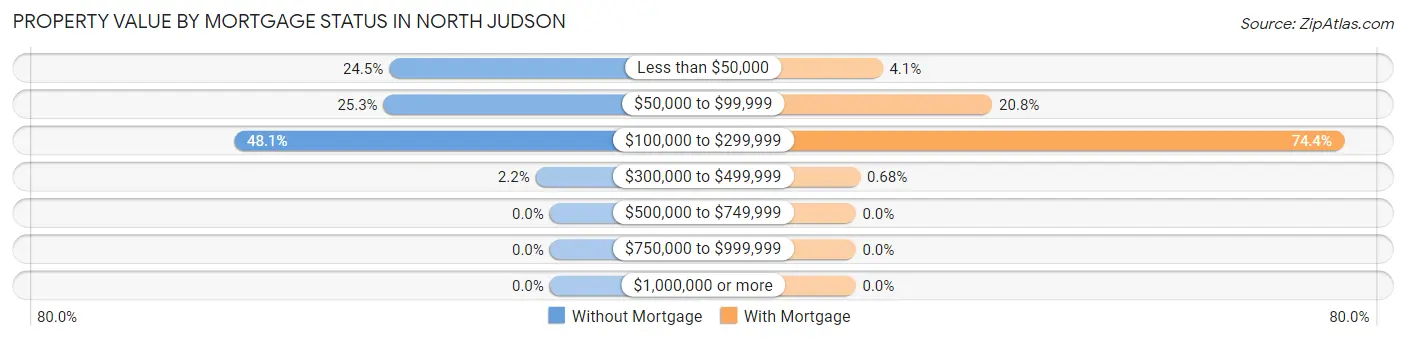
| Property Value | Without Mortgage | With Mortgage |
| Less than $50,000 | 57 (24.5%) | 12 (4.1%) |
| $50,000 to $99,999 | 59 (25.3%) | 61 (20.8%) |
| $100,000 to $299,999 | 112 (48.1%) | 218 (74.4%) |
| $300,000 to $499,999 | 5 (2.1%) | 2 (0.7%) |
| $500,000 to $749,999 | 0 (0.0%) | 0 (0.0%) |
| $750,000 to $999,999 | 0 (0.0%) | 0 (0.0%) |
| $1,000,000 or more | 0 (0.0%) | 0 (0.0%) |
| Total | 233 (100.0%) | 293 (100.0%) |
Household Income by Mortgage Status in North Judson
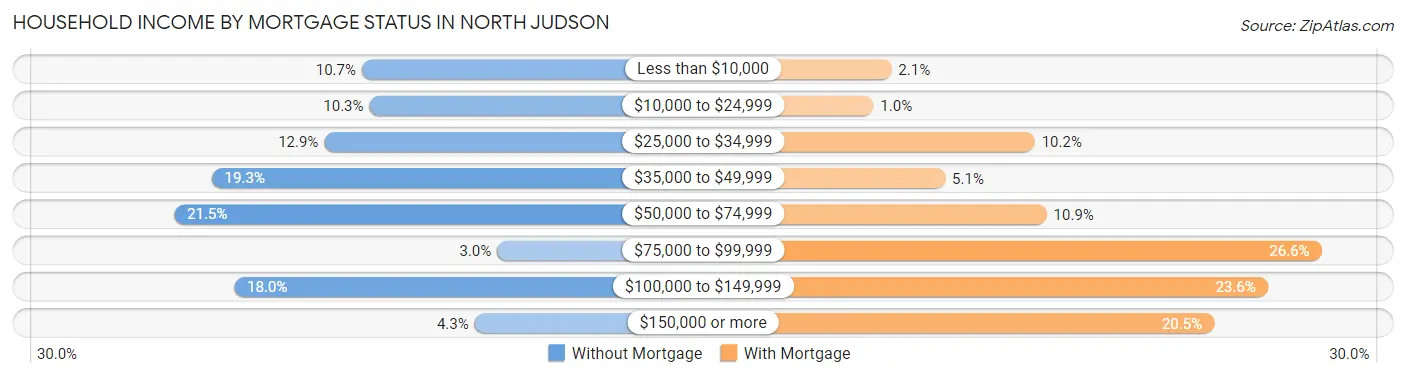
| Household Income | Without Mortgage | With Mortgage |
| Less than $10,000 | 25 (10.7%) | 6 (2.1%) |
| $10,000 to $24,999 | 24 (10.3%) | 3 (1.0%) |
| $25,000 to $34,999 | 30 (12.9%) | 30 (10.2%) |
| $35,000 to $49,999 | 45 (19.3%) | 15 (5.1%) |
| $50,000 to $74,999 | 50 (21.5%) | 32 (10.9%) |
| $75,000 to $99,999 | 7 (3.0%) | 78 (26.6%) |
| $100,000 to $149,999 | 42 (18.0%) | 69 (23.5%) |
| $150,000 or more | 10 (4.3%) | 60 (20.5%) |
| Total | 233 (100.0%) | 293 (100.0%) |
Property Value to Household Income Ratio in North Judson
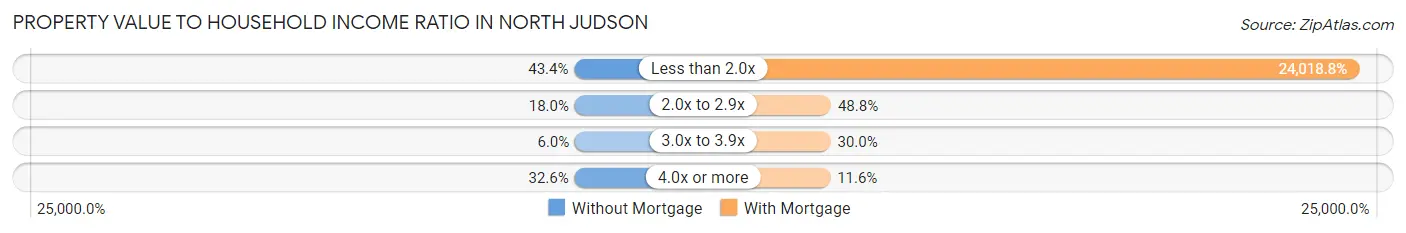
| Value-to-Income Ratio | Without Mortgage | With Mortgage |
| Less than 2.0x | 101 (43.3%) | 70,375 (24,018.8%) |
| 2.0x to 2.9x | 42 (18.0%) | 143 (48.8%) |
| 3.0x to 3.9x | 14 (6.0%) | 88 (30.0%) |
| 4.0x or more | 76 (32.6%) | 34 (11.6%) |
| Total | 233 (100.0%) | 293 (100.0%) |
Real Estate Taxes by Mortgage Status in North Judson
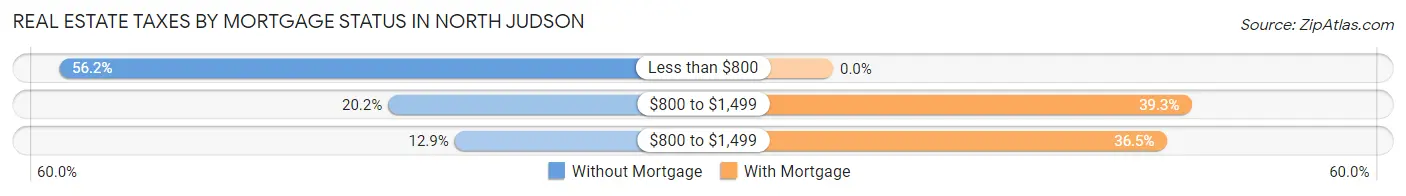
| Property Taxes | Without Mortgage | With Mortgage |
| Less than $800 | 131 (56.2%) | 0 (0.0%) |
| $800 to $1,499 | 47 (20.2%) | 115 (39.3%) |
| $800 to $1,499 | 30 (12.9%) | 107 (36.5%) |
| Total | 233 (100.0%) | 293 (100.0%) |
Health & Disability in North Judson
Health Insurance Coverage by Age in North Judson
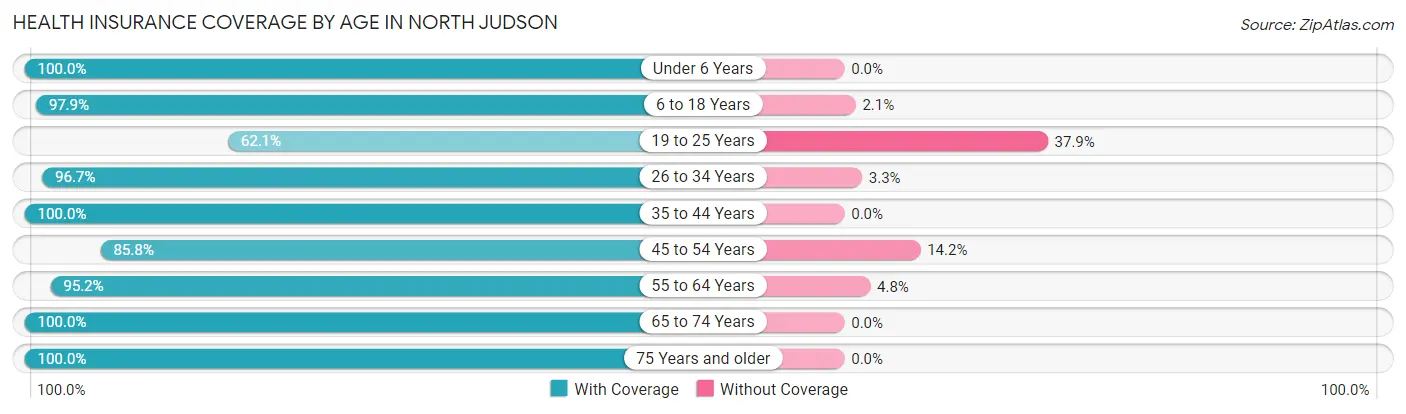
| Age Bracket | With Coverage | Without Coverage |
| Under 6 Years | 127 (100.0%) | 0 (0.0%) |
| 6 to 18 Years | 422 (97.9%) | 9 (2.1%) |
| 19 to 25 Years | 95 (62.1%) | 58 (37.9%) |
| 26 to 34 Years | 266 (96.7%) | 9 (3.3%) |
| 35 to 44 Years | 235 (100.0%) | 0 (0.0%) |
| 45 to 54 Years | 200 (85.8%) | 33 (14.2%) |
| 55 to 64 Years | 198 (95.2%) | 10 (4.8%) |
| 65 to 74 Years | 199 (100.0%) | 0 (0.0%) |
| 75 Years and older | 239 (100.0%) | 0 (0.0%) |
| Total | 1,981 (94.3%) | 119 (5.7%) |
Health Insurance Coverage by Citizenship Status in North Judson
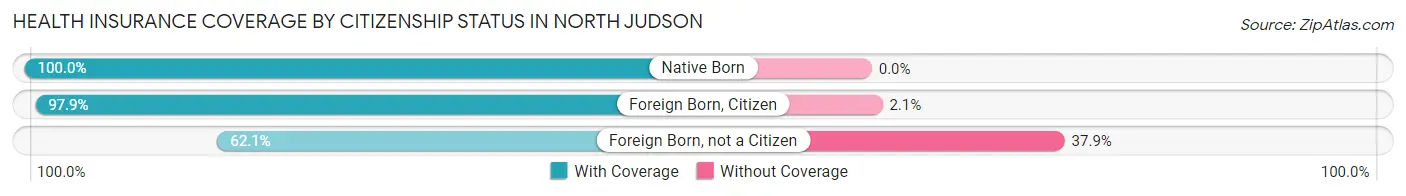
| Citizenship Status | With Coverage | Without Coverage |
| Native Born | 127 (100.0%) | 0 (0.0%) |
| Foreign Born, Citizen | 422 (97.9%) | 9 (2.1%) |
| Foreign Born, not a Citizen | 95 (62.1%) | 58 (37.9%) |
Health Insurance Coverage by Household Income in North Judson
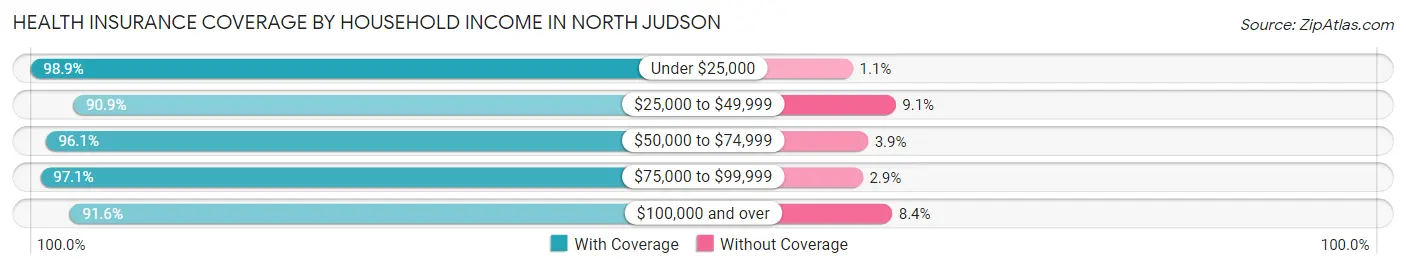
| Household Income | With Coverage | Without Coverage |
| Under $25,000 | 273 (98.9%) | 3 (1.1%) |
| $25,000 to $49,999 | 380 (90.9%) | 38 (9.1%) |
| $50,000 to $74,999 | 466 (96.1%) | 19 (3.9%) |
| $75,000 to $99,999 | 330 (97.1%) | 10 (2.9%) |
| $100,000 and over | 532 (91.6%) | 49 (8.4%) |
Public vs Private Health Insurance Coverage by Age in North Judson
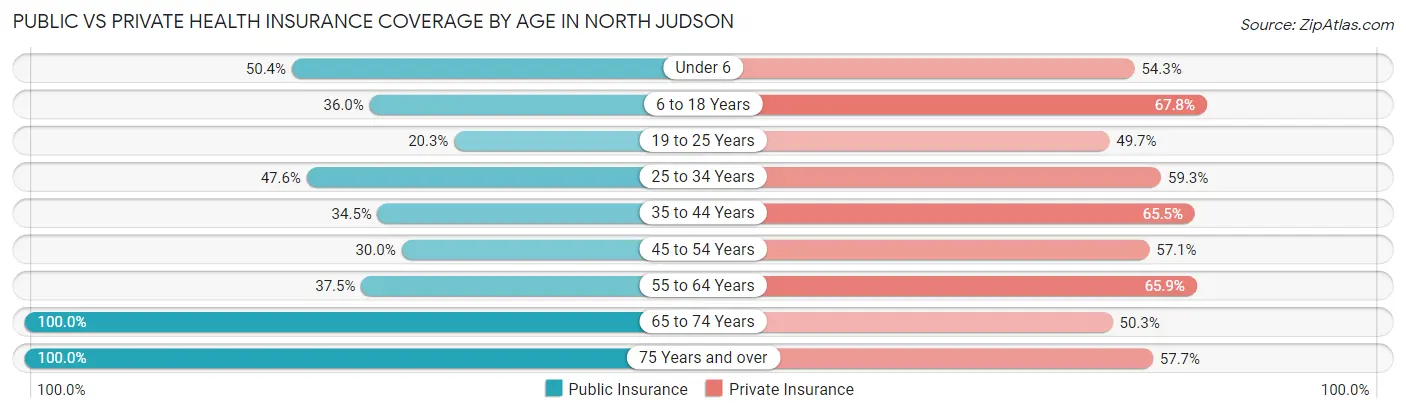
| Age Bracket | Public Insurance | Private Insurance |
| Under 6 | 64 (50.4%) | 69 (54.3%) |
| 6 to 18 Years | 155 (36.0%) | 292 (67.7%) |
| 19 to 25 Years | 31 (20.3%) | 76 (49.7%) |
| 25 to 34 Years | 131 (47.6%) | 163 (59.3%) |
| 35 to 44 Years | 81 (34.5%) | 154 (65.5%) |
| 45 to 54 Years | 70 (30.0%) | 133 (57.1%) |
| 55 to 64 Years | 78 (37.5%) | 137 (65.9%) |
| 65 to 74 Years | 199 (100.0%) | 100 (50.2%) |
| 75 Years and over | 239 (100.0%) | 138 (57.7%) |
| Total | 1,048 (49.9%) | 1,262 (60.1%) |
Disability Status by Sex by Age in North Judson
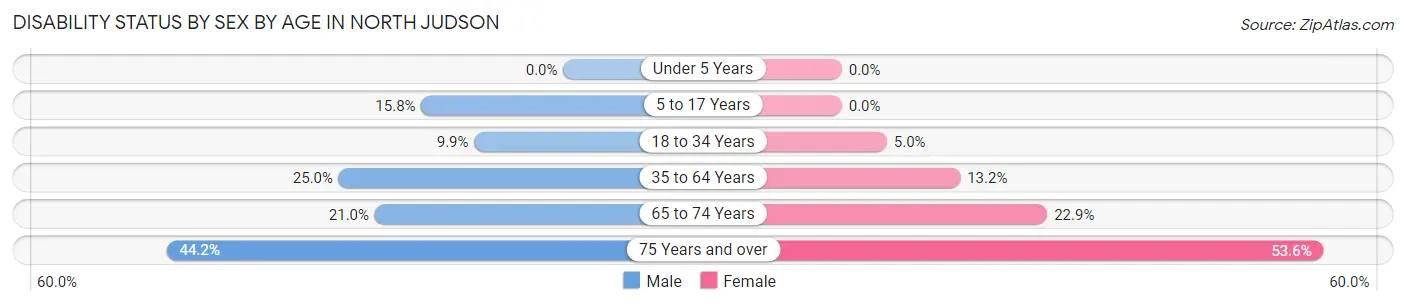
| Age Bracket | Male | Female |
| Under 5 Years | 0 (0.0%) | 0 (0.0%) |
| 5 to 17 Years | 43 (15.8%) | 0 (0.0%) |
| 18 to 34 Years | 21 (9.9%) | 12 (5.0%) |
| 35 to 64 Years | 78 (25.0%) | 48 (13.2%) |
| 65 to 74 Years | 17 (21.0%) | 27 (22.9%) |
| 75 Years and over | 57 (44.2%) | 59 (53.6%) |
Disability Class by Sex by Age in North Judson
Disability Class: Hearing Difficulty
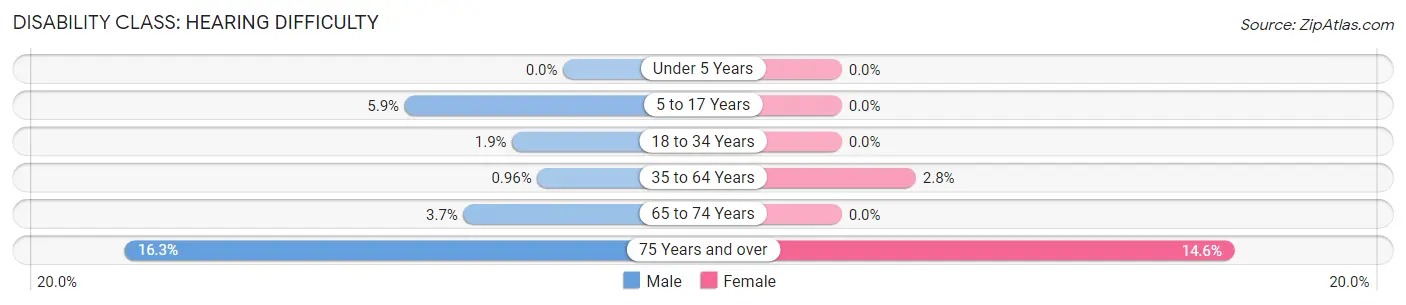
| Age Bracket | Male | Female |
| Under 5 Years | 0 (0.0%) | 0 (0.0%) |
| 5 to 17 Years | 16 (5.9%) | 0 (0.0%) |
| 18 to 34 Years | 4 (1.9%) | 0 (0.0%) |
| 35 to 64 Years | 3 (1.0%) | 10 (2.8%) |
| 65 to 74 Years | 3 (3.7%) | 0 (0.0%) |
| 75 Years and over | 21 (16.3%) | 16 (14.5%) |
Disability Class: Vision Difficulty
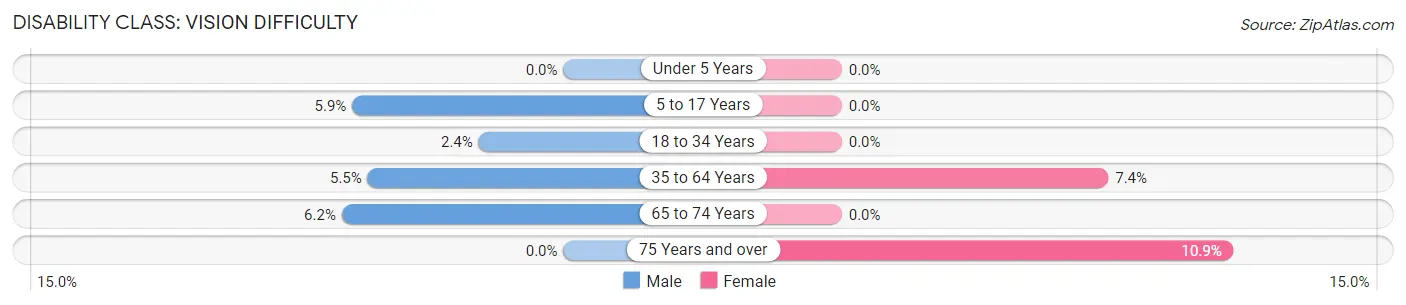
| Age Bracket | Male | Female |
| Under 5 Years | 0 (0.0%) | 0 (0.0%) |
| 5 to 17 Years | 16 (5.9%) | 0 (0.0%) |
| 18 to 34 Years | 5 (2.4%) | 0 (0.0%) |
| 35 to 64 Years | 17 (5.4%) | 27 (7.4%) |
| 65 to 74 Years | 5 (6.2%) | 0 (0.0%) |
| 75 Years and over | 0 (0.0%) | 12 (10.9%) |
Disability Class: Cognitive Difficulty
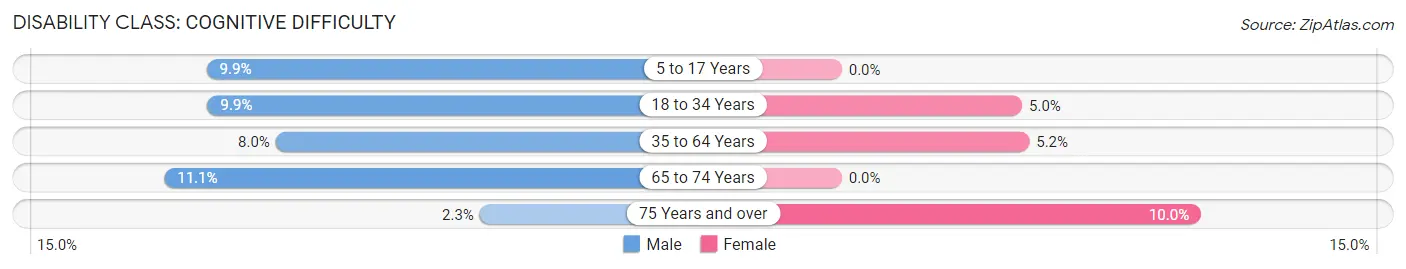
| Age Bracket | Male | Female |
| 5 to 17 Years | 27 (9.9%) | 0 (0.0%) |
| 18 to 34 Years | 21 (9.9%) | 12 (5.0%) |
| 35 to 64 Years | 25 (8.0%) | 19 (5.2%) |
| 65 to 74 Years | 9 (11.1%) | 0 (0.0%) |
| 75 Years and over | 3 (2.3%) | 11 (10.0%) |
Disability Class: Ambulatory Difficulty
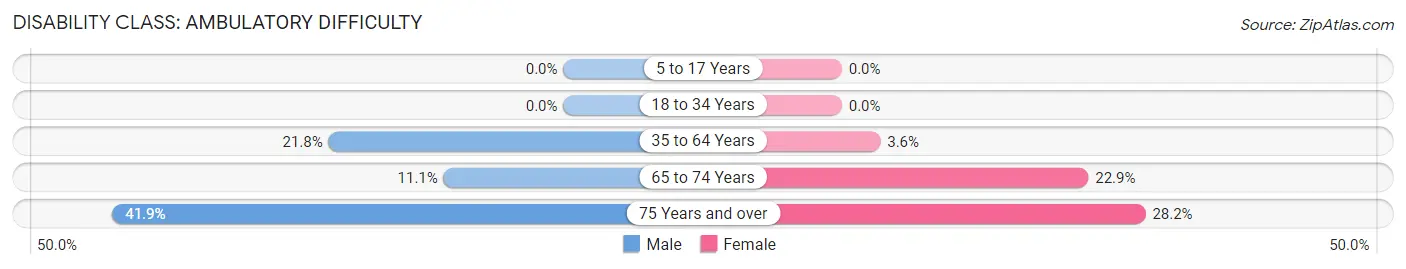
| Age Bracket | Male | Female |
| 5 to 17 Years | 0 (0.0%) | 0 (0.0%) |
| 18 to 34 Years | 0 (0.0%) | 0 (0.0%) |
| 35 to 64 Years | 68 (21.8%) | 13 (3.6%) |
| 65 to 74 Years | 9 (11.1%) | 27 (22.9%) |
| 75 Years and over | 54 (41.9%) | 31 (28.2%) |
Disability Class: Self-Care Difficulty
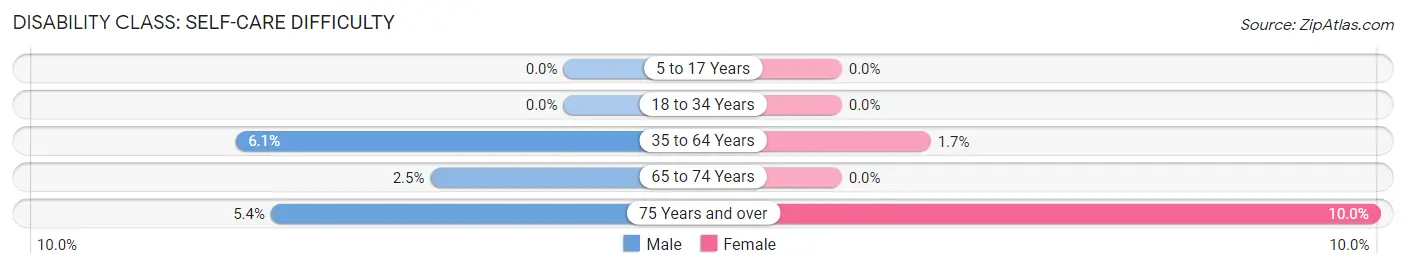
| Age Bracket | Male | Female |
| 5 to 17 Years | 0 (0.0%) | 0 (0.0%) |
| 18 to 34 Years | 0 (0.0%) | 0 (0.0%) |
| 35 to 64 Years | 19 (6.1%) | 6 (1.7%) |
| 65 to 74 Years | 2 (2.5%) | 0 (0.0%) |
| 75 Years and over | 7 (5.4%) | 11 (10.0%) |
Technology Access in North Judson
Computing Device Access in North Judson
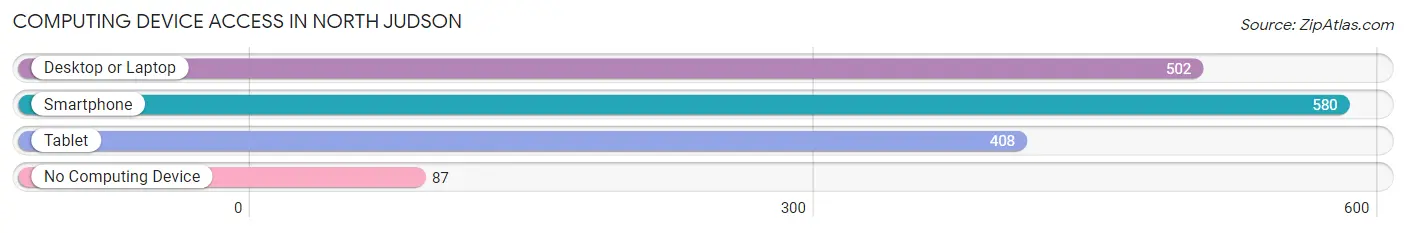
| Device Type | # Households | % Households |
| Desktop or Laptop | 502 | 66.9% |
| Smartphone | 580 | 77.3% |
| Tablet | 408 | 54.4% |
| No Computing Device | 87 | 11.6% |
| Total | 750 | 100.0% |
Internet Access in North Judson
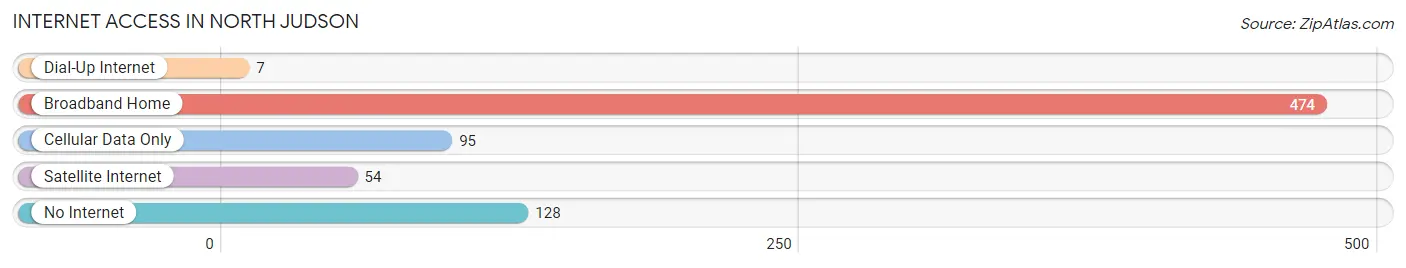
| Internet Type | # Households | % Households |
| Dial-Up Internet | 7 | 0.9% |
| Broadband Home | 474 | 63.2% |
| Cellular Data Only | 95 | 12.7% |
| Satellite Internet | 54 | 7.2% |
| No Internet | 128 | 17.1% |
| Total | 750 | 100.0% |
North Judson Summary
History
North Judson is a small town located in Starke County, Indiana. It is situated on the banks of the Kankakee River, about 30 miles south of South Bend. The town was founded in 1851 by a group of settlers from Ohio, led by John Judson. The town was named after Judson, and the “North” was added to distinguish it from another town in the area called South Judson.
The town grew slowly but steadily over the years, and by the early 1900s, it had become a thriving agricultural community. The town was home to several grain elevators, a flour mill, and a canning factory. The town also had a railroad station, which allowed for the transport of goods and people to and from the town.
In the early 1900s, the town began to experience a period of growth and prosperity. The town was home to several businesses, including a bank, a hotel, a movie theater, and a variety of stores. The town also had a public library, a hospital, and a high school.
In the 1950s, the town experienced a period of decline. Many of the businesses closed, and the population began to decline. In the late 1970s, the town began to experience a period of revitalization. The town was home to several new businesses, and the population began to increase.
Geography
North Judson is located in Starke County, Indiana. It is situated on the banks of the Kankakee River, about 30 miles south of South Bend. The town is located in a rural area, and is surrounded by farmland and woodlands. The town is located in the Central Till Plains region of Indiana, and is characterized by flat terrain and rolling hills.
The climate in North Judson is humid continental, with hot summers and cold winters. The average temperature in the summer is around 75 degrees Fahrenheit, and the average temperature in the winter is around 30 degrees Fahrenheit. The town receives an average of 40 inches of precipitation per year.
Economy
The economy of North Judson is largely based on agriculture. The town is home to several grain elevators, a flour mill, and a canning factory. The town also has a variety of small businesses, including restaurants, retail stores, and service providers.
The town is also home to a variety of manufacturing companies, including a plastics manufacturer, a metal fabricator, and a machine shop. The town is also home to a variety of healthcare providers, including a hospital, a nursing home, and several medical clinics.
Demographics
As of the 2010 census, the population of North Judson was 1,945. The population is largely white (94.3%), with small percentages of African American (2.2%), Hispanic (1.7%), and Asian (0.7%) residents. The median household income in the town is $41,250, and the median home value is $90,000. The town has a poverty rate of 16.3%.
Conclusion
North Judson is a small town located in Starke County, Indiana. It is situated on the banks of the Kankakee River, about 30 miles south of South Bend. The town was founded in 1851 by a group of settlers from Ohio, led by John Judson. The town has experienced periods of growth and decline over the years, but is currently experiencing a period of revitalization. The economy of the town is largely based on agriculture, and the town is home to a variety of small businesses. The population of the town is largely white, with small percentages of African American, Hispanic, and Asian residents.
Common Questions
What is Per Capita Income in North Judson?
Per Capita income in North Judson is $22,669.
What is the Median Family Income in North Judson?
Median Family Income in North Judson is $56,758.
What is the Median Household income in North Judson?
Median Household Income in North Judson is $51,071.
What is Income or Wage Gap in North Judson?
Income or Wage Gap in North Judson is 34.3%.
Women in North Judson earn 65.7 cents for every dollar earned by a man.
What is Inequality or Gini Index in North Judson?
Inequality or Gini Index in North Judson is 0.37.
What is the Total Population of North Judson?
Total Population of North Judson is 2,100.
What is the Total Male Population of North Judson?
Total Male Population of North Judson is 1,067.
What is the Total Female Population of North Judson?
Total Female Population of North Judson is 1,033.
What is the Ratio of Males per 100 Females in North Judson?
There are 103.29 Males per 100 Females in North Judson.
What is the Ratio of Females per 100 Males in North Judson?
There are 96.81 Females per 100 Males in North Judson.
What is the Median Population Age in North Judson?
Median Population Age in North Judson is 36.9 Years.
What is the Average Family Size in North Judson
Average Family Size in North Judson is 3.2 People.
What is the Average Household Size in North Judson
Average Household Size in North Judson is 2.8 People.
How Large is the Labor Force in North Judson?
There are 894 People in the Labor Forcein in North Judson.
What is the Percentage of People in the Labor Force in North Judson?
55.2% of People are in the Labor Force in North Judson.
What is the Unemployment Rate in North Judson?
Unemployment Rate in North Judson is 5.3%.