Newburgh, IN Map & Demographics
Newburgh Map
Newburgh Overview
$53,396
PER CAPITA INCOME
$101,786
AVG FAMILY INCOME
$67,772
AVG HOUSEHOLD INCOME
46.5%
WAGE / INCOME GAP [ % ]
53.5¢/ $1
WAGE / INCOME GAP [ $ ]
0.49
INEQUALITY / GINI INDEX
3,350
TOTAL POPULATION
1,754
MALE POPULATION
1,596
FEMALE POPULATION
109.90
MALES / 100 FEMALES
90.99
FEMALES / 100 MALES
48.8
MEDIAN AGE
2.7
AVG FAMILY SIZE
2.1
AVG HOUSEHOLD SIZE
1,831
LABOR FORCE [ PEOPLE ]
66.6%
PERCENT IN LABOR FORCE
7.0%
UNEMPLOYMENT RATE
Newburgh Zip Codes
Newburgh Area Codes
Income in Newburgh
Income Overview in Newburgh
Per Capita Income in Newburgh is $53,396, while median incomes of families and households are $101,786 and $67,772 respectively.
| Characteristic | Number | Measure |
| Per Capita Income | 3,350 | $53,396 |
| Median Family Income | 952 | $101,786 |
| Mean Family Income | 952 | $129,587 |
| Median Household Income | 1,593 | $67,772 |
| Mean Household Income | 1,593 | $115,601 |
| Income Deficit | 952 | $0 |
| Wage / Income Gap (%) | 3,350 | 46.52% |
| Wage / Income Gap ($) | 3,350 | 53.48¢ per $1 |
| Gini / Inequality Index | 3,350 | 0.49 |
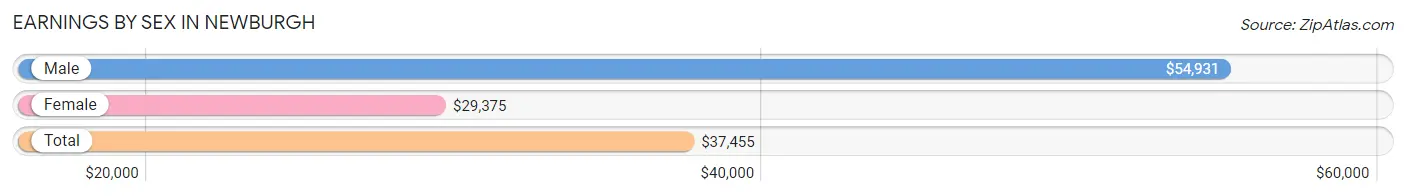
Earnings by Sex in Newburgh
Average Earnings in Newburgh are $37,455, $54,931 for men and $29,375 for women, a difference of 46.5%.
| Sex | Number | Average Earnings |
| Male | 899 (47.8%) | $54,931 |
| Female | 982 (52.2%) | $29,375 |
| Total | 1,881 (100.0%) | $37,455 |
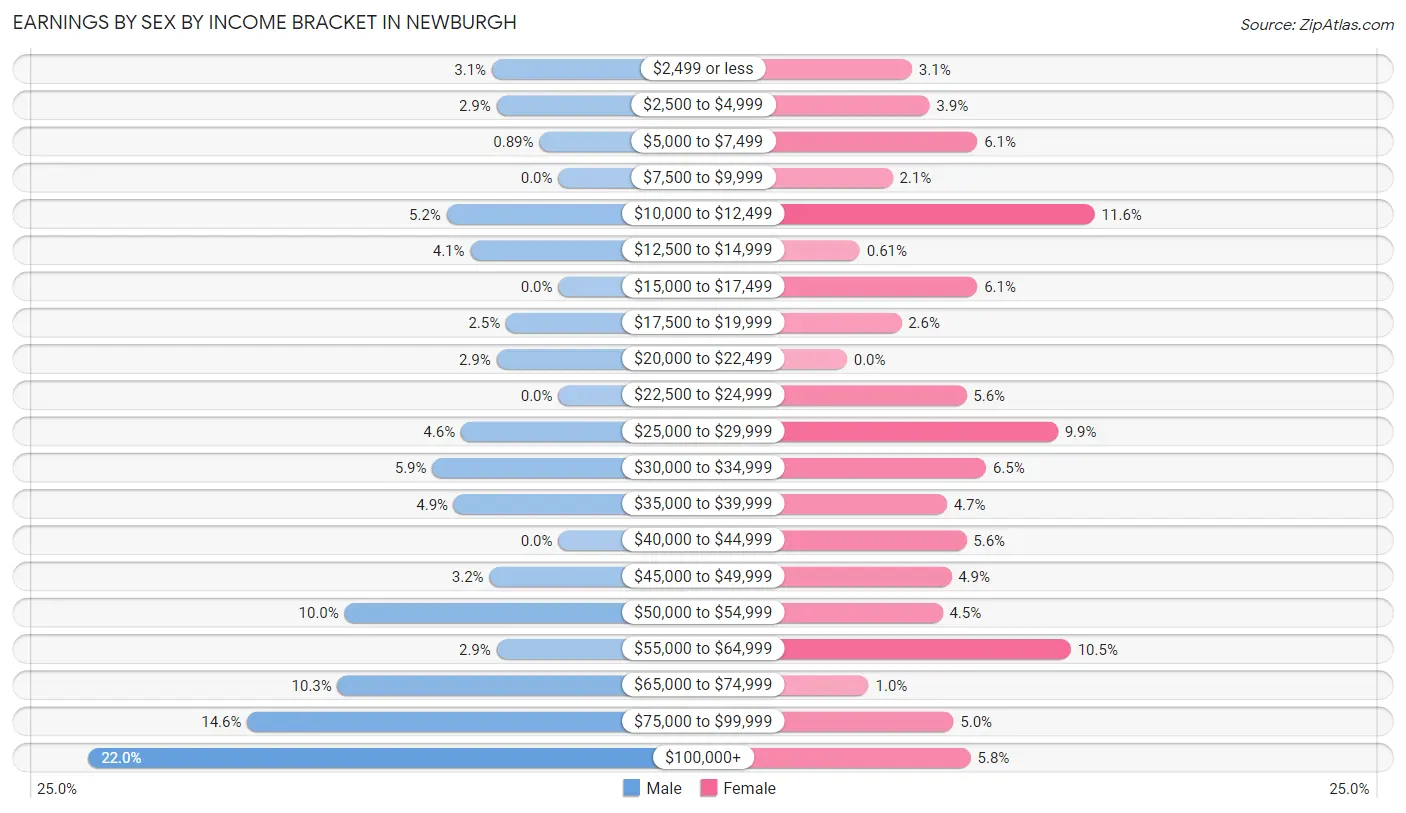
Earnings by Sex by Income Bracket in Newburgh
The most common earnings brackets in Newburgh are $100,000+ for men (198 | 22.0%) and $10,000 to $12,499 for women (114 | 11.6%).
| Income | Male | Female |
| $2,499 or less | 28 (3.1%) | 30 (3.0%) |
| $2,500 to $4,999 | 26 (2.9%) | 38 (3.9%) |
| $5,000 to $7,499 | 8 (0.9%) | 60 (6.1%) |
| $7,500 to $9,999 | 0 (0.0%) | 21 (2.1%) |
| $10,000 to $12,499 | 47 (5.2%) | 114 (11.6%) |
| $12,500 to $14,999 | 37 (4.1%) | 6 (0.6%) |
| $15,000 to $17,499 | 0 (0.0%) | 60 (6.1%) |
| $17,500 to $19,999 | 22 (2.5%) | 25 (2.5%) |
| $20,000 to $22,499 | 26 (2.9%) | 0 (0.0%) |
| $22,500 to $24,999 | 0 (0.0%) | 55 (5.6%) |
| $25,000 to $29,999 | 41 (4.6%) | 97 (9.9%) |
| $30,000 to $34,999 | 53 (5.9%) | 64 (6.5%) |
| $35,000 to $39,999 | 44 (4.9%) | 46 (4.7%) |
| $40,000 to $44,999 | 0 (0.0%) | 55 (5.6%) |
| $45,000 to $49,999 | 29 (3.2%) | 48 (4.9%) |
| $50,000 to $54,999 | 90 (10.0%) | 44 (4.5%) |
| $55,000 to $64,999 | 26 (2.9%) | 103 (10.5%) |
| $65,000 to $74,999 | 93 (10.3%) | 10 (1.0%) |
| $75,000 to $99,999 | 131 (14.6%) | 49 (5.0%) |
| $100,000+ | 198 (22.0%) | 57 (5.8%) |
| Total | 899 (100.0%) | 982 (100.0%) |
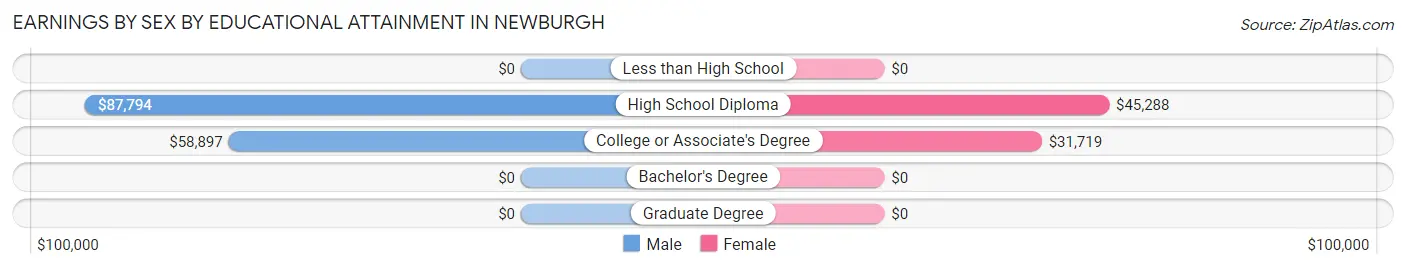
Earnings by Sex by Educational Attainment in Newburgh
Average earnings in Newburgh are $71,250 for men and $34,167 for women, a difference of 52.0%. Men with an educational attainment of high school diploma enjoy the highest average annual earnings of $87,794, while those with college or associate's degree education earn the least with $58,897. Women with an educational attainment of high school diploma earn the most with the average annual earnings of $45,288, while those with college or associate's degree education have the smallest earnings of $31,719.
| Educational Attainment | Male Income | Female Income |
| Less than High School | - | - |
| High School Diploma | $87,794 | $45,288 |
| College or Associate's Degree | $58,897 | $31,719 |
| Bachelor's Degree | - | - |
| Graduate Degree | - | - |
| Total | $71,250 | $34,167 |
Family Income in Newburgh
Family Income Brackets in Newburgh
According to the Newburgh family income data, there are 227 families falling into the $100,000 to $149,999 income range, which is the most common income bracket and makes up 23.8% of all families.
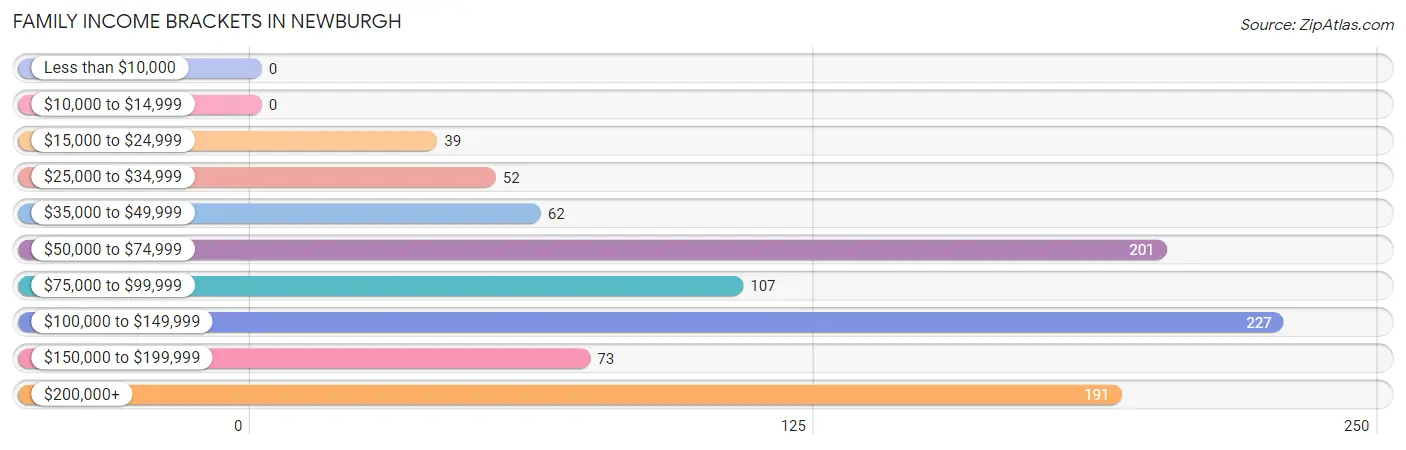
| Income Bracket | # Families | % Families |
| Less than $10,000 | 0 | 0.0% |
| $10,000 to $14,999 | 0 | 0.0% |
| $15,000 to $24,999 | 39 | 4.1% |
| $25,000 to $34,999 | 52 | 5.5% |
| $35,000 to $49,999 | 62 | 6.5% |
| $50,000 to $74,999 | 201 | 21.1% |
| $75,000 to $99,999 | 107 | 11.2% |
| $100,000 to $149,999 | 227 | 23.8% |
| $150,000 to $199,999 | 73 | 7.7% |
| $200,000+ | 191 | 20.1% |
Family Income by Famaliy Size in Newburgh
4-person families (129 | 13.6%) account for the highest median family income in Newburgh with $128,068 per family, while 2-person families (571 | 60.0%) have the highest median income of $43,244 per family member.
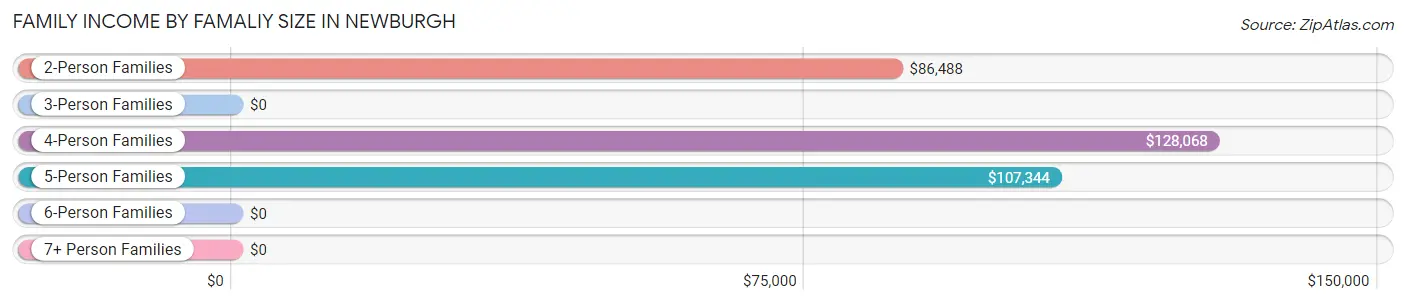
| Income Bracket | # Families | Median Income |
| 2-Person Families | 571 (60.0%) | $86,488 |
| 3-Person Families | 165 (17.3%) | $0 |
| 4-Person Families | 129 (13.6%) | $128,068 |
| 5-Person Families | 87 (9.1%) | $107,344 |
| 6-Person Families | 0 (0.0%) | $0 |
| 7+ Person Families | 0 (0.0%) | $0 |
| Total | 952 (100.0%) | $101,786 |
Family Income by Number of Earners in Newburgh
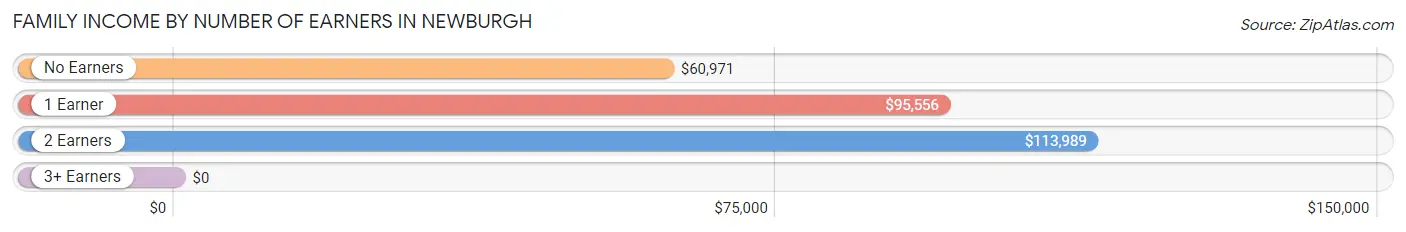
| Number of Earners | # Families | Median Income |
| No Earners | 166 (17.4%) | $60,971 |
| 1 Earner | 276 (29.0%) | $95,556 |
| 2 Earners | 455 (47.8%) | $113,989 |
| 3+ Earners | 55 (5.8%) | $0 |
| Total | 952 (100.0%) | $101,786 |
Household Income in Newburgh
Household Income Brackets in Newburgh
With 478 households falling in the category, the $50,000 to $74,999 income range is the most frequent in Newburgh, accounting for 30.0% of all households. In contrast, only 10 households (0.6%) fall into the less than $10,000 income bracket, making it the least populous group.
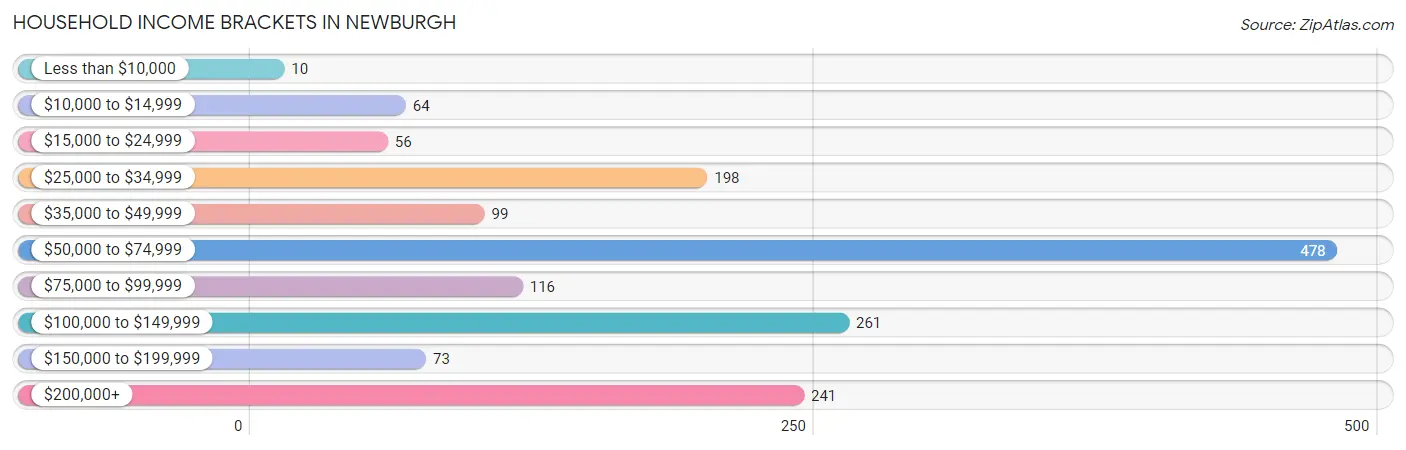
| Income Bracket | # Households | % Households |
| Less than $10,000 | 10 | 0.6% |
| $10,000 to $14,999 | 64 | 4.0% |
| $15,000 to $24,999 | 56 | 3.5% |
| $25,000 to $34,999 | 198 | 12.4% |
| $35,000 to $49,999 | 99 | 6.2% |
| $50,000 to $74,999 | 478 | 30.0% |
| $75,000 to $99,999 | 116 | 7.3% |
| $100,000 to $149,999 | 261 | 16.4% |
| $150,000 to $199,999 | 73 | 4.6% |
| $200,000+ | 241 | 15.1% |
Household Income by Householder Age in Newburgh
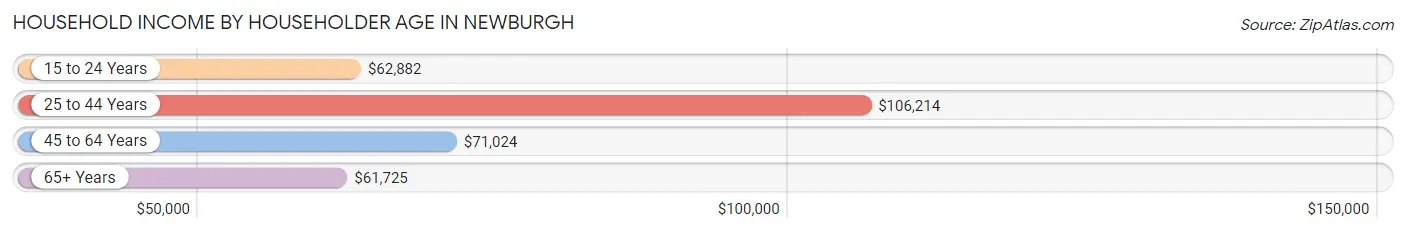
The median household income in Newburgh is $67,772, with the highest median household income of $106,214 found in the 25 to 44 years age bracket for the primary householder. A total of 278 households (17.4%) fall into this category. Meanwhile, the 65+ years age bracket for the primary householder has the lowest median household income of $61,725, with 471 households (29.6%) in this group.
| Income Bracket | # Households | Median Income |
| 15 to 24 Years | 89 (5.6%) | $62,882 |
| 25 to 44 Years | 278 (17.4%) | $106,214 |
| 45 to 64 Years | 755 (47.4%) | $71,024 |
| 65+ Years | 471 (29.6%) | $61,725 |
| Total | 1,593 (100.0%) | $67,772 |
Poverty in Newburgh
Income Below Poverty by Sex and Age in Newburgh
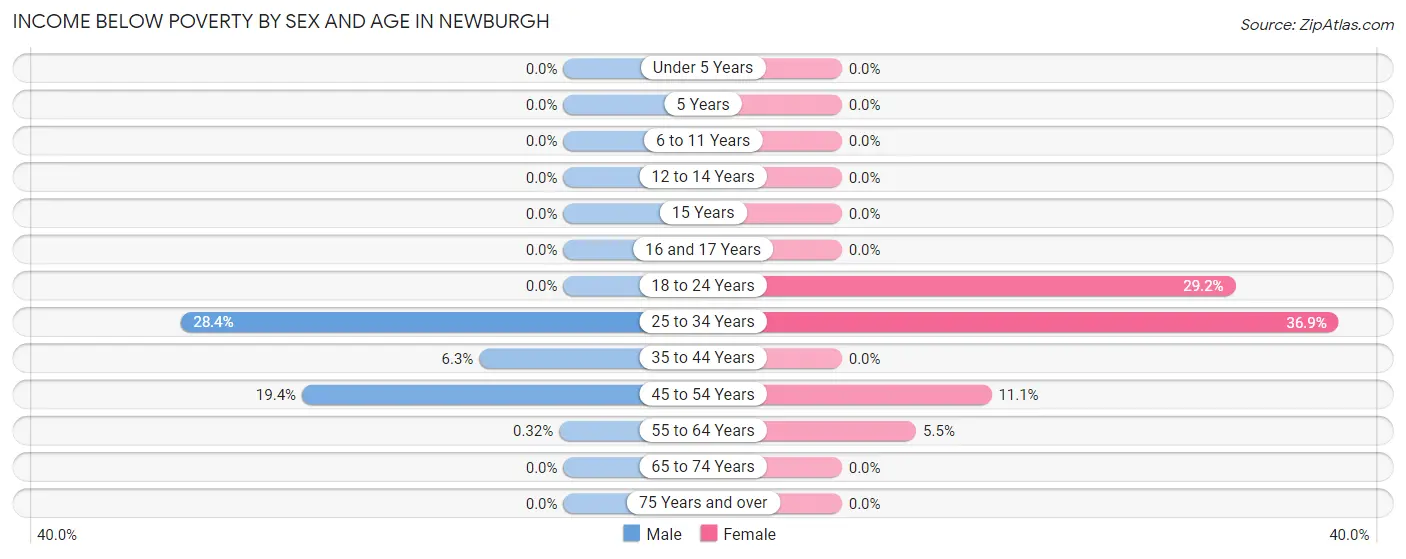
With 6.6% poverty level for males and 9.1% for females among the residents of Newburgh, 25 to 34 year old males and 25 to 34 year old females are the most vulnerable to poverty, with 62 males (28.4%) and 59 females (36.9%) in their respective age groups living below the poverty level.
| Age Bracket | Male | Female |
| Under 5 Years | 0 (0.0%) | 0 (0.0%) |
| 5 Years | 0 (0.0%) | 0 (0.0%) |
| 6 to 11 Years | 0 (0.0%) | 0 (0.0%) |
| 12 to 14 Years | 0 (0.0%) | 0 (0.0%) |
| 15 Years | 0 (0.0%) | 0 (0.0%) |
| 16 and 17 Years | 0 (0.0%) | 0 (0.0%) |
| 18 to 24 Years | 0 (0.0%) | 45 (29.2%) |
| 25 to 34 Years | 62 (28.4%) | 59 (36.9%) |
| 35 to 44 Years | 6 (6.2%) | 0 (0.0%) |
| 45 to 54 Years | 46 (19.4%) | 25 (11.1%) |
| 55 to 64 Years | 1 (0.3%) | 17 (5.5%) |
| 65 to 74 Years | 0 (0.0%) | 0 (0.0%) |
| 75 Years and over | 0 (0.0%) | 0 (0.0%) |
| Total | 115 (6.6%) | 146 (9.1%) |
Income Above Poverty by Sex and Age in Newburgh
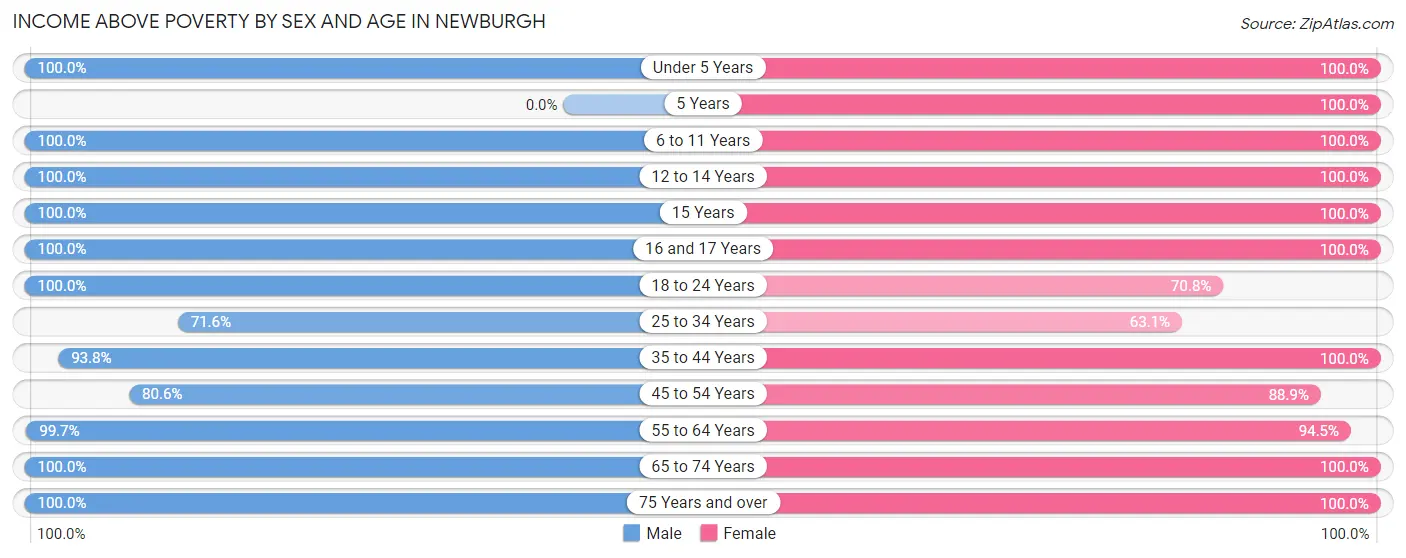
According to the poverty statistics in Newburgh, males aged under 5 years and females aged under 5 years are the age groups that are most secure financially, with 100.0% of males and 100.0% of females in these age groups living above the poverty line.
| Age Bracket | Male | Female |
| Under 5 Years | 81 (100.0%) | 132 (100.0%) |
| 5 Years | 0 (0.0%) | 3 (100.0%) |
| 6 to 11 Years | 160 (100.0%) | 34 (100.0%) |
| 12 to 14 Years | 96 (100.0%) | 9 (100.0%) |
| 15 Years | 61 (100.0%) | 19 (100.0%) |
| 16 and 17 Years | 44 (100.0%) | 62 (100.0%) |
| 18 to 24 Years | 90 (100.0%) | 109 (70.8%) |
| 25 to 34 Years | 156 (71.6%) | 101 (63.1%) |
| 35 to 44 Years | 90 (93.8%) | 151 (100.0%) |
| 45 to 54 Years | 191 (80.6%) | 200 (88.9%) |
| 55 to 64 Years | 316 (99.7%) | 291 (94.5%) |
| 65 to 74 Years | 171 (100.0%) | 138 (100.0%) |
| 75 Years and over | 178 (100.0%) | 201 (100.0%) |
| Total | 1,634 (93.4%) | 1,450 (90.8%) |
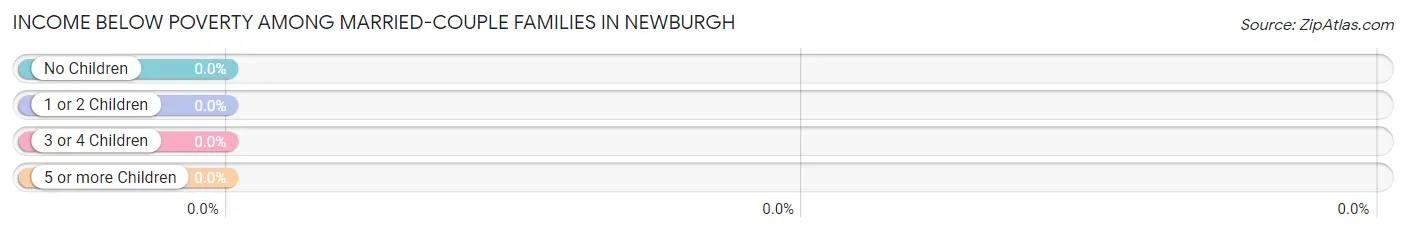
Income Below Poverty Among Married-Couple Families in Newburgh
| Children | Above Poverty | Below Poverty |
| No Children | 550 (100.0%) | 0 (0.0%) |
| 1 or 2 Children | 224 (100.0%) | 0 (0.0%) |
| 3 or 4 Children | 50 (100.0%) | 0 (0.0%) |
| 5 or more Children | 0 (0.0%) | 0 (0.0%) |
| Total | 824 (100.0%) | 0 (0.0%) |
Income Below Poverty Among Single-Parent Households in Newburgh
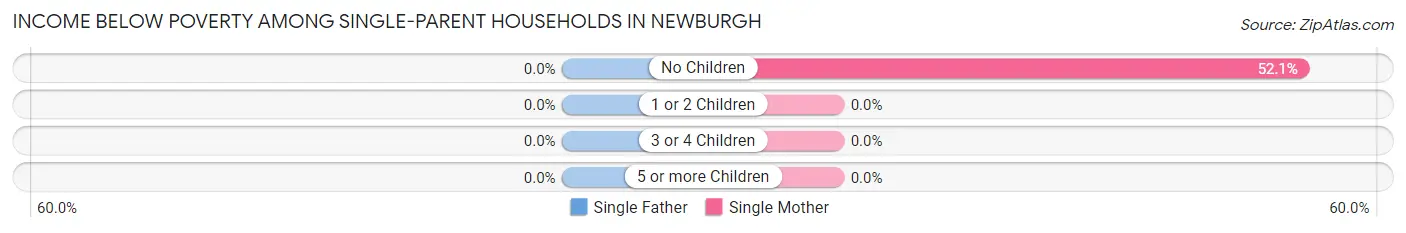
| Children | Single Father | Single Mother |
| No Children | 0 (0.0%) | 25 (52.1%) |
| 1 or 2 Children | 0 (0.0%) | 0 (0.0%) |
| 3 or 4 Children | 0 (0.0%) | 0 (0.0%) |
| 5 or more Children | 0 (0.0%) | 0 (0.0%) |
| Total | 0 (0.0%) | 25 (23.2%) |
Income Below Poverty Among Married-Couple vs Single-Parent Households in Newburgh
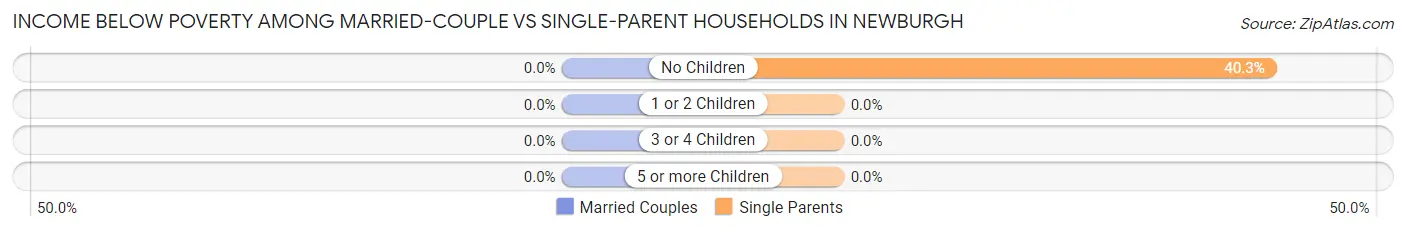
| Children | Married-Couple Families | Single-Parent Households |
| No Children | 0 (0.0%) | 25 (40.3%) |
| 1 or 2 Children | 0 (0.0%) | 0 (0.0%) |
| 3 or 4 Children | 0 (0.0%) | 0 (0.0%) |
| 5 or more Children | 0 (0.0%) | 0 (0.0%) |
| Total | 0 (0.0%) | 25 (19.5%) |
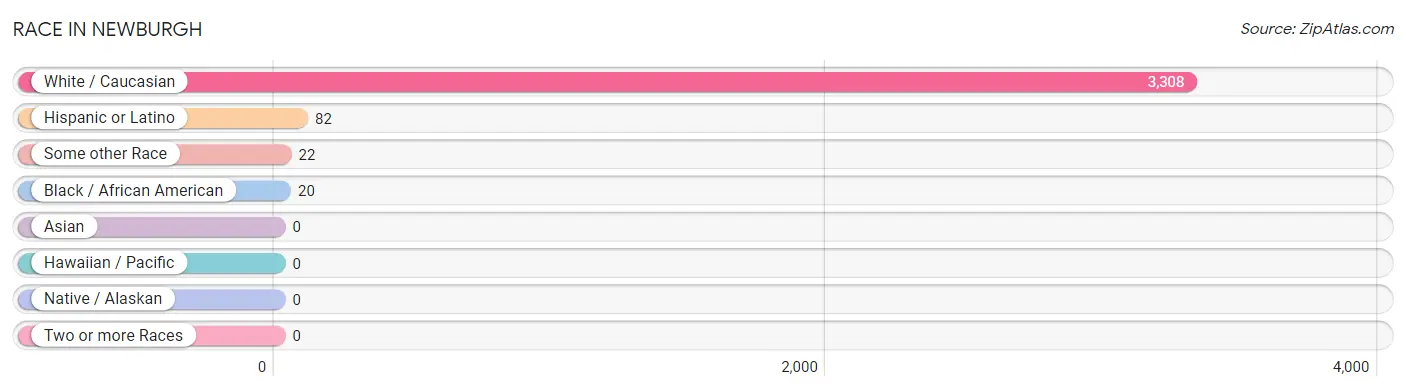
Race in Newburgh
The most populous races in Newburgh are White / Caucasian (3,308 | 98.8%), Hispanic or Latino (82 | 2.5%), and Some other Race (22 | 0.7%).
| Race | # Population | % Population |
| Asian | 0 | 0.0% |
| Black / African American | 20 | 0.6% |
| Hawaiian / Pacific | 0 | 0.0% |
| Hispanic or Latino | 82 | 2.5% |
| Native / Alaskan | 0 | 0.0% |
| White / Caucasian | 3,308 | 98.8% |
| Two or more Races | 0 | 0.0% |
| Some other Race | 22 | 0.7% |
| Total | 3,350 | 100.0% |
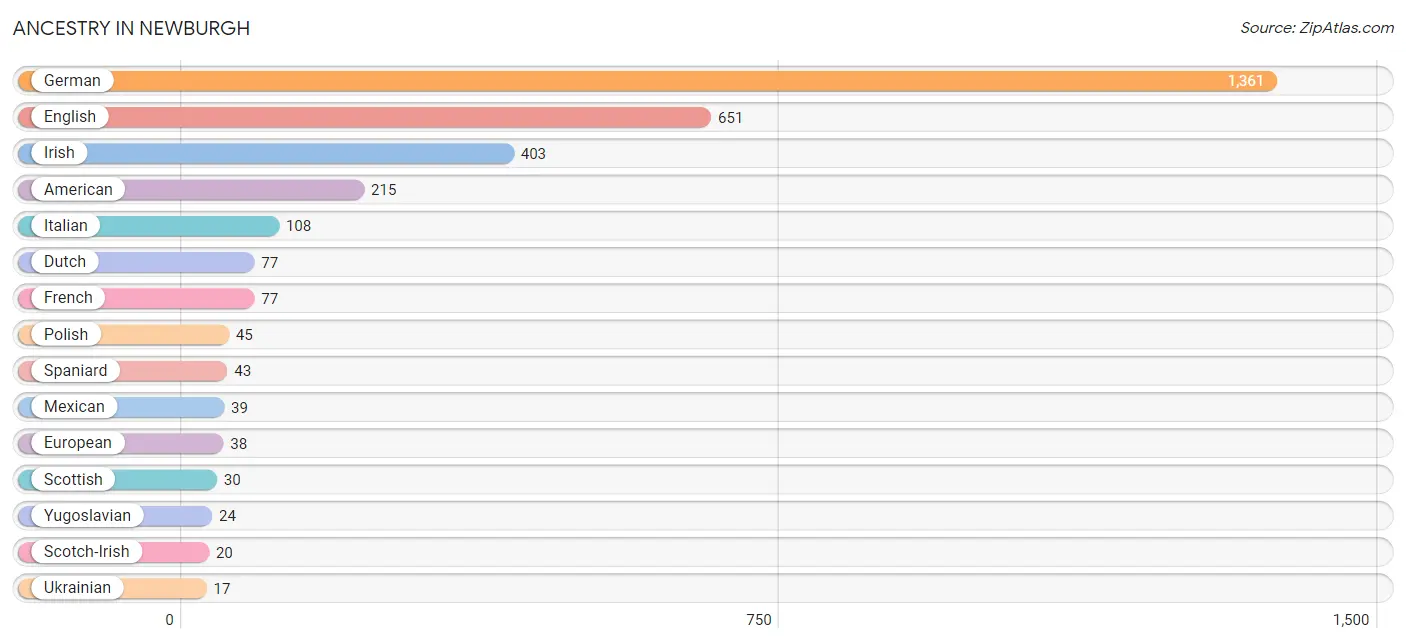
Ancestry in Newburgh
The most populous ancestries reported in Newburgh are German (1,361 | 40.6%), English (651 | 19.4%), Irish (403 | 12.0%), American (215 | 6.4%), and Italian (108 | 3.2%), together accounting for 81.7% of all Newburgh residents.
| Ancestry | # Population | % Population |
| American | 215 | 6.4% |
| British | 14 | 0.4% |
| Dutch | 77 | 2.3% |
| Eastern European | 8 | 0.2% |
| English | 651 | 19.4% |
| European | 38 | 1.1% |
| French | 77 | 2.3% |
| German | 1,361 | 40.6% |
| Irish | 403 | 12.0% |
| Italian | 108 | 3.2% |
| Mexican | 39 | 1.2% |
| Polish | 45 | 1.3% |
| Scotch-Irish | 20 | 0.6% |
| Scottish | 30 | 0.9% |
| Slovak | 9 | 0.3% |
| Spaniard | 43 | 1.3% |
| Swedish | 7 | 0.2% |
| Ukrainian | 17 | 0.5% |
| Yugoslavian | 24 | 0.7% | View All 19 Rows |
Immigrants in Newburgh

| Immigration Origin | # Population | % Population | View All 0 Rows |
Sex and Age in Newburgh
Sex and Age in Newburgh
The most populous age groups in Newburgh are 60 to 64 Years (206 | 11.7%) for men and 55 to 59 Years (161 | 10.1%) for women.
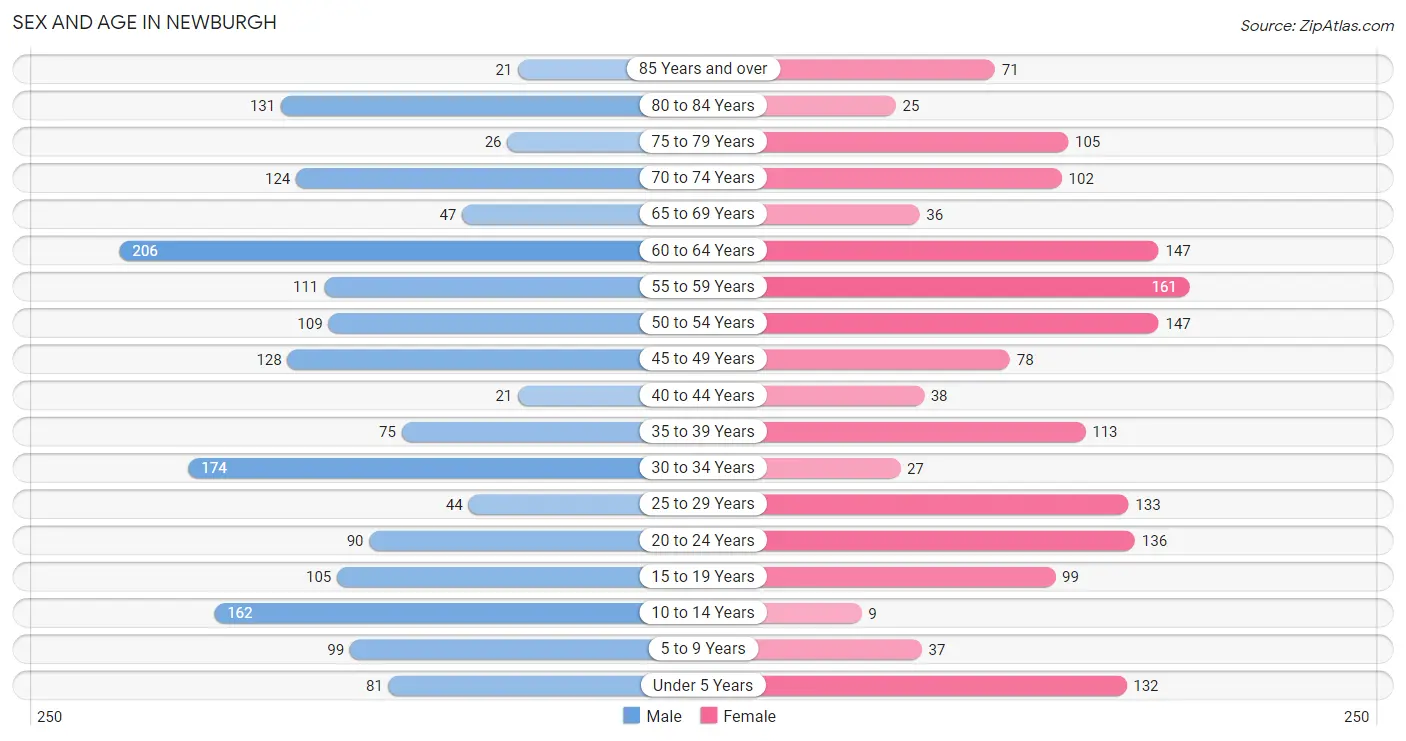
| Age Bracket | Male | Female |
| Under 5 Years | 81 (4.6%) | 132 (8.3%) |
| 5 to 9 Years | 99 (5.6%) | 37 (2.3%) |
| 10 to 14 Years | 162 (9.2%) | 9 (0.6%) |
| 15 to 19 Years | 105 (6.0%) | 99 (6.2%) |
| 20 to 24 Years | 90 (5.1%) | 136 (8.5%) |
| 25 to 29 Years | 44 (2.5%) | 133 (8.3%) |
| 30 to 34 Years | 174 (9.9%) | 27 (1.7%) |
| 35 to 39 Years | 75 (4.3%) | 113 (7.1%) |
| 40 to 44 Years | 21 (1.2%) | 38 (2.4%) |
| 45 to 49 Years | 128 (7.3%) | 78 (4.9%) |
| 50 to 54 Years | 109 (6.2%) | 147 (9.2%) |
| 55 to 59 Years | 111 (6.3%) | 161 (10.1%) |
| 60 to 64 Years | 206 (11.7%) | 147 (9.2%) |
| 65 to 69 Years | 47 (2.7%) | 36 (2.3%) |
| 70 to 74 Years | 124 (7.1%) | 102 (6.4%) |
| 75 to 79 Years | 26 (1.5%) | 105 (6.6%) |
| 80 to 84 Years | 131 (7.5%) | 25 (1.6%) |
| 85 Years and over | 21 (1.2%) | 71 (4.4%) |
| Total | 1,754 (100.0%) | 1,596 (100.0%) |
Families and Households in Newburgh
Median Family Size in Newburgh
The median family size in Newburgh is 2.66 persons per family, with single female/mother families (108 | 11.3%) accounting for the largest median family size of 2.96 persons per family. On the other hand, single male/father families (20 | 2.1%) represent the smallest median family size with 2.15 persons per family.
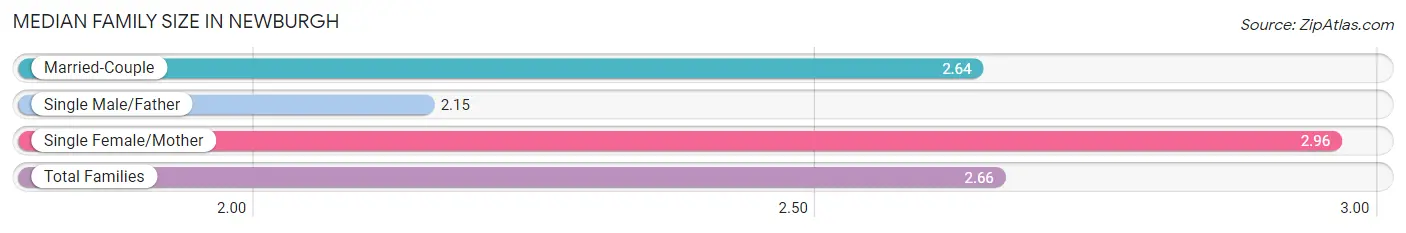
| Family Type | # Families | Family Size |
| Married-Couple | 824 (86.6%) | 2.64 |
| Single Male/Father | 20 (2.1%) | 2.15 |
| Single Female/Mother | 108 (11.3%) | 2.96 |
| Total Families | 952 (100.0%) | 2.66 |
Median Household Size in Newburgh
The median household size in Newburgh is 2.10 persons per household, with single female/mother households (108 | 6.8%) accounting for the largest median household size of 3.08 persons per household. non-family households (641 | 40.2%) represent the smallest median household size with 1.20 persons per household.
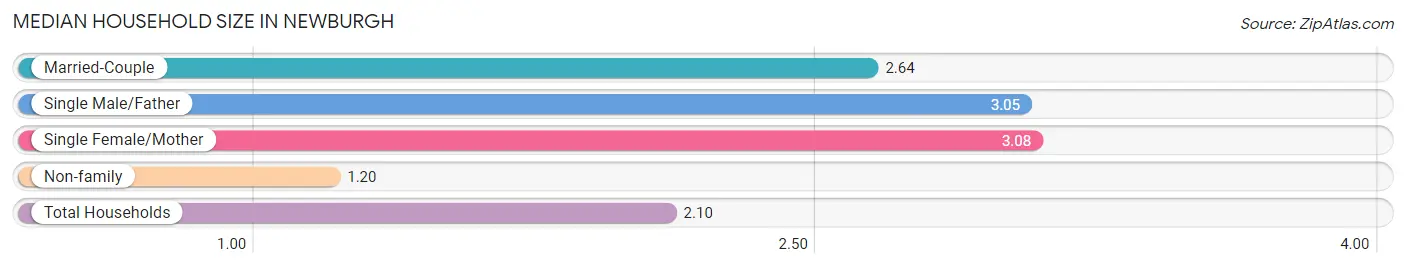
| Household Type | # Households | Household Size |
| Married-Couple | 824 (51.7%) | 2.64 |
| Single Male/Father | 20 (1.3%) | 3.05 |
| Single Female/Mother | 108 (6.8%) | 3.08 |
| Non-family | 641 (40.2%) | 1.20 |
| Total Households | 1,593 (100.0%) | 2.10 |
Household Size by Marriage Status in Newburgh
Out of a total of 1,593 households in Newburgh, 952 (59.8%) are family households, while 641 (40.2%) are nonfamily households. The most numerous type of family households are 2-person households, comprising 556, and the most common type of nonfamily households are 1-person households, comprising 559.
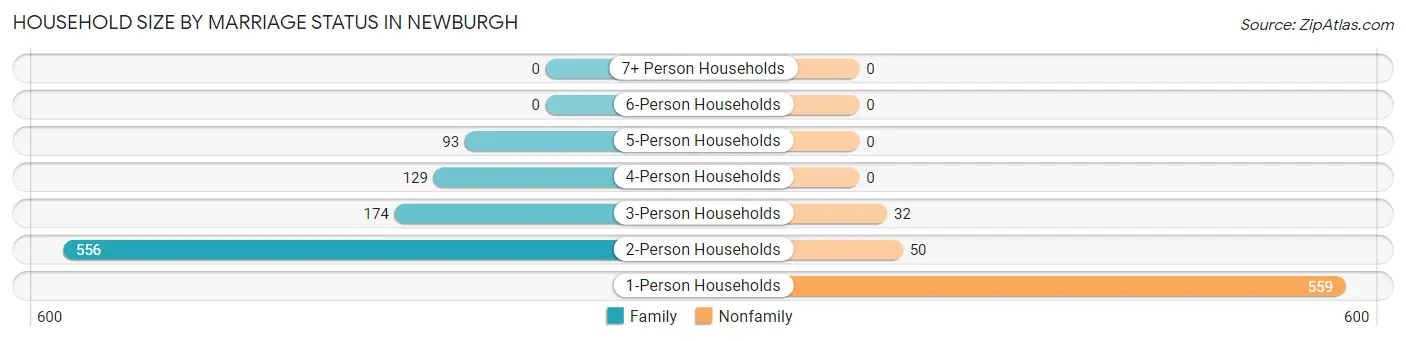
| Household Size | Family Households | Nonfamily Households |
| 1-Person Households | - | 559 (35.1%) |
| 2-Person Households | 556 (34.9%) | 50 (3.1%) |
| 3-Person Households | 174 (10.9%) | 32 (2.0%) |
| 4-Person Households | 129 (8.1%) | 0 (0.0%) |
| 5-Person Households | 93 (5.8%) | 0 (0.0%) |
| 6-Person Households | 0 (0.0%) | 0 (0.0%) |
| 7+ Person Households | 0 (0.0%) | 0 (0.0%) |
| Total | 952 (59.8%) | 641 (40.2%) |
Female Fertility in Newburgh
Fertility by Age in Newburgh
Average fertility rate in Newburgh is 79.0 births per 1,000 women. Women in the age bracket of 20 to 34 years have the highest fertility rate with 118.0 births per 1,000 women. Women in the age bracket of 20 to 34 years acount for 68.6% of all women with births.
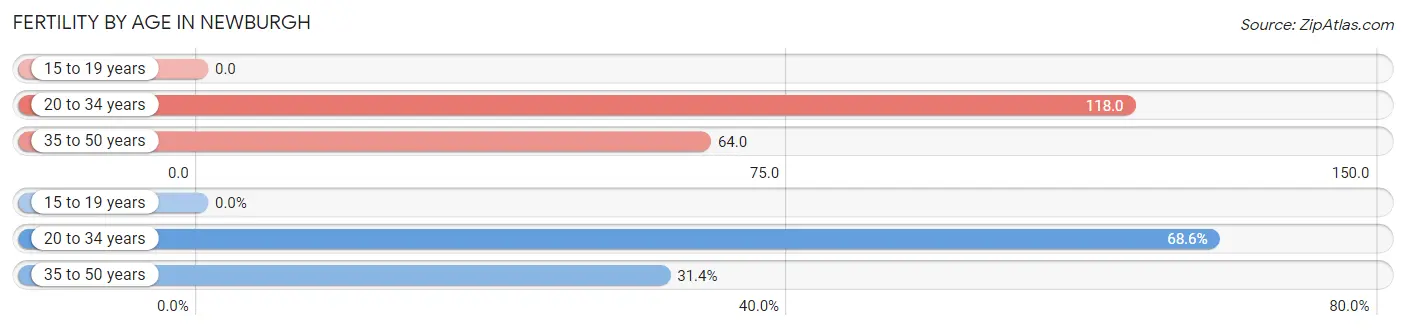
| Age Bracket | Women with Births | Births / 1,000 Women |
| 15 to 19 years | 0 (0.0%) | 0.0 |
| 20 to 34 years | 35 (68.6%) | 118.0 |
| 35 to 50 years | 16 (31.4%) | 64.0 |
| Total | 51 (100.0%) | 79.0 |
Fertility by Age by Marriage Status in Newburgh
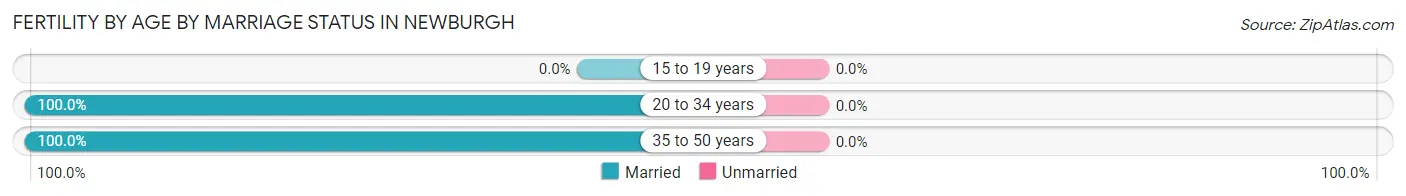
| Age Bracket | Married | Unmarried |
| 15 to 19 years | 0 (0.0%) | 0 (0.0%) |
| 20 to 34 years | 35 (100.0%) | 0 (0.0%) |
| 35 to 50 years | 16 (100.0%) | 0 (0.0%) |
| Total | 51 (100.0%) | 0 (0.0%) |
Fertility by Education in Newburgh
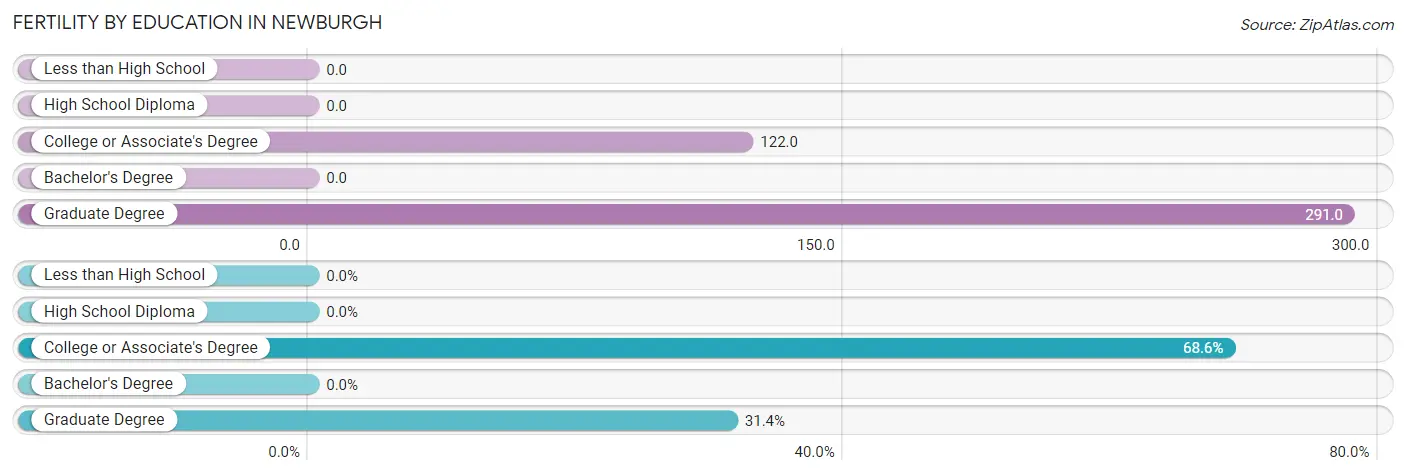
| Educational Attainment | Women with Births | Births / 1,000 Women |
| Less than High School | 0 (0.0%) | 0.0 |
| High School Diploma | 0 (0.0%) | 0.0 |
| College or Associate's Degree | 35 (68.6%) | 122.0 |
| Bachelor's Degree | 0 (0.0%) | 0.0 |
| Graduate Degree | 16 (31.4%) | 291.0 |
| Total | 51 (100.0%) | 79.0 |
Fertility by Education by Marriage Status in Newburgh
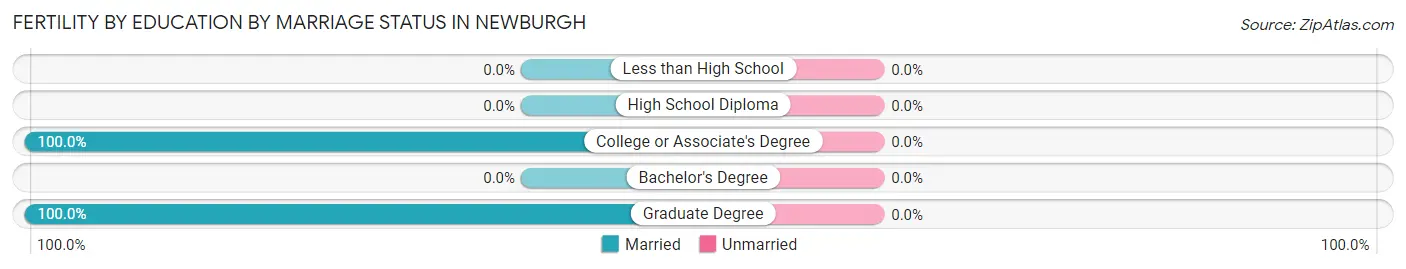
| Educational Attainment | Married | Unmarried |
| Less than High School | 0 (0.0%) | 0 (0.0%) |
| High School Diploma | 0 (0.0%) | 0 (0.0%) |
| College or Associate's Degree | 35 (100.0%) | 0 (0.0%) |
| Bachelor's Degree | 0 (0.0%) | 0 (0.0%) |
| Graduate Degree | 16 (100.0%) | 0 (0.0%) |
| Total | 51 (100.0%) | 0 (0.0%) |
Employment Characteristics in Newburgh
Employment by Class of Employer in Newburgh
Among the 1,678 employed individuals in Newburgh, private company employees (1,090 | 65.0%), not-for-profit organizations (330 | 19.7%), and self-employed (incorporated) (83 | 5.0%) make up the most common classes of employment.
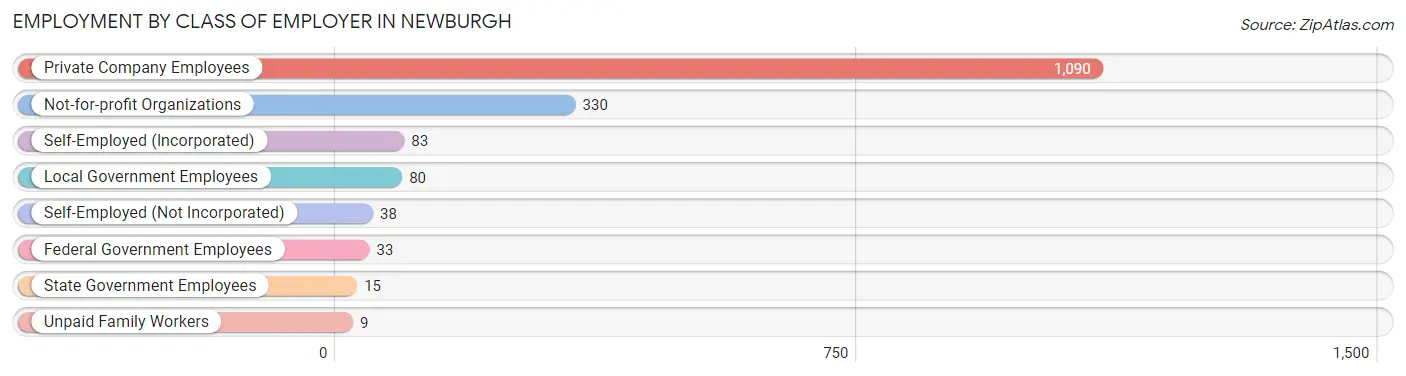
| Employer Class | # Employees | % Employees |
| Private Company Employees | 1,090 | 65.0% |
| Self-Employed (Incorporated) | 83 | 5.0% |
| Self-Employed (Not Incorporated) | 38 | 2.3% |
| Not-for-profit Organizations | 330 | 19.7% |
| Local Government Employees | 80 | 4.8% |
| State Government Employees | 15 | 0.9% |
| Federal Government Employees | 33 | 2.0% |
| Unpaid Family Workers | 9 | 0.5% |
| Total | 1,678 | 100.0% |
Employment Status by Age in Newburgh
According to the labor force statistics for Newburgh, out of the total population over 16 years of age (2,750), 66.6% or 1,832 individuals are in the labor force, with 7.0% or 128 of them unemployed. The age group with the highest labor force participation rate is 45 to 54 years, with 99.6% or 460 individuals in the labor force. Within the labor force, the 16 to 19 years age range has the highest percentage of unemployed individuals, with 50.0% or 18 of them being unemployed.
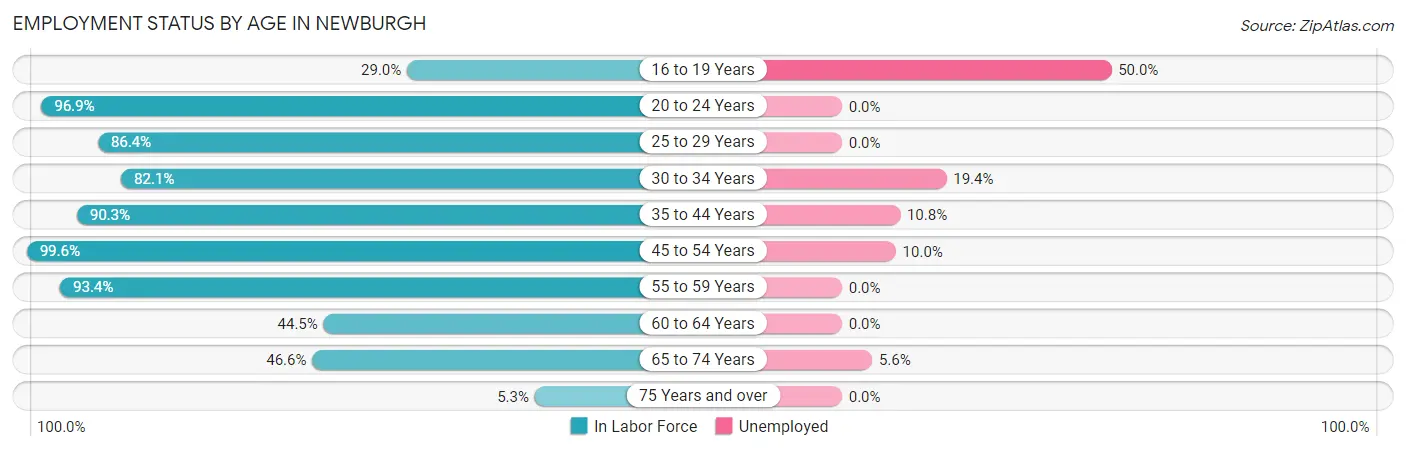
| Age Bracket | In Labor Force | Unemployed |
| 16 to 19 Years | 36 (29.0%) | 18 (50.0%) |
| 20 to 24 Years | 219 (96.9%) | 0 (0.0%) |
| 25 to 29 Years | 153 (86.4%) | 0 (0.0%) |
| 30 to 34 Years | 165 (82.1%) | 32 (19.4%) |
| 35 to 44 Years | 223 (90.3%) | 24 (10.8%) |
| 45 to 54 Years | 460 (99.6%) | 46 (10.0%) |
| 55 to 59 Years | 254 (93.4%) | 0 (0.0%) |
| 60 to 64 Years | 157 (44.5%) | 0 (0.0%) |
| 65 to 74 Years | 144 (46.6%) | 8 (5.6%) |
| 75 Years and over | 20 (5.3%) | 0 (0.0%) |
| Total | 1,831 (66.6%) | 128 (7.0%) |
Employment Status by Educational Attainment in Newburgh
According to labor force statistics for Newburgh, 82.5% of individuals (1,412) out of the total population between 25 and 64 years of age (1,712) are in the labor force, with 7.2% or 102 of them being unemployed. The group with the highest labor force participation rate are those with the educational attainment of bachelor's degree or higher, with 96.5% or 558 individuals in the labor force. Within the labor force, individuals with bachelor's degree or higher education have the highest percentage of unemployment, with 14.0% or 78 of them being unemployed.
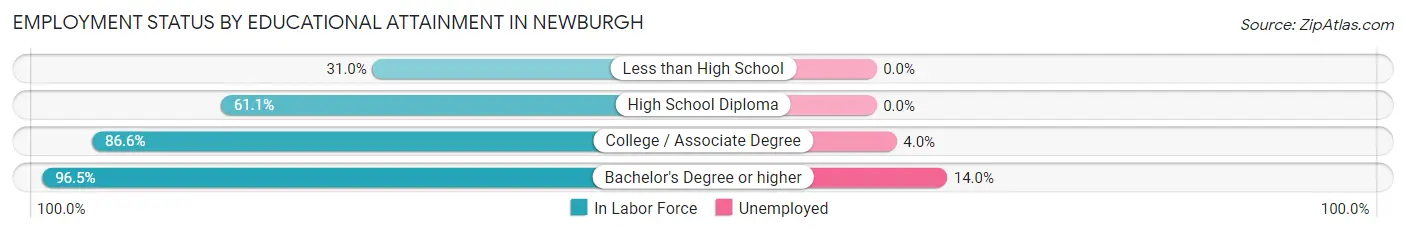
| Educational Attainment | In Labor Force | Unemployed |
| Less than High School | 18 (31.0%) | 0 (0.0%) |
| High School Diploma | 229 (61.1%) | 0 (0.0%) |
| College / Associate Degree | 607 (86.6%) | 28 (4.0%) |
| Bachelor's Degree or higher | 558 (96.5%) | 81 (14.0%) |
| Total | 1,412 (82.5%) | 123 (7.2%) |
Employment Occupations by Sex in Newburgh
Management, Business, Science and Arts Occupations
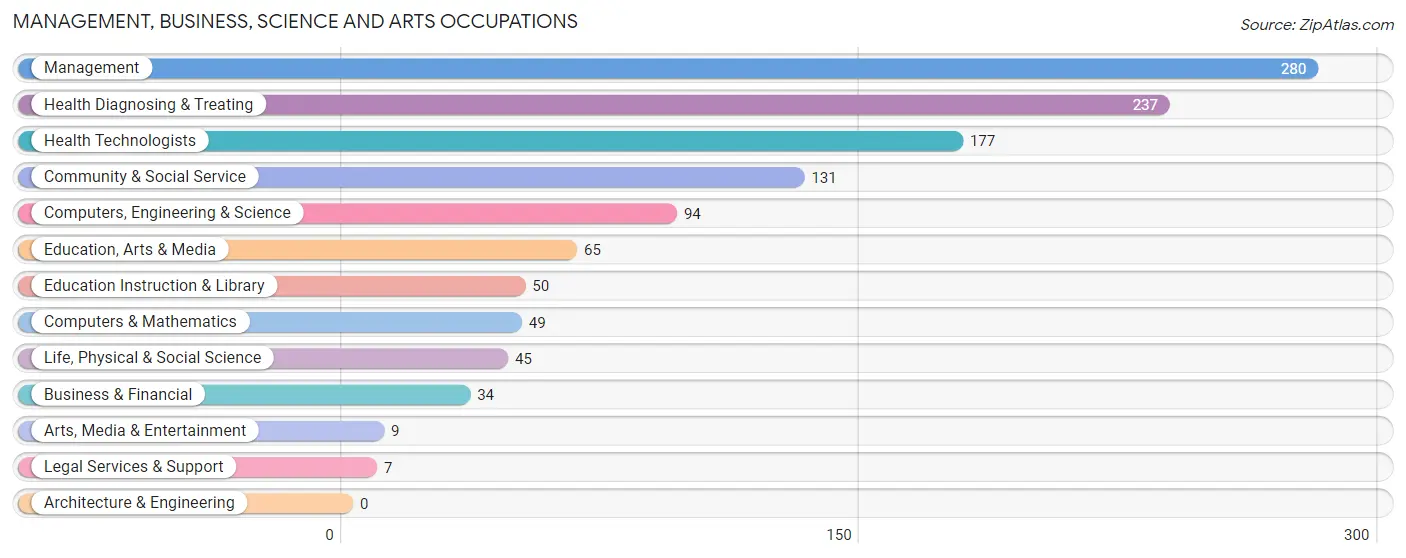
The most common Management, Business, Science and Arts occupations in Newburgh are Management (280 | 16.4%), Health Diagnosing & Treating (237 | 13.9%), Health Technologists (177 | 10.4%), Community & Social Service (131 | 7.7%), and Computers, Engineering & Science (94 | 5.5%).
Management, Business, Science and Arts Occupations by Sex
Within the Management, Business, Science and Arts occupations in Newburgh, the most male-oriented occupations are Business & Financial (100.0%), Legal Services & Support (100.0%), and Computers & Mathematics (87.8%), while the most female-oriented occupations are Education, Arts & Media (100.0%), Arts, Media & Entertainment (100.0%), and Education Instruction & Library (92.0%).
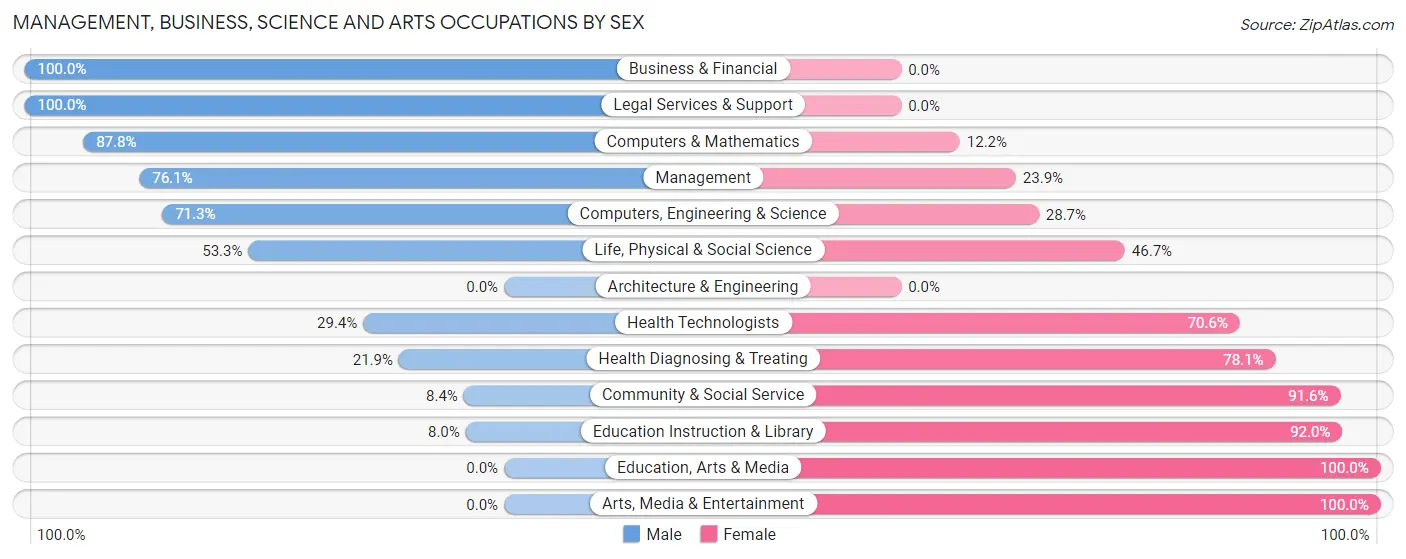
| Occupation | Male | Female |
| Management | 213 (76.1%) | 67 (23.9%) |
| Business & Financial | 34 (100.0%) | 0 (0.0%) |
| Computers, Engineering & Science | 67 (71.3%) | 27 (28.7%) |
| Computers & Mathematics | 43 (87.8%) | 6 (12.2%) |
| Architecture & Engineering | 0 (0.0%) | 0 (0.0%) |
| Life, Physical & Social Science | 24 (53.3%) | 21 (46.7%) |
| Community & Social Service | 11 (8.4%) | 120 (91.6%) |
| Education, Arts & Media | 0 (0.0%) | 65 (100.0%) |
| Legal Services & Support | 7 (100.0%) | 0 (0.0%) |
| Education Instruction & Library | 4 (8.0%) | 46 (92.0%) |
| Arts, Media & Entertainment | 0 (0.0%) | 9 (100.0%) |
| Health Diagnosing & Treating | 52 (21.9%) | 185 (78.1%) |
| Health Technologists | 52 (29.4%) | 125 (70.6%) |
| Total (Category) | 377 (48.6%) | 399 (51.4%) |
| Total (Overall) | 733 (43.0%) | 970 (57.0%) |
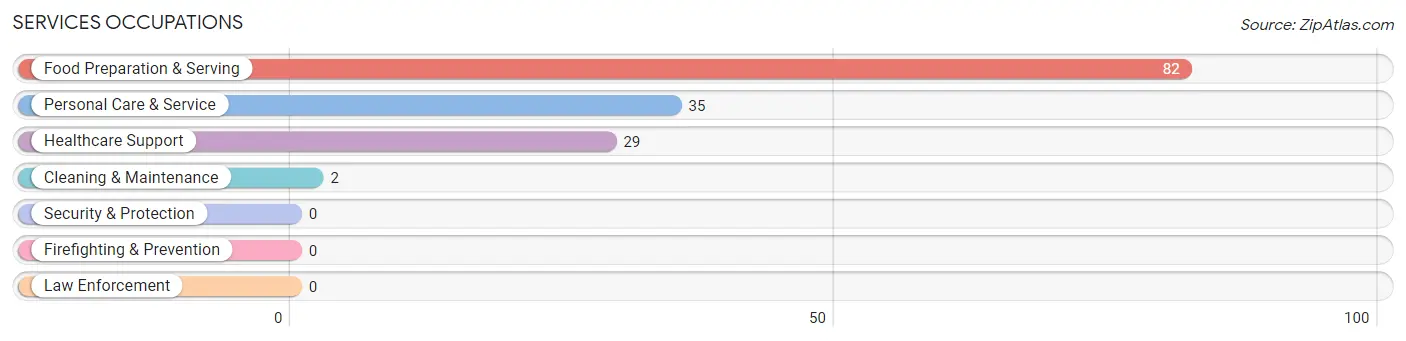
Services Occupations
The most common Services occupations in Newburgh are Food Preparation & Serving (82 | 4.8%), Personal Care & Service (35 | 2.1%), Healthcare Support (29 | 1.7%), and Cleaning & Maintenance (2 | 0.1%).
Services Occupations by Sex
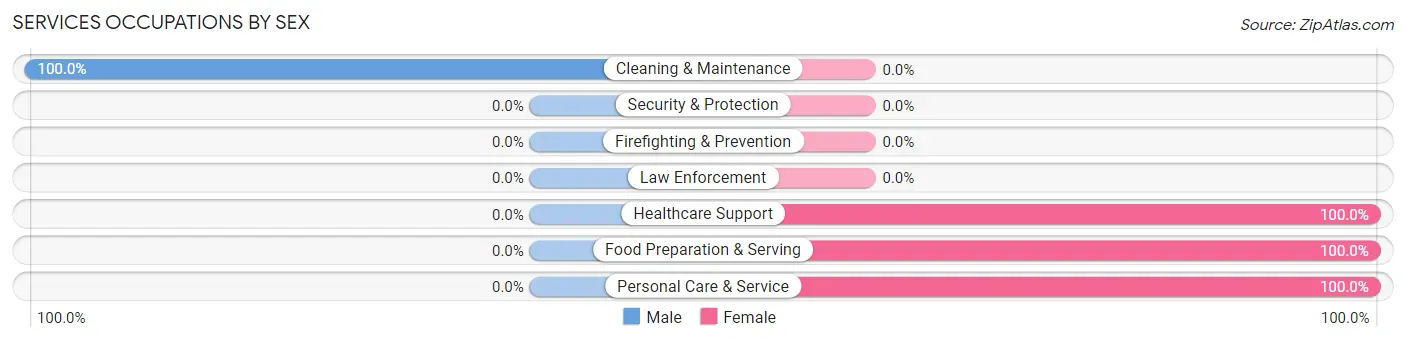
| Occupation | Male | Female |
| Healthcare Support | 0 (0.0%) | 29 (100.0%) |
| Security & Protection | 0 (0.0%) | 0 (0.0%) |
| Firefighting & Prevention | 0 (0.0%) | 0 (0.0%) |
| Law Enforcement | 0 (0.0%) | 0 (0.0%) |
| Food Preparation & Serving | 0 (0.0%) | 82 (100.0%) |
| Cleaning & Maintenance | 2 (100.0%) | 0 (0.0%) |
| Personal Care & Service | 0 (0.0%) | 35 (100.0%) |
| Total (Category) | 2 (1.3%) | 146 (98.7%) |
| Total (Overall) | 733 (43.0%) | 970 (57.0%) |
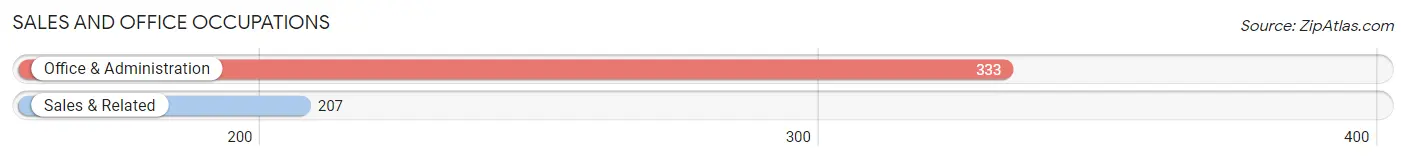
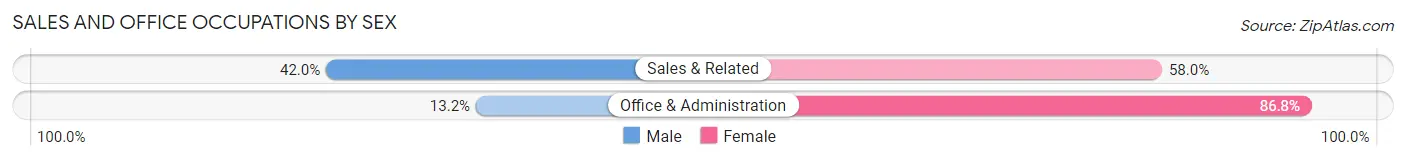
Sales and Office Occupations
The most common Sales and Office occupations in Newburgh are Office & Administration (333 | 19.6%), and Sales & Related (207 | 12.2%).
Sales and Office Occupations by Sex
| Occupation | Male | Female |
| Sales & Related | 87 (42.0%) | 120 (58.0%) |
| Office & Administration | 44 (13.2%) | 289 (86.8%) |
| Total (Category) | 131 (24.3%) | 409 (75.7%) |
| Total (Overall) | 733 (43.0%) | 970 (57.0%) |
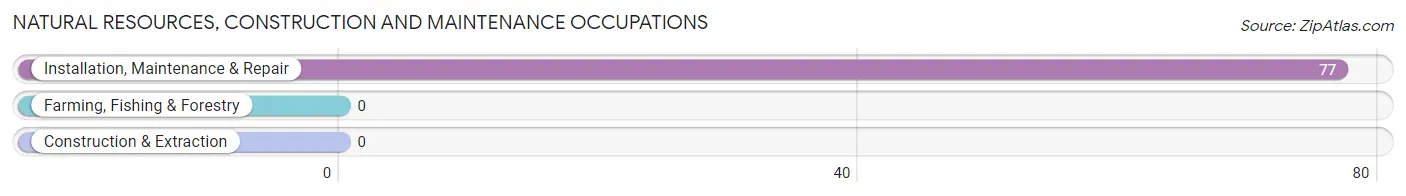
Natural Resources, Construction and Maintenance Occupations
The most common Natural Resources, Construction and Maintenance occupations in Newburgh are , and Installation, Maintenance & Repair (77 | 4.5%).
Natural Resources, Construction and Maintenance Occupations by Sex
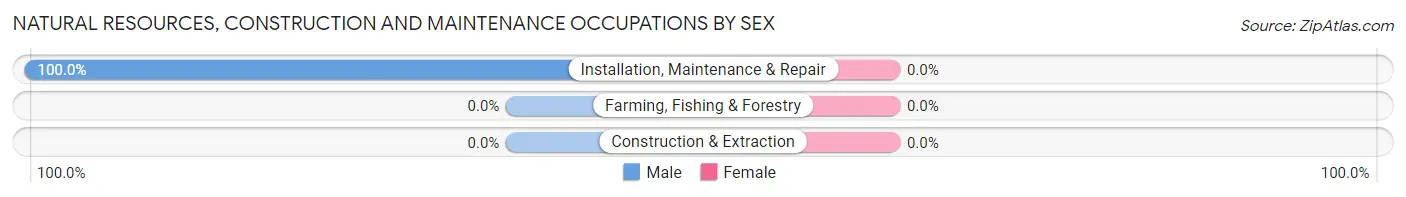
| Occupation | Male | Female |
| Farming, Fishing & Forestry | 0 (0.0%) | 0 (0.0%) |
| Construction & Extraction | 0 (0.0%) | 0 (0.0%) |
| Installation, Maintenance & Repair | 77 (100.0%) | 0 (0.0%) |
| Total (Category) | 77 (100.0%) | 0 (0.0%) |
| Total (Overall) | 733 (43.0%) | 970 (57.0%) |
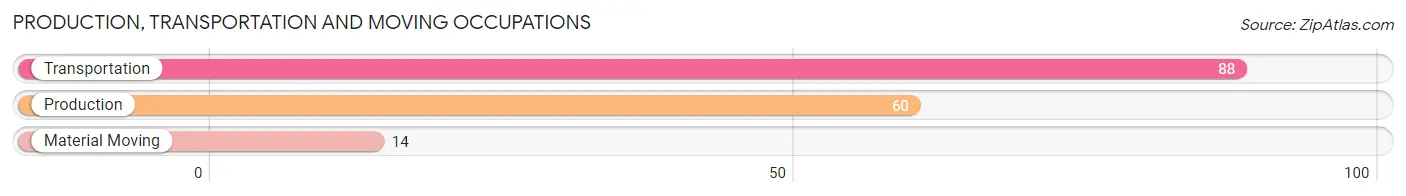
Production, Transportation and Moving Occupations
The most common Production, Transportation and Moving occupations in Newburgh are Transportation (88 | 5.2%), Production (60 | 3.5%), and Material Moving (14 | 0.8%).
Production, Transportation and Moving Occupations by Sex
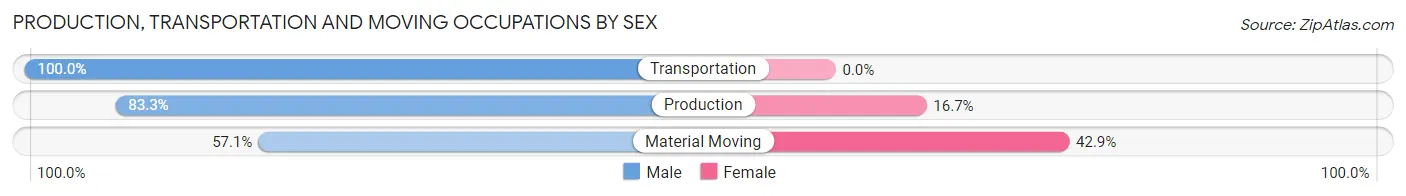
| Occupation | Male | Female |
| Production | 50 (83.3%) | 10 (16.7%) |
| Transportation | 88 (100.0%) | 0 (0.0%) |
| Material Moving | 8 (57.1%) | 6 (42.9%) |
| Total (Category) | 146 (90.1%) | 16 (9.9%) |
| Total (Overall) | 733 (43.0%) | 970 (57.0%) |
Employment Industries by Sex in Newburgh
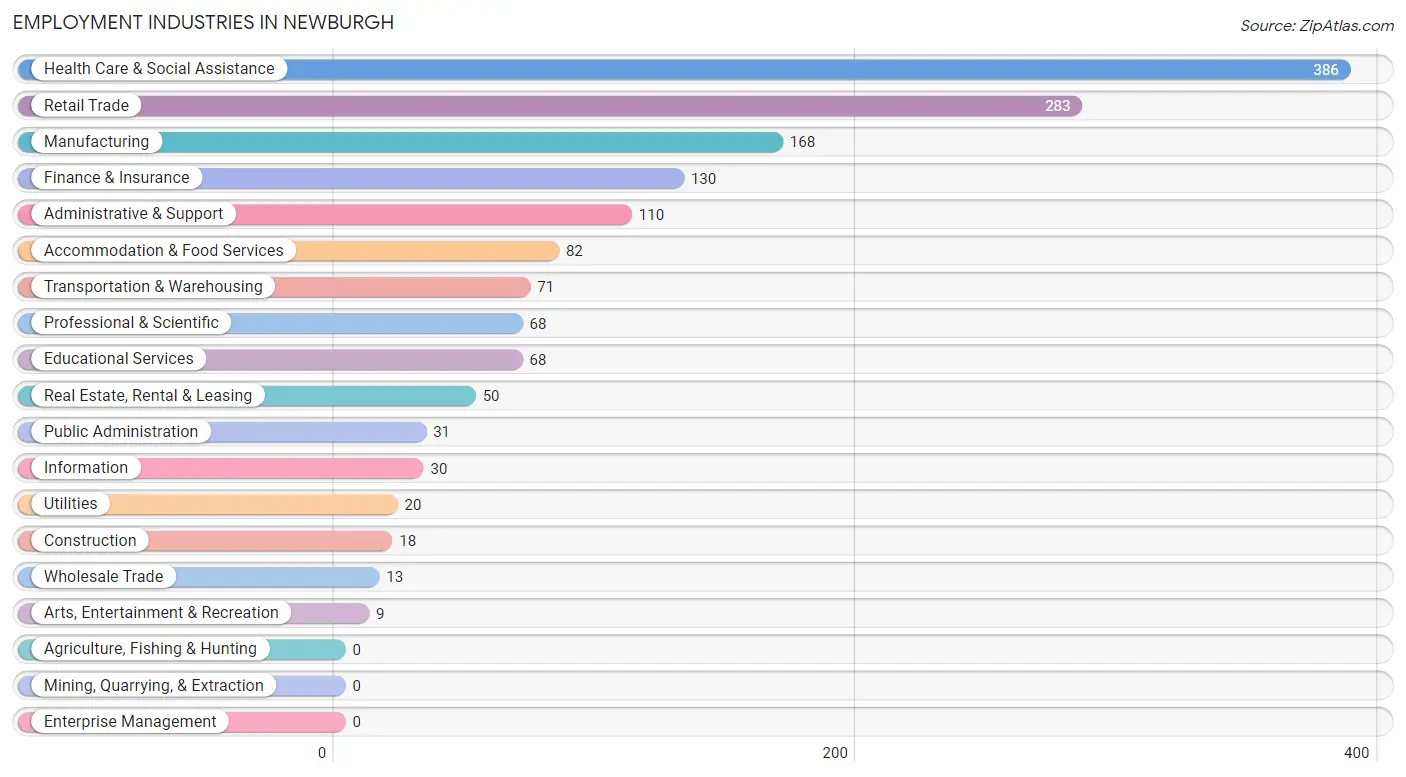
Employment Industries in Newburgh
The major employment industries in Newburgh include Health Care & Social Assistance (386 | 22.7%), Retail Trade (283 | 16.6%), Manufacturing (168 | 9.9%), Finance & Insurance (130 | 7.6%), and Administrative & Support (110 | 6.5%).
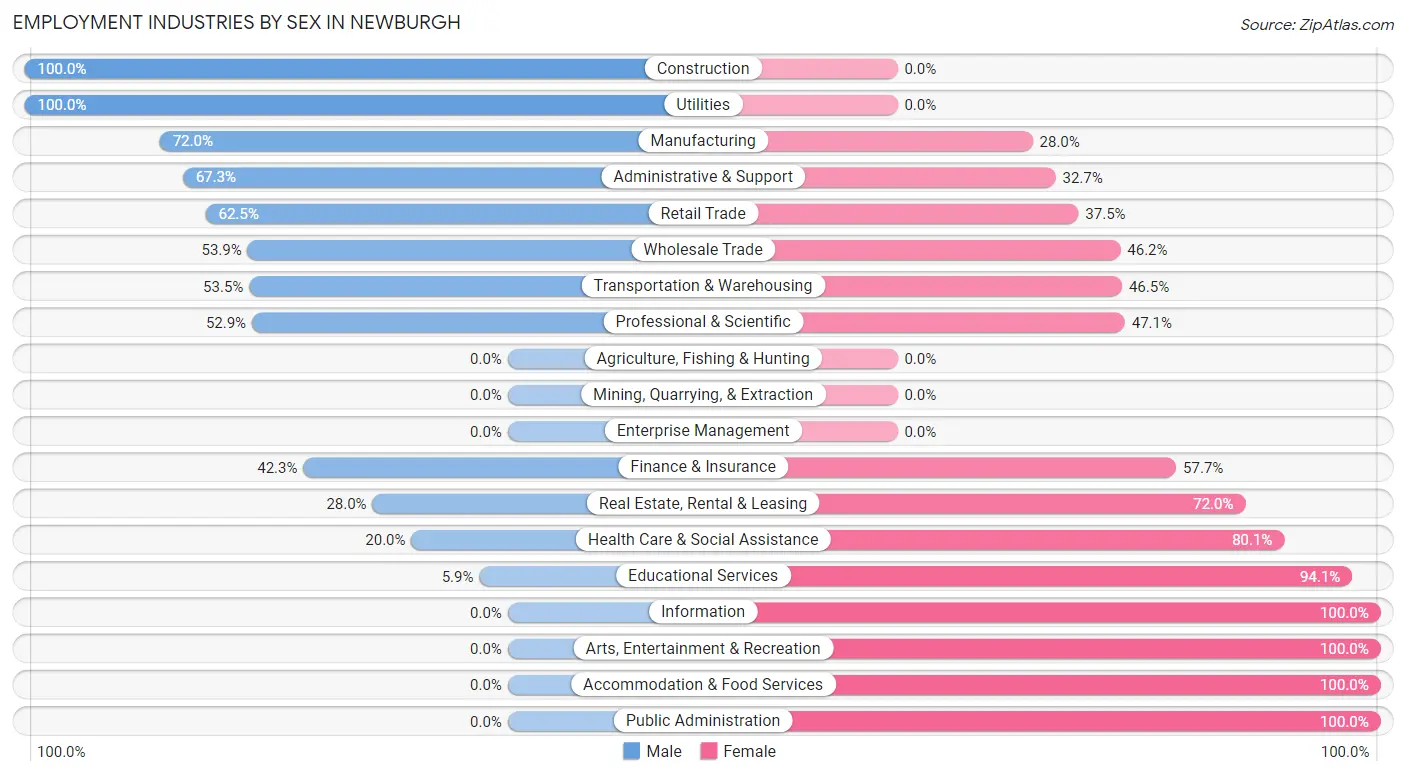
Employment Industries by Sex in Newburgh
The Newburgh industries that see more men than women are Construction (100.0%), Utilities (100.0%), and Manufacturing (72.0%), whereas the industries that tend to have a higher number of women are Information (100.0%), Arts, Entertainment & Recreation (100.0%), and Accommodation & Food Services (100.0%).
| Industry | Male | Female |
| Agriculture, Fishing & Hunting | 0 (0.0%) | 0 (0.0%) |
| Mining, Quarrying, & Extraction | 0 (0.0%) | 0 (0.0%) |
| Construction | 18 (100.0%) | 0 (0.0%) |
| Manufacturing | 121 (72.0%) | 47 (28.0%) |
| Wholesale Trade | 7 (53.8%) | 6 (46.2%) |
| Retail Trade | 177 (62.5%) | 106 (37.5%) |
| Transportation & Warehousing | 38 (53.5%) | 33 (46.5%) |
| Utilities | 20 (100.0%) | 0 (0.0%) |
| Information | 0 (0.0%) | 30 (100.0%) |
| Finance & Insurance | 55 (42.3%) | 75 (57.7%) |
| Real Estate, Rental & Leasing | 14 (28.0%) | 36 (72.0%) |
| Professional & Scientific | 36 (52.9%) | 32 (47.1%) |
| Enterprise Management | 0 (0.0%) | 0 (0.0%) |
| Administrative & Support | 74 (67.3%) | 36 (32.7%) |
| Educational Services | 4 (5.9%) | 64 (94.1%) |
| Health Care & Social Assistance | 77 (20.0%) | 309 (80.0%) |
| Arts, Entertainment & Recreation | 0 (0.0%) | 9 (100.0%) |
| Accommodation & Food Services | 0 (0.0%) | 82 (100.0%) |
| Public Administration | 0 (0.0%) | 31 (100.0%) |
| Total | 733 (43.0%) | 970 (57.0%) |
Education in Newburgh
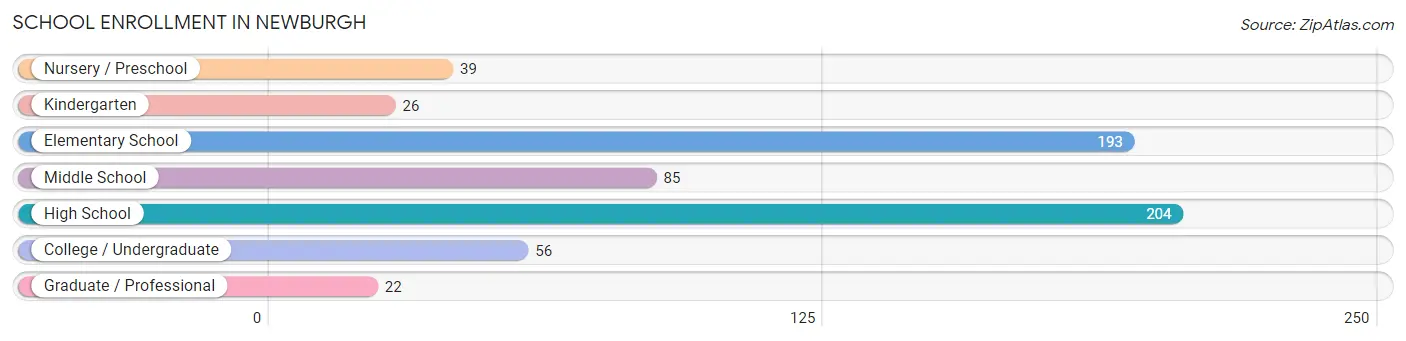
School Enrollment in Newburgh
The most common levels of schooling among the 625 students in Newburgh are high school (204 | 32.6%), elementary school (193 | 30.9%), and middle school (85 | 13.6%).
| School Level | # Students | % Students |
| Nursery / Preschool | 39 | 6.2% |
| Kindergarten | 26 | 4.2% |
| Elementary School | 193 | 30.9% |
| Middle School | 85 | 13.6% |
| High School | 204 | 32.6% |
| College / Undergraduate | 56 | 9.0% |
| Graduate / Professional | 22 | 3.5% |
| Total | 625 | 100.0% |
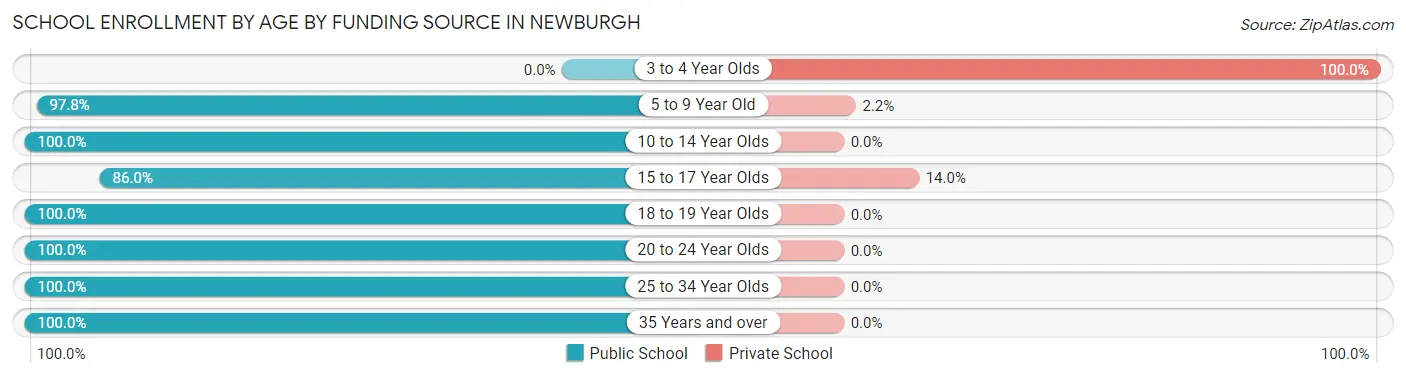
School Enrollment by Age by Funding Source in Newburgh
Out of a total of 625 students who are enrolled in schools in Newburgh, 65 (10.4%) attend a private institution, while the remaining 560 (89.6%) are enrolled in public schools. The age group of 3 to 4 year olds has the highest likelihood of being enrolled in private schools, with 36 (100.0% in the age bracket) enrolled. Conversely, the age group of 10 to 14 year olds has the lowest likelihood of being enrolled in a private school, with 171 (100.0% in the age bracket) attending a public institution.
| Age Bracket | Public School | Private School |
| 3 to 4 Year Olds | 0 (0.0%) | 36 (100.0%) |
| 5 to 9 Year Old | 133 (97.8%) | 3 (2.2%) |
| 10 to 14 Year Olds | 171 (100.0%) | 0 (0.0%) |
| 15 to 17 Year Olds | 160 (86.0%) | 26 (14.0%) |
| 18 to 19 Year Olds | 18 (100.0%) | 0 (0.0%) |
| 20 to 24 Year Olds | 41 (100.0%) | 0 (0.0%) |
| 25 to 34 Year Olds | 15 (100.0%) | 0 (0.0%) |
| 35 Years and over | 22 (100.0%) | 0 (0.0%) |
| Total | 560 (89.6%) | 65 (10.4%) |
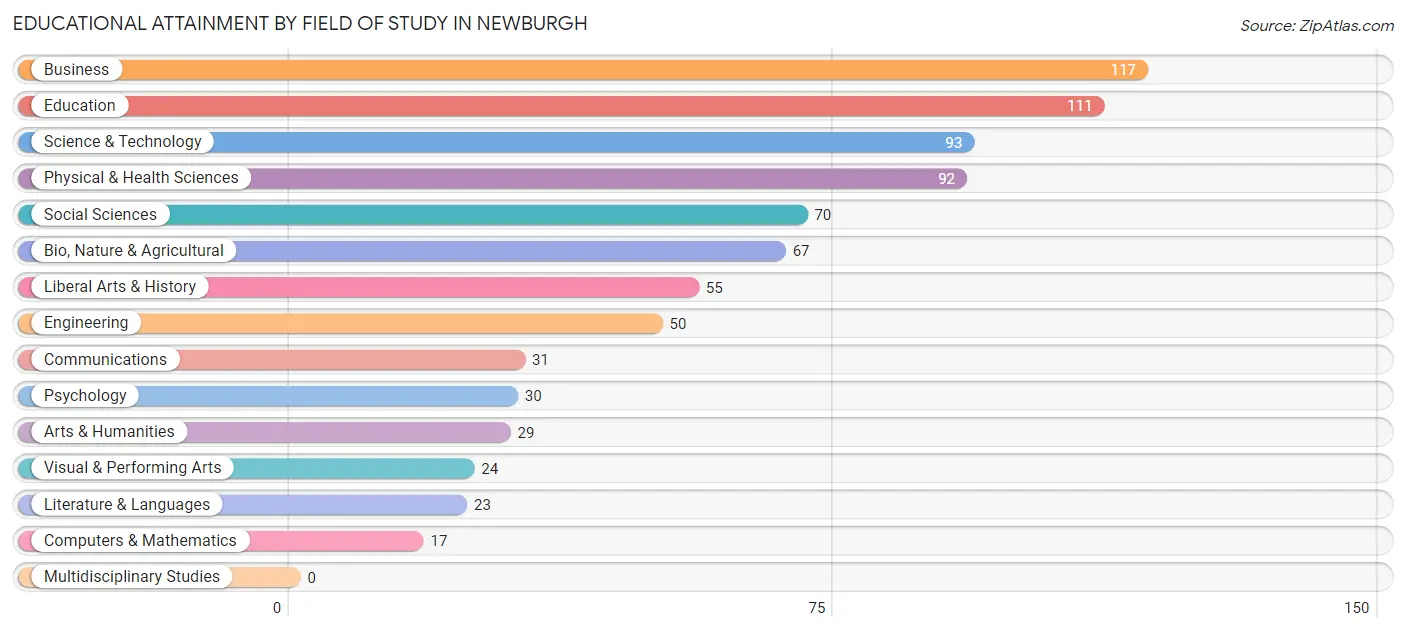
Educational Attainment by Field of Study in Newburgh
Business (117 | 14.5%), education (111 | 13.7%), science & technology (93 | 11.5%), physical & health sciences (92 | 11.4%), and social sciences (70 | 8.6%) are the most common fields of study among 809 individuals in Newburgh who have obtained a bachelor's degree or higher.
| Field of Study | # Graduates | % Graduates |
| Computers & Mathematics | 17 | 2.1% |
| Bio, Nature & Agricultural | 67 | 8.3% |
| Physical & Health Sciences | 92 | 11.4% |
| Psychology | 30 | 3.7% |
| Social Sciences | 70 | 8.6% |
| Engineering | 50 | 6.2% |
| Multidisciplinary Studies | 0 | 0.0% |
| Science & Technology | 93 | 11.5% |
| Business | 117 | 14.5% |
| Education | 111 | 13.7% |
| Literature & Languages | 23 | 2.8% |
| Liberal Arts & History | 55 | 6.8% |
| Visual & Performing Arts | 24 | 3.0% |
| Communications | 31 | 3.8% |
| Arts & Humanities | 29 | 3.6% |
| Total | 809 | 100.0% |
Transportation & Commute in Newburgh
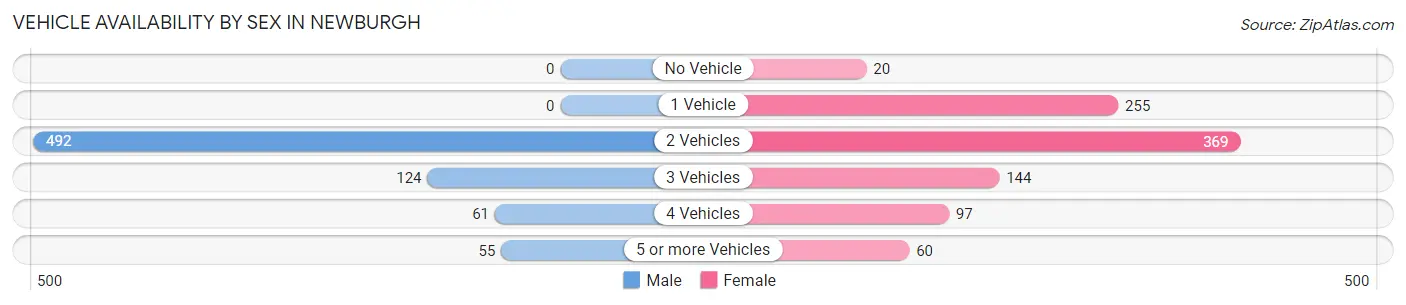
Vehicle Availability by Sex in Newburgh
The most prevalent vehicle ownership categories in Newburgh are males with 2 vehicles (492, accounting for 67.2%) and females with 2 vehicles (369, making up 52.1%).
| Vehicles Available | Male | Female |
| No Vehicle | 0 (0.0%) | 20 (2.1%) |
| 1 Vehicle | 0 (0.0%) | 255 (27.0%) |
| 2 Vehicles | 492 (67.2%) | 369 (39.1%) |
| 3 Vehicles | 124 (16.9%) | 144 (15.2%) |
| 4 Vehicles | 61 (8.3%) | 97 (10.3%) |
| 5 or more Vehicles | 55 (7.5%) | 60 (6.4%) |
| Total | 732 (100.0%) | 945 (100.0%) |
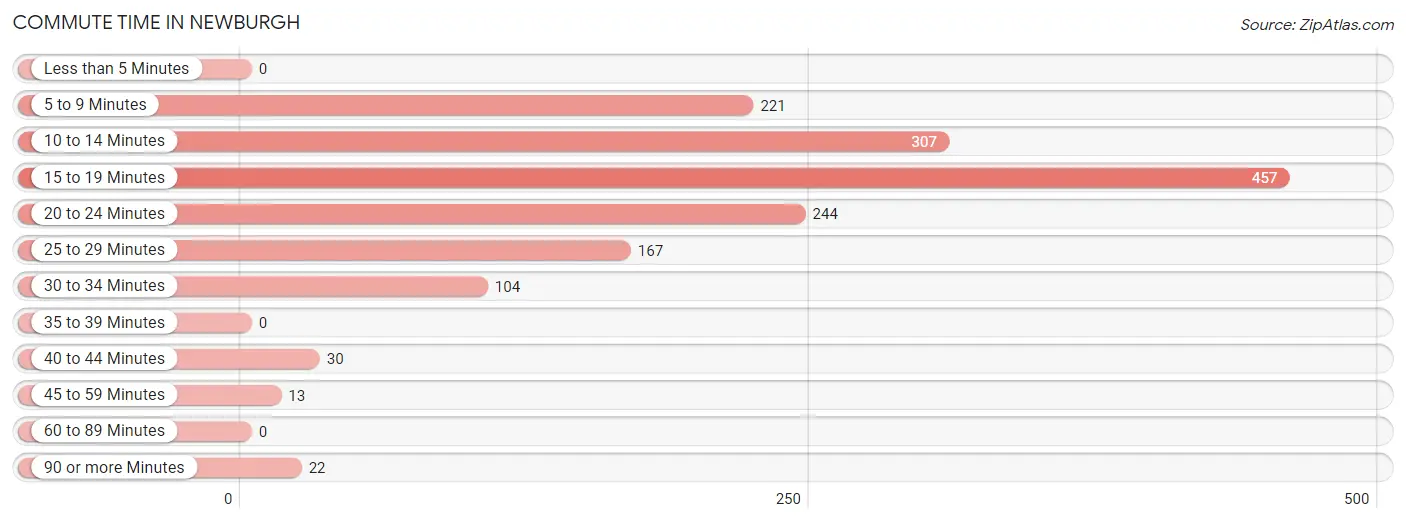
Commute Time in Newburgh
The most frequently occuring commute durations in Newburgh are 15 to 19 minutes (457 commuters, 29.2%), 10 to 14 minutes (307 commuters, 19.6%), and 20 to 24 minutes (244 commuters, 15.6%).
| Commute Time | # Commuters | % Commuters |
| Less than 5 Minutes | 0 | 0.0% |
| 5 to 9 Minutes | 221 | 14.1% |
| 10 to 14 Minutes | 307 | 19.6% |
| 15 to 19 Minutes | 457 | 29.2% |
| 20 to 24 Minutes | 244 | 15.6% |
| 25 to 29 Minutes | 167 | 10.7% |
| 30 to 34 Minutes | 104 | 6.7% |
| 35 to 39 Minutes | 0 | 0.0% |
| 40 to 44 Minutes | 30 | 1.9% |
| 45 to 59 Minutes | 13 | 0.8% |
| 60 to 89 Minutes | 0 | 0.0% |
| 90 or more Minutes | 22 | 1.4% |
Commute Time by Sex in Newburgh
The most common commute times in Newburgh are 15 to 19 minutes (255 commuters, 39.2%) for males and 15 to 19 minutes (202 commuters, 22.1%) for females.
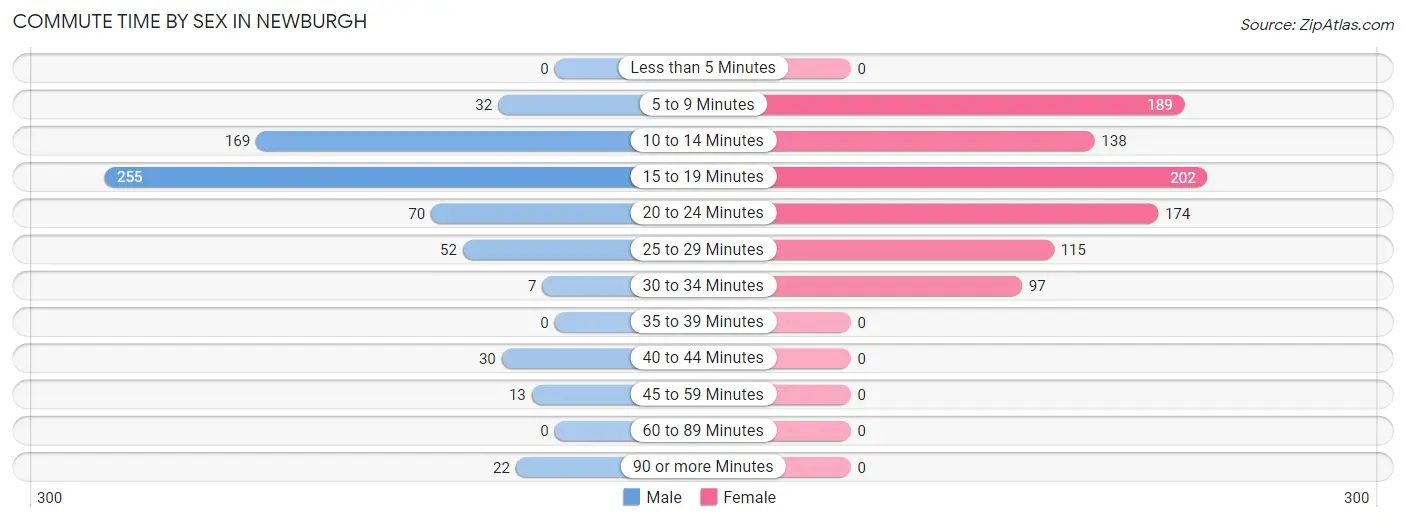
| Commute Time | Male | Female |
| Less than 5 Minutes | 0 (0.0%) | 0 (0.0%) |
| 5 to 9 Minutes | 32 (4.9%) | 189 (20.7%) |
| 10 to 14 Minutes | 169 (26.0%) | 138 (15.1%) |
| 15 to 19 Minutes | 255 (39.2%) | 202 (22.1%) |
| 20 to 24 Minutes | 70 (10.8%) | 174 (19.0%) |
| 25 to 29 Minutes | 52 (8.0%) | 115 (12.6%) |
| 30 to 34 Minutes | 7 (1.1%) | 97 (10.6%) |
| 35 to 39 Minutes | 0 (0.0%) | 0 (0.0%) |
| 40 to 44 Minutes | 30 (4.6%) | 0 (0.0%) |
| 45 to 59 Minutes | 13 (2.0%) | 0 (0.0%) |
| 60 to 89 Minutes | 0 (0.0%) | 0 (0.0%) |
| 90 or more Minutes | 22 (3.4%) | 0 (0.0%) |
Time of Departure to Work by Sex in Newburgh
The most frequent times of departure to work in Newburgh are 7:30 AM to 7:59 AM (190, 29.2%) for males and 7:30 AM to 7:59 AM (241, 26.3%) for females.
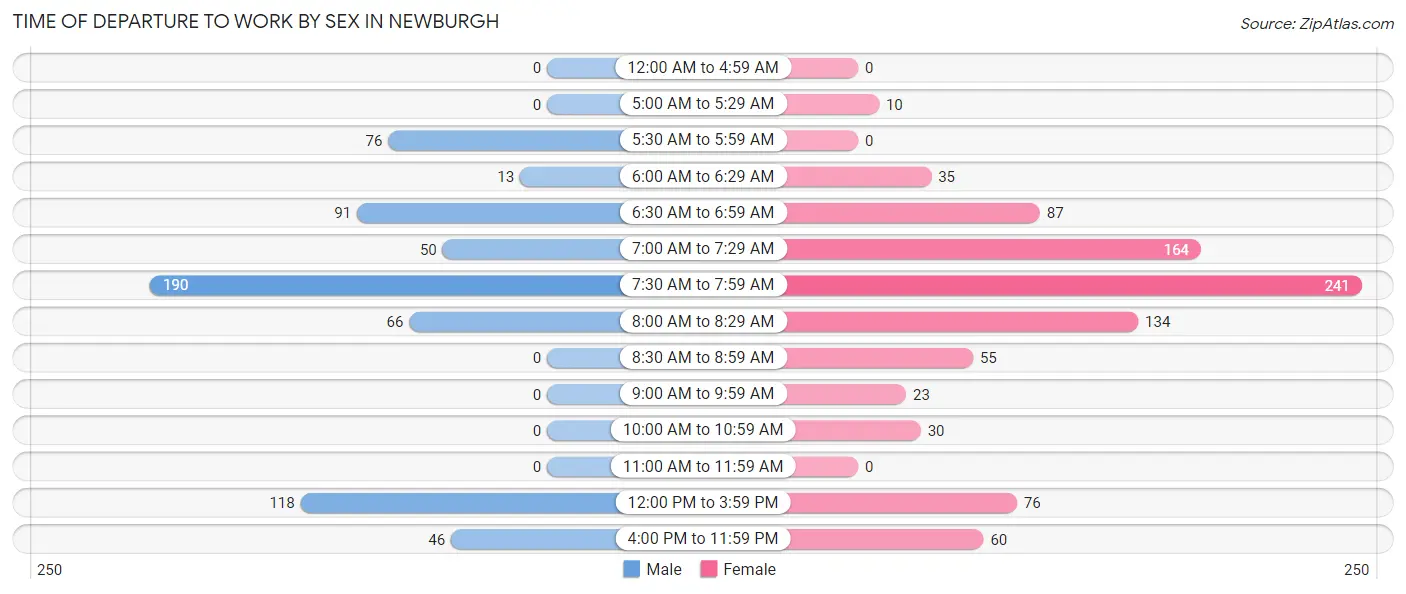
| Time of Departure | Male | Female |
| 12:00 AM to 4:59 AM | 0 (0.0%) | 0 (0.0%) |
| 5:00 AM to 5:29 AM | 0 (0.0%) | 10 (1.1%) |
| 5:30 AM to 5:59 AM | 76 (11.7%) | 0 (0.0%) |
| 6:00 AM to 6:29 AM | 13 (2.0%) | 35 (3.8%) |
| 6:30 AM to 6:59 AM | 91 (14.0%) | 87 (9.5%) |
| 7:00 AM to 7:29 AM | 50 (7.7%) | 164 (17.9%) |
| 7:30 AM to 7:59 AM | 190 (29.2%) | 241 (26.3%) |
| 8:00 AM to 8:29 AM | 66 (10.2%) | 134 (14.6%) |
| 8:30 AM to 8:59 AM | 0 (0.0%) | 55 (6.0%) |
| 9:00 AM to 9:59 AM | 0 (0.0%) | 23 (2.5%) |
| 10:00 AM to 10:59 AM | 0 (0.0%) | 30 (3.3%) |
| 11:00 AM to 11:59 AM | 0 (0.0%) | 0 (0.0%) |
| 12:00 PM to 3:59 PM | 118 (18.1%) | 76 (8.3%) |
| 4:00 PM to 11:59 PM | 46 (7.1%) | 60 (6.6%) |
| Total | 650 (100.0%) | 915 (100.0%) |
Housing Occupancy in Newburgh
Occupancy by Ownership in Newburgh
Of the total 1,593 dwellings in Newburgh, owner-occupied units account for 1,311 (82.3%), while renter-occupied units make up 282 (17.7%).
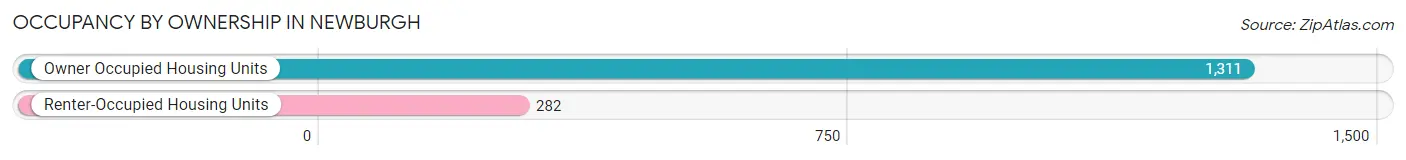
| Occupancy | # Housing Units | % Housing Units |
| Owner Occupied Housing Units | 1,311 | 82.3% |
| Renter-Occupied Housing Units | 282 | 17.7% |
| Total Occupied Housing Units | 1,593 | 100.0% |
Occupancy by Household Size in Newburgh
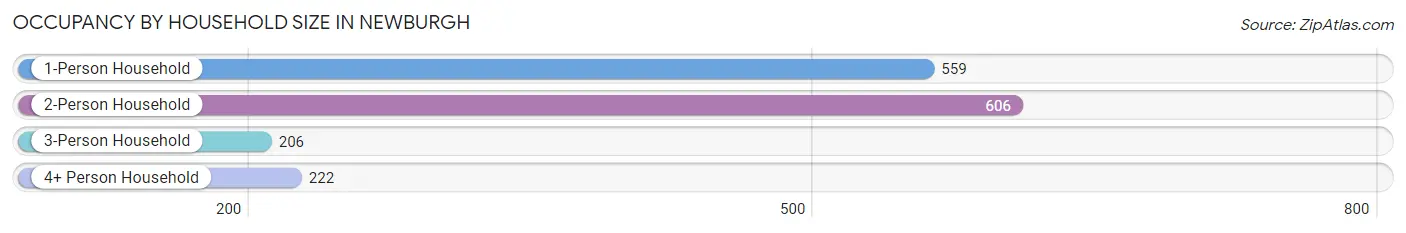
| Household Size | # Housing Units | % Housing Units |
| 1-Person Household | 559 | 35.1% |
| 2-Person Household | 606 | 38.0% |
| 3-Person Household | 206 | 12.9% |
| 4+ Person Household | 222 | 13.9% |
| Total Housing Units | 1,593 | 100.0% |
Occupancy by Ownership by Household Size in Newburgh
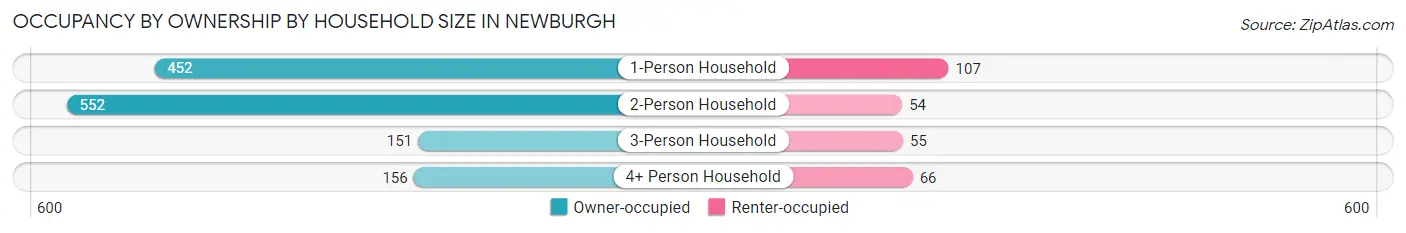
| Household Size | Owner-occupied | Renter-occupied |
| 1-Person Household | 452 (80.9%) | 107 (19.1%) |
| 2-Person Household | 552 (91.1%) | 54 (8.9%) |
| 3-Person Household | 151 (73.3%) | 55 (26.7%) |
| 4+ Person Household | 156 (70.3%) | 66 (29.7%) |
| Total Housing Units | 1,311 (82.3%) | 282 (17.7%) |
Occupancy by Educational Attainment in Newburgh
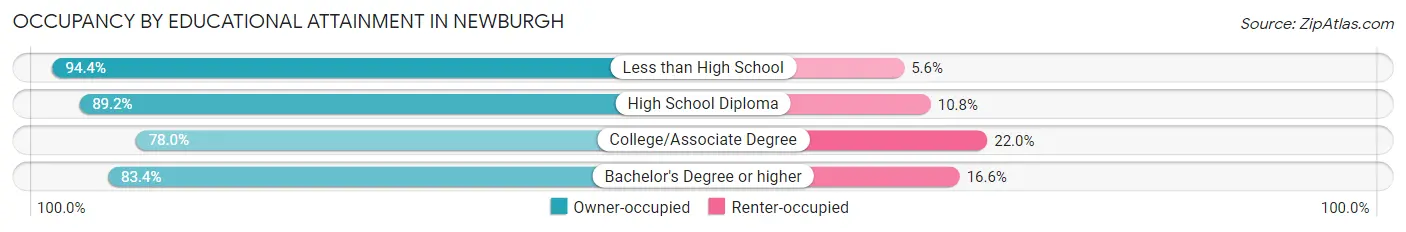
| Household Size | Owner-occupied | Renter-occupied |
| Less than High School | 17 (94.4%) | 1 (5.6%) |
| High School Diploma | 321 (89.2%) | 39 (10.8%) |
| College/Associate Degree | 580 (78.0%) | 164 (22.0%) |
| Bachelor's Degree or higher | 393 (83.4%) | 78 (16.6%) |
Occupancy by Age of Householder in Newburgh
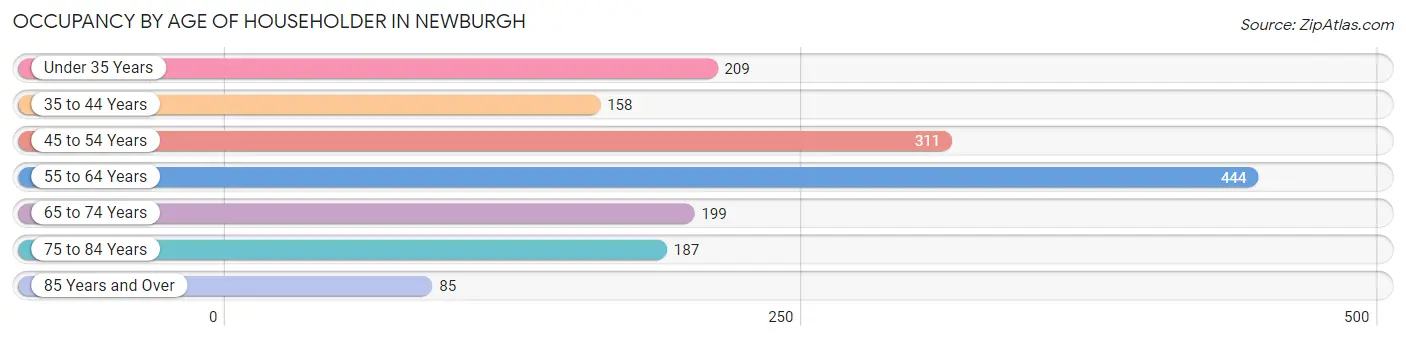
| Age Bracket | # Households | % Households |
| Under 35 Years | 209 | 13.1% |
| 35 to 44 Years | 158 | 9.9% |
| 45 to 54 Years | 311 | 19.5% |
| 55 to 64 Years | 444 | 27.9% |
| 65 to 74 Years | 199 | 12.5% |
| 75 to 84 Years | 187 | 11.7% |
| 85 Years and Over | 85 | 5.3% |
| Total | 1,593 | 100.0% |
Housing Finances in Newburgh
Median Income by Occupancy in Newburgh
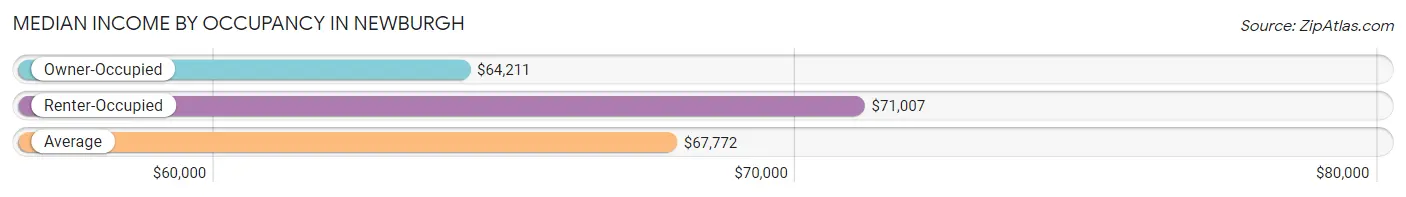
| Occupancy Type | # Households | Median Income |
| Owner-Occupied | 1,311 (82.3%) | $64,211 |
| Renter-Occupied | 282 (17.7%) | $71,007 |
| Average | 1,593 (100.0%) | $67,772 |
Occupancy by Householder Income Bracket in Newburgh
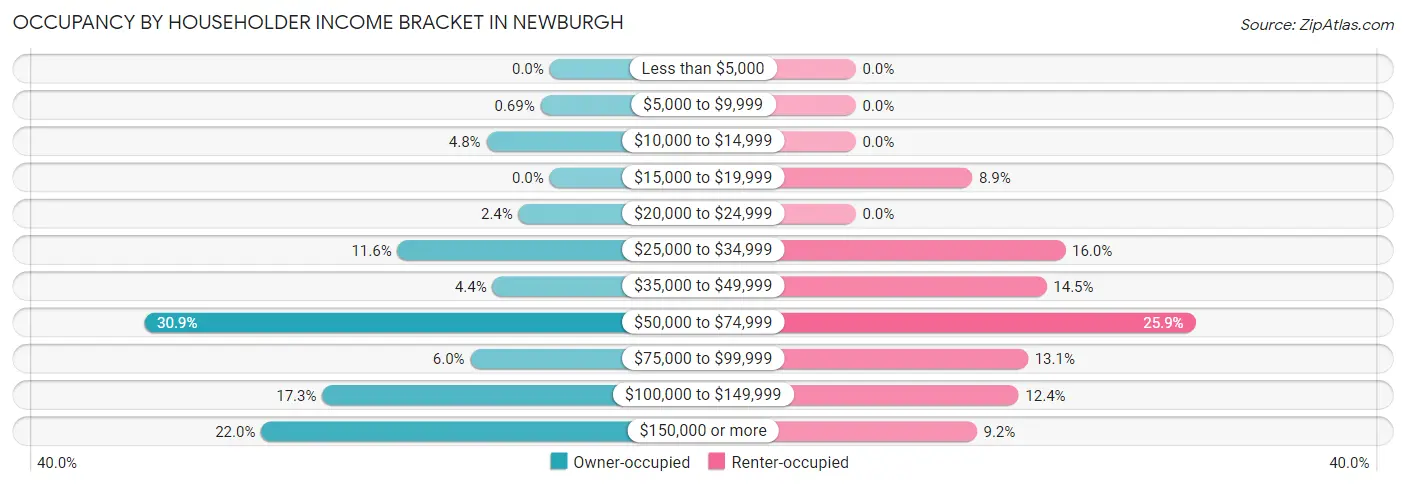
| Income Bracket | Owner-occupied | Renter-occupied |
| Less than $5,000 | 0 (0.0%) | 0 (0.0%) |
| $5,000 to $9,999 | 9 (0.7%) | 0 (0.0%) |
| $10,000 to $14,999 | 63 (4.8%) | 0 (0.0%) |
| $15,000 to $19,999 | 0 (0.0%) | 25 (8.9%) |
| $20,000 to $24,999 | 31 (2.4%) | 0 (0.0%) |
| $25,000 to $34,999 | 152 (11.6%) | 45 (16.0%) |
| $35,000 to $49,999 | 57 (4.3%) | 41 (14.5%) |
| $50,000 to $74,999 | 405 (30.9%) | 73 (25.9%) |
| $75,000 to $99,999 | 79 (6.0%) | 37 (13.1%) |
| $100,000 to $149,999 | 227 (17.3%) | 35 (12.4%) |
| $150,000 or more | 288 (22.0%) | 26 (9.2%) |
| Total | 1,311 (100.0%) | 282 (100.0%) |
Monthly Housing Cost Tiers in Newburgh
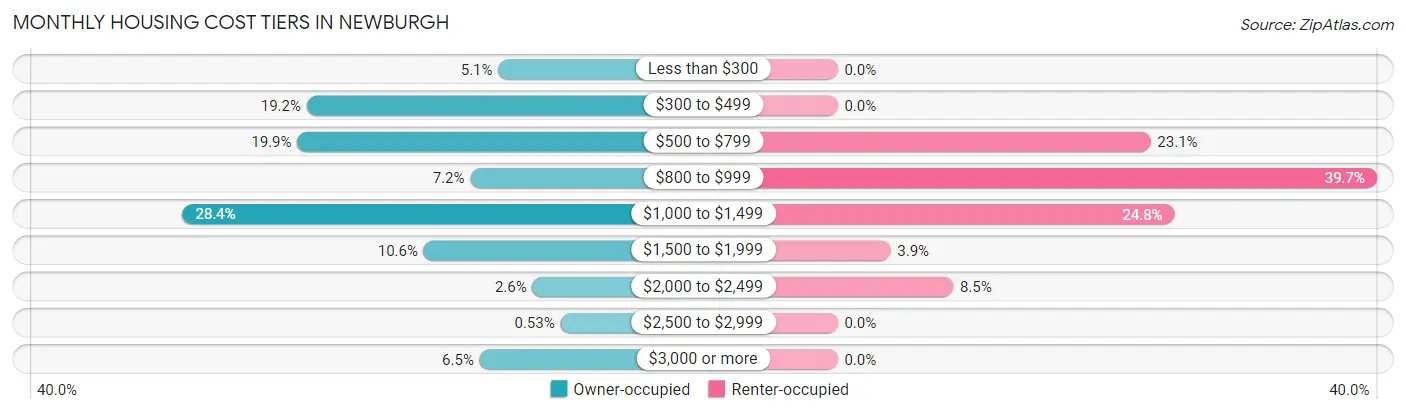
| Monthly Cost | Owner-occupied | Renter-occupied |
| Less than $300 | 67 (5.1%) | 0 (0.0%) |
| $300 to $499 | 252 (19.2%) | 0 (0.0%) |
| $500 to $799 | 261 (19.9%) | 65 (23.1%) |
| $800 to $999 | 94 (7.2%) | 112 (39.7%) |
| $1,000 to $1,499 | 372 (28.4%) | 70 (24.8%) |
| $1,500 to $1,999 | 139 (10.6%) | 11 (3.9%) |
| $2,000 to $2,499 | 34 (2.6%) | 24 (8.5%) |
| $2,500 to $2,999 | 7 (0.5%) | 0 (0.0%) |
| $3,000 or more | 85 (6.5%) | 0 (0.0%) |
| Total | 1,311 (100.0%) | 282 (100.0%) |
Physical Housing Characteristics in Newburgh
Housing Structures in Newburgh
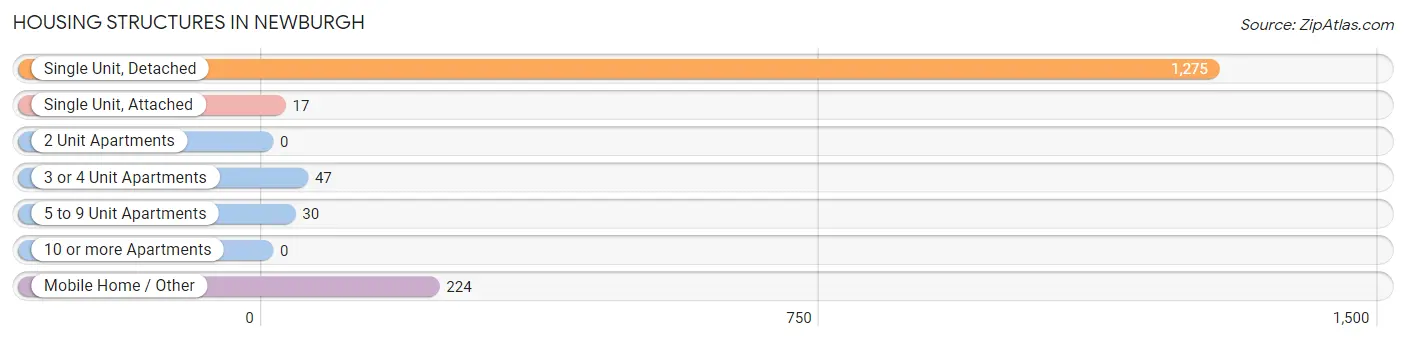
| Structure Type | # Housing Units | % Housing Units |
| Single Unit, Detached | 1,275 | 80.0% |
| Single Unit, Attached | 17 | 1.1% |
| 2 Unit Apartments | 0 | 0.0% |
| 3 or 4 Unit Apartments | 47 | 2.9% |
| 5 to 9 Unit Apartments | 30 | 1.9% |
| 10 or more Apartments | 0 | 0.0% |
| Mobile Home / Other | 224 | 14.1% |
| Total | 1,593 | 100.0% |
Housing Structures by Occupancy in Newburgh
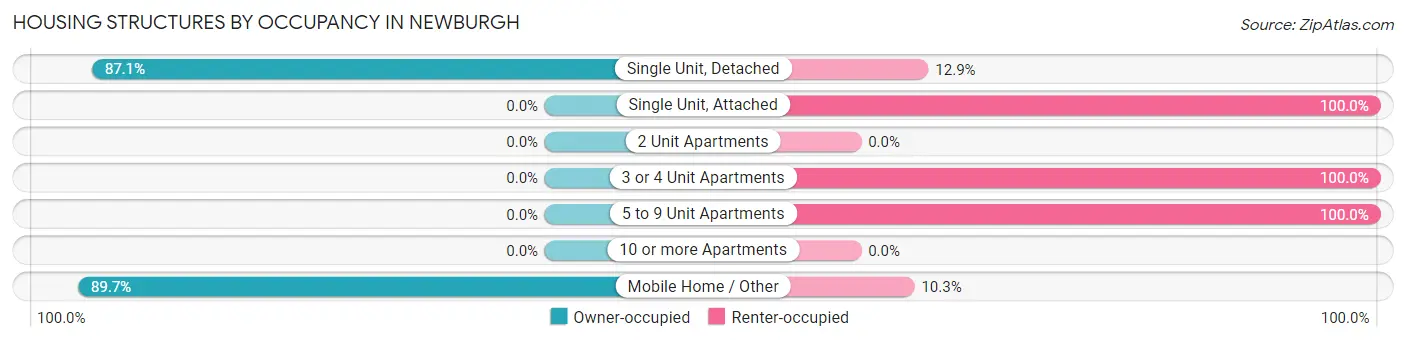
| Structure Type | Owner-occupied | Renter-occupied |
| Single Unit, Detached | 1,110 (87.1%) | 165 (12.9%) |
| Single Unit, Attached | 0 (0.0%) | 17 (100.0%) |
| 2 Unit Apartments | 0 (0.0%) | 0 (0.0%) |
| 3 or 4 Unit Apartments | 0 (0.0%) | 47 (100.0%) |
| 5 to 9 Unit Apartments | 0 (0.0%) | 30 (100.0%) |
| 10 or more Apartments | 0 (0.0%) | 0 (0.0%) |
| Mobile Home / Other | 201 (89.7%) | 23 (10.3%) |
| Total | 1,311 (82.3%) | 282 (17.7%) |
Housing Structures by Number of Rooms in Newburgh
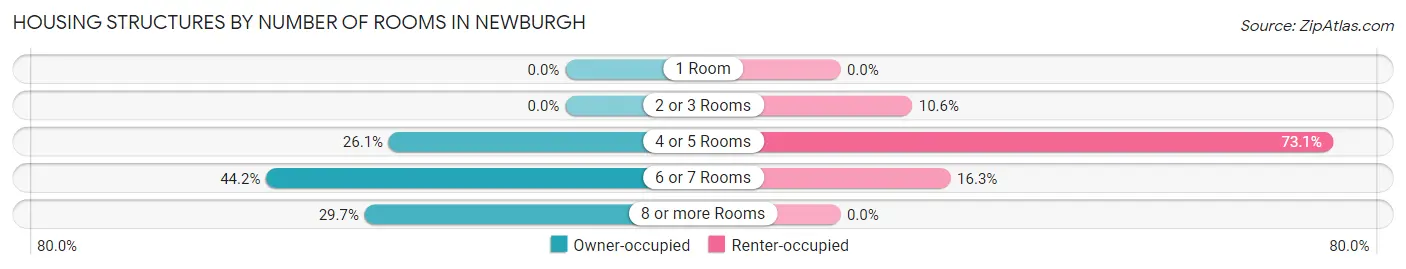
| Number of Rooms | Owner-occupied | Renter-occupied |
| 1 Room | 0 (0.0%) | 0 (0.0%) |
| 2 or 3 Rooms | 0 (0.0%) | 30 (10.6%) |
| 4 or 5 Rooms | 342 (26.1%) | 206 (73.1%) |
| 6 or 7 Rooms | 580 (44.2%) | 46 (16.3%) |
| 8 or more Rooms | 389 (29.7%) | 0 (0.0%) |
| Total | 1,311 (100.0%) | 282 (100.0%) |
Housing Structure by Heating Type in Newburgh
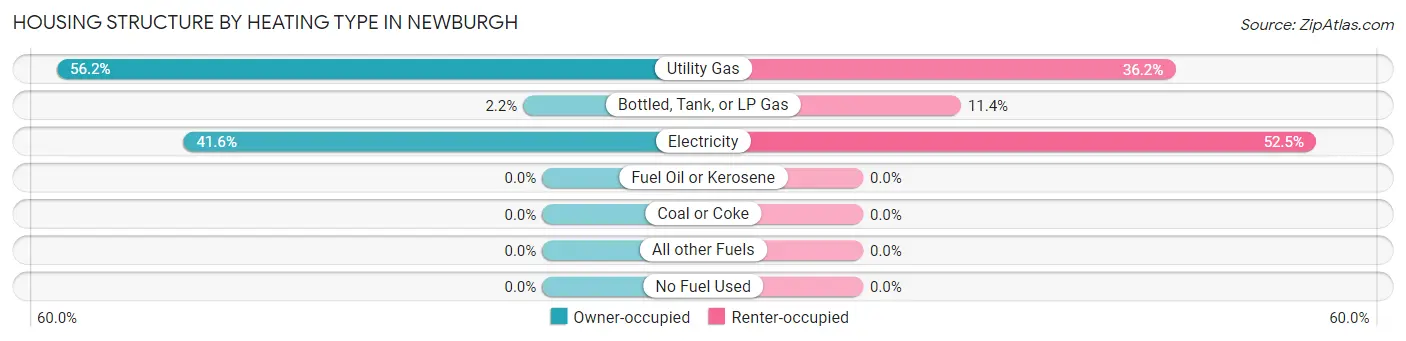
| Heating Type | Owner-occupied | Renter-occupied |
| Utility Gas | 737 (56.2%) | 102 (36.2%) |
| Bottled, Tank, or LP Gas | 29 (2.2%) | 32 (11.4%) |
| Electricity | 545 (41.6%) | 148 (52.5%) |
| Fuel Oil or Kerosene | 0 (0.0%) | 0 (0.0%) |
| Coal or Coke | 0 (0.0%) | 0 (0.0%) |
| All other Fuels | 0 (0.0%) | 0 (0.0%) |
| No Fuel Used | 0 (0.0%) | 0 (0.0%) |
| Total | 1,311 (100.0%) | 282 (100.0%) |
Household Vehicle Usage in Newburgh
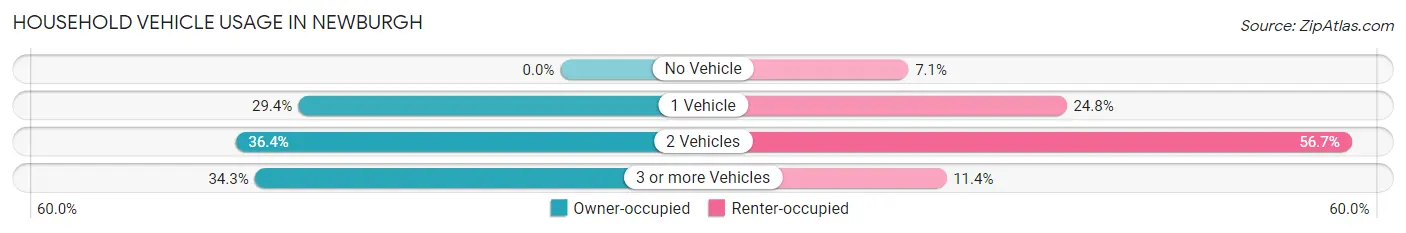
| Vehicles per Household | Owner-occupied | Renter-occupied |
| No Vehicle | 0 (0.0%) | 20 (7.1%) |
| 1 Vehicle | 385 (29.4%) | 70 (24.8%) |
| 2 Vehicles | 477 (36.4%) | 160 (56.7%) |
| 3 or more Vehicles | 449 (34.3%) | 32 (11.4%) |
| Total | 1,311 (100.0%) | 282 (100.0%) |
Real Estate & Mortgages in Newburgh
Real Estate and Mortgage Overview in Newburgh
| Characteristic | Without Mortgage | With Mortgage |
| Housing Units | 712 | 599 |
| Median Property Value | $97,900 | $216,500 |
| Median Household Income | $61,212 | $198 |
| Monthly Housing Costs | $532 | $85 |
| Real Estate Taxes | $755 | $9 |
Property Value by Mortgage Status in Newburgh
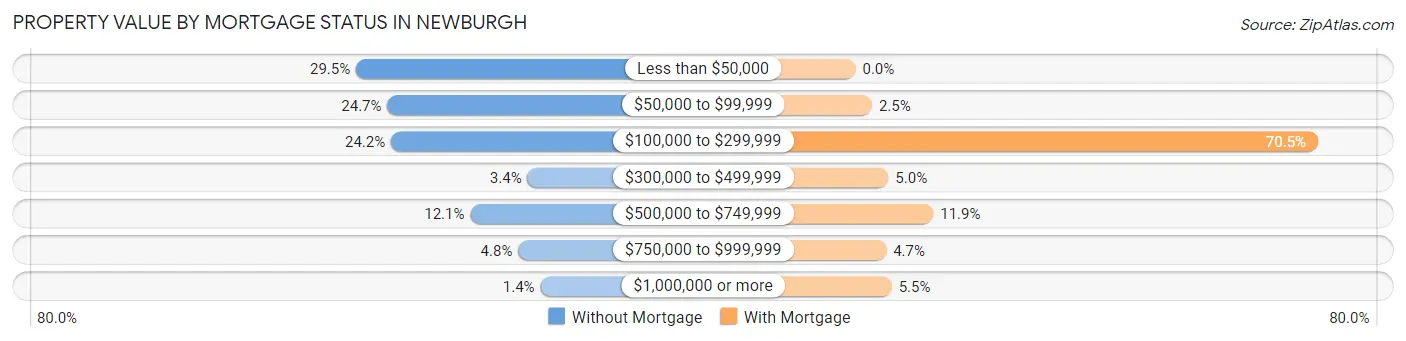
| Property Value | Without Mortgage | With Mortgage |
| Less than $50,000 | 210 (29.5%) | 0 (0.0%) |
| $50,000 to $99,999 | 176 (24.7%) | 15 (2.5%) |
| $100,000 to $299,999 | 172 (24.2%) | 422 (70.5%) |
| $300,000 to $499,999 | 24 (3.4%) | 30 (5.0%) |
| $500,000 to $749,999 | 86 (12.1%) | 71 (11.8%) |
| $750,000 to $999,999 | 34 (4.8%) | 28 (4.7%) |
| $1,000,000 or more | 10 (1.4%) | 33 (5.5%) |
| Total | 712 (100.0%) | 599 (100.0%) |
Household Income by Mortgage Status in Newburgh
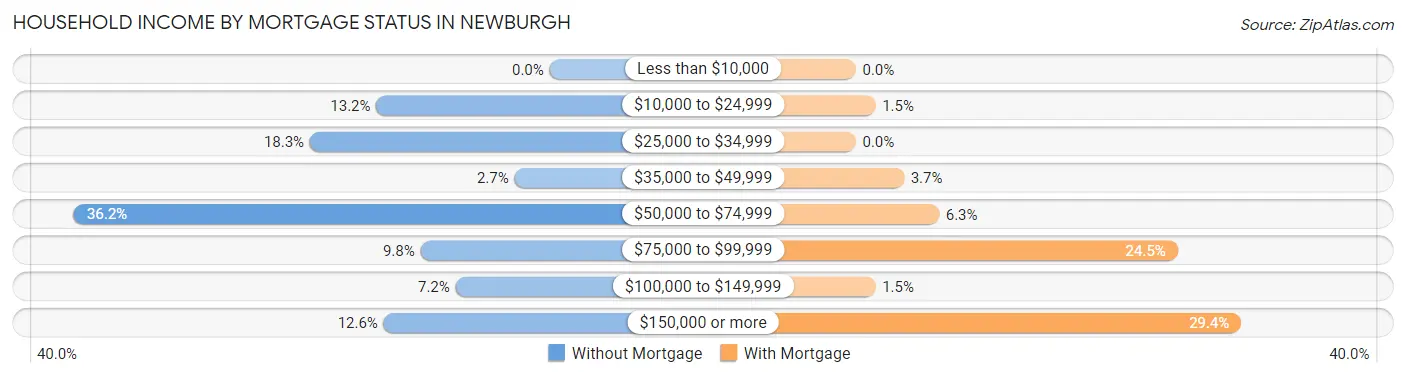
| Household Income | Without Mortgage | With Mortgage |
| Less than $10,000 | 0 (0.0%) | 0 (0.0%) |
| $10,000 to $24,999 | 94 (13.2%) | 9 (1.5%) |
| $25,000 to $34,999 | 130 (18.3%) | 0 (0.0%) |
| $35,000 to $49,999 | 19 (2.7%) | 22 (3.7%) |
| $50,000 to $74,999 | 258 (36.2%) | 38 (6.3%) |
| $75,000 to $99,999 | 70 (9.8%) | 147 (24.5%) |
| $100,000 to $149,999 | 51 (7.2%) | 9 (1.5%) |
| $150,000 or more | 90 (12.6%) | 176 (29.4%) |
| Total | 712 (100.0%) | 599 (100.0%) |
Property Value to Household Income Ratio in Newburgh
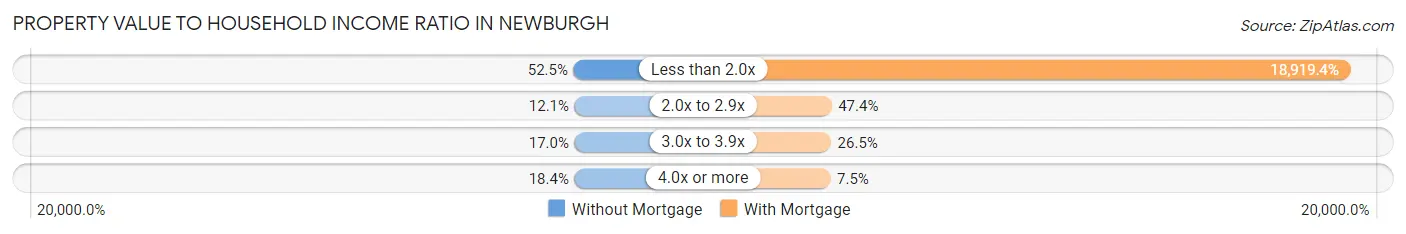
| Value-to-Income Ratio | Without Mortgage | With Mortgage |
| Less than 2.0x | 374 (52.5%) | 113,327 (18,919.4%) |
| 2.0x to 2.9x | 86 (12.1%) | 284 (47.4%) |
| 3.0x to 3.9x | 121 (17.0%) | 159 (26.5%) |
| 4.0x or more | 131 (18.4%) | 45 (7.5%) |
| Total | 712 (100.0%) | 599 (100.0%) |
Real Estate Taxes by Mortgage Status in Newburgh
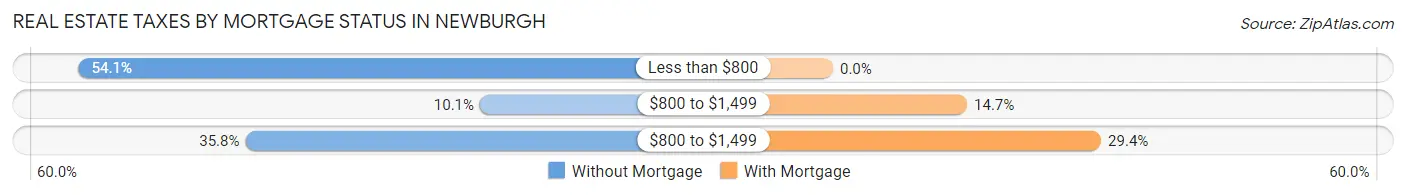
| Property Taxes | Without Mortgage | With Mortgage |
| Less than $800 | 385 (54.1%) | 0 (0.0%) |
| $800 to $1,499 | 72 (10.1%) | 88 (14.7%) |
| $800 to $1,499 | 255 (35.8%) | 176 (29.4%) |
| Total | 712 (100.0%) | 599 (100.0%) |
Health & Disability in Newburgh
Health Insurance Coverage by Age in Newburgh
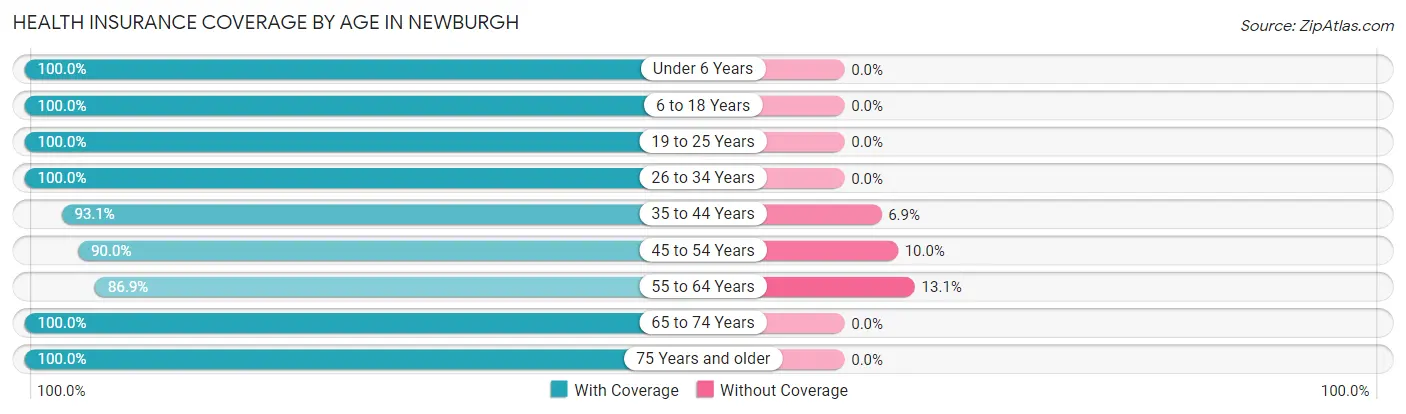
| Age Bracket | With Coverage | Without Coverage |
| Under 6 Years | 216 (100.0%) | 0 (0.0%) |
| 6 to 18 Years | 508 (100.0%) | 0 (0.0%) |
| 19 to 25 Years | 249 (100.0%) | 0 (0.0%) |
| 26 to 34 Years | 355 (100.0%) | 0 (0.0%) |
| 35 to 44 Years | 230 (93.1%) | 17 (6.9%) |
| 45 to 54 Years | 416 (90.0%) | 46 (10.0%) |
| 55 to 64 Years | 543 (86.9%) | 82 (13.1%) |
| 65 to 74 Years | 309 (100.0%) | 0 (0.0%) |
| 75 Years and older | 379 (100.0%) | 0 (0.0%) |
| Total | 3,205 (95.7%) | 145 (4.3%) |
Health Insurance Coverage by Citizenship Status in Newburgh
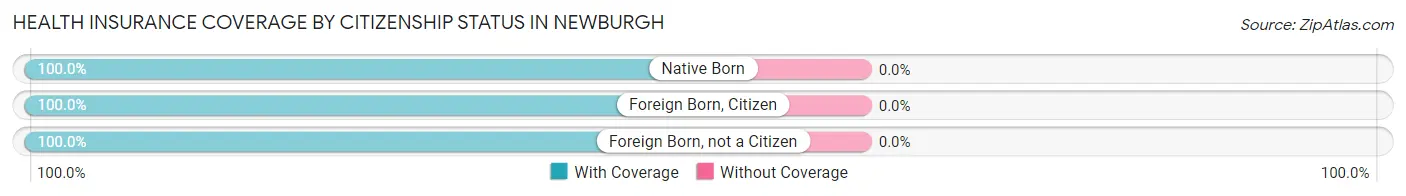
| Citizenship Status | With Coverage | Without Coverage |
| Native Born | 216 (100.0%) | 0 (0.0%) |
| Foreign Born, Citizen | 508 (100.0%) | 0 (0.0%) |
| Foreign Born, not a Citizen | 249 (100.0%) | 0 (0.0%) |
Health Insurance Coverage by Household Income in Newburgh
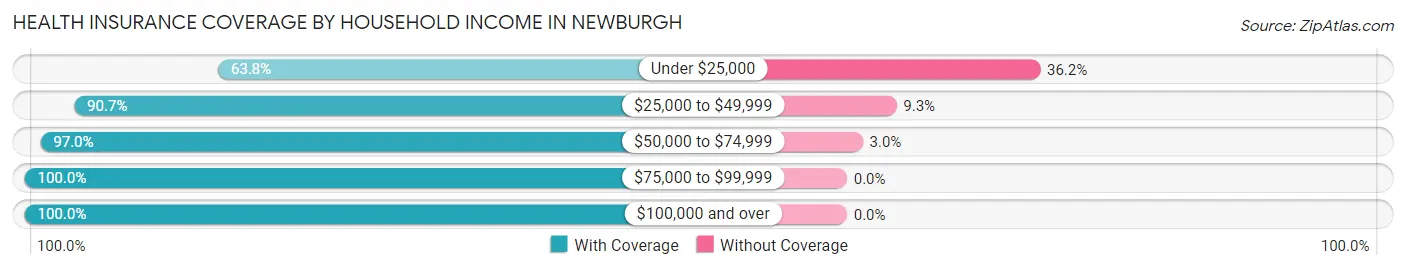
| Household Income | With Coverage | Without Coverage |
| Under $25,000 | 111 (63.8%) | 63 (36.2%) |
| $25,000 to $49,999 | 586 (90.7%) | 60 (9.3%) |
| $50,000 to $74,999 | 722 (97.0%) | 22 (3.0%) |
| $75,000 to $99,999 | 293 (100.0%) | 0 (0.0%) |
| $100,000 and over | 1,482 (100.0%) | 0 (0.0%) |
Public vs Private Health Insurance Coverage by Age in Newburgh
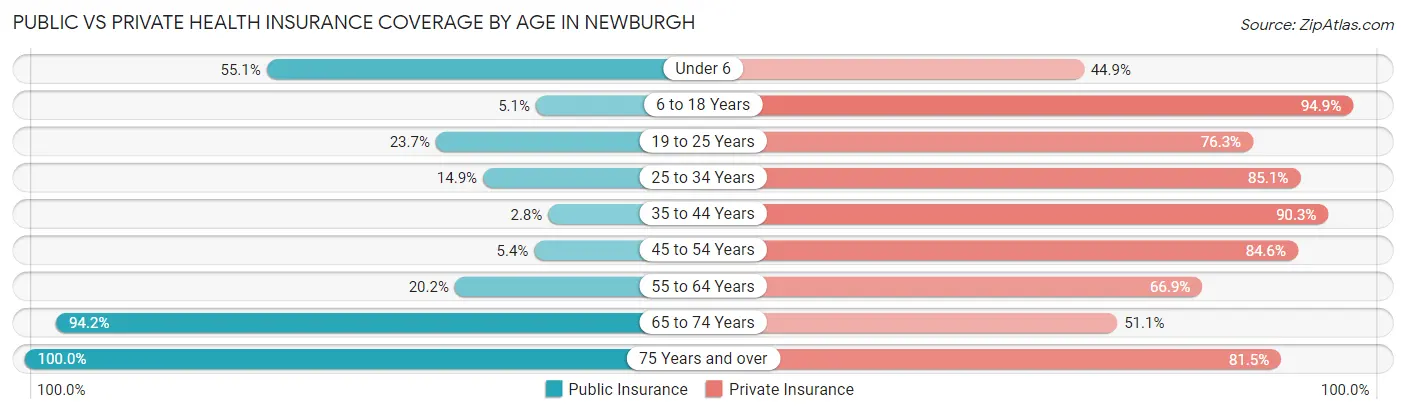
| Age Bracket | Public Insurance | Private Insurance |
| Under 6 | 119 (55.1%) | 97 (44.9%) |
| 6 to 18 Years | 26 (5.1%) | 482 (94.9%) |
| 19 to 25 Years | 59 (23.7%) | 190 (76.3%) |
| 25 to 34 Years | 53 (14.9%) | 302 (85.1%) |
| 35 to 44 Years | 7 (2.8%) | 223 (90.3%) |
| 45 to 54 Years | 25 (5.4%) | 391 (84.6%) |
| 55 to 64 Years | 126 (20.2%) | 418 (66.9%) |
| 65 to 74 Years | 291 (94.2%) | 158 (51.1%) |
| 75 Years and over | 379 (100.0%) | 309 (81.5%) |
| Total | 1,085 (32.4%) | 2,570 (76.7%) |
Disability Status by Sex by Age in Newburgh
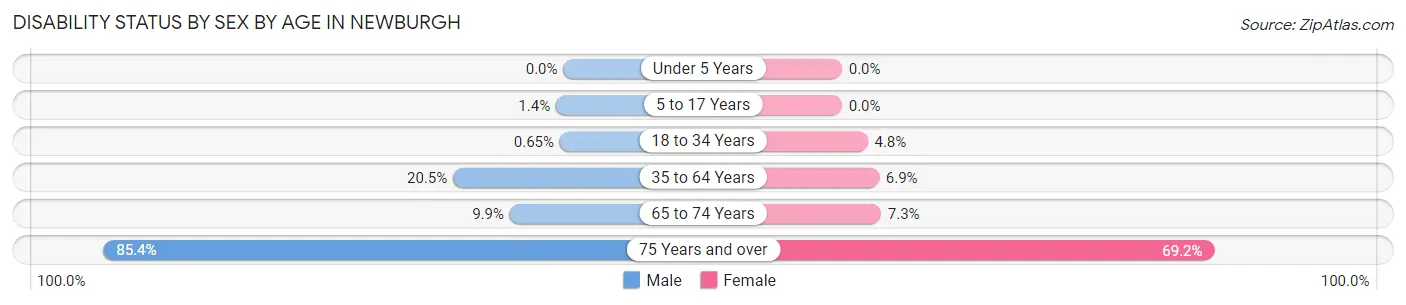
| Age Bracket | Male | Female |
| Under 5 Years | 0 (0.0%) | 0 (0.0%) |
| 5 to 17 Years | 5 (1.4%) | 0 (0.0%) |
| 18 to 34 Years | 2 (0.6%) | 15 (4.8%) |
| 35 to 64 Years | 133 (20.5%) | 47 (6.9%) |
| 65 to 74 Years | 17 (9.9%) | 10 (7.2%) |
| 75 Years and over | 152 (85.4%) | 139 (69.2%) |
Disability Class by Sex by Age in Newburgh
Disability Class: Hearing Difficulty
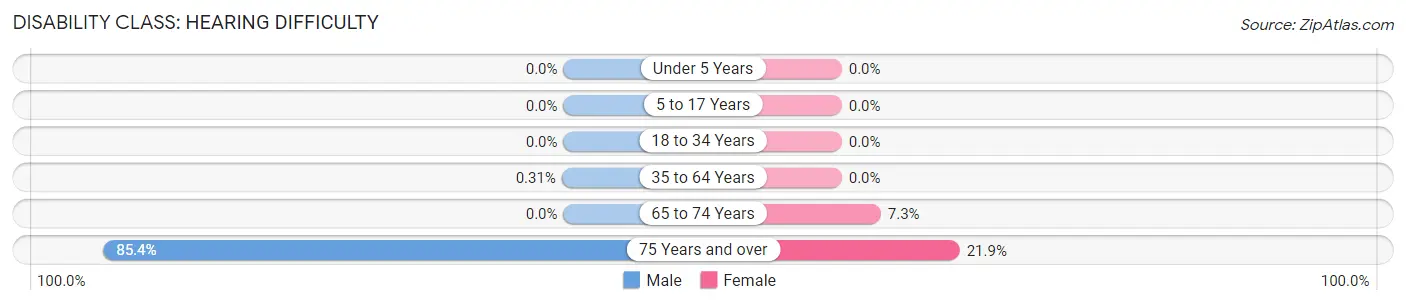
| Age Bracket | Male | Female |
| Under 5 Years | 0 (0.0%) | 0 (0.0%) |
| 5 to 17 Years | 0 (0.0%) | 0 (0.0%) |
| 18 to 34 Years | 0 (0.0%) | 0 (0.0%) |
| 35 to 64 Years | 2 (0.3%) | 0 (0.0%) |
| 65 to 74 Years | 0 (0.0%) | 10 (7.2%) |
| 75 Years and over | 152 (85.4%) | 44 (21.9%) |
Disability Class: Vision Difficulty
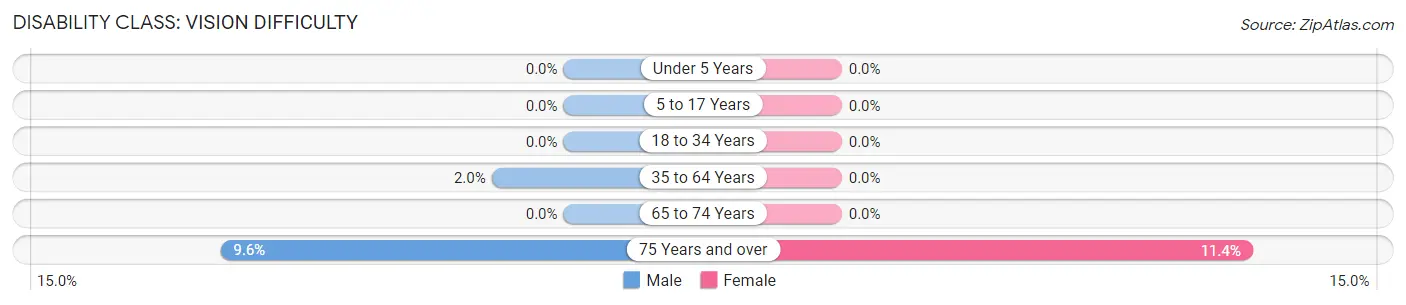
| Age Bracket | Male | Female |
| Under 5 Years | 0 (0.0%) | 0 (0.0%) |
| 5 to 17 Years | 0 (0.0%) | 0 (0.0%) |
| 18 to 34 Years | 0 (0.0%) | 0 (0.0%) |
| 35 to 64 Years | 13 (2.0%) | 0 (0.0%) |
| 65 to 74 Years | 0 (0.0%) | 0 (0.0%) |
| 75 Years and over | 17 (9.6%) | 23 (11.4%) |
Disability Class: Cognitive Difficulty
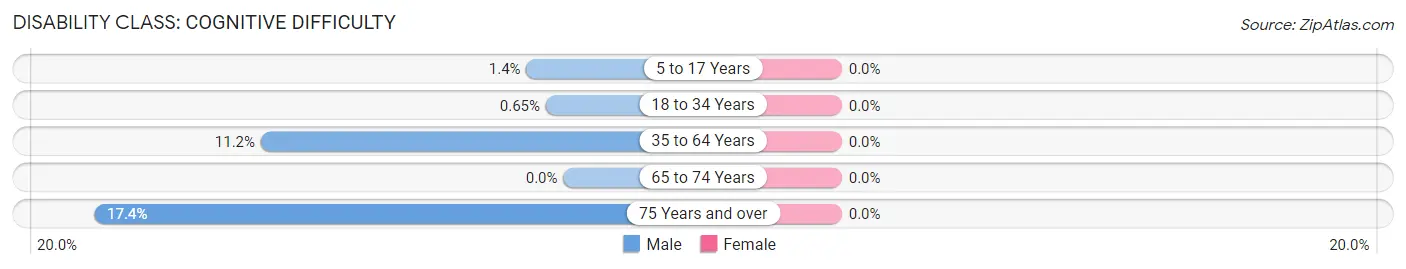
| Age Bracket | Male | Female |
| 5 to 17 Years | 5 (1.4%) | 0 (0.0%) |
| 18 to 34 Years | 2 (0.6%) | 0 (0.0%) |
| 35 to 64 Years | 73 (11.2%) | 0 (0.0%) |
| 65 to 74 Years | 0 (0.0%) | 0 (0.0%) |
| 75 Years and over | 31 (17.4%) | 0 (0.0%) |
Disability Class: Ambulatory Difficulty
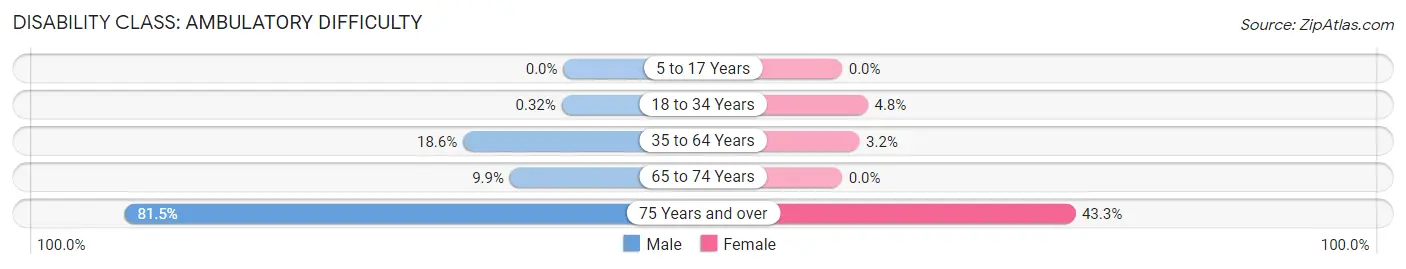
| Age Bracket | Male | Female |
| 5 to 17 Years | 0 (0.0%) | 0 (0.0%) |
| 18 to 34 Years | 1 (0.3%) | 15 (4.8%) |
| 35 to 64 Years | 121 (18.6%) | 22 (3.2%) |
| 65 to 74 Years | 17 (9.9%) | 0 (0.0%) |
| 75 Years and over | 145 (81.5%) | 87 (43.3%) |
Disability Class: Self-Care Difficulty
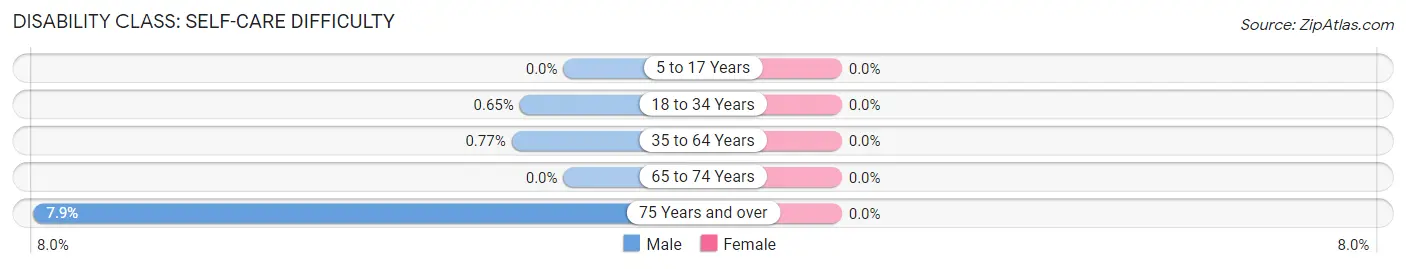
| Age Bracket | Male | Female |
| 5 to 17 Years | 0 (0.0%) | 0 (0.0%) |
| 18 to 34 Years | 2 (0.6%) | 0 (0.0%) |
| 35 to 64 Years | 5 (0.8%) | 0 (0.0%) |
| 65 to 74 Years | 0 (0.0%) | 0 (0.0%) |
| 75 Years and over | 14 (7.9%) | 0 (0.0%) |
Technology Access in Newburgh
Computing Device Access in Newburgh
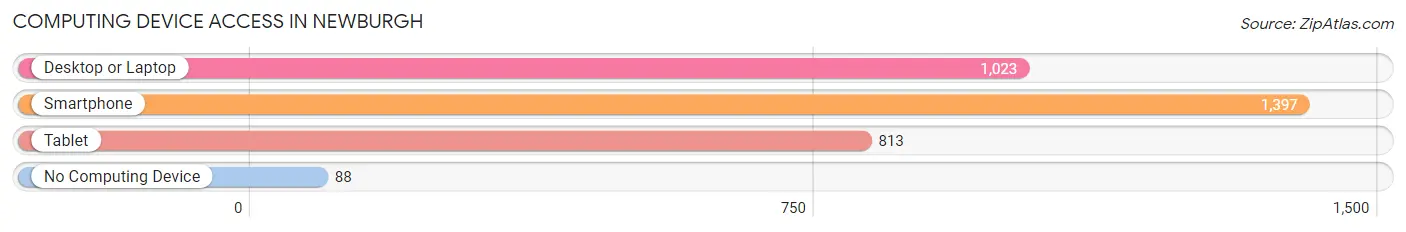
| Device Type | # Households | % Households |
| Desktop or Laptop | 1,023 | 64.2% |
| Smartphone | 1,397 | 87.7% |
| Tablet | 813 | 51.0% |
| No Computing Device | 88 | 5.5% |
| Total | 1,593 | 100.0% |
Internet Access in Newburgh
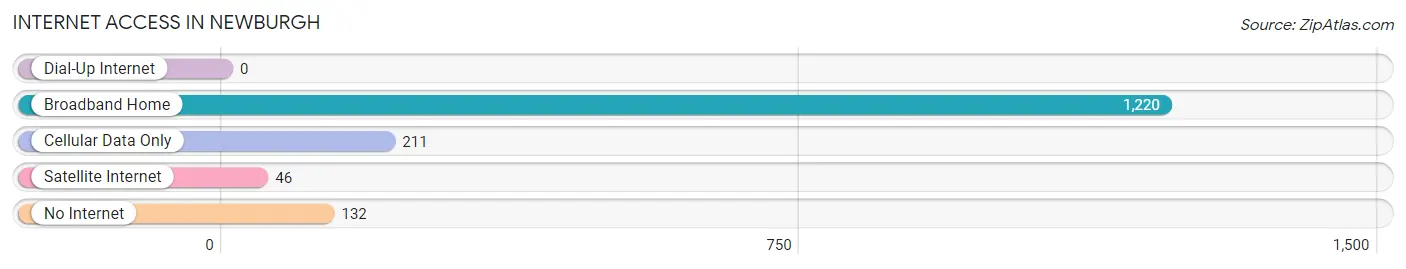
| Internet Type | # Households | % Households |
| Dial-Up Internet | 0 | 0.0% |
| Broadband Home | 1,220 | 76.6% |
| Cellular Data Only | 211 | 13.3% |
| Satellite Internet | 46 | 2.9% |
| No Internet | 132 | 8.3% |
| Total | 1,593 | 100.0% |
Newburgh Summary
Newburgh is a small city located in Warrick County, Indiana, United States. It is situated on the Ohio River, just east of Evansville. The city has a population of about 3,400 people, according to the 2010 census.
History
Newburgh was founded in 1803 by William Henry Harrison, the ninth president of the United States. The city was named after Newburgh, New York, where Harrison had previously served as a general in the Continental Army. The city was incorporated in 1817 and was the first city in Warrick County.
In the early 19th century, Newburgh was a thriving river port and a major center for the production of hemp and tobacco. The city was also a major stop on the Underground Railroad, with many slaves escaping to freedom in the North.
In the late 19th century, the city experienced a period of growth and prosperity. The city was home to several factories, including a glass factory, a paper mill, and a flour mill. The city also had a thriving business district, with several stores, banks, and hotels.
Geography
Newburgh is located in the southwestern corner of Warrick County, on the Ohio River. The city is situated on a bluff overlooking the river, and is surrounded by rolling hills and farmland. The city is located about 10 miles east of Evansville, Indiana, and about 50 miles west of Louisville, Kentucky.
The climate in Newburgh is humid subtropical, with hot, humid summers and mild winters. The average annual temperature is around 57 degrees Fahrenheit, and the average annual precipitation is around 40 inches.
Economy
The economy of Newburgh is largely based on manufacturing and tourism. The city is home to several factories, including a glass factory, a paper mill, and a flour mill. The city also has a thriving business district, with several stores, banks, and hotels.
Newburgh is also a popular tourist destination, with several attractions, including the Newburgh Museum, the Newburgh Lock and Dam, and the Newburgh Riverwalk. The city also hosts several festivals and events throughout the year, including the Newburgh Jazz Festival and the Newburgh Art Fair.
Demographics
As of the 2010 census, the population of Newburgh was 3,400. The racial makeup of the city was 94.3% White, 2.2% African American, 0.3% Native American, 0.7% Asian, 0.1% Pacific Islander, 0.9% from other races, and 1.5% from two or more races. Hispanic or Latino of any race were 2.2% of the population.
The median household income in Newburgh was $41,944, and the median family income was $50,917. The per capita income was $20,945. About 11.3% of families and 14.2% of the population were below the poverty line, including 19.2% of those under age 18 and 8.2% of those age 65 or over.
Common Questions
What is Per Capita Income in Newburgh?
Per Capita income in Newburgh is $53,396.
What is the Median Family Income in Newburgh?
Median Family Income in Newburgh is $101,786.
What is the Median Household income in Newburgh?
Median Household Income in Newburgh is $67,772.
What is Income or Wage Gap in Newburgh?
Income or Wage Gap in Newburgh is 46.5%.
Women in Newburgh earn 53.5 cents for every dollar earned by a man.
What is Inequality or Gini Index in Newburgh?
Inequality or Gini Index in Newburgh is 0.49.
What is the Total Population of Newburgh?
Total Population of Newburgh is 3,350.
What is the Total Male Population of Newburgh?
Total Male Population of Newburgh is 1,754.
What is the Total Female Population of Newburgh?
Total Female Population of Newburgh is 1,596.
What is the Ratio of Males per 100 Females in Newburgh?
There are 109.90 Males per 100 Females in Newburgh.
What is the Ratio of Females per 100 Males in Newburgh?
There are 90.99 Females per 100 Males in Newburgh.
What is the Median Population Age in Newburgh?
Median Population Age in Newburgh is 48.8 Years.
What is the Average Family Size in Newburgh
Average Family Size in Newburgh is 2.7 People.
What is the Average Household Size in Newburgh
Average Household Size in Newburgh is 2.1 People.
How Large is the Labor Force in Newburgh?
There are 1,831 People in the Labor Forcein in Newburgh.
What is the Percentage of People in the Labor Force in Newburgh?
66.6% of People are in the Labor Force in Newburgh.
What is the Unemployment Rate in Newburgh?
Unemployment Rate in Newburgh is 7.0%.