New Point, IN Map & Demographics
New Point Map
New Point Overview
$27,195
PER CAPITA INCOME
$73,750
AVG FAMILY INCOME
$54,432
AVG HOUSEHOLD INCOME
57.6%
WAGE / INCOME GAP [ % ]
42.4¢/ $1
WAGE / INCOME GAP [ $ ]
0.37
INEQUALITY / GINI INDEX
325
TOTAL POPULATION
159
MALE POPULATION
166
FEMALE POPULATION
95.78
MALES / 100 FEMALES
104.40
FEMALES / 100 MALES
37.8
MEDIAN AGE
3.2
AVG FAMILY SIZE
2.9
AVG HOUSEHOLD SIZE
162
LABOR FORCE [ PEOPLE ]
63.8%
PERCENT IN LABOR FORCE
3.7%
UNEMPLOYMENT RATE
New Point Zip Codes
Income in New Point
Income Overview in New Point
Per Capita Income in New Point is $27,195, while median incomes of families and households are $73,750 and $54,432 respectively.
| Characteristic | Number | Measure |
| Per Capita Income | 325 | $27,195 |
| Median Family Income | 76 | $73,750 |
| Mean Family Income | 76 | $88,239 |
| Median Household Income | 113 | $54,432 |
| Mean Household Income | 113 | $79,478 |
| Income Deficit | 76 | $0 |
| Wage / Income Gap (%) | 325 | 57.55% |
| Wage / Income Gap ($) | 325 | 42.45¢ per $1 |
| Gini / Inequality Index | 325 | 0.37 |
Earnings by Sex in New Point
Average Earnings in New Point are $34,583, $51,042 for men and $21,667 for women, a difference of 57.6%.
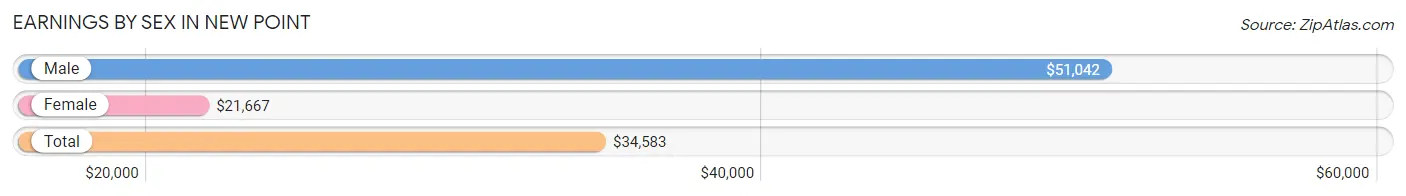
| Sex | Number | Average Earnings |
| Male | 81 (45.8%) | $51,042 |
| Female | 96 (54.2%) | $21,667 |
| Total | 177 (100.0%) | $34,583 |
Earnings by Sex by Income Bracket in New Point
The most common earnings brackets in New Point are $55,000 to $64,999 for men (18 | 22.2%) and $15,000 to $17,499 for women (21 | 21.9%).
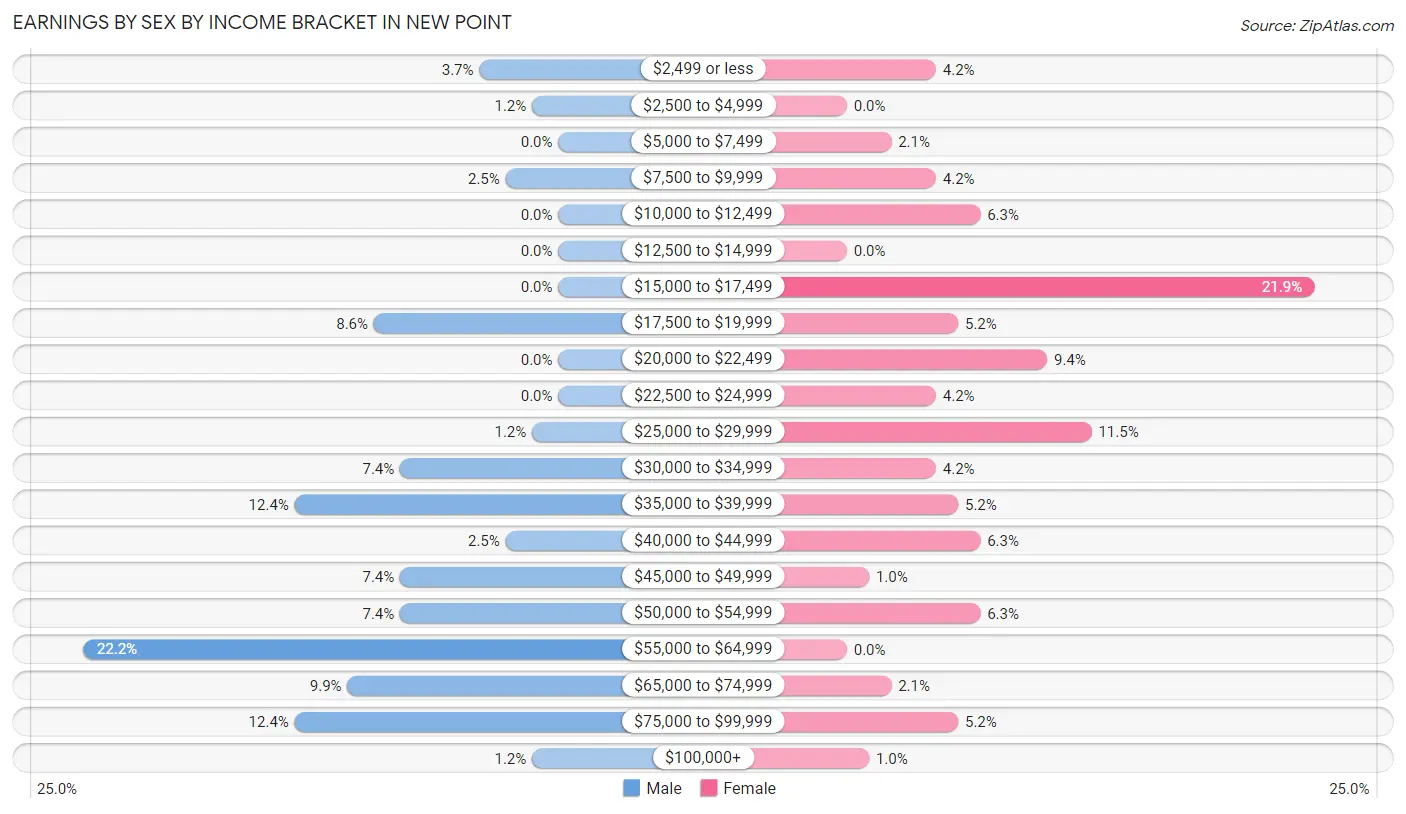
| Income | Male | Female |
| $2,499 or less | 3 (3.7%) | 4 (4.2%) |
| $2,500 to $4,999 | 1 (1.2%) | 0 (0.0%) |
| $5,000 to $7,499 | 0 (0.0%) | 2 (2.1%) |
| $7,500 to $9,999 | 2 (2.5%) | 4 (4.2%) |
| $10,000 to $12,499 | 0 (0.0%) | 6 (6.2%) |
| $12,500 to $14,999 | 0 (0.0%) | 0 (0.0%) |
| $15,000 to $17,499 | 0 (0.0%) | 21 (21.9%) |
| $17,500 to $19,999 | 7 (8.6%) | 5 (5.2%) |
| $20,000 to $22,499 | 0 (0.0%) | 9 (9.4%) |
| $22,500 to $24,999 | 0 (0.0%) | 4 (4.2%) |
| $25,000 to $29,999 | 1 (1.2%) | 11 (11.5%) |
| $30,000 to $34,999 | 6 (7.4%) | 4 (4.2%) |
| $35,000 to $39,999 | 10 (12.3%) | 5 (5.2%) |
| $40,000 to $44,999 | 2 (2.5%) | 6 (6.2%) |
| $45,000 to $49,999 | 6 (7.4%) | 1 (1.0%) |
| $50,000 to $54,999 | 6 (7.4%) | 6 (6.2%) |
| $55,000 to $64,999 | 18 (22.2%) | 0 (0.0%) |
| $65,000 to $74,999 | 8 (9.9%) | 2 (2.1%) |
| $75,000 to $99,999 | 10 (12.3%) | 5 (5.2%) |
| $100,000+ | 1 (1.2%) | 1 (1.0%) |
| Total | 81 (100.0%) | 96 (100.0%) |
Earnings by Sex by Educational Attainment in New Point
Average earnings in New Point are $51,458 for men and $23,750 for women, a difference of 53.8%. Men with an educational attainment of college or associate's degree enjoy the highest average annual earnings of $78,333, while those with high school diploma education earn the least with $47,500. Women with an educational attainment of college or associate's degree earn the most with the average annual earnings of $34,167, while those with less than high school education have the smallest earnings of $16,731.
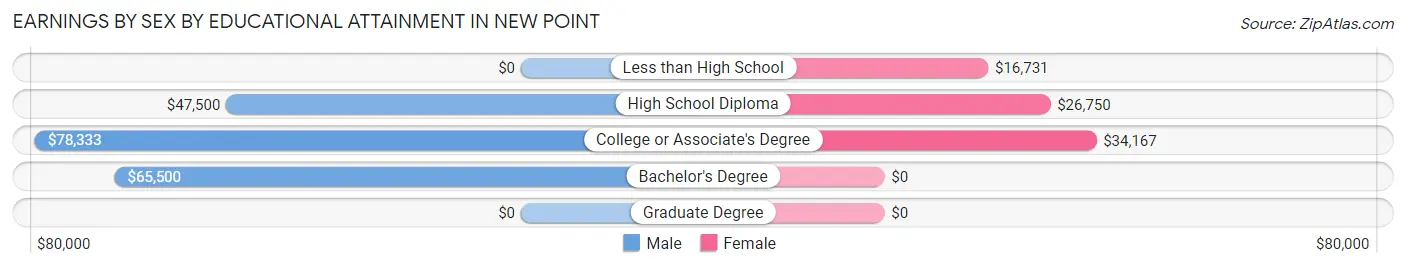
| Educational Attainment | Male Income | Female Income |
| Less than High School | - | - |
| High School Diploma | $47,500 | $26,750 |
| College or Associate's Degree | $78,333 | $34,167 |
| Bachelor's Degree | $65,500 | $0 |
| Graduate Degree | - | - |
| Total | $51,458 | $23,750 |
Family Income in New Point
Family Income Brackets in New Point
According to the New Point family income data, there are 22 families falling into the $50,000 to $74,999 income range, which is the most common income bracket and makes up 28.9% of all families.
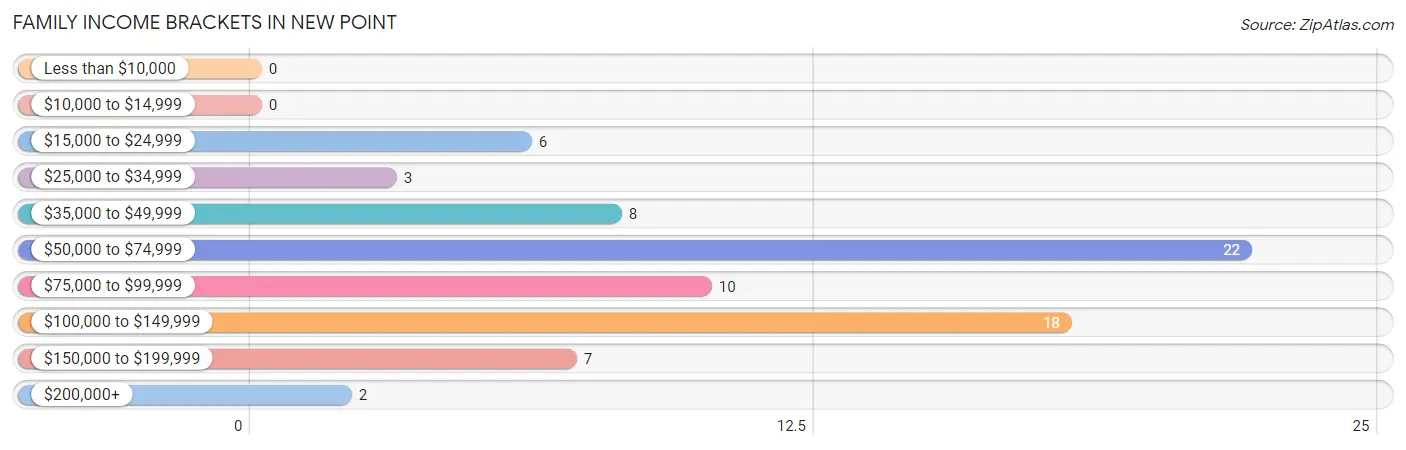
| Income Bracket | # Families | % Families |
| Less than $10,000 | 0 | 0.0% |
| $10,000 to $14,999 | 0 | 0.0% |
| $15,000 to $24,999 | 6 | 7.9% |
| $25,000 to $34,999 | 3 | 3.9% |
| $35,000 to $49,999 | 8 | 10.5% |
| $50,000 to $74,999 | 22 | 28.9% |
| $75,000 to $99,999 | 10 | 13.2% |
| $100,000 to $149,999 | 18 | 23.7% |
| $150,000 to $199,999 | 7 | 9.2% |
| $200,000+ | 2 | 2.6% |
Family Income by Famaliy Size in New Point
4-person families (9 | 11.8%) account for the highest median family income in New Point with $152,917 per family, while 4-person families (9 | 11.8%) have the highest median income of $38,229 per family member.
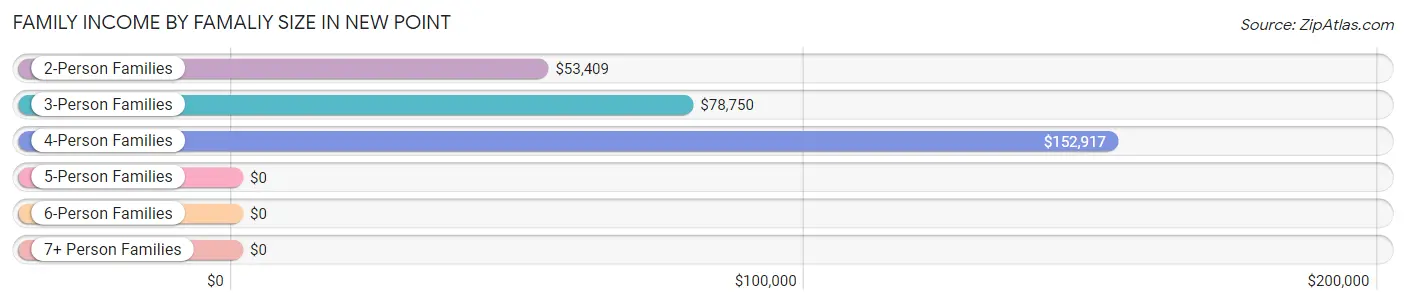
| Income Bracket | # Families | Median Income |
| 2-Person Families | 40 (52.6%) | $53,409 |
| 3-Person Families | 18 (23.7%) | $78,750 |
| 4-Person Families | 9 (11.8%) | $152,917 |
| 5-Person Families | 4 (5.3%) | $0 |
| 6-Person Families | 1 (1.3%) | $0 |
| 7+ Person Families | 4 (5.3%) | $0 |
| Total | 76 (100.0%) | $73,750 |
Family Income by Number of Earners in New Point
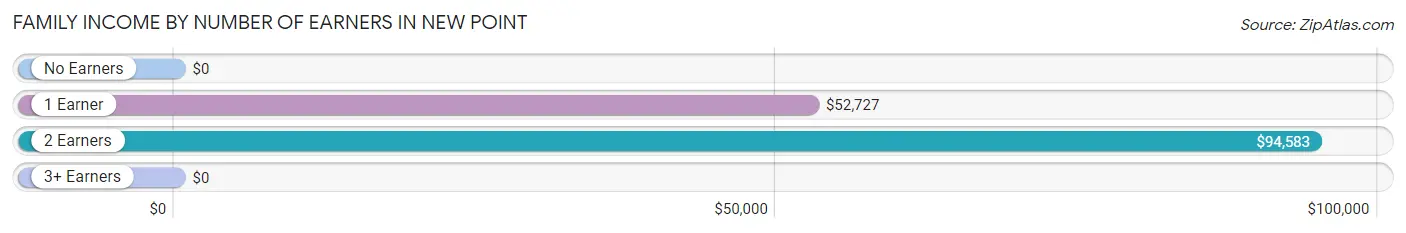
| Number of Earners | # Families | Median Income |
| No Earners | 4 (5.3%) | $0 |
| 1 Earner | 32 (42.1%) | $52,727 |
| 2 Earners | 33 (43.4%) | $94,583 |
| 3+ Earners | 7 (9.2%) | $0 |
| Total | 76 (100.0%) | $73,750 |
Household Income in New Point
Household Income Brackets in New Point
With 26 households falling in the category, the $35,000 to $49,999 income range is the most frequent in New Point, accounting for 23.0% of all households.
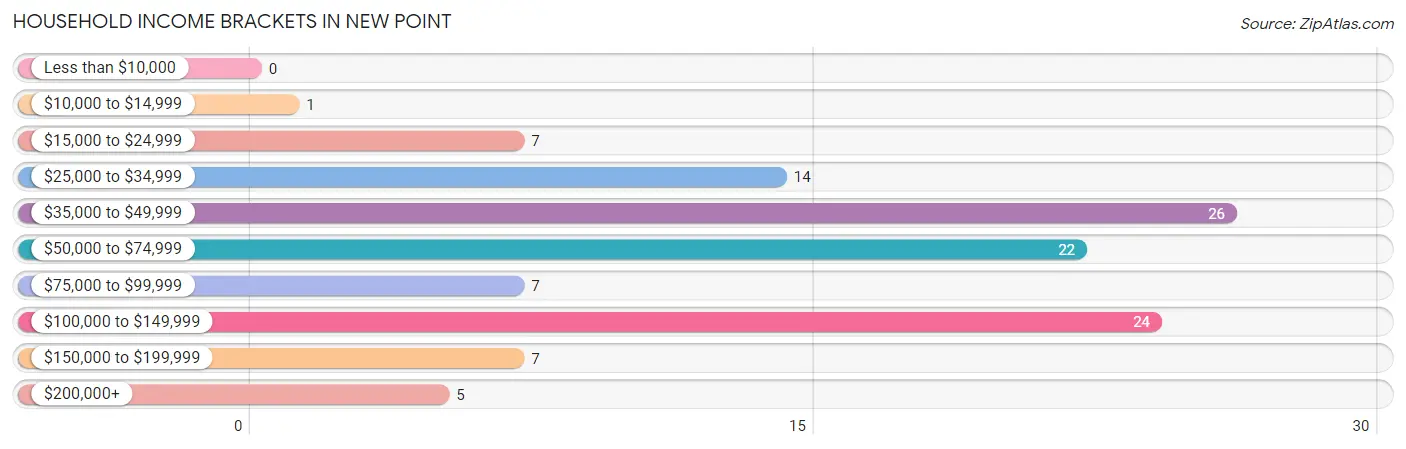
| Income Bracket | # Households | % Households |
| Less than $10,000 | 0 | 0.0% |
| $10,000 to $14,999 | 1 | 0.9% |
| $15,000 to $24,999 | 7 | 6.2% |
| $25,000 to $34,999 | 14 | 12.4% |
| $35,000 to $49,999 | 26 | 23.0% |
| $50,000 to $74,999 | 22 | 19.5% |
| $75,000 to $99,999 | 7 | 6.2% |
| $100,000 to $149,999 | 24 | 21.2% |
| $150,000 to $199,999 | 7 | 6.2% |
| $200,000+ | 5 | 4.4% |
Household Income by Householder Age in New Point
The median household income in New Point is $54,432, with the highest median household income of $126,667 found in the 25 to 44 years age bracket for the primary householder. A total of 40 households (35.4%) fall into this category. Meanwhile, the 15 to 24 years age bracket for the primary householder has the lowest median household income of $0, with 4 households (3.5%) in this group.
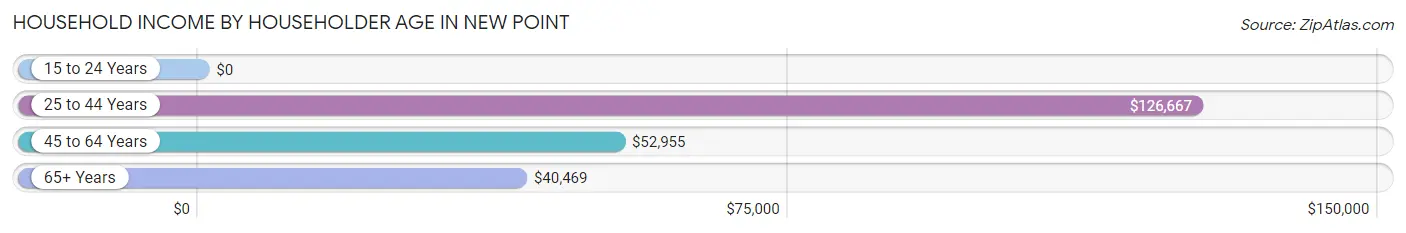
| Income Bracket | # Households | Median Income |
| 15 to 24 Years | 4 (3.5%) | $0 |
| 25 to 44 Years | 40 (35.4%) | $126,667 |
| 45 to 64 Years | 38 (33.6%) | $52,955 |
| 65+ Years | 31 (27.4%) | $40,469 |
| Total | 113 (100.0%) | $54,432 |
Poverty in New Point
Income Below Poverty by Sex and Age in New Point
With 8.8% poverty level for males and 12.0% for females among the residents of New Point, 15 year old males and under 5 year old females are the most vulnerable to poverty, with 4 males (100.0%) and 2 females (100.0%) in their respective age groups living below the poverty level.
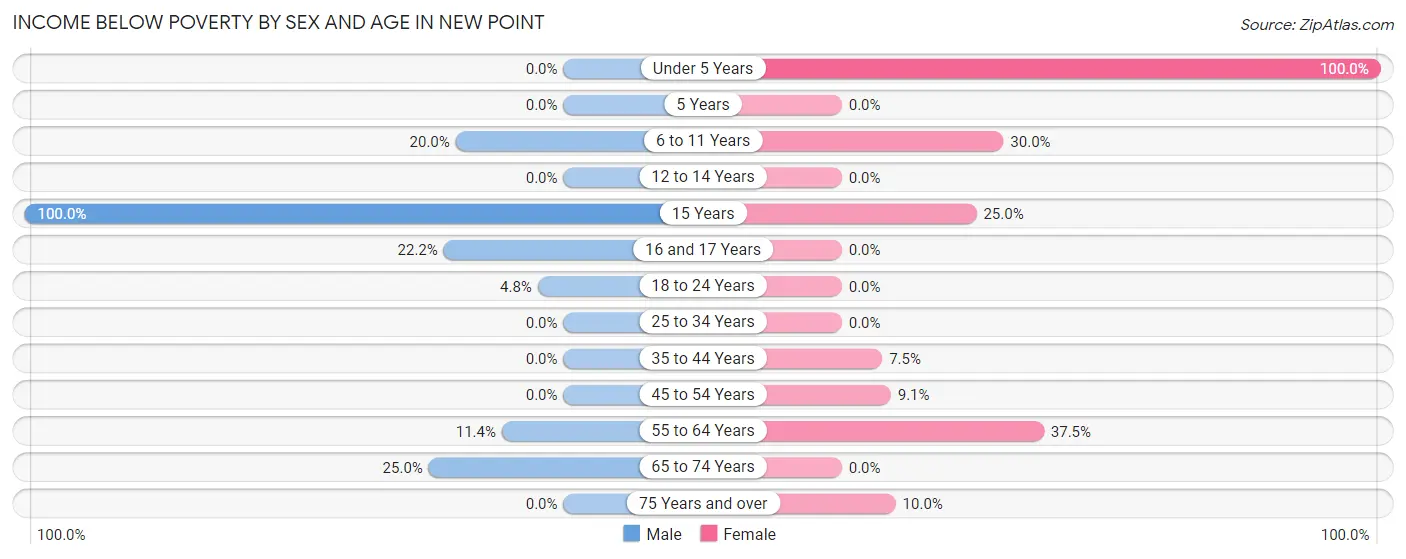
| Age Bracket | Male | Female |
| Under 5 Years | 0 (0.0%) | 2 (100.0%) |
| 5 Years | 0 (0.0%) | 0 (0.0%) |
| 6 to 11 Years | 2 (20.0%) | 6 (30.0%) |
| 12 to 14 Years | 0 (0.0%) | 0 (0.0%) |
| 15 Years | 4 (100.0%) | 4 (25.0%) |
| 16 and 17 Years | 2 (22.2%) | 0 (0.0%) |
| 18 to 24 Years | 1 (4.8%) | 0 (0.0%) |
| 25 to 34 Years | 0 (0.0%) | 0 (0.0%) |
| 35 to 44 Years | 0 (0.0%) | 3 (7.5%) |
| 45 to 54 Years | 0 (0.0%) | 1 (9.1%) |
| 55 to 64 Years | 4 (11.4%) | 3 (37.5%) |
| 65 to 74 Years | 1 (25.0%) | 0 (0.0%) |
| 75 Years and over | 0 (0.0%) | 1 (10.0%) |
| Total | 14 (8.8%) | 20 (12.0%) |
Income Above Poverty by Sex and Age in New Point
According to the poverty statistics in New Point, males aged 5 years and females aged 5 years are the age groups that are most secure financially, with 100.0% of males and 100.0% of females in these age groups living above the poverty line.
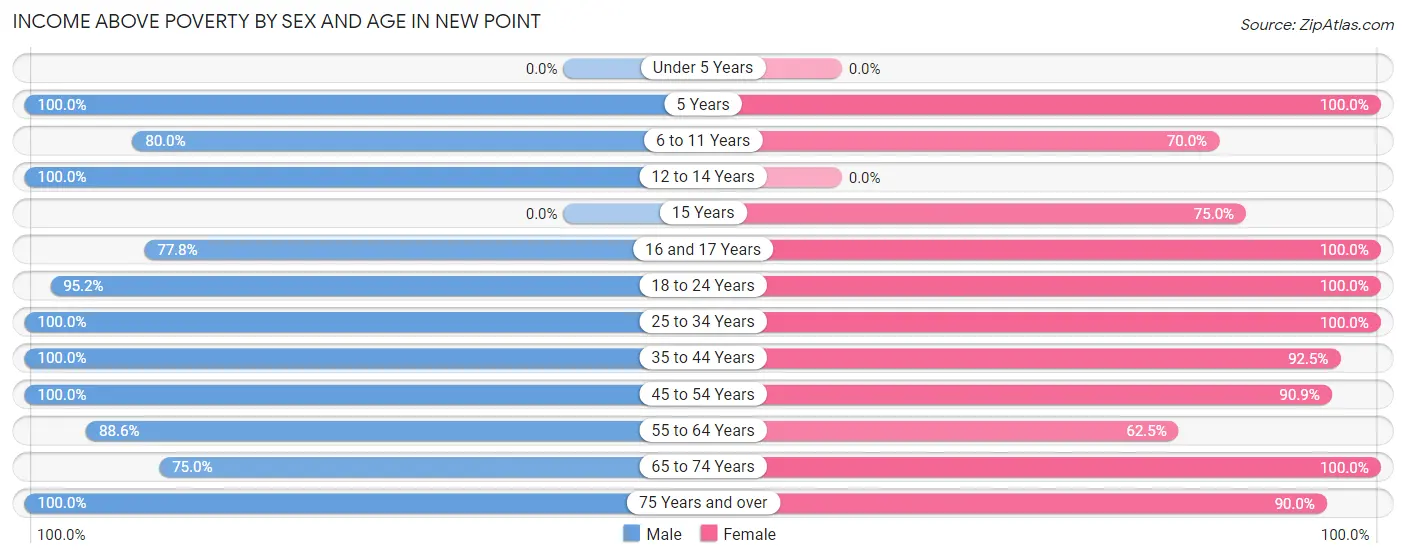
| Age Bracket | Male | Female |
| Under 5 Years | 0 (0.0%) | 0 (0.0%) |
| 5 Years | 6 (100.0%) | 3 (100.0%) |
| 6 to 11 Years | 8 (80.0%) | 14 (70.0%) |
| 12 to 14 Years | 10 (100.0%) | 0 (0.0%) |
| 15 Years | 0 (0.0%) | 12 (75.0%) |
| 16 and 17 Years | 7 (77.8%) | 4 (100.0%) |
| 18 to 24 Years | 20 (95.2%) | 20 (100.0%) |
| 25 to 34 Years | 6 (100.0%) | 15 (100.0%) |
| 35 to 44 Years | 36 (100.0%) | 37 (92.5%) |
| 45 to 54 Years | 11 (100.0%) | 10 (90.9%) |
| 55 to 64 Years | 31 (88.6%) | 5 (62.5%) |
| 65 to 74 Years | 3 (75.0%) | 17 (100.0%) |
| 75 Years and over | 7 (100.0%) | 9 (90.0%) |
| Total | 145 (91.2%) | 146 (87.9%) |
Income Below Poverty Among Married-Couple Families in New Point
The poverty statistics for married-couple families in New Point show that 2.4% or 1 of the total 41 families live below the poverty line. Families with no children have the highest poverty rate of 4.5%, comprising of 1 families. On the other hand, families with 1 or 2 children have the lowest poverty rate of 0.0%, which includes 0 families.
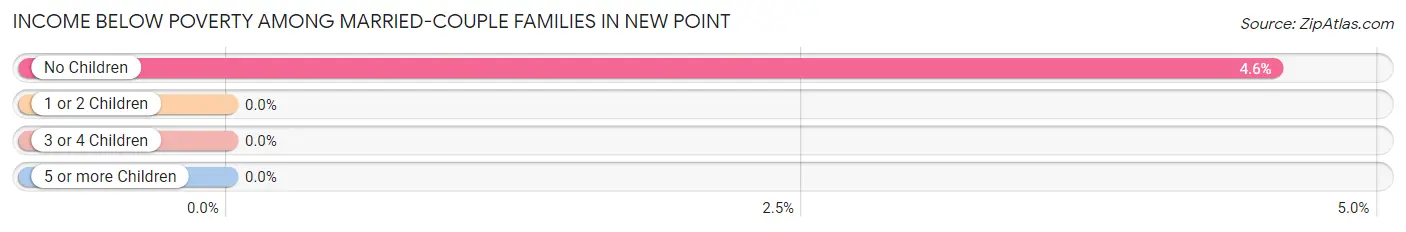
| Children | Above Poverty | Below Poverty |
| No Children | 21 (95.5%) | 1 (4.5%) |
| 1 or 2 Children | 15 (100.0%) | 0 (0.0%) |
| 3 or 4 Children | 4 (100.0%) | 0 (0.0%) |
| 5 or more Children | 0 (0.0%) | 0 (0.0%) |
| Total | 40 (97.6%) | 1 (2.4%) |
Income Below Poverty Among Single-Parent Households in New Point
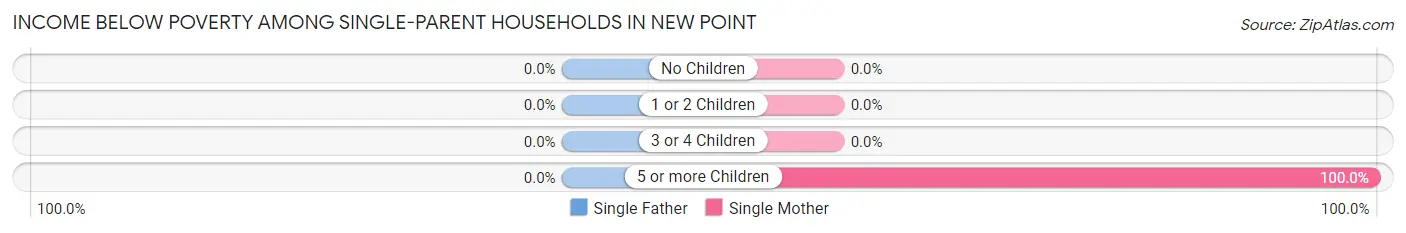
| Children | Single Father | Single Mother |
| No Children | 0 (0.0%) | 0 (0.0%) |
| 1 or 2 Children | 0 (0.0%) | 0 (0.0%) |
| 3 or 4 Children | 0 (0.0%) | 0 (0.0%) |
| 5 or more Children | 0 (0.0%) | 1 (100.0%) |
| Total | 0 (0.0%) | 1 (4.3%) |
Income Below Poverty Among Married-Couple vs Single-Parent Households in New Point
The poverty data for New Point shows that 1 of the married-couple family households (2.4%) and 1 of the single-parent households (2.9%) are living below the poverty level. Within the married-couple family households, those with no children have the highest poverty rate, with 1 households (4.5%) falling below the poverty line. Among the single-parent households, those with 5 or more children have the highest poverty rate, with 1 household (100.0%) living below poverty.
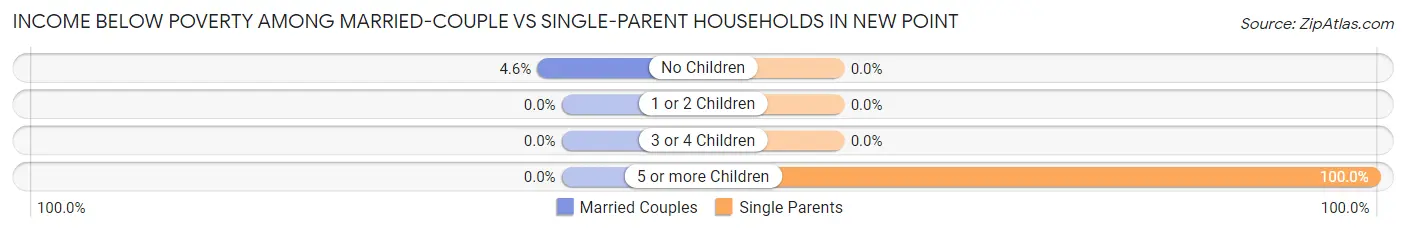
| Children | Married-Couple Families | Single-Parent Households |
| No Children | 1 (4.5%) | 0 (0.0%) |
| 1 or 2 Children | 0 (0.0%) | 0 (0.0%) |
| 3 or 4 Children | 0 (0.0%) | 0 (0.0%) |
| 5 or more Children | 0 (0.0%) | 1 (100.0%) |
| Total | 1 (2.4%) | 1 (2.9%) |
Race in New Point
The most populous races in New Point are White / Caucasian (289 | 88.9%), Two or more Races (36 | 11.1%), and Hispanic or Latino (19 | 5.9%).
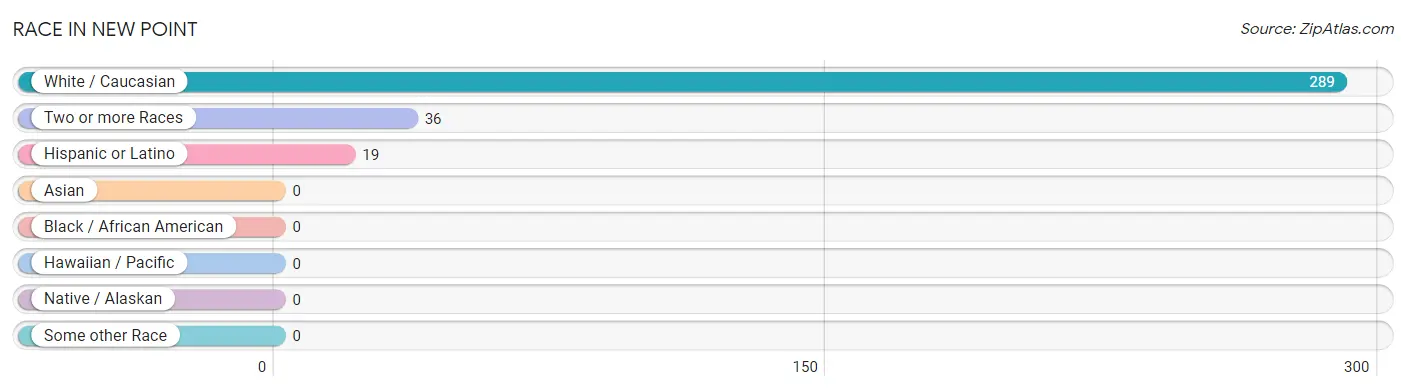
| Race | # Population | % Population |
| Asian | 0 | 0.0% |
| Black / African American | 0 | 0.0% |
| Hawaiian / Pacific | 0 | 0.0% |
| Hispanic or Latino | 19 | 5.9% |
| Native / Alaskan | 0 | 0.0% |
| White / Caucasian | 289 | 88.9% |
| Two or more Races | 36 | 11.1% |
| Some other Race | 0 | 0.0% |
| Total | 325 | 100.0% |
Ancestry in New Point
The most populous ancestries reported in New Point are German (78 | 24.0%), Irish (55 | 16.9%), American (54 | 16.6%), English (46 | 14.1%), and Mexican (19 | 5.9%), together accounting for 77.5% of all New Point residents.
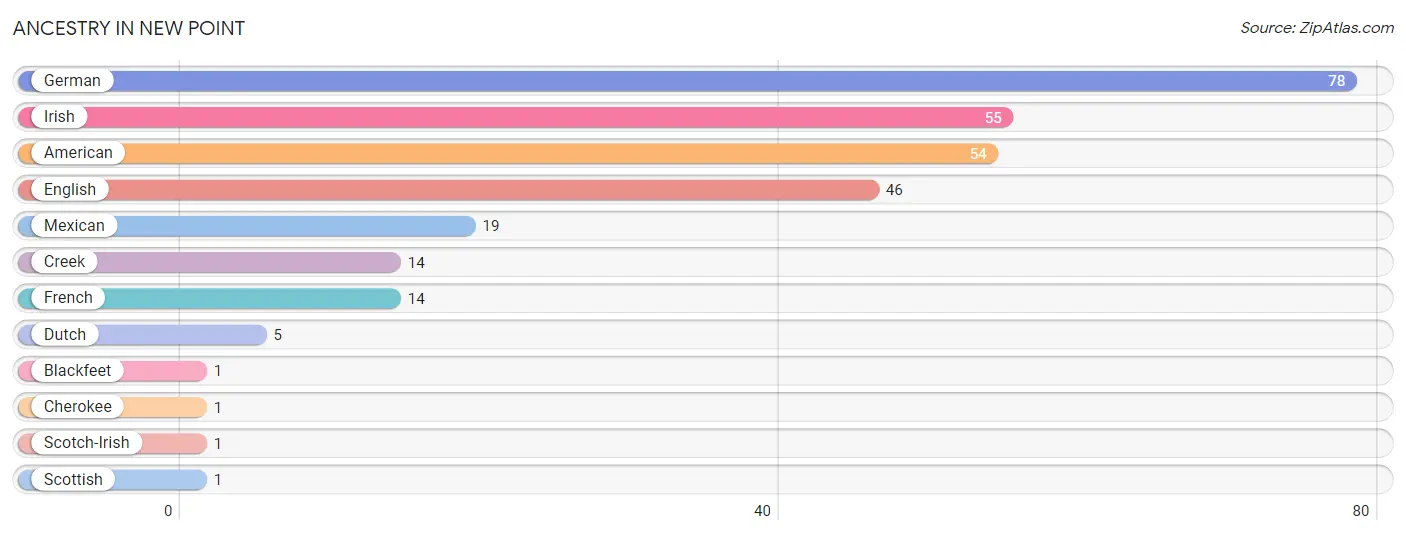
| Ancestry | # Population | % Population |
| American | 54 | 16.6% |
| Blackfeet | 1 | 0.3% |
| Cherokee | 1 | 0.3% |
| Creek | 14 | 4.3% |
| Dutch | 5 | 1.5% |
| English | 46 | 14.1% |
| French | 14 | 4.3% |
| German | 78 | 24.0% |
| Irish | 55 | 16.9% |
| Mexican | 19 | 5.9% |
| Scotch-Irish | 1 | 0.3% |
| Scottish | 1 | 0.3% | View All 12 Rows |
Immigrants in New Point

| Immigration Origin | # Population | % Population | View All 0 Rows |
Sex and Age in New Point
Sex and Age in New Point
The most populous age groups in New Point are 40 to 44 Years (28 | 17.6%) for men and 40 to 44 Years (28 | 16.9%) for women.
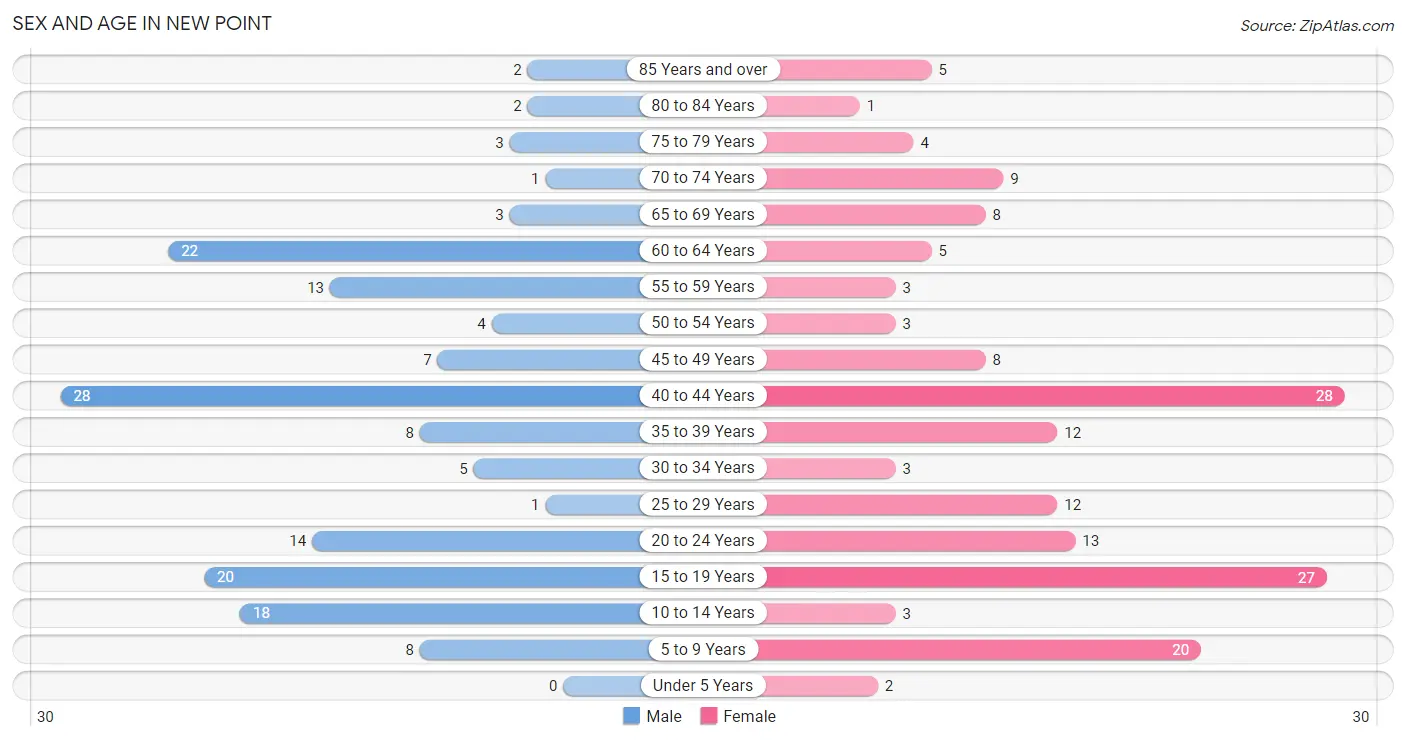
| Age Bracket | Male | Female |
| Under 5 Years | 0 (0.0%) | 2 (1.2%) |
| 5 to 9 Years | 8 (5.0%) | 20 (12.0%) |
| 10 to 14 Years | 18 (11.3%) | 3 (1.8%) |
| 15 to 19 Years | 20 (12.6%) | 27 (16.3%) |
| 20 to 24 Years | 14 (8.8%) | 13 (7.8%) |
| 25 to 29 Years | 1 (0.6%) | 12 (7.2%) |
| 30 to 34 Years | 5 (3.1%) | 3 (1.8%) |
| 35 to 39 Years | 8 (5.0%) | 12 (7.2%) |
| 40 to 44 Years | 28 (17.6%) | 28 (16.9%) |
| 45 to 49 Years | 7 (4.4%) | 8 (4.8%) |
| 50 to 54 Years | 4 (2.5%) | 3 (1.8%) |
| 55 to 59 Years | 13 (8.2%) | 3 (1.8%) |
| 60 to 64 Years | 22 (13.8%) | 5 (3.0%) |
| 65 to 69 Years | 3 (1.9%) | 8 (4.8%) |
| 70 to 74 Years | 1 (0.6%) | 9 (5.4%) |
| 75 to 79 Years | 3 (1.9%) | 4 (2.4%) |
| 80 to 84 Years | 2 (1.3%) | 1 (0.6%) |
| 85 Years and over | 2 (1.3%) | 5 (3.0%) |
| Total | 159 (100.0%) | 166 (100.0%) |
Families and Households in New Point
Median Family Size in New Point
The median family size in New Point is 3.22 persons per family, with married-couple families (41 | 53.9%) accounting for the largest median family size of 3.54 persons per family. On the other hand, single male/father families (12 | 15.8%) represent the smallest median family size with 2.50 persons per family.
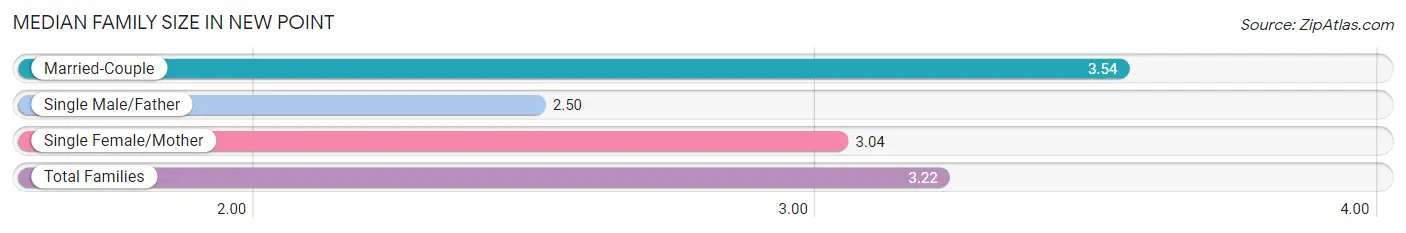
| Family Type | # Families | Family Size |
| Married-Couple | 41 (53.9%) | 3.54 |
| Single Male/Father | 12 (15.8%) | 2.50 |
| Single Female/Mother | 23 (30.3%) | 3.04 |
| Total Families | 76 (100.0%) | 3.22 |
Median Household Size in New Point
The median household size in New Point is 2.88 persons per household, with single male/father households (12 | 10.6%) accounting for the largest median household size of 3.83 persons per household. non-family households (37 | 32.7%) represent the smallest median household size with 1.68 persons per household.
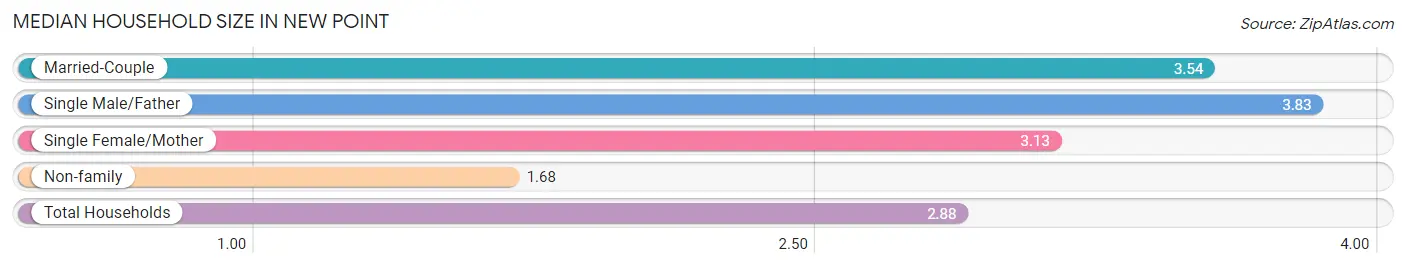
| Household Type | # Households | Household Size |
| Married-Couple | 41 (36.3%) | 3.54 |
| Single Male/Father | 12 (10.6%) | 3.83 |
| Single Female/Mother | 23 (20.3%) | 3.13 |
| Non-family | 37 (32.7%) | 1.68 |
| Total Households | 113 (100.0%) | 2.88 |
Household Size by Marriage Status in New Point
Out of a total of 113 households in New Point, 76 (67.3%) are family households, while 37 (32.7%) are nonfamily households. The most numerous type of family households are 2-person households, comprising 34, and the most common type of nonfamily households are 1-person households, comprising 22.
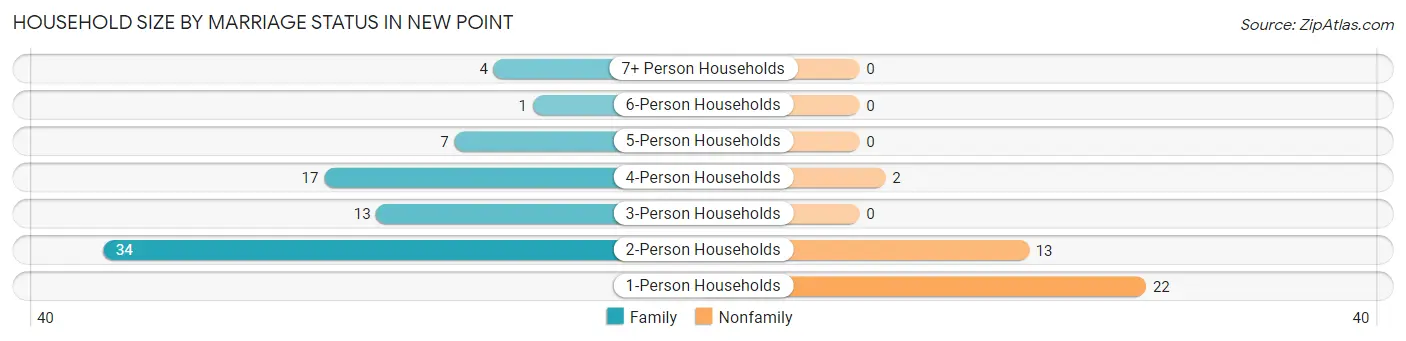
| Household Size | Family Households | Nonfamily Households |
| 1-Person Households | - | 22 (19.5%) |
| 2-Person Households | 34 (30.1%) | 13 (11.5%) |
| 3-Person Households | 13 (11.5%) | 0 (0.0%) |
| 4-Person Households | 17 (15.0%) | 2 (1.8%) |
| 5-Person Households | 7 (6.2%) | 0 (0.0%) |
| 6-Person Households | 1 (0.9%) | 0 (0.0%) |
| 7+ Person Households | 4 (3.5%) | 0 (0.0%) |
| Total | 76 (67.3%) | 37 (32.7%) |
Female Fertility in New Point
Fertility by Age in New Point
Average fertility rate in New Point is 29.0 births per 1,000 women. Women in the age bracket of 20 to 34 years have the highest fertility rate with 107.0 births per 1,000 women. Women in the age bracket of 20 to 34 years acount for 100.0% of all women with births.
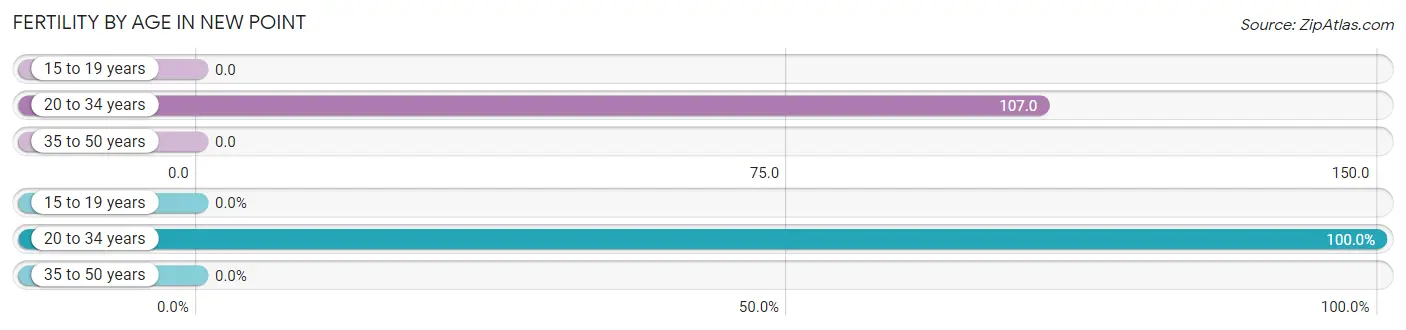
| Age Bracket | Women with Births | Births / 1,000 Women |
| 15 to 19 years | 0 (0.0%) | 0.0 |
| 20 to 34 years | 3 (100.0%) | 107.0 |
| 35 to 50 years | 0 (0.0%) | 0.0 |
| Total | 3 (100.0%) | 29.0 |
Fertility by Age by Marriage Status in New Point
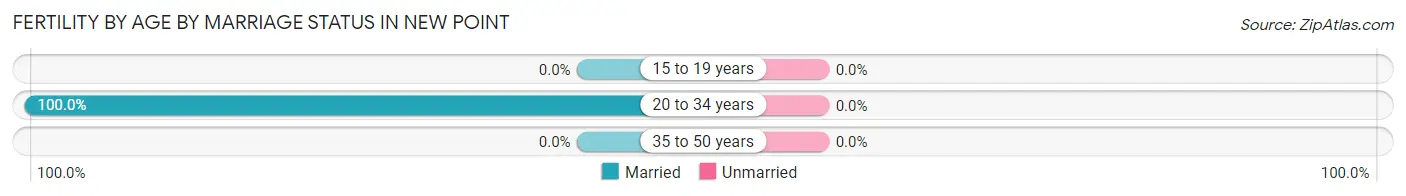
| Age Bracket | Married | Unmarried |
| 15 to 19 years | 0 (0.0%) | 0 (0.0%) |
| 20 to 34 years | 3 (100.0%) | 0 (0.0%) |
| 35 to 50 years | 0 (0.0%) | 0 (0.0%) |
| Total | 3 (100.0%) | 0 (0.0%) |
Fertility by Education in New Point
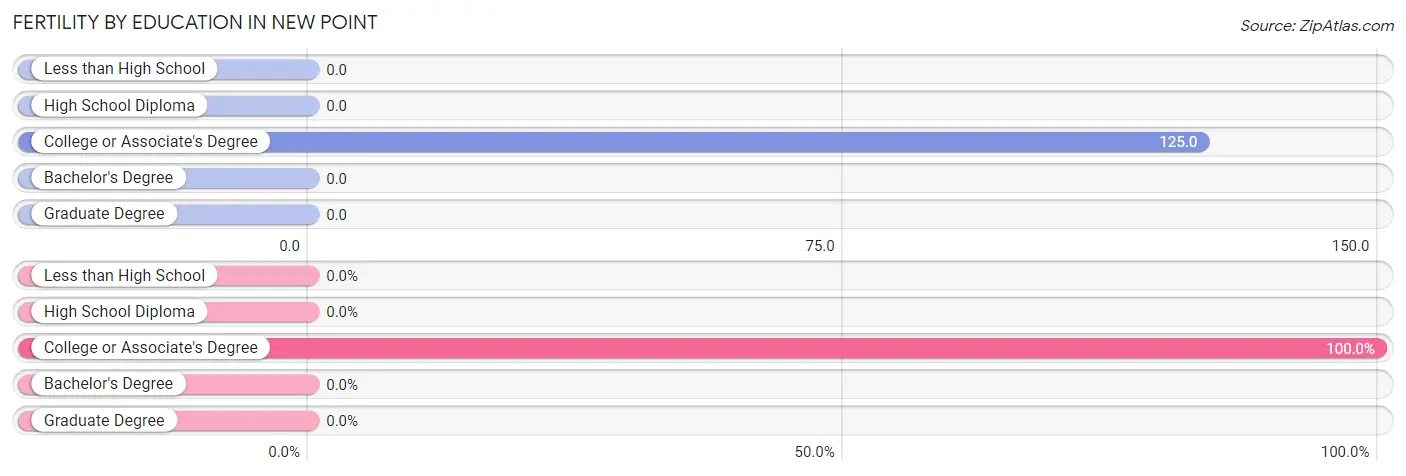
| Educational Attainment | Women with Births | Births / 1,000 Women |
| Less than High School | 0 (0.0%) | 0.0 |
| High School Diploma | 0 (0.0%) | 0.0 |
| College or Associate's Degree | 3 (100.0%) | 125.0 |
| Bachelor's Degree | 0 (0.0%) | 0.0 |
| Graduate Degree | 0 (0.0%) | 0.0 |
| Total | 3 (100.0%) | 29.0 |
Fertility by Education by Marriage Status in New Point
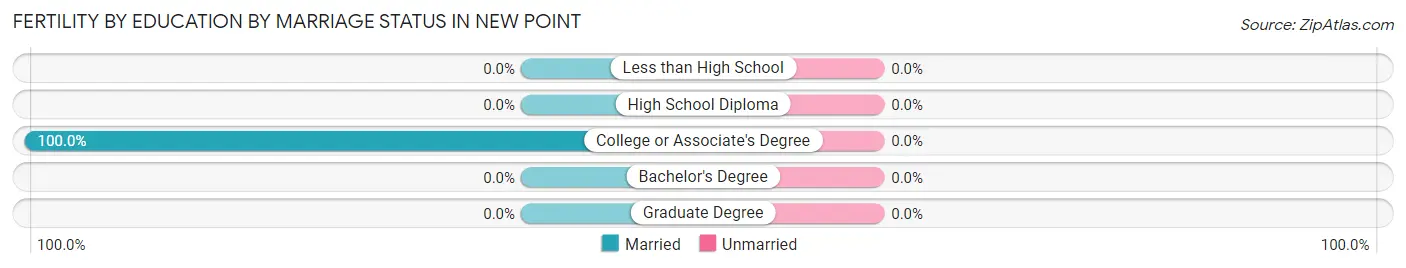
| Educational Attainment | Married | Unmarried |
| Less than High School | 0 (0.0%) | 0 (0.0%) |
| High School Diploma | 0 (0.0%) | 0 (0.0%) |
| College or Associate's Degree | 3 (100.0%) | 0 (0.0%) |
| Bachelor's Degree | 0 (0.0%) | 0 (0.0%) |
| Graduate Degree | 0 (0.0%) | 0 (0.0%) |
| Total | 3 (100.0%) | 0 (0.0%) |
Employment Characteristics in New Point
Employment by Class of Employer in New Point
Among the 152 employed individuals in New Point, private company employees (133 | 87.5%), local government employees (15 | 9.9%), and not-for-profit organizations (3 | 2.0%) make up the most common classes of employment.
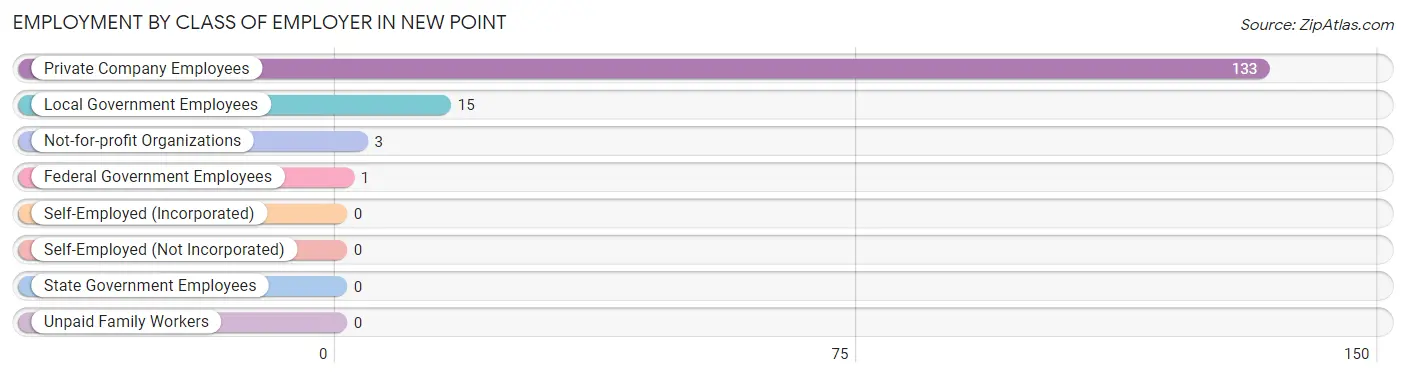
| Employer Class | # Employees | % Employees |
| Private Company Employees | 133 | 87.5% |
| Self-Employed (Incorporated) | 0 | 0.0% |
| Self-Employed (Not Incorporated) | 0 | 0.0% |
| Not-for-profit Organizations | 3 | 2.0% |
| Local Government Employees | 15 | 9.9% |
| State Government Employees | 0 | 0.0% |
| Federal Government Employees | 1 | 0.7% |
| Unpaid Family Workers | 0 | 0.0% |
| Total | 152 | 100.0% |
Employment Status by Age in New Point
According to the labor force statistics for New Point, out of the total population over 16 years of age (254), 63.8% or 162 individuals are in the labor force, with 3.7% or 6 of them unemployed. The age group with the highest labor force participation rate is 25 to 29 years, with 100.0% or 13 individuals in the labor force. Within the labor force, the 35 to 44 years age range has the highest percentage of unemployed individuals, with 9.2% or 6 of them being unemployed.
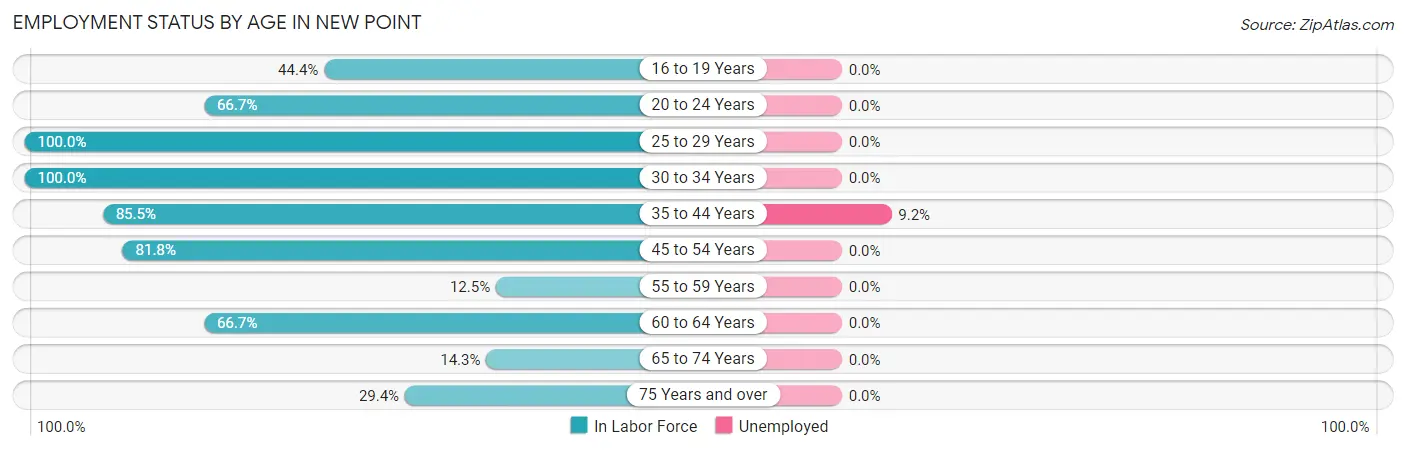
| Age Bracket | In Labor Force | Unemployed |
| 16 to 19 Years | 12 (44.4%) | 0 (0.0%) |
| 20 to 24 Years | 18 (66.7%) | 0 (0.0%) |
| 25 to 29 Years | 13 (100.0%) | 0 (0.0%) |
| 30 to 34 Years | 8 (100.0%) | 0 (0.0%) |
| 35 to 44 Years | 65 (85.5%) | 6 (9.2%) |
| 45 to 54 Years | 18 (81.8%) | 0 (0.0%) |
| 55 to 59 Years | 2 (12.5%) | 0 (0.0%) |
| 60 to 64 Years | 18 (66.7%) | 0 (0.0%) |
| 65 to 74 Years | 3 (14.3%) | 0 (0.0%) |
| 75 Years and over | 5 (29.4%) | 0 (0.0%) |
| Total | 162 (63.8%) | 6 (3.7%) |
Employment Status by Educational Attainment in New Point
According to labor force statistics for New Point, 76.5% of individuals (124) out of the total population between 25 and 64 years of age (162) are in the labor force, with 4.8% or 6 of them being unemployed. The group with the highest labor force participation rate are those with the educational attainment of bachelor's degree or higher, with 100.0% or 12 individuals in the labor force. Within the labor force, individuals with college / associate degree education have the highest percentage of unemployment, with 13.0% or 3 of them being unemployed.
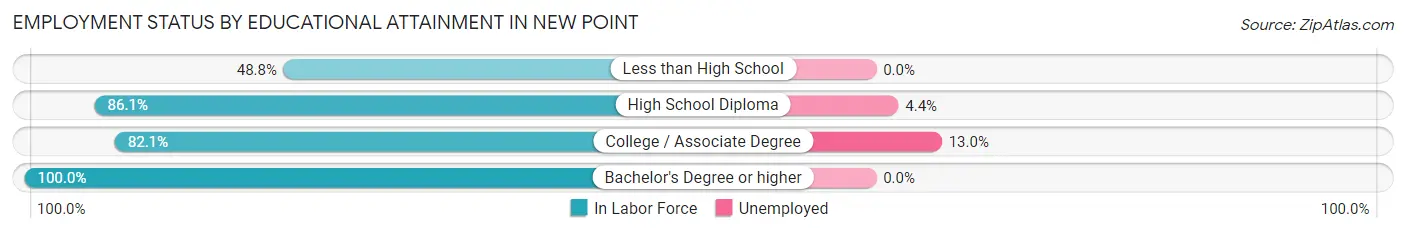
| Educational Attainment | In Labor Force | Unemployed |
| Less than High School | 21 (48.8%) | 0 (0.0%) |
| High School Diploma | 68 (86.1%) | 3 (4.4%) |
| College / Associate Degree | 23 (82.1%) | 4 (13.0%) |
| Bachelor's Degree or higher | 12 (100.0%) | 0 (0.0%) |
| Total | 124 (76.5%) | 8 (4.8%) |
Employment Occupations by Sex in New Point
Management, Business, Science and Arts Occupations
The most common Management, Business, Science and Arts occupations in New Point are Management (18 | 11.5%), Community & Social Service (9 | 5.8%), Education Instruction & Library (9 | 5.8%), Computers, Engineering & Science (6 | 3.8%), and Architecture & Engineering (5 | 3.2%).
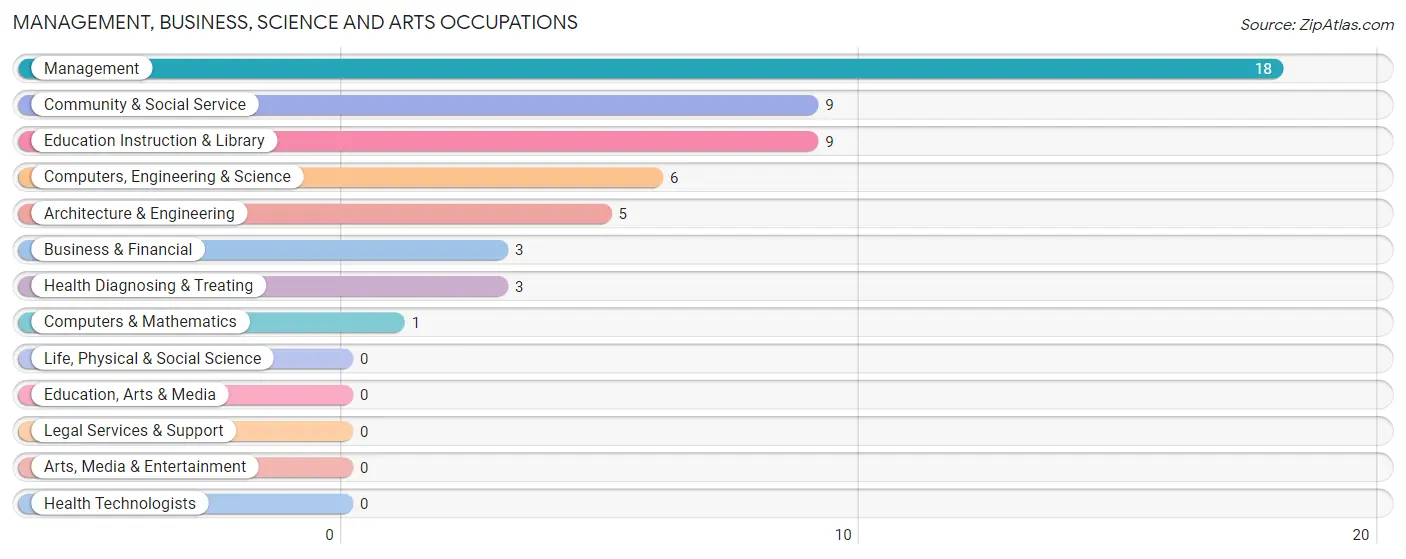
Management, Business, Science and Arts Occupations by Sex
Within the Management, Business, Science and Arts occupations in New Point, the most male-oriented occupations are Business & Financial (100.0%), Computers & Mathematics (100.0%), and Management (88.9%), while the most female-oriented occupations are Architecture & Engineering (100.0%), Health Diagnosing & Treating (100.0%), and Computers, Engineering & Science (83.3%).
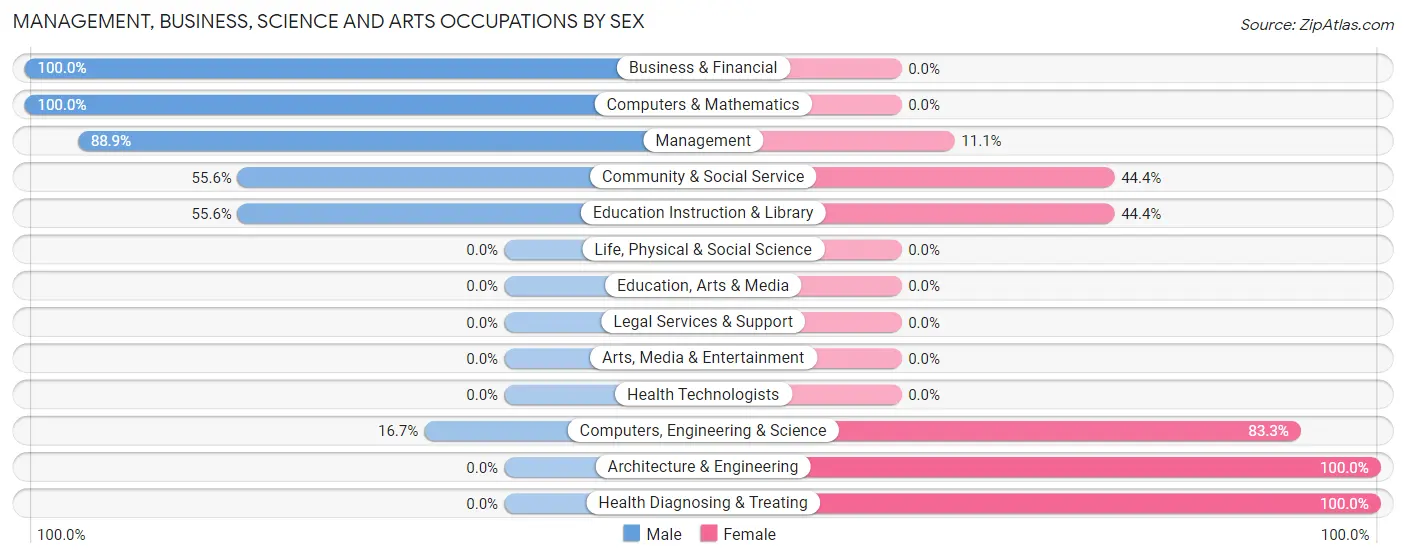
| Occupation | Male | Female |
| Management | 16 (88.9%) | 2 (11.1%) |
| Business & Financial | 3 (100.0%) | 0 (0.0%) |
| Computers, Engineering & Science | 1 (16.7%) | 5 (83.3%) |
| Computers & Mathematics | 1 (100.0%) | 0 (0.0%) |
| Architecture & Engineering | 0 (0.0%) | 5 (100.0%) |
| Life, Physical & Social Science | 0 (0.0%) | 0 (0.0%) |
| Community & Social Service | 5 (55.6%) | 4 (44.4%) |
| Education, Arts & Media | 0 (0.0%) | 0 (0.0%) |
| Legal Services & Support | 0 (0.0%) | 0 (0.0%) |
| Education Instruction & Library | 5 (55.6%) | 4 (44.4%) |
| Arts, Media & Entertainment | 0 (0.0%) | 0 (0.0%) |
| Health Diagnosing & Treating | 0 (0.0%) | 3 (100.0%) |
| Health Technologists | 0 (0.0%) | 0 (0.0%) |
| Total (Category) | 25 (64.1%) | 14 (35.9%) |
| Total (Overall) | 72 (46.2%) | 84 (53.8%) |
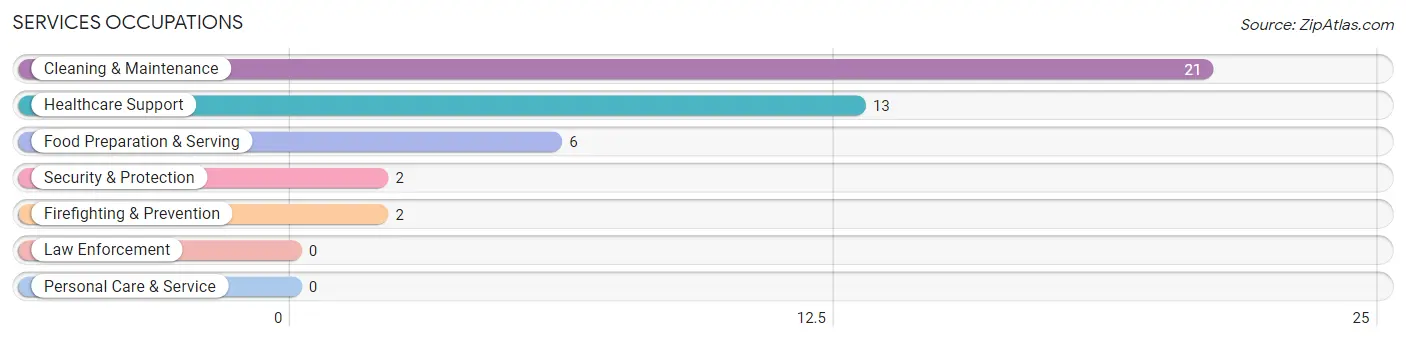
Services Occupations
The most common Services occupations in New Point are Cleaning & Maintenance (21 | 13.5%), Healthcare Support (13 | 8.3%), Food Preparation & Serving (6 | 3.8%), Security & Protection (2 | 1.3%), and Firefighting & Prevention (2 | 1.3%).
Services Occupations by Sex
Within the Services occupations in New Point, the most male-oriented occupations are Cleaning & Maintenance (71.4%), and Food Preparation & Serving (50.0%), while the most female-oriented occupations are Healthcare Support (100.0%), Security & Protection (100.0%), and Firefighting & Prevention (100.0%).
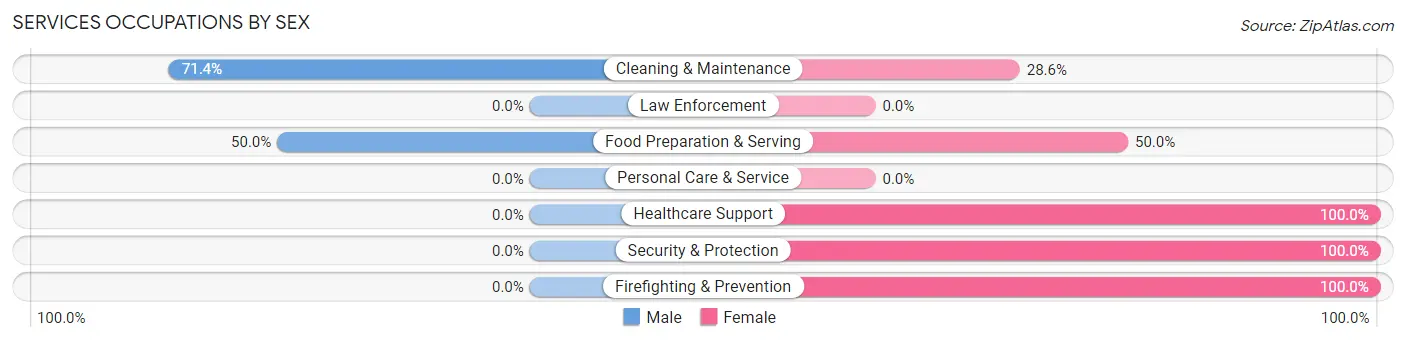
| Occupation | Male | Female |
| Healthcare Support | 0 (0.0%) | 13 (100.0%) |
| Security & Protection | 0 (0.0%) | 2 (100.0%) |
| Firefighting & Prevention | 0 (0.0%) | 2 (100.0%) |
| Law Enforcement | 0 (0.0%) | 0 (0.0%) |
| Food Preparation & Serving | 3 (50.0%) | 3 (50.0%) |
| Cleaning & Maintenance | 15 (71.4%) | 6 (28.6%) |
| Personal Care & Service | 0 (0.0%) | 0 (0.0%) |
| Total (Category) | 18 (42.9%) | 24 (57.1%) |
| Total (Overall) | 72 (46.2%) | 84 (53.8%) |
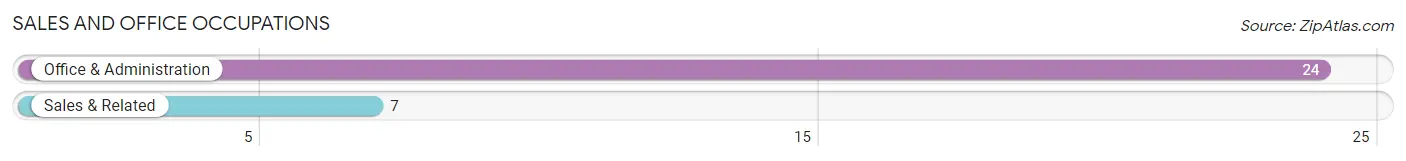
Sales and Office Occupations
The most common Sales and Office occupations in New Point are Office & Administration (24 | 15.4%), and Sales & Related (7 | 4.5%).
Sales and Office Occupations by Sex
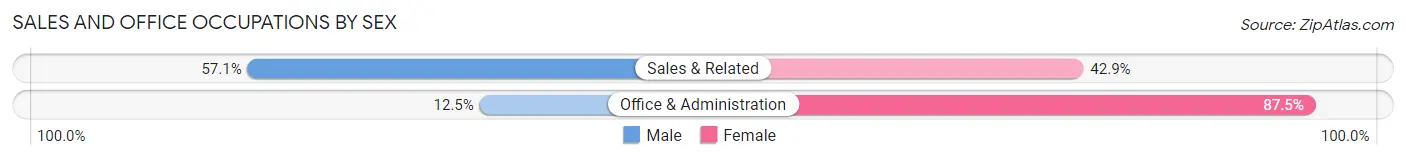
| Occupation | Male | Female |
| Sales & Related | 4 (57.1%) | 3 (42.9%) |
| Office & Administration | 3 (12.5%) | 21 (87.5%) |
| Total (Category) | 7 (22.6%) | 24 (77.4%) |
| Total (Overall) | 72 (46.2%) | 84 (53.8%) |
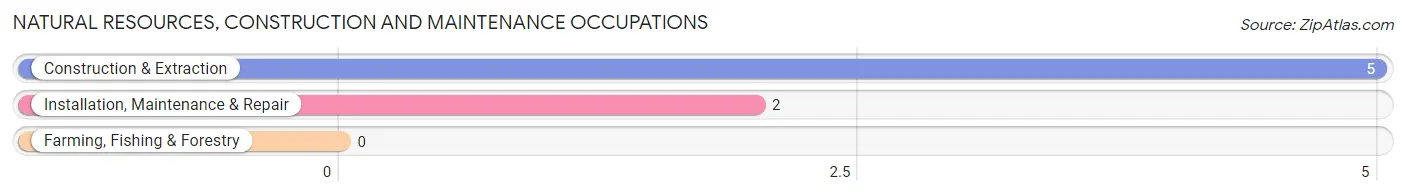
Natural Resources, Construction and Maintenance Occupations
The most common Natural Resources, Construction and Maintenance occupations in New Point are Construction & Extraction (5 | 3.2%), and Installation, Maintenance & Repair (2 | 1.3%).
Natural Resources, Construction and Maintenance Occupations by Sex
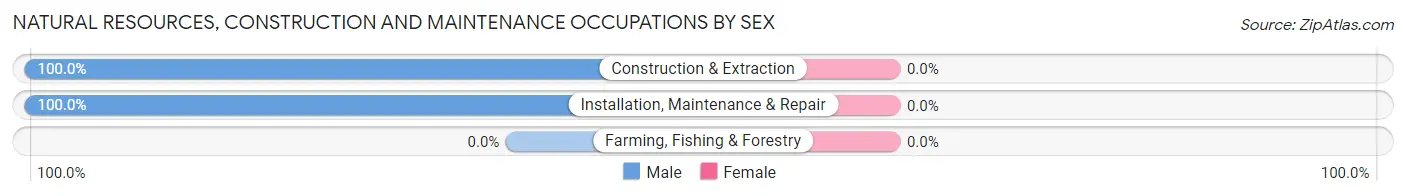
| Occupation | Male | Female |
| Farming, Fishing & Forestry | 0 (0.0%) | 0 (0.0%) |
| Construction & Extraction | 5 (100.0%) | 0 (0.0%) |
| Installation, Maintenance & Repair | 2 (100.0%) | 0 (0.0%) |
| Total (Category) | 7 (100.0%) | 0 (0.0%) |
| Total (Overall) | 72 (46.2%) | 84 (53.8%) |
Production, Transportation and Moving Occupations
The most common Production, Transportation and Moving occupations in New Point are Production (26 | 16.7%), Material Moving (8 | 5.1%), and Transportation (3 | 1.9%).
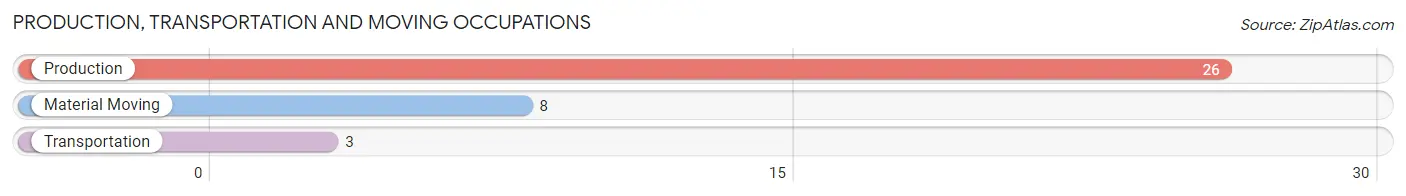
Production, Transportation and Moving Occupations by Sex
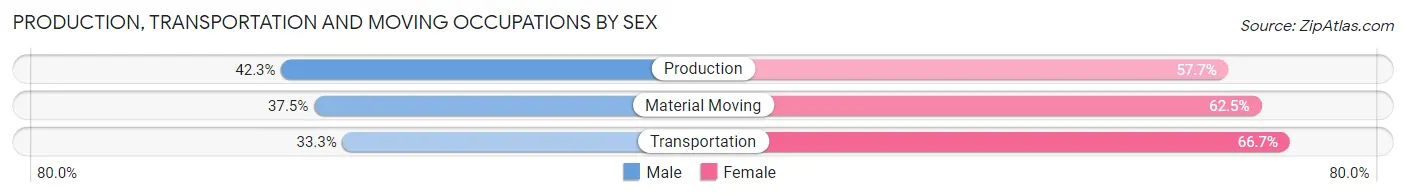
| Occupation | Male | Female |
| Production | 11 (42.3%) | 15 (57.7%) |
| Transportation | 1 (33.3%) | 2 (66.7%) |
| Material Moving | 3 (37.5%) | 5 (62.5%) |
| Total (Category) | 15 (40.5%) | 22 (59.5%) |
| Total (Overall) | 72 (46.2%) | 84 (53.8%) |
Employment Industries by Sex in New Point
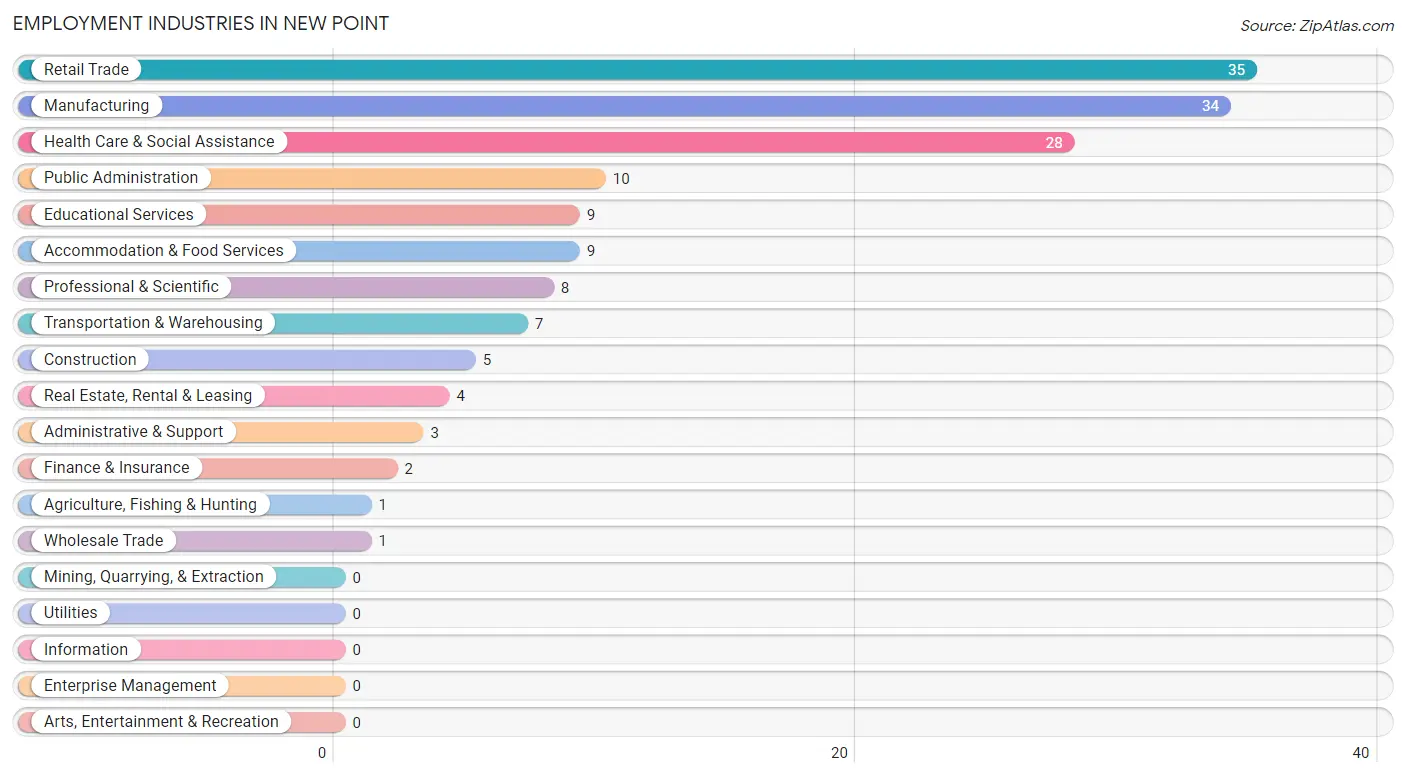
Employment Industries in New Point
The major employment industries in New Point include Retail Trade (35 | 22.4%), Manufacturing (34 | 21.8%), Health Care & Social Assistance (28 | 17.9%), Public Administration (10 | 6.4%), and Educational Services (9 | 5.8%).
Employment Industries by Sex in New Point
The New Point industries that see more men than women are Agriculture, Fishing & Hunting (100.0%), Construction (100.0%), and Real Estate, Rental & Leasing (100.0%), whereas the industries that tend to have a higher number of women are Wholesale Trade (100.0%), Finance & Insurance (100.0%), and Public Administration (100.0%).
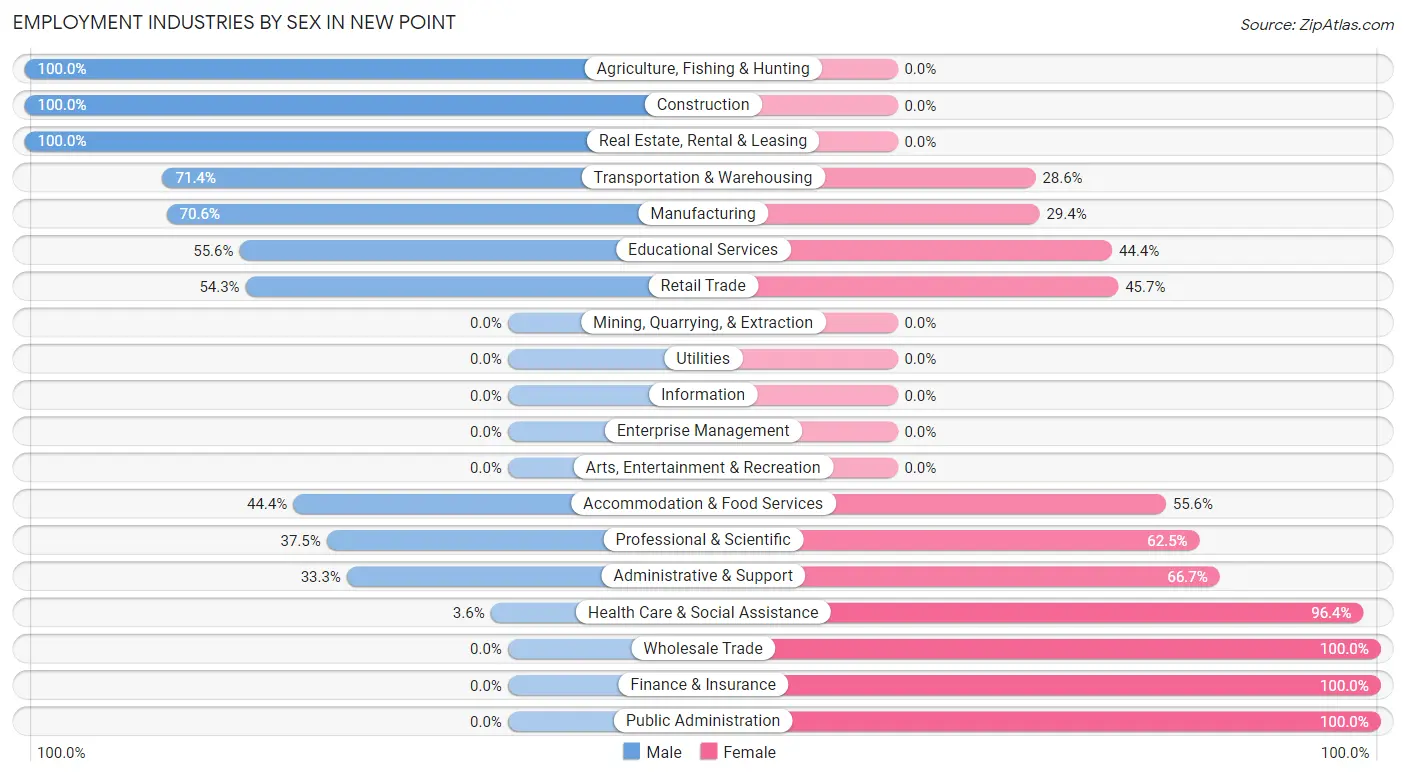
| Industry | Male | Female |
| Agriculture, Fishing & Hunting | 1 (100.0%) | 0 (0.0%) |
| Mining, Quarrying, & Extraction | 0 (0.0%) | 0 (0.0%) |
| Construction | 5 (100.0%) | 0 (0.0%) |
| Manufacturing | 24 (70.6%) | 10 (29.4%) |
| Wholesale Trade | 0 (0.0%) | 1 (100.0%) |
| Retail Trade | 19 (54.3%) | 16 (45.7%) |
| Transportation & Warehousing | 5 (71.4%) | 2 (28.6%) |
| Utilities | 0 (0.0%) | 0 (0.0%) |
| Information | 0 (0.0%) | 0 (0.0%) |
| Finance & Insurance | 0 (0.0%) | 2 (100.0%) |
| Real Estate, Rental & Leasing | 4 (100.0%) | 0 (0.0%) |
| Professional & Scientific | 3 (37.5%) | 5 (62.5%) |
| Enterprise Management | 0 (0.0%) | 0 (0.0%) |
| Administrative & Support | 1 (33.3%) | 2 (66.7%) |
| Educational Services | 5 (55.6%) | 4 (44.4%) |
| Health Care & Social Assistance | 1 (3.6%) | 27 (96.4%) |
| Arts, Entertainment & Recreation | 0 (0.0%) | 0 (0.0%) |
| Accommodation & Food Services | 4 (44.4%) | 5 (55.6%) |
| Public Administration | 0 (0.0%) | 10 (100.0%) |
| Total | 72 (46.2%) | 84 (53.8%) |
Education in New Point
School Enrollment in New Point
The most common levels of schooling among the 96 students in New Point are high school (41 | 42.7%), elementary school (28 | 29.2%), and college / undergraduate (11 | 11.5%).
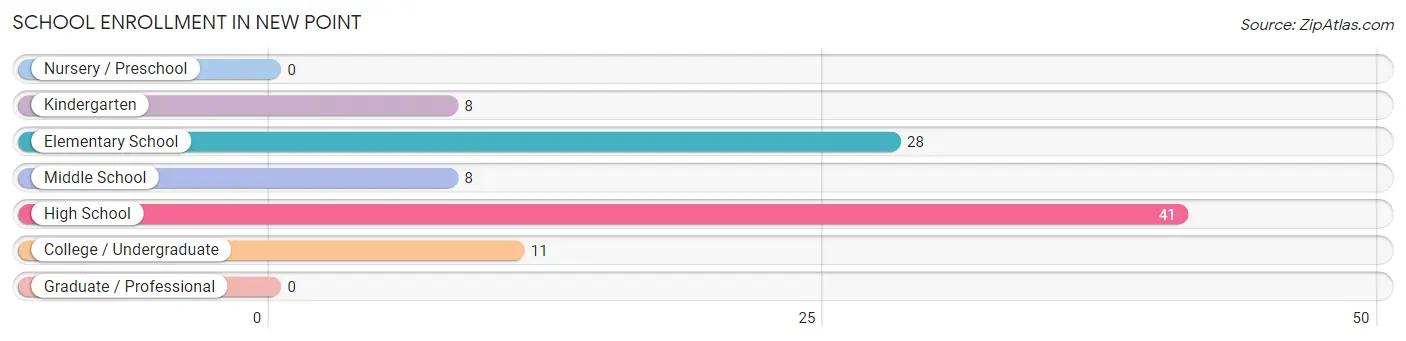
| School Level | # Students | % Students |
| Nursery / Preschool | 0 | 0.0% |
| Kindergarten | 8 | 8.3% |
| Elementary School | 28 | 29.2% |
| Middle School | 8 | 8.3% |
| High School | 41 | 42.7% |
| College / Undergraduate | 11 | 11.5% |
| Graduate / Professional | 0 | 0.0% |
| Total | 96 | 100.0% |
School Enrollment by Age by Funding Source in New Point
Out of a total of 96 students who are enrolled in schools in New Point, 3 (3.1%) attend a private institution, while the remaining 93 (96.9%) are enrolled in public schools. The age group of 5 to 9 year old has the highest likelihood of being enrolled in private schools, with 3 (10.7% in the age bracket) enrolled. Conversely, the age group of 10 to 14 year olds has the lowest likelihood of being enrolled in a private school, with 21 (100.0% in the age bracket) attending a public institution.
| Age Bracket | Public School | Private School |
| 3 to 4 Year Olds | 0 (0.0%) | 0 (0.0%) |
| 5 to 9 Year Old | 25 (89.3%) | 3 (10.7%) |
| 10 to 14 Year Olds | 21 (100.0%) | 0 (0.0%) |
| 15 to 17 Year Olds | 33 (100.0%) | 0 (0.0%) |
| 18 to 19 Year Olds | 7 (100.0%) | 0 (0.0%) |
| 20 to 24 Year Olds | 4 (100.0%) | 0 (0.0%) |
| 25 to 34 Year Olds | 1 (100.0%) | 0 (0.0%) |
| 35 Years and over | 2 (100.0%) | 0 (0.0%) |
| Total | 93 (96.9%) | 3 (3.1%) |
Educational Attainment by Field of Study in New Point
Education (10 | 37.0%), liberal arts & history (9 | 33.3%), science & technology (5 | 18.5%), arts & humanities (2 | 7.4%), and bio, nature & agricultural (1 | 3.7%) are the most common fields of study among 27 individuals in New Point who have obtained a bachelor's degree or higher.
| Field of Study | # Graduates | % Graduates |
| Computers & Mathematics | 0 | 0.0% |
| Bio, Nature & Agricultural | 1 | 3.7% |
| Physical & Health Sciences | 0 | 0.0% |
| Psychology | 0 | 0.0% |
| Social Sciences | 0 | 0.0% |
| Engineering | 0 | 0.0% |
| Multidisciplinary Studies | 0 | 0.0% |
| Science & Technology | 5 | 18.5% |
| Business | 0 | 0.0% |
| Education | 10 | 37.0% |
| Literature & Languages | 0 | 0.0% |
| Liberal Arts & History | 9 | 33.3% |
| Visual & Performing Arts | 0 | 0.0% |
| Communications | 0 | 0.0% |
| Arts & Humanities | 2 | 7.4% |
| Total | 27 | 100.0% |
Transportation & Commute in New Point
Vehicle Availability by Sex in New Point
The most prevalent vehicle ownership categories in New Point are males with 3 vehicles (26, accounting for 36.1%) and females with 3 vehicles (11, making up 32.5%).
| Vehicles Available | Male | Female |
| No Vehicle | 7 (9.7%) | 6 (7.5%) |
| 1 Vehicle | 2 (2.8%) | 27 (33.8%) |
| 2 Vehicles | 11 (15.3%) | 16 (20.0%) |
| 3 Vehicles | 26 (36.1%) | 11 (13.8%) |
| 4 Vehicles | 16 (22.2%) | 13 (16.3%) |
| 5 or more Vehicles | 10 (13.9%) | 7 (8.7%) |
| Total | 72 (100.0%) | 80 (100.0%) |
Commute Time in New Point
The most frequently occuring commute durations in New Point are 15 to 19 minutes (57 commuters, 38.0%), 10 to 14 minutes (33 commuters, 22.0%), and 20 to 24 minutes (24 commuters, 16.0%).
| Commute Time | # Commuters | % Commuters |
| Less than 5 Minutes | 11 | 7.3% |
| 5 to 9 Minutes | 6 | 4.0% |
| 10 to 14 Minutes | 33 | 22.0% |
| 15 to 19 Minutes | 57 | 38.0% |
| 20 to 24 Minutes | 24 | 16.0% |
| 25 to 29 Minutes | 0 | 0.0% |
| 30 to 34 Minutes | 8 | 5.3% |
| 35 to 39 Minutes | 0 | 0.0% |
| 40 to 44 Minutes | 0 | 0.0% |
| 45 to 59 Minutes | 5 | 3.3% |
| 60 to 89 Minutes | 4 | 2.7% |
| 90 or more Minutes | 2 | 1.3% |
Commute Time by Sex in New Point
The most common commute times in New Point are 10 to 14 minutes (22 commuters, 31.4%) for males and 15 to 19 minutes (39 commuters, 48.7%) for females.
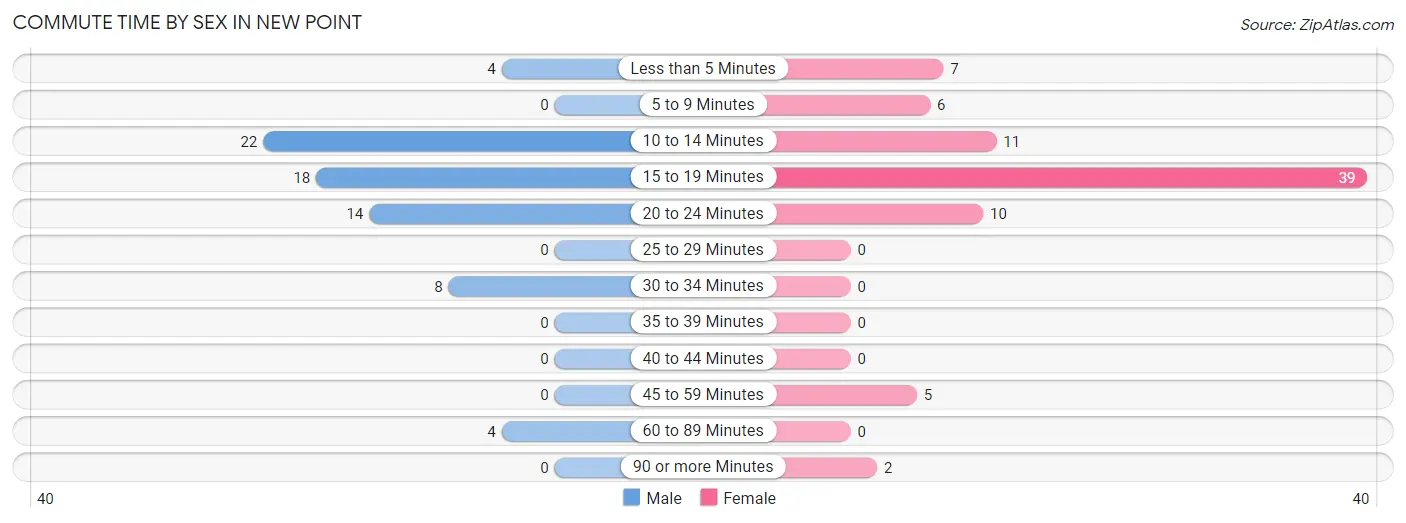
| Commute Time | Male | Female |
| Less than 5 Minutes | 4 (5.7%) | 7 (8.7%) |
| 5 to 9 Minutes | 0 (0.0%) | 6 (7.5%) |
| 10 to 14 Minutes | 22 (31.4%) | 11 (13.8%) |
| 15 to 19 Minutes | 18 (25.7%) | 39 (48.7%) |
| 20 to 24 Minutes | 14 (20.0%) | 10 (12.5%) |
| 25 to 29 Minutes | 0 (0.0%) | 0 (0.0%) |
| 30 to 34 Minutes | 8 (11.4%) | 0 (0.0%) |
| 35 to 39 Minutes | 0 (0.0%) | 0 (0.0%) |
| 40 to 44 Minutes | 0 (0.0%) | 0 (0.0%) |
| 45 to 59 Minutes | 0 (0.0%) | 5 (6.2%) |
| 60 to 89 Minutes | 4 (5.7%) | 0 (0.0%) |
| 90 or more Minutes | 0 (0.0%) | 2 (2.5%) |
Time of Departure to Work by Sex in New Point
The most frequent times of departure to work in New Point are 6:00 AM to 6:29 AM (11, 15.7%) for males and 6:30 AM to 6:59 AM (19, 23.7%) for females.
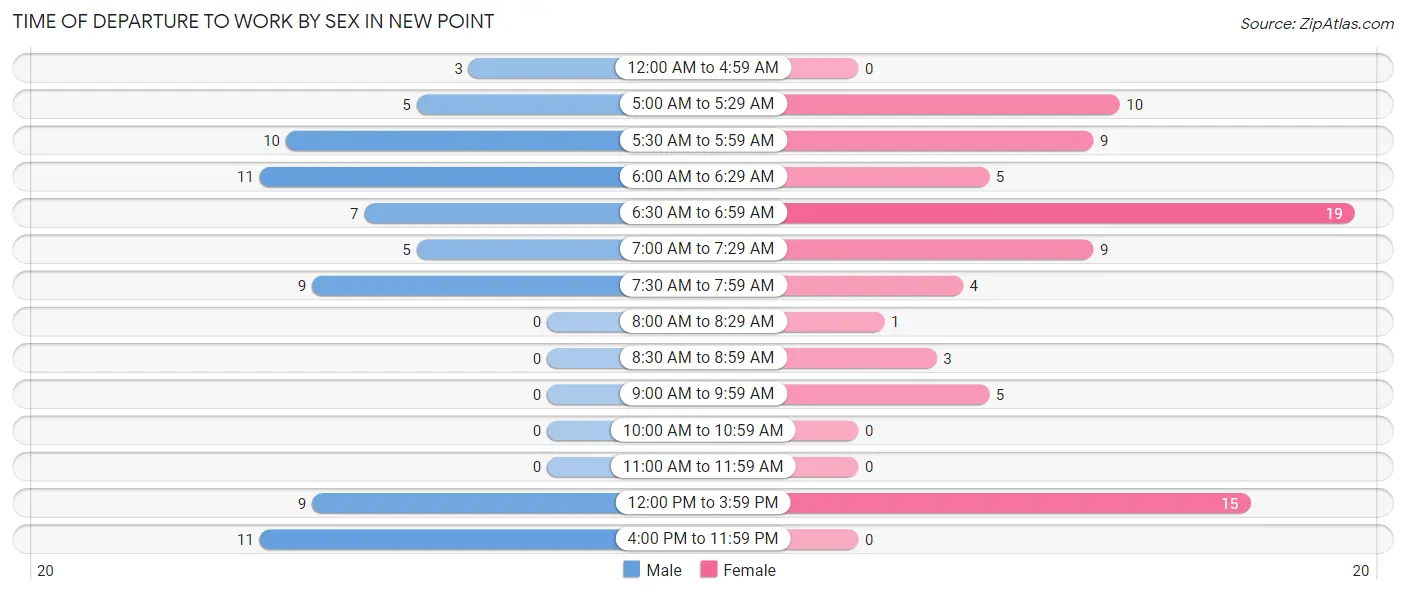
| Time of Departure | Male | Female |
| 12:00 AM to 4:59 AM | 3 (4.3%) | 0 (0.0%) |
| 5:00 AM to 5:29 AM | 5 (7.1%) | 10 (12.5%) |
| 5:30 AM to 5:59 AM | 10 (14.3%) | 9 (11.3%) |
| 6:00 AM to 6:29 AM | 11 (15.7%) | 5 (6.2%) |
| 6:30 AM to 6:59 AM | 7 (10.0%) | 19 (23.7%) |
| 7:00 AM to 7:29 AM | 5 (7.1%) | 9 (11.3%) |
| 7:30 AM to 7:59 AM | 9 (12.9%) | 4 (5.0%) |
| 8:00 AM to 8:29 AM | 0 (0.0%) | 1 (1.3%) |
| 8:30 AM to 8:59 AM | 0 (0.0%) | 3 (3.7%) |
| 9:00 AM to 9:59 AM | 0 (0.0%) | 5 (6.2%) |
| 10:00 AM to 10:59 AM | 0 (0.0%) | 0 (0.0%) |
| 11:00 AM to 11:59 AM | 0 (0.0%) | 0 (0.0%) |
| 12:00 PM to 3:59 PM | 9 (12.9%) | 15 (18.8%) |
| 4:00 PM to 11:59 PM | 11 (15.7%) | 0 (0.0%) |
| Total | 70 (100.0%) | 80 (100.0%) |
Housing Occupancy in New Point
Occupancy by Ownership in New Point
Of the total 113 dwellings in New Point, owner-occupied units account for 85 (75.2%), while renter-occupied units make up 28 (24.8%).
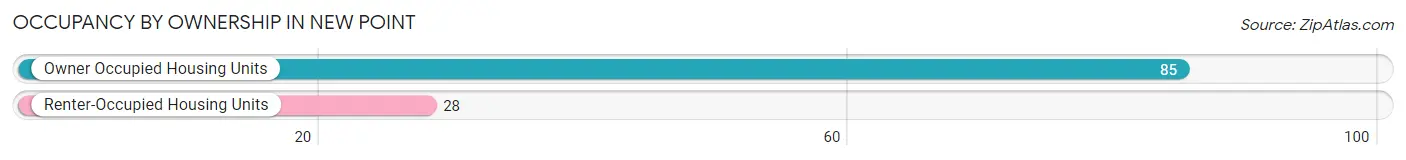
| Occupancy | # Housing Units | % Housing Units |
| Owner Occupied Housing Units | 85 | 75.2% |
| Renter-Occupied Housing Units | 28 | 24.8% |
| Total Occupied Housing Units | 113 | 100.0% |
Occupancy by Household Size in New Point
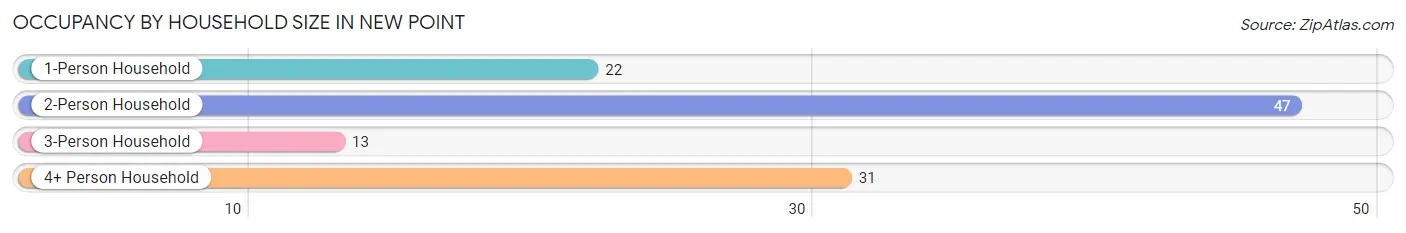
| Household Size | # Housing Units | % Housing Units |
| 1-Person Household | 22 | 19.5% |
| 2-Person Household | 47 | 41.6% |
| 3-Person Household | 13 | 11.5% |
| 4+ Person Household | 31 | 27.4% |
| Total Housing Units | 113 | 100.0% |
Occupancy by Ownership by Household Size in New Point
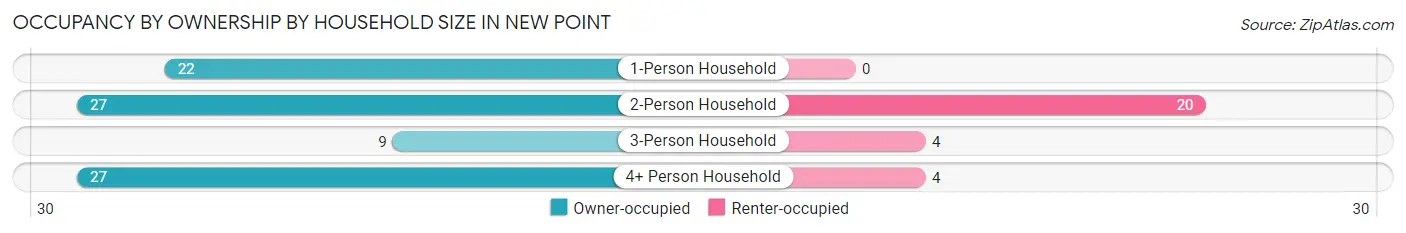
| Household Size | Owner-occupied | Renter-occupied |
| 1-Person Household | 22 (100.0%) | 0 (0.0%) |
| 2-Person Household | 27 (57.5%) | 20 (42.5%) |
| 3-Person Household | 9 (69.2%) | 4 (30.8%) |
| 4+ Person Household | 27 (87.1%) | 4 (12.9%) |
| Total Housing Units | 85 (75.2%) | 28 (24.8%) |
Occupancy by Educational Attainment in New Point
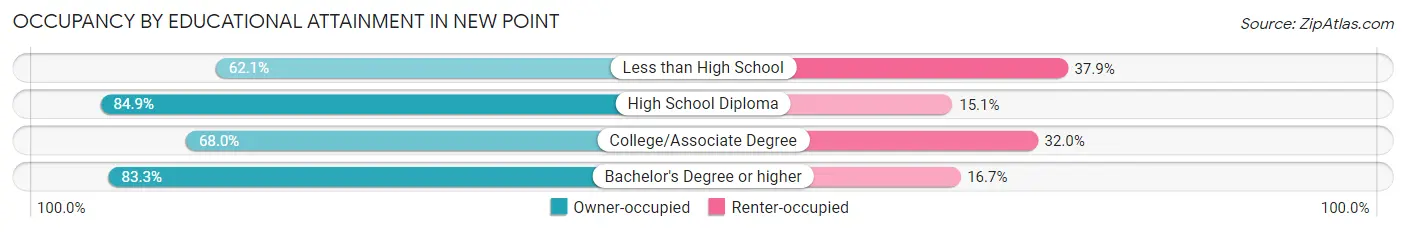
| Household Size | Owner-occupied | Renter-occupied |
| Less than High School | 18 (62.1%) | 11 (37.9%) |
| High School Diploma | 45 (84.9%) | 8 (15.1%) |
| College/Associate Degree | 17 (68.0%) | 8 (32.0%) |
| Bachelor's Degree or higher | 5 (83.3%) | 1 (16.7%) |
Occupancy by Age of Householder in New Point
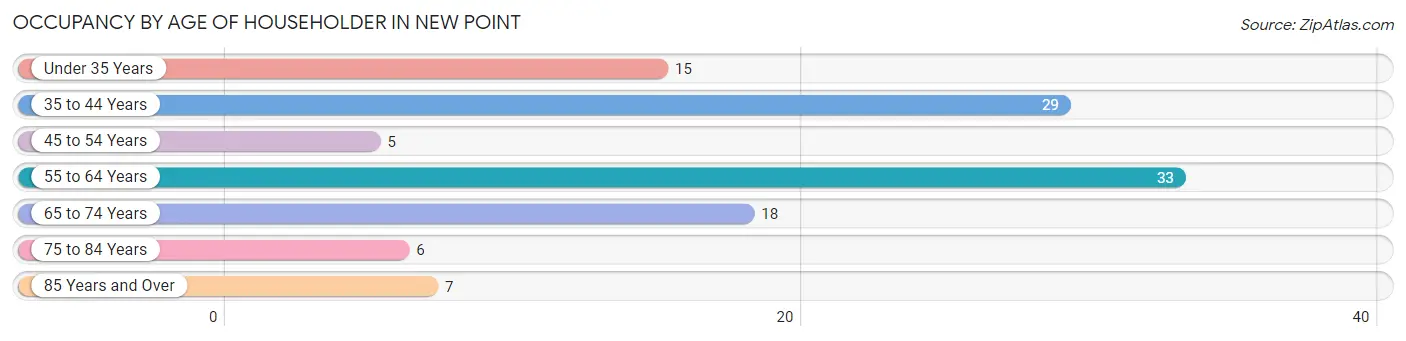
| Age Bracket | # Households | % Households |
| Under 35 Years | 15 | 13.3% |
| 35 to 44 Years | 29 | 25.7% |
| 45 to 54 Years | 5 | 4.4% |
| 55 to 64 Years | 33 | 29.2% |
| 65 to 74 Years | 18 | 15.9% |
| 75 to 84 Years | 6 | 5.3% |
| 85 Years and Over | 7 | 6.2% |
| Total | 113 | 100.0% |
Housing Finances in New Point
Median Income by Occupancy in New Point
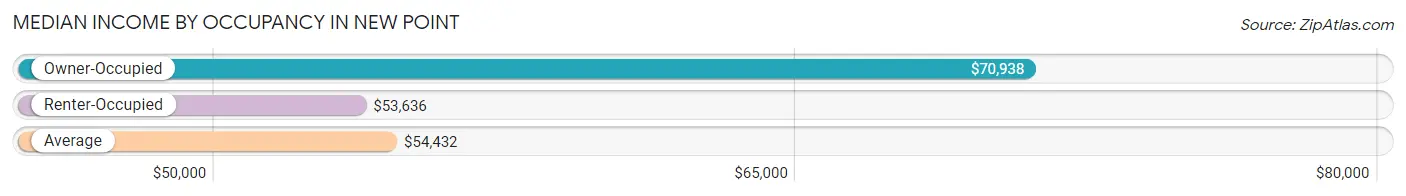
| Occupancy Type | # Households | Median Income |
| Owner-Occupied | 85 (75.2%) | $70,938 |
| Renter-Occupied | 28 (24.8%) | $53,636 |
| Average | 113 (100.0%) | $54,432 |
Occupancy by Householder Income Bracket in New Point
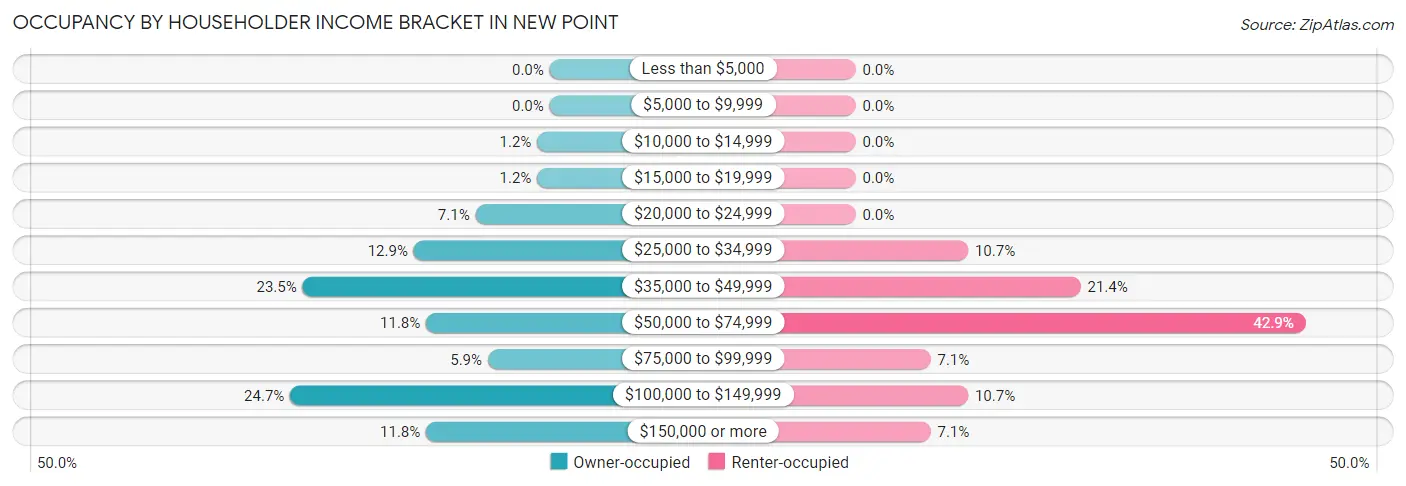
| Income Bracket | Owner-occupied | Renter-occupied |
| Less than $5,000 | 0 (0.0%) | 0 (0.0%) |
| $5,000 to $9,999 | 0 (0.0%) | 0 (0.0%) |
| $10,000 to $14,999 | 1 (1.2%) | 0 (0.0%) |
| $15,000 to $19,999 | 1 (1.2%) | 0 (0.0%) |
| $20,000 to $24,999 | 6 (7.1%) | 0 (0.0%) |
| $25,000 to $34,999 | 11 (12.9%) | 3 (10.7%) |
| $35,000 to $49,999 | 20 (23.5%) | 6 (21.4%) |
| $50,000 to $74,999 | 10 (11.8%) | 12 (42.9%) |
| $75,000 to $99,999 | 5 (5.9%) | 2 (7.1%) |
| $100,000 to $149,999 | 21 (24.7%) | 3 (10.7%) |
| $150,000 or more | 10 (11.8%) | 2 (7.1%) |
| Total | 85 (100.0%) | 28 (100.0%) |
Monthly Housing Cost Tiers in New Point
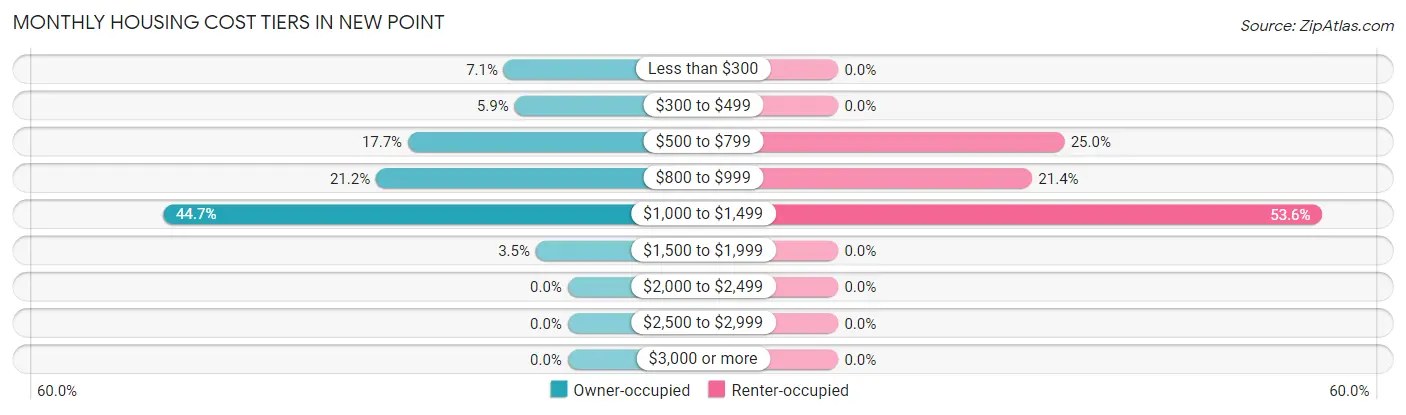
| Monthly Cost | Owner-occupied | Renter-occupied |
| Less than $300 | 6 (7.1%) | 0 (0.0%) |
| $300 to $499 | 5 (5.9%) | 0 (0.0%) |
| $500 to $799 | 15 (17.6%) | 7 (25.0%) |
| $800 to $999 | 18 (21.2%) | 6 (21.4%) |
| $1,000 to $1,499 | 38 (44.7%) | 15 (53.6%) |
| $1,500 to $1,999 | 3 (3.5%) | 0 (0.0%) |
| $2,000 to $2,499 | 0 (0.0%) | 0 (0.0%) |
| $2,500 to $2,999 | 0 (0.0%) | 0 (0.0%) |
| $3,000 or more | 0 (0.0%) | 0 (0.0%) |
| Total | 85 (100.0%) | 28 (100.0%) |
Physical Housing Characteristics in New Point
Housing Structures in New Point
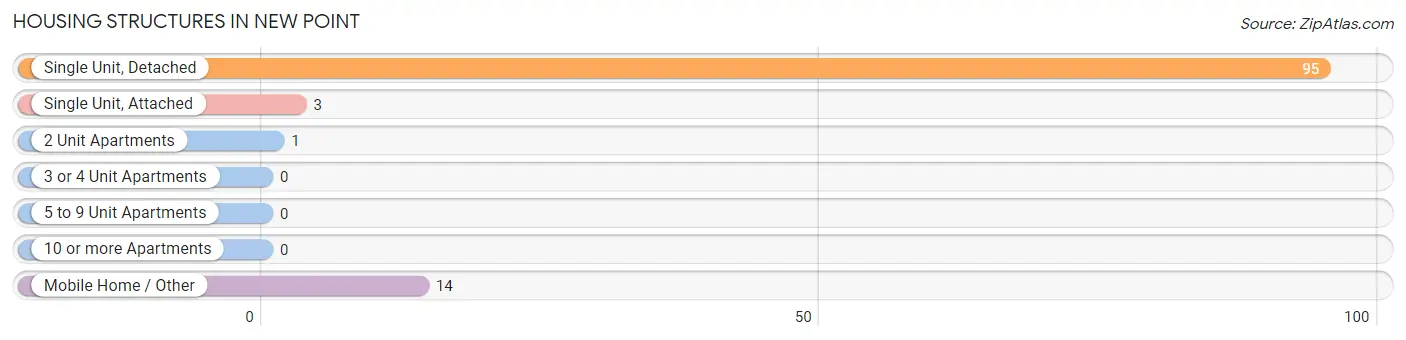
| Structure Type | # Housing Units | % Housing Units |
| Single Unit, Detached | 95 | 84.1% |
| Single Unit, Attached | 3 | 2.6% |
| 2 Unit Apartments | 1 | 0.9% |
| 3 or 4 Unit Apartments | 0 | 0.0% |
| 5 to 9 Unit Apartments | 0 | 0.0% |
| 10 or more Apartments | 0 | 0.0% |
| Mobile Home / Other | 14 | 12.4% |
| Total | 113 | 100.0% |
Housing Structures by Occupancy in New Point
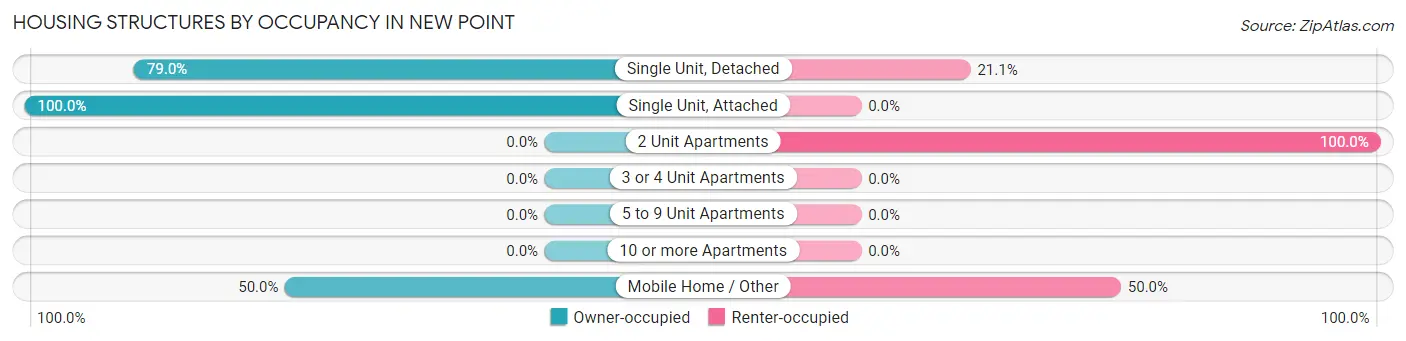
| Structure Type | Owner-occupied | Renter-occupied |
| Single Unit, Detached | 75 (78.9%) | 20 (21.0%) |
| Single Unit, Attached | 3 (100.0%) | 0 (0.0%) |
| 2 Unit Apartments | 0 (0.0%) | 1 (100.0%) |
| 3 or 4 Unit Apartments | 0 (0.0%) | 0 (0.0%) |
| 5 to 9 Unit Apartments | 0 (0.0%) | 0 (0.0%) |
| 10 or more Apartments | 0 (0.0%) | 0 (0.0%) |
| Mobile Home / Other | 7 (50.0%) | 7 (50.0%) |
| Total | 85 (75.2%) | 28 (24.8%) |
Housing Structures by Number of Rooms in New Point
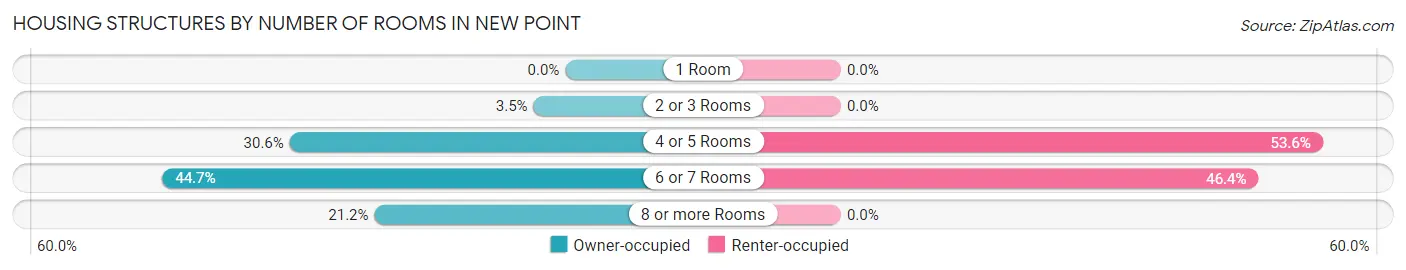
| Number of Rooms | Owner-occupied | Renter-occupied |
| 1 Room | 0 (0.0%) | 0 (0.0%) |
| 2 or 3 Rooms | 3 (3.5%) | 0 (0.0%) |
| 4 or 5 Rooms | 26 (30.6%) | 15 (53.6%) |
| 6 or 7 Rooms | 38 (44.7%) | 13 (46.4%) |
| 8 or more Rooms | 18 (21.2%) | 0 (0.0%) |
| Total | 85 (100.0%) | 28 (100.0%) |
Housing Structure by Heating Type in New Point
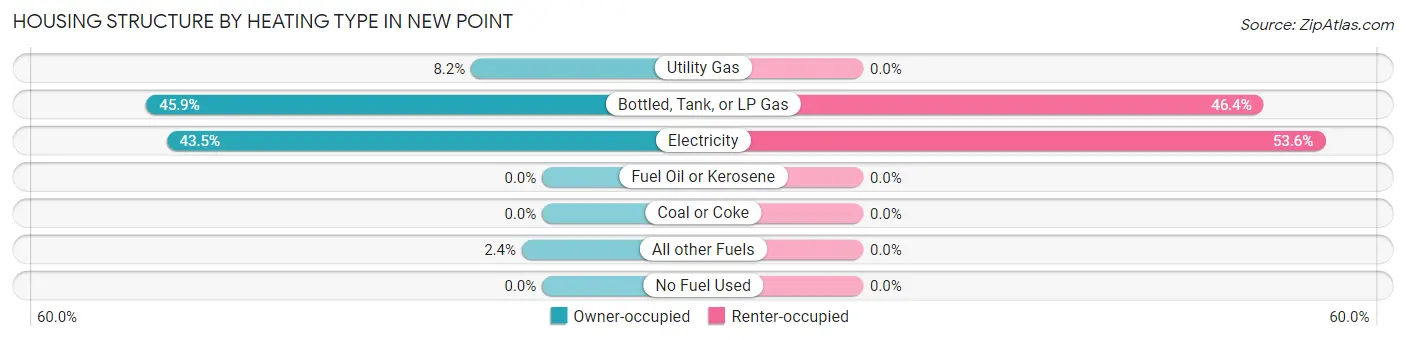
| Heating Type | Owner-occupied | Renter-occupied |
| Utility Gas | 7 (8.2%) | 0 (0.0%) |
| Bottled, Tank, or LP Gas | 39 (45.9%) | 13 (46.4%) |
| Electricity | 37 (43.5%) | 15 (53.6%) |
| Fuel Oil or Kerosene | 0 (0.0%) | 0 (0.0%) |
| Coal or Coke | 0 (0.0%) | 0 (0.0%) |
| All other Fuels | 2 (2.4%) | 0 (0.0%) |
| No Fuel Used | 0 (0.0%) | 0 (0.0%) |
| Total | 85 (100.0%) | 28 (100.0%) |
Household Vehicle Usage in New Point
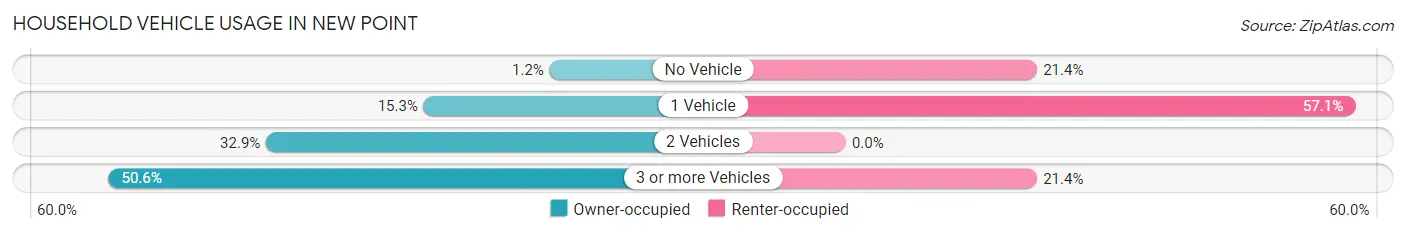
| Vehicles per Household | Owner-occupied | Renter-occupied |
| No Vehicle | 1 (1.2%) | 6 (21.4%) |
| 1 Vehicle | 13 (15.3%) | 16 (57.1%) |
| 2 Vehicles | 28 (32.9%) | 0 (0.0%) |
| 3 or more Vehicles | 43 (50.6%) | 6 (21.4%) |
| Total | 85 (100.0%) | 28 (100.0%) |
Real Estate & Mortgages in New Point
Real Estate and Mortgage Overview in New Point
| Characteristic | Without Mortgage | With Mortgage |
| Housing Units | 20 | 65 |
| Median Property Value | $110,700 | $122,300 |
| Median Household Income | $38,333 | $10 |
| Monthly Housing Costs | $400 | $0 |
| Real Estate Taxes | $520 | $0 |
Property Value by Mortgage Status in New Point
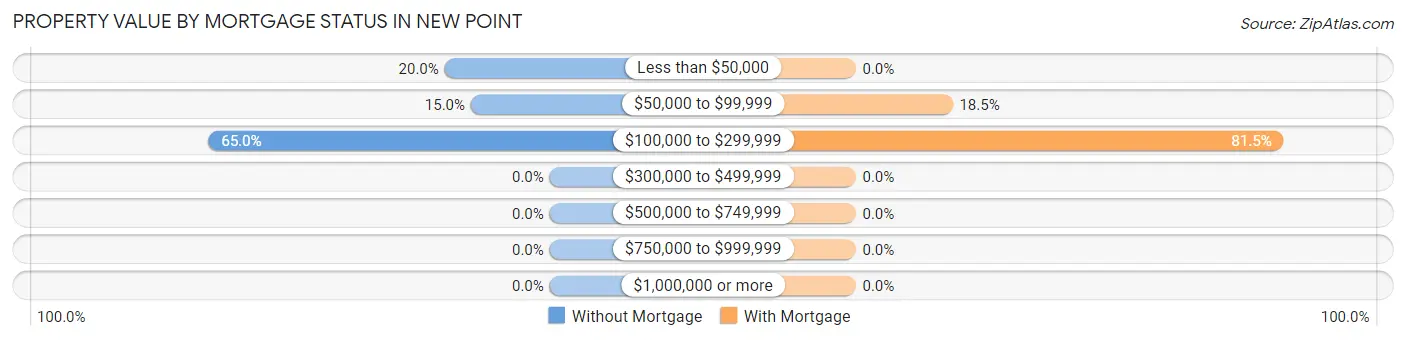
| Property Value | Without Mortgage | With Mortgage |
| Less than $50,000 | 4 (20.0%) | 0 (0.0%) |
| $50,000 to $99,999 | 3 (15.0%) | 12 (18.5%) |
| $100,000 to $299,999 | 13 (65.0%) | 53 (81.5%) |
| $300,000 to $499,999 | 0 (0.0%) | 0 (0.0%) |
| $500,000 to $749,999 | 0 (0.0%) | 0 (0.0%) |
| $750,000 to $999,999 | 0 (0.0%) | 0 (0.0%) |
| $1,000,000 or more | 0 (0.0%) | 0 (0.0%) |
| Total | 20 (100.0%) | 65 (100.0%) |
Household Income by Mortgage Status in New Point
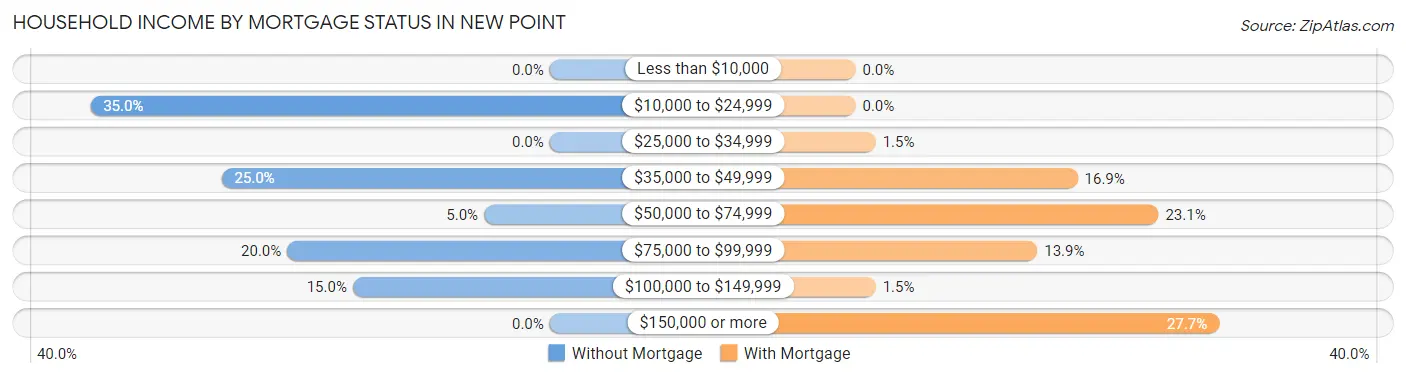
| Household Income | Without Mortgage | With Mortgage |
| Less than $10,000 | 0 (0.0%) | 0 (0.0%) |
| $10,000 to $24,999 | 7 (35.0%) | 0 (0.0%) |
| $25,000 to $34,999 | 0 (0.0%) | 1 (1.5%) |
| $35,000 to $49,999 | 5 (25.0%) | 11 (16.9%) |
| $50,000 to $74,999 | 1 (5.0%) | 15 (23.1%) |
| $75,000 to $99,999 | 4 (20.0%) | 9 (13.9%) |
| $100,000 to $149,999 | 3 (15.0%) | 1 (1.5%) |
| $150,000 or more | 0 (0.0%) | 18 (27.7%) |
| Total | 20 (100.0%) | 65 (100.0%) |
Property Value to Household Income Ratio in New Point
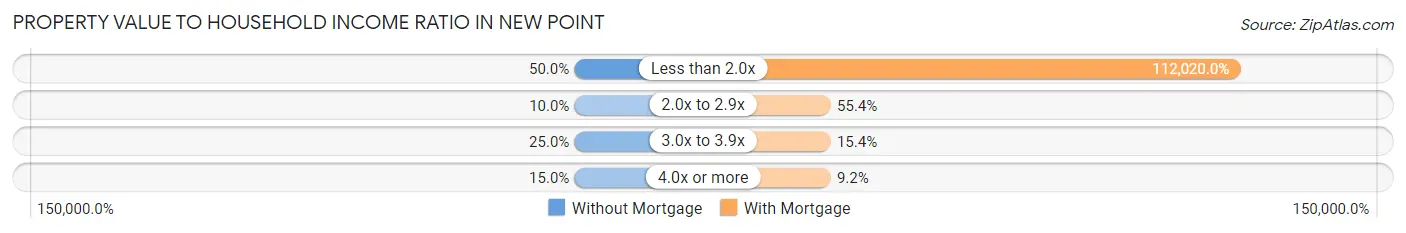
| Value-to-Income Ratio | Without Mortgage | With Mortgage |
| Less than 2.0x | 10 (50.0%) | 72,813 (112,020.0%) |
| 2.0x to 2.9x | 2 (10.0%) | 36 (55.4%) |
| 3.0x to 3.9x | 5 (25.0%) | 10 (15.4%) |
| 4.0x or more | 3 (15.0%) | 6 (9.2%) |
| Total | 20 (100.0%) | 65 (100.0%) |
Real Estate Taxes by Mortgage Status in New Point
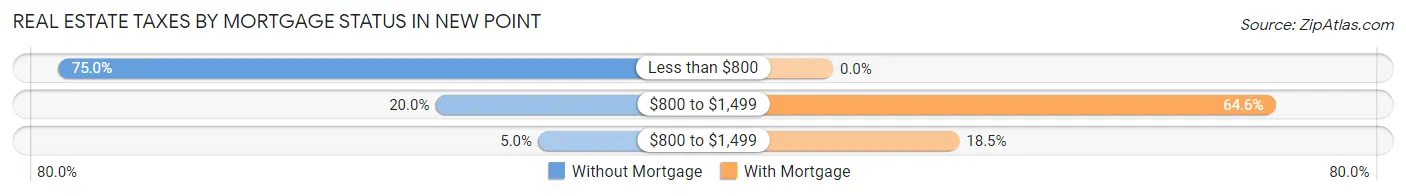
| Property Taxes | Without Mortgage | With Mortgage |
| Less than $800 | 15 (75.0%) | 0 (0.0%) |
| $800 to $1,499 | 4 (20.0%) | 42 (64.6%) |
| $800 to $1,499 | 1 (5.0%) | 12 (18.5%) |
| Total | 20 (100.0%) | 65 (100.0%) |
Health & Disability in New Point
Health Insurance Coverage by Age in New Point
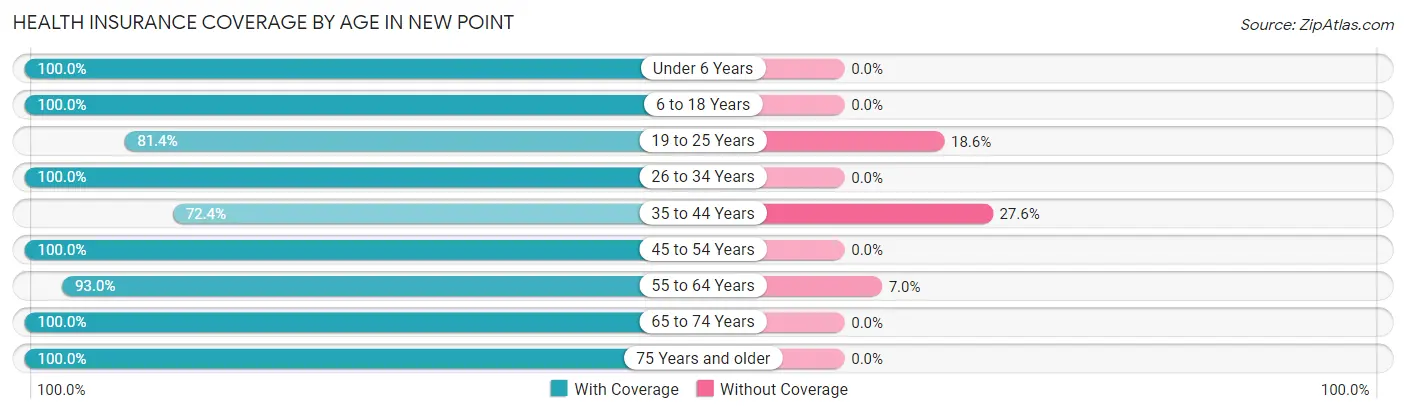
| Age Bracket | With Coverage | Without Coverage |
| Under 6 Years | 11 (100.0%) | 0 (0.0%) |
| 6 to 18 Years | 76 (100.0%) | 0 (0.0%) |
| 19 to 25 Years | 35 (81.4%) | 8 (18.6%) |
| 26 to 34 Years | 16 (100.0%) | 0 (0.0%) |
| 35 to 44 Years | 55 (72.4%) | 21 (27.6%) |
| 45 to 54 Years | 22 (100.0%) | 0 (0.0%) |
| 55 to 64 Years | 40 (93.0%) | 3 (7.0%) |
| 65 to 74 Years | 21 (100.0%) | 0 (0.0%) |
| 75 Years and older | 17 (100.0%) | 0 (0.0%) |
| Total | 293 (90.1%) | 32 (9.9%) |
Health Insurance Coverage by Citizenship Status in New Point
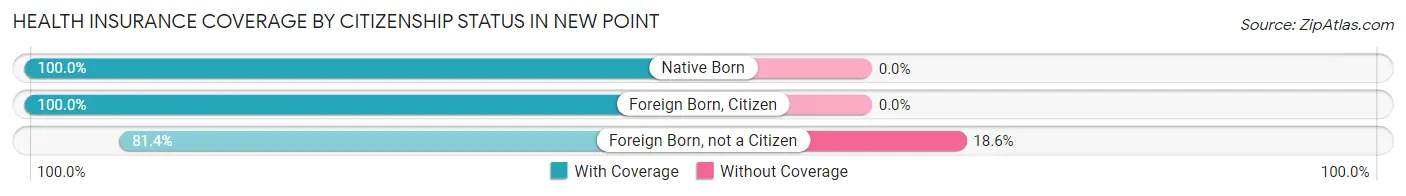
| Citizenship Status | With Coverage | Without Coverage |
| Native Born | 11 (100.0%) | 0 (0.0%) |
| Foreign Born, Citizen | 76 (100.0%) | 0 (0.0%) |
| Foreign Born, not a Citizen | 35 (81.4%) | 8 (18.6%) |
Health Insurance Coverage by Household Income in New Point
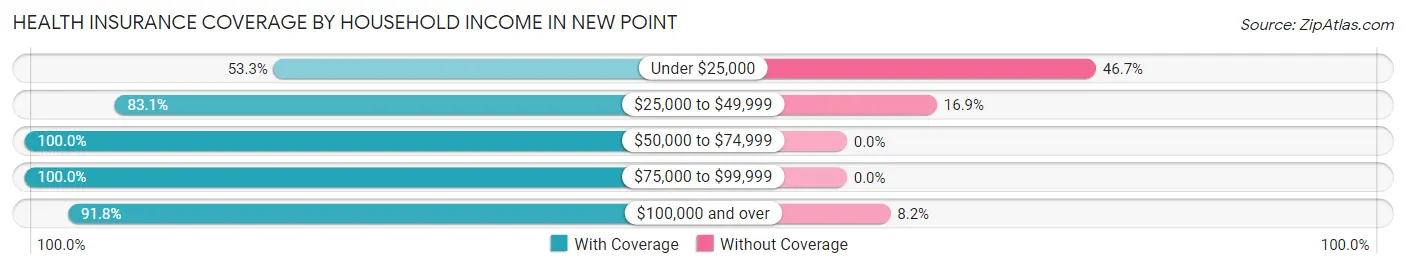
| Household Income | With Coverage | Without Coverage |
| Under $25,000 | 8 (53.3%) | 7 (46.7%) |
| $25,000 to $49,999 | 64 (83.1%) | 13 (16.9%) |
| $50,000 to $74,999 | 66 (100.0%) | 0 (0.0%) |
| $75,000 to $99,999 | 20 (100.0%) | 0 (0.0%) |
| $100,000 and over | 135 (91.8%) | 12 (8.2%) |
Public vs Private Health Insurance Coverage by Age in New Point
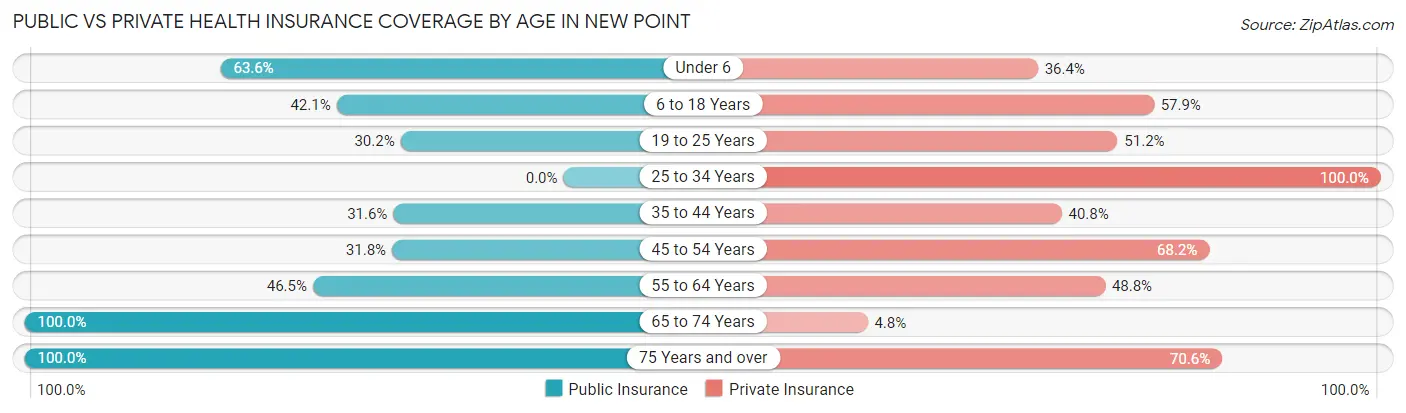
| Age Bracket | Public Insurance | Private Insurance |
| Under 6 | 7 (63.6%) | 4 (36.4%) |
| 6 to 18 Years | 32 (42.1%) | 44 (57.9%) |
| 19 to 25 Years | 13 (30.2%) | 22 (51.2%) |
| 25 to 34 Years | 0 (0.0%) | 16 (100.0%) |
| 35 to 44 Years | 24 (31.6%) | 31 (40.8%) |
| 45 to 54 Years | 7 (31.8%) | 15 (68.2%) |
| 55 to 64 Years | 20 (46.5%) | 21 (48.8%) |
| 65 to 74 Years | 21 (100.0%) | 1 (4.8%) |
| 75 Years and over | 17 (100.0%) | 12 (70.6%) |
| Total | 141 (43.4%) | 166 (51.1%) |
Disability Status by Sex by Age in New Point
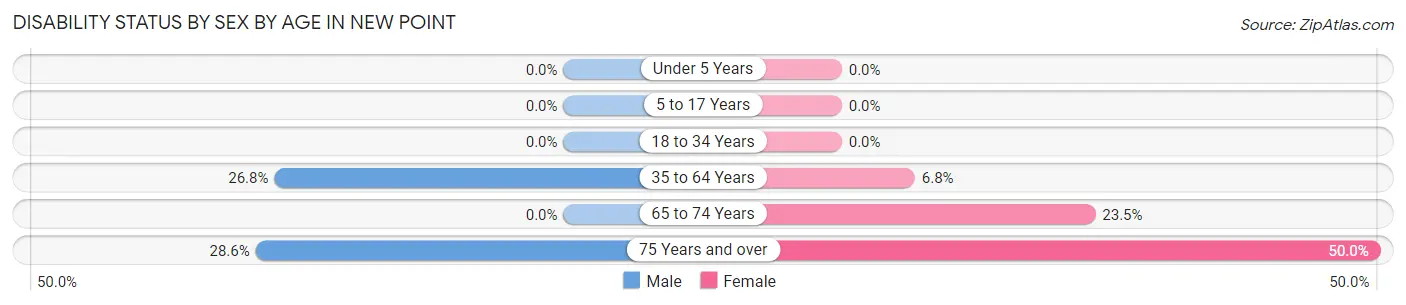
| Age Bracket | Male | Female |
| Under 5 Years | 0 (0.0%) | 0 (0.0%) |
| 5 to 17 Years | 0 (0.0%) | 0 (0.0%) |
| 18 to 34 Years | 0 (0.0%) | 0 (0.0%) |
| 35 to 64 Years | 22 (26.8%) | 4 (6.8%) |
| 65 to 74 Years | 0 (0.0%) | 4 (23.5%) |
| 75 Years and over | 2 (28.6%) | 5 (50.0%) |
Disability Class by Sex by Age in New Point
Disability Class: Hearing Difficulty
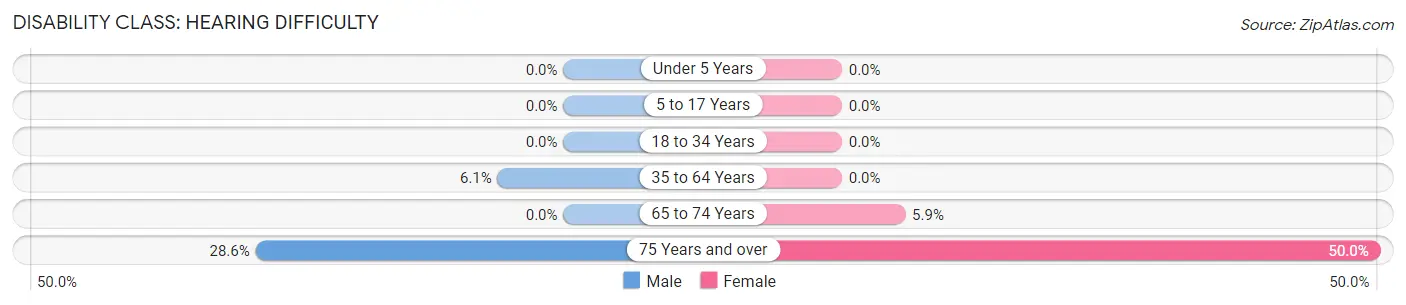
| Age Bracket | Male | Female |
| Under 5 Years | 0 (0.0%) | 0 (0.0%) |
| 5 to 17 Years | 0 (0.0%) | 0 (0.0%) |
| 18 to 34 Years | 0 (0.0%) | 0 (0.0%) |
| 35 to 64 Years | 5 (6.1%) | 0 (0.0%) |
| 65 to 74 Years | 0 (0.0%) | 1 (5.9%) |
| 75 Years and over | 2 (28.6%) | 5 (50.0%) |
Disability Class: Vision Difficulty
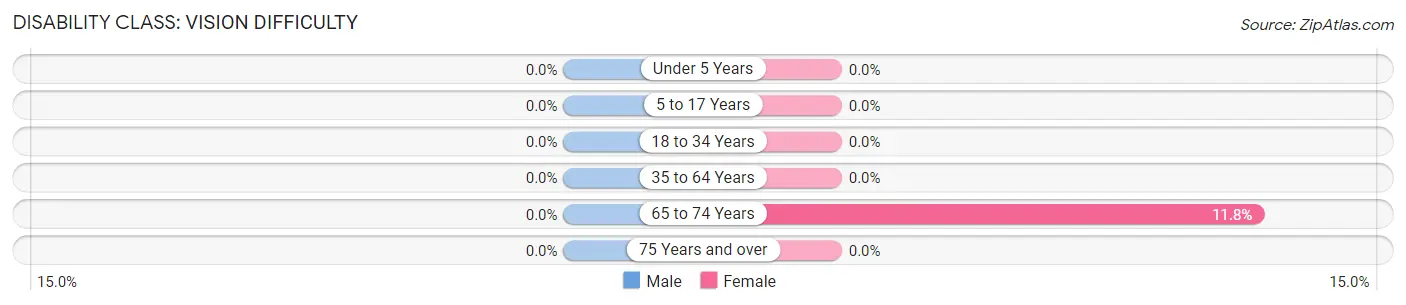
| Age Bracket | Male | Female |
| Under 5 Years | 0 (0.0%) | 0 (0.0%) |
| 5 to 17 Years | 0 (0.0%) | 0 (0.0%) |
| 18 to 34 Years | 0 (0.0%) | 0 (0.0%) |
| 35 to 64 Years | 0 (0.0%) | 0 (0.0%) |
| 65 to 74 Years | 0 (0.0%) | 2 (11.8%) |
| 75 Years and over | 0 (0.0%) | 0 (0.0%) |
Disability Class: Cognitive Difficulty
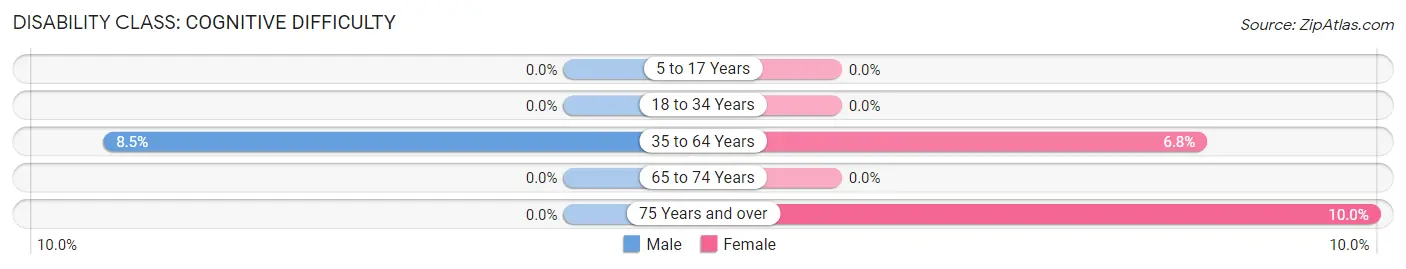
| Age Bracket | Male | Female |
| 5 to 17 Years | 0 (0.0%) | 0 (0.0%) |
| 18 to 34 Years | 0 (0.0%) | 0 (0.0%) |
| 35 to 64 Years | 7 (8.5%) | 4 (6.8%) |
| 65 to 74 Years | 0 (0.0%) | 0 (0.0%) |
| 75 Years and over | 0 (0.0%) | 1 (10.0%) |
Disability Class: Ambulatory Difficulty
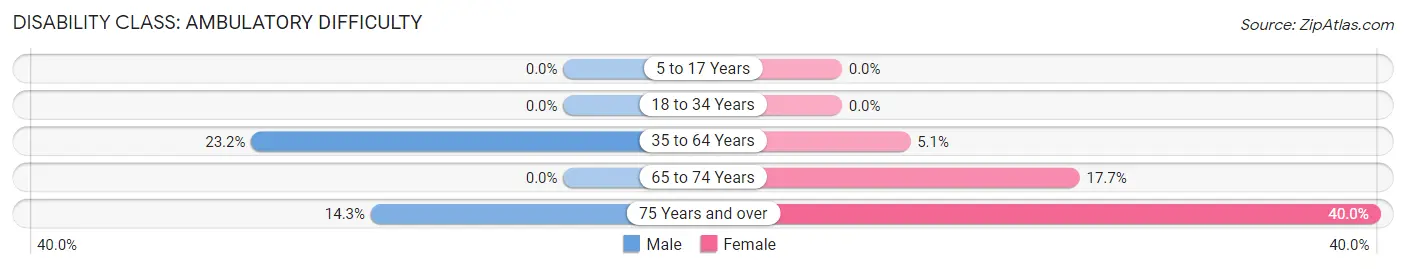
| Age Bracket | Male | Female |
| 5 to 17 Years | 0 (0.0%) | 0 (0.0%) |
| 18 to 34 Years | 0 (0.0%) | 0 (0.0%) |
| 35 to 64 Years | 19 (23.2%) | 3 (5.1%) |
| 65 to 74 Years | 0 (0.0%) | 3 (17.6%) |
| 75 Years and over | 1 (14.3%) | 4 (40.0%) |
Disability Class: Self-Care Difficulty
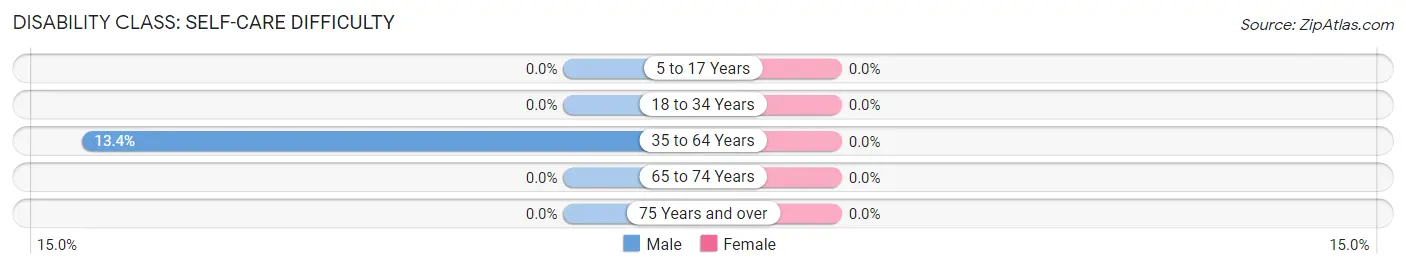
| Age Bracket | Male | Female |
| 5 to 17 Years | 0 (0.0%) | 0 (0.0%) |
| 18 to 34 Years | 0 (0.0%) | 0 (0.0%) |
| 35 to 64 Years | 11 (13.4%) | 0 (0.0%) |
| 65 to 74 Years | 0 (0.0%) | 0 (0.0%) |
| 75 Years and over | 0 (0.0%) | 0 (0.0%) |
Technology Access in New Point
Computing Device Access in New Point
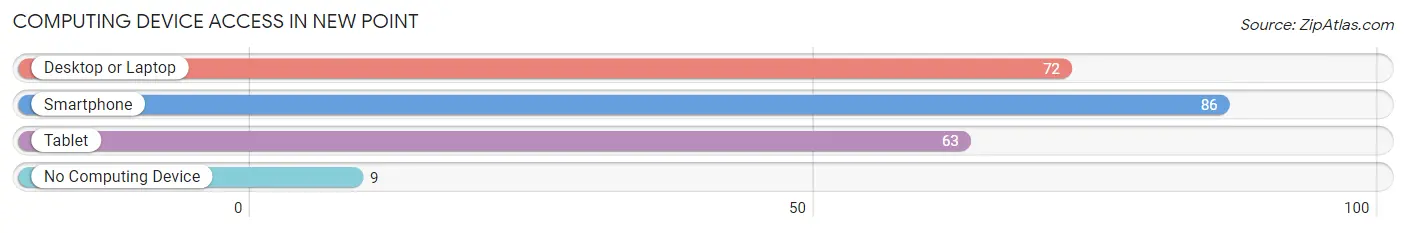
| Device Type | # Households | % Households |
| Desktop or Laptop | 72 | 63.7% |
| Smartphone | 86 | 76.1% |
| Tablet | 63 | 55.7% |
| No Computing Device | 9 | 8.0% |
| Total | 113 | 100.0% |
Internet Access in New Point
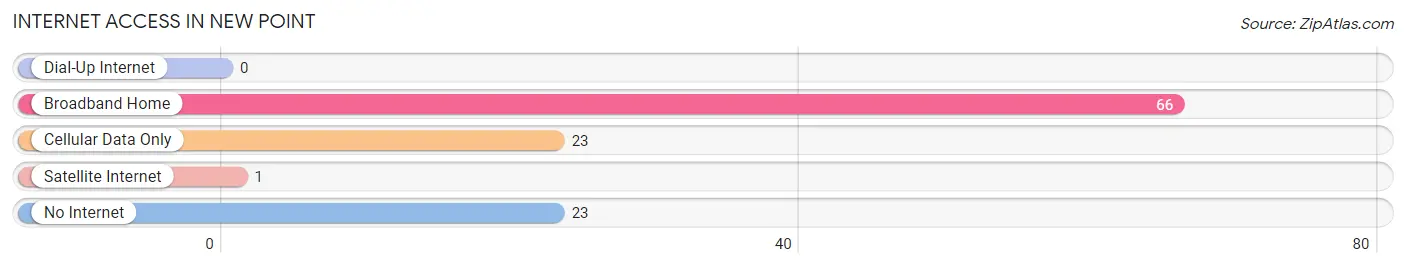
| Internet Type | # Households | % Households |
| Dial-Up Internet | 0 | 0.0% |
| Broadband Home | 66 | 58.4% |
| Cellular Data Only | 23 | 20.3% |
| Satellite Internet | 1 | 0.9% |
| No Internet | 23 | 20.3% |
| Total | 113 | 100.0% |
New Point Summary
Point, Indiana is a small town located in the southwestern corner of the state, in Posey County. It is situated on the banks of the Wabash River, and is part of the Evansville metropolitan area. The town has a population of just over 1,000 people, and is known for its rural charm and small-town atmosphere.
History
Point was founded in 1817 by a group of settlers from Kentucky. The town was originally known as “Point Pleasant”, and was named after the nearby Wabash River. The town was incorporated in 1837, and the name was changed to Point.
The town was an important stop on the Wabash and Erie Canal, which was built in the early 1800s. The canal was used to transport goods and people between the Ohio River and Lake Erie. The canal was a major economic force in the area, and helped to spur the growth of the town.
The town was also an important stop on the Underground Railroad, which was used to help slaves escape to freedom in the northern states. The town was home to several prominent abolitionists, including William Lloyd Garrison and Harriet Tubman.
Geography
Point is located in the southwestern corner of Indiana, in Posey County. It is situated on the banks of the Wabash River, and is part of the Evansville metropolitan area. The town is located about 25 miles from Evansville, and about 50 miles from Louisville, Kentucky.
The town is located in a rural area, and is surrounded by farmland and woodlands. The town is located in a hilly region, and is known for its scenic views. The town is also located near several state parks, including Harmonie State Park and Lincoln State Park.
Economy
The economy of Point is largely based on agriculture and tourism. The town is home to several farms, which produce a variety of crops, including corn, soybeans, and wheat. The town is also home to several wineries, which produce a variety of wines.
The town is also home to several small businesses, including restaurants, shops, and other services. The town is also home to several manufacturing companies, which produce a variety of products, including furniture, clothing, and automotive parts.
Demographics
As of the 2010 census, the population of Point was 1,072. The town is predominantly white, with about 95% of the population being white. The town is also home to a small Hispanic population, with about 4% of the population being Hispanic. The town is also home to a small African American population, with about 1% of the population being African American.
The median household income in Point is $41,250, and the median home value is $90,000. The town has a poverty rate of about 15%, which is slightly higher than the national average. The town also has a high rate of unemployment, with about 10% of the population being unemployed.
Conclusion
Point, Indiana is a small town located in the southwestern corner of the state, in Posey County. It is situated on the banks of the Wabash River, and is part of the Evansville metropolitan area. The town has a population of just over 1,000 people, and is known for its rural charm and small-town atmosphere. The town is largely based on agriculture and tourism, and is home to several small businesses, farms, and wineries. The town is predominantly white, with a small Hispanic and African American population. The median household income in Point is $41,250, and the median home value is $90,000. The town has a poverty rate of about 15%, and a high rate of unemployment.
Common Questions
What is Per Capita Income in New Point?
Per Capita income in New Point is $27,195.
What is the Median Family Income in New Point?
Median Family Income in New Point is $73,750.
What is the Median Household income in New Point?
Median Household Income in New Point is $54,432.
What is Income or Wage Gap in New Point?
Income or Wage Gap in New Point is 57.6%.
Women in New Point earn 42.4 cents for every dollar earned by a man.
What is Inequality or Gini Index in New Point?
Inequality or Gini Index in New Point is 0.37.
What is the Total Population of New Point?
Total Population of New Point is 325.
What is the Total Male Population of New Point?
Total Male Population of New Point is 159.
What is the Total Female Population of New Point?
Total Female Population of New Point is 166.
What is the Ratio of Males per 100 Females in New Point?
There are 95.78 Males per 100 Females in New Point.
What is the Ratio of Females per 100 Males in New Point?
There are 104.40 Females per 100 Males in New Point.
What is the Median Population Age in New Point?
Median Population Age in New Point is 37.8 Years.
What is the Average Family Size in New Point
Average Family Size in New Point is 3.2 People.
What is the Average Household Size in New Point
Average Household Size in New Point is 2.9 People.
How Large is the Labor Force in New Point?
There are 162 People in the Labor Forcein in New Point.
What is the Percentage of People in the Labor Force in New Point?
63.8% of People are in the Labor Force in New Point.
What is the Unemployment Rate in New Point?
Unemployment Rate in New Point is 3.7%.