New Harmony, IN Map & Demographics
New Harmony Map
New Harmony Overview
$28,819
PER CAPITA INCOME
$59,615
AVG FAMILY INCOME
$48,611
AVG HOUSEHOLD INCOME
0.46
INEQUALITY / GINI INDEX
825
TOTAL POPULATION
362
MALE POPULATION
463
FEMALE POPULATION
78.19
MALES / 100 FEMALES
127.90
FEMALES / 100 MALES
48.6
MEDIAN AGE
3.1
AVG FAMILY SIZE
2.2
AVG HOUSEHOLD SIZE
422
LABOR FORCE [ PEOPLE ]
54.1%
PERCENT IN LABOR FORCE
4.3%
UNEMPLOYMENT RATE
New Harmony Zip Codes
New Harmony Area Codes
Income in New Harmony
Income Overview in New Harmony
Per Capita Income in New Harmony is $28,819, while median incomes of families and households are $59,615 and $48,611 respectively.
| Characteristic | Number | Measure |
| Per Capita Income | 825 | $28,819 |
| Median Family Income | 170 | $59,615 |
| Mean Family Income | 170 | $89,878 |
| Median Household Income | 334 | $48,611 |
| Mean Household Income | 334 | $67,902 |
| Income Deficit | 170 | $0 |
| Wage / Income Gap (%) | 825 | 0.00% |
| Wage / Income Gap ($) | 825 | 100.00¢ per $1 |
| Gini / Inequality Index | 825 | 0.46 |
Earnings by Sex in New Harmony
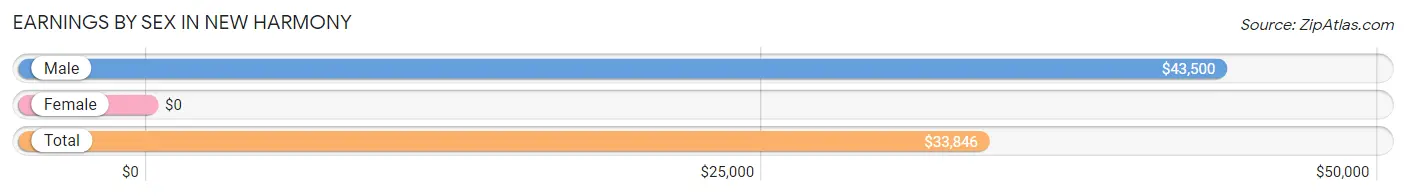
| Sex | Number | Average Earnings |
| Male | 188 (45.2%) | $43,500 |
| Female | 228 (54.8%) | $0 |
| Total | 416 (100.0%) | $33,846 |
Earnings by Sex by Income Bracket in New Harmony
The most common earnings brackets in New Harmony are $50,000 to $54,999 for men (45 | 23.9%) and $5,000 to $7,499 for women (47 | 20.6%).
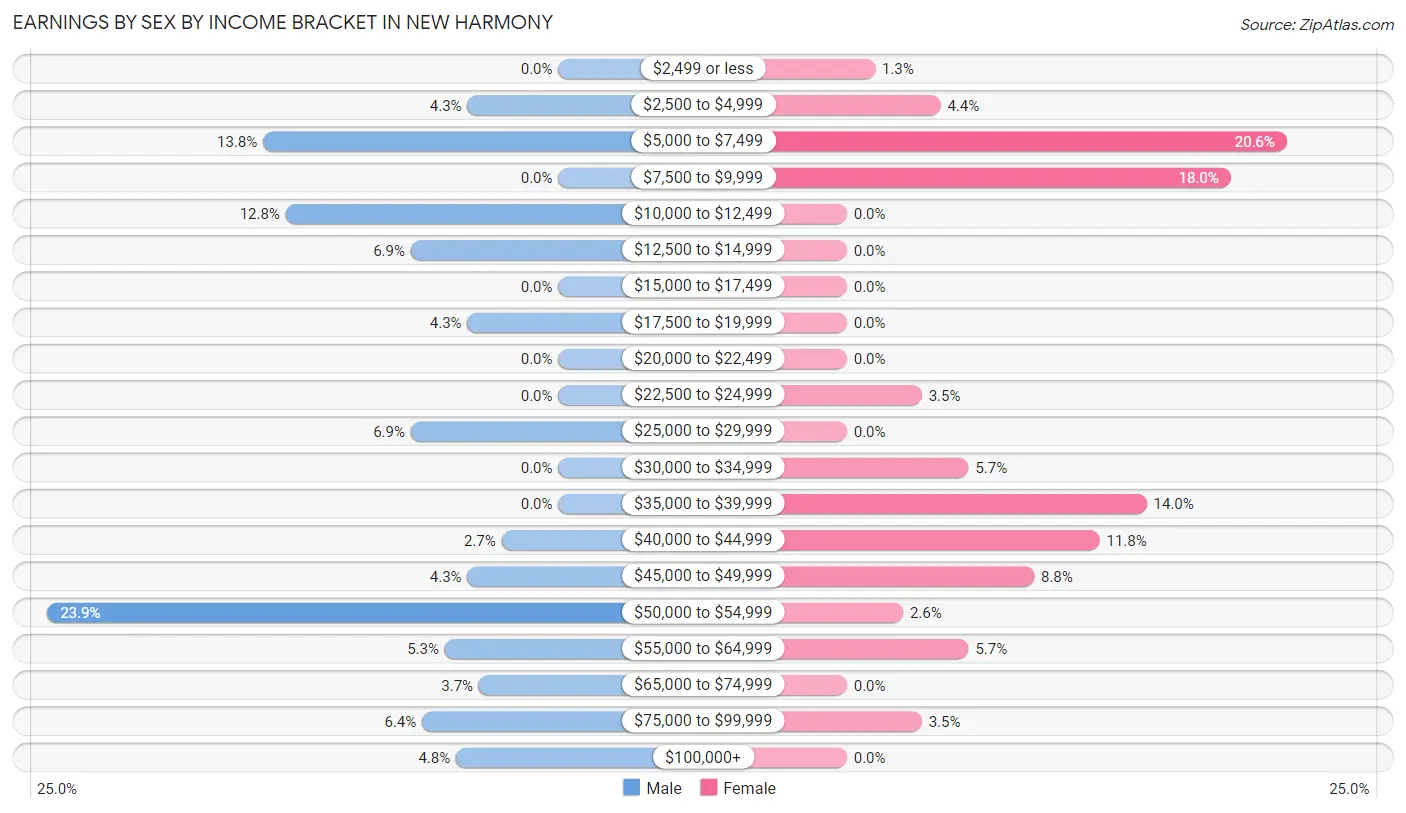
| Income | Male | Female |
| $2,499 or less | 0 (0.0%) | 3 (1.3%) |
| $2,500 to $4,999 | 8 (4.3%) | 10 (4.4%) |
| $5,000 to $7,499 | 26 (13.8%) | 47 (20.6%) |
| $7,500 to $9,999 | 0 (0.0%) | 41 (18.0%) |
| $10,000 to $12,499 | 24 (12.8%) | 0 (0.0%) |
| $12,500 to $14,999 | 13 (6.9%) | 0 (0.0%) |
| $15,000 to $17,499 | 0 (0.0%) | 0 (0.0%) |
| $17,500 to $19,999 | 8 (4.3%) | 0 (0.0%) |
| $20,000 to $22,499 | 0 (0.0%) | 0 (0.0%) |
| $22,500 to $24,999 | 0 (0.0%) | 8 (3.5%) |
| $25,000 to $29,999 | 13 (6.9%) | 0 (0.0%) |
| $30,000 to $34,999 | 0 (0.0%) | 13 (5.7%) |
| $35,000 to $39,999 | 0 (0.0%) | 32 (14.0%) |
| $40,000 to $44,999 | 5 (2.7%) | 27 (11.8%) |
| $45,000 to $49,999 | 8 (4.3%) | 20 (8.8%) |
| $50,000 to $54,999 | 45 (23.9%) | 6 (2.6%) |
| $55,000 to $64,999 | 10 (5.3%) | 13 (5.7%) |
| $65,000 to $74,999 | 7 (3.7%) | 0 (0.0%) |
| $75,000 to $99,999 | 12 (6.4%) | 8 (3.5%) |
| $100,000+ | 9 (4.8%) | 0 (0.0%) |
| Total | 188 (100.0%) | 228 (100.0%) |
Earnings by Sex by Educational Attainment in New Harmony
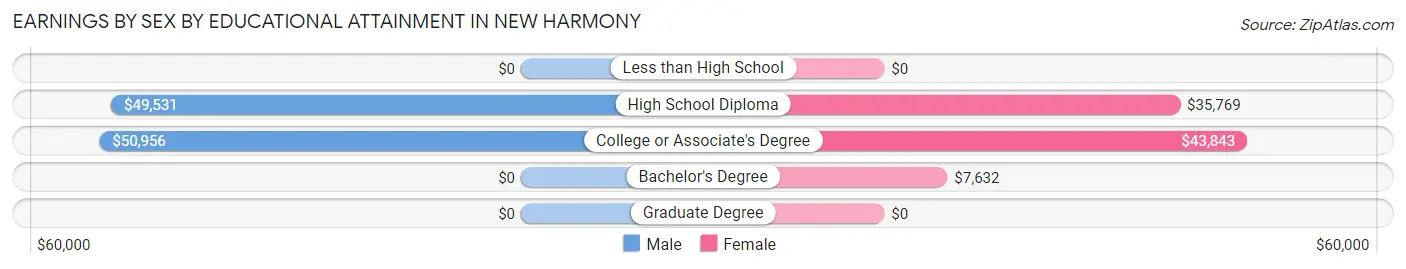
| Educational Attainment | Male Income | Female Income |
| Less than High School | - | - |
| High School Diploma | $49,531 | $35,769 |
| College or Associate's Degree | $50,956 | $43,843 |
| Bachelor's Degree | - | - |
| Graduate Degree | - | - |
| Total | $50,428 | $0 |
Family Income in New Harmony
Family Income Brackets in New Harmony
According to the New Harmony family income data, there are 51 families falling into the $25,000 to $34,999 income range, which is the most common income bracket and makes up 30.0% of all families.
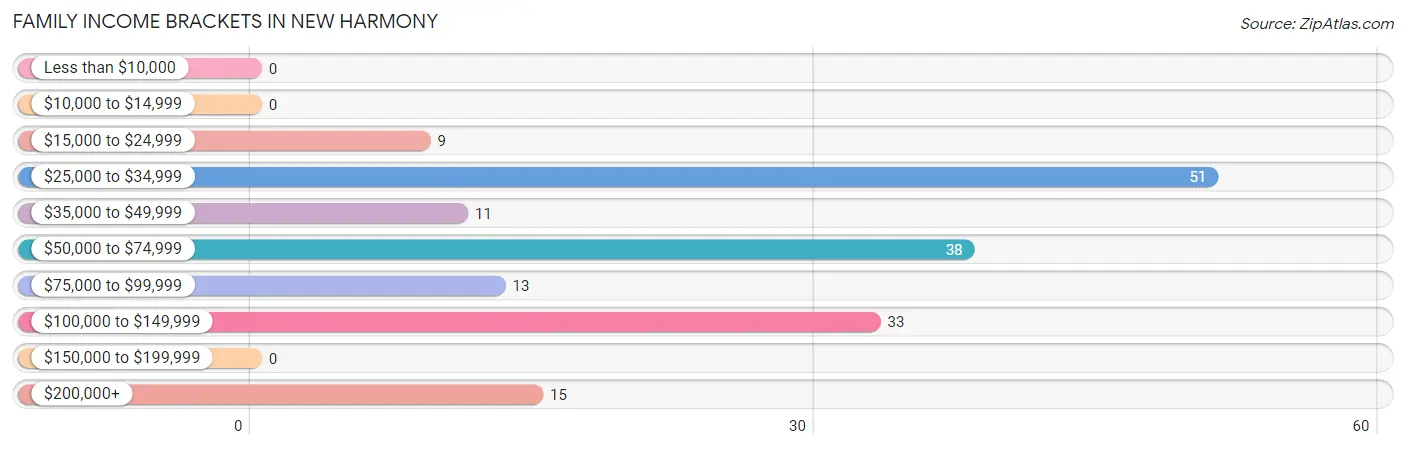
| Income Bracket | # Families | % Families |
| Less than $10,000 | 0 | 0.0% |
| $10,000 to $14,999 | 0 | 0.0% |
| $15,000 to $24,999 | 9 | 5.3% |
| $25,000 to $34,999 | 51 | 30.0% |
| $35,000 to $49,999 | 11 | 6.5% |
| $50,000 to $74,999 | 38 | 22.4% |
| $75,000 to $99,999 | 13 | 7.6% |
| $100,000 to $149,999 | 33 | 19.4% |
| $150,000 to $199,999 | 0 | 0.0% |
| $200,000+ | 15 | 8.8% |
Family Income by Famaliy Size in New Harmony
2-person families (90 | 52.9%) account for the highest median family income in New Harmony with $63,750 per family, while 2-person families (90 | 52.9%) have the highest median income of $31,875 per family member.
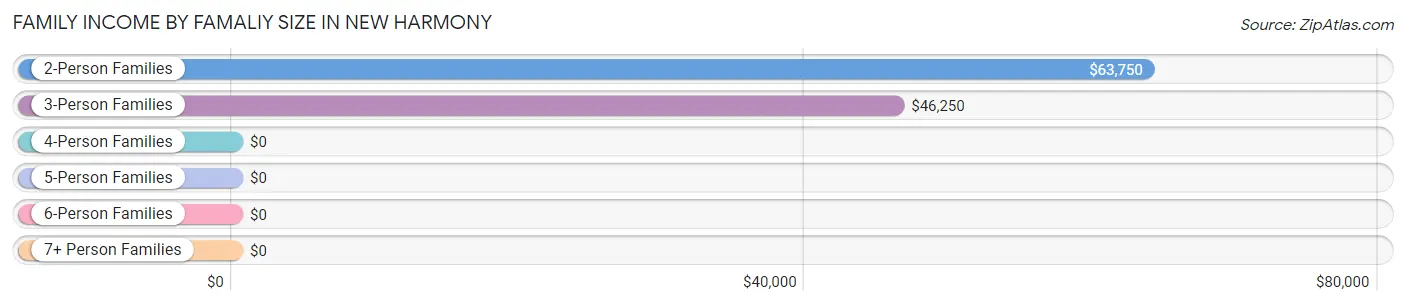
| Income Bracket | # Families | Median Income |
| 2-Person Families | 90 (52.9%) | $63,750 |
| 3-Person Families | 56 (32.9%) | $46,250 |
| 4-Person Families | 6 (3.5%) | $0 |
| 5-Person Families | 18 (10.6%) | $0 |
| 6-Person Families | 0 (0.0%) | $0 |
| 7+ Person Families | 0 (0.0%) | $0 |
| Total | 170 (100.0%) | $59,615 |
Family Income by Number of Earners in New Harmony
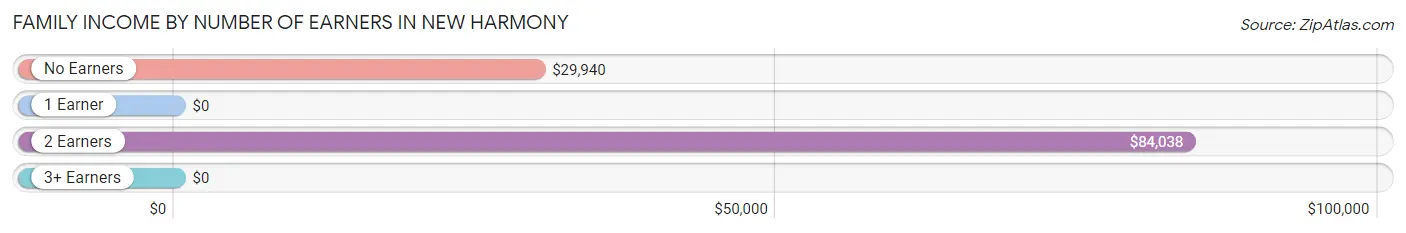
| Number of Earners | # Families | Median Income |
| No Earners | 41 (24.1%) | $29,940 |
| 1 Earner | 25 (14.7%) | $0 |
| 2 Earners | 72 (42.3%) | $84,038 |
| 3+ Earners | 32 (18.8%) | $0 |
| Total | 170 (100.0%) | $59,615 |
Household Income in New Harmony
Household Income Brackets in New Harmony
With 61 households falling in the category, the $35,000 to $49,999 income range is the most frequent in New Harmony, accounting for 18.3% of all households.
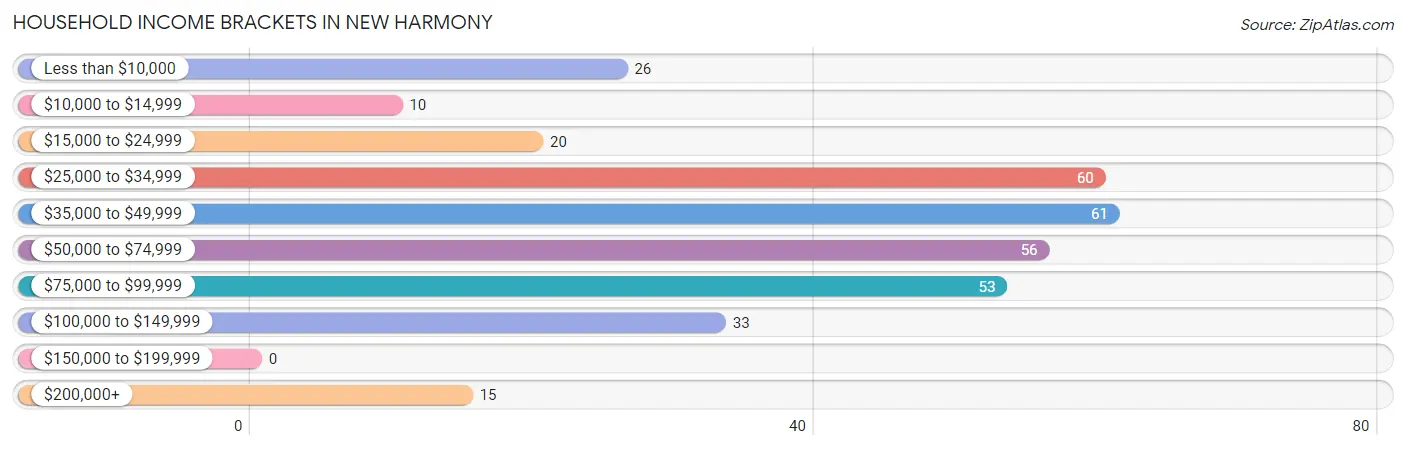
| Income Bracket | # Households | % Households |
| Less than $10,000 | 26 | 7.8% |
| $10,000 to $14,999 | 10 | 3.0% |
| $15,000 to $24,999 | 20 | 6.0% |
| $25,000 to $34,999 | 60 | 18.0% |
| $35,000 to $49,999 | 61 | 18.3% |
| $50,000 to $74,999 | 56 | 16.8% |
| $75,000 to $99,999 | 53 | 15.9% |
| $100,000 to $149,999 | 33 | 9.9% |
| $150,000 to $199,999 | 0 | 0.0% |
| $200,000+ | 15 | 4.5% |
Household Income by Householder Age in New Harmony
The median household income in New Harmony is $48,611, with the highest median household income of $84,423 found in the 25 to 44 years age bracket for the primary householder. A total of 64 households (19.2%) fall into this category. Meanwhile, the 15 to 24 years age bracket for the primary householder has the lowest median household income of $0, with 30 households (9.0%) in this group.
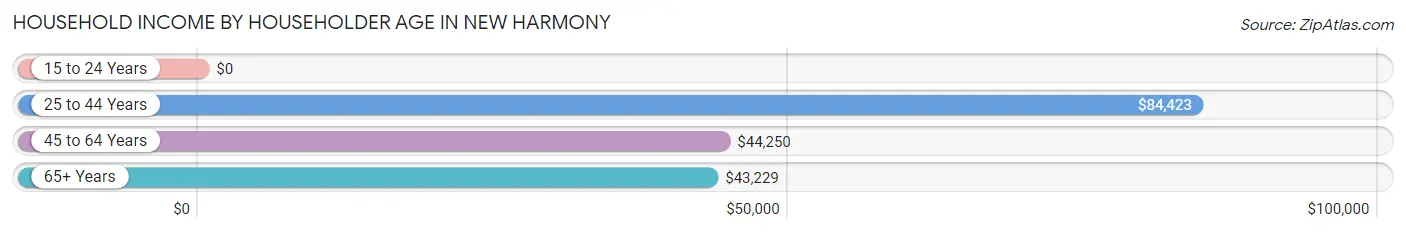
| Income Bracket | # Households | Median Income |
| 15 to 24 Years | 30 (9.0%) | $0 |
| 25 to 44 Years | 64 (19.2%) | $84,423 |
| 45 to 64 Years | 111 (33.2%) | $44,250 |
| 65+ Years | 129 (38.6%) | $43,229 |
| Total | 334 (100.0%) | $48,611 |
Poverty in New Harmony
Income Below Poverty by Sex and Age in New Harmony
With 11.1% poverty level for males and 7.7% for females among the residents of New Harmony, 18 to 24 year old males and 18 to 24 year old females are the most vulnerable to poverty, with 19 males (40.4%) and 7 females (46.7%) in their respective age groups living below the poverty level.
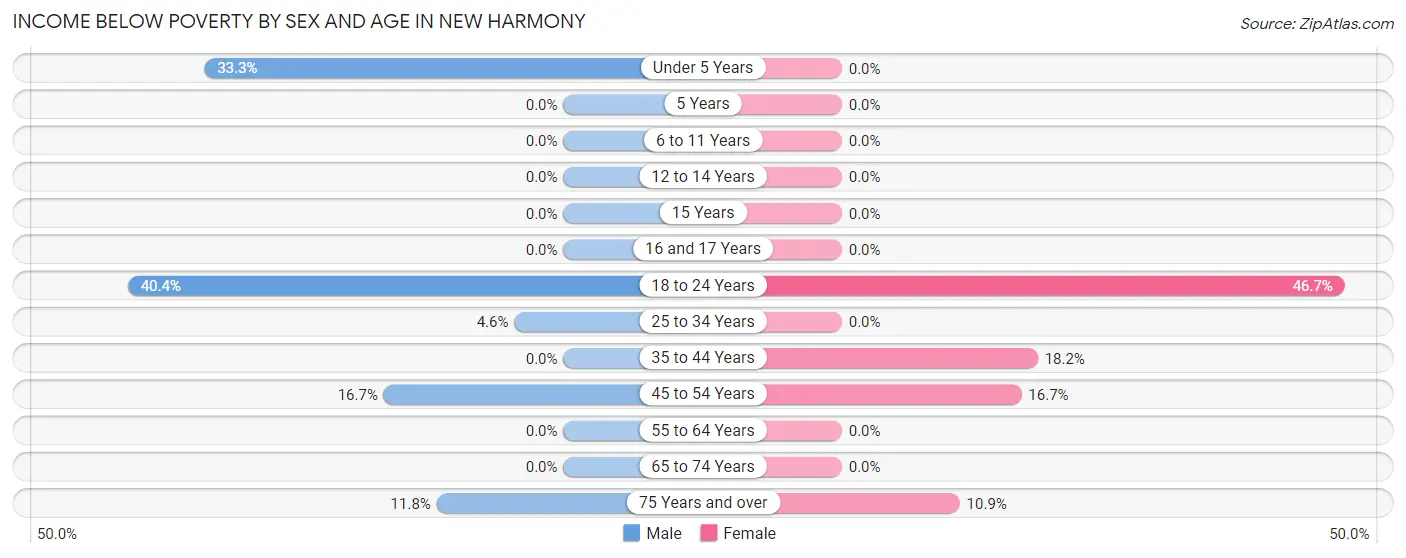
| Age Bracket | Male | Female |
| Under 5 Years | 7 (33.3%) | 0 (0.0%) |
| 5 Years | 0 (0.0%) | 0 (0.0%) |
| 6 to 11 Years | 0 (0.0%) | 0 (0.0%) |
| 12 to 14 Years | 0 (0.0%) | 0 (0.0%) |
| 15 Years | 0 (0.0%) | 0 (0.0%) |
| 16 and 17 Years | 0 (0.0%) | 0 (0.0%) |
| 18 to 24 Years | 19 (40.4%) | 7 (46.7%) |
| 25 to 34 Years | 3 (4.5%) | 0 (0.0%) |
| 35 to 44 Years | 0 (0.0%) | 6 (18.2%) |
| 45 to 54 Years | 6 (16.7%) | 10 (16.7%) |
| 55 to 64 Years | 0 (0.0%) | 0 (0.0%) |
| 65 to 74 Years | 0 (0.0%) | 0 (0.0%) |
| 75 Years and over | 2 (11.8%) | 7 (10.9%) |
| Total | 37 (11.1%) | 30 (7.7%) |
Income Above Poverty by Sex and Age in New Harmony
According to the poverty statistics in New Harmony, males aged 6 to 11 years and females aged under 5 years are the age groups that are most secure financially, with 100.0% of males and 100.0% of females in these age groups living above the poverty line.
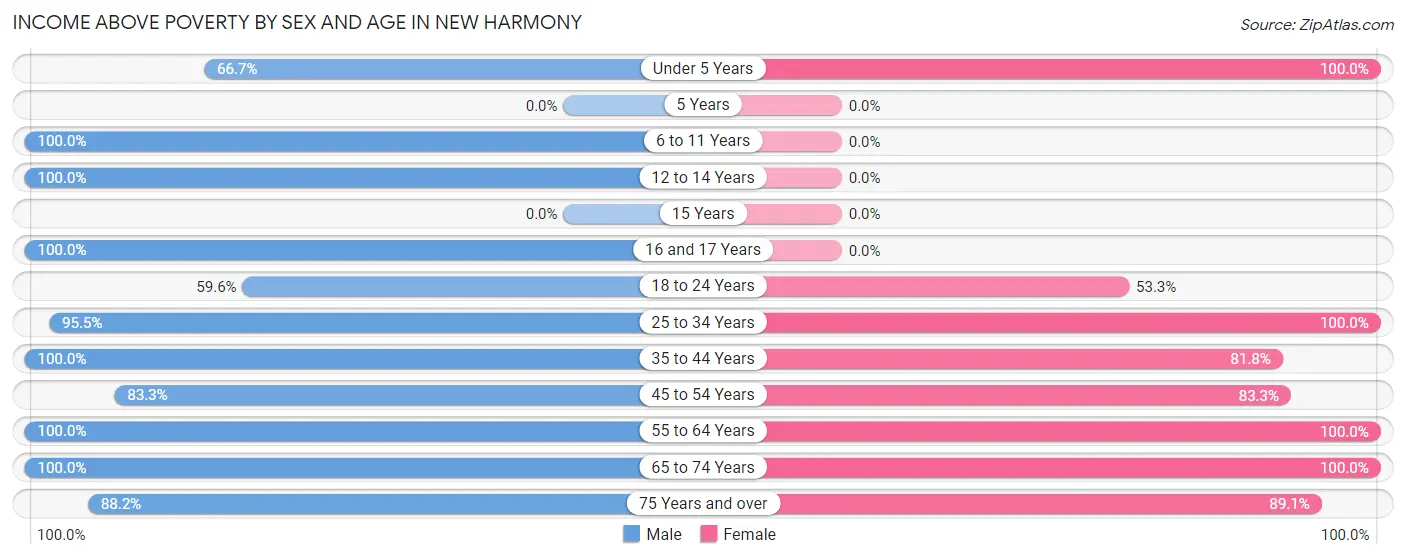
| Age Bracket | Male | Female |
| Under 5 Years | 14 (66.7%) | 3 (100.0%) |
| 5 Years | 0 (0.0%) | 0 (0.0%) |
| 6 to 11 Years | 6 (100.0%) | 0 (0.0%) |
| 12 to 14 Years | 15 (100.0%) | 0 (0.0%) |
| 15 Years | 0 (0.0%) | 0 (0.0%) |
| 16 and 17 Years | 14 (100.0%) | 0 (0.0%) |
| 18 to 24 Years | 28 (59.6%) | 8 (53.3%) |
| 25 to 34 Years | 63 (95.5%) | 122 (100.0%) |
| 35 to 44 Years | 31 (100.0%) | 27 (81.8%) |
| 45 to 54 Years | 30 (83.3%) | 50 (83.3%) |
| 55 to 64 Years | 42 (100.0%) | 25 (100.0%) |
| 65 to 74 Years | 39 (100.0%) | 66 (100.0%) |
| 75 Years and over | 15 (88.2%) | 57 (89.1%) |
| Total | 297 (88.9%) | 358 (92.3%) |
Income Below Poverty Among Married-Couple Families in New Harmony
The poverty statistics for married-couple families in New Harmony show that 2.5% or 3 of the total 122 families live below the poverty line. Families with no children have the highest poverty rate of 3.2%, comprising of 3 families. On the other hand, families with 1 or 2 children have the lowest poverty rate of 0.0%, which includes 0 families.
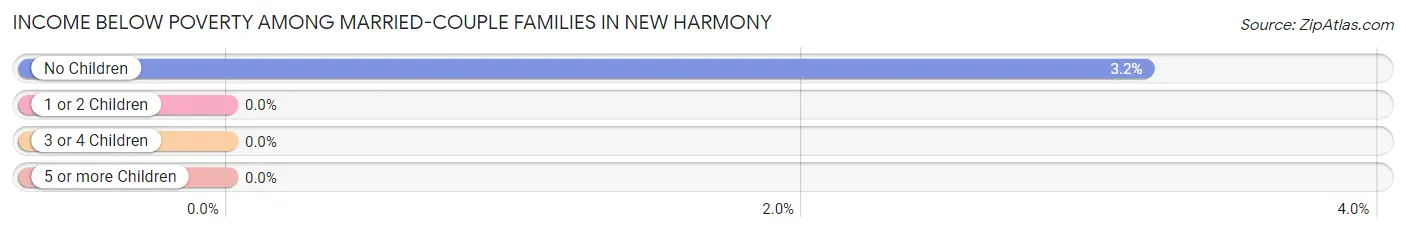
| Children | Above Poverty | Below Poverty |
| No Children | 91 (96.8%) | 3 (3.2%) |
| 1 or 2 Children | 28 (100.0%) | 0 (0.0%) |
| 3 or 4 Children | 0 (0.0%) | 0 (0.0%) |
| 5 or more Children | 0 (0.0%) | 0 (0.0%) |
| Total | 119 (97.5%) | 3 (2.5%) |
Income Below Poverty Among Single-Parent Households in New Harmony
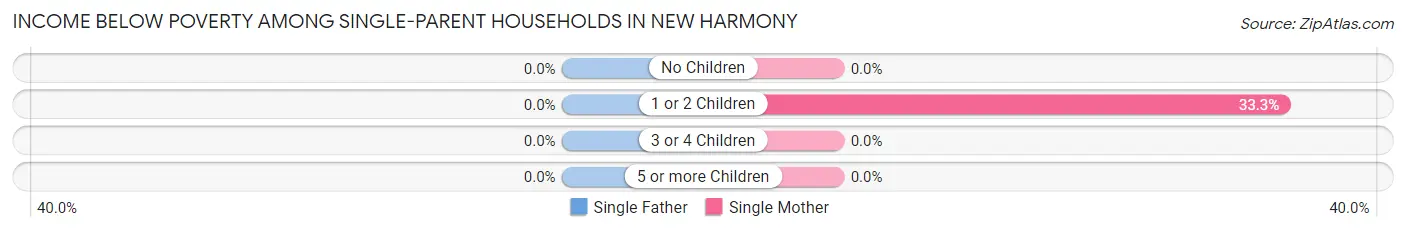
| Children | Single Father | Single Mother |
| No Children | 0 (0.0%) | 0 (0.0%) |
| 1 or 2 Children | 0 (0.0%) | 6 (33.3%) |
| 3 or 4 Children | 0 (0.0%) | 0 (0.0%) |
| 5 or more Children | 0 (0.0%) | 0 (0.0%) |
| Total | 0 (0.0%) | 6 (18.8%) |
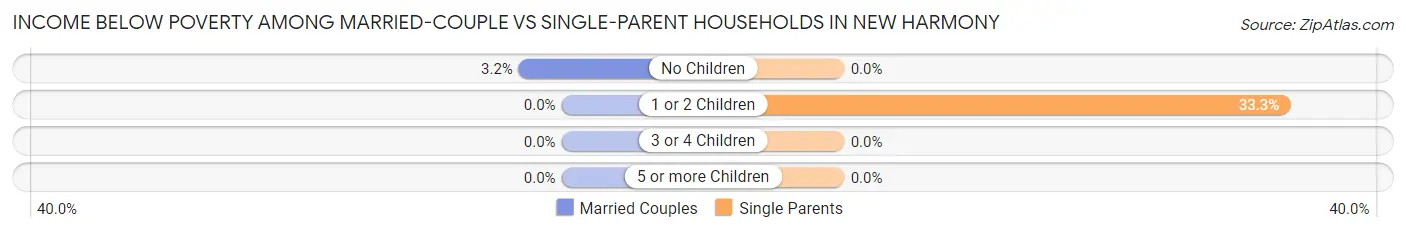
Income Below Poverty Among Married-Couple vs Single-Parent Households in New Harmony
The poverty data for New Harmony shows that 3 of the married-couple family households (2.5%) and 6 of the single-parent households (12.5%) are living below the poverty level. Within the married-couple family households, those with no children have the highest poverty rate, with 3 households (3.2%) falling below the poverty line. Among the single-parent households, those with 1 or 2 children have the highest poverty rate, with 6 household (33.3%) living below poverty.
| Children | Married-Couple Families | Single-Parent Households |
| No Children | 3 (3.2%) | 0 (0.0%) |
| 1 or 2 Children | 0 (0.0%) | 6 (33.3%) |
| 3 or 4 Children | 0 (0.0%) | 0 (0.0%) |
| 5 or more Children | 0 (0.0%) | 0 (0.0%) |
| Total | 3 (2.5%) | 6 (12.5%) |
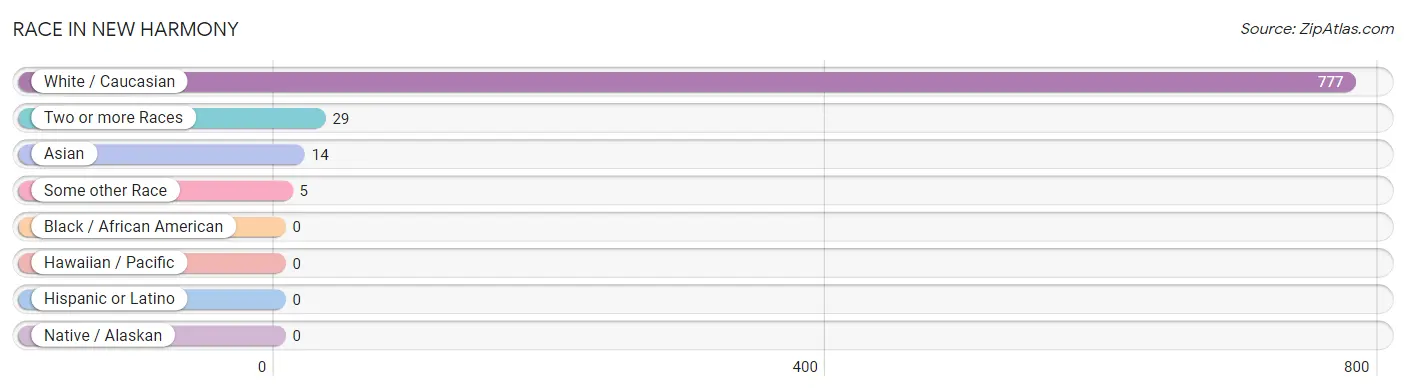
Race in New Harmony
The most populous races in New Harmony are White / Caucasian (777 | 94.2%), Two or more Races (29 | 3.5%), and Asian (14 | 1.7%).
| Race | # Population | % Population |
| Asian | 14 | 1.7% |
| Black / African American | 0 | 0.0% |
| Hawaiian / Pacific | 0 | 0.0% |
| Hispanic or Latino | 0 | 0.0% |
| Native / Alaskan | 0 | 0.0% |
| White / Caucasian | 777 | 94.2% |
| Two or more Races | 29 | 3.5% |
| Some other Race | 5 | 0.6% |
| Total | 825 | 100.0% |
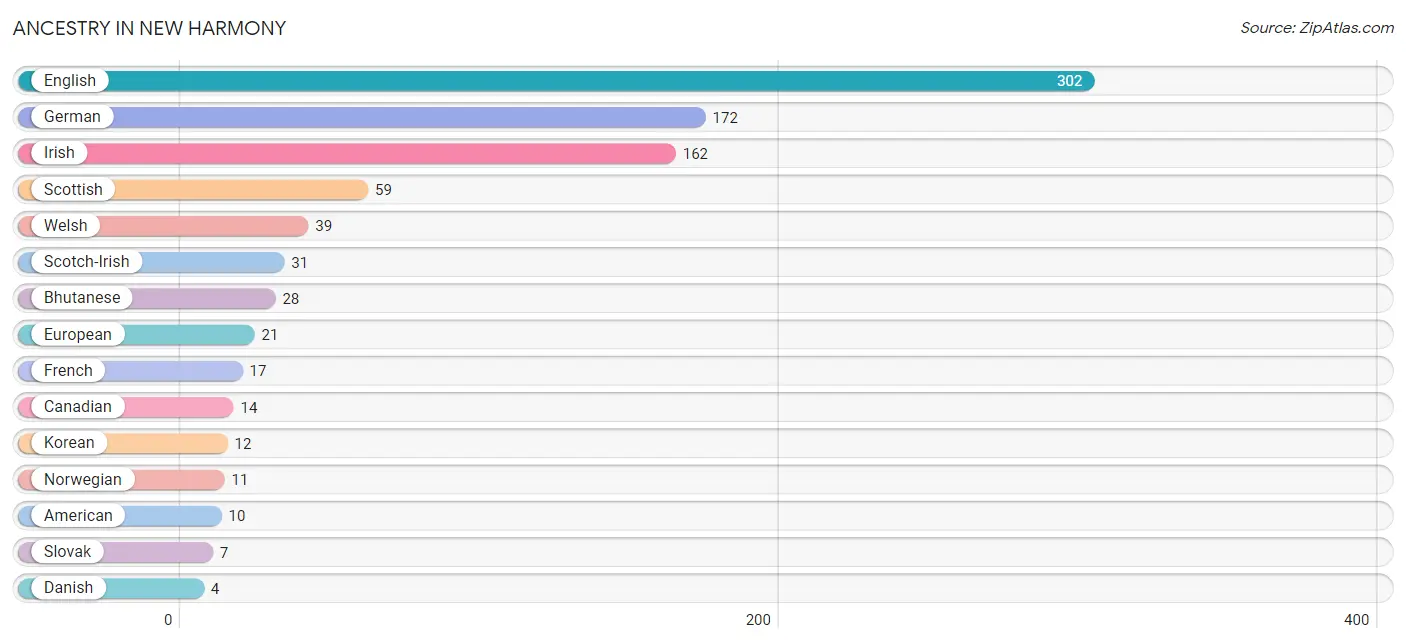
Ancestry in New Harmony
The most populous ancestries reported in New Harmony are English (302 | 36.6%), German (172 | 20.8%), Irish (162 | 19.6%), Scottish (59 | 7.1%), and Welsh (39 | 4.7%), together accounting for 89.0% of all New Harmony residents.
| Ancestry | # Population | % Population |
| American | 10 | 1.2% |
| Bhutanese | 28 | 3.4% |
| Canadian | 14 | 1.7% |
| Cherokee | 3 | 0.4% |
| Croatian | 2 | 0.2% |
| Danish | 4 | 0.5% |
| Dutch | 2 | 0.2% |
| Eastern European | 2 | 0.2% |
| English | 302 | 36.6% |
| European | 21 | 2.5% |
| French | 17 | 2.1% |
| German | 172 | 20.8% |
| Irish | 162 | 19.6% |
| Italian | 1 | 0.1% |
| Korean | 12 | 1.5% |
| Norwegian | 11 | 1.3% |
| Russian | 2 | 0.2% |
| Scotch-Irish | 31 | 3.8% |
| Scottish | 59 | 7.1% |
| Slovak | 7 | 0.9% |
| Swedish | 3 | 0.4% |
| Welsh | 39 | 4.7% | View All 22 Rows |
Immigrants in New Harmony
The most numerous immigrant groups reported in New Harmony came from Asia (14 | 1.7%), Canada (14 | 1.7%), Eastern Asia (14 | 1.7%), and Japan (14 | 1.7%), together accounting for 6.8% of all New Harmony residents.
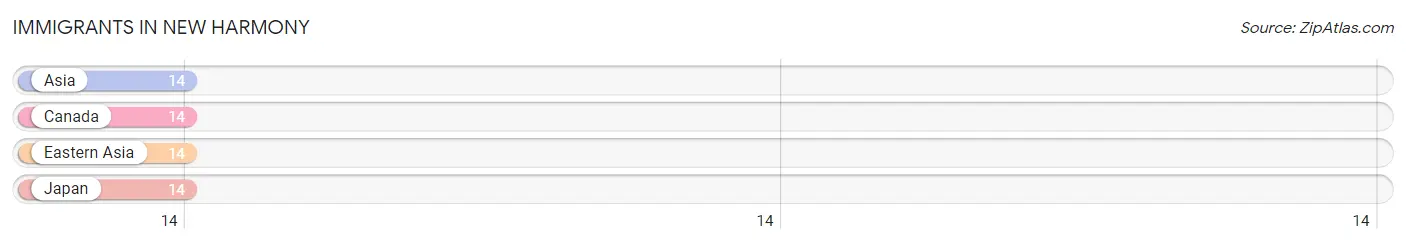
| Immigration Origin | # Population | % Population |
| Asia | 14 | 1.7% |
| Canada | 14 | 1.7% |
| Eastern Asia | 14 | 1.7% |
| Japan | 14 | 1.7% | View All 4 Rows |
Sex and Age in New Harmony
Sex and Age in New Harmony
The most populous age groups in New Harmony are 15 to 19 Years (53 | 14.6%) for men and 25 to 29 Years (105 | 22.7%) for women.
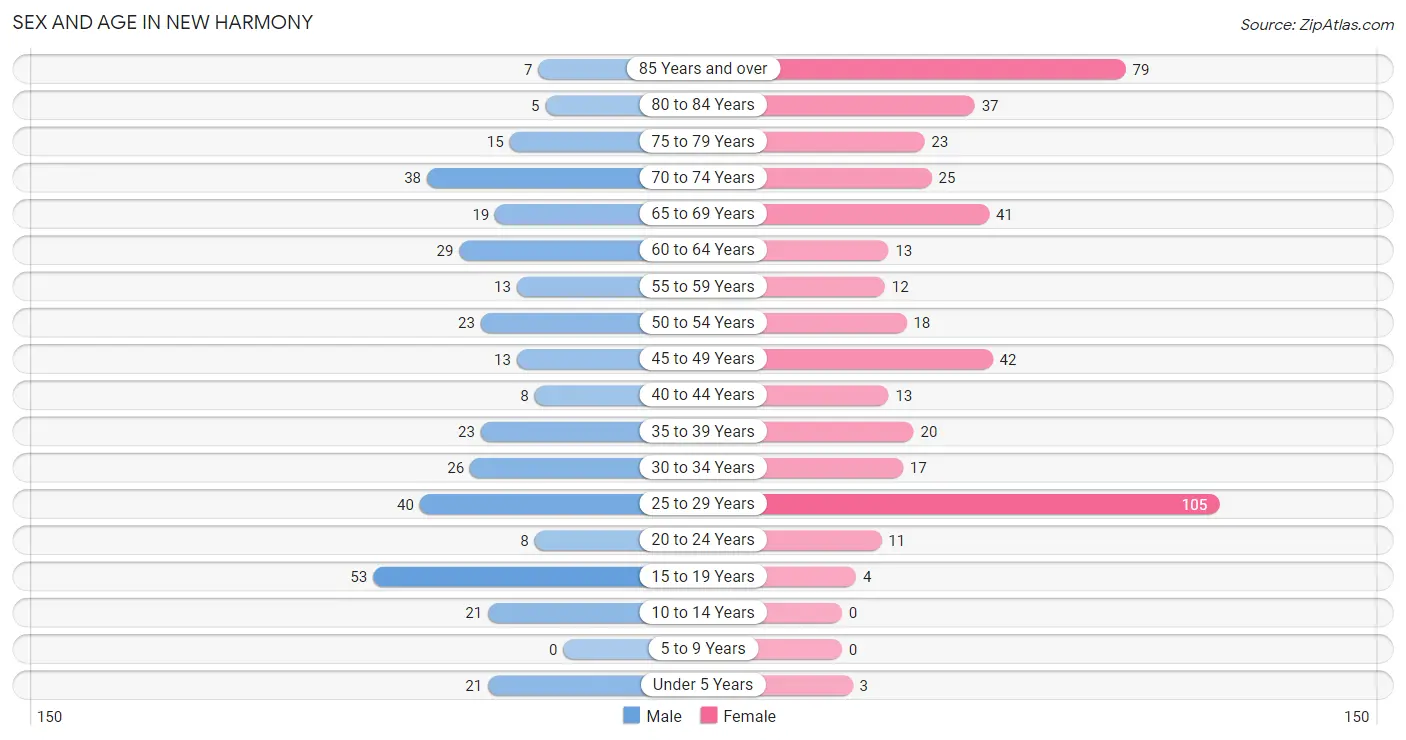
| Age Bracket | Male | Female |
| Under 5 Years | 21 (5.8%) | 3 (0.6%) |
| 5 to 9 Years | 0 (0.0%) | 0 (0.0%) |
| 10 to 14 Years | 21 (5.8%) | 0 (0.0%) |
| 15 to 19 Years | 53 (14.6%) | 4 (0.9%) |
| 20 to 24 Years | 8 (2.2%) | 11 (2.4%) |
| 25 to 29 Years | 40 (11.1%) | 105 (22.7%) |
| 30 to 34 Years | 26 (7.2%) | 17 (3.7%) |
| 35 to 39 Years | 23 (6.4%) | 20 (4.3%) |
| 40 to 44 Years | 8 (2.2%) | 13 (2.8%) |
| 45 to 49 Years | 13 (3.6%) | 42 (9.1%) |
| 50 to 54 Years | 23 (6.4%) | 18 (3.9%) |
| 55 to 59 Years | 13 (3.6%) | 12 (2.6%) |
| 60 to 64 Years | 29 (8.0%) | 13 (2.8%) |
| 65 to 69 Years | 19 (5.2%) | 41 (8.9%) |
| 70 to 74 Years | 38 (10.5%) | 25 (5.4%) |
| 75 to 79 Years | 15 (4.1%) | 23 (5.0%) |
| 80 to 84 Years | 5 (1.4%) | 37 (8.0%) |
| 85 Years and over | 7 (1.9%) | 79 (17.1%) |
| Total | 362 (100.0%) | 463 (100.0%) |
Families and Households in New Harmony
Median Family Size in New Harmony
The median family size in New Harmony is 3.06 persons per family, with single male/father families (16 | 9.4%) accounting for the largest median family size of 5.81 persons per family. On the other hand, married-couple families (122 | 71.8%) represent the smallest median family size with 2.50 persons per family.
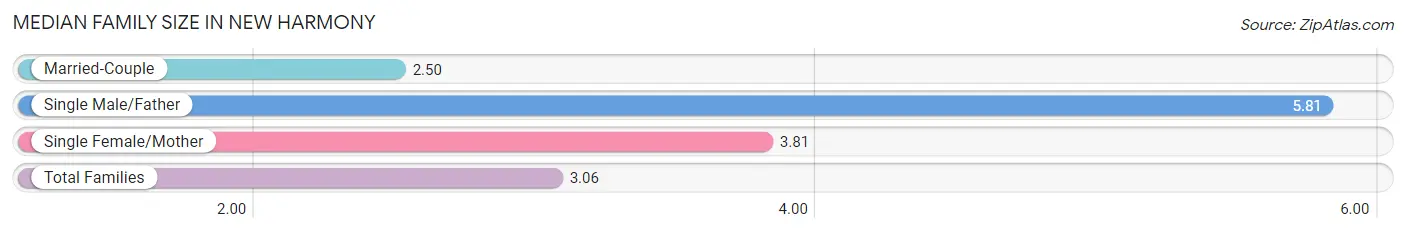
| Family Type | # Families | Family Size |
| Married-Couple | 122 (71.8%) | 2.50 |
| Single Male/Father | 16 (9.4%) | 5.81 |
| Single Female/Mother | 32 (18.8%) | 3.81 |
| Total Families | 170 (100.0%) | 3.06 |
Median Household Size in New Harmony
The median household size in New Harmony is 2.16 persons per household, with single male/father households (16 | 4.8%) accounting for the largest median household size of 5.81 persons per household. non-family households (164 | 49.1%) represent the smallest median household size with 1.14 persons per household.
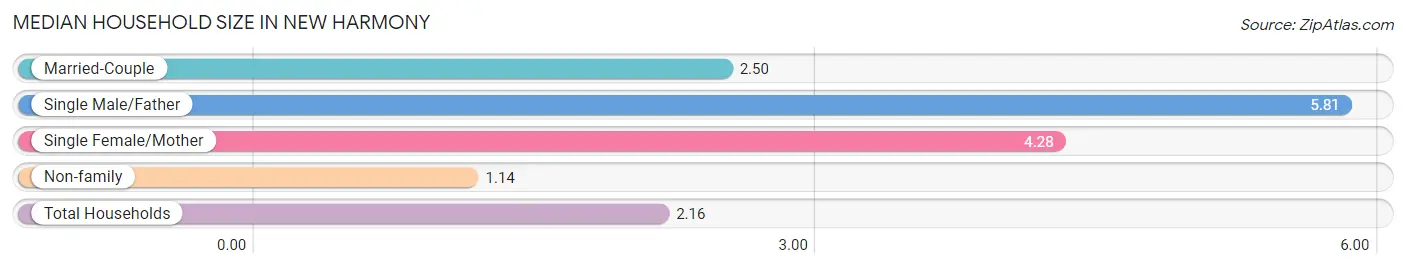
| Household Type | # Households | Household Size |
| Married-Couple | 122 (36.5%) | 2.50 |
| Single Male/Father | 16 (4.8%) | 5.81 |
| Single Female/Mother | 32 (9.6%) | 4.28 |
| Non-family | 164 (49.1%) | 1.14 |
| Total Households | 334 (100.0%) | 2.16 |
Household Size by Marriage Status in New Harmony
Out of a total of 334 households in New Harmony, 170 (50.9%) are family households, while 164 (49.1%) are nonfamily households. The most numerous type of family households are 2-person households, comprising 90, and the most common type of nonfamily households are 1-person households, comprising 139.
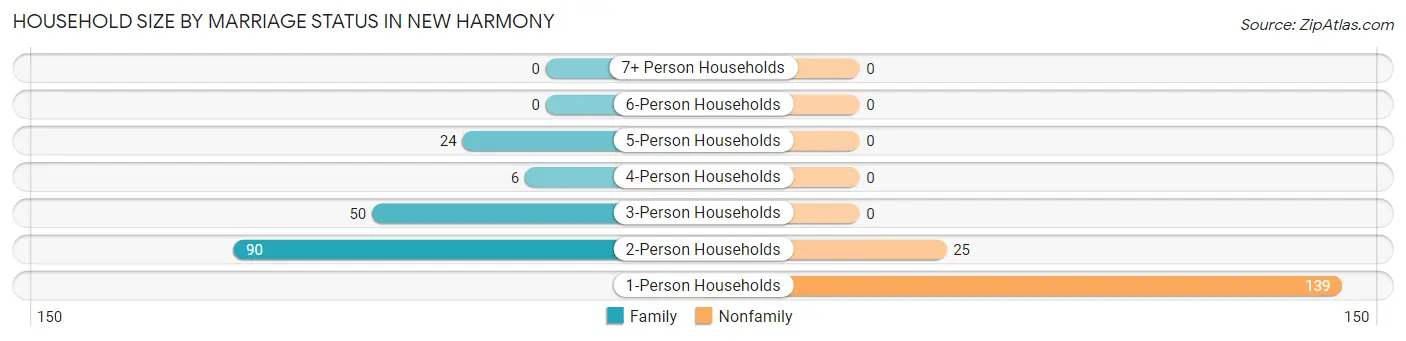
| Household Size | Family Households | Nonfamily Households |
| 1-Person Households | - | 139 (41.6%) |
| 2-Person Households | 90 (27.0%) | 25 (7.5%) |
| 3-Person Households | 50 (15.0%) | 0 (0.0%) |
| 4-Person Households | 6 (1.8%) | 0 (0.0%) |
| 5-Person Households | 24 (7.2%) | 0 (0.0%) |
| 6-Person Households | 0 (0.0%) | 0 (0.0%) |
| 7+ Person Households | 0 (0.0%) | 0 (0.0%) |
| Total | 170 (50.9%) | 164 (49.1%) |
Female Fertility in New Harmony
Fertility by Age in New Harmony
Average fertility rate in New Harmony is 123.0 births per 1,000 women. Women in the age bracket of 20 to 34 years have the highest fertility rate with 150.0 births per 1,000 women. Women in the age bracket of 20 to 34 years acount for 76.9% of all women with births.
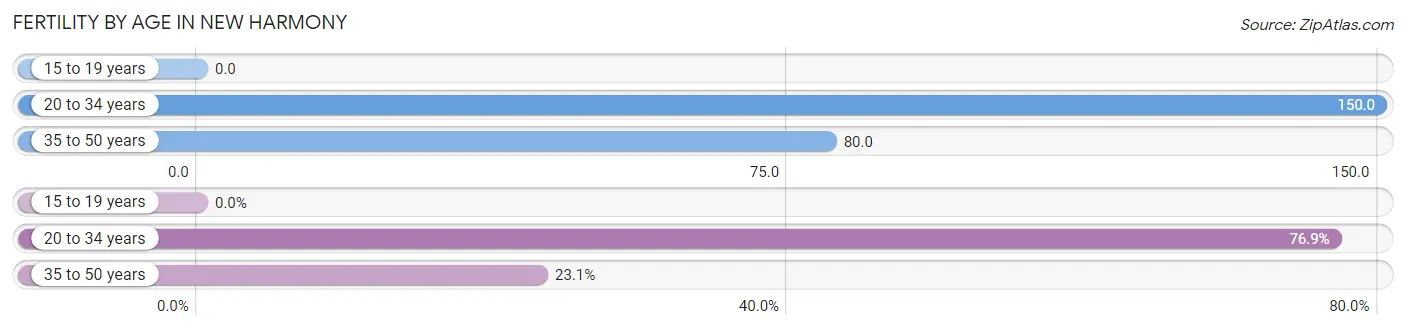
| Age Bracket | Women with Births | Births / 1,000 Women |
| 15 to 19 years | 0 (0.0%) | 0.0 |
| 20 to 34 years | 20 (76.9%) | 150.0 |
| 35 to 50 years | 6 (23.1%) | 80.0 |
| Total | 26 (100.0%) | 123.0 |
Fertility by Age by Marriage Status in New Harmony
53.8% of women with births (26) in New Harmony are married. The highest percentage of unmarried women with births falls into 35 to 50 years age bracket with 100.0% of them unmarried at the time of birth, while the lowest percentage of unmarried women with births belong to 20 to 34 years age bracket with 30.0% of them unmarried.
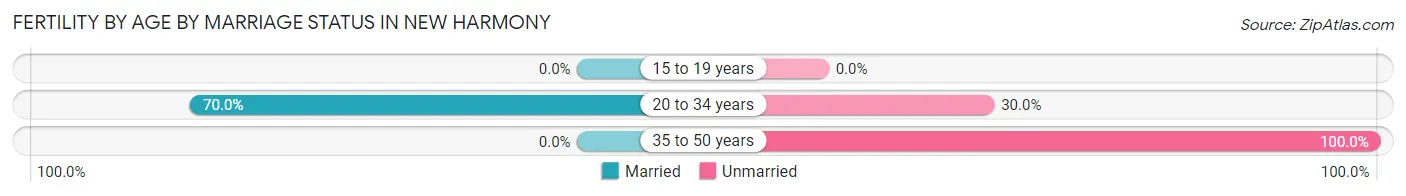
| Age Bracket | Married | Unmarried |
| 15 to 19 years | 0 (0.0%) | 0 (0.0%) |
| 20 to 34 years | 14 (70.0%) | 6 (30.0%) |
| 35 to 50 years | 0 (0.0%) | 6 (100.0%) |
| Total | 14 (53.8%) | 12 (46.2%) |
Fertility by Education in New Harmony
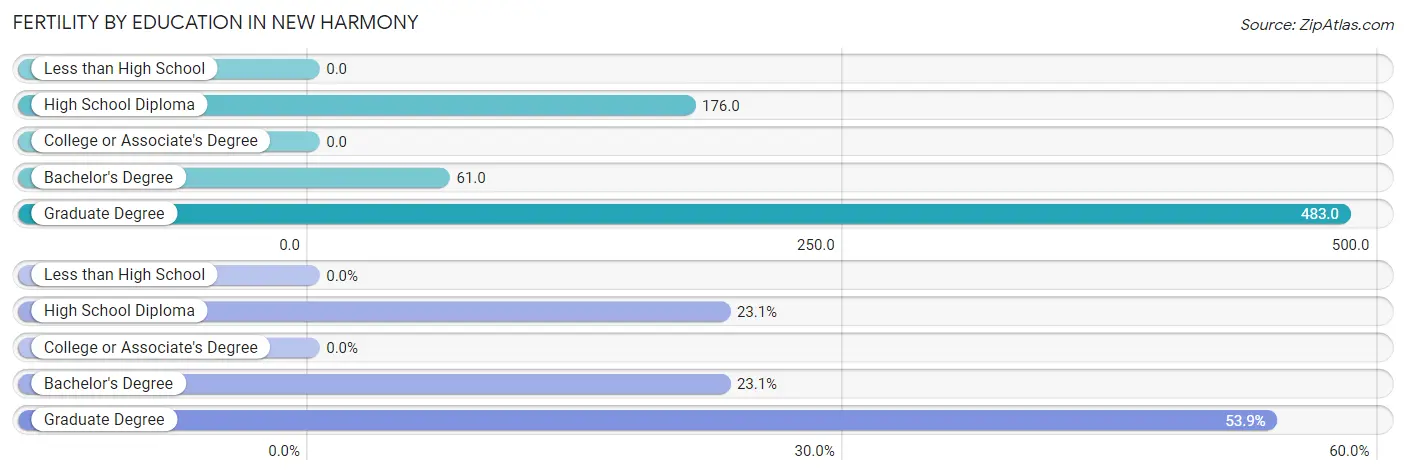
| Educational Attainment | Women with Births | Births / 1,000 Women |
| Less than High School | 0 (0.0%) | 0.0 |
| High School Diploma | 6 (23.1%) | 176.0 |
| College or Associate's Degree | 0 (0.0%) | 0.0 |
| Bachelor's Degree | 6 (23.1%) | 61.0 |
| Graduate Degree | 14 (53.8%) | 483.0 |
| Total | 26 (100.0%) | 123.0 |
Fertility by Education by Marriage Status in New Harmony
46.2% of women with births in New Harmony are unmarried. Women with the educational attainment of graduate degree are most likely to be married with 100.0% of them married at childbirth, while women with the educational attainment of high school diploma are least likely to be married with 100.0% of them unmarried at childbirth.
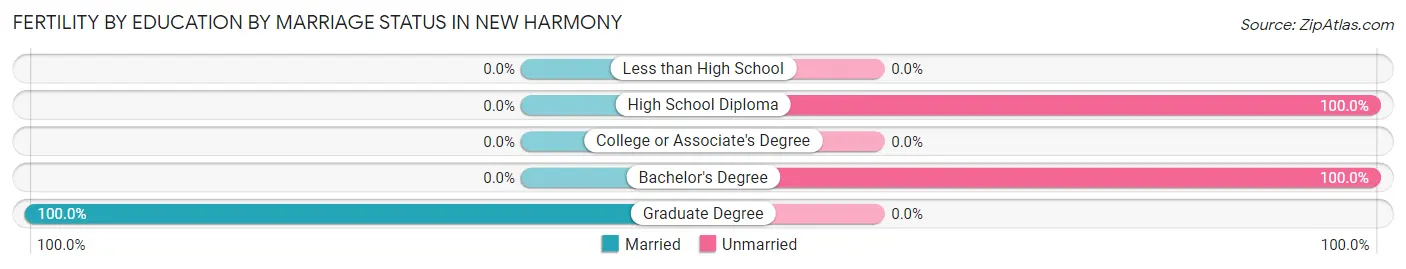
| Educational Attainment | Married | Unmarried |
| Less than High School | 0 (0.0%) | 0 (0.0%) |
| High School Diploma | 0 (0.0%) | 6 (100.0%) |
| College or Associate's Degree | 0 (0.0%) | 0 (0.0%) |
| Bachelor's Degree | 0 (0.0%) | 6 (100.0%) |
| Graduate Degree | 14 (100.0%) | 0 (0.0%) |
| Total | 14 (53.8%) | 12 (46.2%) |
Employment Characteristics in New Harmony
Employment by Class of Employer in New Harmony
Among the 404 employed individuals in New Harmony, private company employees (264 | 65.3%), not-for-profit organizations (55 | 13.6%), and local government employees (51 | 12.6%) make up the most common classes of employment.
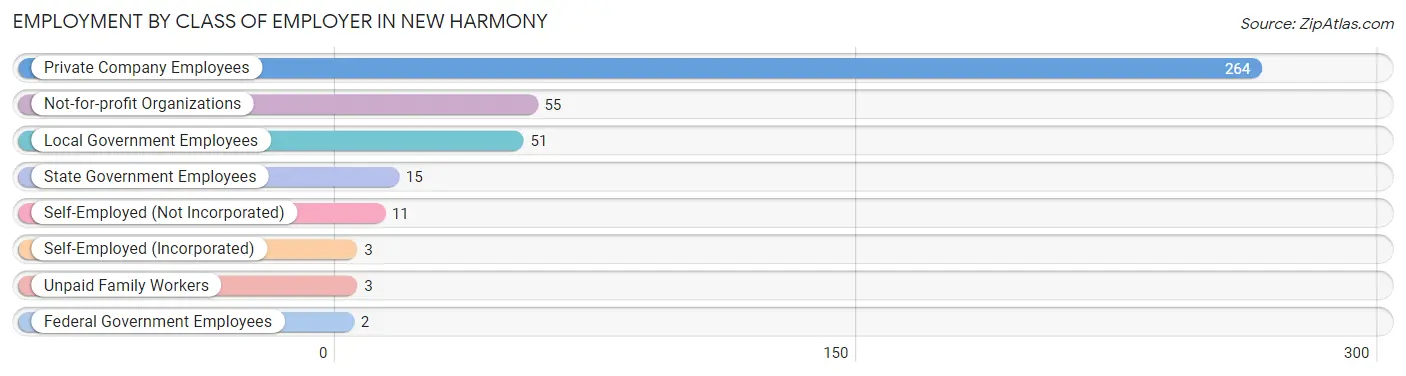
| Employer Class | # Employees | % Employees |
| Private Company Employees | 264 | 65.3% |
| Self-Employed (Incorporated) | 3 | 0.7% |
| Self-Employed (Not Incorporated) | 11 | 2.7% |
| Not-for-profit Organizations | 55 | 13.6% |
| Local Government Employees | 51 | 12.6% |
| State Government Employees | 15 | 3.7% |
| Federal Government Employees | 2 | 0.5% |
| Unpaid Family Workers | 3 | 0.7% |
| Total | 404 | 100.0% |
Employment Status by Age in New Harmony
According to the labor force statistics for New Harmony, out of the total population over 16 years of age (780), 54.1% or 422 individuals are in the labor force, with 4.3% or 18 of them unemployed. The age group with the highest labor force participation rate is 20 to 24 years, with 100.0% or 19 individuals in the labor force. Within the labor force, the 60 to 64 years age range has the highest percentage of unemployed individuals, with 20.0% or 5 of them being unemployed.
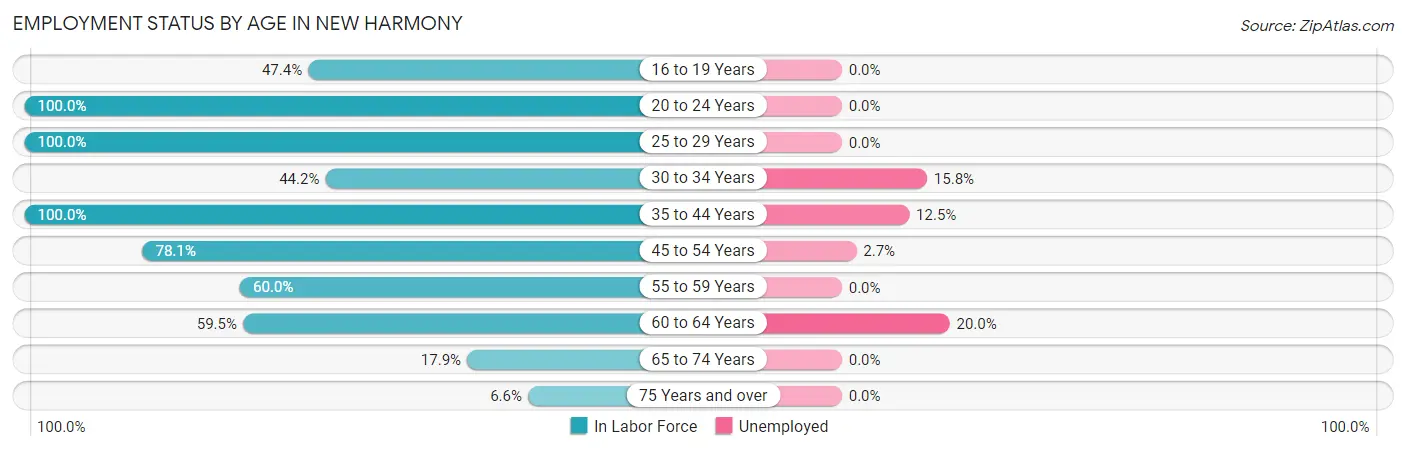
| Age Bracket | In Labor Force | Unemployed |
| 16 to 19 Years | 27 (47.4%) | 0 (0.0%) |
| 20 to 24 Years | 19 (100.0%) | 0 (0.0%) |
| 25 to 29 Years | 145 (100.0%) | 0 (0.0%) |
| 30 to 34 Years | 19 (44.2%) | 3 (15.8%) |
| 35 to 44 Years | 64 (100.0%) | 8 (12.5%) |
| 45 to 54 Years | 75 (78.1%) | 2 (2.7%) |
| 55 to 59 Years | 15 (60.0%) | 0 (0.0%) |
| 60 to 64 Years | 25 (59.5%) | 5 (20.0%) |
| 65 to 74 Years | 22 (17.9%) | 0 (0.0%) |
| 75 Years and over | 11 (6.6%) | 0 (0.0%) |
| Total | 422 (54.1%) | 18 (4.3%) |
Employment Status by Educational Attainment in New Harmony
According to labor force statistics for New Harmony, 82.7% of individuals (343) out of the total population between 25 and 64 years of age (415) are in the labor force, with 5.2% or 18 of them being unemployed. The group with the highest labor force participation rate are those with the educational attainment of college / associate degree, with 92.7% or 89 individuals in the labor force. Within the labor force, individuals with high school diploma education have the highest percentage of unemployment, with 12.4% or 13 of them being unemployed.
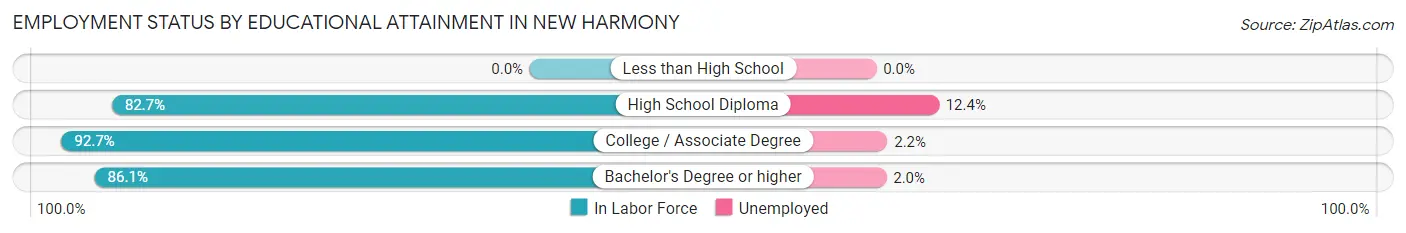
| Educational Attainment | In Labor Force | Unemployed |
| Less than High School | 0 (0.0%) | 0 (0.0%) |
| High School Diploma | 105 (82.7%) | 16 (12.4%) |
| College / Associate Degree | 89 (92.7%) | 2 (2.2%) |
| Bachelor's Degree or higher | 149 (86.1%) | 3 (2.0%) |
| Total | 343 (82.7%) | 22 (5.2%) |
Employment Occupations by Sex in New Harmony
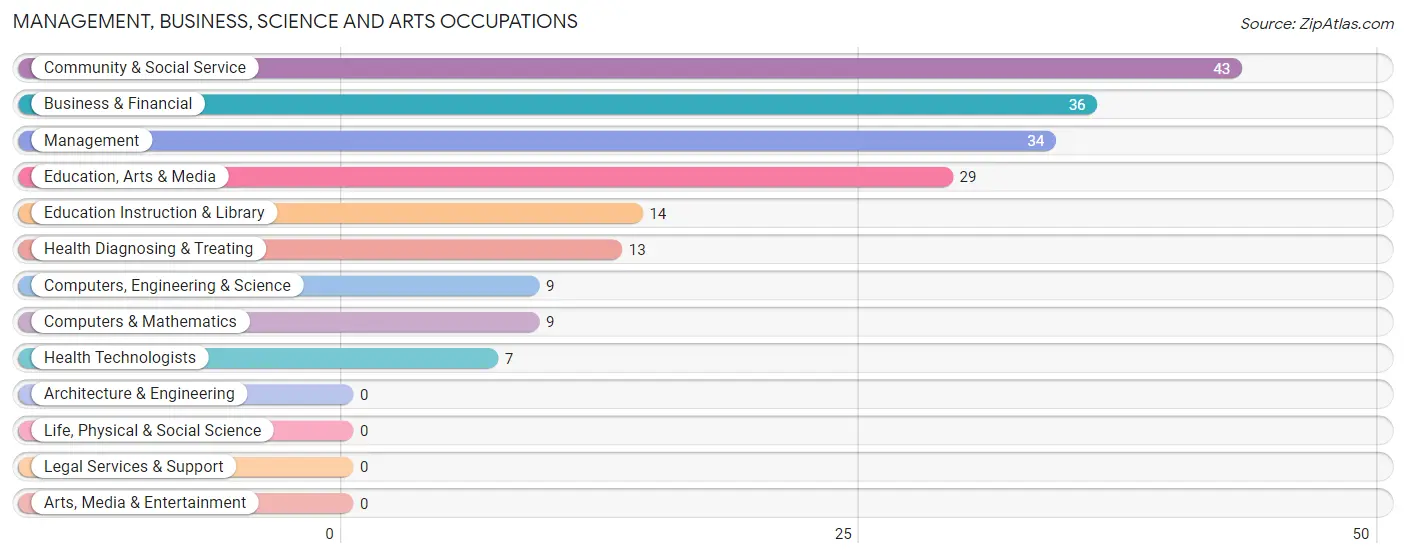
Management, Business, Science and Arts Occupations
The most common Management, Business, Science and Arts occupations in New Harmony are Community & Social Service (43 | 10.6%), Business & Financial (36 | 8.9%), Management (34 | 8.4%), Education, Arts & Media (29 | 7.2%), and Education Instruction & Library (14 | 3.5%).
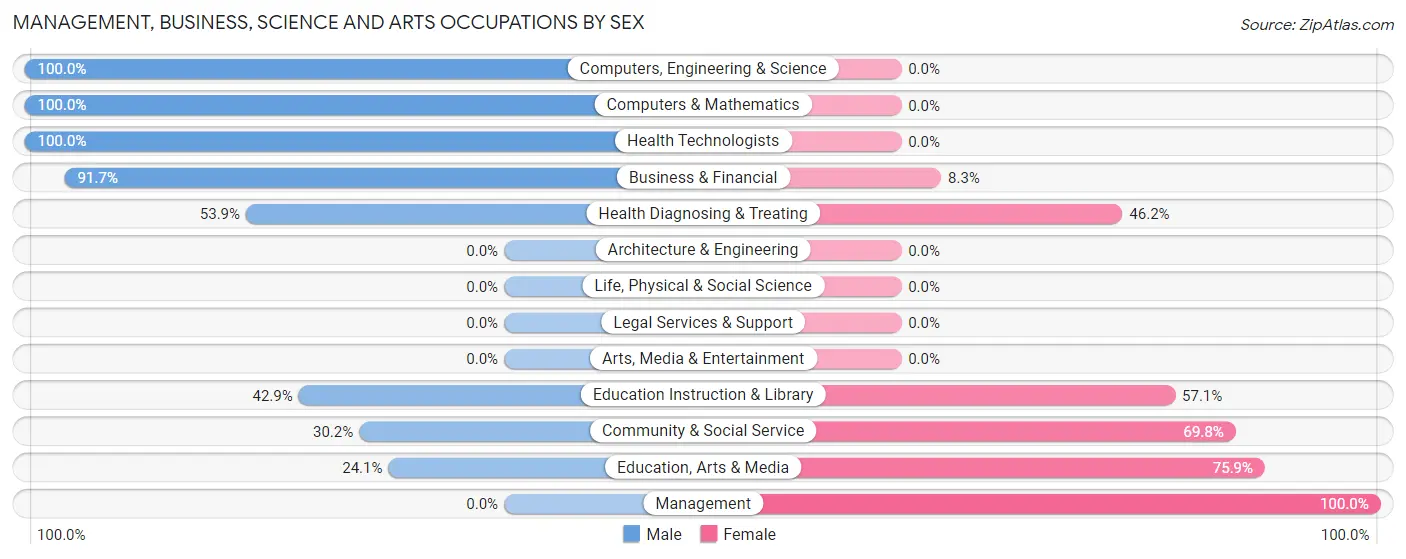
Management, Business, Science and Arts Occupations by Sex
Within the Management, Business, Science and Arts occupations in New Harmony, the most male-oriented occupations are Computers, Engineering & Science (100.0%), Computers & Mathematics (100.0%), and Health Technologists (100.0%), while the most female-oriented occupations are Management (100.0%), Education, Arts & Media (75.9%), and Community & Social Service (69.8%).
| Occupation | Male | Female |
| Management | 0 (0.0%) | 34 (100.0%) |
| Business & Financial | 33 (91.7%) | 3 (8.3%) |
| Computers, Engineering & Science | 9 (100.0%) | 0 (0.0%) |
| Computers & Mathematics | 9 (100.0%) | 0 (0.0%) |
| Architecture & Engineering | 0 (0.0%) | 0 (0.0%) |
| Life, Physical & Social Science | 0 (0.0%) | 0 (0.0%) |
| Community & Social Service | 13 (30.2%) | 30 (69.8%) |
| Education, Arts & Media | 7 (24.1%) | 22 (75.9%) |
| Legal Services & Support | 0 (0.0%) | 0 (0.0%) |
| Education Instruction & Library | 6 (42.9%) | 8 (57.1%) |
| Arts, Media & Entertainment | 0 (0.0%) | 0 (0.0%) |
| Health Diagnosing & Treating | 7 (53.8%) | 6 (46.2%) |
| Health Technologists | 7 (100.0%) | 0 (0.0%) |
| Total (Category) | 62 (45.9%) | 73 (54.1%) |
| Total (Overall) | 176 (43.6%) | 228 (56.4%) |
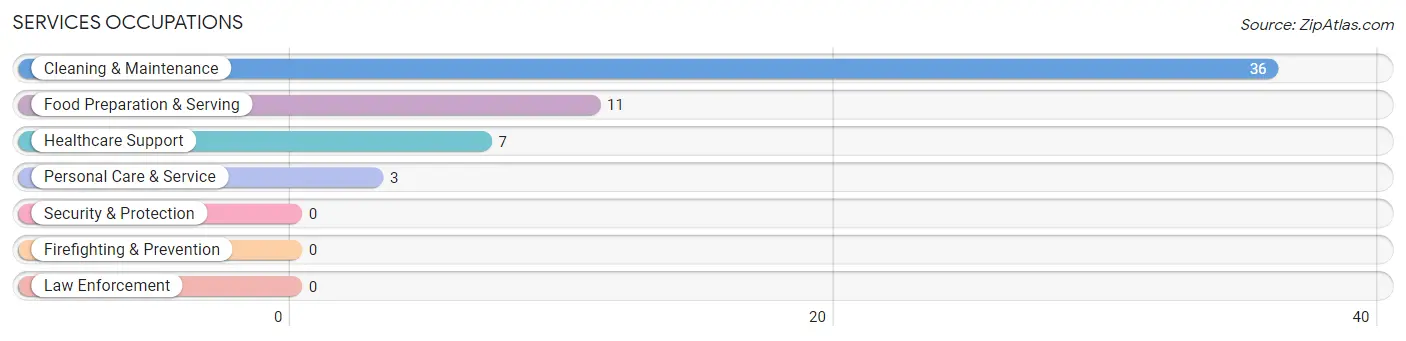
Services Occupations
The most common Services occupations in New Harmony are Cleaning & Maintenance (36 | 8.9%), Food Preparation & Serving (11 | 2.7%), Healthcare Support (7 | 1.7%), and Personal Care & Service (3 | 0.7%).
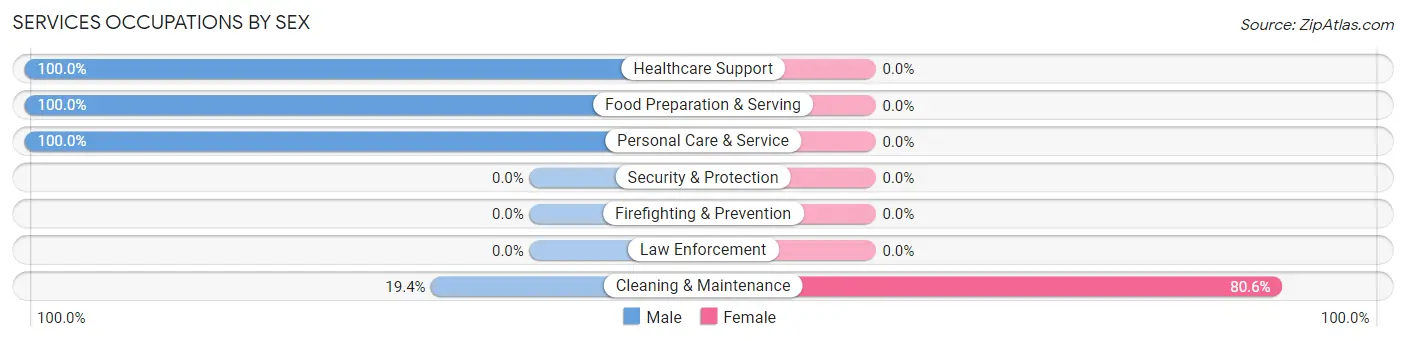
Services Occupations by Sex
| Occupation | Male | Female |
| Healthcare Support | 7 (100.0%) | 0 (0.0%) |
| Security & Protection | 0 (0.0%) | 0 (0.0%) |
| Firefighting & Prevention | 0 (0.0%) | 0 (0.0%) |
| Law Enforcement | 0 (0.0%) | 0 (0.0%) |
| Food Preparation & Serving | 11 (100.0%) | 0 (0.0%) |
| Cleaning & Maintenance | 7 (19.4%) | 29 (80.6%) |
| Personal Care & Service | 3 (100.0%) | 0 (0.0%) |
| Total (Category) | 28 (49.1%) | 29 (50.9%) |
| Total (Overall) | 176 (43.6%) | 228 (56.4%) |
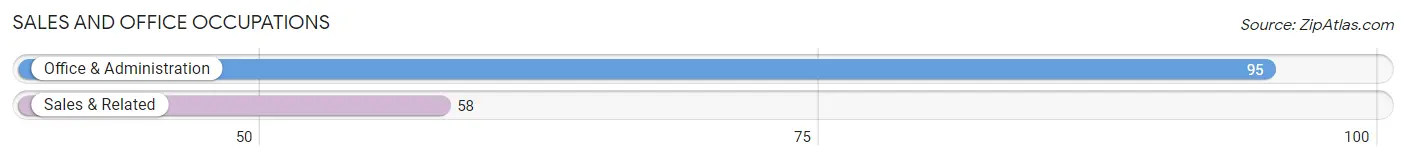
Sales and Office Occupations
The most common Sales and Office occupations in New Harmony are Office & Administration (95 | 23.5%), and Sales & Related (58 | 14.4%).
Sales and Office Occupations by Sex
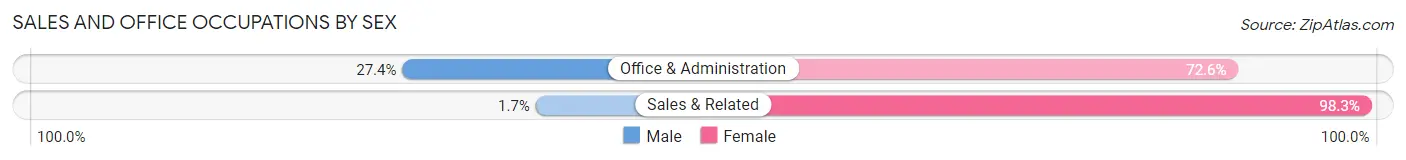
| Occupation | Male | Female |
| Sales & Related | 1 (1.7%) | 57 (98.3%) |
| Office & Administration | 26 (27.4%) | 69 (72.6%) |
| Total (Category) | 27 (17.6%) | 126 (82.4%) |
| Total (Overall) | 176 (43.6%) | 228 (56.4%) |
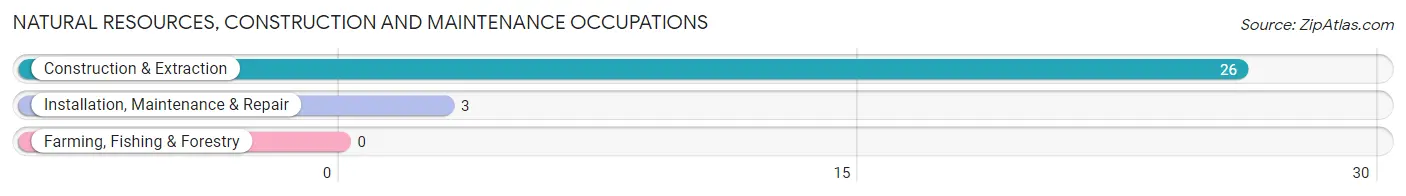
Natural Resources, Construction and Maintenance Occupations
The most common Natural Resources, Construction and Maintenance occupations in New Harmony are Construction & Extraction (26 | 6.4%), and Installation, Maintenance & Repair (3 | 0.7%).
Natural Resources, Construction and Maintenance Occupations by Sex
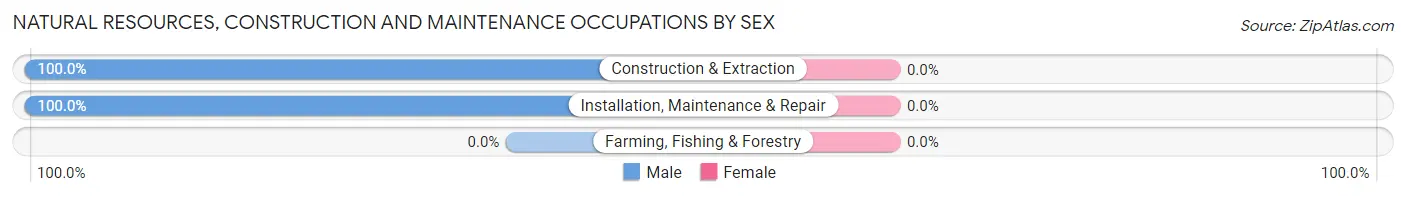
| Occupation | Male | Female |
| Farming, Fishing & Forestry | 0 (0.0%) | 0 (0.0%) |
| Construction & Extraction | 26 (100.0%) | 0 (0.0%) |
| Installation, Maintenance & Repair | 3 (100.0%) | 0 (0.0%) |
| Total (Category) | 29 (100.0%) | 0 (0.0%) |
| Total (Overall) | 176 (43.6%) | 228 (56.4%) |
Production, Transportation and Moving Occupations
The most common Production, Transportation and Moving occupations in New Harmony are Production (25 | 6.2%), and Transportation (5 | 1.2%).
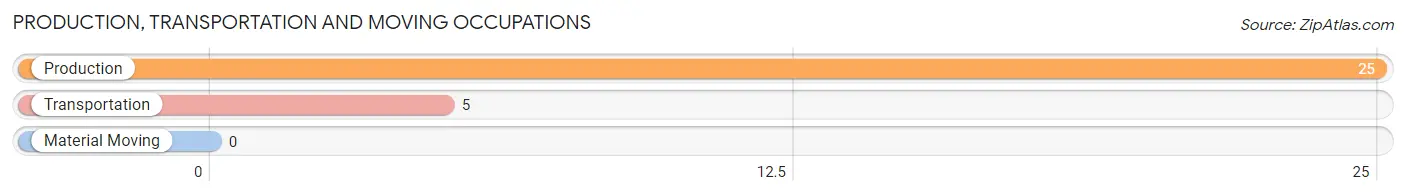
Production, Transportation and Moving Occupations by Sex
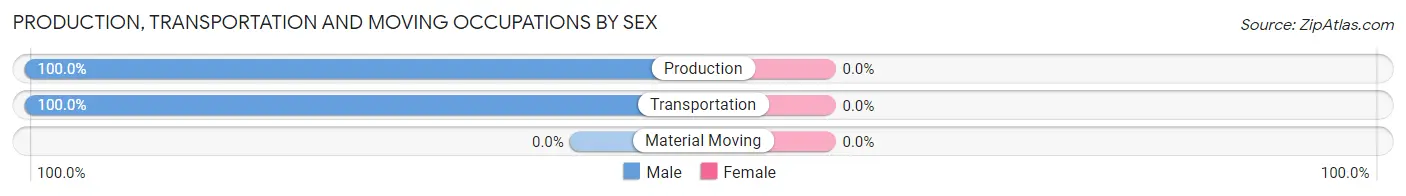
| Occupation | Male | Female |
| Production | 25 (100.0%) | 0 (0.0%) |
| Transportation | 5 (100.0%) | 0 (0.0%) |
| Material Moving | 0 (0.0%) | 0 (0.0%) |
| Total (Category) | 30 (100.0%) | 0 (0.0%) |
| Total (Overall) | 176 (43.6%) | 228 (56.4%) |
Employment Industries by Sex in New Harmony
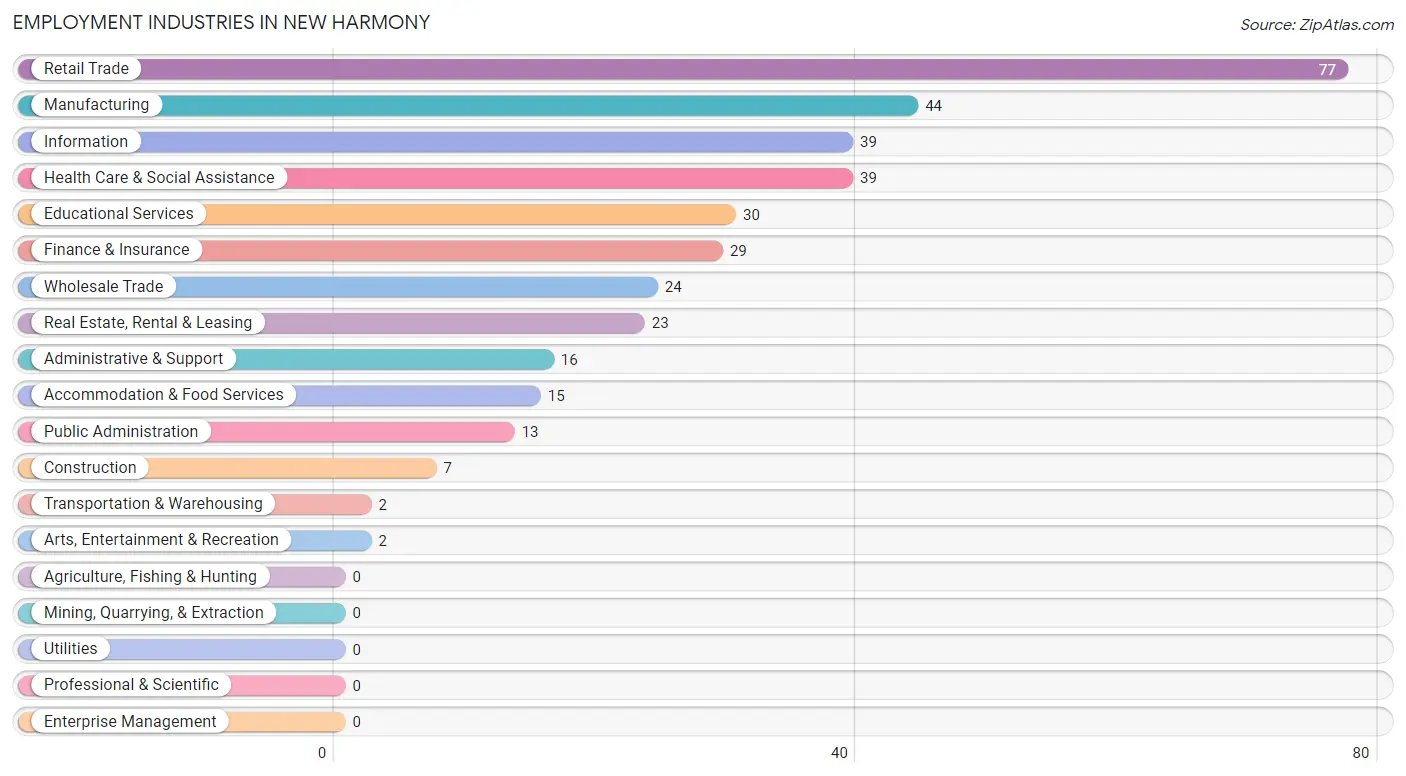
Employment Industries in New Harmony
The major employment industries in New Harmony include Retail Trade (77 | 19.1%), Manufacturing (44 | 10.9%), Information (39 | 9.7%), Health Care & Social Assistance (39 | 9.7%), and Educational Services (30 | 7.4%).
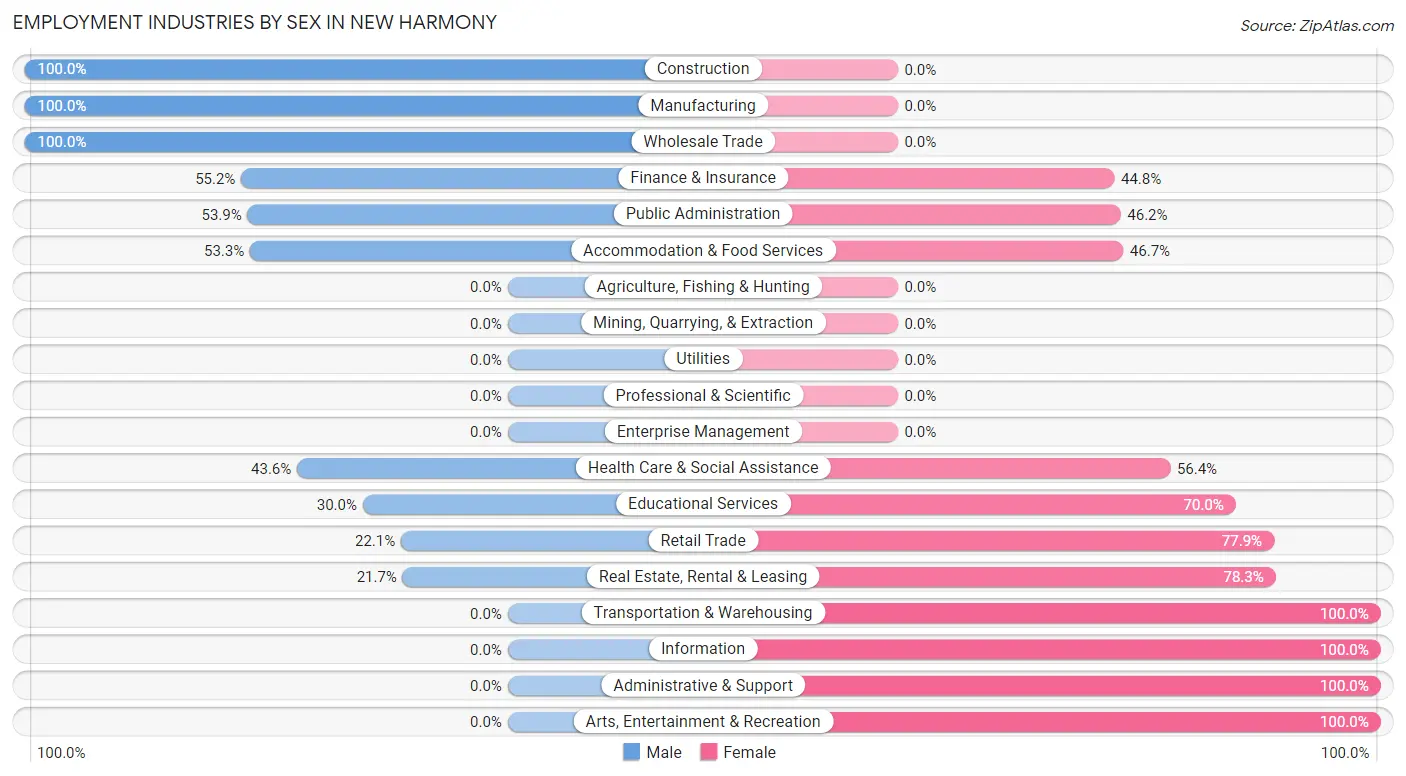
Employment Industries by Sex in New Harmony
The New Harmony industries that see more men than women are Construction (100.0%), Manufacturing (100.0%), and Wholesale Trade (100.0%), whereas the industries that tend to have a higher number of women are Transportation & Warehousing (100.0%), Information (100.0%), and Administrative & Support (100.0%).
| Industry | Male | Female |
| Agriculture, Fishing & Hunting | 0 (0.0%) | 0 (0.0%) |
| Mining, Quarrying, & Extraction | 0 (0.0%) | 0 (0.0%) |
| Construction | 7 (100.0%) | 0 (0.0%) |
| Manufacturing | 44 (100.0%) | 0 (0.0%) |
| Wholesale Trade | 24 (100.0%) | 0 (0.0%) |
| Retail Trade | 17 (22.1%) | 60 (77.9%) |
| Transportation & Warehousing | 0 (0.0%) | 2 (100.0%) |
| Utilities | 0 (0.0%) | 0 (0.0%) |
| Information | 0 (0.0%) | 39 (100.0%) |
| Finance & Insurance | 16 (55.2%) | 13 (44.8%) |
| Real Estate, Rental & Leasing | 5 (21.7%) | 18 (78.3%) |
| Professional & Scientific | 0 (0.0%) | 0 (0.0%) |
| Enterprise Management | 0 (0.0%) | 0 (0.0%) |
| Administrative & Support | 0 (0.0%) | 16 (100.0%) |
| Educational Services | 9 (30.0%) | 21 (70.0%) |
| Health Care & Social Assistance | 17 (43.6%) | 22 (56.4%) |
| Arts, Entertainment & Recreation | 0 (0.0%) | 2 (100.0%) |
| Accommodation & Food Services | 8 (53.3%) | 7 (46.7%) |
| Public Administration | 7 (53.8%) | 6 (46.2%) |
| Total | 176 (43.6%) | 228 (56.4%) |
Education in New Harmony
School Enrollment in New Harmony
The most common levels of schooling among the 68 students in New Harmony are high school (30 | 44.1%), middle school (15 | 22.1%), and college / undergraduate (14 | 20.6%).
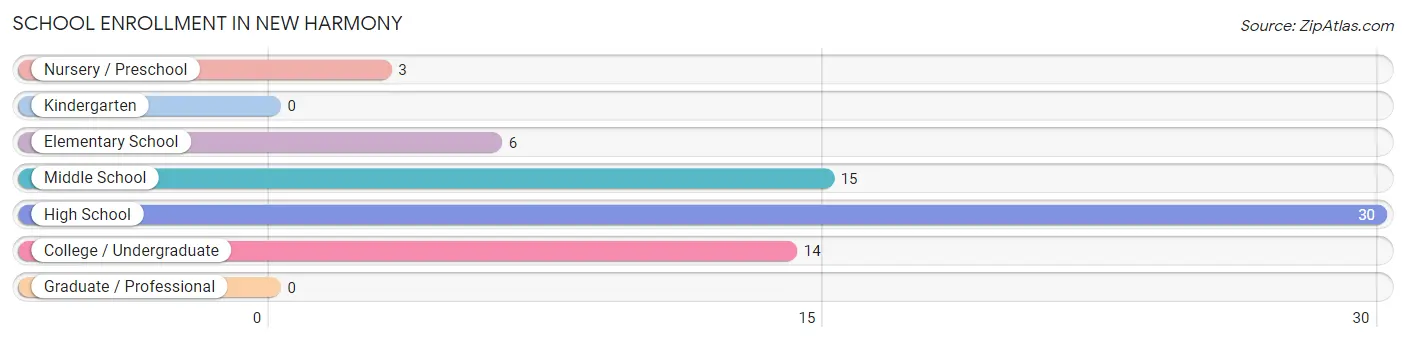
| School Level | # Students | % Students |
| Nursery / Preschool | 3 | 4.4% |
| Kindergarten | 0 | 0.0% |
| Elementary School | 6 | 8.8% |
| Middle School | 15 | 22.1% |
| High School | 30 | 44.1% |
| College / Undergraduate | 14 | 20.6% |
| Graduate / Professional | 0 | 0.0% |
| Total | 68 | 100.0% |
School Enrollment by Age by Funding Source in New Harmony
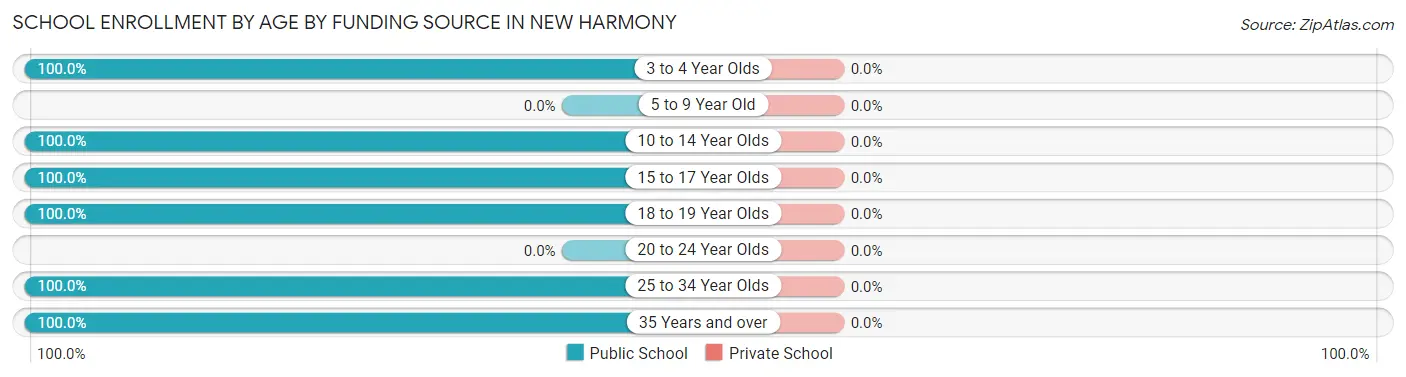
| Age Bracket | Public School | Private School |
| 3 to 4 Year Olds | 3 (100.0%) | 0 (0.0%) |
| 5 to 9 Year Old | 0 (0.0%) | 0 (0.0%) |
| 10 to 14 Year Olds | 21 (100.0%) | 0 (0.0%) |
| 15 to 17 Year Olds | 14 (100.0%) | 0 (0.0%) |
| 18 to 19 Year Olds | 16 (100.0%) | 0 (0.0%) |
| 20 to 24 Year Olds | 0 (0.0%) | 0 (0.0%) |
| 25 to 34 Year Olds | 6 (100.0%) | 0 (0.0%) |
| 35 Years and over | 8 (100.0%) | 0 (0.0%) |
| Total | 68 (100.0%) | 0 (0.0%) |
Educational Attainment by Field of Study in New Harmony
Social sciences (45 | 15.1%), arts & humanities (44 | 14.8%), visual & performing arts (41 | 13.8%), education (39 | 13.1%), and business (26 | 8.7%) are the most common fields of study among 298 individuals in New Harmony who have obtained a bachelor's degree or higher.
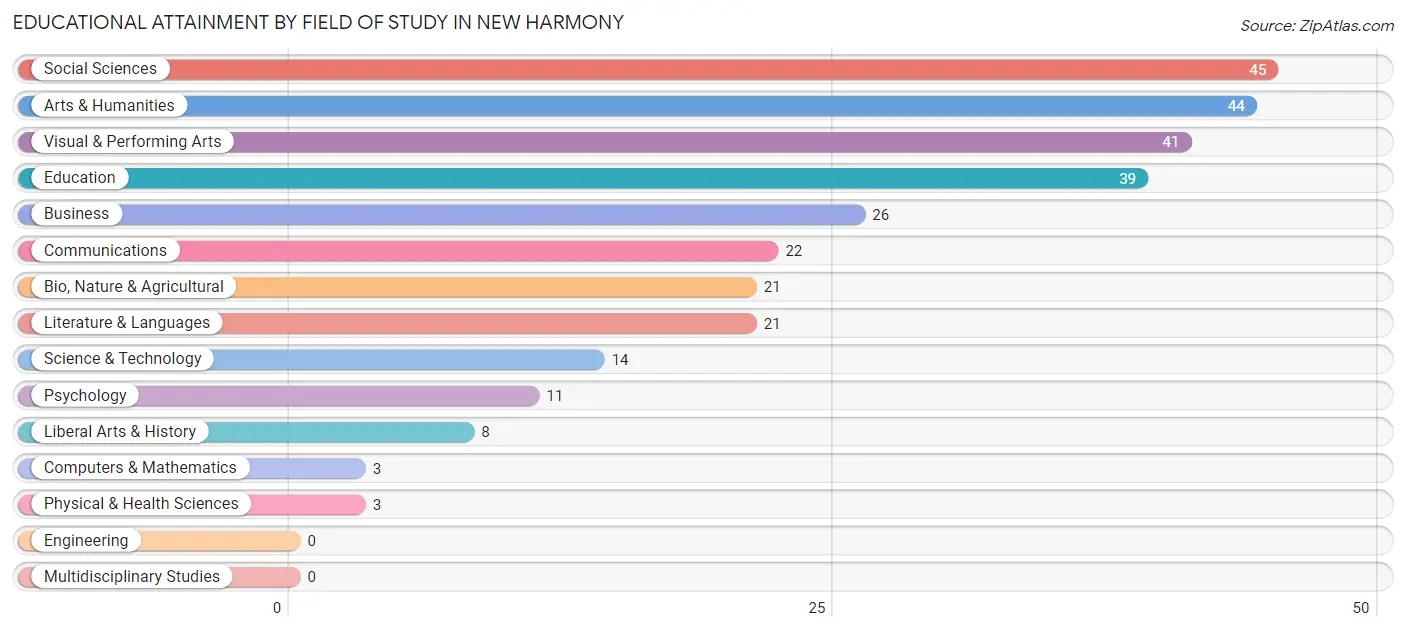
| Field of Study | # Graduates | % Graduates |
| Computers & Mathematics | 3 | 1.0% |
| Bio, Nature & Agricultural | 21 | 7.0% |
| Physical & Health Sciences | 3 | 1.0% |
| Psychology | 11 | 3.7% |
| Social Sciences | 45 | 15.1% |
| Engineering | 0 | 0.0% |
| Multidisciplinary Studies | 0 | 0.0% |
| Science & Technology | 14 | 4.7% |
| Business | 26 | 8.7% |
| Education | 39 | 13.1% |
| Literature & Languages | 21 | 7.0% |
| Liberal Arts & History | 8 | 2.7% |
| Visual & Performing Arts | 41 | 13.8% |
| Communications | 22 | 7.4% |
| Arts & Humanities | 44 | 14.8% |
| Total | 298 | 100.0% |
Transportation & Commute in New Harmony
Vehicle Availability by Sex in New Harmony
The most prevalent vehicle ownership categories in New Harmony are males with 4 vehicles (56, accounting for 31.8%) and females with 4 vehicles (101, making up 24.6%).
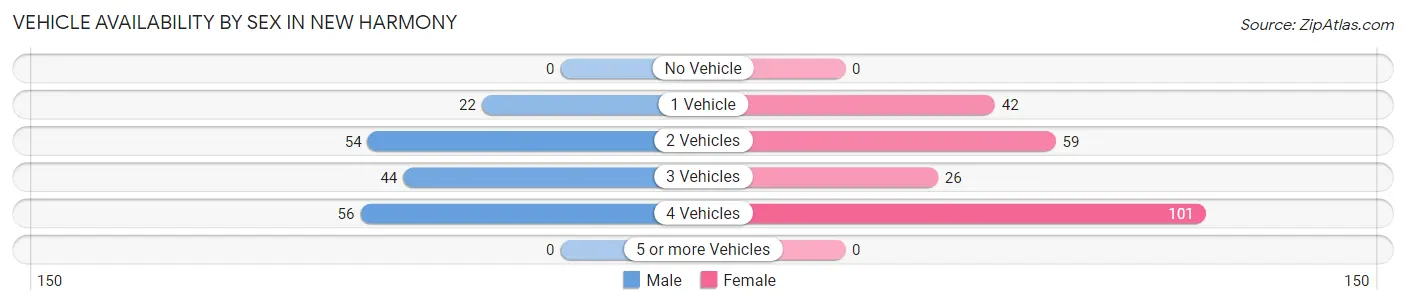
| Vehicles Available | Male | Female |
| No Vehicle | 0 (0.0%) | 0 (0.0%) |
| 1 Vehicle | 22 (12.5%) | 42 (18.4%) |
| 2 Vehicles | 54 (30.7%) | 59 (25.9%) |
| 3 Vehicles | 44 (25.0%) | 26 (11.4%) |
| 4 Vehicles | 56 (31.8%) | 101 (44.3%) |
| 5 or more Vehicles | 0 (0.0%) | 0 (0.0%) |
| Total | 176 (100.0%) | 228 (100.0%) |
Commute Time in New Harmony
The most frequently occuring commute durations in New Harmony are 20 to 24 minutes (72 commuters, 17.9%), 5 to 9 minutes (64 commuters, 15.9%), and 45 to 59 minutes (58 commuters, 14.4%).
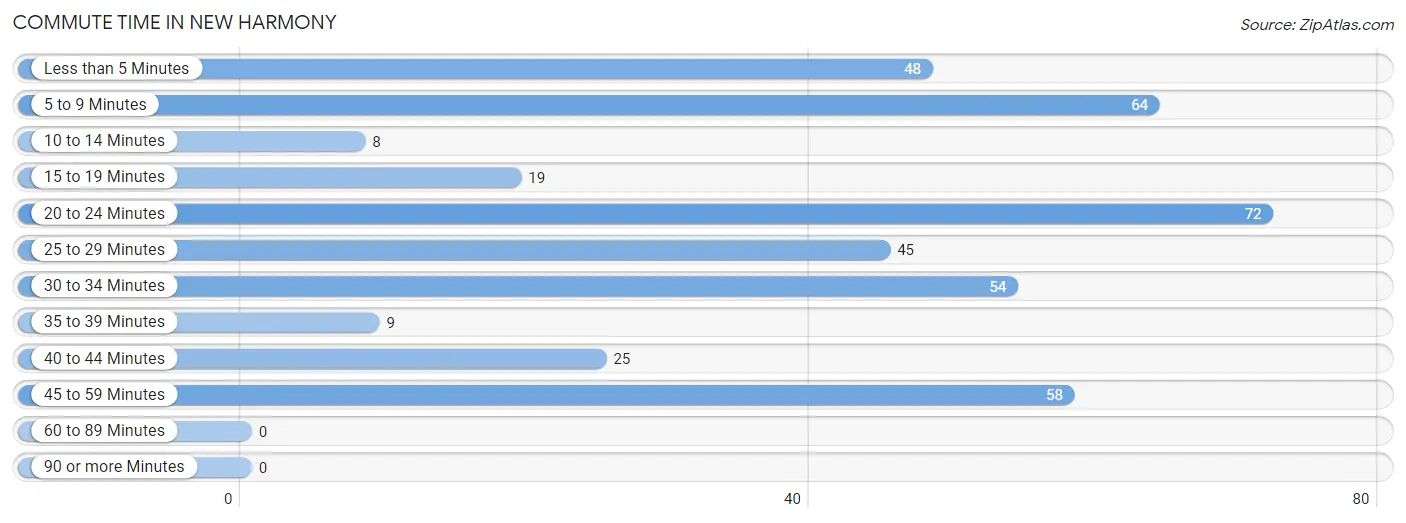
| Commute Time | # Commuters | % Commuters |
| Less than 5 Minutes | 48 | 11.9% |
| 5 to 9 Minutes | 64 | 15.9% |
| 10 to 14 Minutes | 8 | 2.0% |
| 15 to 19 Minutes | 19 | 4.7% |
| 20 to 24 Minutes | 72 | 17.9% |
| 25 to 29 Minutes | 45 | 11.2% |
| 30 to 34 Minutes | 54 | 13.4% |
| 35 to 39 Minutes | 9 | 2.2% |
| 40 to 44 Minutes | 25 | 6.2% |
| 45 to 59 Minutes | 58 | 14.4% |
| 60 to 89 Minutes | 0 | 0.0% |
| 90 or more Minutes | 0 | 0.0% |
Commute Time by Sex in New Harmony
The most common commute times in New Harmony are 20 to 24 minutes (50 commuters, 28.7%) for males and 5 to 9 minutes (52 commuters, 22.8%) for females.
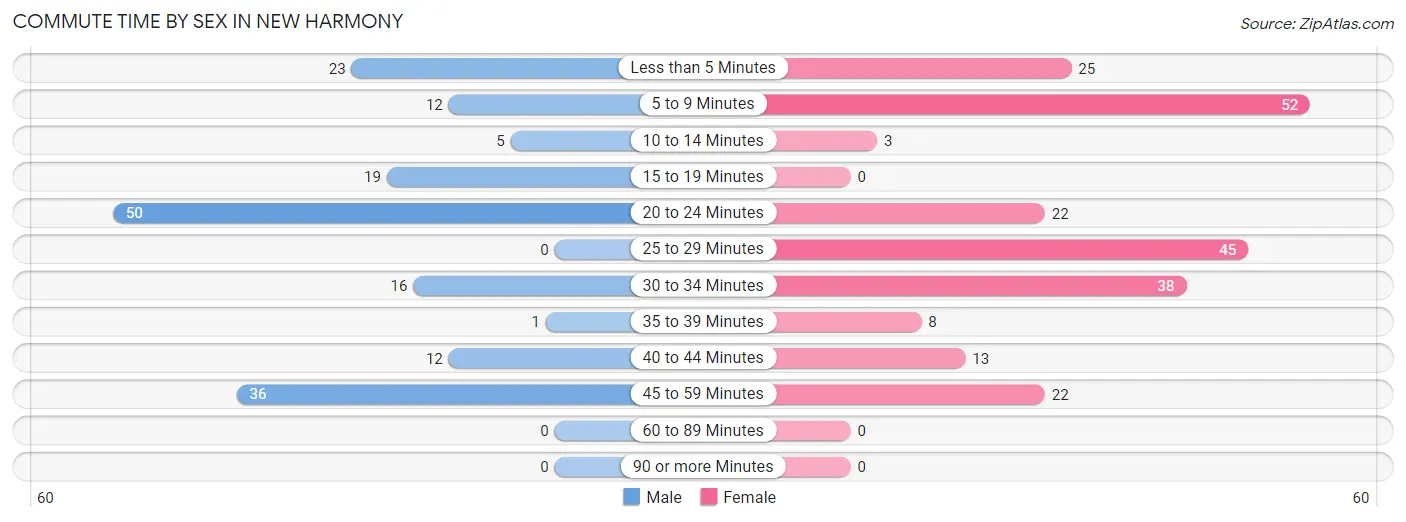
| Commute Time | Male | Female |
| Less than 5 Minutes | 23 (13.2%) | 25 (11.0%) |
| 5 to 9 Minutes | 12 (6.9%) | 52 (22.8%) |
| 10 to 14 Minutes | 5 (2.9%) | 3 (1.3%) |
| 15 to 19 Minutes | 19 (10.9%) | 0 (0.0%) |
| 20 to 24 Minutes | 50 (28.7%) | 22 (9.7%) |
| 25 to 29 Minutes | 0 (0.0%) | 45 (19.7%) |
| 30 to 34 Minutes | 16 (9.2%) | 38 (16.7%) |
| 35 to 39 Minutes | 1 (0.6%) | 8 (3.5%) |
| 40 to 44 Minutes | 12 (6.9%) | 13 (5.7%) |
| 45 to 59 Minutes | 36 (20.7%) | 22 (9.7%) |
| 60 to 89 Minutes | 0 (0.0%) | 0 (0.0%) |
| 90 or more Minutes | 0 (0.0%) | 0 (0.0%) |
Time of Departure to Work by Sex in New Harmony
The most frequent times of departure to work in New Harmony are 5:30 AM to 5:59 AM (33, 19.0%) for males and 8:00 AM to 8:29 AM (79, 34.6%) for females.
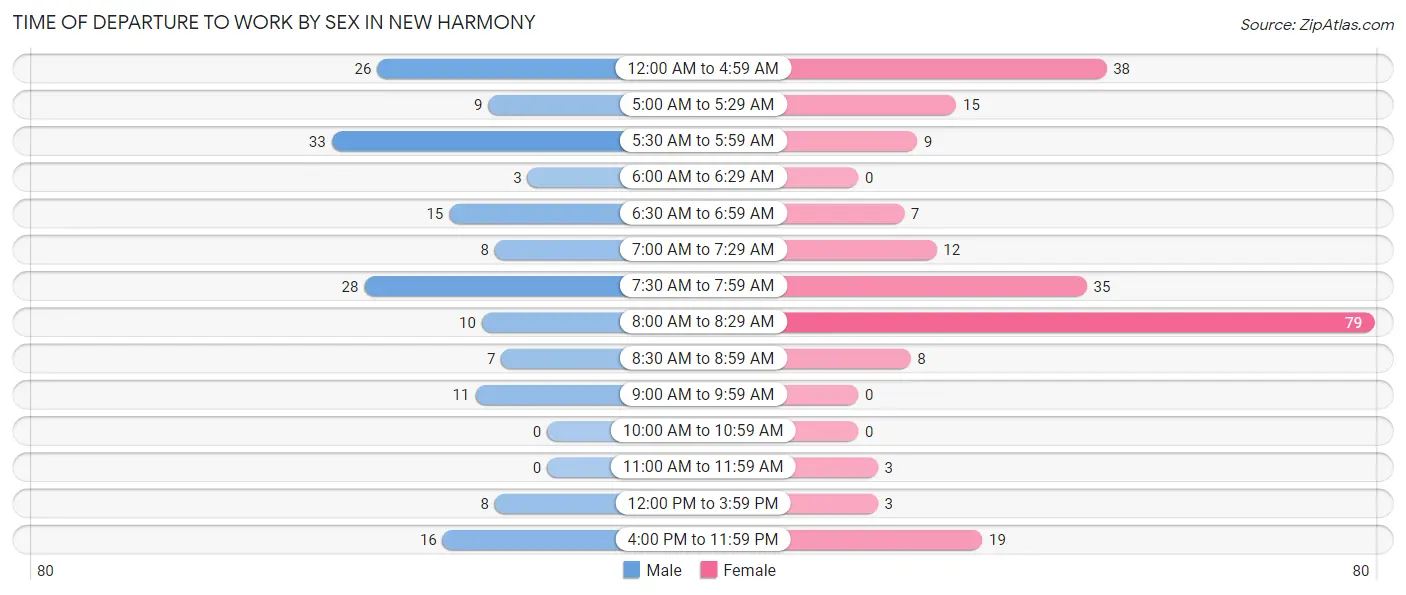
| Time of Departure | Male | Female |
| 12:00 AM to 4:59 AM | 26 (14.9%) | 38 (16.7%) |
| 5:00 AM to 5:29 AM | 9 (5.2%) | 15 (6.6%) |
| 5:30 AM to 5:59 AM | 33 (19.0%) | 9 (4.0%) |
| 6:00 AM to 6:29 AM | 3 (1.7%) | 0 (0.0%) |
| 6:30 AM to 6:59 AM | 15 (8.6%) | 7 (3.1%) |
| 7:00 AM to 7:29 AM | 8 (4.6%) | 12 (5.3%) |
| 7:30 AM to 7:59 AM | 28 (16.1%) | 35 (15.3%) |
| 8:00 AM to 8:29 AM | 10 (5.8%) | 79 (34.6%) |
| 8:30 AM to 8:59 AM | 7 (4.0%) | 8 (3.5%) |
| 9:00 AM to 9:59 AM | 11 (6.3%) | 0 (0.0%) |
| 10:00 AM to 10:59 AM | 0 (0.0%) | 0 (0.0%) |
| 11:00 AM to 11:59 AM | 0 (0.0%) | 3 (1.3%) |
| 12:00 PM to 3:59 PM | 8 (4.6%) | 3 (1.3%) |
| 4:00 PM to 11:59 PM | 16 (9.2%) | 19 (8.3%) |
| Total | 174 (100.0%) | 228 (100.0%) |
Housing Occupancy in New Harmony
Occupancy by Ownership in New Harmony
Of the total 334 dwellings in New Harmony, owner-occupied units account for 226 (67.7%), while renter-occupied units make up 108 (32.3%).
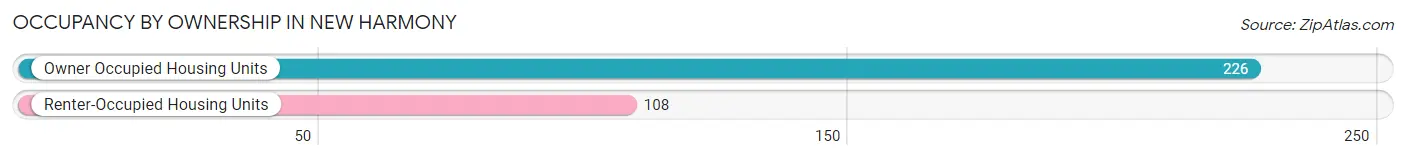
| Occupancy | # Housing Units | % Housing Units |
| Owner Occupied Housing Units | 226 | 67.7% |
| Renter-Occupied Housing Units | 108 | 32.3% |
| Total Occupied Housing Units | 334 | 100.0% |
Occupancy by Household Size in New Harmony
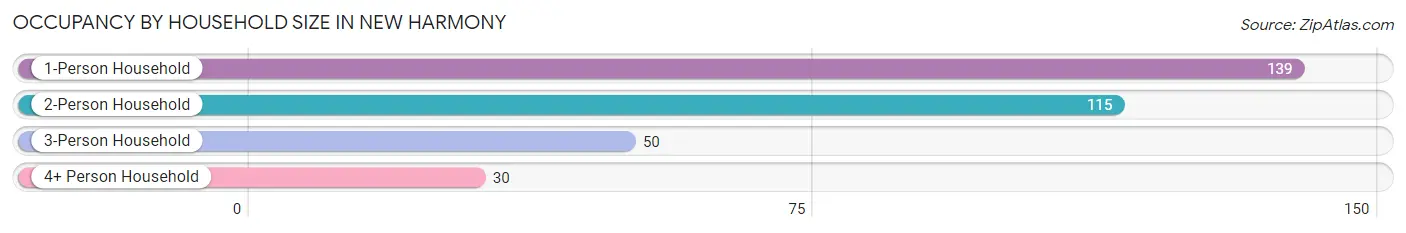
| Household Size | # Housing Units | % Housing Units |
| 1-Person Household | 139 | 41.6% |
| 2-Person Household | 115 | 34.4% |
| 3-Person Household | 50 | 15.0% |
| 4+ Person Household | 30 | 9.0% |
| Total Housing Units | 334 | 100.0% |
Occupancy by Ownership by Household Size in New Harmony
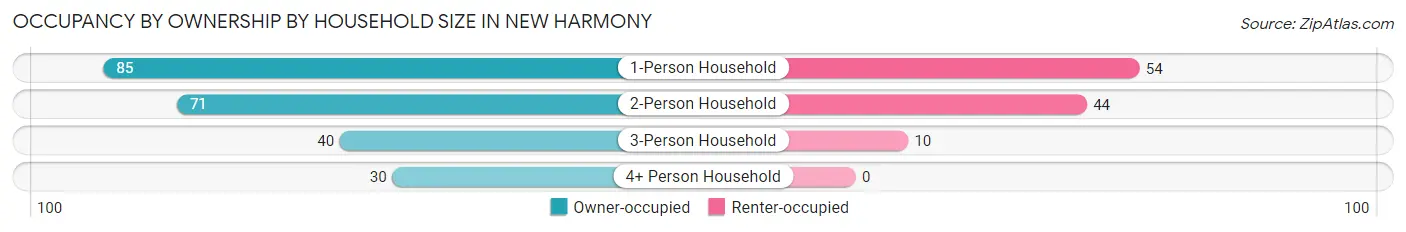
| Household Size | Owner-occupied | Renter-occupied |
| 1-Person Household | 85 (61.2%) | 54 (38.9%) |
| 2-Person Household | 71 (61.7%) | 44 (38.3%) |
| 3-Person Household | 40 (80.0%) | 10 (20.0%) |
| 4+ Person Household | 30 (100.0%) | 0 (0.0%) |
| Total Housing Units | 226 (67.7%) | 108 (32.3%) |
Occupancy by Educational Attainment in New Harmony
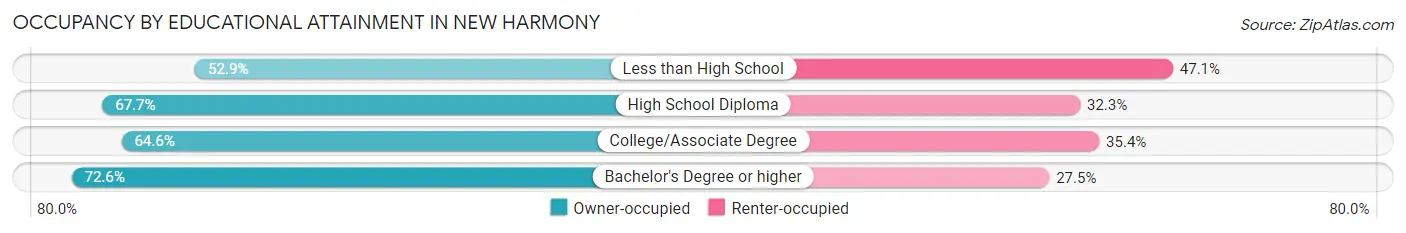
| Household Size | Owner-occupied | Renter-occupied |
| Less than High School | 9 (52.9%) | 8 (47.1%) |
| High School Diploma | 90 (67.7%) | 43 (32.3%) |
| College/Associate Degree | 53 (64.6%) | 29 (35.4%) |
| Bachelor's Degree or higher | 74 (72.6%) | 28 (27.5%) |
Occupancy by Age of Householder in New Harmony
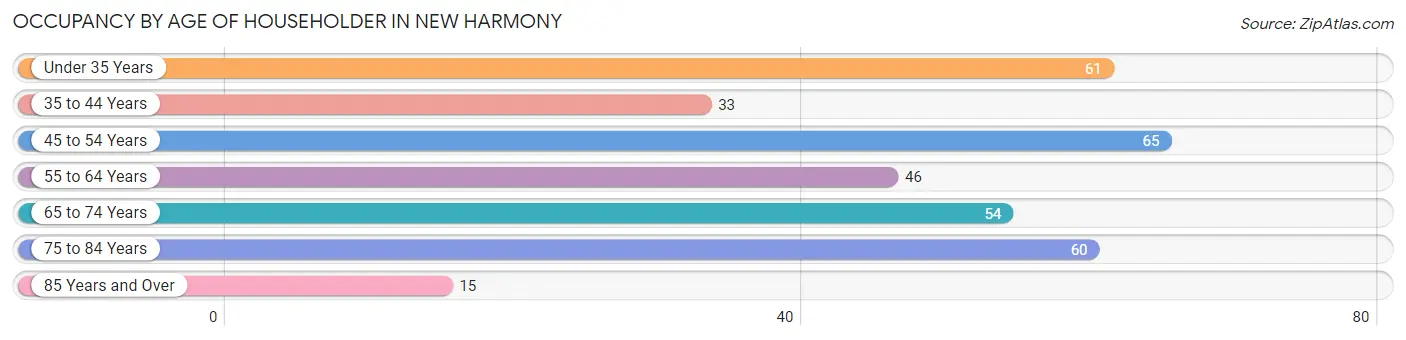
| Age Bracket | # Households | % Households |
| Under 35 Years | 61 | 18.3% |
| 35 to 44 Years | 33 | 9.9% |
| 45 to 54 Years | 65 | 19.5% |
| 55 to 64 Years | 46 | 13.8% |
| 65 to 74 Years | 54 | 16.2% |
| 75 to 84 Years | 60 | 18.0% |
| 85 Years and Over | 15 | 4.5% |
| Total | 334 | 100.0% |
Housing Finances in New Harmony
Median Income by Occupancy in New Harmony
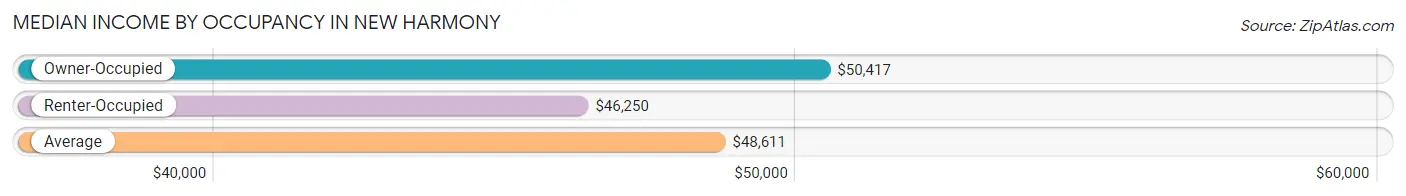
| Occupancy Type | # Households | Median Income |
| Owner-Occupied | 226 (67.7%) | $50,417 |
| Renter-Occupied | 108 (32.3%) | $46,250 |
| Average | 334 (100.0%) | $48,611 |
Occupancy by Householder Income Bracket in New Harmony
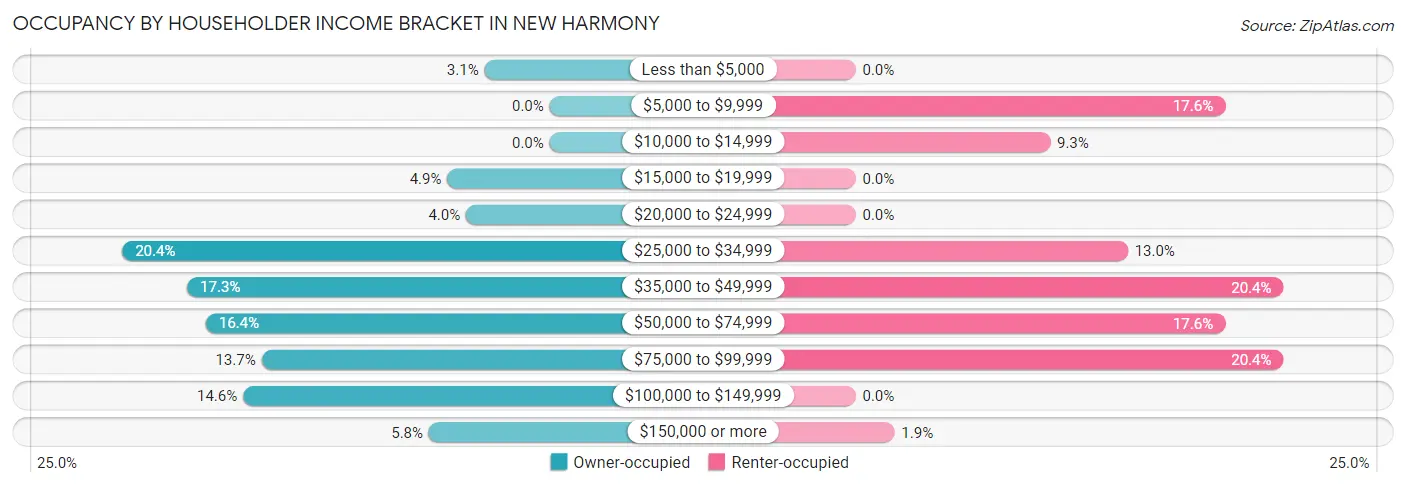
| Income Bracket | Owner-occupied | Renter-occupied |
| Less than $5,000 | 7 (3.1%) | 0 (0.0%) |
| $5,000 to $9,999 | 0 (0.0%) | 19 (17.6%) |
| $10,000 to $14,999 | 0 (0.0%) | 10 (9.3%) |
| $15,000 to $19,999 | 11 (4.9%) | 0 (0.0%) |
| $20,000 to $24,999 | 9 (4.0%) | 0 (0.0%) |
| $25,000 to $34,999 | 46 (20.3%) | 14 (13.0%) |
| $35,000 to $49,999 | 39 (17.3%) | 22 (20.4%) |
| $50,000 to $74,999 | 37 (16.4%) | 19 (17.6%) |
| $75,000 to $99,999 | 31 (13.7%) | 22 (20.4%) |
| $100,000 to $149,999 | 33 (14.6%) | 0 (0.0%) |
| $150,000 or more | 13 (5.8%) | 2 (1.8%) |
| Total | 226 (100.0%) | 108 (100.0%) |
Monthly Housing Cost Tiers in New Harmony
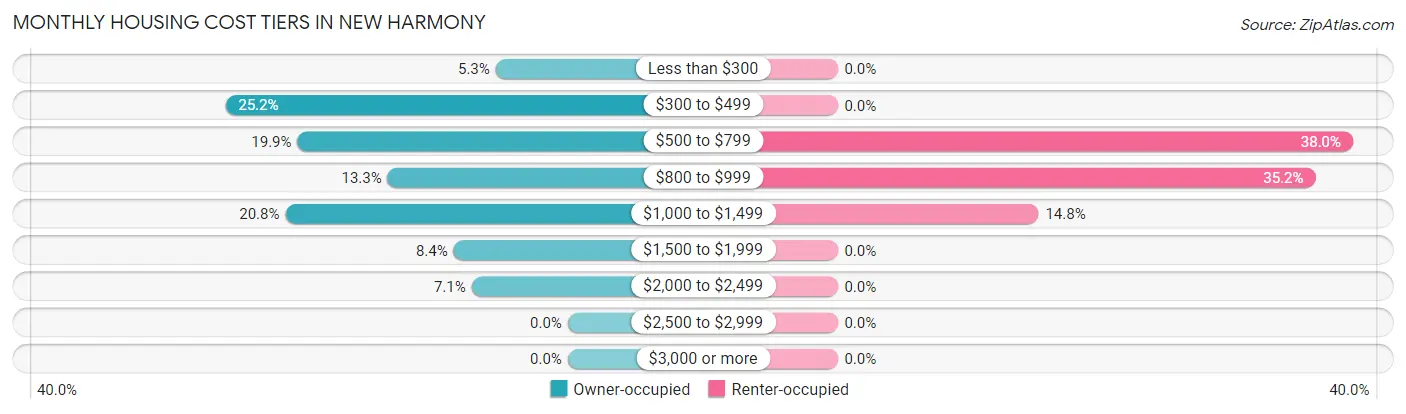
| Monthly Cost | Owner-occupied | Renter-occupied |
| Less than $300 | 12 (5.3%) | 0 (0.0%) |
| $300 to $499 | 57 (25.2%) | 0 (0.0%) |
| $500 to $799 | 45 (19.9%) | 41 (38.0%) |
| $800 to $999 | 30 (13.3%) | 38 (35.2%) |
| $1,000 to $1,499 | 47 (20.8%) | 16 (14.8%) |
| $1,500 to $1,999 | 19 (8.4%) | 0 (0.0%) |
| $2,000 to $2,499 | 16 (7.1%) | 0 (0.0%) |
| $2,500 to $2,999 | 0 (0.0%) | 0 (0.0%) |
| $3,000 or more | 0 (0.0%) | 0 (0.0%) |
| Total | 226 (100.0%) | 108 (100.0%) |
Physical Housing Characteristics in New Harmony
Housing Structures in New Harmony
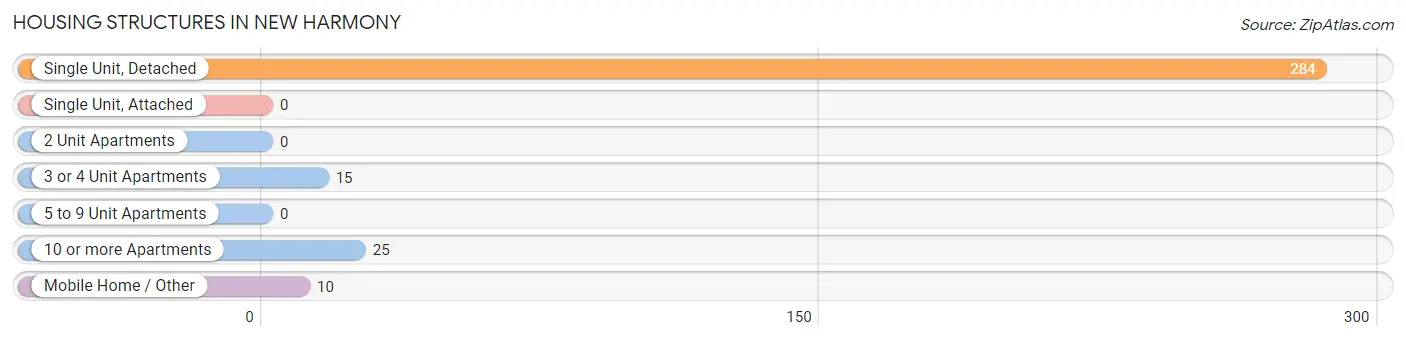
| Structure Type | # Housing Units | % Housing Units |
| Single Unit, Detached | 284 | 85.0% |
| Single Unit, Attached | 0 | 0.0% |
| 2 Unit Apartments | 0 | 0.0% |
| 3 or 4 Unit Apartments | 15 | 4.5% |
| 5 to 9 Unit Apartments | 0 | 0.0% |
| 10 or more Apartments | 25 | 7.5% |
| Mobile Home / Other | 10 | 3.0% |
| Total | 334 | 100.0% |
Housing Structures by Occupancy in New Harmony
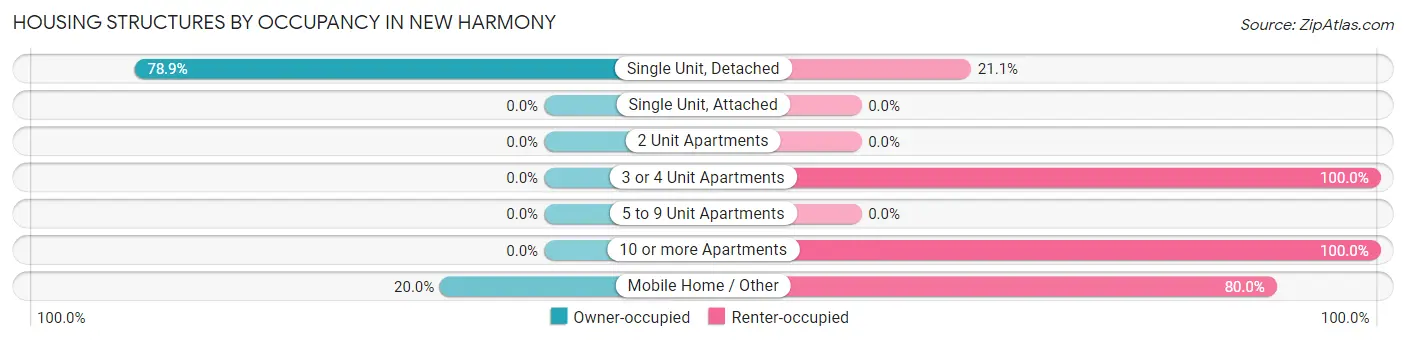
| Structure Type | Owner-occupied | Renter-occupied |
| Single Unit, Detached | 224 (78.9%) | 60 (21.1%) |
| Single Unit, Attached | 0 (0.0%) | 0 (0.0%) |
| 2 Unit Apartments | 0 (0.0%) | 0 (0.0%) |
| 3 or 4 Unit Apartments | 0 (0.0%) | 15 (100.0%) |
| 5 to 9 Unit Apartments | 0 (0.0%) | 0 (0.0%) |
| 10 or more Apartments | 0 (0.0%) | 25 (100.0%) |
| Mobile Home / Other | 2 (20.0%) | 8 (80.0%) |
| Total | 226 (67.7%) | 108 (32.3%) |
Housing Structures by Number of Rooms in New Harmony
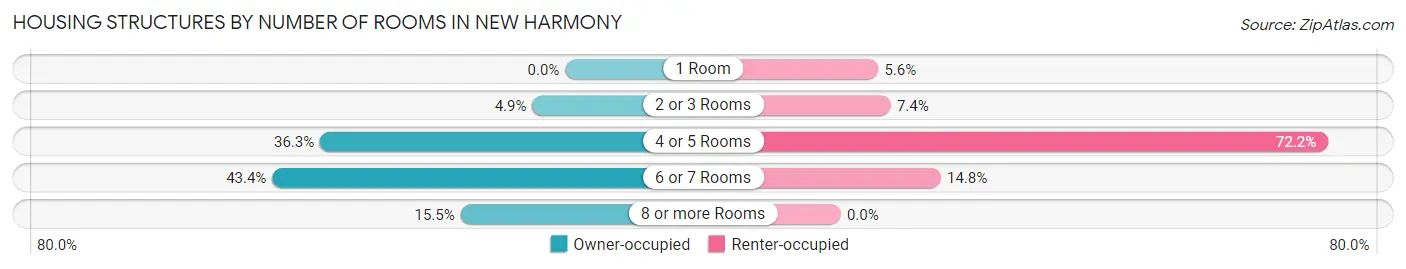
| Number of Rooms | Owner-occupied | Renter-occupied |
| 1 Room | 0 (0.0%) | 6 (5.6%) |
| 2 or 3 Rooms | 11 (4.9%) | 8 (7.4%) |
| 4 or 5 Rooms | 82 (36.3%) | 78 (72.2%) |
| 6 or 7 Rooms | 98 (43.4%) | 16 (14.8%) |
| 8 or more Rooms | 35 (15.5%) | 0 (0.0%) |
| Total | 226 (100.0%) | 108 (100.0%) |
Housing Structure by Heating Type in New Harmony
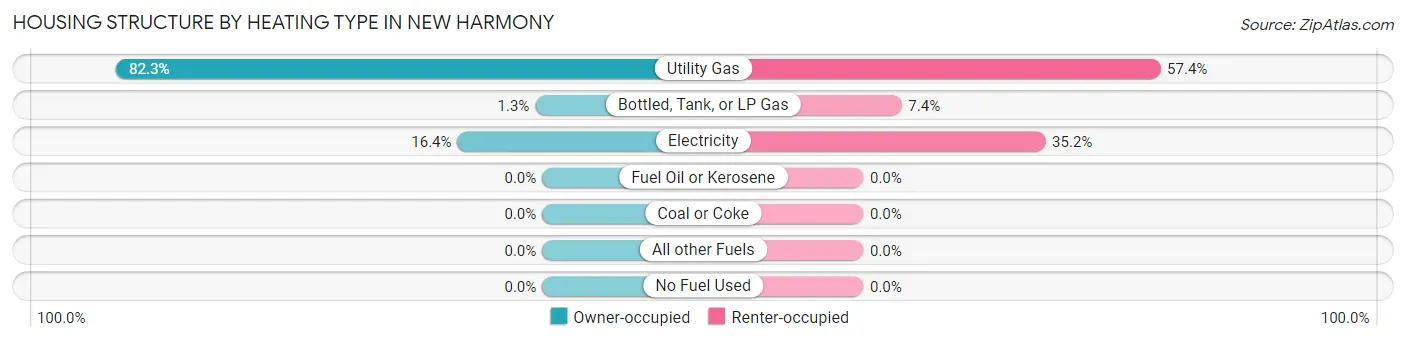
| Heating Type | Owner-occupied | Renter-occupied |
| Utility Gas | 186 (82.3%) | 62 (57.4%) |
| Bottled, Tank, or LP Gas | 3 (1.3%) | 8 (7.4%) |
| Electricity | 37 (16.4%) | 38 (35.2%) |
| Fuel Oil or Kerosene | 0 (0.0%) | 0 (0.0%) |
| Coal or Coke | 0 (0.0%) | 0 (0.0%) |
| All other Fuels | 0 (0.0%) | 0 (0.0%) |
| No Fuel Used | 0 (0.0%) | 0 (0.0%) |
| Total | 226 (100.0%) | 108 (100.0%) |
Household Vehicle Usage in New Harmony
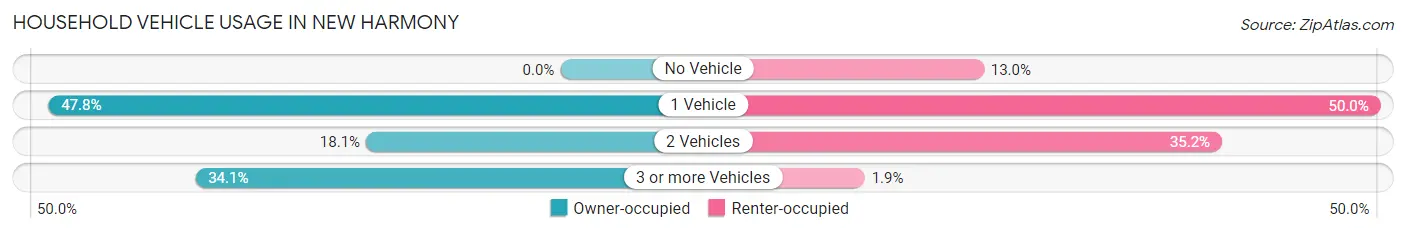
| Vehicles per Household | Owner-occupied | Renter-occupied |
| No Vehicle | 0 (0.0%) | 14 (13.0%) |
| 1 Vehicle | 108 (47.8%) | 54 (50.0%) |
| 2 Vehicles | 41 (18.1%) | 38 (35.2%) |
| 3 or more Vehicles | 77 (34.1%) | 2 (1.8%) |
| Total | 226 (100.0%) | 108 (100.0%) |
Real Estate & Mortgages in New Harmony
Real Estate and Mortgage Overview in New Harmony
| Characteristic | Without Mortgage | With Mortgage |
| Housing Units | 98 | 128 |
| Median Property Value | $175,900 | $164,000 |
| Median Household Income | $36,786 | $11 |
| Monthly Housing Costs | $457 | $0 |
| Real Estate Taxes | $1,000 | $0 |
Property Value by Mortgage Status in New Harmony
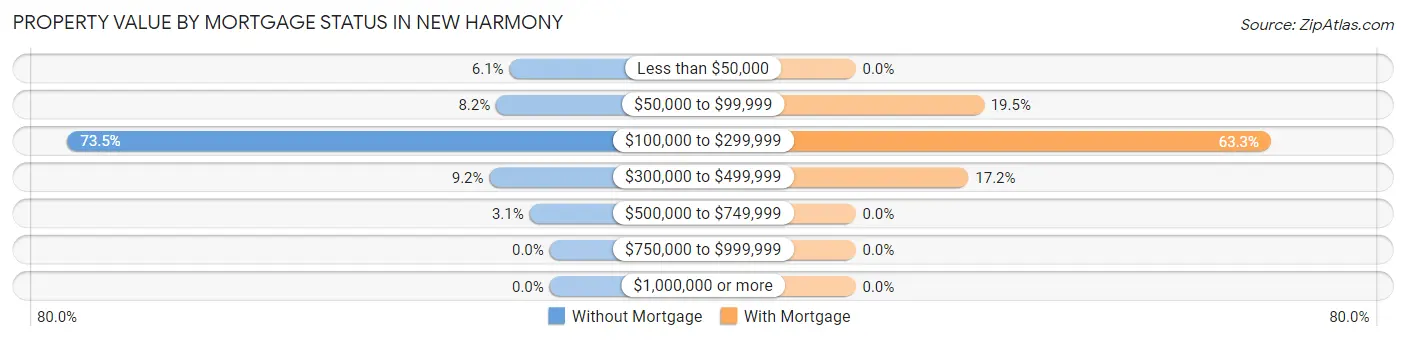
| Property Value | Without Mortgage | With Mortgage |
| Less than $50,000 | 6 (6.1%) | 0 (0.0%) |
| $50,000 to $99,999 | 8 (8.2%) | 25 (19.5%) |
| $100,000 to $299,999 | 72 (73.5%) | 81 (63.3%) |
| $300,000 to $499,999 | 9 (9.2%) | 22 (17.2%) |
| $500,000 to $749,999 | 3 (3.1%) | 0 (0.0%) |
| $750,000 to $999,999 | 0 (0.0%) | 0 (0.0%) |
| $1,000,000 or more | 0 (0.0%) | 0 (0.0%) |
| Total | 98 (100.0%) | 128 (100.0%) |
Household Income by Mortgage Status in New Harmony
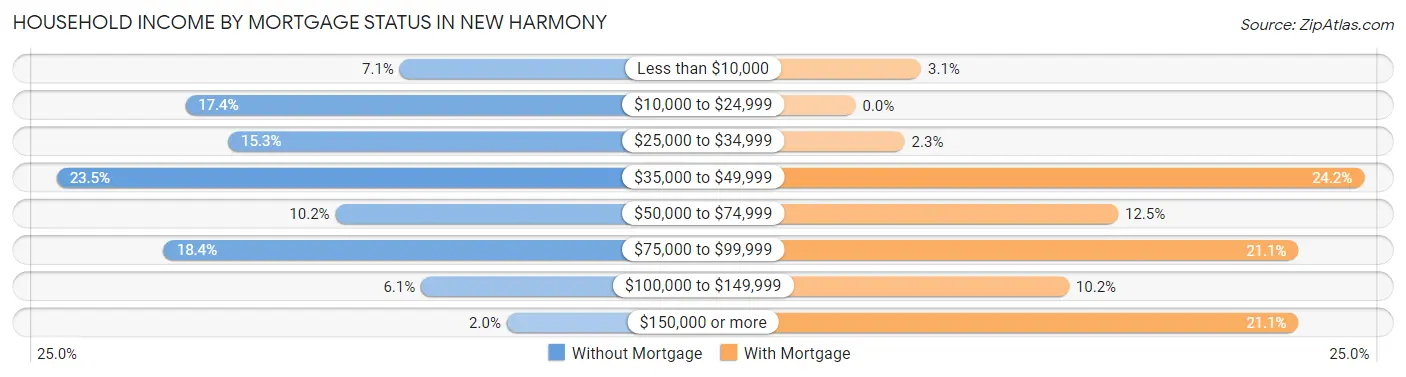
| Household Income | Without Mortgage | With Mortgage |
| Less than $10,000 | 7 (7.1%) | 4 (3.1%) |
| $10,000 to $24,999 | 17 (17.3%) | 0 (0.0%) |
| $25,000 to $34,999 | 15 (15.3%) | 3 (2.3%) |
| $35,000 to $49,999 | 23 (23.5%) | 31 (24.2%) |
| $50,000 to $74,999 | 10 (10.2%) | 16 (12.5%) |
| $75,000 to $99,999 | 18 (18.4%) | 27 (21.1%) |
| $100,000 to $149,999 | 6 (6.1%) | 13 (10.2%) |
| $150,000 or more | 2 (2.0%) | 27 (21.1%) |
| Total | 98 (100.0%) | 128 (100.0%) |
Property Value to Household Income Ratio in New Harmony
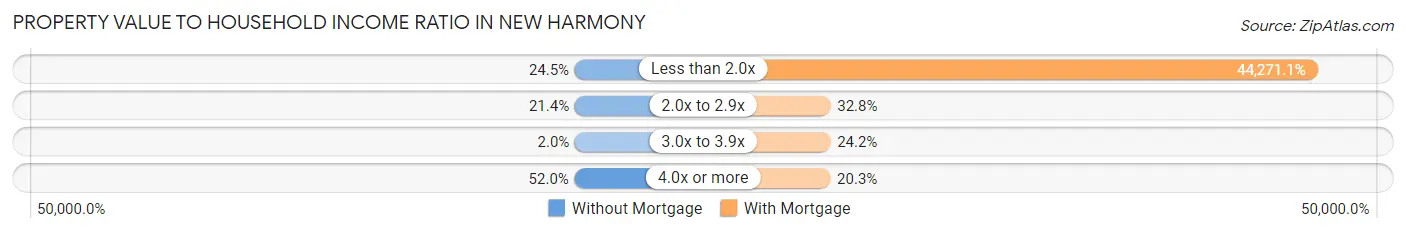
| Value-to-Income Ratio | Without Mortgage | With Mortgage |
| Less than 2.0x | 24 (24.5%) | 56,667 (44,271.1%) |
| 2.0x to 2.9x | 21 (21.4%) | 42 (32.8%) |
| 3.0x to 3.9x | 2 (2.0%) | 31 (24.2%) |
| 4.0x or more | 51 (52.0%) | 26 (20.3%) |
| Total | 98 (100.0%) | 128 (100.0%) |
Real Estate Taxes by Mortgage Status in New Harmony
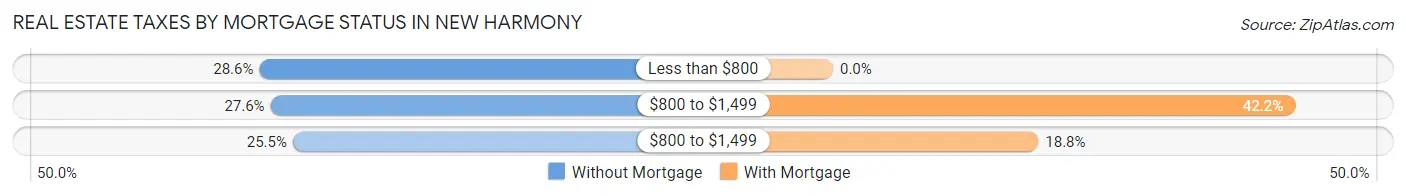
| Property Taxes | Without Mortgage | With Mortgage |
| Less than $800 | 28 (28.6%) | 0 (0.0%) |
| $800 to $1,499 | 27 (27.6%) | 54 (42.2%) |
| $800 to $1,499 | 25 (25.5%) | 24 (18.8%) |
| Total | 98 (100.0%) | 128 (100.0%) |
Health & Disability in New Harmony
Health Insurance Coverage by Age in New Harmony
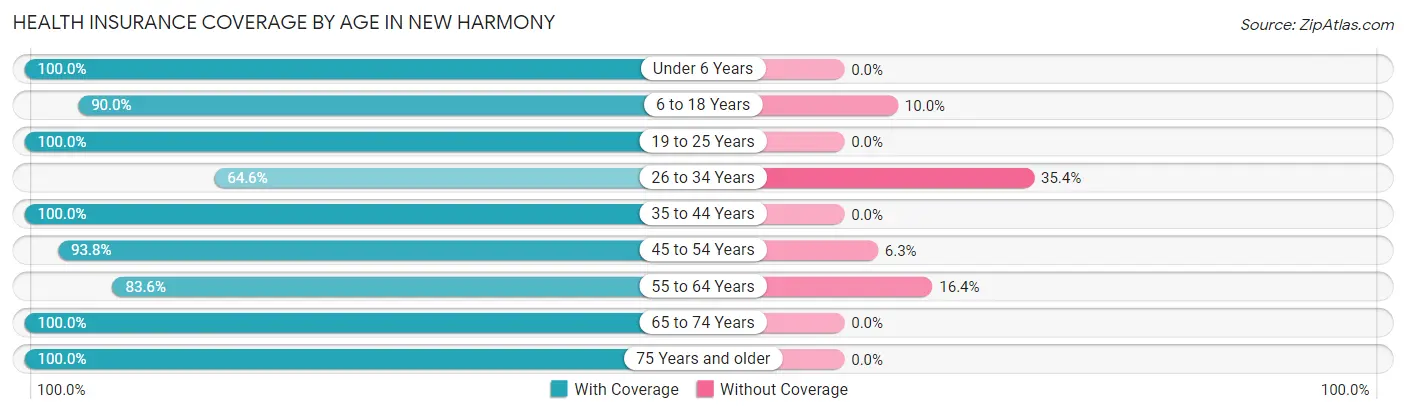
| Age Bracket | With Coverage | Without Coverage |
| Under 6 Years | 24 (100.0%) | 0 (0.0%) |
| 6 to 18 Years | 63 (90.0%) | 7 (10.0%) |
| 19 to 25 Years | 37 (100.0%) | 0 (0.0%) |
| 26 to 34 Years | 115 (64.6%) | 63 (35.4%) |
| 35 to 44 Years | 64 (100.0%) | 0 (0.0%) |
| 45 to 54 Years | 90 (93.8%) | 6 (6.2%) |
| 55 to 64 Years | 56 (83.6%) | 11 (16.4%) |
| 65 to 74 Years | 105 (100.0%) | 0 (0.0%) |
| 75 Years and older | 81 (100.0%) | 0 (0.0%) |
| Total | 635 (87.9%) | 87 (12.0%) |
Health Insurance Coverage by Citizenship Status in New Harmony
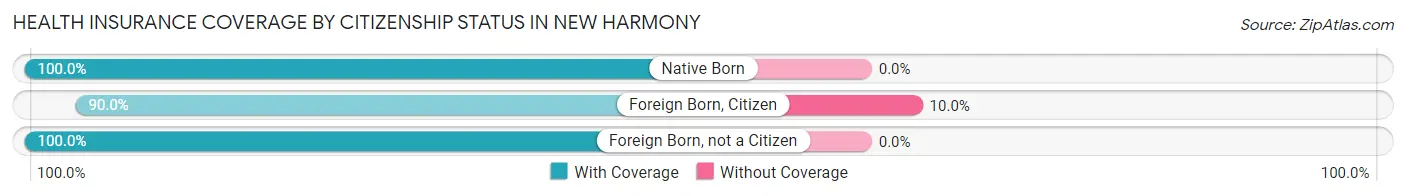
| Citizenship Status | With Coverage | Without Coverage |
| Native Born | 24 (100.0%) | 0 (0.0%) |
| Foreign Born, Citizen | 63 (90.0%) | 7 (10.0%) |
| Foreign Born, not a Citizen | 37 (100.0%) | 0 (0.0%) |
Health Insurance Coverage by Household Income in New Harmony
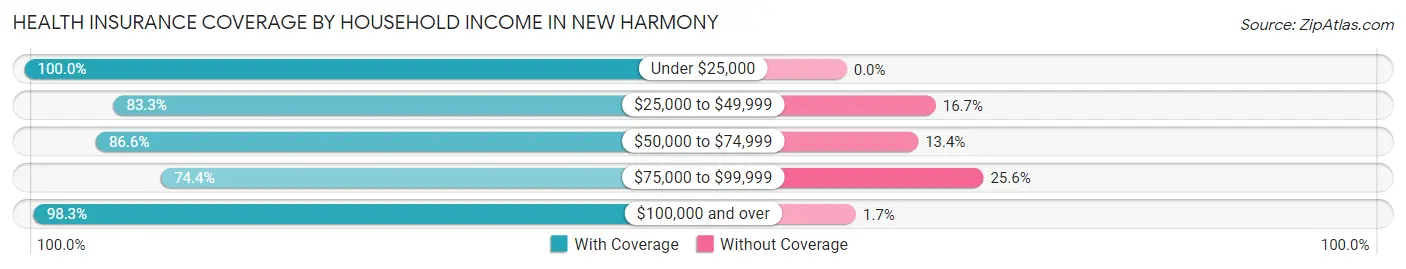
| Household Income | With Coverage | Without Coverage |
| Under $25,000 | 59 (100.0%) | 0 (0.0%) |
| $25,000 to $49,999 | 210 (83.3%) | 42 (16.7%) |
| $50,000 to $74,999 | 136 (86.6%) | 21 (13.4%) |
| $75,000 to $99,999 | 61 (74.4%) | 21 (25.6%) |
| $100,000 and over | 169 (98.3%) | 3 (1.7%) |
Public vs Private Health Insurance Coverage by Age in New Harmony
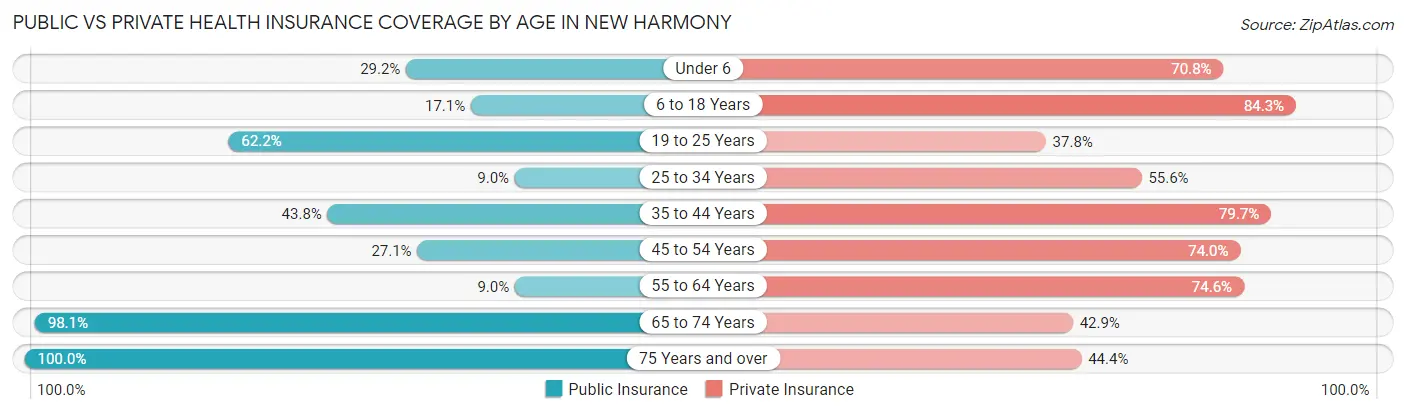
| Age Bracket | Public Insurance | Private Insurance |
| Under 6 | 7 (29.2%) | 17 (70.8%) |
| 6 to 18 Years | 12 (17.1%) | 59 (84.3%) |
| 19 to 25 Years | 23 (62.2%) | 14 (37.8%) |
| 25 to 34 Years | 16 (9.0%) | 99 (55.6%) |
| 35 to 44 Years | 28 (43.8%) | 51 (79.7%) |
| 45 to 54 Years | 26 (27.1%) | 71 (74.0%) |
| 55 to 64 Years | 6 (9.0%) | 50 (74.6%) |
| 65 to 74 Years | 103 (98.1%) | 45 (42.9%) |
| 75 Years and over | 81 (100.0%) | 36 (44.4%) |
| Total | 302 (41.8%) | 442 (61.2%) |
Disability Status by Sex by Age in New Harmony
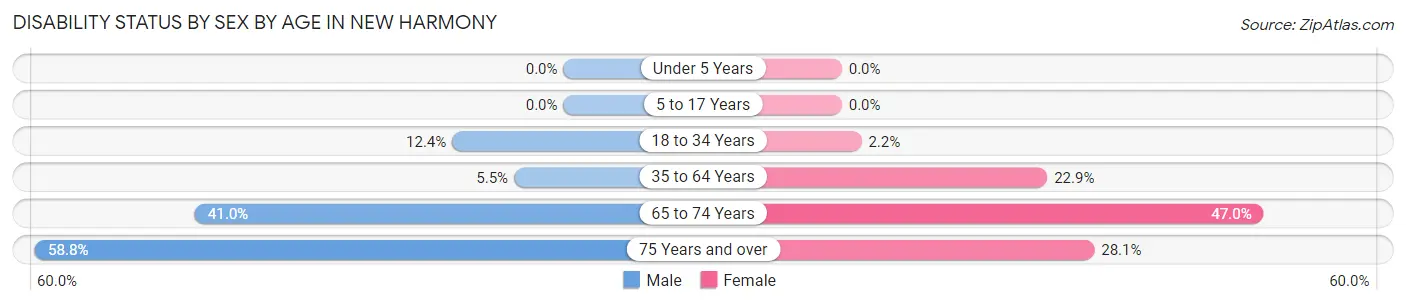
| Age Bracket | Male | Female |
| Under 5 Years | 0 (0.0%) | 0 (0.0%) |
| 5 to 17 Years | 0 (0.0%) | 0 (0.0%) |
| 18 to 34 Years | 14 (12.4%) | 3 (2.2%) |
| 35 to 64 Years | 6 (5.5%) | 27 (22.9%) |
| 65 to 74 Years | 16 (41.0%) | 31 (47.0%) |
| 75 Years and over | 10 (58.8%) | 18 (28.1%) |
Disability Class by Sex by Age in New Harmony
Disability Class: Hearing Difficulty
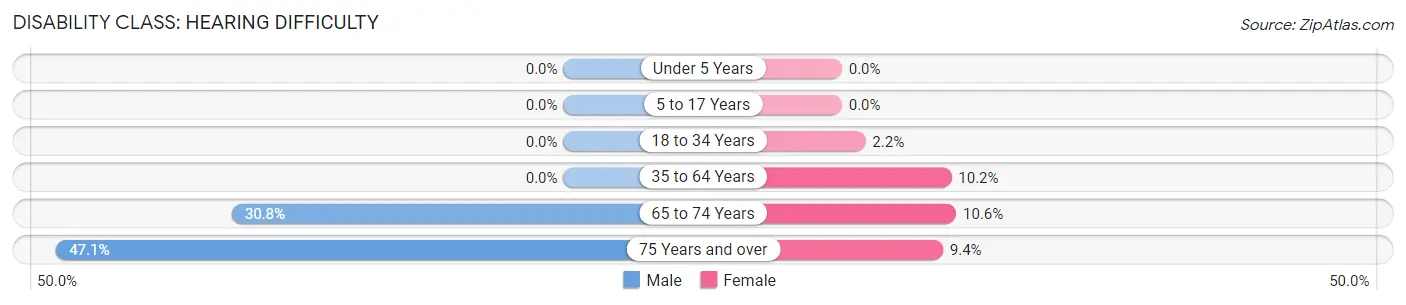
| Age Bracket | Male | Female |
| Under 5 Years | 0 (0.0%) | 0 (0.0%) |
| 5 to 17 Years | 0 (0.0%) | 0 (0.0%) |
| 18 to 34 Years | 0 (0.0%) | 3 (2.2%) |
| 35 to 64 Years | 0 (0.0%) | 12 (10.2%) |
| 65 to 74 Years | 12 (30.8%) | 7 (10.6%) |
| 75 Years and over | 8 (47.1%) | 6 (9.4%) |
Disability Class: Vision Difficulty
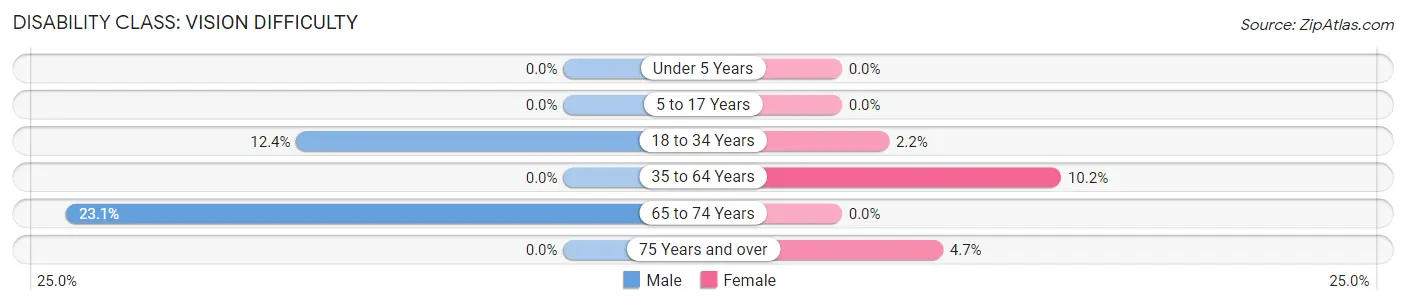
| Age Bracket | Male | Female |
| Under 5 Years | 0 (0.0%) | 0 (0.0%) |
| 5 to 17 Years | 0 (0.0%) | 0 (0.0%) |
| 18 to 34 Years | 14 (12.4%) | 3 (2.2%) |
| 35 to 64 Years | 0 (0.0%) | 12 (10.2%) |
| 65 to 74 Years | 9 (23.1%) | 0 (0.0%) |
| 75 Years and over | 0 (0.0%) | 3 (4.7%) |
Disability Class: Cognitive Difficulty
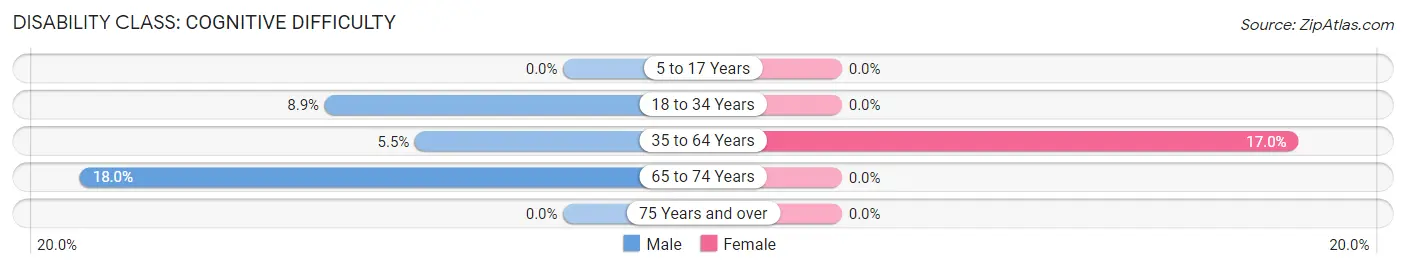
| Age Bracket | Male | Female |
| 5 to 17 Years | 0 (0.0%) | 0 (0.0%) |
| 18 to 34 Years | 10 (8.8%) | 0 (0.0%) |
| 35 to 64 Years | 6 (5.5%) | 20 (17.0%) |
| 65 to 74 Years | 7 (17.9%) | 0 (0.0%) |
| 75 Years and over | 0 (0.0%) | 0 (0.0%) |
Disability Class: Ambulatory Difficulty
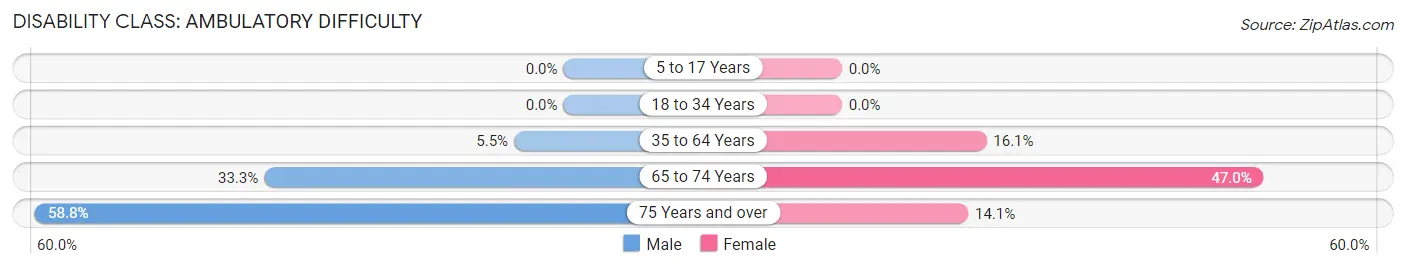
| Age Bracket | Male | Female |
| 5 to 17 Years | 0 (0.0%) | 0 (0.0%) |
| 18 to 34 Years | 0 (0.0%) | 0 (0.0%) |
| 35 to 64 Years | 6 (5.5%) | 19 (16.1%) |
| 65 to 74 Years | 13 (33.3%) | 31 (47.0%) |
| 75 Years and over | 10 (58.8%) | 9 (14.1%) |
Disability Class: Self-Care Difficulty
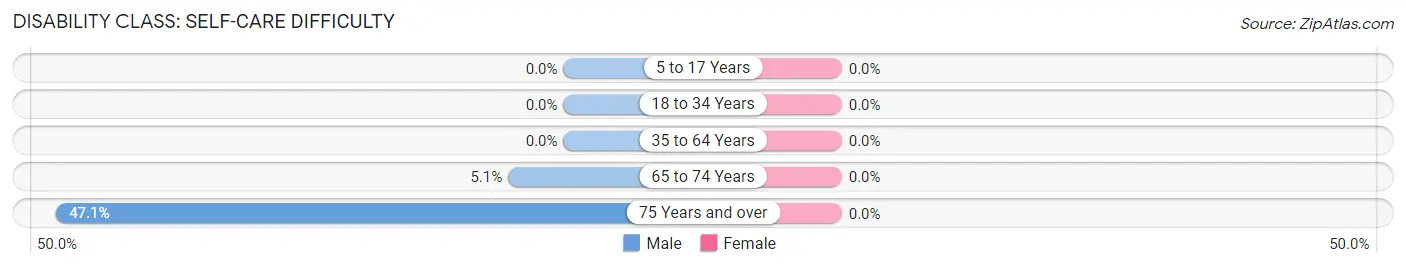
| Age Bracket | Male | Female |
| 5 to 17 Years | 0 (0.0%) | 0 (0.0%) |
| 18 to 34 Years | 0 (0.0%) | 0 (0.0%) |
| 35 to 64 Years | 0 (0.0%) | 0 (0.0%) |
| 65 to 74 Years | 2 (5.1%) | 0 (0.0%) |
| 75 Years and over | 8 (47.1%) | 0 (0.0%) |
Technology Access in New Harmony
Computing Device Access in New Harmony
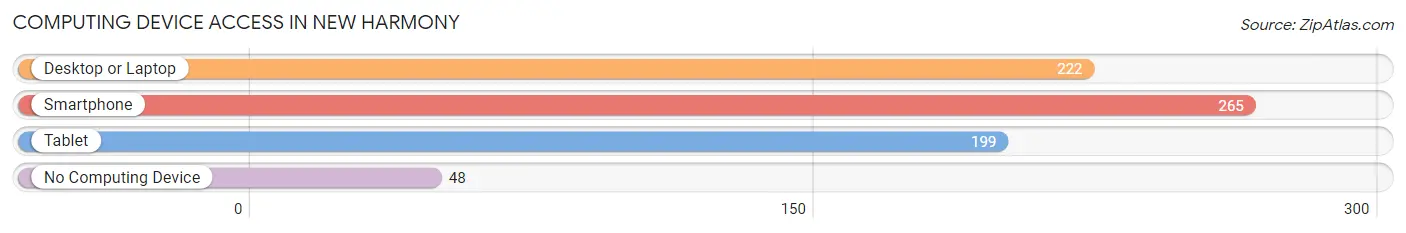
| Device Type | # Households | % Households |
| Desktop or Laptop | 222 | 66.5% |
| Smartphone | 265 | 79.3% |
| Tablet | 199 | 59.6% |
| No Computing Device | 48 | 14.4% |
| Total | 334 | 100.0% |
Internet Access in New Harmony
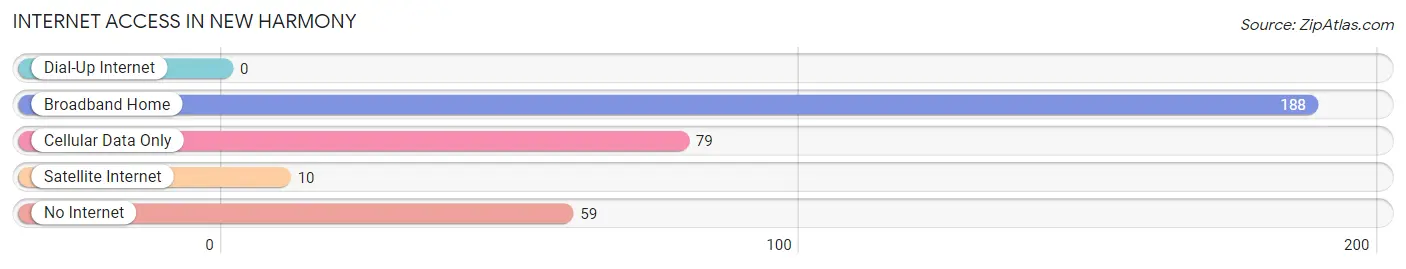
| Internet Type | # Households | % Households |
| Dial-Up Internet | 0 | 0.0% |
| Broadband Home | 188 | 56.3% |
| Cellular Data Only | 79 | 23.6% |
| Satellite Internet | 10 | 3.0% |
| No Internet | 59 | 17.7% |
| Total | 334 | 100.0% |
New Harmony Summary
History
New Harmony, Indiana is a small town located in Posey County, Indiana. It was founded in 1814 by the Harmonist Society, a religious group led by German immigrant George Rapp. The Harmonists had previously lived in Pennsylvania, but were looking for a place to practice their faith without persecution. They purchased 20,000 acres of land in Indiana and established the town of New Harmony.
The Harmonists were a communal society, meaning that all members shared in the work and the profits. They built a gristmill, a sawmill, a woolen mill, and a distillery, and they also farmed the land. The Harmonists were successful in their endeavors and the town flourished.
In 1824, the Harmonists sold the town to Robert Owen, a Welsh industrialist. Owen was a social reformer and he wanted to create a utopian society in New Harmony. He established a school, a library, and a scientific laboratory, and he encouraged the townspeople to work together for the common good. Unfortunately, his experiment failed and the town was sold again in 1827.
Since then, New Harmony has been a small, rural town. It has a population of about 800 people and is known for its historic buildings and its peaceful atmosphere. The town is home to several museums, including the Atheneum, a museum of science and history, and the Roofless Church, a historic church built in 1824.
Geography
New Harmony is located in the southwestern corner of Indiana, in Posey County. It is situated on the banks of the Wabash River, about 25 miles from Evansville. The town is surrounded by rolling hills and farmland, and is known for its scenic beauty.
The climate in New Harmony is humid continental, with hot summers and cold winters. The average temperature in July is 81°F (27°C), and the average temperature in January is 28°F (-2°C). The average annual precipitation is 40 inches (101 cm).
Economy
The economy of New Harmony is largely based on agriculture and tourism. The town is home to several farms, which produce corn, soybeans, wheat, and other crops. Tourism is also an important part of the local economy, as the town is home to several historic sites and museums.
The town also has several small businesses, including restaurants, shops, and galleries. The town is home to a few small manufacturing companies, which produce furniture, clothing, and other goods.
Demographics
As of the 2010 census, the population of New Harmony was 769. The racial makeup of the town was 97.2% White, 0.3% African American, 0.3% Native American, 0.3% Asian, 0.3% from other races, and 1.5% from two or more races. Hispanic or Latino of any race were 1.3% of the population.
The median household income in New Harmony was $37,500, and the median family income was $45,000. The per capita income was $19,000. About 11.3% of the population was below the poverty line.
Common Questions
What is Per Capita Income in New Harmony?
Per Capita income in New Harmony is $28,819.
What is the Median Family Income in New Harmony?
Median Family Income in New Harmony is $59,615.
What is the Median Household income in New Harmony?
Median Household Income in New Harmony is $48,611.
What is Inequality or Gini Index in New Harmony?
Inequality or Gini Index in New Harmony is 0.46.
What is the Total Population of New Harmony?
Total Population of New Harmony is 825.
What is the Total Male Population of New Harmony?
Total Male Population of New Harmony is 362.
What is the Total Female Population of New Harmony?
Total Female Population of New Harmony is 463.
What is the Ratio of Males per 100 Females in New Harmony?
There are 78.19 Males per 100 Females in New Harmony.
What is the Ratio of Females per 100 Males in New Harmony?
There are 127.90 Females per 100 Males in New Harmony.
What is the Median Population Age in New Harmony?
Median Population Age in New Harmony is 48.6 Years.
What is the Average Family Size in New Harmony
Average Family Size in New Harmony is 3.1 People.
What is the Average Household Size in New Harmony
Average Household Size in New Harmony is 2.2 People.
How Large is the Labor Force in New Harmony?
There are 422 People in the Labor Forcein in New Harmony.
What is the Percentage of People in the Labor Force in New Harmony?
54.1% of People are in the Labor Force in New Harmony.
What is the Unemployment Rate in New Harmony?
Unemployment Rate in New Harmony is 4.3%.