Mount Vernon, IN Map & Demographics
Mount Vernon Map
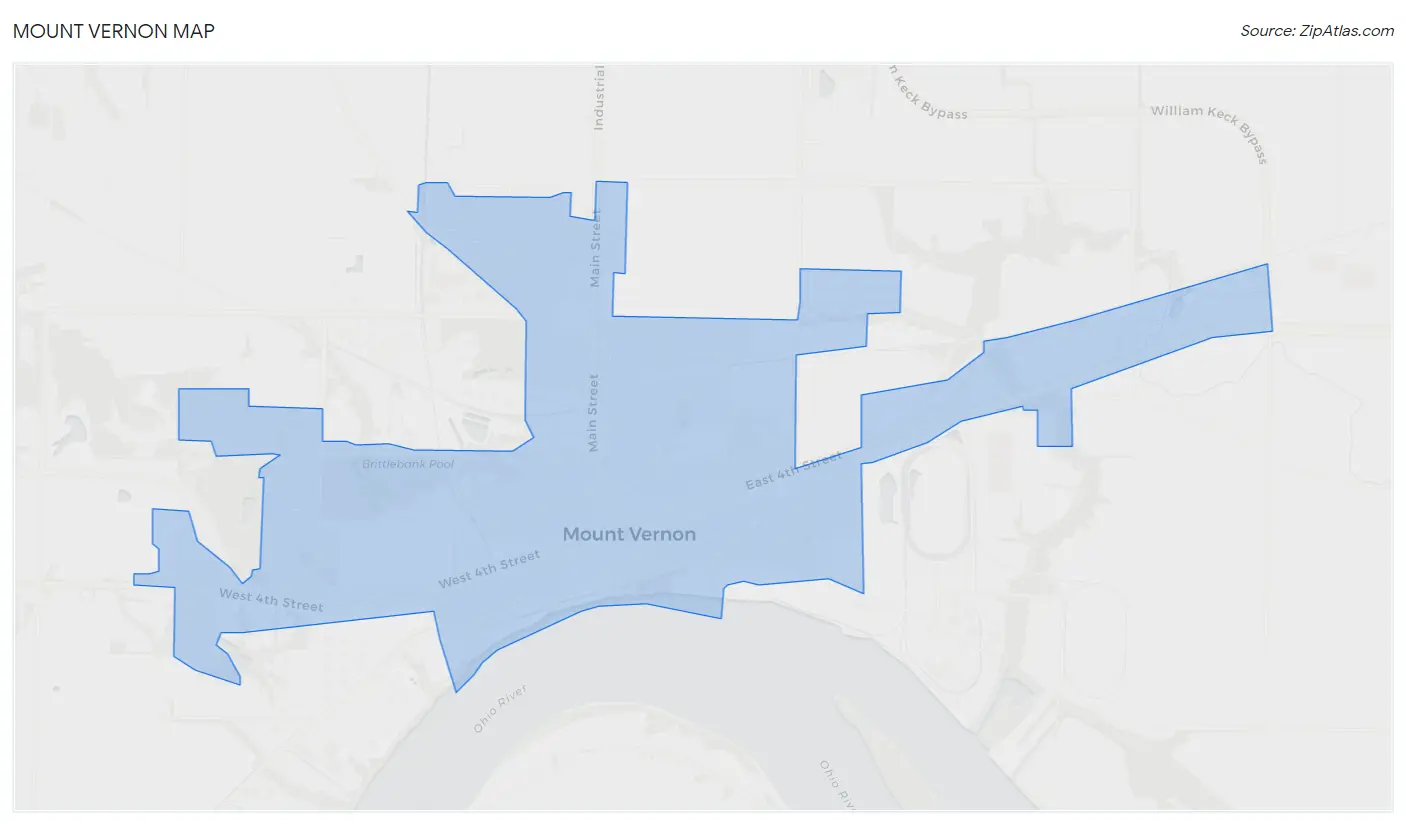
Mount Vernon Overview
$35,228
PER CAPITA INCOME
$71,903
AVG FAMILY INCOME
$58,370
AVG HOUSEHOLD INCOME
47.9%
WAGE / INCOME GAP [ % ]
52.1¢/ $1
WAGE / INCOME GAP [ $ ]
0.42
INEQUALITY / GINI INDEX
6,480
TOTAL POPULATION
3,039
MALE POPULATION
3,441
FEMALE POPULATION
88.32
MALES / 100 FEMALES
113.23
FEMALES / 100 MALES
40.7
MEDIAN AGE
2.7
AVG FAMILY SIZE
2.1
AVG HOUSEHOLD SIZE
3,286
LABOR FORCE [ PEOPLE ]
62.3%
PERCENT IN LABOR FORCE
5.5%
UNEMPLOYMENT RATE
Mount Vernon Zip Codes
Mount Vernon Area Codes
Income in Mount Vernon
Income Overview in Mount Vernon
Per Capita Income in Mount Vernon is $35,228, while median incomes of families and households are $71,903 and $58,370 respectively.
| Characteristic | Number | Measure |
| Per Capita Income | 6,480 | $35,228 |
| Median Family Income | 1,861 | $71,903 |
| Mean Family Income | 1,861 | $93,454 |
| Median Household Income | 3,011 | $58,370 |
| Mean Household Income | 3,011 | $75,724 |
| Income Deficit | 1,861 | $0 |
| Wage / Income Gap (%) | 6,480 | 47.93% |
| Wage / Income Gap ($) | 6,480 | 52.07¢ per $1 |
| Gini / Inequality Index | 6,480 | 0.42 |
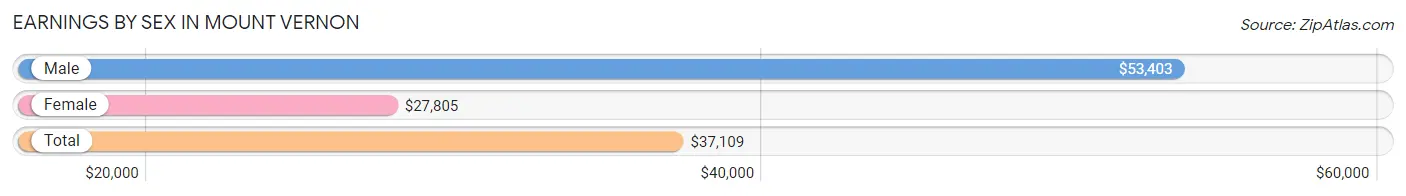
Earnings by Sex in Mount Vernon
Average Earnings in Mount Vernon are $37,109, $53,403 for men and $27,805 for women, a difference of 47.9%.
| Sex | Number | Average Earnings |
| Male | 1,824 (52.7%) | $53,403 |
| Female | 1,636 (47.3%) | $27,805 |
| Total | 3,460 (100.0%) | $37,109 |
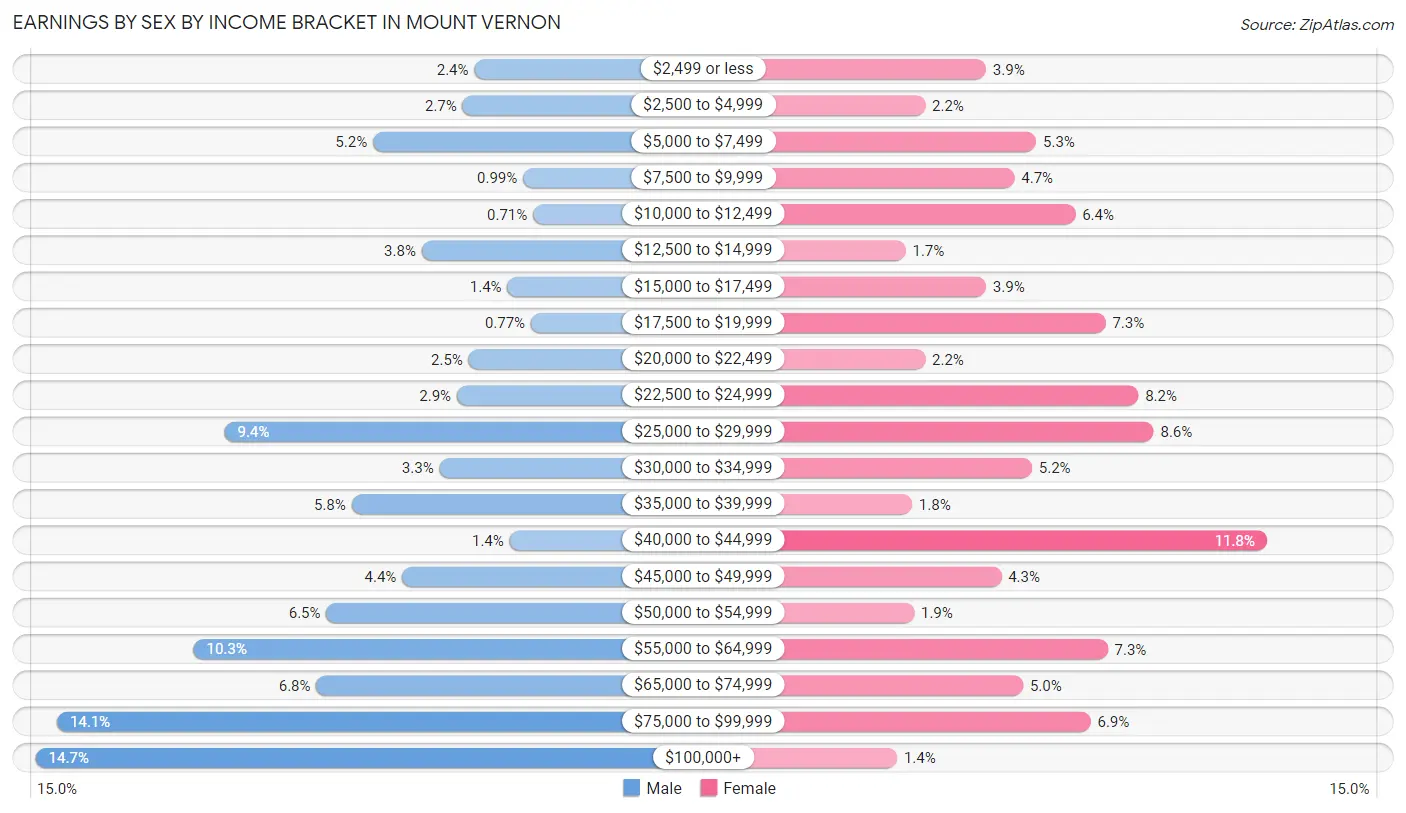
Earnings by Sex by Income Bracket in Mount Vernon
The most common earnings brackets in Mount Vernon are $100,000+ for men (268 | 14.7%) and $40,000 to $44,999 for women (193 | 11.8%).
| Income | Male | Female |
| $2,499 or less | 43 (2.4%) | 64 (3.9%) |
| $2,500 to $4,999 | 49 (2.7%) | 36 (2.2%) |
| $5,000 to $7,499 | 95 (5.2%) | 87 (5.3%) |
| $7,500 to $9,999 | 18 (1.0%) | 77 (4.7%) |
| $10,000 to $12,499 | 13 (0.7%) | 105 (6.4%) |
| $12,500 to $14,999 | 70 (3.8%) | 27 (1.7%) |
| $15,000 to $17,499 | 26 (1.4%) | 64 (3.9%) |
| $17,500 to $19,999 | 14 (0.8%) | 119 (7.3%) |
| $20,000 to $22,499 | 46 (2.5%) | 36 (2.2%) |
| $22,500 to $24,999 | 52 (2.9%) | 134 (8.2%) |
| $25,000 to $29,999 | 171 (9.4%) | 141 (8.6%) |
| $30,000 to $34,999 | 61 (3.3%) | 85 (5.2%) |
| $35,000 to $39,999 | 106 (5.8%) | 30 (1.8%) |
| $40,000 to $44,999 | 25 (1.4%) | 193 (11.8%) |
| $45,000 to $49,999 | 80 (4.4%) | 71 (4.3%) |
| $50,000 to $54,999 | 119 (6.5%) | 31 (1.9%) |
| $55,000 to $64,999 | 187 (10.2%) | 120 (7.3%) |
| $65,000 to $74,999 | 124 (6.8%) | 81 (5.0%) |
| $75,000 to $99,999 | 257 (14.1%) | 112 (6.9%) |
| $100,000+ | 268 (14.7%) | 23 (1.4%) |
| Total | 1,824 (100.0%) | 1,636 (100.0%) |
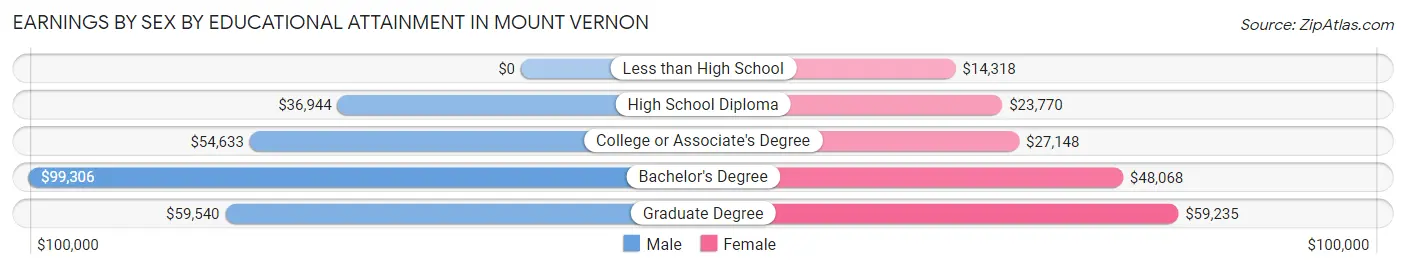
Earnings by Sex by Educational Attainment in Mount Vernon
Average earnings in Mount Vernon are $58,781 for men and $31,300 for women, a difference of 46.8%. Men with an educational attainment of bachelor's degree enjoy the highest average annual earnings of $99,306, while those with high school diploma education earn the least with $36,944. Women with an educational attainment of graduate degree earn the most with the average annual earnings of $59,235, while those with less than high school education have the smallest earnings of $14,318.
| Educational Attainment | Male Income | Female Income |
| Less than High School | - | - |
| High School Diploma | $36,944 | $23,770 |
| College or Associate's Degree | $54,633 | $27,148 |
| Bachelor's Degree | $99,306 | $48,068 |
| Graduate Degree | $59,540 | $59,235 |
| Total | $58,781 | $31,300 |
Family Income in Mount Vernon
Family Income Brackets in Mount Vernon
According to the Mount Vernon family income data, there are 422 families falling into the $50,000 to $74,999 income range, which is the most common income bracket and makes up 22.7% of all families. Conversely, the $15,000 to $24,999 income bracket is the least frequent group with only 39 families (2.1%) belonging to this category.
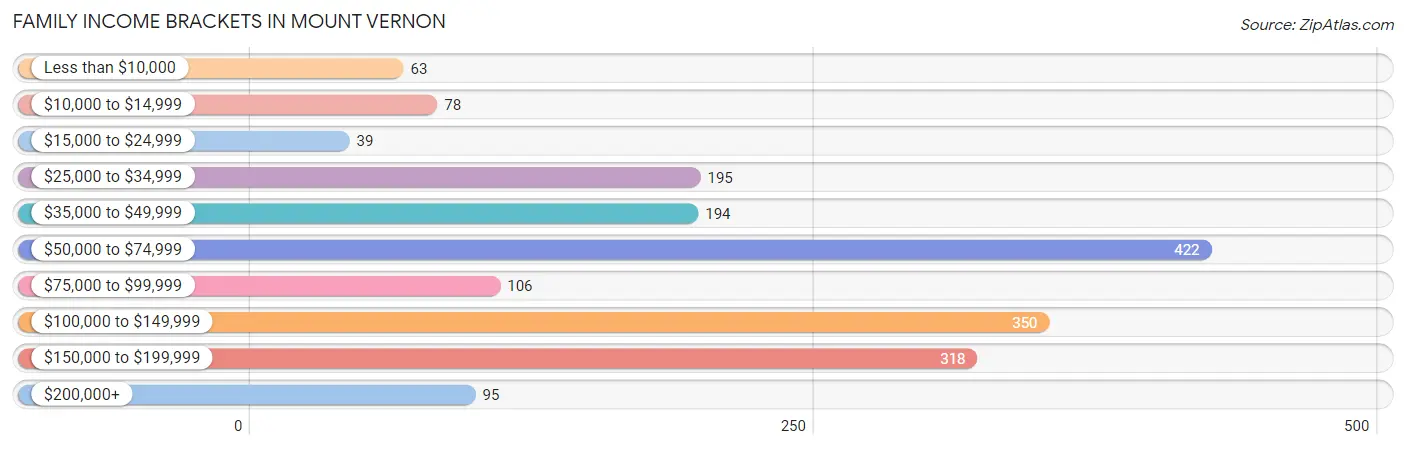
| Income Bracket | # Families | % Families |
| Less than $10,000 | 63 | 3.4% |
| $10,000 to $14,999 | 78 | 4.2% |
| $15,000 to $24,999 | 39 | 2.1% |
| $25,000 to $34,999 | 195 | 10.5% |
| $35,000 to $49,999 | 194 | 10.4% |
| $50,000 to $74,999 | 422 | 22.7% |
| $75,000 to $99,999 | 106 | 5.7% |
| $100,000 to $149,999 | 350 | 18.8% |
| $150,000 to $199,999 | 318 | 17.1% |
| $200,000+ | 95 | 5.1% |
Family Income by Famaliy Size in Mount Vernon
6-person families (44 | 2.4%) account for the highest median family income in Mount Vernon with $170,208 per family, while 2-person families (1,133 | 60.9%) have the highest median income of $33,968 per family member.
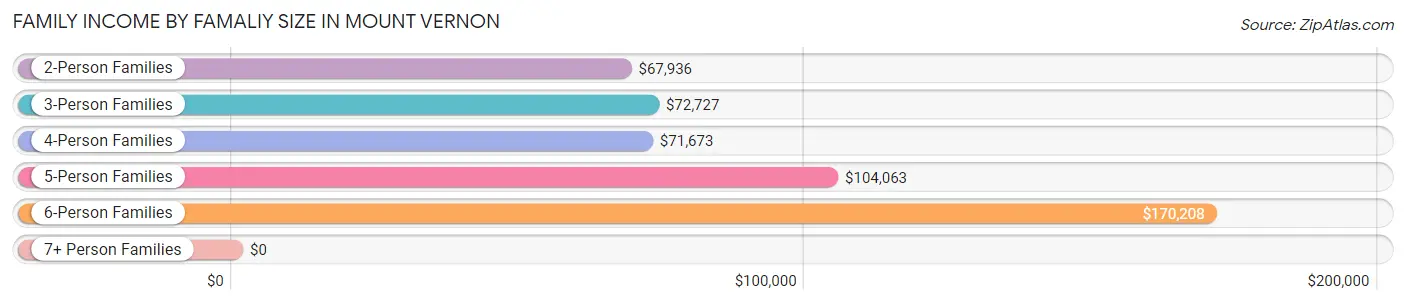
| Income Bracket | # Families | Median Income |
| 2-Person Families | 1,133 (60.9%) | $67,936 |
| 3-Person Families | 282 (15.1%) | $72,727 |
| 4-Person Families | 275 (14.8%) | $71,673 |
| 5-Person Families | 127 (6.8%) | $104,063 |
| 6-Person Families | 44 (2.4%) | $170,208 |
| 7+ Person Families | 0 (0.0%) | $0 |
| Total | 1,861 (100.0%) | $71,903 |
Family Income by Number of Earners in Mount Vernon
The median family income in Mount Vernon is $71,903, with families comprising 3+ earners (230) having the highest median family income of $152,621, while families with no earners (436) have the lowest median family income of $46,538, accounting for 12.4% and 23.4% of families, respectively.
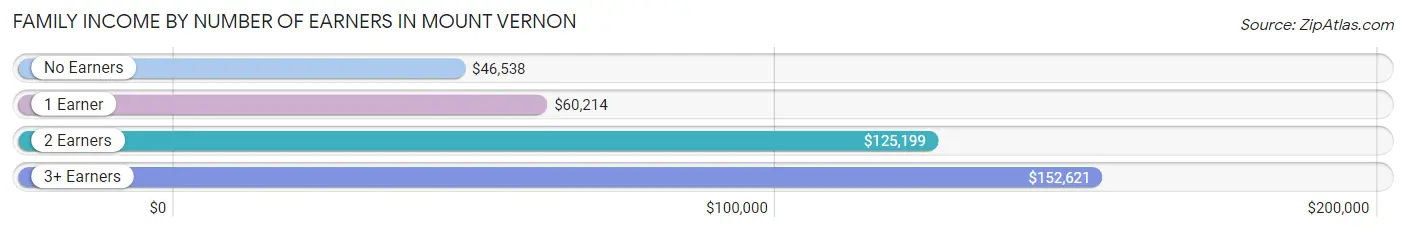
| Number of Earners | # Families | Median Income |
| No Earners | 436 (23.4%) | $46,538 |
| 1 Earner | 536 (28.8%) | $60,214 |
| 2 Earners | 659 (35.4%) | $125,199 |
| 3+ Earners | 230 (12.4%) | $152,621 |
| Total | 1,861 (100.0%) | $71,903 |
Household Income in Mount Vernon
Household Income Brackets in Mount Vernon
With 741 households falling in the category, the $50,000 to $74,999 income range is the most frequent in Mount Vernon, accounting for 24.6% of all households. In contrast, only 96 households (3.2%) fall into the $200,000+ income bracket, making it the least populous group.
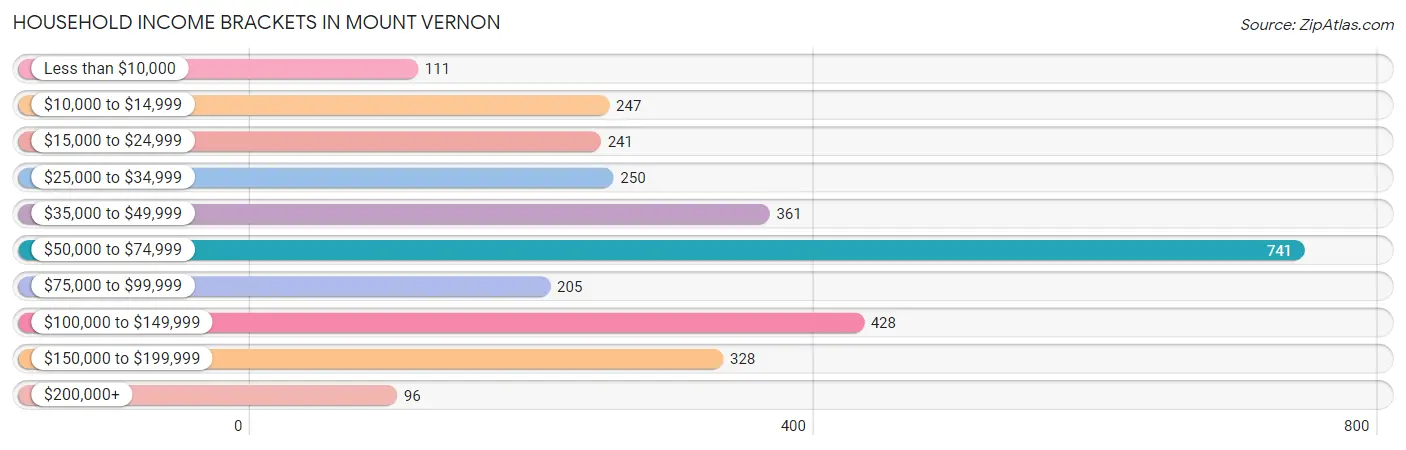
| Income Bracket | # Households | % Households |
| Less than $10,000 | 111 | 3.7% |
| $10,000 to $14,999 | 247 | 8.2% |
| $15,000 to $24,999 | 241 | 8.0% |
| $25,000 to $34,999 | 250 | 8.3% |
| $35,000 to $49,999 | 361 | 12.0% |
| $50,000 to $74,999 | 741 | 24.6% |
| $75,000 to $99,999 | 205 | 6.8% |
| $100,000 to $149,999 | 428 | 14.2% |
| $150,000 to $199,999 | 328 | 10.9% |
| $200,000+ | 96 | 3.2% |
Household Income by Householder Age in Mount Vernon
The median household income in Mount Vernon is $58,370, with the highest median household income of $75,132 found in the 45 to 64 years age bracket for the primary householder. A total of 990 households (32.9%) fall into this category. Meanwhile, the 65+ years age bracket for the primary householder has the lowest median household income of $48,700, with 894 households (29.7%) in this group.
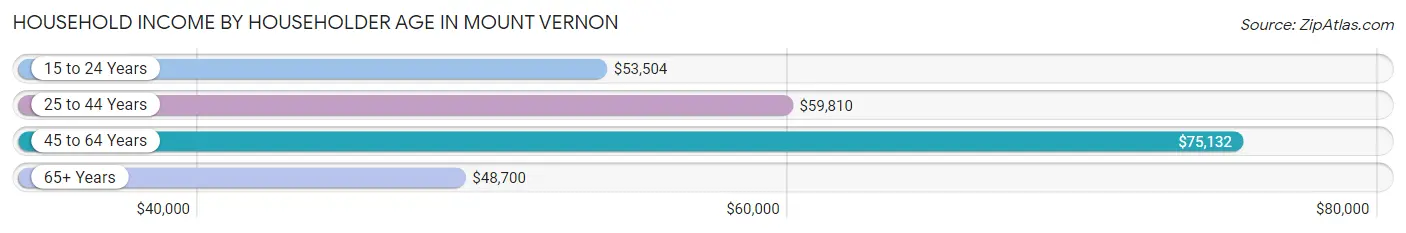
| Income Bracket | # Households | Median Income |
| 15 to 24 Years | 173 (5.8%) | $53,504 |
| 25 to 44 Years | 954 (31.7%) | $59,810 |
| 45 to 64 Years | 990 (32.9%) | $75,132 |
| 65+ Years | 894 (29.7%) | $48,700 |
| Total | 3,011 (100.0%) | $58,370 |
Poverty in Mount Vernon
Income Below Poverty by Sex and Age in Mount Vernon
With 8.4% poverty level for males and 16.7% for females among the residents of Mount Vernon, 16 and 17 year old males and 15 year old females are the most vulnerable to poverty, with 18 males (25.4%) and 25 females (62.5%) in their respective age groups living below the poverty level.
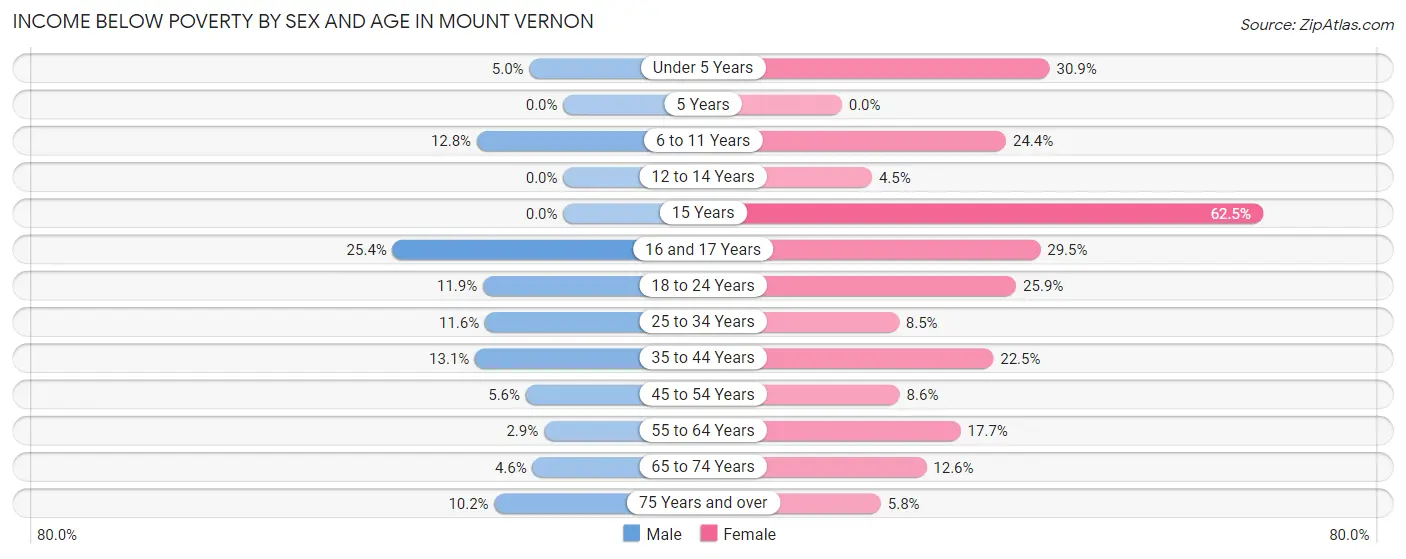
| Age Bracket | Male | Female |
| Under 5 Years | 6 (5.0%) | 83 (30.9%) |
| 5 Years | 0 (0.0%) | 0 (0.0%) |
| 6 to 11 Years | 29 (12.8%) | 50 (24.4%) |
| 12 to 14 Years | 0 (0.0%) | 6 (4.5%) |
| 15 Years | 0 (0.0%) | 25 (62.5%) |
| 16 and 17 Years | 18 (25.4%) | 28 (29.5%) |
| 18 to 24 Years | 31 (11.9%) | 58 (25.9%) |
| 25 to 34 Years | 62 (11.6%) | 30 (8.5%) |
| 35 to 44 Years | 41 (13.1%) | 99 (22.5%) |
| 45 to 54 Years | 16 (5.6%) | 33 (8.6%) |
| 55 to 64 Years | 13 (2.9%) | 84 (17.6%) |
| 65 to 74 Years | 17 (4.6%) | 49 (12.6%) |
| 75 Years and over | 18 (10.2%) | 22 (5.8%) |
| Total | 251 (8.4%) | 567 (16.7%) |
Income Above Poverty by Sex and Age in Mount Vernon
According to the poverty statistics in Mount Vernon, males aged 5 years and females aged 5 years are the age groups that are most secure financially, with 100.0% of males and 100.0% of females in these age groups living above the poverty line.
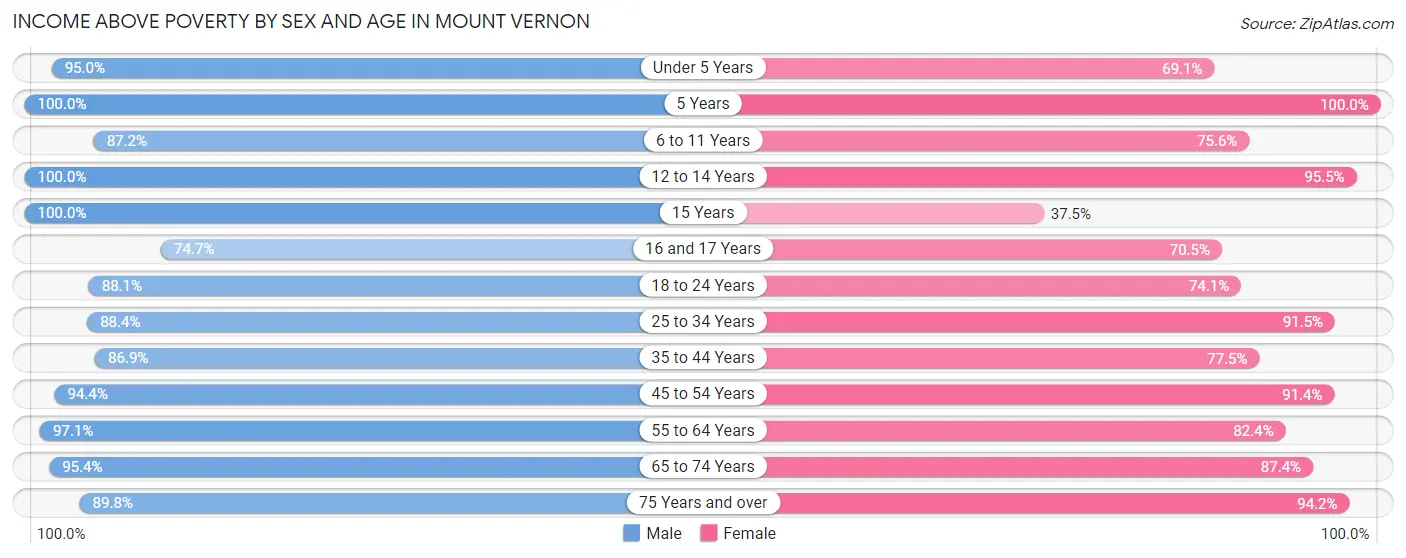
| Age Bracket | Male | Female |
| Under 5 Years | 113 (95.0%) | 186 (69.1%) |
| 5 Years | 18 (100.0%) | 14 (100.0%) |
| 6 to 11 Years | 197 (87.2%) | 155 (75.6%) |
| 12 to 14 Years | 105 (100.0%) | 128 (95.5%) |
| 15 Years | 72 (100.0%) | 15 (37.5%) |
| 16 and 17 Years | 53 (74.7%) | 67 (70.5%) |
| 18 to 24 Years | 229 (88.1%) | 166 (74.1%) |
| 25 to 34 Years | 471 (88.4%) | 324 (91.5%) |
| 35 to 44 Years | 272 (86.9%) | 341 (77.5%) |
| 45 to 54 Years | 271 (94.4%) | 351 (91.4%) |
| 55 to 64 Years | 442 (97.1%) | 392 (82.4%) |
| 65 to 74 Years | 355 (95.4%) | 341 (87.4%) |
| 75 Years and over | 158 (89.8%) | 357 (94.2%) |
| Total | 2,756 (91.6%) | 2,837 (83.3%) |
Income Below Poverty Among Married-Couple Families in Mount Vernon
The poverty statistics for married-couple families in Mount Vernon show that 7.8% or 111 of the total 1,425 families live below the poverty line. Families with 3 or 4 children have the highest poverty rate of 21.7%, comprising of 28 families. On the other hand, families with 1 or 2 children have the lowest poverty rate of 1.7%, which includes 5 families.
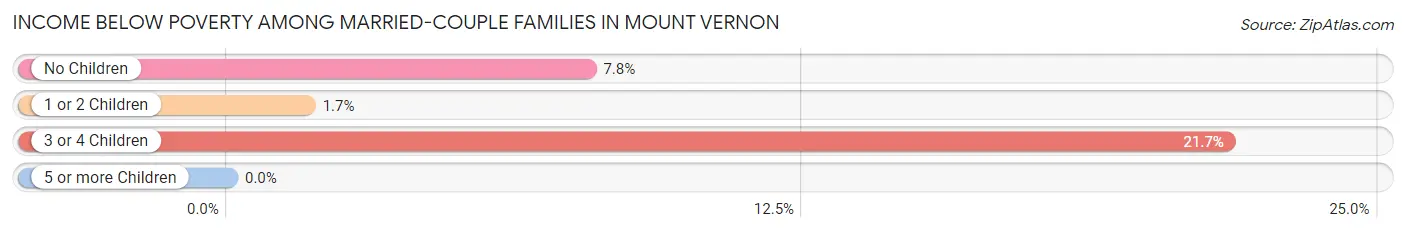
| Children | Above Poverty | Below Poverty |
| No Children | 922 (92.2%) | 78 (7.8%) |
| 1 or 2 Children | 291 (98.3%) | 5 (1.7%) |
| 3 or 4 Children | 101 (78.3%) | 28 (21.7%) |
| 5 or more Children | 0 (0.0%) | 0 (0.0%) |
| Total | 1,314 (92.2%) | 111 (7.8%) |
Income Below Poverty Among Single-Parent Households in Mount Vernon
According to the poverty data in Mount Vernon, 14.5% or 11 single-father households and 21.9% or 79 single-mother households are living below the poverty line. Among single-father households, those with 1 or 2 children have the highest poverty rate, with 11 households (28.9%) experiencing poverty. Likewise, among single-mother households, those with 3 or 4 children have the highest poverty rate, with 21 households (46.7%) falling below the poverty line.
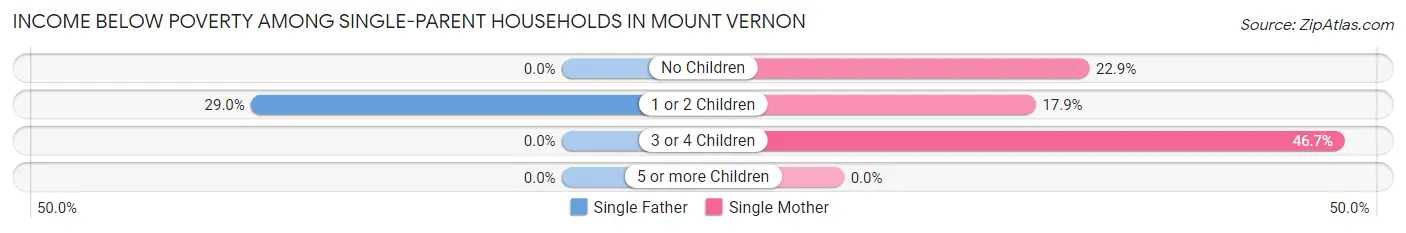
| Children | Single Father | Single Mother |
| No Children | 0 (0.0%) | 8 (22.9%) |
| 1 or 2 Children | 11 (28.9%) | 50 (17.9%) |
| 3 or 4 Children | 0 (0.0%) | 21 (46.7%) |
| 5 or more Children | 0 (0.0%) | 0 (0.0%) |
| Total | 11 (14.5%) | 79 (21.9%) |
Income Below Poverty Among Married-Couple vs Single-Parent Households in Mount Vernon
The poverty data for Mount Vernon shows that 111 of the married-couple family households (7.8%) and 90 of the single-parent households (20.6%) are living below the poverty level. Within the married-couple family households, those with 3 or 4 children have the highest poverty rate, with 28 households (21.7%) falling below the poverty line. Among the single-parent households, those with 3 or 4 children have the highest poverty rate, with 21 household (46.7%) living below poverty.
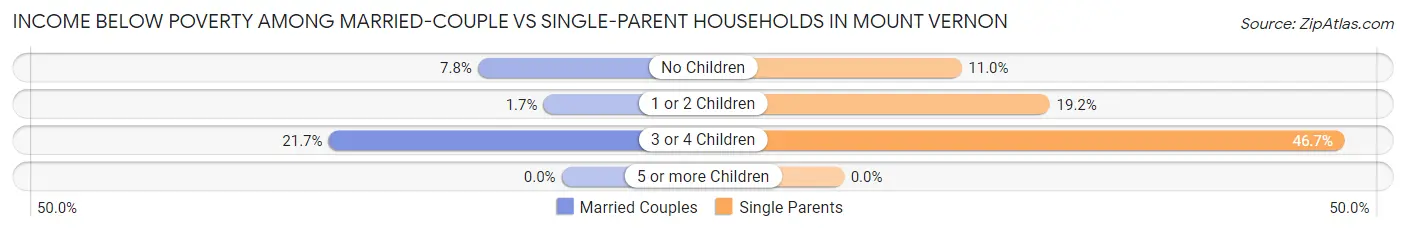
| Children | Married-Couple Families | Single-Parent Households |
| No Children | 78 (7.8%) | 8 (11.0%) |
| 1 or 2 Children | 5 (1.7%) | 61 (19.2%) |
| 3 or 4 Children | 28 (21.7%) | 21 (46.7%) |
| 5 or more Children | 0 (0.0%) | 0 (0.0%) |
| Total | 111 (7.8%) | 90 (20.6%) |
Race in Mount Vernon
The most populous races in Mount Vernon are White / Caucasian (6,005 | 92.7%), Hispanic or Latino (302 | 4.7%), and Black / African American (175 | 2.7%).
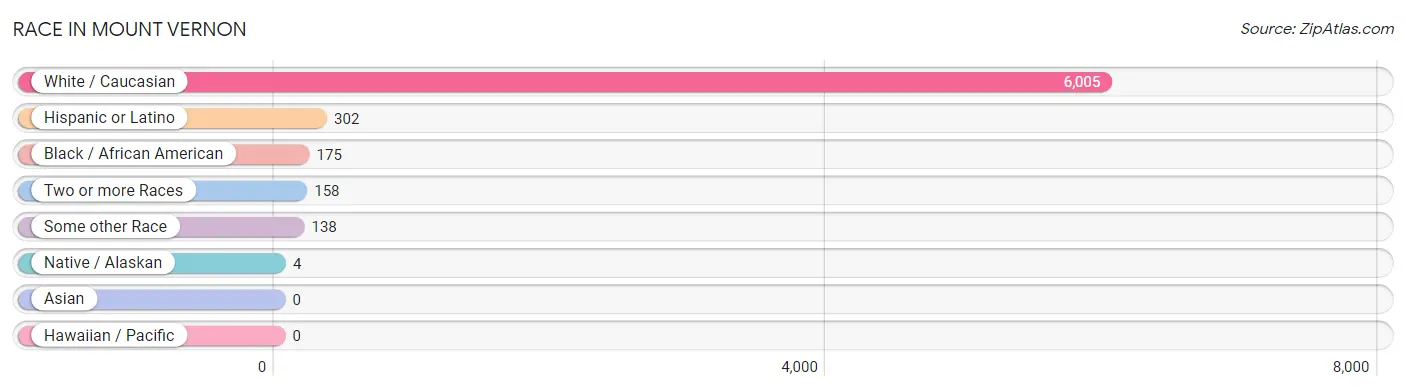
| Race | # Population | % Population |
| Asian | 0 | 0.0% |
| Black / African American | 175 | 2.7% |
| Hawaiian / Pacific | 0 | 0.0% |
| Hispanic or Latino | 302 | 4.7% |
| Native / Alaskan | 4 | 0.1% |
| White / Caucasian | 6,005 | 92.7% |
| Two or more Races | 158 | 2.4% |
| Some other Race | 138 | 2.1% |
| Total | 6,480 | 100.0% |
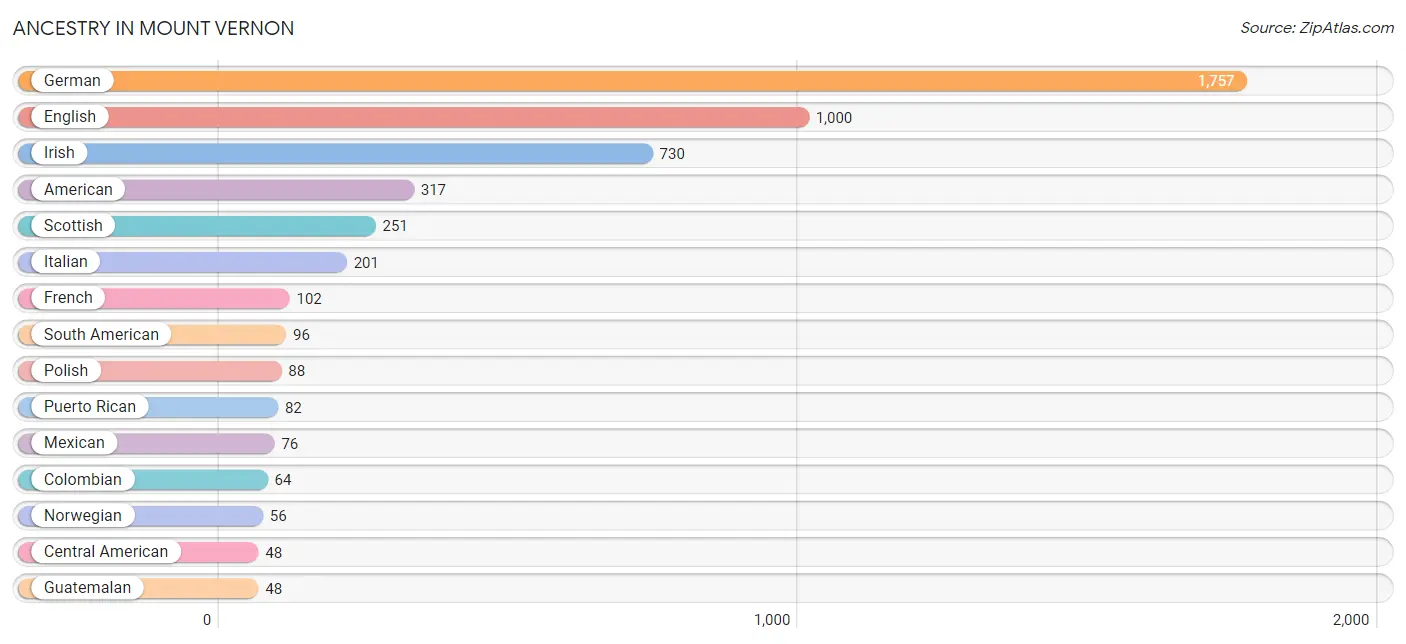
Ancestry in Mount Vernon
The most populous ancestries reported in Mount Vernon are German (1,757 | 27.1%), English (1,000 | 15.4%), Irish (730 | 11.3%), American (317 | 4.9%), and Scottish (251 | 3.9%), together accounting for 62.6% of all Mount Vernon residents.
| Ancestry | # Population | % Population |
| African | 11 | 0.2% |
| American | 317 | 4.9% |
| Argentinean | 32 | 0.5% |
| Central American | 48 | 0.7% |
| Cherokee | 18 | 0.3% |
| Colombian | 64 | 1.0% |
| Czech | 13 | 0.2% |
| Czechoslovakian | 13 | 0.2% |
| Dutch | 10 | 0.2% |
| Eastern European | 31 | 0.5% |
| English | 1,000 | 15.4% |
| European | 33 | 0.5% |
| French | 102 | 1.6% |
| German | 1,757 | 27.1% |
| Greek | 23 | 0.4% |
| Guatemalan | 48 | 0.7% |
| Hungarian | 25 | 0.4% |
| Irish | 730 | 11.3% |
| Italian | 201 | 3.1% |
| Mexican | 76 | 1.2% |
| Norwegian | 56 | 0.9% |
| Polish | 88 | 1.4% |
| Puerto Rican | 82 | 1.3% |
| Russian | 9 | 0.1% |
| Scandinavian | 5 | 0.1% |
| Scotch-Irish | 23 | 0.4% |
| Scottish | 251 | 3.9% |
| Slovene | 10 | 0.2% |
| South American | 96 | 1.5% |
| Subsaharan African | 11 | 0.2% |
| Swedish | 26 | 0.4% |
| Welsh | 25 | 0.4% | View All 32 Rows |
Immigrants in Mount Vernon
The most numerous immigrant groups reported in Mount Vernon came from Latin America (122 | 1.9%), South America (62 | 1.0%), Central America (60 | 0.9%), Guatemala (60 | 0.9%), and Argentina (32 | 0.5%), together accounting for 5.2% of all Mount Vernon residents.
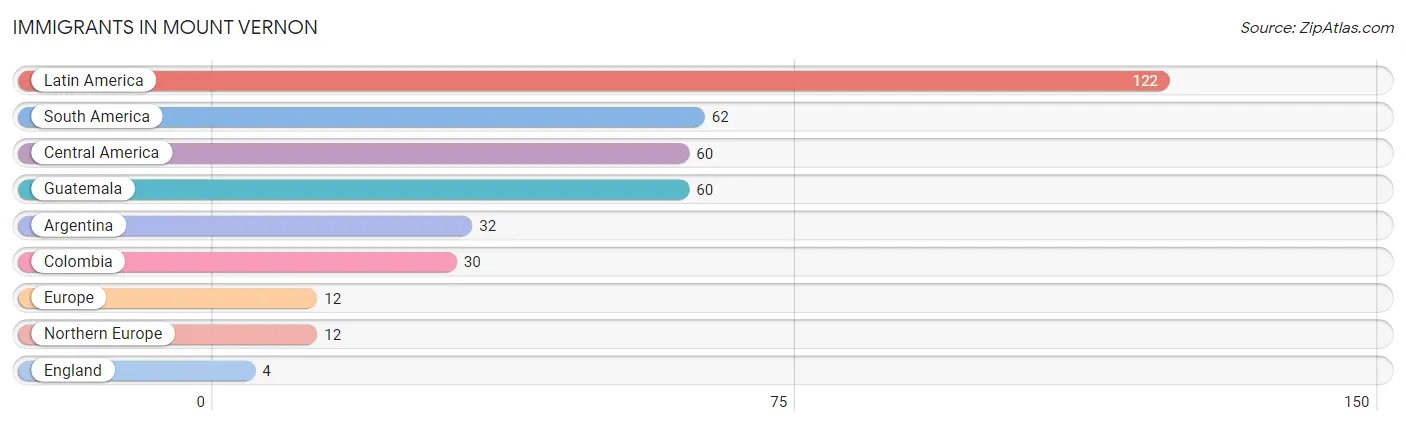
| Immigration Origin | # Population | % Population |
| Argentina | 32 | 0.5% |
| Central America | 60 | 0.9% |
| Colombia | 30 | 0.5% |
| England | 4 | 0.1% |
| Europe | 12 | 0.2% |
| Guatemala | 60 | 0.9% |
| Latin America | 122 | 1.9% |
| Northern Europe | 12 | 0.2% |
| South America | 62 | 1.0% | View All 9 Rows |
Sex and Age in Mount Vernon
Sex and Age in Mount Vernon
The most populous age groups in Mount Vernon are 60 to 64 Years (303 | 10.0%) for men and Under 5 Years (269 | 7.8%) for women.
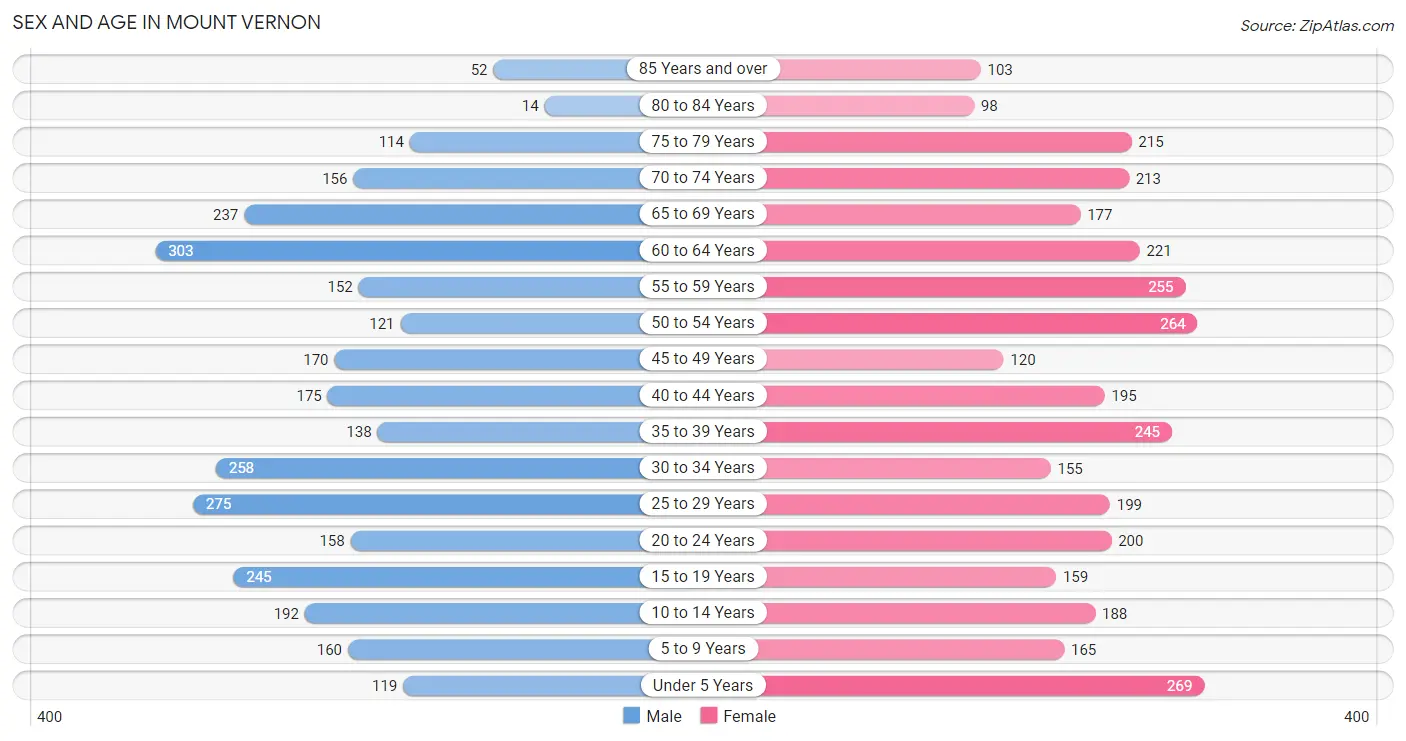
| Age Bracket | Male | Female |
| Under 5 Years | 119 (3.9%) | 269 (7.8%) |
| 5 to 9 Years | 160 (5.3%) | 165 (4.8%) |
| 10 to 14 Years | 192 (6.3%) | 188 (5.5%) |
| 15 to 19 Years | 245 (8.1%) | 159 (4.6%) |
| 20 to 24 Years | 158 (5.2%) | 200 (5.8%) |
| 25 to 29 Years | 275 (9.0%) | 199 (5.8%) |
| 30 to 34 Years | 258 (8.5%) | 155 (4.5%) |
| 35 to 39 Years | 138 (4.5%) | 245 (7.1%) |
| 40 to 44 Years | 175 (5.8%) | 195 (5.7%) |
| 45 to 49 Years | 170 (5.6%) | 120 (3.5%) |
| 50 to 54 Years | 121 (4.0%) | 264 (7.7%) |
| 55 to 59 Years | 152 (5.0%) | 255 (7.4%) |
| 60 to 64 Years | 303 (10.0%) | 221 (6.4%) |
| 65 to 69 Years | 237 (7.8%) | 177 (5.1%) |
| 70 to 74 Years | 156 (5.1%) | 213 (6.2%) |
| 75 to 79 Years | 114 (3.7%) | 215 (6.2%) |
| 80 to 84 Years | 14 (0.5%) | 98 (2.9%) |
| 85 Years and over | 52 (1.7%) | 103 (3.0%) |
| Total | 3,039 (100.0%) | 3,441 (100.0%) |
Families and Households in Mount Vernon
Median Family Size in Mount Vernon
The median family size in Mount Vernon is 2.70 persons per family, with single female/mother families (360 | 19.3%) accounting for the largest median family size of 2.71 persons per family. On the other hand, single male/father families (76 | 4.1%) represent the smallest median family size with 2.68 persons per family.
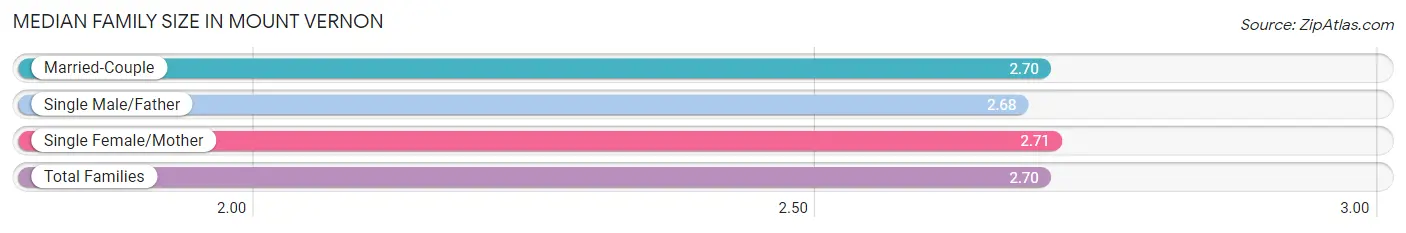
| Family Type | # Families | Family Size |
| Married-Couple | 1,425 (76.6%) | 2.70 |
| Single Male/Father | 76 (4.1%) | 2.68 |
| Single Female/Mother | 360 (19.3%) | 2.71 |
| Total Families | 1,861 (100.0%) | 2.70 |
Median Household Size in Mount Vernon
The median household size in Mount Vernon is 2.12 persons per household, with single female/mother households (360 | 12.0%) accounting for the largest median household size of 3.05 persons per household. non-family households (1,150 | 38.2%) represent the smallest median household size with 1.07 persons per household.
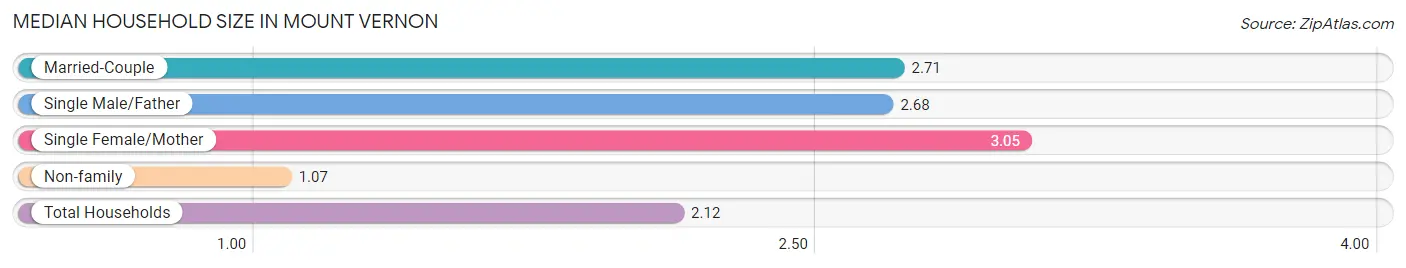
| Household Type | # Households | Household Size |
| Married-Couple | 1,425 (47.3%) | 2.71 |
| Single Male/Father | 76 (2.5%) | 2.68 |
| Single Female/Mother | 360 (12.0%) | 3.05 |
| Non-family | 1,150 (38.2%) | 1.07 |
| Total Households | 3,011 (100.0%) | 2.12 |
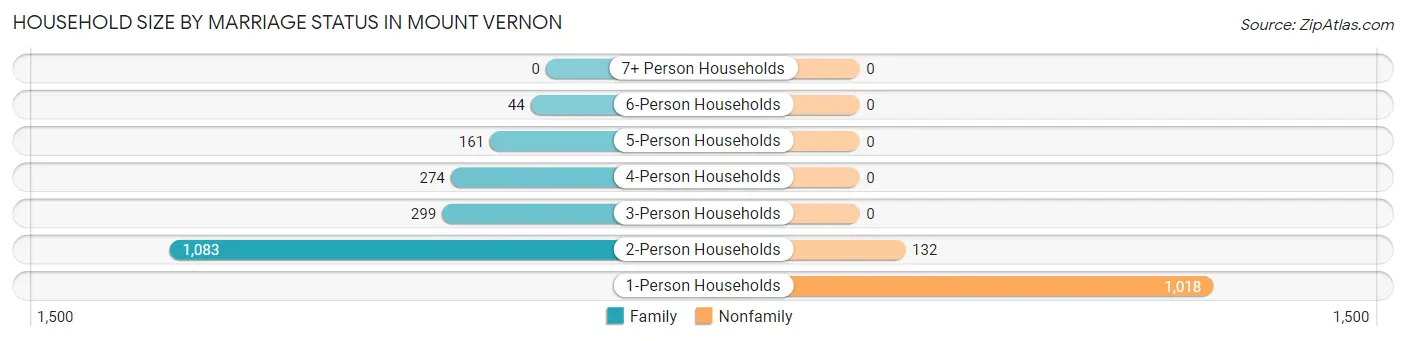
Household Size by Marriage Status in Mount Vernon
Out of a total of 3,011 households in Mount Vernon, 1,861 (61.8%) are family households, while 1,150 (38.2%) are nonfamily households. The most numerous type of family households are 2-person households, comprising 1,083, and the most common type of nonfamily households are 1-person households, comprising 1,018.
| Household Size | Family Households | Nonfamily Households |
| 1-Person Households | - | 1,018 (33.8%) |
| 2-Person Households | 1,083 (36.0%) | 132 (4.4%) |
| 3-Person Households | 299 (9.9%) | 0 (0.0%) |
| 4-Person Households | 274 (9.1%) | 0 (0.0%) |
| 5-Person Households | 161 (5.3%) | 0 (0.0%) |
| 6-Person Households | 44 (1.5%) | 0 (0.0%) |
| 7+ Person Households | 0 (0.0%) | 0 (0.0%) |
| Total | 1,861 (61.8%) | 1,150 (38.2%) |
Female Fertility in Mount Vernon
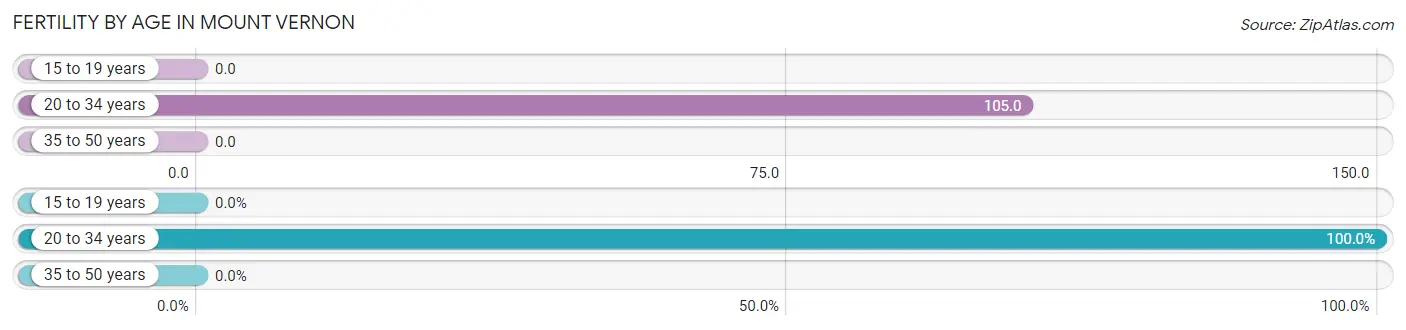
Fertility by Age in Mount Vernon
Average fertility rate in Mount Vernon is 45.0 births per 1,000 women. Women in the age bracket of 20 to 34 years have the highest fertility rate with 105.0 births per 1,000 women. Women in the age bracket of 20 to 34 years acount for 100.0% of all women with births.
| Age Bracket | Women with Births | Births / 1,000 Women |
| 15 to 19 years | 0 (0.0%) | 0.0 |
| 20 to 34 years | 58 (100.0%) | 105.0 |
| 35 to 50 years | 0 (0.0%) | 0.0 |
| Total | 58 (100.0%) | 45.0 |
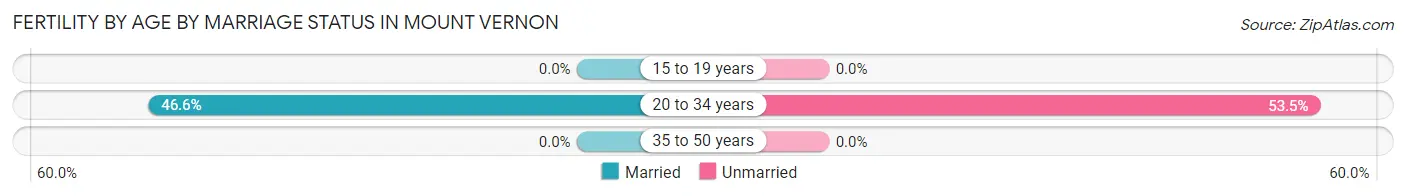
Fertility by Age by Marriage Status in Mount Vernon
46.6% of women with births (58) in Mount Vernon are married. The highest percentage of unmarried women with births falls into 20 to 34 years age bracket with 53.4% of them unmarried at the time of birth, while the lowest percentage of unmarried women with births belong to 20 to 34 years age bracket with 53.4% of them unmarried.
| Age Bracket | Married | Unmarried |
| 15 to 19 years | 0 (0.0%) | 0 (0.0%) |
| 20 to 34 years | 27 (46.6%) | 31 (53.4%) |
| 35 to 50 years | 0 (0.0%) | 0 (0.0%) |
| Total | 27 (46.6%) | 31 (53.4%) |
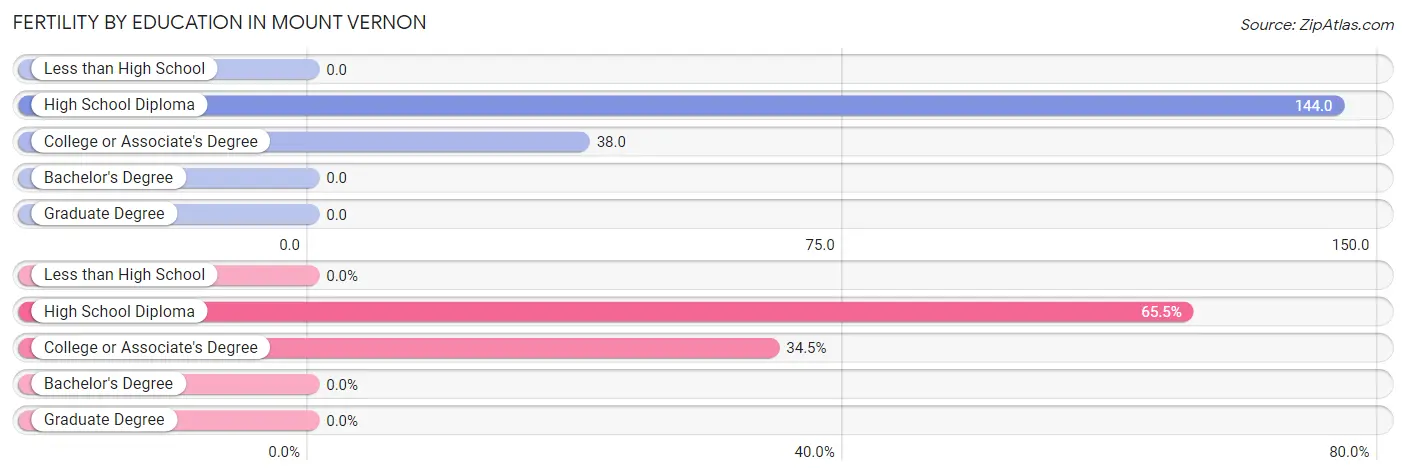
Fertility by Education in Mount Vernon
| Educational Attainment | Women with Births | Births / 1,000 Women |
| Less than High School | 0 (0.0%) | 0.0 |
| High School Diploma | 38 (65.5%) | 144.0 |
| College or Associate's Degree | 20 (34.5%) | 38.0 |
| Bachelor's Degree | 0 (0.0%) | 0.0 |
| Graduate Degree | 0 (0.0%) | 0.0 |
| Total | 58 (100.0%) | 45.0 |
Fertility by Education by Marriage Status in Mount Vernon
53.4% of women with births in Mount Vernon are unmarried. Women with the educational attainment of college or associate's degree are most likely to be married with 100.0% of them married at childbirth, while women with the educational attainment of high school diploma are least likely to be married with 81.6% of them unmarried at childbirth.

| Educational Attainment | Married | Unmarried |
| Less than High School | 0 (0.0%) | 0 (0.0%) |
| High School Diploma | 7 (18.4%) | 31 (81.6%) |
| College or Associate's Degree | 20 (100.0%) | 0 (0.0%) |
| Bachelor's Degree | 0 (0.0%) | 0 (0.0%) |
| Graduate Degree | 0 (0.0%) | 0 (0.0%) |
| Total | 27 (46.6%) | 31 (53.4%) |
Employment Characteristics in Mount Vernon
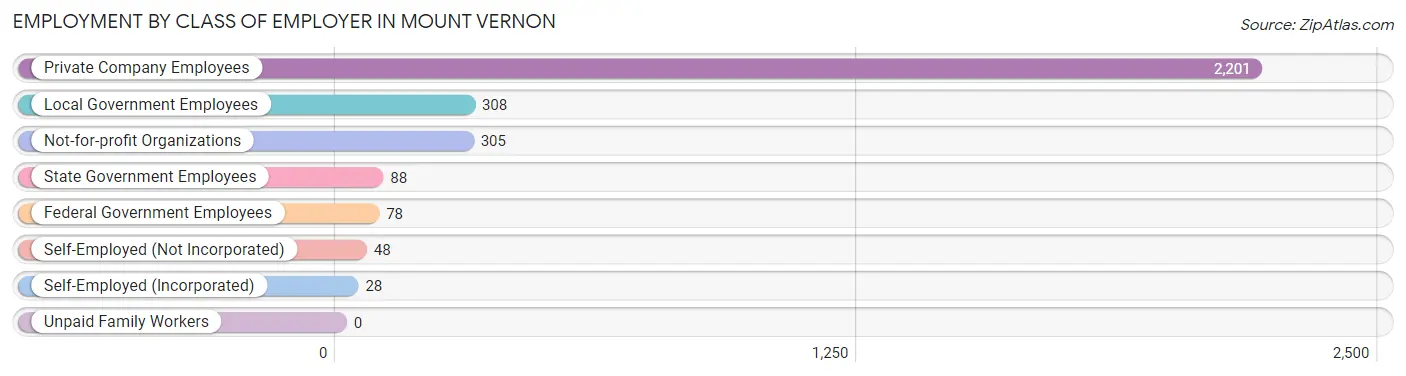
Employment by Class of Employer in Mount Vernon
Among the 3,056 employed individuals in Mount Vernon, private company employees (2,201 | 72.0%), local government employees (308 | 10.1%), and not-for-profit organizations (305 | 10.0%) make up the most common classes of employment.
| Employer Class | # Employees | % Employees |
| Private Company Employees | 2,201 | 72.0% |
| Self-Employed (Incorporated) | 28 | 0.9% |
| Self-Employed (Not Incorporated) | 48 | 1.6% |
| Not-for-profit Organizations | 305 | 10.0% |
| Local Government Employees | 308 | 10.1% |
| State Government Employees | 88 | 2.9% |
| Federal Government Employees | 78 | 2.5% |
| Unpaid Family Workers | 0 | 0.0% |
| Total | 3,056 | 100.0% |
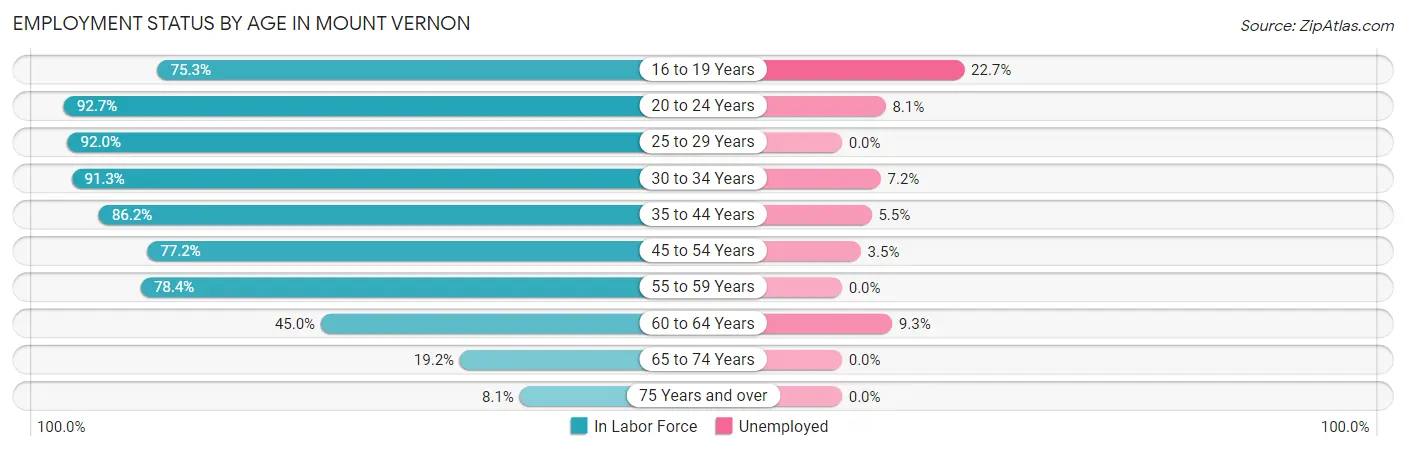
Employment Status by Age in Mount Vernon
According to the labor force statistics for Mount Vernon, out of the total population over 16 years of age (5,275), 62.3% or 3,286 individuals are in the labor force, with 5.5% or 181 of them unemployed. The age group with the highest labor force participation rate is 20 to 24 years, with 92.7% or 332 individuals in the labor force. Within the labor force, the 16 to 19 years age range has the highest percentage of unemployed individuals, with 22.7% or 50 of them being unemployed.
| Age Bracket | In Labor Force | Unemployed |
| 16 to 19 Years | 220 (75.3%) | 50 (22.7%) |
| 20 to 24 Years | 332 (92.7%) | 27 (8.1%) |
| 25 to 29 Years | 436 (92.0%) | 0 (0.0%) |
| 30 to 34 Years | 377 (91.3%) | 27 (7.2%) |
| 35 to 44 Years | 649 (86.2%) | 36 (5.5%) |
| 45 to 54 Years | 521 (77.2%) | 18 (3.5%) |
| 55 to 59 Years | 319 (78.4%) | 0 (0.0%) |
| 60 to 64 Years | 236 (45.0%) | 22 (9.3%) |
| 65 to 74 Years | 150 (19.2%) | 0 (0.0%) |
| 75 Years and over | 48 (8.1%) | 0 (0.0%) |
| Total | 3,286 (62.3%) | 181 (5.5%) |
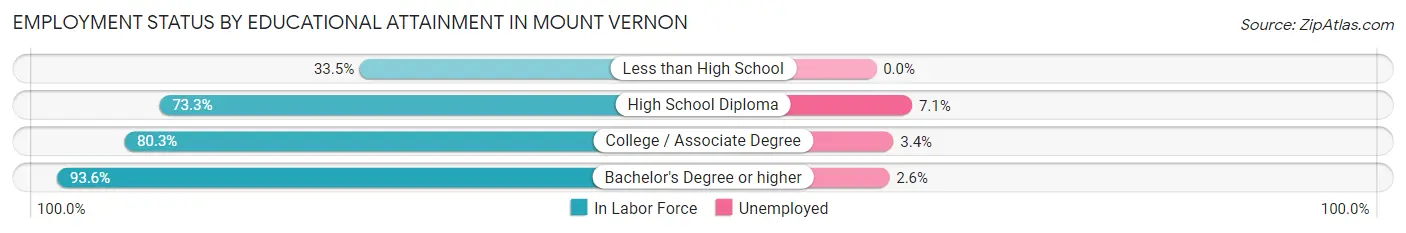
Employment Status by Educational Attainment in Mount Vernon
According to labor force statistics for Mount Vernon, 78.2% of individuals (2,538) out of the total population between 25 and 64 years of age (3,246) are in the labor force, with 4.1% or 104 of them being unemployed. The group with the highest labor force participation rate are those with the educational attainment of bachelor's degree or higher, with 93.6% or 734 individuals in the labor force. Within the labor force, individuals with high school diploma education have the highest percentage of unemployment, with 7.1% or 48 of them being unemployed.
| Educational Attainment | In Labor Force | Unemployed |
| Less than High School | 78 (33.5%) | 0 (0.0%) |
| High School Diploma | 672 (73.3%) | 65 (7.1%) |
| College / Associate Degree | 1,054 (80.3%) | 45 (3.4%) |
| Bachelor's Degree or higher | 734 (93.6%) | 20 (2.6%) |
| Total | 2,538 (78.2%) | 133 (4.1%) |
Employment Occupations by Sex in Mount Vernon
Management, Business, Science and Arts Occupations
The most common Management, Business, Science and Arts occupations in Mount Vernon are Computers, Engineering & Science (354 | 11.4%), Community & Social Service (333 | 10.7%), Education Instruction & Library (232 | 7.5%), Management (208 | 6.7%), and Health Diagnosing & Treating (172 | 5.5%).
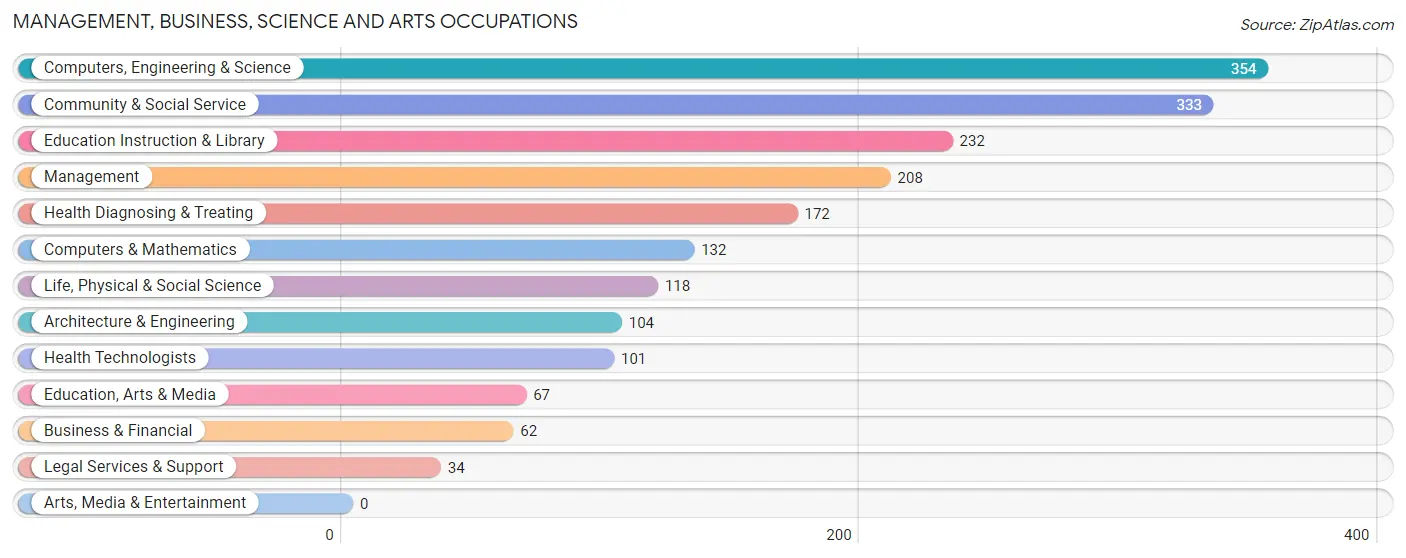
Management, Business, Science and Arts Occupations by Sex
Within the Management, Business, Science and Arts occupations in Mount Vernon, the most male-oriented occupations are Architecture & Engineering (100.0%), Legal Services & Support (100.0%), and Life, Physical & Social Science (92.4%), while the most female-oriented occupations are Education Instruction & Library (100.0%), Health Diagnosing & Treating (88.9%), and Health Technologists (81.2%).
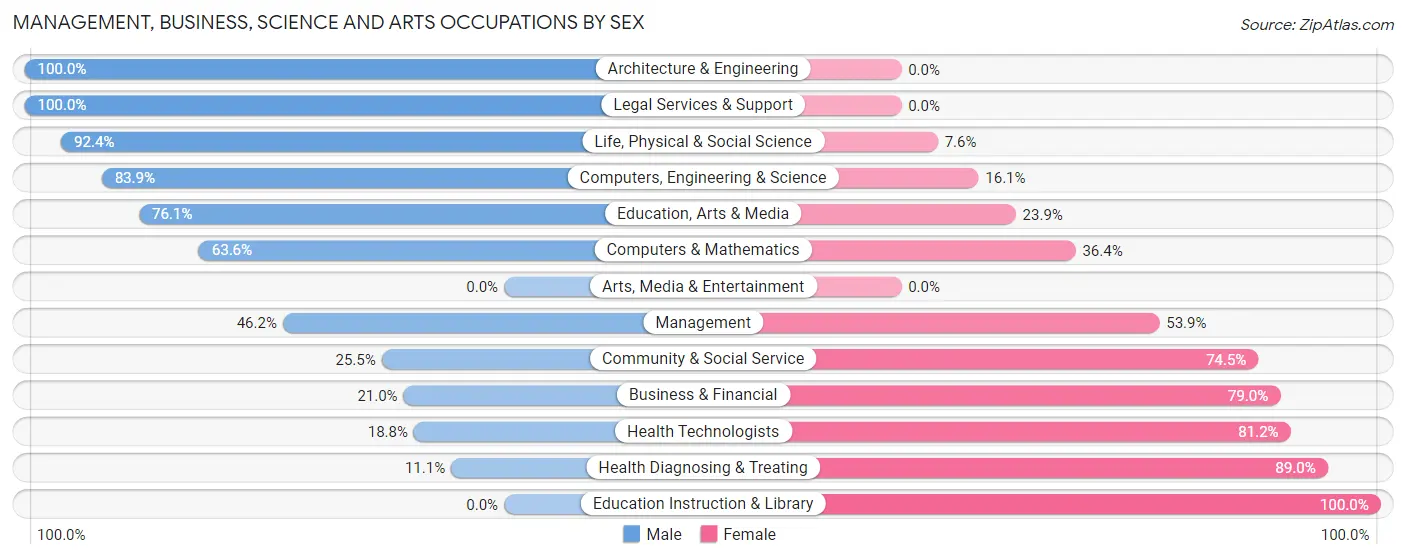
| Occupation | Male | Female |
| Management | 96 (46.2%) | 112 (53.8%) |
| Business & Financial | 13 (21.0%) | 49 (79.0%) |
| Computers, Engineering & Science | 297 (83.9%) | 57 (16.1%) |
| Computers & Mathematics | 84 (63.6%) | 48 (36.4%) |
| Architecture & Engineering | 104 (100.0%) | 0 (0.0%) |
| Life, Physical & Social Science | 109 (92.4%) | 9 (7.6%) |
| Community & Social Service | 85 (25.5%) | 248 (74.5%) |
| Education, Arts & Media | 51 (76.1%) | 16 (23.9%) |
| Legal Services & Support | 34 (100.0%) | 0 (0.0%) |
| Education Instruction & Library | 0 (0.0%) | 232 (100.0%) |
| Arts, Media & Entertainment | 0 (0.0%) | 0 (0.0%) |
| Health Diagnosing & Treating | 19 (11.1%) | 153 (88.9%) |
| Health Technologists | 19 (18.8%) | 82 (81.2%) |
| Total (Category) | 510 (45.2%) | 619 (54.8%) |
| Total (Overall) | 1,609 (51.8%) | 1,499 (48.2%) |
Services Occupations
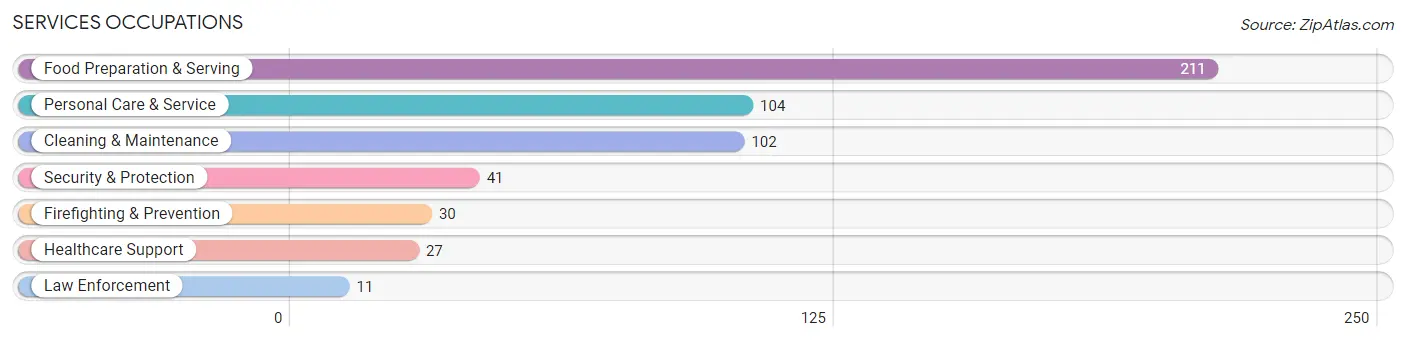
The most common Services occupations in Mount Vernon are Food Preparation & Serving (211 | 6.8%), Personal Care & Service (104 | 3.4%), Cleaning & Maintenance (102 | 3.3%), Security & Protection (41 | 1.3%), and Firefighting & Prevention (30 | 1.0%).
Services Occupations by Sex
Within the Services occupations in Mount Vernon, the most male-oriented occupations are Law Enforcement (100.0%), Security & Protection (85.4%), and Firefighting & Prevention (80.0%), while the most female-oriented occupations are Healthcare Support (100.0%), Personal Care & Service (84.6%), and Cleaning & Maintenance (33.3%).
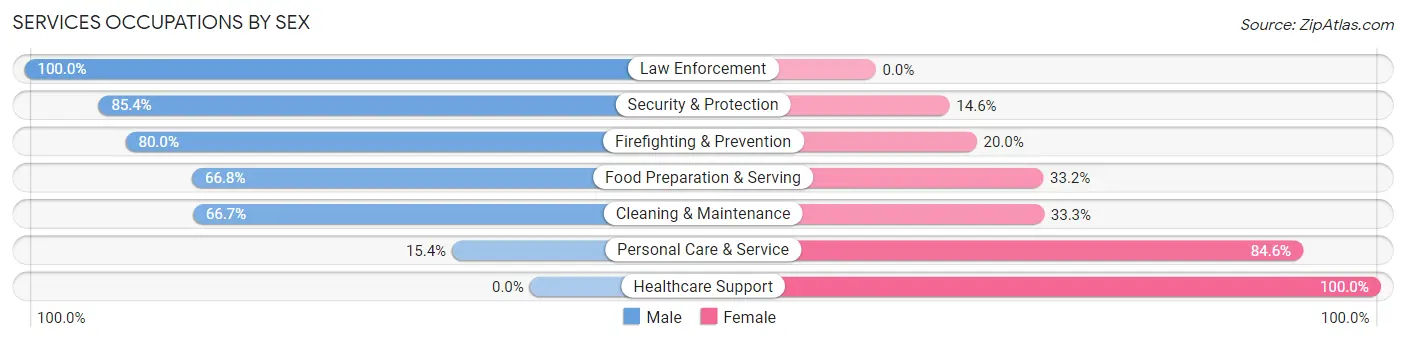
| Occupation | Male | Female |
| Healthcare Support | 0 (0.0%) | 27 (100.0%) |
| Security & Protection | 35 (85.4%) | 6 (14.6%) |
| Firefighting & Prevention | 24 (80.0%) | 6 (20.0%) |
| Law Enforcement | 11 (100.0%) | 0 (0.0%) |
| Food Preparation & Serving | 141 (66.8%) | 70 (33.2%) |
| Cleaning & Maintenance | 68 (66.7%) | 34 (33.3%) |
| Personal Care & Service | 16 (15.4%) | 88 (84.6%) |
| Total (Category) | 260 (53.6%) | 225 (46.4%) |
| Total (Overall) | 1,609 (51.8%) | 1,499 (48.2%) |
Sales and Office Occupations
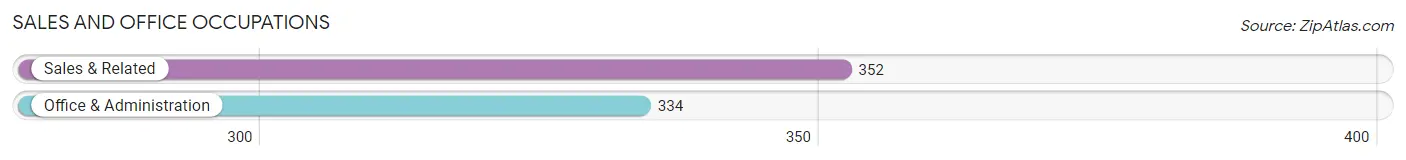
The most common Sales and Office occupations in Mount Vernon are Sales & Related (352 | 11.3%), and Office & Administration (334 | 10.7%).
Sales and Office Occupations by Sex
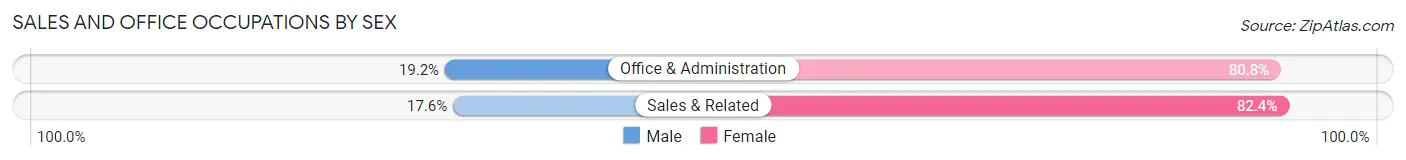
| Occupation | Male | Female |
| Sales & Related | 62 (17.6%) | 290 (82.4%) |
| Office & Administration | 64 (19.2%) | 270 (80.8%) |
| Total (Category) | 126 (18.4%) | 560 (81.6%) |
| Total (Overall) | 1,609 (51.8%) | 1,499 (48.2%) |
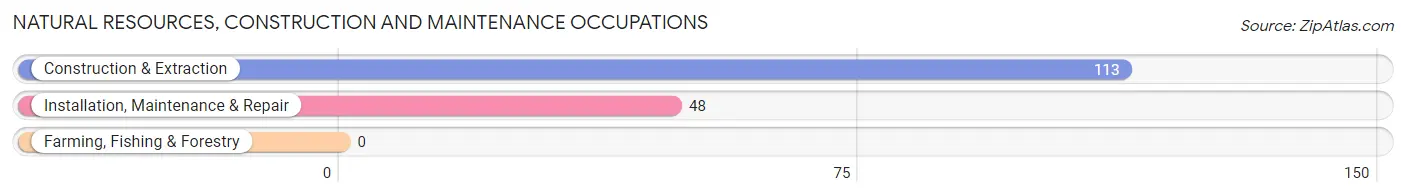
Natural Resources, Construction and Maintenance Occupations
The most common Natural Resources, Construction and Maintenance occupations in Mount Vernon are Construction & Extraction (113 | 3.6%), and Installation, Maintenance & Repair (48 | 1.5%).
Natural Resources, Construction and Maintenance Occupations by Sex
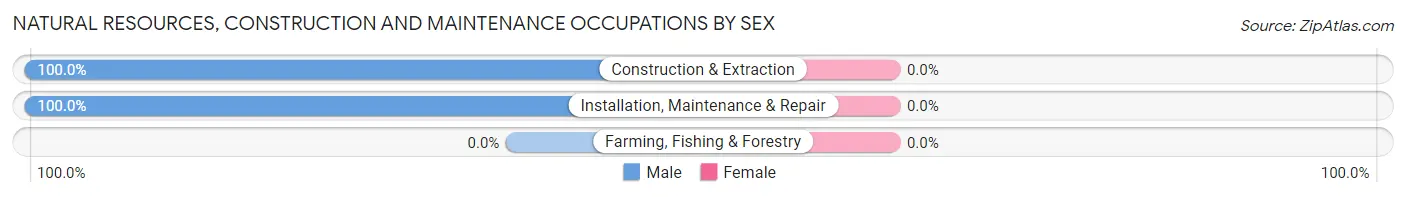
| Occupation | Male | Female |
| Farming, Fishing & Forestry | 0 (0.0%) | 0 (0.0%) |
| Construction & Extraction | 113 (100.0%) | 0 (0.0%) |
| Installation, Maintenance & Repair | 48 (100.0%) | 0 (0.0%) |
| Total (Category) | 161 (100.0%) | 0 (0.0%) |
| Total (Overall) | 1,609 (51.8%) | 1,499 (48.2%) |
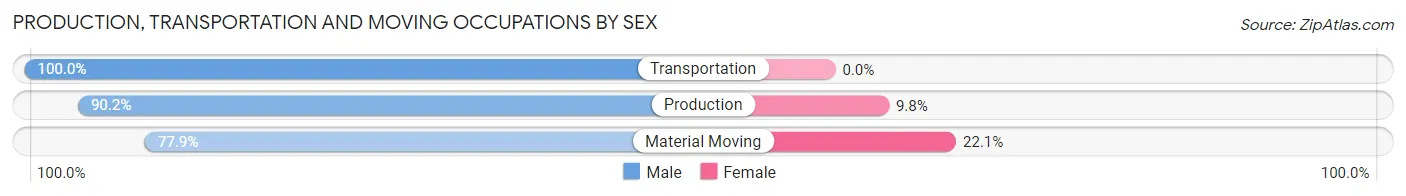
Production, Transportation and Moving Occupations
The most common Production, Transportation and Moving occupations in Mount Vernon are Material Moving (321 | 10.3%), Production (245 | 7.9%), and Transportation (81 | 2.6%).
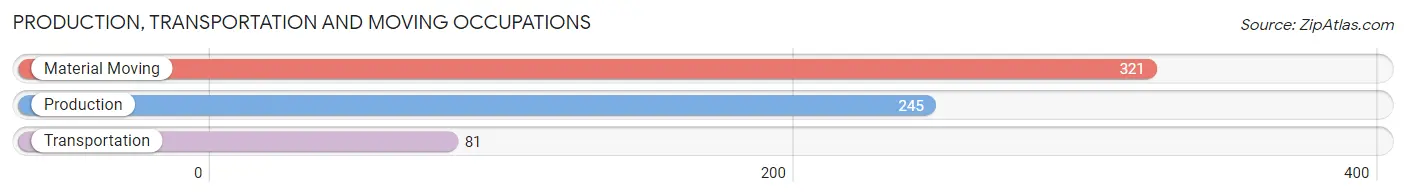
Production, Transportation and Moving Occupations by Sex
| Occupation | Male | Female |
| Production | 221 (90.2%) | 24 (9.8%) |
| Transportation | 81 (100.0%) | 0 (0.0%) |
| Material Moving | 250 (77.9%) | 71 (22.1%) |
| Total (Category) | 552 (85.3%) | 95 (14.7%) |
| Total (Overall) | 1,609 (51.8%) | 1,499 (48.2%) |
Employment Industries by Sex in Mount Vernon
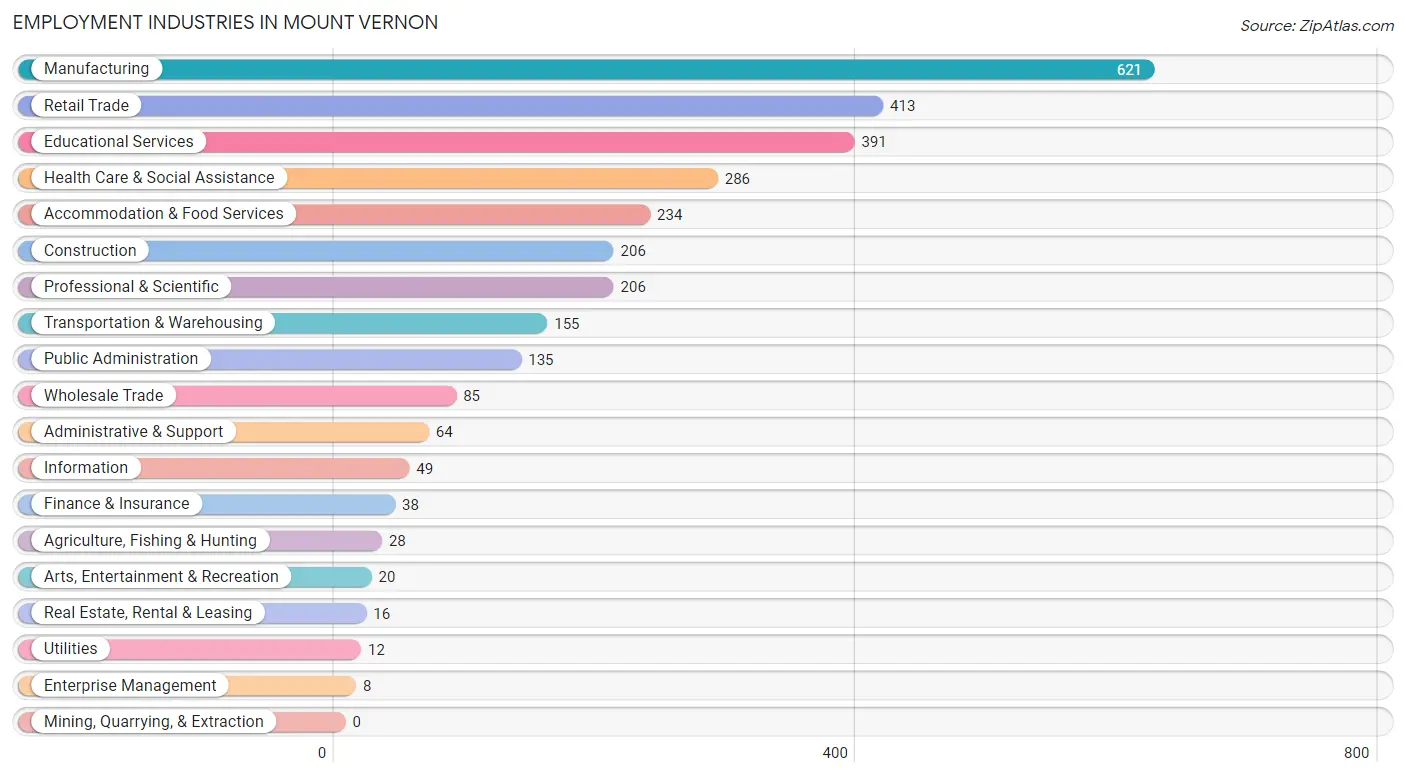
Employment Industries in Mount Vernon
The major employment industries in Mount Vernon include Manufacturing (621 | 20.0%), Retail Trade (413 | 13.3%), Educational Services (391 | 12.6%), Health Care & Social Assistance (286 | 9.2%), and Accommodation & Food Services (234 | 7.5%).
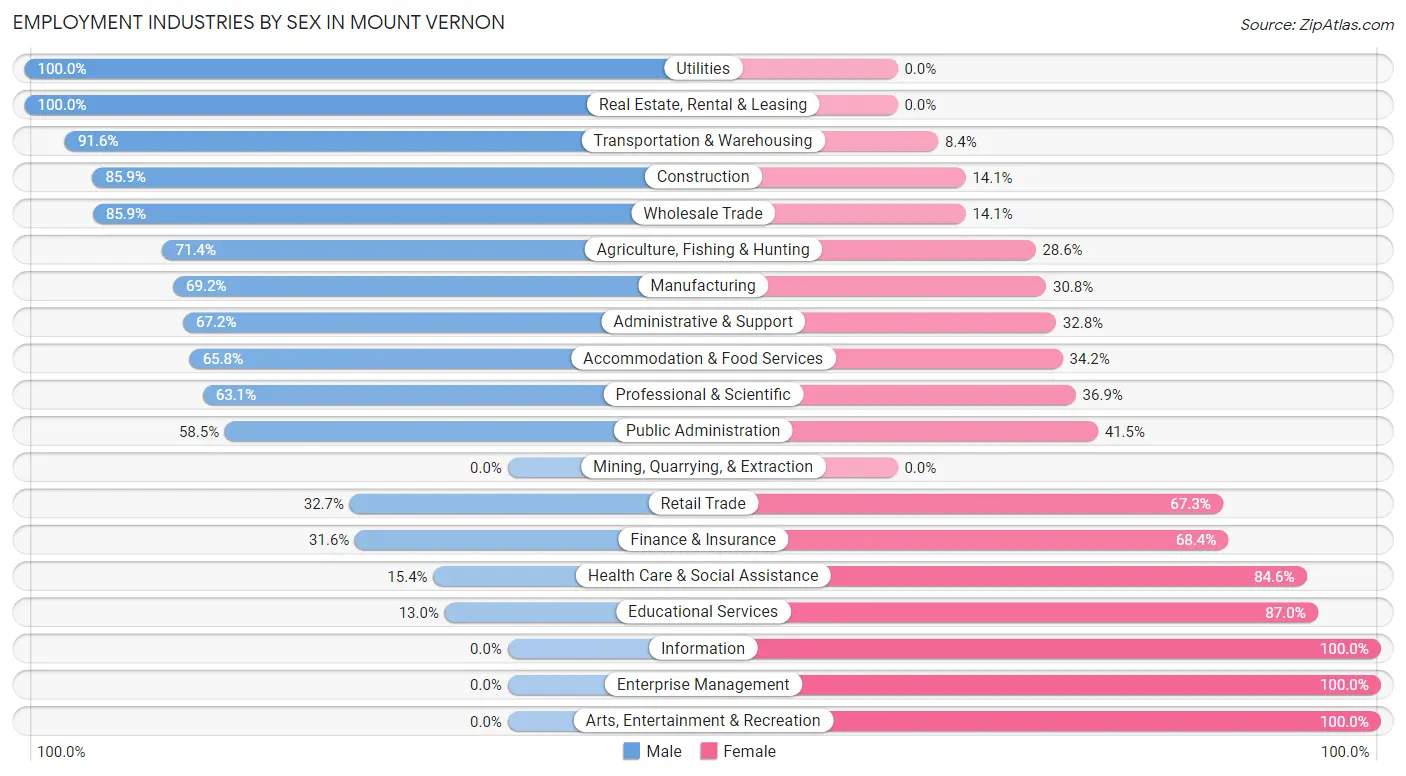
Employment Industries by Sex in Mount Vernon
The Mount Vernon industries that see more men than women are Utilities (100.0%), Real Estate, Rental & Leasing (100.0%), and Transportation & Warehousing (91.6%), whereas the industries that tend to have a higher number of women are Information (100.0%), Enterprise Management (100.0%), and Arts, Entertainment & Recreation (100.0%).
| Industry | Male | Female |
| Agriculture, Fishing & Hunting | 20 (71.4%) | 8 (28.6%) |
| Mining, Quarrying, & Extraction | 0 (0.0%) | 0 (0.0%) |
| Construction | 177 (85.9%) | 29 (14.1%) |
| Manufacturing | 430 (69.2%) | 191 (30.8%) |
| Wholesale Trade | 73 (85.9%) | 12 (14.1%) |
| Retail Trade | 135 (32.7%) | 278 (67.3%) |
| Transportation & Warehousing | 142 (91.6%) | 13 (8.4%) |
| Utilities | 12 (100.0%) | 0 (0.0%) |
| Information | 0 (0.0%) | 49 (100.0%) |
| Finance & Insurance | 12 (31.6%) | 26 (68.4%) |
| Real Estate, Rental & Leasing | 16 (100.0%) | 0 (0.0%) |
| Professional & Scientific | 130 (63.1%) | 76 (36.9%) |
| Enterprise Management | 0 (0.0%) | 8 (100.0%) |
| Administrative & Support | 43 (67.2%) | 21 (32.8%) |
| Educational Services | 51 (13.0%) | 340 (87.0%) |
| Health Care & Social Assistance | 44 (15.4%) | 242 (84.6%) |
| Arts, Entertainment & Recreation | 0 (0.0%) | 20 (100.0%) |
| Accommodation & Food Services | 154 (65.8%) | 80 (34.2%) |
| Public Administration | 79 (58.5%) | 56 (41.5%) |
| Total | 1,609 (51.8%) | 1,499 (48.2%) |
Education in Mount Vernon
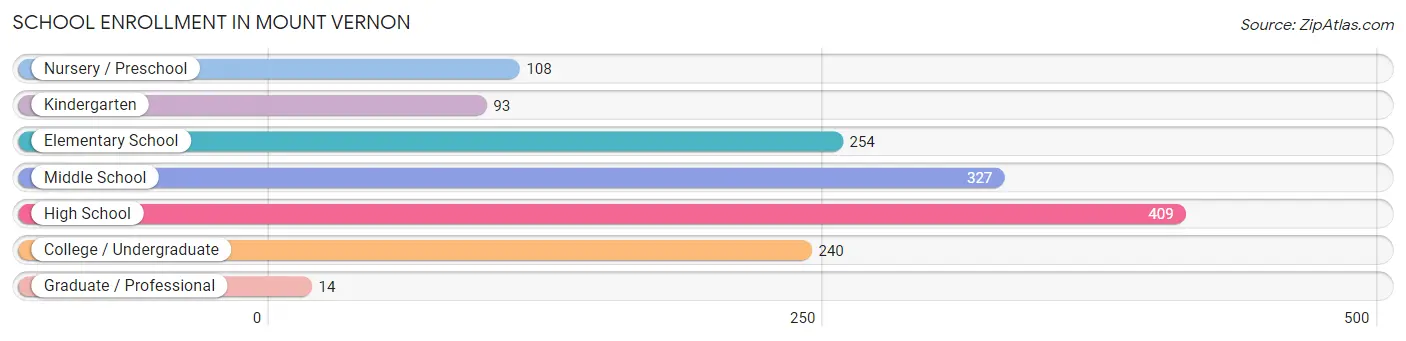
School Enrollment in Mount Vernon
The most common levels of schooling among the 1,445 students in Mount Vernon are high school (409 | 28.3%), middle school (327 | 22.6%), and elementary school (254 | 17.6%).
| School Level | # Students | % Students |
| Nursery / Preschool | 108 | 7.5% |
| Kindergarten | 93 | 6.4% |
| Elementary School | 254 | 17.6% |
| Middle School | 327 | 22.6% |
| High School | 409 | 28.3% |
| College / Undergraduate | 240 | 16.6% |
| Graduate / Professional | 14 | 1.0% |
| Total | 1,445 | 100.0% |
School Enrollment by Age by Funding Source in Mount Vernon
Out of a total of 1,445 students who are enrolled in schools in Mount Vernon, 173 (12.0%) attend a private institution, while the remaining 1,272 (88.0%) are enrolled in public schools. The age group of 15 to 17 year olds has the highest likelihood of being enrolled in private schools, with 60 (22.7% in the age bracket) enrolled. Conversely, the age group of 3 to 4 year olds has the lowest likelihood of being enrolled in a private school, with 88 (100.0% in the age bracket) attending a public institution.
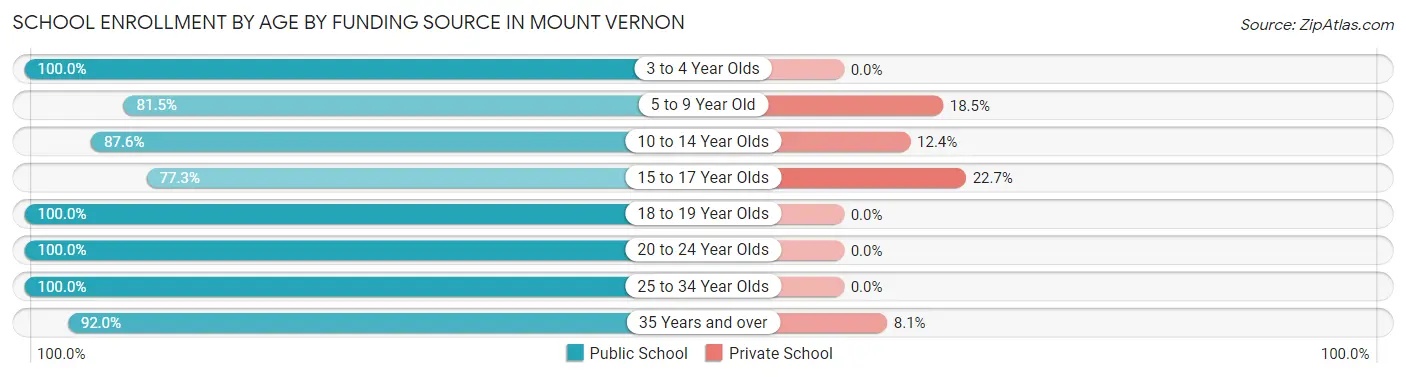
| Age Bracket | Public School | Private School |
| 3 to 4 Year Olds | 88 (100.0%) | 0 (0.0%) |
| 5 to 9 Year Old | 265 (81.5%) | 60 (18.5%) |
| 10 to 14 Year Olds | 333 (87.6%) | 47 (12.4%) |
| 15 to 17 Year Olds | 204 (77.3%) | 60 (22.7%) |
| 18 to 19 Year Olds | 97 (100.0%) | 0 (0.0%) |
| 20 to 24 Year Olds | 134 (100.0%) | 0 (0.0%) |
| 25 to 34 Year Olds | 70 (100.0%) | 0 (0.0%) |
| 35 Years and over | 80 (91.9%) | 7 (8.1%) |
| Total | 1,272 (88.0%) | 173 (12.0%) |
Educational Attainment by Field of Study in Mount Vernon
Education (255 | 23.6%), engineering (152 | 14.1%), bio, nature & agricultural (121 | 11.2%), science & technology (114 | 10.5%), and business (107 | 9.9%) are the most common fields of study among 1,081 individuals in Mount Vernon who have obtained a bachelor's degree or higher.
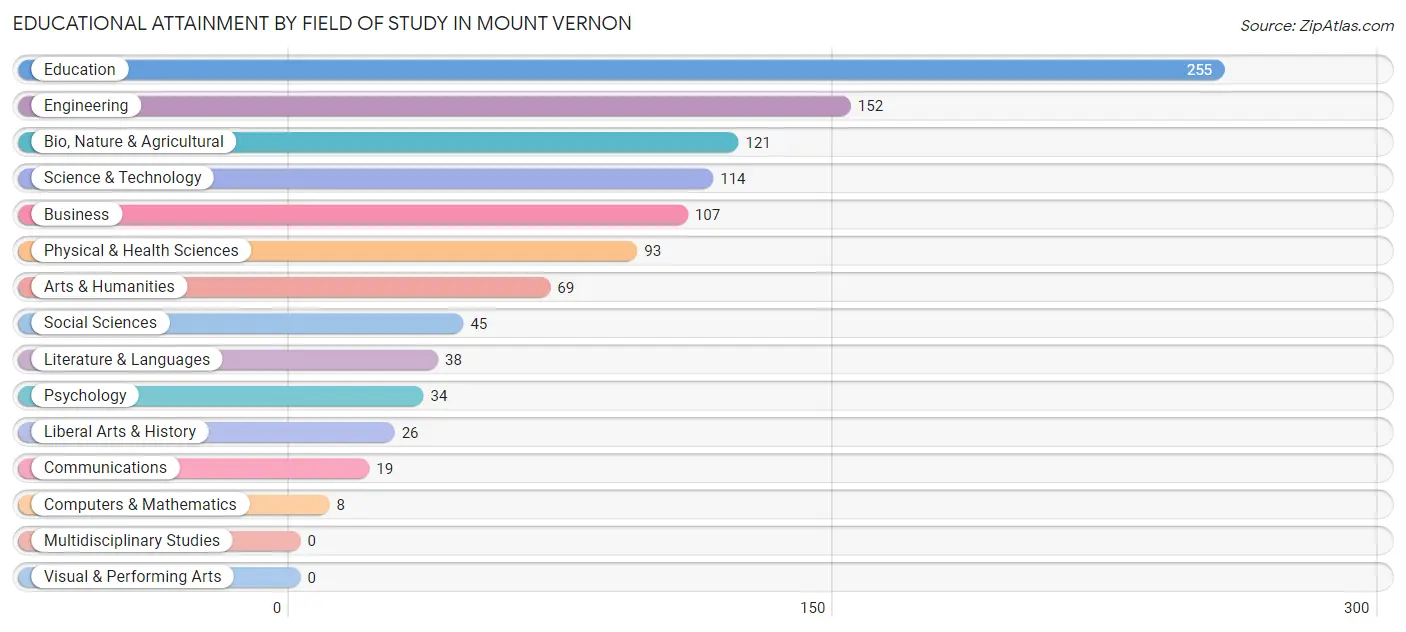
| Field of Study | # Graduates | % Graduates |
| Computers & Mathematics | 8 | 0.7% |
| Bio, Nature & Agricultural | 121 | 11.2% |
| Physical & Health Sciences | 93 | 8.6% |
| Psychology | 34 | 3.2% |
| Social Sciences | 45 | 4.2% |
| Engineering | 152 | 14.1% |
| Multidisciplinary Studies | 0 | 0.0% |
| Science & Technology | 114 | 10.5% |
| Business | 107 | 9.9% |
| Education | 255 | 23.6% |
| Literature & Languages | 38 | 3.5% |
| Liberal Arts & History | 26 | 2.4% |
| Visual & Performing Arts | 0 | 0.0% |
| Communications | 19 | 1.8% |
| Arts & Humanities | 69 | 6.4% |
| Total | 1,081 | 100.0% |
Transportation & Commute in Mount Vernon
Vehicle Availability by Sex in Mount Vernon
The most prevalent vehicle ownership categories in Mount Vernon are males with 2 vehicles (623, accounting for 39.6%) and females with 2 vehicles (569, making up 42.4%).
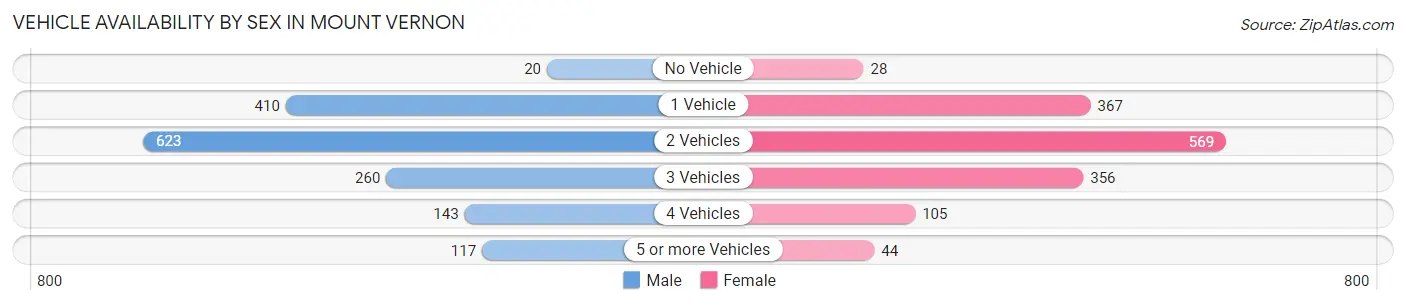
| Vehicles Available | Male | Female |
| No Vehicle | 20 (1.3%) | 28 (1.9%) |
| 1 Vehicle | 410 (26.1%) | 367 (25.0%) |
| 2 Vehicles | 623 (39.6%) | 569 (38.7%) |
| 3 Vehicles | 260 (16.5%) | 356 (24.2%) |
| 4 Vehicles | 143 (9.1%) | 105 (7.1%) |
| 5 or more Vehicles | 117 (7.4%) | 44 (3.0%) |
| Total | 1,573 (100.0%) | 1,469 (100.0%) |
Commute Time in Mount Vernon
The most frequently occuring commute durations in Mount Vernon are 5 to 9 minutes (924 commuters, 31.4%), 10 to 14 minutes (750 commuters, 25.5%), and 35 to 39 minutes (227 commuters, 7.7%).
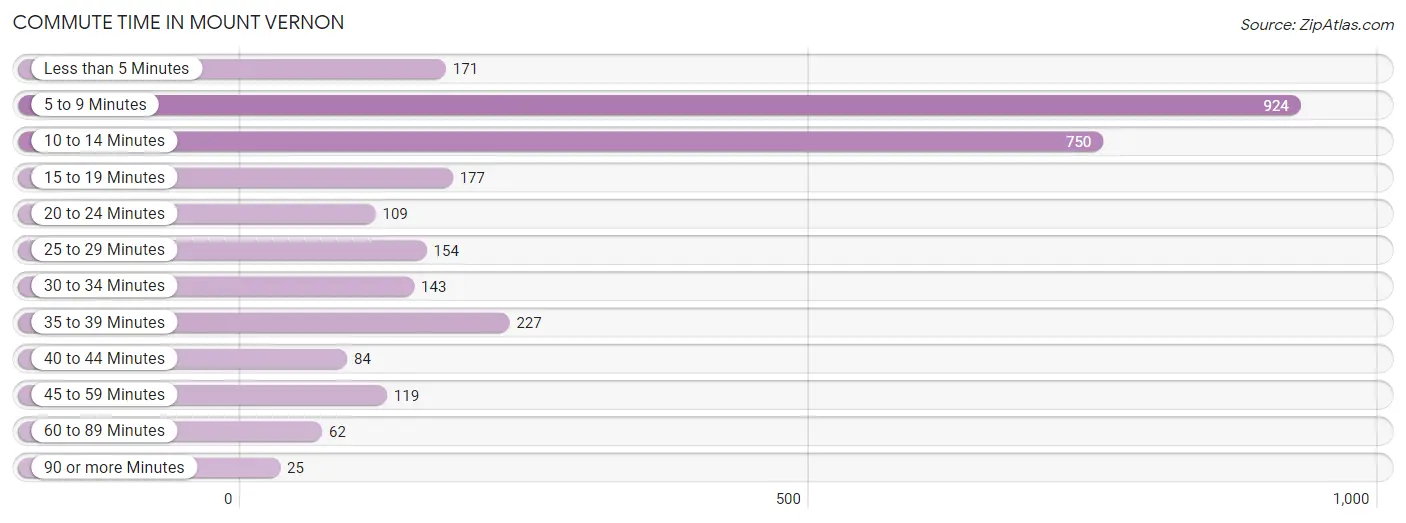
| Commute Time | # Commuters | % Commuters |
| Less than 5 Minutes | 171 | 5.8% |
| 5 to 9 Minutes | 924 | 31.4% |
| 10 to 14 Minutes | 750 | 25.5% |
| 15 to 19 Minutes | 177 | 6.0% |
| 20 to 24 Minutes | 109 | 3.7% |
| 25 to 29 Minutes | 154 | 5.2% |
| 30 to 34 Minutes | 143 | 4.9% |
| 35 to 39 Minutes | 227 | 7.7% |
| 40 to 44 Minutes | 84 | 2.9% |
| 45 to 59 Minutes | 119 | 4.0% |
| 60 to 89 Minutes | 62 | 2.1% |
| 90 or more Minutes | 25 | 0.9% |
Commute Time by Sex in Mount Vernon
The most common commute times in Mount Vernon are 5 to 9 minutes (494 commuters, 32.3%) for males and 5 to 9 minutes (430 commuters, 30.4%) for females.
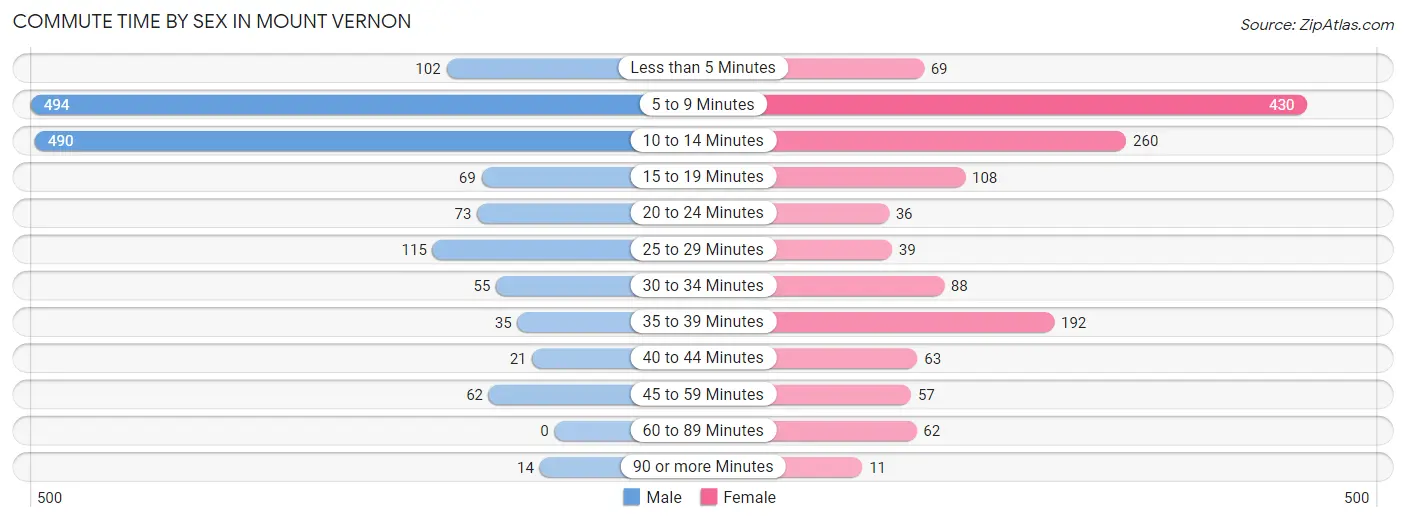
| Commute Time | Male | Female |
| Less than 5 Minutes | 102 (6.7%) | 69 (4.9%) |
| 5 to 9 Minutes | 494 (32.3%) | 430 (30.4%) |
| 10 to 14 Minutes | 490 (32.0%) | 260 (18.4%) |
| 15 to 19 Minutes | 69 (4.5%) | 108 (7.6%) |
| 20 to 24 Minutes | 73 (4.8%) | 36 (2.5%) |
| 25 to 29 Minutes | 115 (7.5%) | 39 (2.8%) |
| 30 to 34 Minutes | 55 (3.6%) | 88 (6.2%) |
| 35 to 39 Minutes | 35 (2.3%) | 192 (13.6%) |
| 40 to 44 Minutes | 21 (1.4%) | 63 (4.4%) |
| 45 to 59 Minutes | 62 (4.1%) | 57 (4.0%) |
| 60 to 89 Minutes | 0 (0.0%) | 62 (4.4%) |
| 90 or more Minutes | 14 (0.9%) | 11 (0.8%) |
Time of Departure to Work by Sex in Mount Vernon
The most frequent times of departure to work in Mount Vernon are 6:30 AM to 6:59 AM (234, 15.3%) for males and 7:00 AM to 7:29 AM (485, 34.3%) for females.
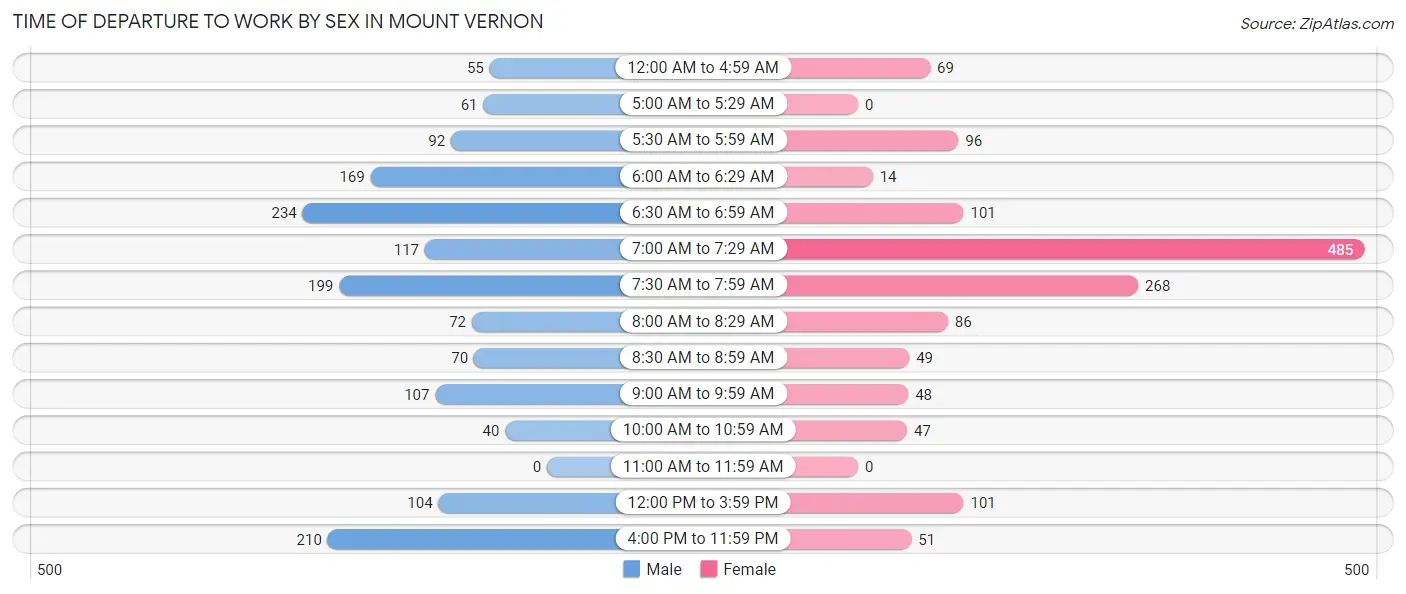
| Time of Departure | Male | Female |
| 12:00 AM to 4:59 AM | 55 (3.6%) | 69 (4.9%) |
| 5:00 AM to 5:29 AM | 61 (4.0%) | 0 (0.0%) |
| 5:30 AM to 5:59 AM | 92 (6.0%) | 96 (6.8%) |
| 6:00 AM to 6:29 AM | 169 (11.1%) | 14 (1.0%) |
| 6:30 AM to 6:59 AM | 234 (15.3%) | 101 (7.1%) |
| 7:00 AM to 7:29 AM | 117 (7.6%) | 485 (34.3%) |
| 7:30 AM to 7:59 AM | 199 (13.0%) | 268 (18.9%) |
| 8:00 AM to 8:29 AM | 72 (4.7%) | 86 (6.1%) |
| 8:30 AM to 8:59 AM | 70 (4.6%) | 49 (3.5%) |
| 9:00 AM to 9:59 AM | 107 (7.0%) | 48 (3.4%) |
| 10:00 AM to 10:59 AM | 40 (2.6%) | 47 (3.3%) |
| 11:00 AM to 11:59 AM | 0 (0.0%) | 0 (0.0%) |
| 12:00 PM to 3:59 PM | 104 (6.8%) | 101 (7.1%) |
| 4:00 PM to 11:59 PM | 210 (13.7%) | 51 (3.6%) |
| Total | 1,530 (100.0%) | 1,415 (100.0%) |
Housing Occupancy in Mount Vernon
Occupancy by Ownership in Mount Vernon
Of the total 3,011 dwellings in Mount Vernon, owner-occupied units account for 1,909 (63.4%), while renter-occupied units make up 1,102 (36.6%).
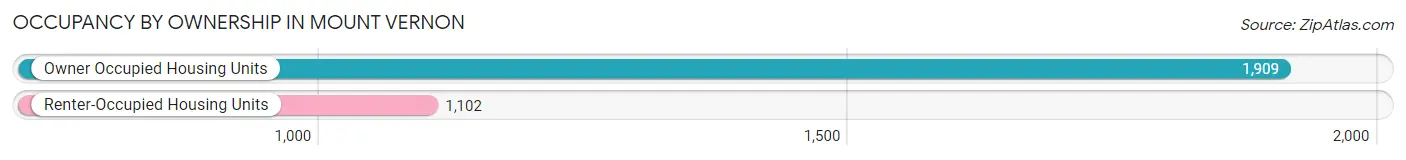
| Occupancy | # Housing Units | % Housing Units |
| Owner Occupied Housing Units | 1,909 | 63.4% |
| Renter-Occupied Housing Units | 1,102 | 36.6% |
| Total Occupied Housing Units | 3,011 | 100.0% |
Occupancy by Household Size in Mount Vernon
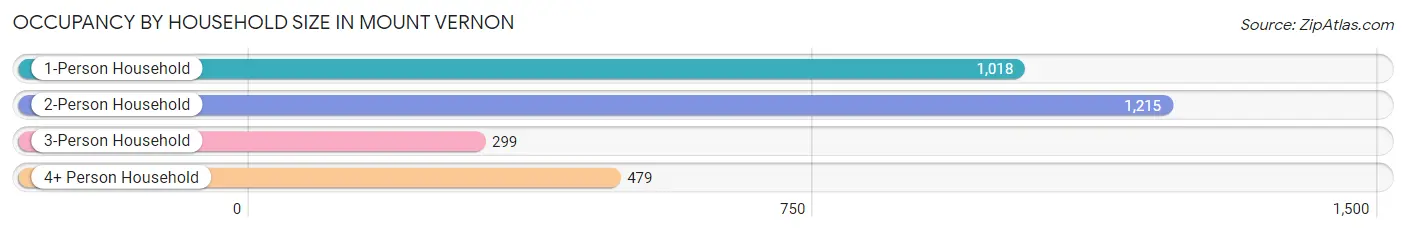
| Household Size | # Housing Units | % Housing Units |
| 1-Person Household | 1,018 | 33.8% |
| 2-Person Household | 1,215 | 40.4% |
| 3-Person Household | 299 | 9.9% |
| 4+ Person Household | 479 | 15.9% |
| Total Housing Units | 3,011 | 100.0% |
Occupancy by Ownership by Household Size in Mount Vernon
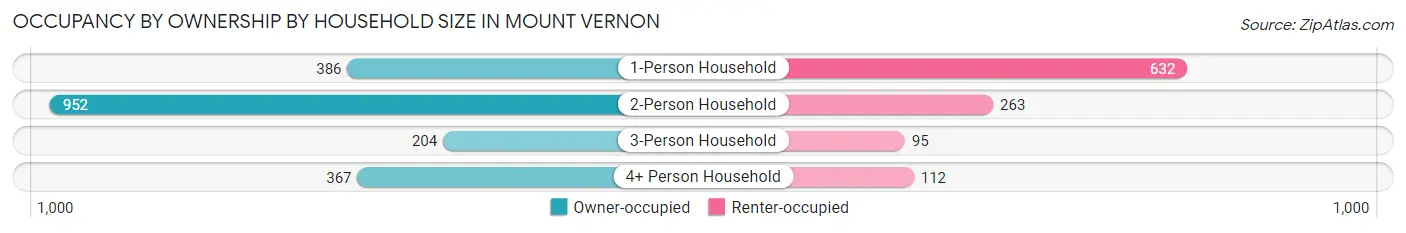
| Household Size | Owner-occupied | Renter-occupied |
| 1-Person Household | 386 (37.9%) | 632 (62.1%) |
| 2-Person Household | 952 (78.3%) | 263 (21.6%) |
| 3-Person Household | 204 (68.2%) | 95 (31.8%) |
| 4+ Person Household | 367 (76.6%) | 112 (23.4%) |
| Total Housing Units | 1,909 (63.4%) | 1,102 (36.6%) |
Occupancy by Educational Attainment in Mount Vernon
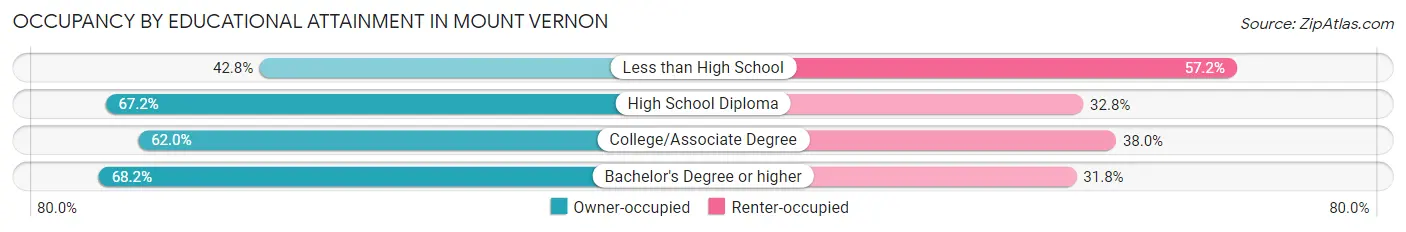
| Household Size | Owner-occupied | Renter-occupied |
| Less than High School | 122 (42.8%) | 163 (57.2%) |
| High School Diploma | 712 (67.2%) | 348 (32.8%) |
| College/Associate Degree | 611 (62.0%) | 375 (38.0%) |
| Bachelor's Degree or higher | 464 (68.2%) | 216 (31.8%) |
Occupancy by Age of Householder in Mount Vernon
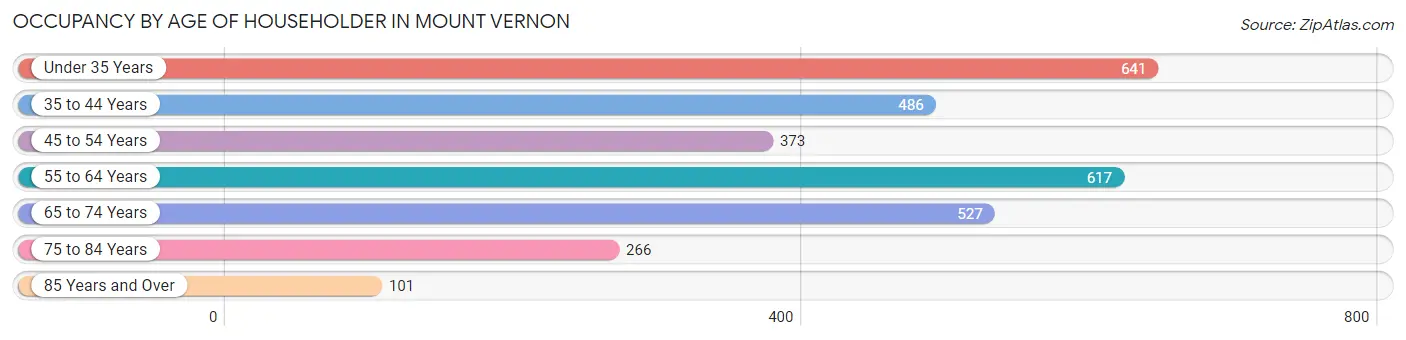
| Age Bracket | # Households | % Households |
| Under 35 Years | 641 | 21.3% |
| 35 to 44 Years | 486 | 16.1% |
| 45 to 54 Years | 373 | 12.4% |
| 55 to 64 Years | 617 | 20.5% |
| 65 to 74 Years | 527 | 17.5% |
| 75 to 84 Years | 266 | 8.8% |
| 85 Years and Over | 101 | 3.4% |
| Total | 3,011 | 100.0% |
Housing Finances in Mount Vernon
Median Income by Occupancy in Mount Vernon
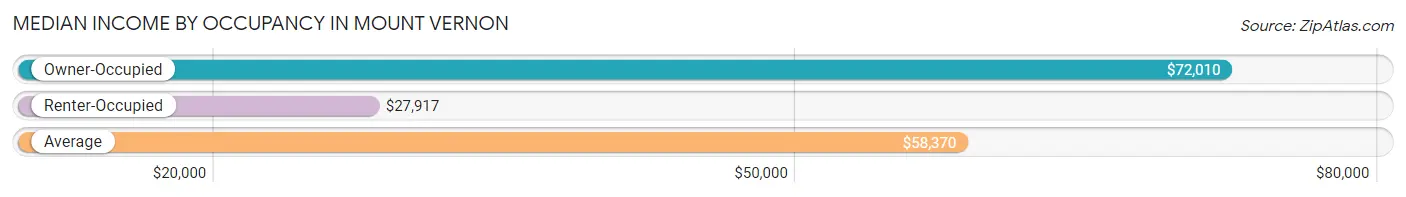
| Occupancy Type | # Households | Median Income |
| Owner-Occupied | 1,909 (63.4%) | $72,010 |
| Renter-Occupied | 1,102 (36.6%) | $27,917 |
| Average | 3,011 (100.0%) | $58,370 |
Occupancy by Householder Income Bracket in Mount Vernon
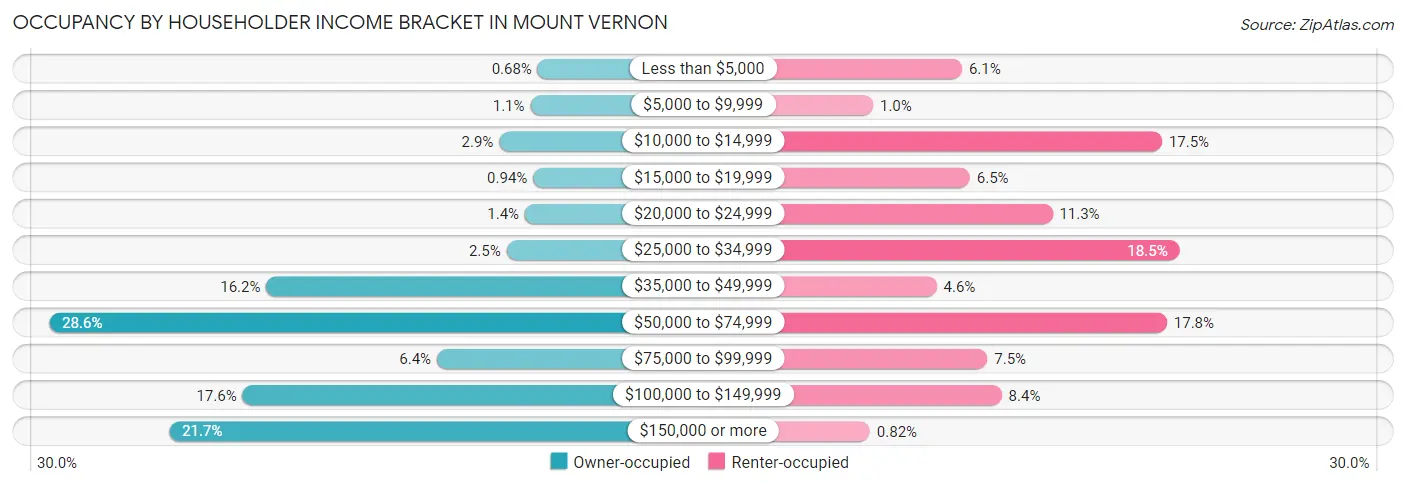
| Income Bracket | Owner-occupied | Renter-occupied |
| Less than $5,000 | 13 (0.7%) | 67 (6.1%) |
| $5,000 to $9,999 | 21 (1.1%) | 11 (1.0%) |
| $10,000 to $14,999 | 55 (2.9%) | 193 (17.5%) |
| $15,000 to $19,999 | 18 (0.9%) | 72 (6.5%) |
| $20,000 to $24,999 | 27 (1.4%) | 124 (11.3%) |
| $25,000 to $34,999 | 47 (2.5%) | 204 (18.5%) |
| $35,000 to $49,999 | 309 (16.2%) | 51 (4.6%) |
| $50,000 to $74,999 | 546 (28.6%) | 196 (17.8%) |
| $75,000 to $99,999 | 123 (6.4%) | 83 (7.5%) |
| $100,000 to $149,999 | 335 (17.5%) | 92 (8.4%) |
| $150,000 or more | 415 (21.7%) | 9 (0.8%) |
| Total | 1,909 (100.0%) | 1,102 (100.0%) |
Monthly Housing Cost Tiers in Mount Vernon
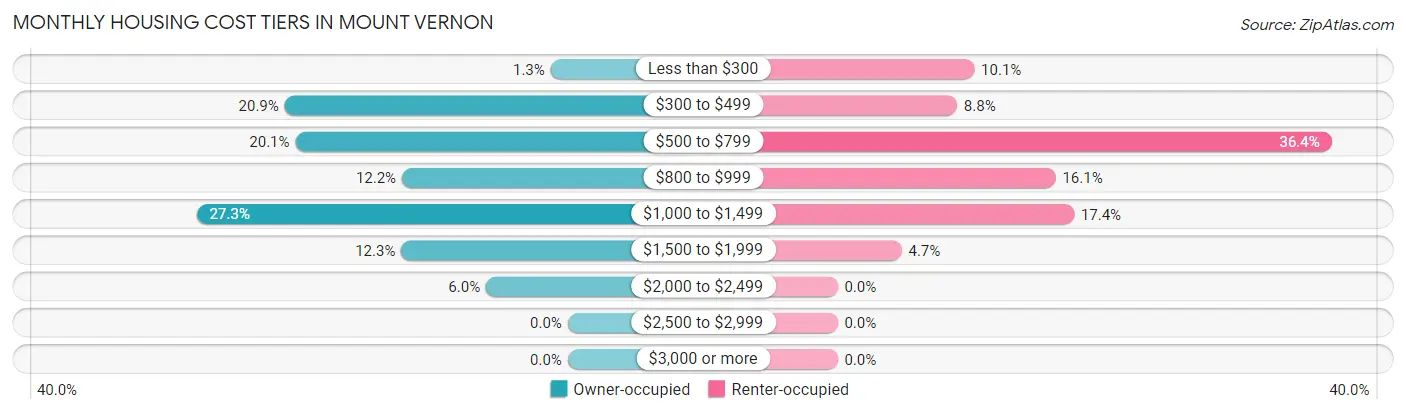
| Monthly Cost | Owner-occupied | Renter-occupied |
| Less than $300 | 24 (1.3%) | 111 (10.1%) |
| $300 to $499 | 398 (20.8%) | 97 (8.8%) |
| $500 to $799 | 383 (20.1%) | 401 (36.4%) |
| $800 to $999 | 233 (12.2%) | 177 (16.1%) |
| $1,000 to $1,499 | 522 (27.3%) | 192 (17.4%) |
| $1,500 to $1,999 | 234 (12.3%) | 52 (4.7%) |
| $2,000 to $2,499 | 115 (6.0%) | 0 (0.0%) |
| $2,500 to $2,999 | 0 (0.0%) | 0 (0.0%) |
| $3,000 or more | 0 (0.0%) | 0 (0.0%) |
| Total | 1,909 (100.0%) | 1,102 (100.0%) |
Physical Housing Characteristics in Mount Vernon
Housing Structures in Mount Vernon
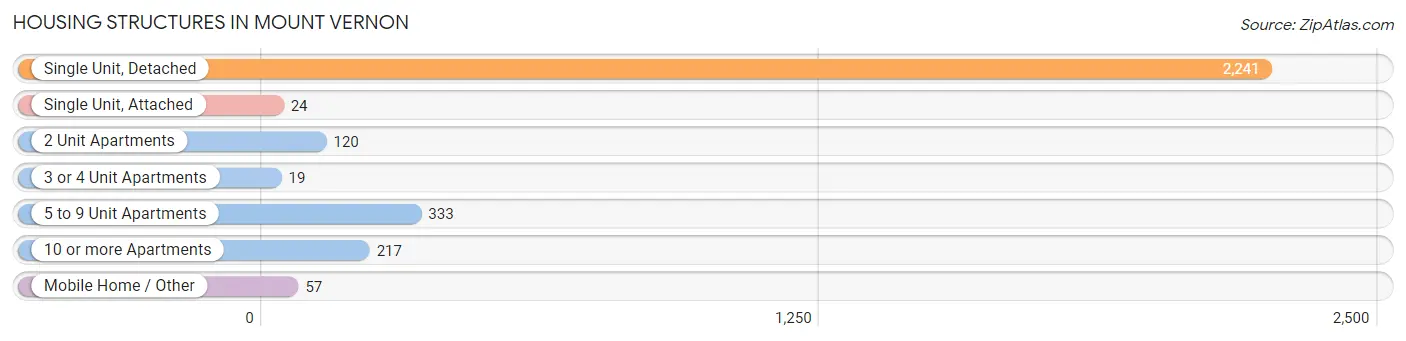
| Structure Type | # Housing Units | % Housing Units |
| Single Unit, Detached | 2,241 | 74.4% |
| Single Unit, Attached | 24 | 0.8% |
| 2 Unit Apartments | 120 | 4.0% |
| 3 or 4 Unit Apartments | 19 | 0.6% |
| 5 to 9 Unit Apartments | 333 | 11.1% |
| 10 or more Apartments | 217 | 7.2% |
| Mobile Home / Other | 57 | 1.9% |
| Total | 3,011 | 100.0% |
Housing Structures by Occupancy in Mount Vernon
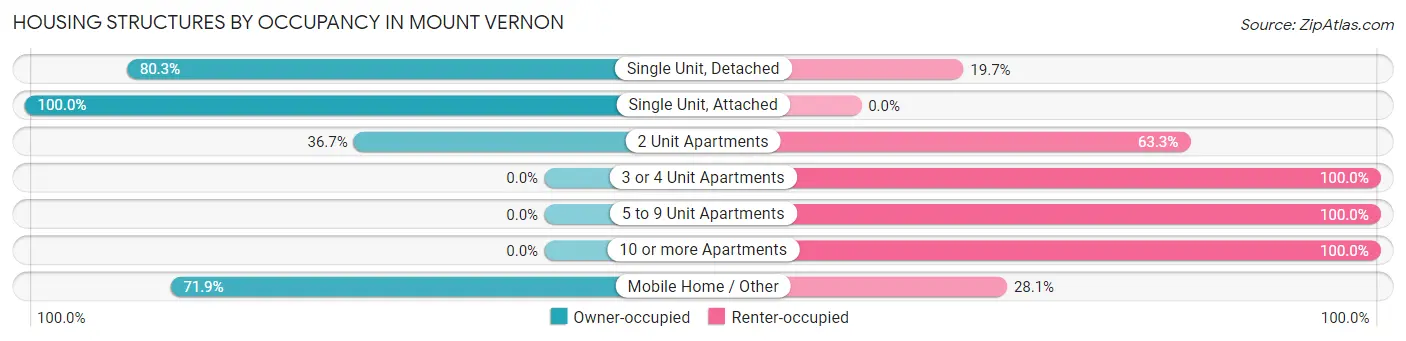
| Structure Type | Owner-occupied | Renter-occupied |
| Single Unit, Detached | 1,800 (80.3%) | 441 (19.7%) |
| Single Unit, Attached | 24 (100.0%) | 0 (0.0%) |
| 2 Unit Apartments | 44 (36.7%) | 76 (63.3%) |
| 3 or 4 Unit Apartments | 0 (0.0%) | 19 (100.0%) |
| 5 to 9 Unit Apartments | 0 (0.0%) | 333 (100.0%) |
| 10 or more Apartments | 0 (0.0%) | 217 (100.0%) |
| Mobile Home / Other | 41 (71.9%) | 16 (28.1%) |
| Total | 1,909 (63.4%) | 1,102 (36.6%) |
Housing Structures by Number of Rooms in Mount Vernon
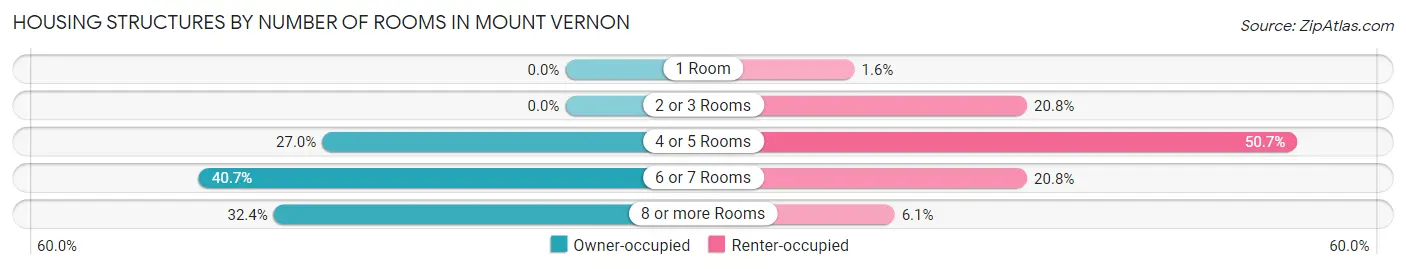
| Number of Rooms | Owner-occupied | Renter-occupied |
| 1 Room | 0 (0.0%) | 18 (1.6%) |
| 2 or 3 Rooms | 0 (0.0%) | 229 (20.8%) |
| 4 or 5 Rooms | 515 (27.0%) | 559 (50.7%) |
| 6 or 7 Rooms | 776 (40.6%) | 229 (20.8%) |
| 8 or more Rooms | 618 (32.4%) | 67 (6.1%) |
| Total | 1,909 (100.0%) | 1,102 (100.0%) |
Housing Structure by Heating Type in Mount Vernon
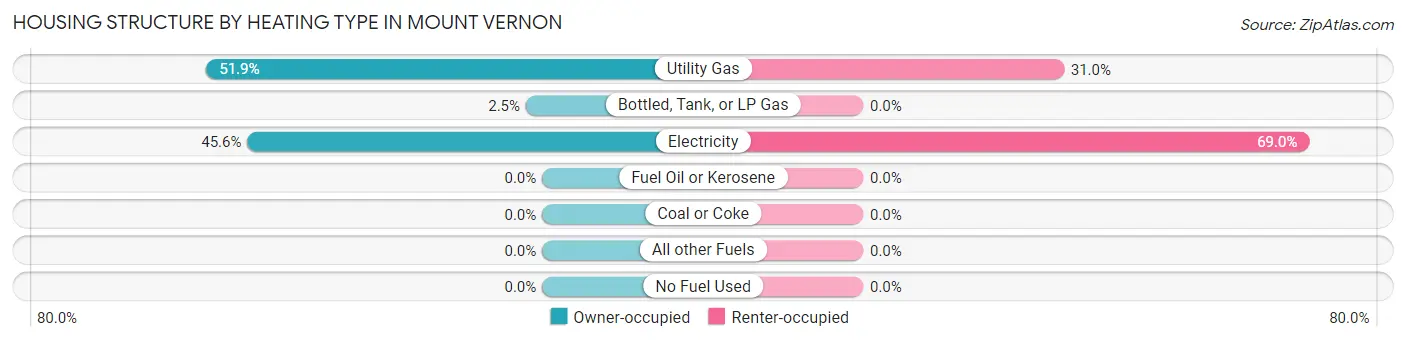
| Heating Type | Owner-occupied | Renter-occupied |
| Utility Gas | 991 (51.9%) | 342 (31.0%) |
| Bottled, Tank, or LP Gas | 48 (2.5%) | 0 (0.0%) |
| Electricity | 870 (45.6%) | 760 (69.0%) |
| Fuel Oil or Kerosene | 0 (0.0%) | 0 (0.0%) |
| Coal or Coke | 0 (0.0%) | 0 (0.0%) |
| All other Fuels | 0 (0.0%) | 0 (0.0%) |
| No Fuel Used | 0 (0.0%) | 0 (0.0%) |
| Total | 1,909 (100.0%) | 1,102 (100.0%) |
Household Vehicle Usage in Mount Vernon
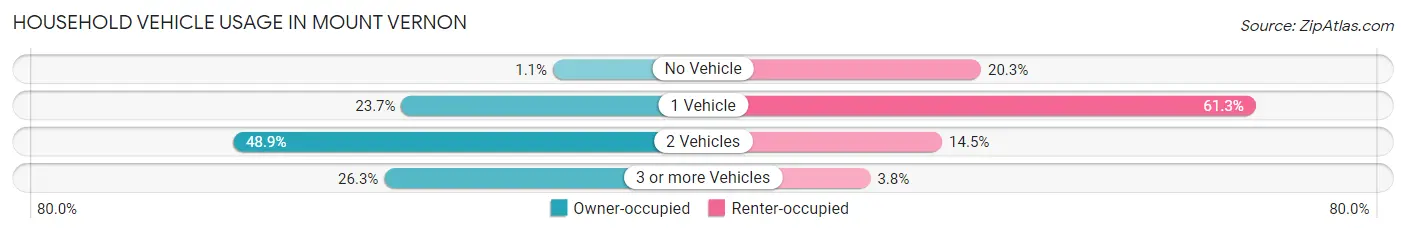
| Vehicles per Household | Owner-occupied | Renter-occupied |
| No Vehicle | 21 (1.1%) | 224 (20.3%) |
| 1 Vehicle | 453 (23.7%) | 676 (61.3%) |
| 2 Vehicles | 933 (48.9%) | 160 (14.5%) |
| 3 or more Vehicles | 502 (26.3%) | 42 (3.8%) |
| Total | 1,909 (100.0%) | 1,102 (100.0%) |
Real Estate & Mortgages in Mount Vernon
Real Estate and Mortgage Overview in Mount Vernon
| Characteristic | Without Mortgage | With Mortgage |
| Housing Units | 674 | 1,235 |
| Median Property Value | $142,600 | $164,200 |
| Median Household Income | $58,864 | $251 |
| Monthly Housing Costs | $473 | $0 |
| Real Estate Taxes | $1,065 | $32 |
Property Value by Mortgage Status in Mount Vernon
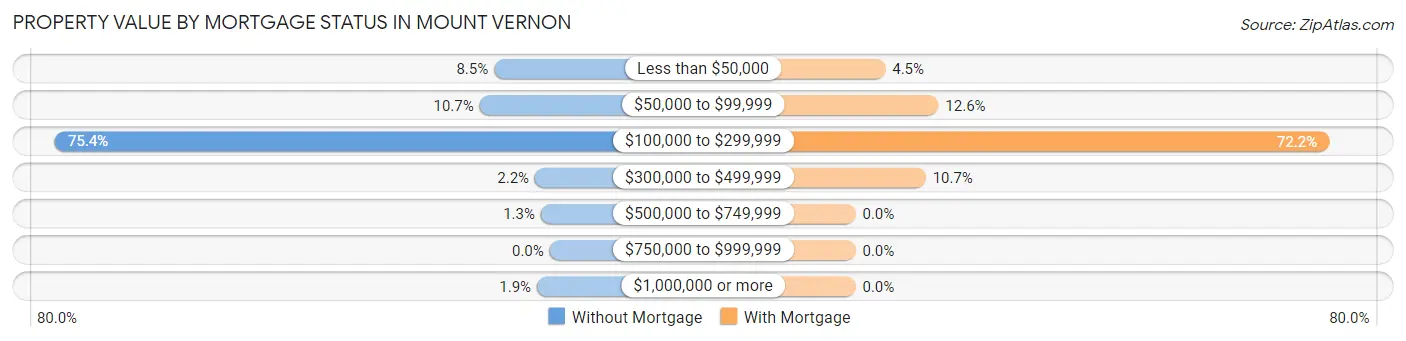
| Property Value | Without Mortgage | With Mortgage |
| Less than $50,000 | 57 (8.5%) | 56 (4.5%) |
| $50,000 to $99,999 | 72 (10.7%) | 156 (12.6%) |
| $100,000 to $299,999 | 508 (75.4%) | 891 (72.2%) |
| $300,000 to $499,999 | 15 (2.2%) | 132 (10.7%) |
| $500,000 to $749,999 | 9 (1.3%) | 0 (0.0%) |
| $750,000 to $999,999 | 0 (0.0%) | 0 (0.0%) |
| $1,000,000 or more | 13 (1.9%) | 0 (0.0%) |
| Total | 674 (100.0%) | 1,235 (100.0%) |
Household Income by Mortgage Status in Mount Vernon
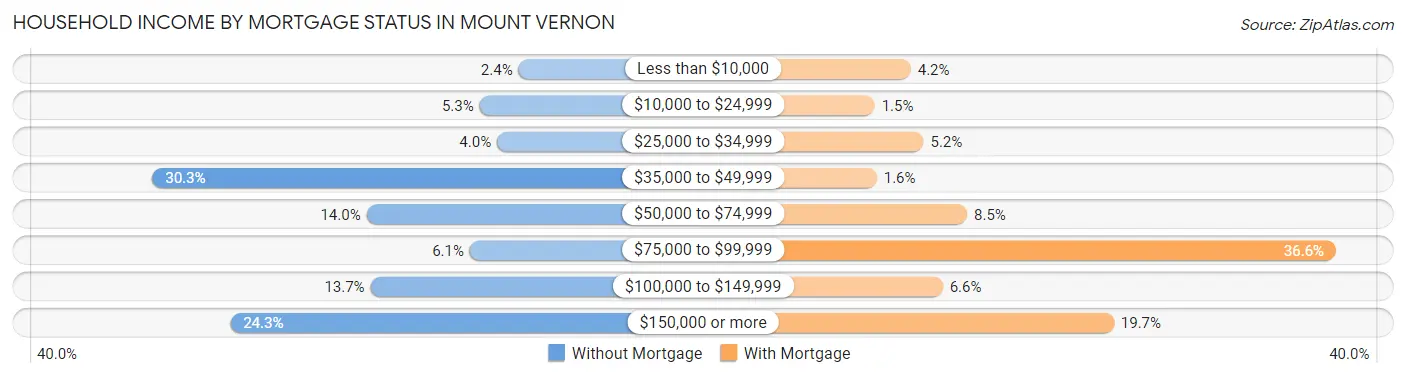
| Household Income | Without Mortgage | With Mortgage |
| Less than $10,000 | 16 (2.4%) | 52 (4.2%) |
| $10,000 to $24,999 | 36 (5.3%) | 18 (1.5%) |
| $25,000 to $34,999 | 27 (4.0%) | 64 (5.2%) |
| $35,000 to $49,999 | 204 (30.3%) | 20 (1.6%) |
| $50,000 to $74,999 | 94 (14.0%) | 105 (8.5%) |
| $75,000 to $99,999 | 41 (6.1%) | 452 (36.6%) |
| $100,000 to $149,999 | 92 (13.7%) | 82 (6.6%) |
| $150,000 or more | 164 (24.3%) | 243 (19.7%) |
| Total | 674 (100.0%) | 1,235 (100.0%) |
Property Value to Household Income Ratio in Mount Vernon
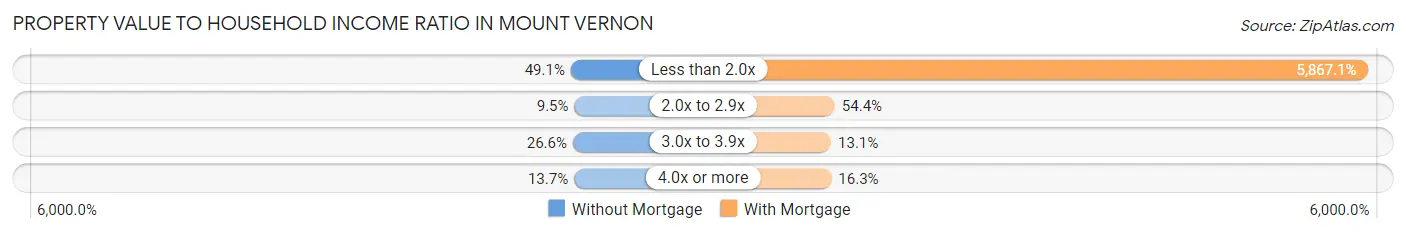
| Value-to-Income Ratio | Without Mortgage | With Mortgage |
| Less than 2.0x | 331 (49.1%) | 72,459 (5,867.1%) |
| 2.0x to 2.9x | 64 (9.5%) | 672 (54.4%) |
| 3.0x to 3.9x | 179 (26.6%) | 162 (13.1%) |
| 4.0x or more | 92 (13.7%) | 201 (16.3%) |
| Total | 674 (100.0%) | 1,235 (100.0%) |
Real Estate Taxes by Mortgage Status in Mount Vernon
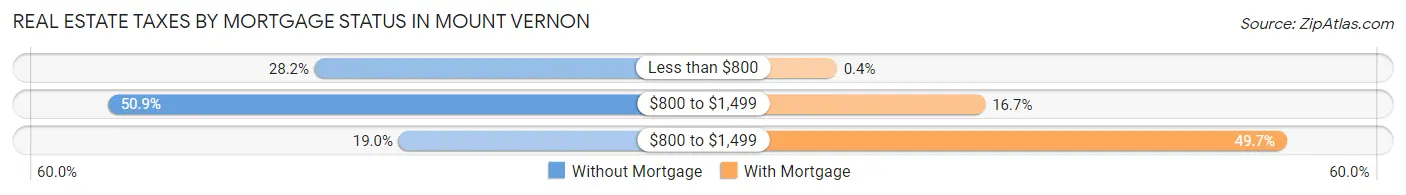
| Property Taxes | Without Mortgage | With Mortgage |
| Less than $800 | 190 (28.2%) | 5 (0.4%) |
| $800 to $1,499 | 343 (50.9%) | 206 (16.7%) |
| $800 to $1,499 | 128 (19.0%) | 614 (49.7%) |
| Total | 674 (100.0%) | 1,235 (100.0%) |
Health & Disability in Mount Vernon
Health Insurance Coverage by Age in Mount Vernon
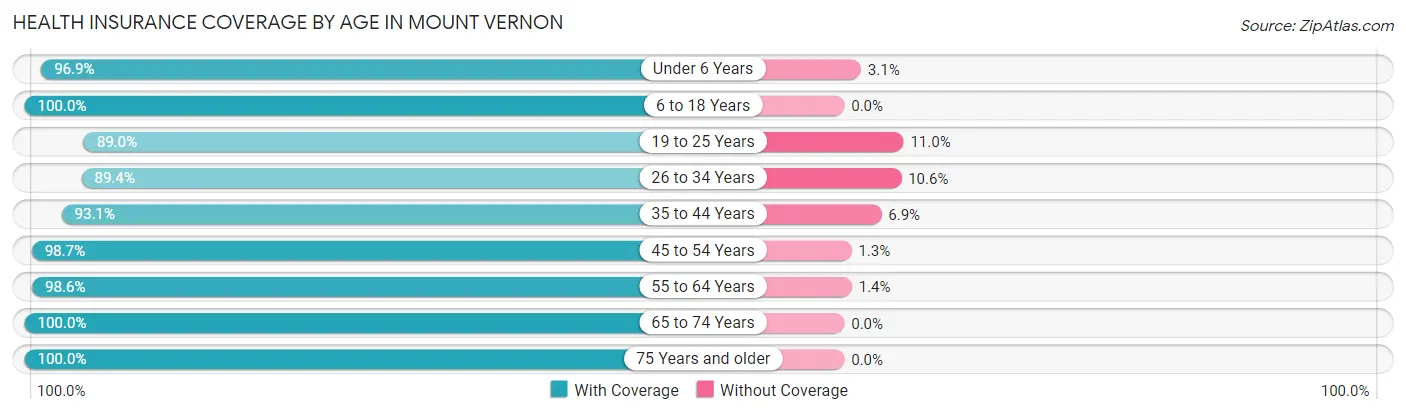
| Age Bracket | With Coverage | Without Coverage |
| Under 6 Years | 407 (96.9%) | 13 (3.1%) |
| 6 to 18 Years | 1,041 (100.0%) | 0 (0.0%) |
| 19 to 25 Years | 419 (89.0%) | 52 (11.0%) |
| 26 to 34 Years | 724 (89.4%) | 86 (10.6%) |
| 35 to 44 Years | 701 (93.1%) | 52 (6.9%) |
| 45 to 54 Years | 662 (98.7%) | 9 (1.3%) |
| 55 to 64 Years | 918 (98.6%) | 13 (1.4%) |
| 65 to 74 Years | 762 (100.0%) | 0 (0.0%) |
| 75 Years and older | 555 (100.0%) | 0 (0.0%) |
| Total | 6,189 (96.5%) | 225 (3.5%) |
Health Insurance Coverage by Citizenship Status in Mount Vernon
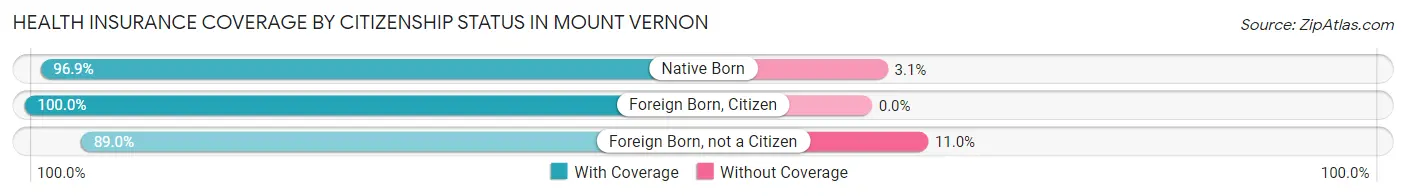
| Citizenship Status | With Coverage | Without Coverage |
| Native Born | 407 (96.9%) | 13 (3.1%) |
| Foreign Born, Citizen | 1,041 (100.0%) | 0 (0.0%) |
| Foreign Born, not a Citizen | 419 (89.0%) | 52 (11.0%) |
Health Insurance Coverage by Household Income in Mount Vernon
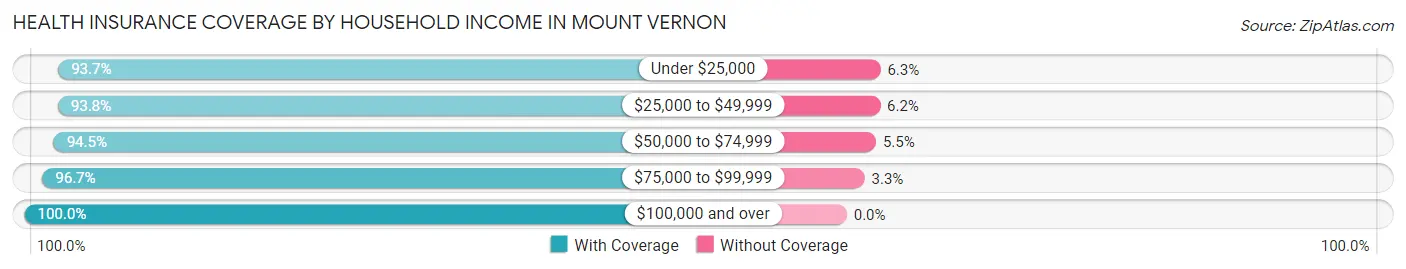
| Household Income | With Coverage | Without Coverage |
| Under $25,000 | 846 (93.7%) | 57 (6.3%) |
| $25,000 to $49,999 | 916 (93.8%) | 61 (6.2%) |
| $50,000 to $74,999 | 1,539 (94.5%) | 89 (5.5%) |
| $75,000 to $99,999 | 523 (96.7%) | 18 (3.3%) |
| $100,000 and over | 2,343 (100.0%) | 0 (0.0%) |
Public vs Private Health Insurance Coverage by Age in Mount Vernon
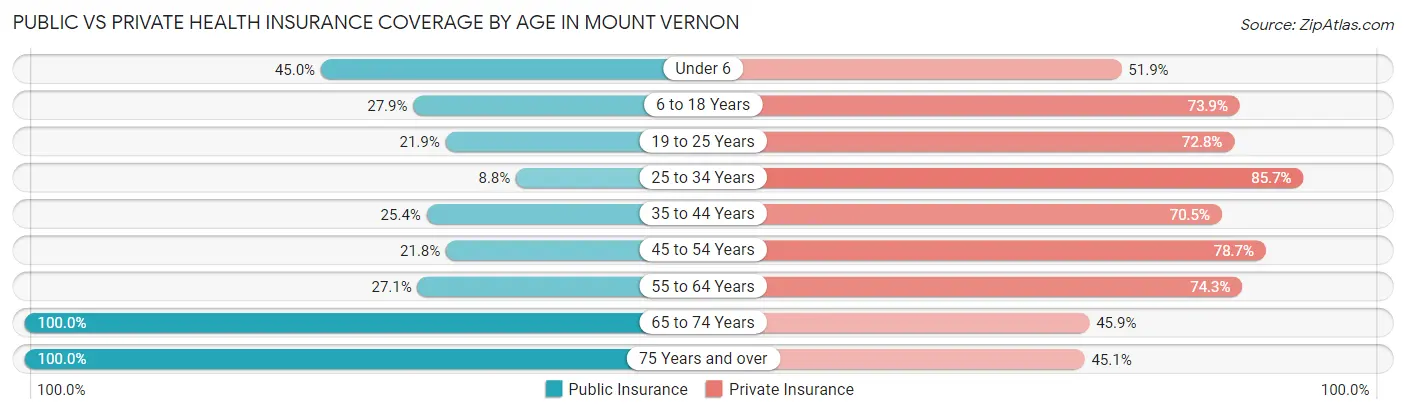
| Age Bracket | Public Insurance | Private Insurance |
| Under 6 | 189 (45.0%) | 218 (51.9%) |
| 6 to 18 Years | 290 (27.9%) | 769 (73.9%) |
| 19 to 25 Years | 103 (21.9%) | 343 (72.8%) |
| 25 to 34 Years | 71 (8.8%) | 694 (85.7%) |
| 35 to 44 Years | 191 (25.4%) | 531 (70.5%) |
| 45 to 54 Years | 146 (21.8%) | 528 (78.7%) |
| 55 to 64 Years | 252 (27.1%) | 692 (74.3%) |
| 65 to 74 Years | 762 (100.0%) | 350 (45.9%) |
| 75 Years and over | 555 (100.0%) | 250 (45.1%) |
| Total | 2,559 (39.9%) | 4,375 (68.2%) |
Disability Status by Sex by Age in Mount Vernon
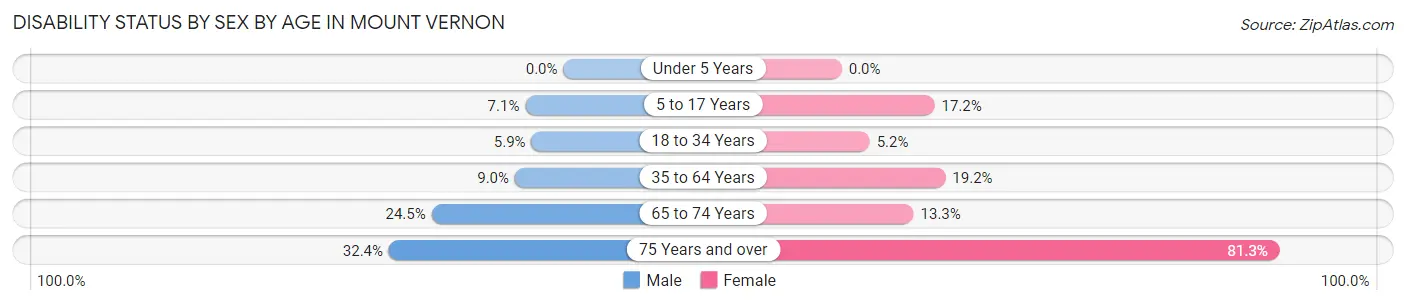
| Age Bracket | Male | Female |
| Under 5 Years | 0 (0.0%) | 0 (0.0%) |
| 5 to 17 Years | 35 (7.1%) | 84 (17.2%) |
| 18 to 34 Years | 47 (5.9%) | 30 (5.2%) |
| 35 to 64 Years | 95 (9.0%) | 250 (19.2%) |
| 65 to 74 Years | 91 (24.5%) | 52 (13.3%) |
| 75 Years and over | 57 (32.4%) | 308 (81.3%) |
Disability Class by Sex by Age in Mount Vernon
Disability Class: Hearing Difficulty
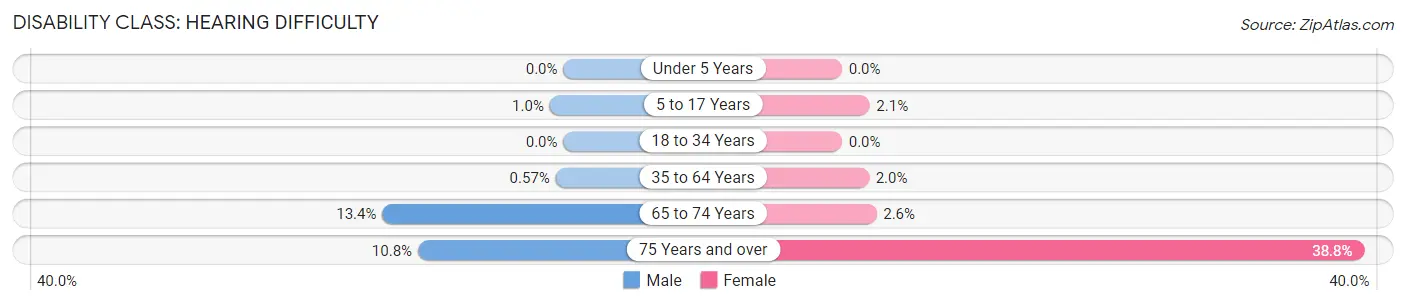
| Age Bracket | Male | Female |
| Under 5 Years | 0 (0.0%) | 0 (0.0%) |
| 5 to 17 Years | 5 (1.0%) | 10 (2.1%) |
| 18 to 34 Years | 0 (0.0%) | 0 (0.0%) |
| 35 to 64 Years | 6 (0.6%) | 26 (2.0%) |
| 65 to 74 Years | 50 (13.4%) | 10 (2.6%) |
| 75 Years and over | 19 (10.8%) | 147 (38.8%) |
Disability Class: Vision Difficulty
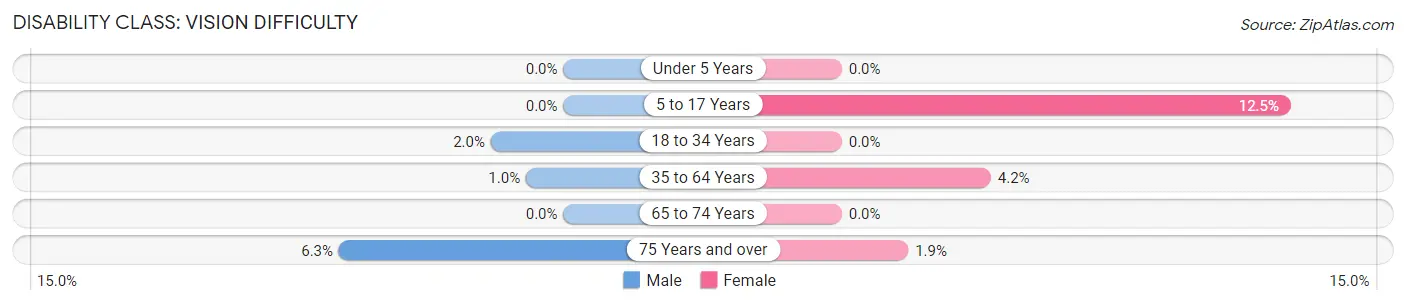
| Age Bracket | Male | Female |
| Under 5 Years | 0 (0.0%) | 0 (0.0%) |
| 5 to 17 Years | 0 (0.0%) | 61 (12.5%) |
| 18 to 34 Years | 16 (2.0%) | 0 (0.0%) |
| 35 to 64 Years | 11 (1.0%) | 54 (4.2%) |
| 65 to 74 Years | 0 (0.0%) | 0 (0.0%) |
| 75 Years and over | 11 (6.2%) | 7 (1.8%) |
Disability Class: Cognitive Difficulty
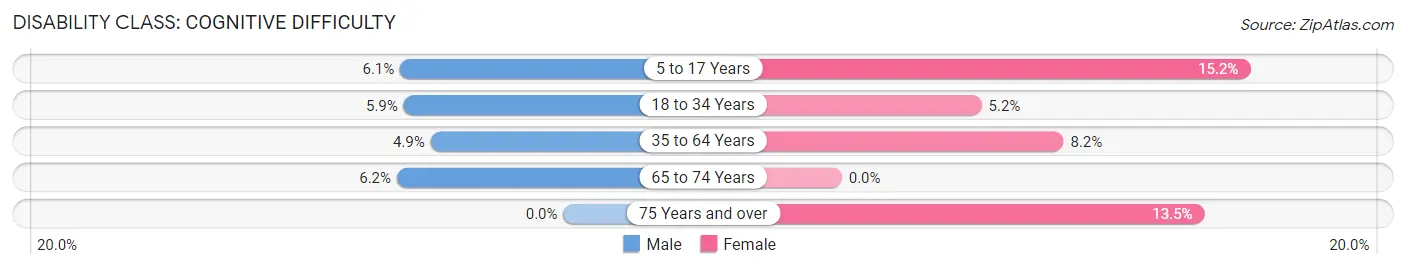
| Age Bracket | Male | Female |
| 5 to 17 Years | 30 (6.1%) | 74 (15.2%) |
| 18 to 34 Years | 47 (5.9%) | 30 (5.2%) |
| 35 to 64 Years | 52 (4.9%) | 107 (8.2%) |
| 65 to 74 Years | 23 (6.2%) | 0 (0.0%) |
| 75 Years and over | 0 (0.0%) | 51 (13.5%) |
Disability Class: Ambulatory Difficulty
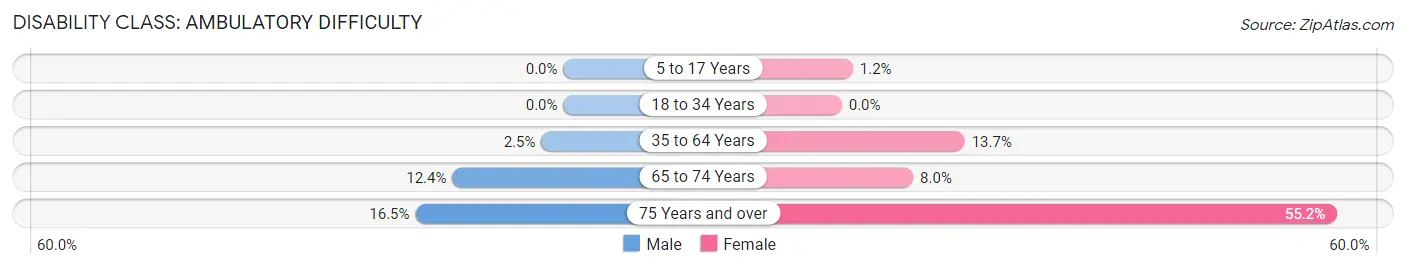
| Age Bracket | Male | Female |
| 5 to 17 Years | 0 (0.0%) | 6 (1.2%) |
| 18 to 34 Years | 0 (0.0%) | 0 (0.0%) |
| 35 to 64 Years | 26 (2.5%) | 178 (13.7%) |
| 65 to 74 Years | 46 (12.4%) | 31 (8.0%) |
| 75 Years and over | 29 (16.5%) | 209 (55.1%) |
Disability Class: Self-Care Difficulty
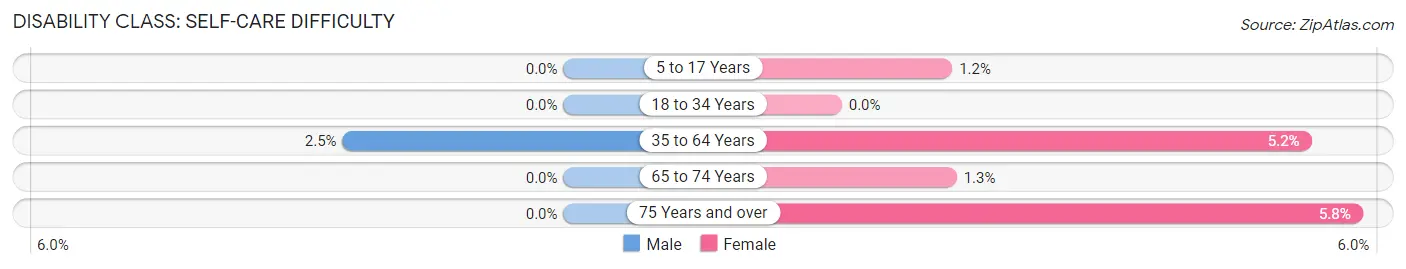
| Age Bracket | Male | Female |
| 5 to 17 Years | 0 (0.0%) | 6 (1.2%) |
| 18 to 34 Years | 0 (0.0%) | 0 (0.0%) |
| 35 to 64 Years | 26 (2.5%) | 68 (5.2%) |
| 65 to 74 Years | 0 (0.0%) | 5 (1.3%) |
| 75 Years and over | 0 (0.0%) | 22 (5.8%) |
Technology Access in Mount Vernon
Computing Device Access in Mount Vernon
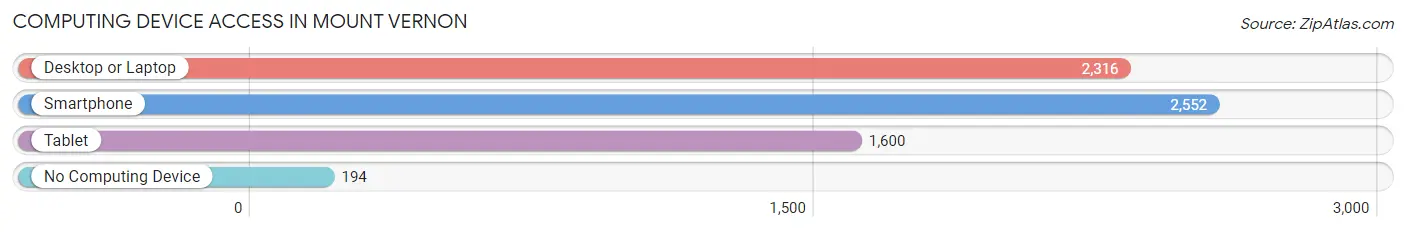
| Device Type | # Households | % Households |
| Desktop or Laptop | 2,316 | 76.9% |
| Smartphone | 2,552 | 84.8% |
| Tablet | 1,600 | 53.1% |
| No Computing Device | 194 | 6.4% |
| Total | 3,011 | 100.0% |
Internet Access in Mount Vernon
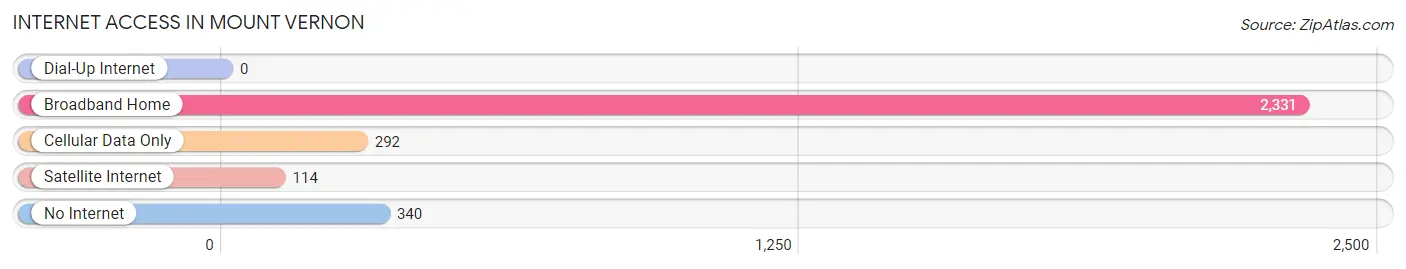
| Internet Type | # Households | % Households |
| Dial-Up Internet | 0 | 0.0% |
| Broadband Home | 2,331 | 77.4% |
| Cellular Data Only | 292 | 9.7% |
| Satellite Internet | 114 | 3.8% |
| No Internet | 340 | 11.3% |
| Total | 3,011 | 100.0% |
Mount Vernon Summary
Introduction
Mount Vernon, Indiana is a small city located in Posey County, Indiana. It is the county seat of Posey County and is located on the banks of the Wabash River. The city has a population of 6,812 as of the 2010 census. The city is known for its historic downtown area, which is listed on the National Register of Historic Places. The city is also home to a number of historic buildings, including the Posey County Courthouse, the Posey County Jail, and the Posey County Historical Museum.
History
Mount Vernon was founded in 1817 by William Prince, a Revolutionary War veteran. The city was named after George Washington's home, Mount Vernon. The city was incorporated in 1832 and was the county seat of Posey County. The city was a major stop on the Wabash and Erie Canal, which was completed in 1853. The canal brought economic growth to the city and helped to make it a major transportation hub.
The city was also a major stop on the Underground Railroad, with many slaves escaping to freedom in the city. The city was also home to a number of abolitionists, including William Prince, who was a major advocate for the abolition of slavery.
Geography
Mount Vernon is located in Posey County, Indiana. The city is situated on the banks of the Wabash River. The city is located in the southwestern part of the state, about 40 miles from Evansville, Indiana. The city is located in a hilly area, with the highest point being the Posey County Courthouse, which is located at an elevation of 845 feet.
The city has a total area of 4.2 square miles, all of which is land. The city is located in the Central Time Zone and observes Daylight Saving Time.
Economy
The economy of Mount Vernon is largely based on agriculture and manufacturing. The city is home to a number of manufacturing companies, including a steel mill, a paper mill, and a plastics plant. The city is also home to a number of agricultural businesses, including a dairy farm, a hog farm, and a grain elevator.
The city is also home to a number of retail businesses, including a number of antique stores, a grocery store, and a number of restaurants. The city is also home to a number of service businesses, including a number of banks, a hospital, and a number of law firms.
Demographics
As of the 2010 census, the population of Mount Vernon was 6,812. The racial makeup of the city was 95.3% White, 1.2% African American, 0.3% Native American, 0.7% Asian, 0.1% Pacific Islander, 0.7% from other races, and 1.9% from two or more races. Hispanic or Latino of any race were 2.2% of the population.
The median income for a household in the city was $37,917, and the median income for a family was $45,938. The per capita income for the city was $19,945. About 11.2% of families and 14.2% of the population were below the poverty line, including 19.2% of those under age 18 and 8.2% of those age 65 or over.
Conclusion
Mount Vernon, Indiana is a small city located in Posey County, Indiana. The city has a rich history, with a number of historic buildings and sites. The city is also home to a number of manufacturing and agricultural businesses, as well as a number of retail and service businesses. The population of the city is 6,812, with a median income of $37,917. The city is a great place to live, work, and visit, with a number of attractions and activities to enjoy.
Common Questions
What is Per Capita Income in Mount Vernon?
Per Capita income in Mount Vernon is $35,228.
What is the Median Family Income in Mount Vernon?
Median Family Income in Mount Vernon is $71,903.
What is the Median Household income in Mount Vernon?
Median Household Income in Mount Vernon is $58,370.
What is Income or Wage Gap in Mount Vernon?
Income or Wage Gap in Mount Vernon is 47.9%.
Women in Mount Vernon earn 52.1 cents for every dollar earned by a man.
What is Inequality or Gini Index in Mount Vernon?
Inequality or Gini Index in Mount Vernon is 0.42.
What is the Total Population of Mount Vernon?
Total Population of Mount Vernon is 6,480.
What is the Total Male Population of Mount Vernon?
Total Male Population of Mount Vernon is 3,039.
What is the Total Female Population of Mount Vernon?
Total Female Population of Mount Vernon is 3,441.
What is the Ratio of Males per 100 Females in Mount Vernon?
There are 88.32 Males per 100 Females in Mount Vernon.
What is the Ratio of Females per 100 Males in Mount Vernon?
There are 113.23 Females per 100 Males in Mount Vernon.
What is the Median Population Age in Mount Vernon?
Median Population Age in Mount Vernon is 40.7 Years.
What is the Average Family Size in Mount Vernon
Average Family Size in Mount Vernon is 2.7 People.
What is the Average Household Size in Mount Vernon
Average Household Size in Mount Vernon is 2.1 People.
How Large is the Labor Force in Mount Vernon?
There are 3,286 People in the Labor Forcein in Mount Vernon.
What is the Percentage of People in the Labor Force in Mount Vernon?
62.3% of People are in the Labor Force in Mount Vernon.
What is the Unemployment Rate in Mount Vernon?
Unemployment Rate in Mount Vernon is 5.5%.