Morgantown, IN Map & Demographics
Morgantown Map
Morgantown Overview
$22,369
PER CAPITA INCOME
$53,542
AVG FAMILY INCOME
$50,257
AVG HOUSEHOLD INCOME
28.8%
WAGE / INCOME GAP [ % ]
71.2¢/ $1
WAGE / INCOME GAP [ $ ]
$13,722
FAMILY INCOME DEFICIT
0.41
INEQUALITY / GINI INDEX
1,293
TOTAL POPULATION
577
MALE POPULATION
716
FEMALE POPULATION
80.59
MALES / 100 FEMALES
124.09
FEMALES / 100 MALES
36.0
MEDIAN AGE
3.0
AVG FAMILY SIZE
2.6
AVG HOUSEHOLD SIZE
589
LABOR FORCE [ PEOPLE ]
62.5%
PERCENT IN LABOR FORCE
19.0%
UNEMPLOYMENT RATE
Morgantown Zip Codes
Morgantown Area Codes
Income in Morgantown
Income Overview in Morgantown
Per Capita Income in Morgantown is $22,369, while median incomes of families and households are $53,542 and $50,257 respectively.
| Characteristic | Number | Measure |
| Per Capita Income | 1,293 | $22,369 |
| Median Family Income | 351 | $53,542 |
| Mean Family Income | 351 | $67,608 |
| Median Household Income | 487 | $50,257 |
| Mean Household Income | 487 | $59,916 |
| Income Deficit | 351 | $13,722 |
| Wage / Income Gap (%) | 1,293 | 28.76% |
| Wage / Income Gap ($) | 1,293 | 71.24¢ per $1 |
| Gini / Inequality Index | 1,293 | 0.41 |
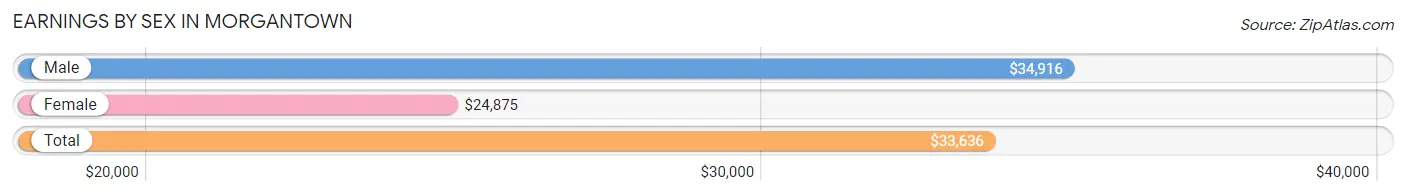
Earnings by Sex in Morgantown
Average Earnings in Morgantown are $33,636, $34,916 for men and $24,875 for women, a difference of 28.8%.
| Sex | Number | Average Earnings |
| Male | 335 (55.8%) | $34,916 |
| Female | 265 (44.2%) | $24,875 |
| Total | 600 (100.0%) | $33,636 |
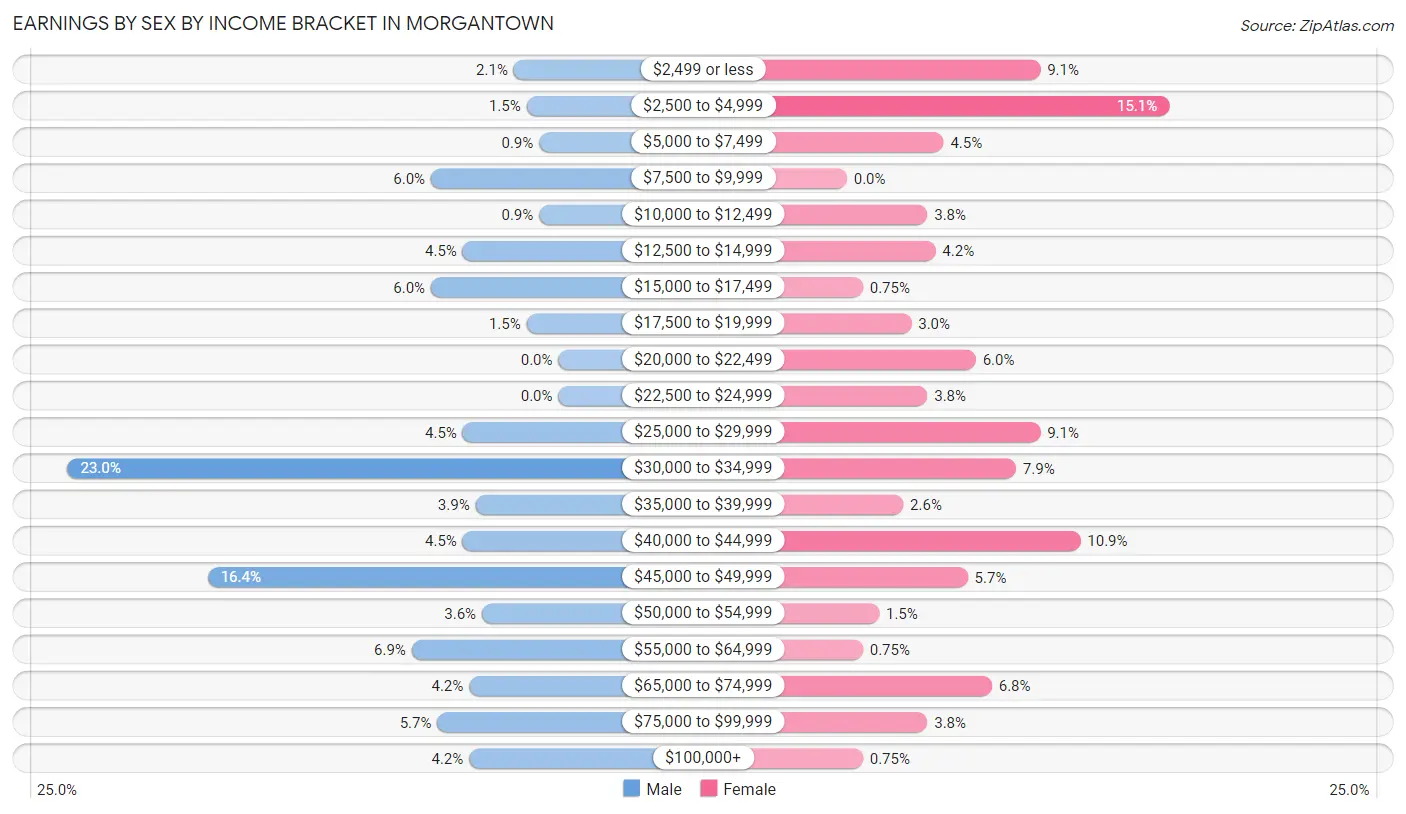
Earnings by Sex by Income Bracket in Morgantown
The most common earnings brackets in Morgantown are $30,000 to $34,999 for men (77 | 23.0%) and $2,500 to $4,999 for women (40 | 15.1%).
| Income | Male | Female |
| $2,499 or less | 7 (2.1%) | 24 (9.1%) |
| $2,500 to $4,999 | 5 (1.5%) | 40 (15.1%) |
| $5,000 to $7,499 | 3 (0.9%) | 12 (4.5%) |
| $7,500 to $9,999 | 20 (6.0%) | 0 (0.0%) |
| $10,000 to $12,499 | 3 (0.9%) | 10 (3.8%) |
| $12,500 to $14,999 | 15 (4.5%) | 11 (4.2%) |
| $15,000 to $17,499 | 20 (6.0%) | 2 (0.7%) |
| $17,500 to $19,999 | 5 (1.5%) | 8 (3.0%) |
| $20,000 to $22,499 | 0 (0.0%) | 16 (6.0%) |
| $22,500 to $24,999 | 0 (0.0%) | 10 (3.8%) |
| $25,000 to $29,999 | 15 (4.5%) | 24 (9.1%) |
| $30,000 to $34,999 | 77 (23.0%) | 21 (7.9%) |
| $35,000 to $39,999 | 13 (3.9%) | 7 (2.6%) |
| $40,000 to $44,999 | 15 (4.5%) | 29 (10.9%) |
| $45,000 to $49,999 | 55 (16.4%) | 15 (5.7%) |
| $50,000 to $54,999 | 12 (3.6%) | 4 (1.5%) |
| $55,000 to $64,999 | 23 (6.9%) | 2 (0.7%) |
| $65,000 to $74,999 | 14 (4.2%) | 18 (6.8%) |
| $75,000 to $99,999 | 19 (5.7%) | 10 (3.8%) |
| $100,000+ | 14 (4.2%) | 2 (0.7%) |
| Total | 335 (100.0%) | 265 (100.0%) |
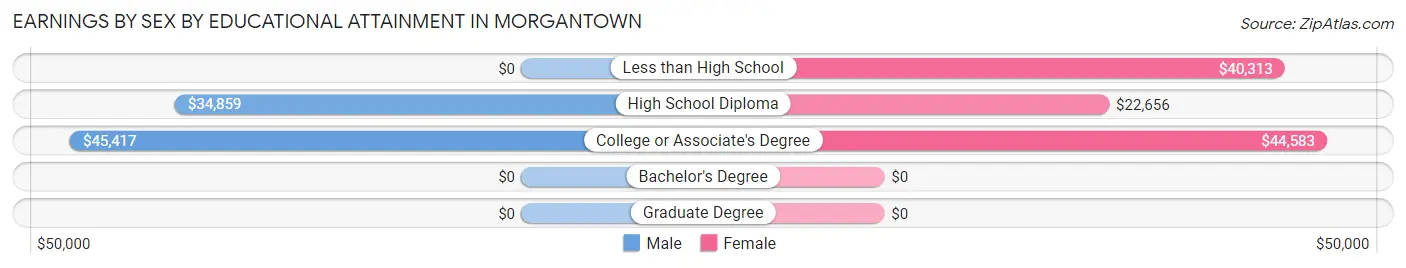
Earnings by Sex by Educational Attainment in Morgantown
Average earnings in Morgantown are $37,969 for men and $29,038 for women, a difference of 23.5%. Men with an educational attainment of college or associate's degree enjoy the highest average annual earnings of $45,417, while those with high school diploma education earn the least with $34,859. Women with an educational attainment of college or associate's degree earn the most with the average annual earnings of $44,583, while those with high school diploma education have the smallest earnings of $22,656.
| Educational Attainment | Male Income | Female Income |
| Less than High School | - | - |
| High School Diploma | $34,859 | $22,656 |
| College or Associate's Degree | $45,417 | $44,583 |
| Bachelor's Degree | - | - |
| Graduate Degree | - | - |
| Total | $37,969 | $29,038 |
Family Income in Morgantown
Family Income Brackets in Morgantown
According to the Morgantown family income data, there are 83 families falling into the $50,000 to $74,999 income range, which is the most common income bracket and makes up 23.6% of all families. Conversely, the $10,000 to $14,999 income bracket is the least frequent group with only 7 families (2.0%) belonging to this category.
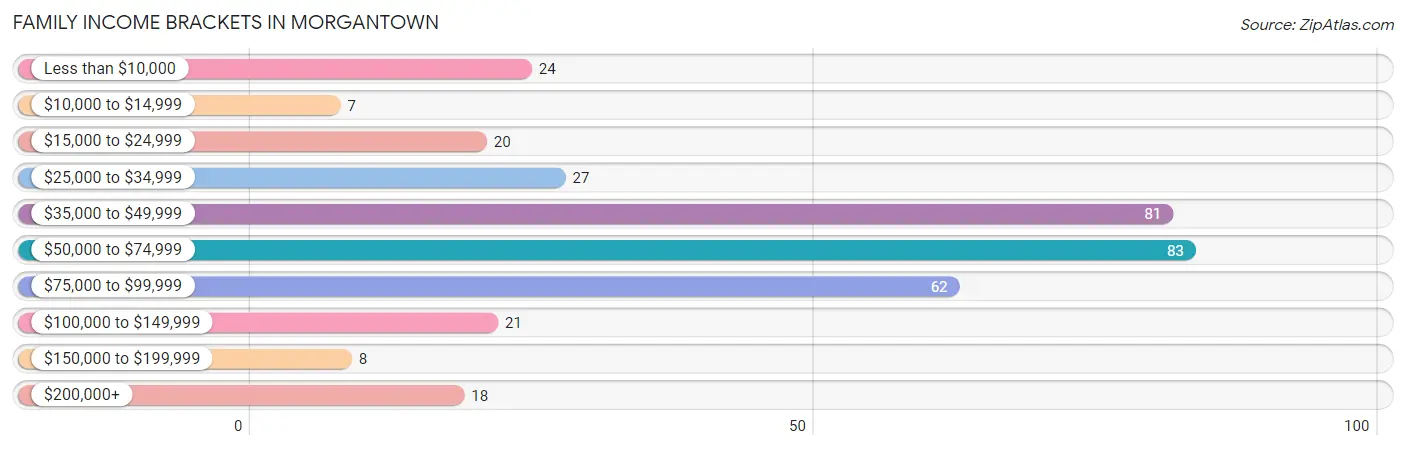
| Income Bracket | # Families | % Families |
| Less than $10,000 | 24 | 6.8% |
| $10,000 to $14,999 | 7 | 2.0% |
| $15,000 to $24,999 | 20 | 5.7% |
| $25,000 to $34,999 | 27 | 7.7% |
| $35,000 to $49,999 | 81 | 23.1% |
| $50,000 to $74,999 | 83 | 23.6% |
| $75,000 to $99,999 | 62 | 17.7% |
| $100,000 to $149,999 | 21 | 6.0% |
| $150,000 to $199,999 | 8 | 2.3% |
| $200,000+ | 18 | 5.1% |
Family Income by Famaliy Size in Morgantown
5-person families (21 | 6.0%) account for the highest median family income in Morgantown with $88,036 per family, while 2-person families (132 | 37.6%) have the highest median income of $27,916 per family member.
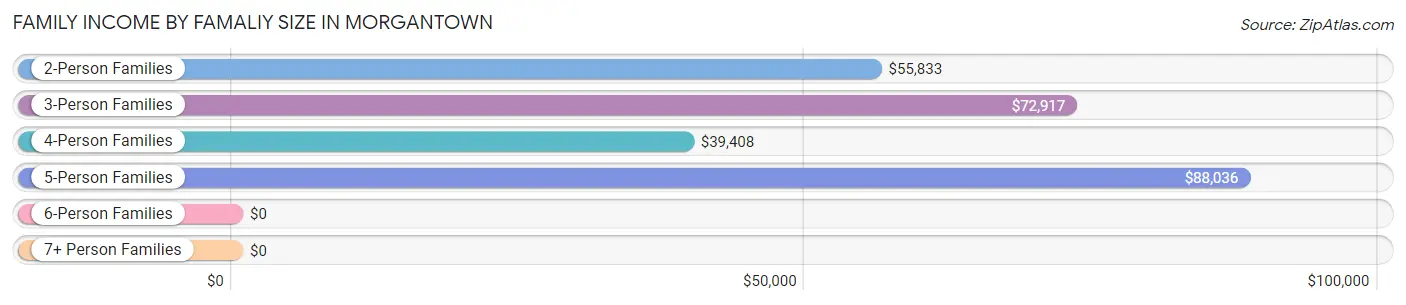
| Income Bracket | # Families | Median Income |
| 2-Person Families | 132 (37.6%) | $55,833 |
| 3-Person Families | 62 (17.7%) | $72,917 |
| 4-Person Families | 131 (37.3%) | $39,408 |
| 5-Person Families | 21 (6.0%) | $88,036 |
| 6-Person Families | 5 (1.4%) | $0 |
| 7+ Person Families | 0 (0.0%) | $0 |
| Total | 351 (100.0%) | $53,542 |
Family Income by Number of Earners in Morgantown
The median family income in Morgantown is $53,542, with families comprising 3+ earners (18) having the highest median family income of $155,833, while families with 1 earner (128) have the lowest median family income of $31,250, accounting for 5.1% and 36.5% of families, respectively.
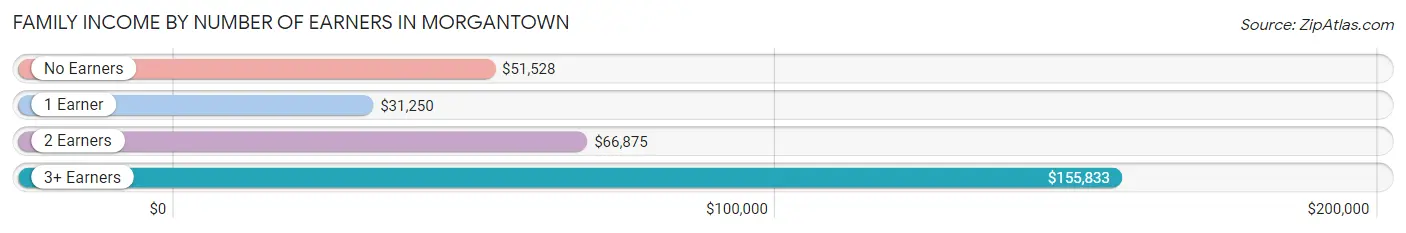
| Number of Earners | # Families | Median Income |
| No Earners | 31 (8.8%) | $51,528 |
| 1 Earner | 128 (36.5%) | $31,250 |
| 2 Earners | 174 (49.6%) | $66,875 |
| 3+ Earners | 18 (5.1%) | $155,833 |
| Total | 351 (100.0%) | $53,542 |
Household Income in Morgantown
Household Income Brackets in Morgantown
With 120 households falling in the category, the $50,000 to $74,999 income range is the most frequent in Morgantown, accounting for 24.6% of all households. In contrast, only 8 households (1.6%) fall into the $150,000 to $199,999 income bracket, making it the least populous group.
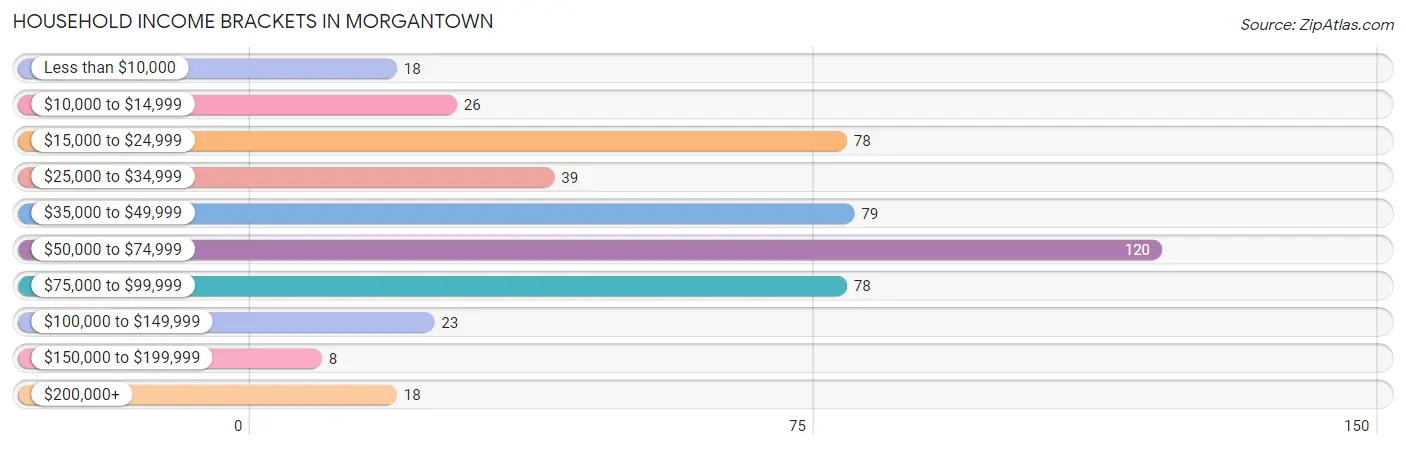
| Income Bracket | # Households | % Households |
| Less than $10,000 | 18 | 3.7% |
| $10,000 to $14,999 | 26 | 5.3% |
| $15,000 to $24,999 | 78 | 16.0% |
| $25,000 to $34,999 | 39 | 8.0% |
| $35,000 to $49,999 | 79 | 16.2% |
| $50,000 to $74,999 | 120 | 24.6% |
| $75,000 to $99,999 | 78 | 16.0% |
| $100,000 to $149,999 | 23 | 4.7% |
| $150,000 to $199,999 | 8 | 1.6% |
| $200,000+ | 18 | 3.7% |
Household Income by Householder Age in Morgantown
The median household income in Morgantown is $50,257, with the highest median household income of $58,214 found in the 45 to 64 years age bracket for the primary householder. A total of 136 households (27.9%) fall into this category. Meanwhile, the 15 to 24 years age bracket for the primary householder has the lowest median household income of $0, with 3 households (0.6%) in this group.
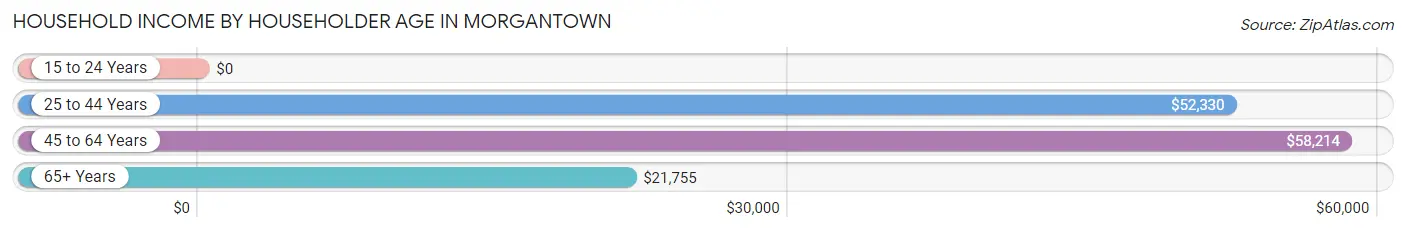
| Income Bracket | # Households | Median Income |
| 15 to 24 Years | 3 (0.6%) | $0 |
| 25 to 44 Years | 215 (44.2%) | $52,330 |
| 45 to 64 Years | 136 (27.9%) | $58,214 |
| 65+ Years | 133 (27.3%) | $21,755 |
| Total | 487 (100.0%) | $50,257 |
Poverty in Morgantown
Income Below Poverty by Sex and Age in Morgantown
With 10.4% poverty level for males and 15.9% for females among the residents of Morgantown, 12 to 14 year old males and 16 and 17 year old females are the most vulnerable to poverty, with 8 males (53.3%) and 21 females (87.5%) in their respective age groups living below the poverty level.
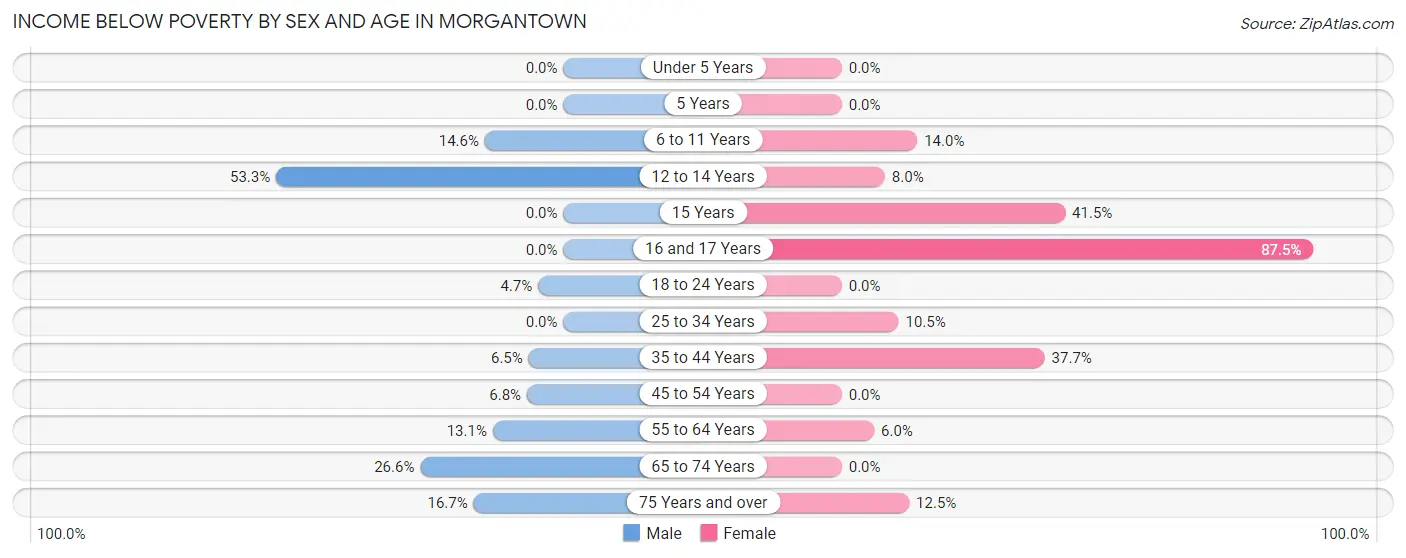
| Age Bracket | Male | Female |
| Under 5 Years | 0 (0.0%) | 0 (0.0%) |
| 5 Years | 0 (0.0%) | 0 (0.0%) |
| 6 to 11 Years | 7 (14.6%) | 21 (14.0%) |
| 12 to 14 Years | 8 (53.3%) | 2 (8.0%) |
| 15 Years | 0 (0.0%) | 17 (41.5%) |
| 16 and 17 Years | 0 (0.0%) | 21 (87.5%) |
| 18 to 24 Years | 3 (4.7%) | 0 (0.0%) |
| 25 to 34 Years | 0 (0.0%) | 10 (10.5%) |
| 35 to 44 Years | 8 (6.5%) | 32 (37.7%) |
| 45 to 54 Years | 5 (6.8%) | 0 (0.0%) |
| 55 to 64 Years | 8 (13.1%) | 3 (6.0%) |
| 65 to 74 Years | 17 (26.6%) | 0 (0.0%) |
| 75 Years and over | 2 (16.7%) | 2 (12.5%) |
| Total | 58 (10.4%) | 108 (15.9%) |
Income Above Poverty by Sex and Age in Morgantown
According to the poverty statistics in Morgantown, males aged under 5 years and females aged under 5 years are the age groups that are most secure financially, with 100.0% of males and 100.0% of females in these age groups living above the poverty line.
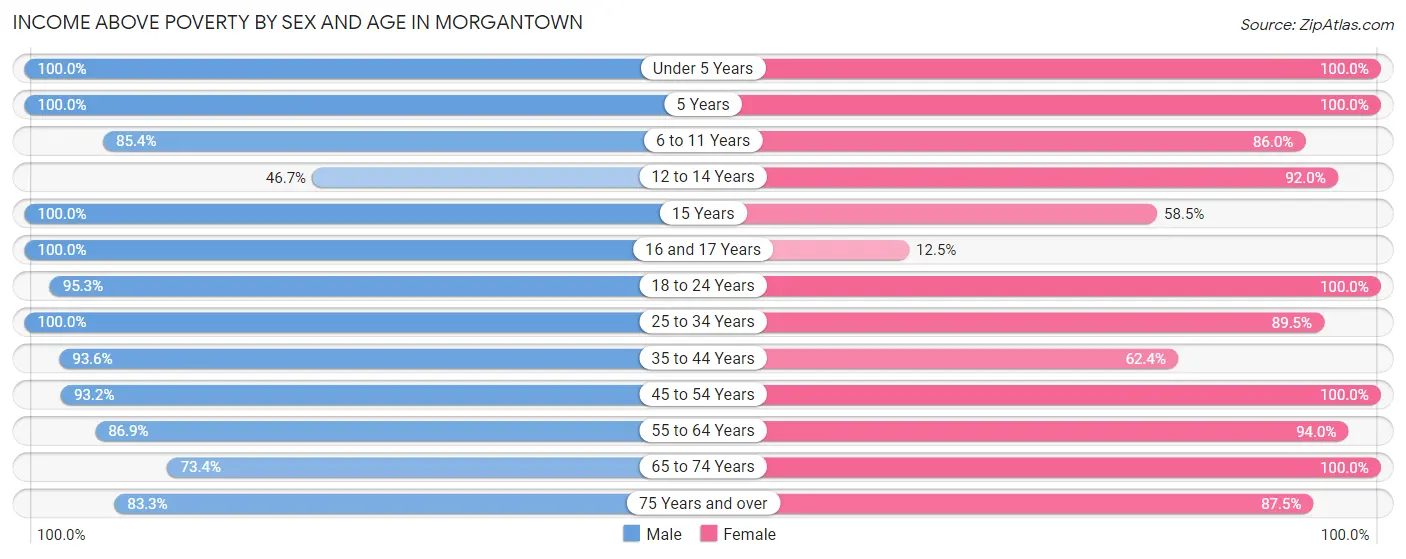
| Age Bracket | Male | Female |
| Under 5 Years | 20 (100.0%) | 25 (100.0%) |
| 5 Years | 9 (100.0%) | 5 (100.0%) |
| 6 to 11 Years | 41 (85.4%) | 129 (86.0%) |
| 12 to 14 Years | 7 (46.7%) | 23 (92.0%) |
| 15 Years | 2 (100.0%) | 24 (58.5%) |
| 16 and 17 Years | 5 (100.0%) | 3 (12.5%) |
| 18 to 24 Years | 61 (95.3%) | 42 (100.0%) |
| 25 to 34 Years | 61 (100.0%) | 85 (89.5%) |
| 35 to 44 Years | 116 (93.5%) | 53 (62.4%) |
| 45 to 54 Years | 69 (93.2%) | 52 (100.0%) |
| 55 to 64 Years | 53 (86.9%) | 47 (94.0%) |
| 65 to 74 Years | 47 (73.4%) | 71 (100.0%) |
| 75 Years and over | 10 (83.3%) | 14 (87.5%) |
| Total | 501 (89.6%) | 573 (84.1%) |
Income Below Poverty Among Married-Couple Families in Morgantown
The poverty statistics for married-couple families in Morgantown show that 4.3% or 11 of the total 253 families live below the poverty line. Families with no children have the highest poverty rate of 9.6%, comprising of 11 families. On the other hand, families with 1 or 2 children have the lowest poverty rate of 0.0%, which includes 0 families.
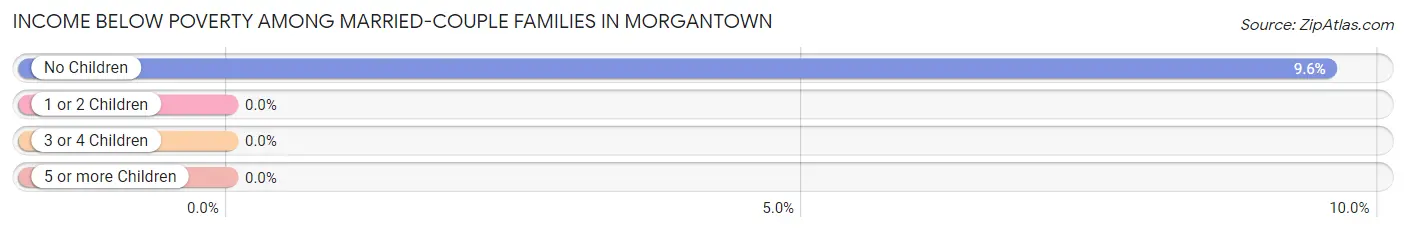
| Children | Above Poverty | Below Poverty |
| No Children | 104 (90.4%) | 11 (9.6%) |
| 1 or 2 Children | 119 (100.0%) | 0 (0.0%) |
| 3 or 4 Children | 19 (100.0%) | 0 (0.0%) |
| 5 or more Children | 0 (0.0%) | 0 (0.0%) |
| Total | 242 (95.7%) | 11 (4.3%) |
Income Below Poverty Among Single-Parent Households in Morgantown
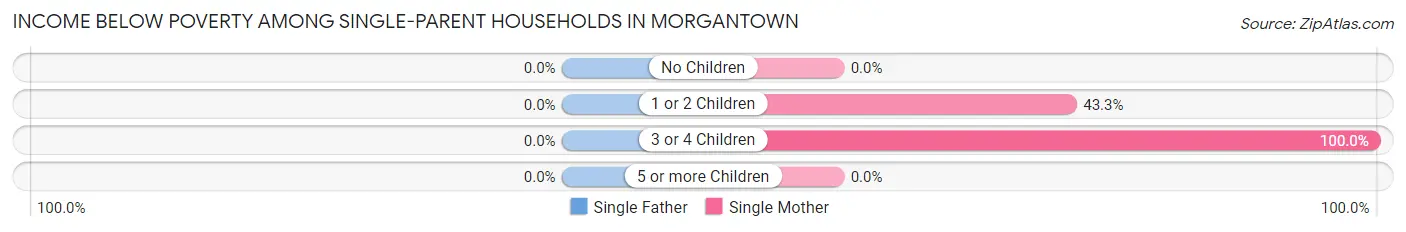
| Children | Single Father | Single Mother |
| No Children | 0 (0.0%) | 0 (0.0%) |
| 1 or 2 Children | 0 (0.0%) | 13 (43.3%) |
| 3 or 4 Children | 0 (0.0%) | 22 (100.0%) |
| 5 or more Children | 0 (0.0%) | 0 (0.0%) |
| Total | 0 (0.0%) | 35 (54.7%) |
Income Below Poverty Among Married-Couple vs Single-Parent Households in Morgantown
The poverty data for Morgantown shows that 11 of the married-couple family households (4.3%) and 35 of the single-parent households (35.7%) are living below the poverty level. Within the married-couple family households, those with no children have the highest poverty rate, with 11 households (9.6%) falling below the poverty line. Among the single-parent households, those with 3 or 4 children have the highest poverty rate, with 22 household (88.0%) living below poverty.
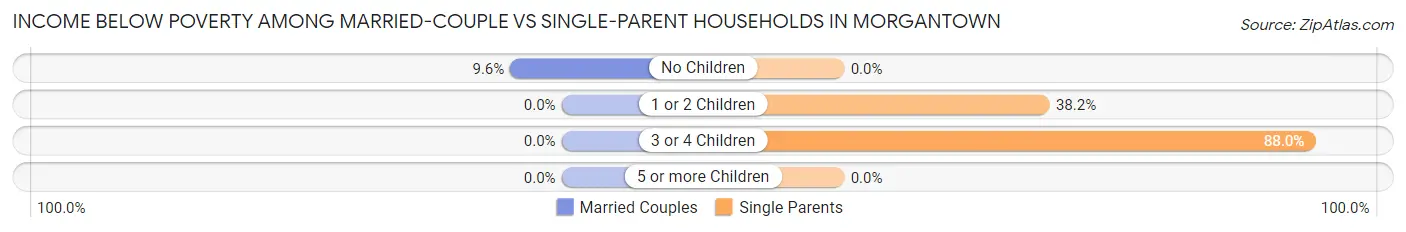
| Children | Married-Couple Families | Single-Parent Households |
| No Children | 11 (9.6%) | 0 (0.0%) |
| 1 or 2 Children | 0 (0.0%) | 13 (38.2%) |
| 3 or 4 Children | 0 (0.0%) | 22 (88.0%) |
| 5 or more Children | 0 (0.0%) | 0 (0.0%) |
| Total | 11 (4.3%) | 35 (35.7%) |
Race in Morgantown
The most populous races in Morgantown are White / Caucasian (1,210 | 93.6%), Hispanic or Latino (95 | 7.3%), and Two or more Races (69 | 5.3%).
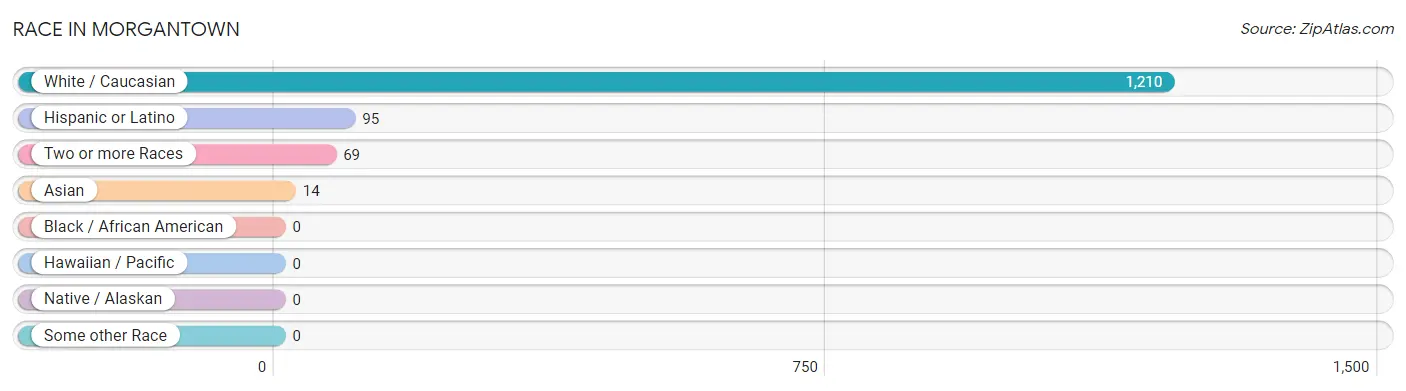
| Race | # Population | % Population |
| Asian | 14 | 1.1% |
| Black / African American | 0 | 0.0% |
| Hawaiian / Pacific | 0 | 0.0% |
| Hispanic or Latino | 95 | 7.3% |
| Native / Alaskan | 0 | 0.0% |
| White / Caucasian | 1,210 | 93.6% |
| Two or more Races | 69 | 5.3% |
| Some other Race | 0 | 0.0% |
| Total | 1,293 | 100.0% |
Ancestry in Morgantown
The most populous ancestries reported in Morgantown are American (240 | 18.6%), German (192 | 14.8%), Irish (117 | 9.0%), Mexican (95 | 7.3%), and English (70 | 5.4%), together accounting for 55.2% of all Morgantown residents.
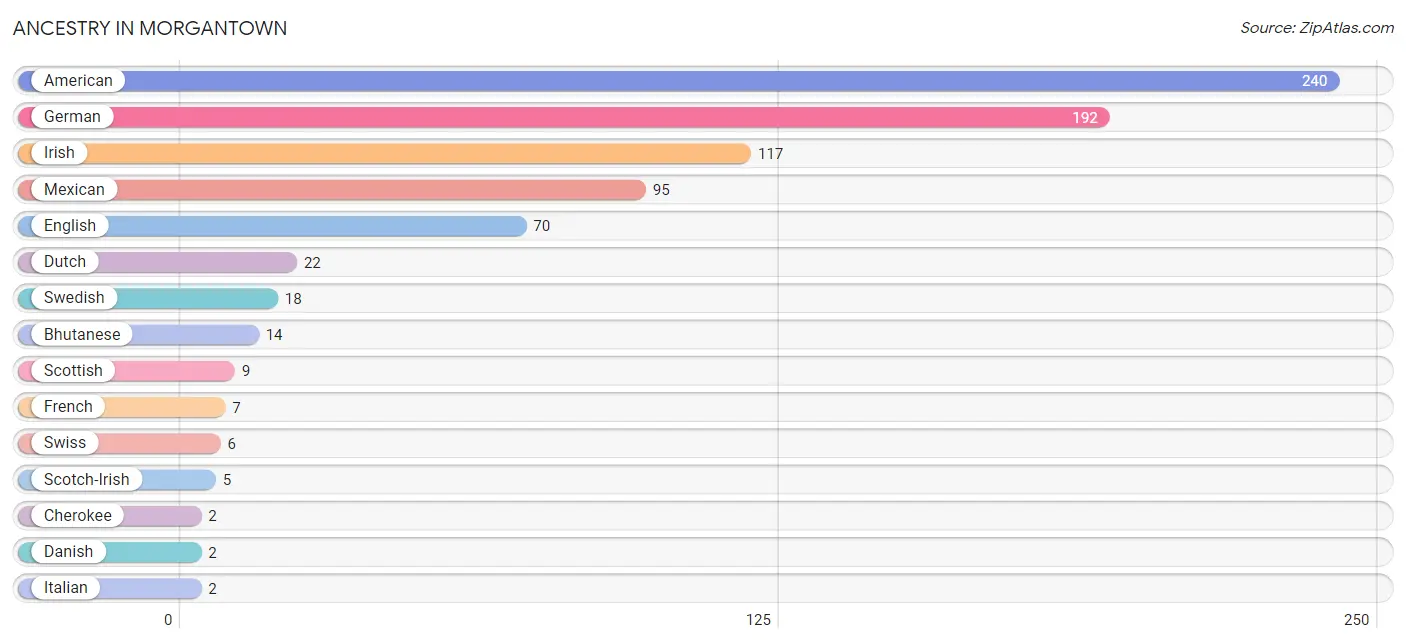
| Ancestry | # Population | % Population |
| American | 240 | 18.6% |
| Bhutanese | 14 | 1.1% |
| Cherokee | 2 | 0.2% |
| Danish | 2 | 0.2% |
| Dutch | 22 | 1.7% |
| English | 70 | 5.4% |
| French | 7 | 0.5% |
| German | 192 | 14.8% |
| Irish | 117 | 9.0% |
| Italian | 2 | 0.2% |
| Mexican | 95 | 7.3% |
| Scotch-Irish | 5 | 0.4% |
| Scottish | 9 | 0.7% |
| Swedish | 18 | 1.4% |
| Swiss | 6 | 0.5% | View All 15 Rows |
Immigrants in Morgantown
The most numerous immigrant groups reported in Morgantown came from Europe (2 | 0.2%), Germany (2 | 0.2%), and Western Europe (2 | 0.2%), together accounting for 0.5% of all Morgantown residents.
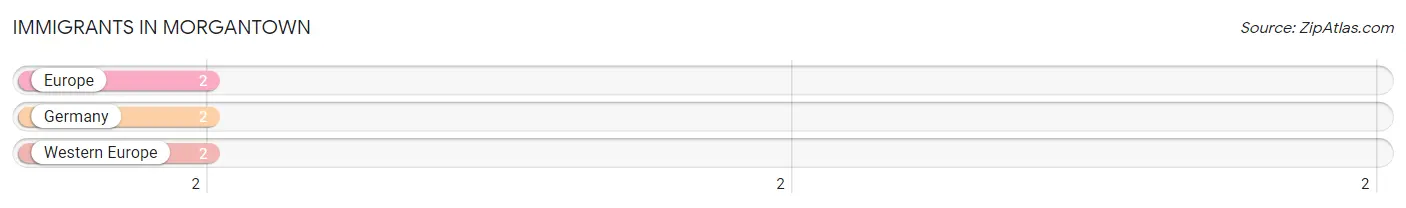
| Immigration Origin | # Population | % Population |
| Europe | 2 | 0.2% |
| Germany | 2 | 0.2% |
| Western Europe | 2 | 0.2% | View All 3 Rows |
Sex and Age in Morgantown
Sex and Age in Morgantown
The most populous age groups in Morgantown are 35 to 39 Years (75 | 13.0%) for men and 10 to 14 Years (105 | 14.7%) for women.
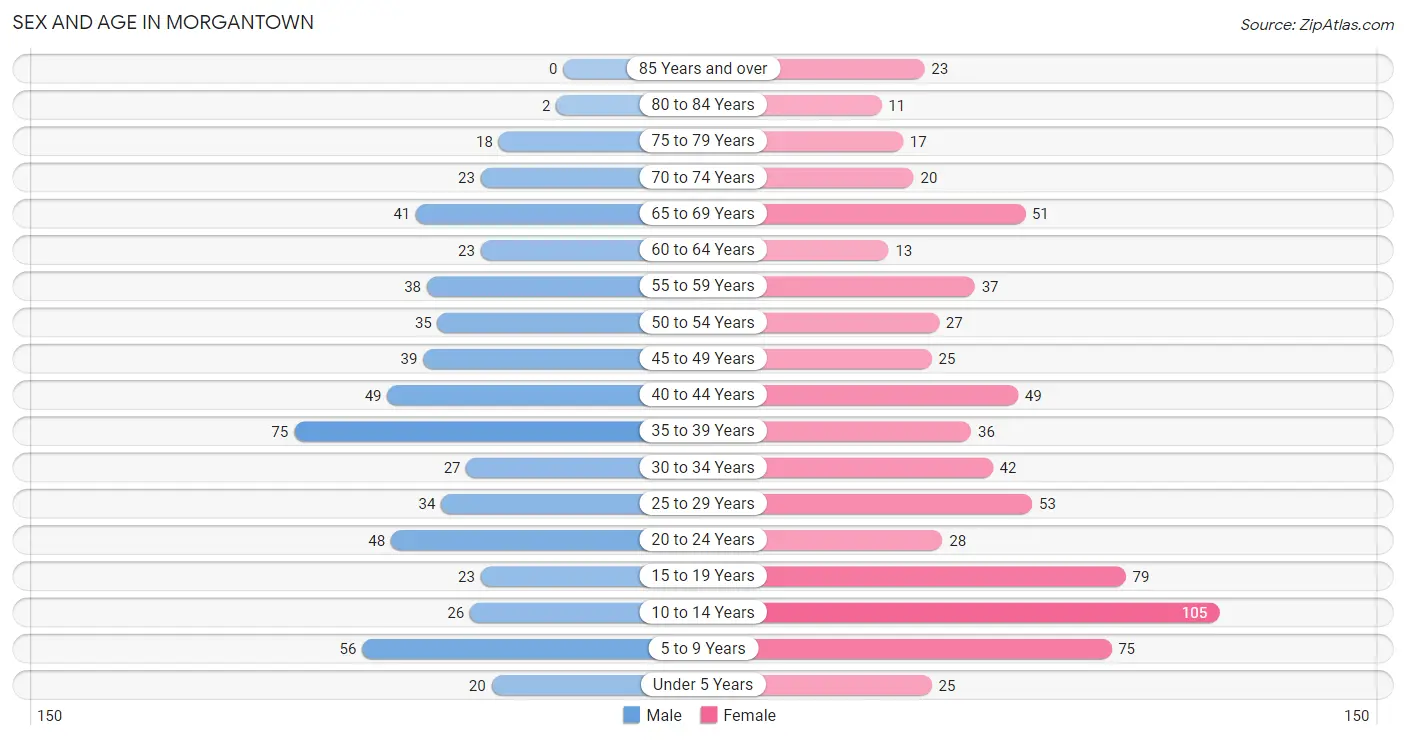
| Age Bracket | Male | Female |
| Under 5 Years | 20 (3.5%) | 25 (3.5%) |
| 5 to 9 Years | 56 (9.7%) | 75 (10.5%) |
| 10 to 14 Years | 26 (4.5%) | 105 (14.7%) |
| 15 to 19 Years | 23 (4.0%) | 79 (11.0%) |
| 20 to 24 Years | 48 (8.3%) | 28 (3.9%) |
| 25 to 29 Years | 34 (5.9%) | 53 (7.4%) |
| 30 to 34 Years | 27 (4.7%) | 42 (5.9%) |
| 35 to 39 Years | 75 (13.0%) | 36 (5.0%) |
| 40 to 44 Years | 49 (8.5%) | 49 (6.8%) |
| 45 to 49 Years | 39 (6.8%) | 25 (3.5%) |
| 50 to 54 Years | 35 (6.1%) | 27 (3.8%) |
| 55 to 59 Years | 38 (6.6%) | 37 (5.2%) |
| 60 to 64 Years | 23 (4.0%) | 13 (1.8%) |
| 65 to 69 Years | 41 (7.1%) | 51 (7.1%) |
| 70 to 74 Years | 23 (4.0%) | 20 (2.8%) |
| 75 to 79 Years | 18 (3.1%) | 17 (2.4%) |
| 80 to 84 Years | 2 (0.4%) | 11 (1.5%) |
| 85 Years and over | 0 (0.0%) | 23 (3.2%) |
| Total | 577 (100.0%) | 716 (100.0%) |
Families and Households in Morgantown
Median Family Size in Morgantown
The median family size in Morgantown is 3.02 persons per family, with married-couple families (253 | 72.1%) accounting for the largest median family size of 3.08 persons per family. On the other hand, single male/father families (34 | 9.7%) represent the smallest median family size with 2.82 persons per family.
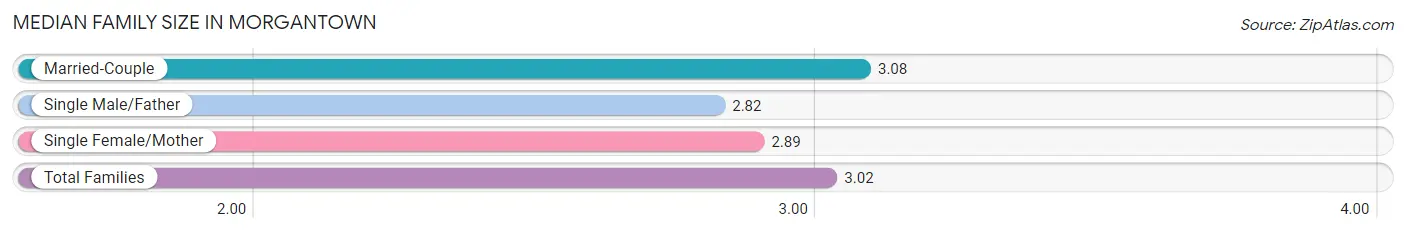
| Family Type | # Families | Family Size |
| Married-Couple | 253 (72.1%) | 3.08 |
| Single Male/Father | 34 (9.7%) | 2.82 |
| Single Female/Mother | 64 (18.2%) | 2.89 |
| Total Families | 351 (100.0%) | 3.02 |
Median Household Size in Morgantown
The median household size in Morgantown is 2.57 persons per household, with single female/mother households (64 | 13.1%) accounting for the largest median household size of 3.5 persons per household. non-family households (136 | 27.9%) represent the smallest median household size with 1.04 persons per household.
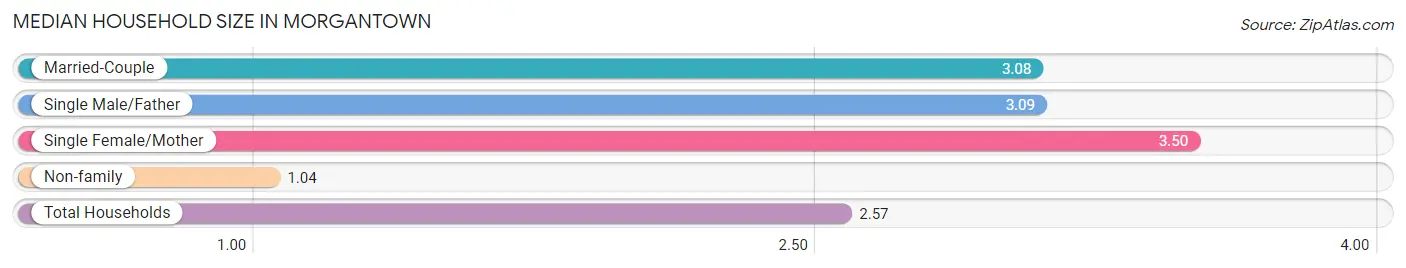
| Household Type | # Households | Household Size |
| Married-Couple | 253 (51.9%) | 3.08 |
| Single Male/Father | 34 (7.0%) | 3.09 |
| Single Female/Mother | 64 (13.1%) | 3.50 |
| Non-family | 136 (27.9%) | 1.04 |
| Total Households | 487 (100.0%) | 2.57 |
Household Size by Marriage Status in Morgantown
Out of a total of 487 households in Morgantown, 351 (72.1%) are family households, while 136 (27.9%) are nonfamily households. The most numerous type of family households are 2-person households, comprising 121, and the most common type of nonfamily households are 1-person households, comprising 131.
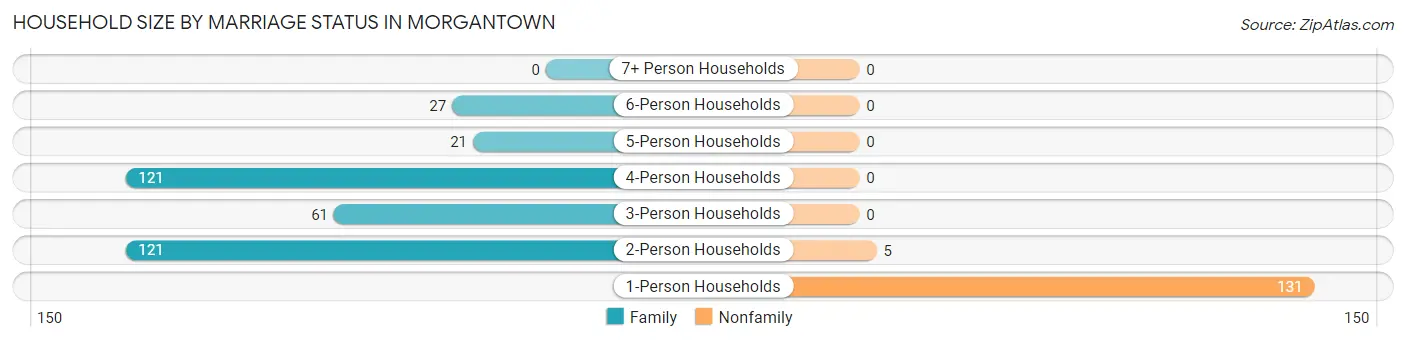
| Household Size | Family Households | Nonfamily Households |
| 1-Person Households | - | 131 (26.9%) |
| 2-Person Households | 121 (24.8%) | 5 (1.0%) |
| 3-Person Households | 61 (12.5%) | 0 (0.0%) |
| 4-Person Households | 121 (24.8%) | 0 (0.0%) |
| 5-Person Households | 21 (4.3%) | 0 (0.0%) |
| 6-Person Households | 27 (5.5%) | 0 (0.0%) |
| 7+ Person Households | 0 (0.0%) | 0 (0.0%) |
| Total | 351 (72.1%) | 136 (27.9%) |
Female Fertility in Morgantown
Fertility by Age in Morgantown
Average fertility rate in Morgantown is 6.0 births per 1,000 women. Women in the age bracket of 20 to 34 years have the highest fertility rate with 16.0 births per 1,000 women. Women in the age bracket of 20 to 34 years acount for 100.0% of all women with births.
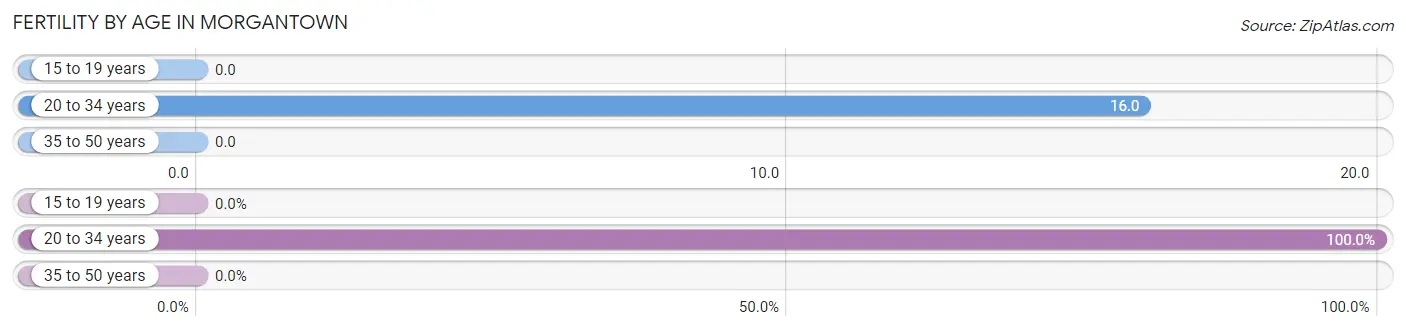
| Age Bracket | Women with Births | Births / 1,000 Women |
| 15 to 19 years | 0 (0.0%) | 0.0 |
| 20 to 34 years | 2 (100.0%) | 16.0 |
| 35 to 50 years | 0 (0.0%) | 0.0 |
| Total | 2 (100.0%) | 6.0 |
Fertility by Age by Marriage Status in Morgantown
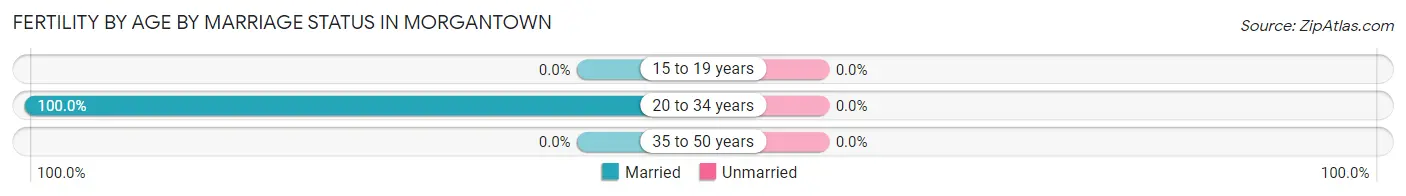
| Age Bracket | Married | Unmarried |
| 15 to 19 years | 0 (0.0%) | 0 (0.0%) |
| 20 to 34 years | 2 (100.0%) | 0 (0.0%) |
| 35 to 50 years | 0 (0.0%) | 0 (0.0%) |
| Total | 2 (100.0%) | 0 (0.0%) |
Fertility by Education in Morgantown
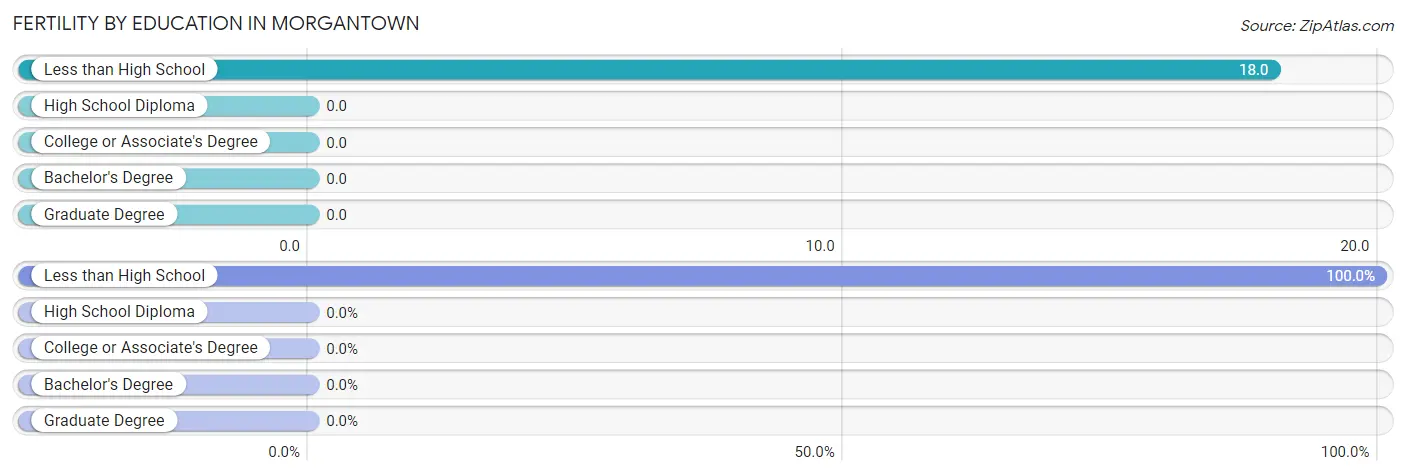
| Educational Attainment | Women with Births | Births / 1,000 Women |
| Less than High School | 2 (100.0%) | 18.0 |
| High School Diploma | 0 (0.0%) | 0.0 |
| College or Associate's Degree | 0 (0.0%) | 0.0 |
| Bachelor's Degree | 0 (0.0%) | 0.0 |
| Graduate Degree | 0 (0.0%) | 0.0 |
| Total | 2 (100.0%) | 6.0 |
Fertility by Education by Marriage Status in Morgantown
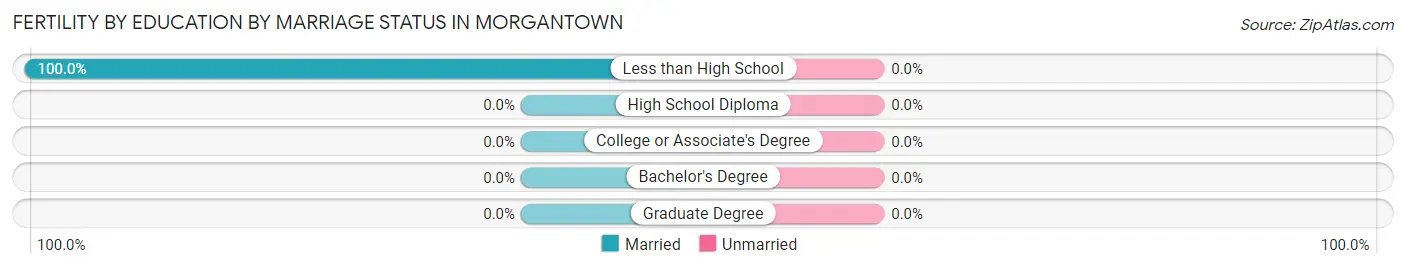
| Educational Attainment | Married | Unmarried |
| Less than High School | 2 (100.0%) | 0 (0.0%) |
| High School Diploma | 0 (0.0%) | 0 (0.0%) |
| College or Associate's Degree | 0 (0.0%) | 0 (0.0%) |
| Bachelor's Degree | 0 (0.0%) | 0 (0.0%) |
| Graduate Degree | 0 (0.0%) | 0 (0.0%) |
| Total | 2 (100.0%) | 0 (0.0%) |
Employment Characteristics in Morgantown
Employment by Class of Employer in Morgantown
Among the 466 employed individuals in Morgantown, private company employees (323 | 69.3%), self-employed (not incorporated) (39 | 8.4%), and local government employees (39 | 8.4%) make up the most common classes of employment.
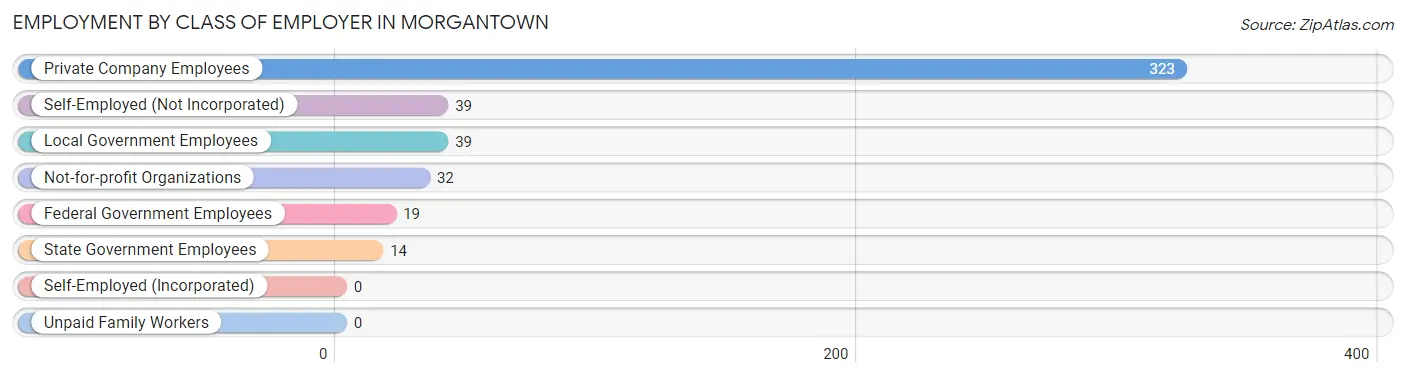
| Employer Class | # Employees | % Employees |
| Private Company Employees | 323 | 69.3% |
| Self-Employed (Incorporated) | 0 | 0.0% |
| Self-Employed (Not Incorporated) | 39 | 8.4% |
| Not-for-profit Organizations | 32 | 6.9% |
| Local Government Employees | 39 | 8.4% |
| State Government Employees | 14 | 3.0% |
| Federal Government Employees | 19 | 4.1% |
| Unpaid Family Workers | 0 | 0.0% |
| Total | 466 | 100.0% |
Employment Status by Age in Morgantown
According to the labor force statistics for Morgantown, out of the total population over 16 years of age (943), 62.5% or 589 individuals are in the labor force, with 19.0% or 112 of them unemployed. The age group with the highest labor force participation rate is 30 to 34 years, with 100.0% or 69 individuals in the labor force. Within the labor force, the 30 to 34 years age range has the highest percentage of unemployed individuals, with 52.2% or 36 of them being unemployed.
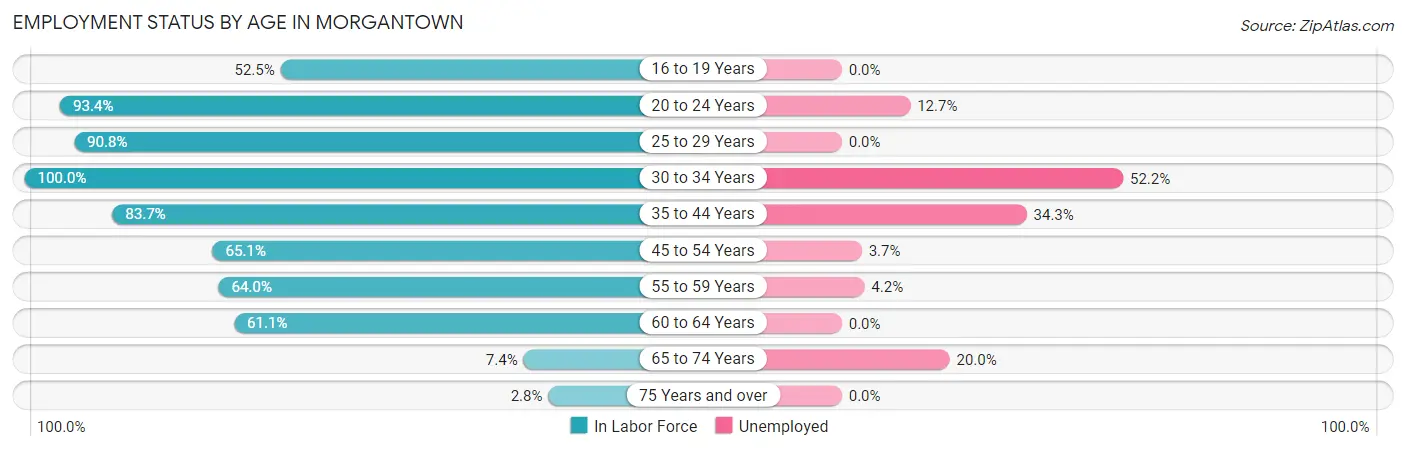
| Age Bracket | In Labor Force | Unemployed |
| 16 to 19 Years | 31 (52.5%) | 0 (0.0%) |
| 20 to 24 Years | 71 (93.4%) | 9 (12.7%) |
| 25 to 29 Years | 79 (90.8%) | 0 (0.0%) |
| 30 to 34 Years | 69 (100.0%) | 36 (52.2%) |
| 35 to 44 Years | 175 (83.7%) | 60 (34.3%) |
| 45 to 54 Years | 82 (65.1%) | 3 (3.7%) |
| 55 to 59 Years | 48 (64.0%) | 2 (4.2%) |
| 60 to 64 Years | 22 (61.1%) | 0 (0.0%) |
| 65 to 74 Years | 10 (7.4%) | 2 (20.0%) |
| 75 Years and over | 2 (2.8%) | 0 (0.0%) |
| Total | 589 (62.5%) | 112 (19.0%) |
Employment Status by Educational Attainment in Morgantown
According to labor force statistics for Morgantown, 78.9% of individuals (475) out of the total population between 25 and 64 years of age (602) are in the labor force, with 21.3% or 101 of them being unemployed. The group with the highest labor force participation rate are those with the educational attainment of bachelor's degree or higher, with 100.0% or 44 individuals in the labor force. Within the labor force, individuals with high school diploma education have the highest percentage of unemployment, with 35.6% or 101 of them being unemployed.
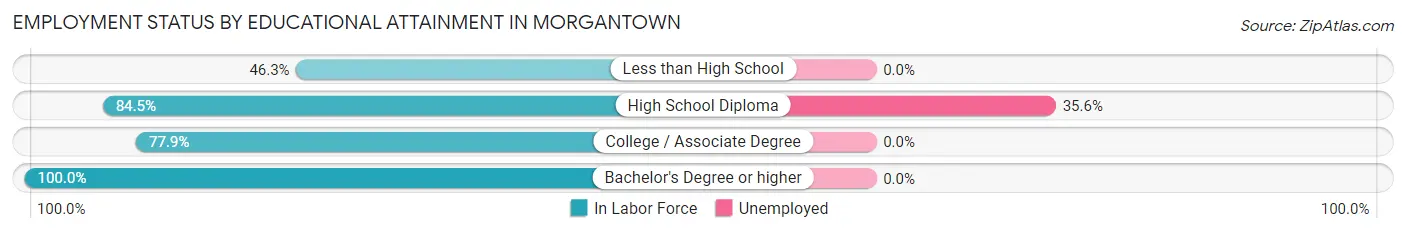
| Educational Attainment | In Labor Force | Unemployed |
| Less than High School | 38 (46.3%) | 0 (0.0%) |
| High School Diploma | 284 (84.5%) | 120 (35.6%) |
| College / Associate Degree | 109 (77.9%) | 0 (0.0%) |
| Bachelor's Degree or higher | 44 (100.0%) | 0 (0.0%) |
| Total | 475 (78.9%) | 128 (21.3%) |
Employment Occupations by Sex in Morgantown
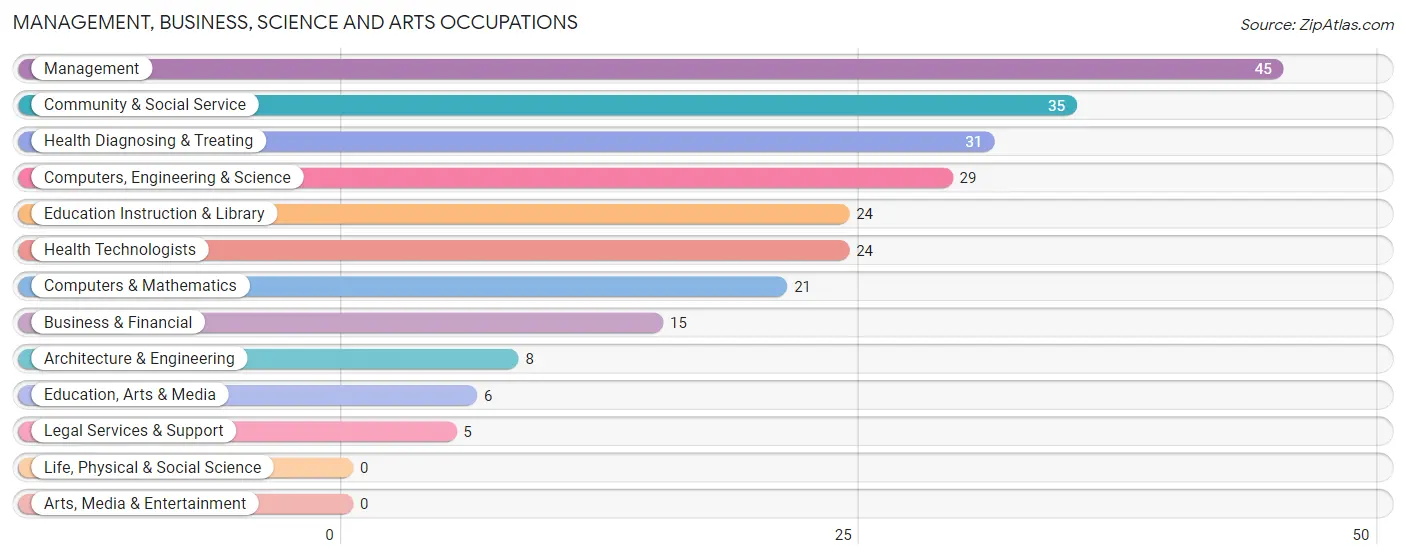
Management, Business, Science and Arts Occupations
The most common Management, Business, Science and Arts occupations in Morgantown are Management (45 | 9.4%), Community & Social Service (35 | 7.3%), Health Diagnosing & Treating (31 | 6.5%), Computers, Engineering & Science (29 | 6.1%), and Education Instruction & Library (24 | 5.0%).
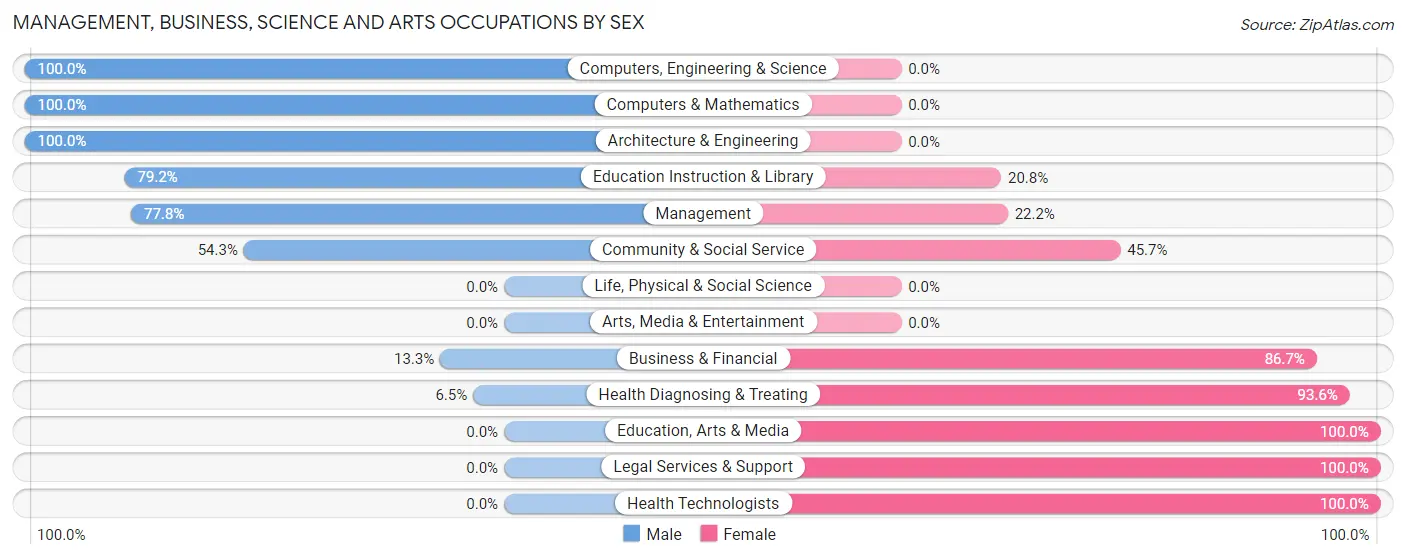
Management, Business, Science and Arts Occupations by Sex
Within the Management, Business, Science and Arts occupations in Morgantown, the most male-oriented occupations are Computers, Engineering & Science (100.0%), Computers & Mathematics (100.0%), and Architecture & Engineering (100.0%), while the most female-oriented occupations are Education, Arts & Media (100.0%), Legal Services & Support (100.0%), and Health Technologists (100.0%).
| Occupation | Male | Female |
| Management | 35 (77.8%) | 10 (22.2%) |
| Business & Financial | 2 (13.3%) | 13 (86.7%) |
| Computers, Engineering & Science | 29 (100.0%) | 0 (0.0%) |
| Computers & Mathematics | 21 (100.0%) | 0 (0.0%) |
| Architecture & Engineering | 8 (100.0%) | 0 (0.0%) |
| Life, Physical & Social Science | 0 (0.0%) | 0 (0.0%) |
| Community & Social Service | 19 (54.3%) | 16 (45.7%) |
| Education, Arts & Media | 0 (0.0%) | 6 (100.0%) |
| Legal Services & Support | 0 (0.0%) | 5 (100.0%) |
| Education Instruction & Library | 19 (79.2%) | 5 (20.8%) |
| Arts, Media & Entertainment | 0 (0.0%) | 0 (0.0%) |
| Health Diagnosing & Treating | 2 (6.5%) | 29 (93.5%) |
| Health Technologists | 0 (0.0%) | 24 (100.0%) |
| Total (Category) | 87 (56.1%) | 68 (43.9%) |
| Total (Overall) | 255 (53.5%) | 222 (46.5%) |
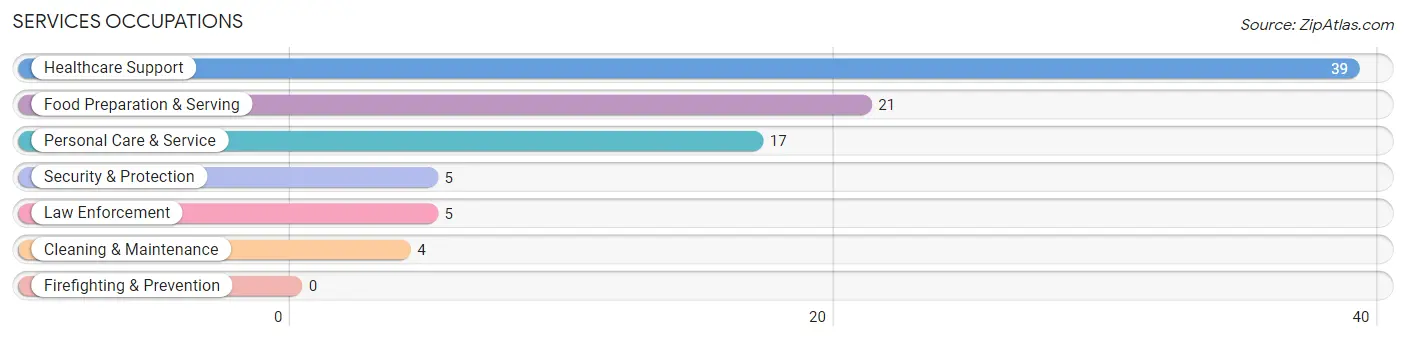
Services Occupations
The most common Services occupations in Morgantown are Healthcare Support (39 | 8.2%), Food Preparation & Serving (21 | 4.4%), Personal Care & Service (17 | 3.6%), Security & Protection (5 | 1.1%), and Law Enforcement (5 | 1.1%).
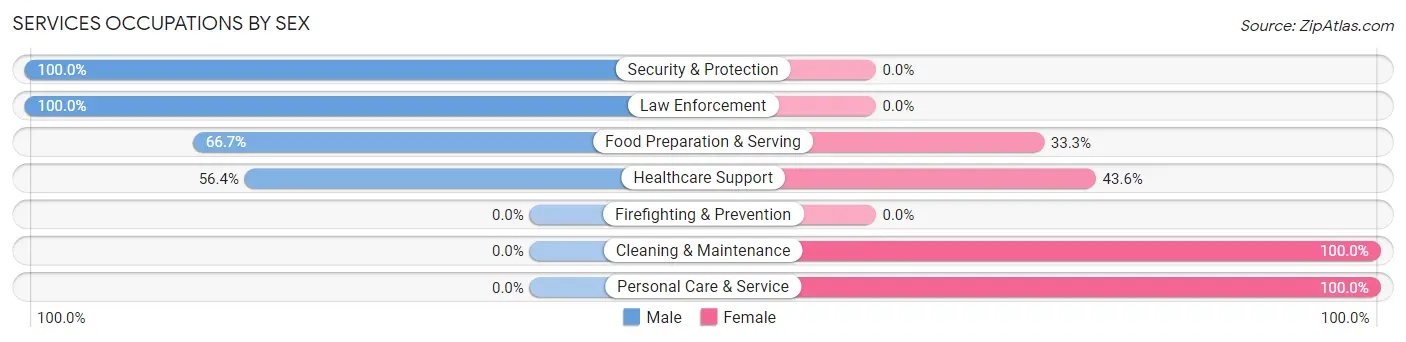
Services Occupations by Sex
Within the Services occupations in Morgantown, the most male-oriented occupations are Security & Protection (100.0%), Law Enforcement (100.0%), and Food Preparation & Serving (66.7%), while the most female-oriented occupations are Cleaning & Maintenance (100.0%), Personal Care & Service (100.0%), and Healthcare Support (43.6%).
| Occupation | Male | Female |
| Healthcare Support | 22 (56.4%) | 17 (43.6%) |
| Security & Protection | 5 (100.0%) | 0 (0.0%) |
| Firefighting & Prevention | 0 (0.0%) | 0 (0.0%) |
| Law Enforcement | 5 (100.0%) | 0 (0.0%) |
| Food Preparation & Serving | 14 (66.7%) | 7 (33.3%) |
| Cleaning & Maintenance | 0 (0.0%) | 4 (100.0%) |
| Personal Care & Service | 0 (0.0%) | 17 (100.0%) |
| Total (Category) | 41 (47.7%) | 45 (52.3%) |
| Total (Overall) | 255 (53.5%) | 222 (46.5%) |
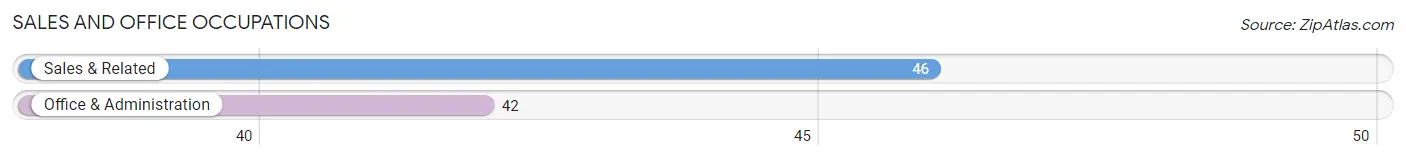
Sales and Office Occupations
The most common Sales and Office occupations in Morgantown are Sales & Related (46 | 9.6%), and Office & Administration (42 | 8.8%).
Sales and Office Occupations by Sex
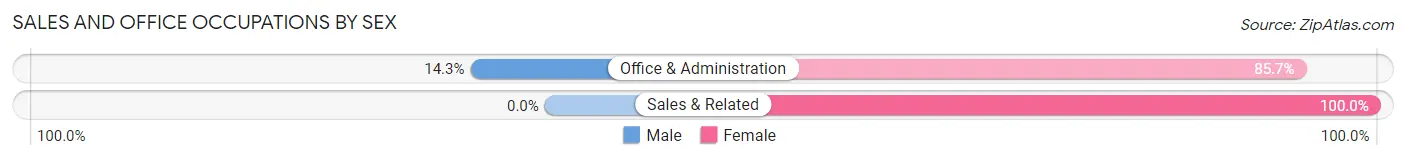
| Occupation | Male | Female |
| Sales & Related | 0 (0.0%) | 46 (100.0%) |
| Office & Administration | 6 (14.3%) | 36 (85.7%) |
| Total (Category) | 6 (6.8%) | 82 (93.2%) |
| Total (Overall) | 255 (53.5%) | 222 (46.5%) |
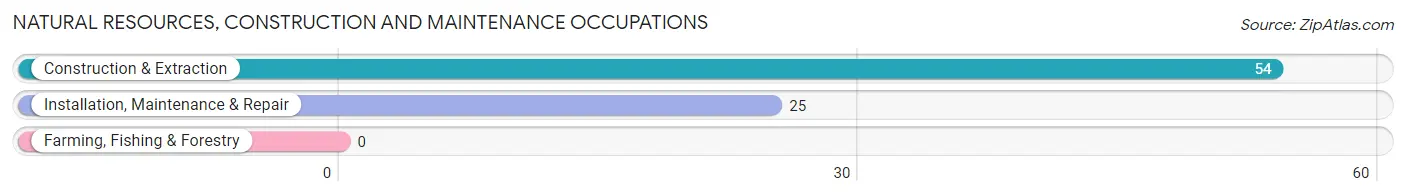
Natural Resources, Construction and Maintenance Occupations
The most common Natural Resources, Construction and Maintenance occupations in Morgantown are Construction & Extraction (54 | 11.3%), and Installation, Maintenance & Repair (25 | 5.2%).
Natural Resources, Construction and Maintenance Occupations by Sex
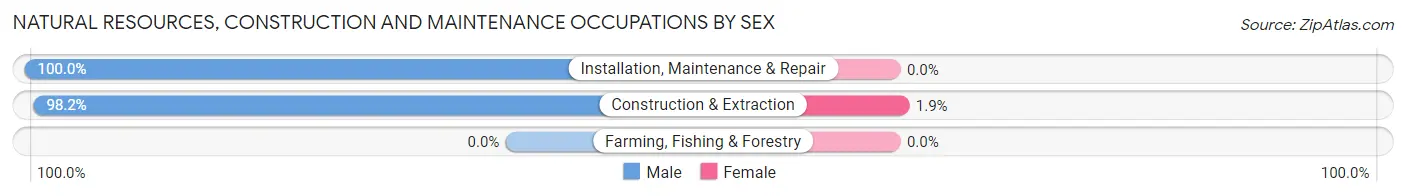
| Occupation | Male | Female |
| Farming, Fishing & Forestry | 0 (0.0%) | 0 (0.0%) |
| Construction & Extraction | 53 (98.2%) | 1 (1.8%) |
| Installation, Maintenance & Repair | 25 (100.0%) | 0 (0.0%) |
| Total (Category) | 78 (98.7%) | 1 (1.3%) |
| Total (Overall) | 255 (53.5%) | 222 (46.5%) |
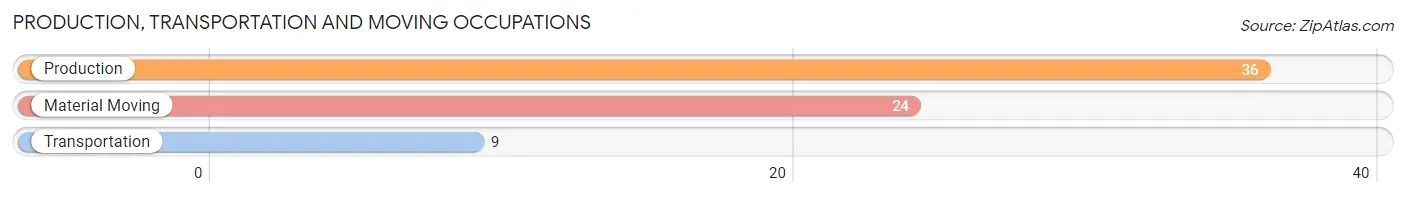
Production, Transportation and Moving Occupations
The most common Production, Transportation and Moving occupations in Morgantown are Production (36 | 7.5%), Material Moving (24 | 5.0%), and Transportation (9 | 1.9%).
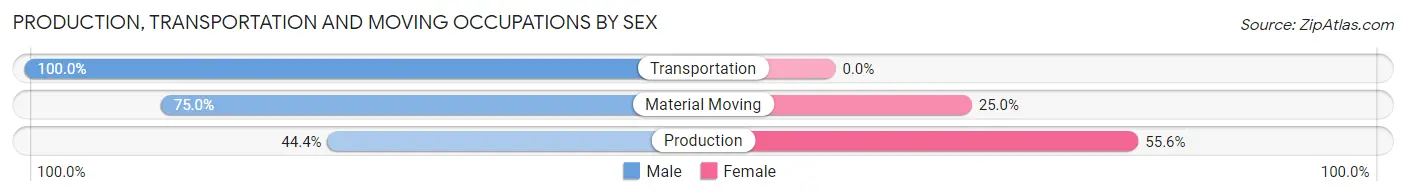
Production, Transportation and Moving Occupations by Sex
| Occupation | Male | Female |
| Production | 16 (44.4%) | 20 (55.6%) |
| Transportation | 9 (100.0%) | 0 (0.0%) |
| Material Moving | 18 (75.0%) | 6 (25.0%) |
| Total (Category) | 43 (62.3%) | 26 (37.7%) |
| Total (Overall) | 255 (53.5%) | 222 (46.5%) |
Employment Industries by Sex in Morgantown
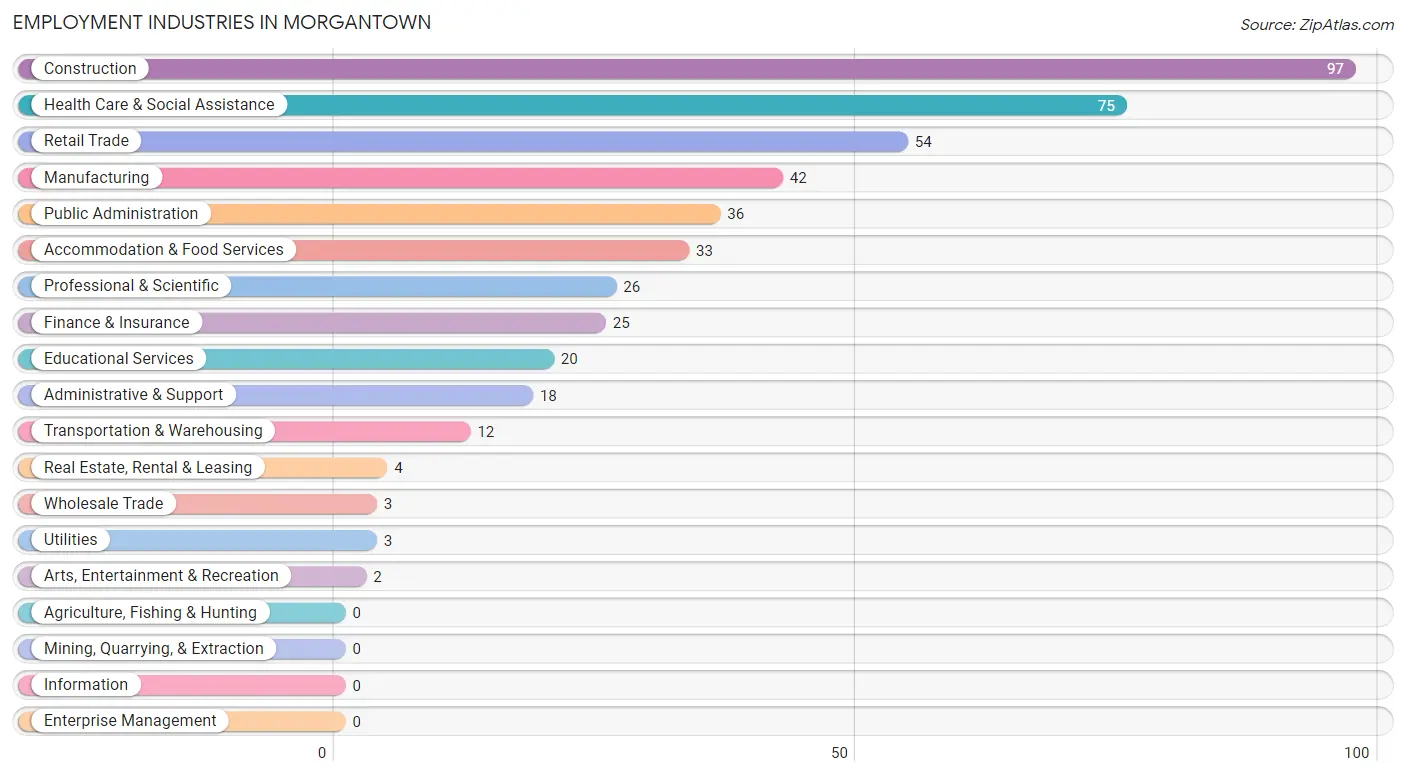
Employment Industries in Morgantown
The major employment industries in Morgantown include Construction (97 | 20.3%), Health Care & Social Assistance (75 | 15.7%), Retail Trade (54 | 11.3%), Manufacturing (42 | 8.8%), and Public Administration (36 | 7.5%).
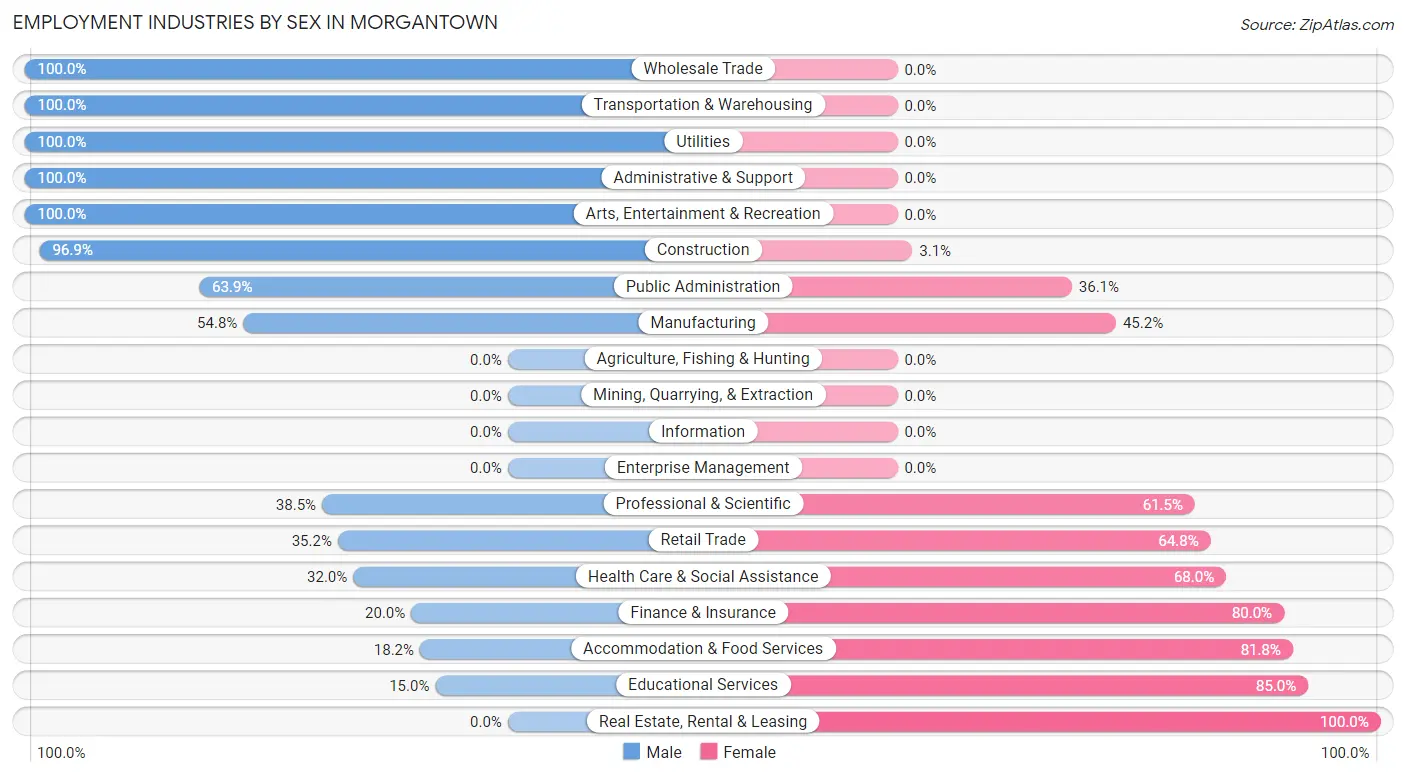
Employment Industries by Sex in Morgantown
The Morgantown industries that see more men than women are Wholesale Trade (100.0%), Transportation & Warehousing (100.0%), and Utilities (100.0%), whereas the industries that tend to have a higher number of women are Real Estate, Rental & Leasing (100.0%), Educational Services (85.0%), and Accommodation & Food Services (81.8%).
| Industry | Male | Female |
| Agriculture, Fishing & Hunting | 0 (0.0%) | 0 (0.0%) |
| Mining, Quarrying, & Extraction | 0 (0.0%) | 0 (0.0%) |
| Construction | 94 (96.9%) | 3 (3.1%) |
| Manufacturing | 23 (54.8%) | 19 (45.2%) |
| Wholesale Trade | 3 (100.0%) | 0 (0.0%) |
| Retail Trade | 19 (35.2%) | 35 (64.8%) |
| Transportation & Warehousing | 12 (100.0%) | 0 (0.0%) |
| Utilities | 3 (100.0%) | 0 (0.0%) |
| Information | 0 (0.0%) | 0 (0.0%) |
| Finance & Insurance | 5 (20.0%) | 20 (80.0%) |
| Real Estate, Rental & Leasing | 0 (0.0%) | 4 (100.0%) |
| Professional & Scientific | 10 (38.5%) | 16 (61.5%) |
| Enterprise Management | 0 (0.0%) | 0 (0.0%) |
| Administrative & Support | 18 (100.0%) | 0 (0.0%) |
| Educational Services | 3 (15.0%) | 17 (85.0%) |
| Health Care & Social Assistance | 24 (32.0%) | 51 (68.0%) |
| Arts, Entertainment & Recreation | 2 (100.0%) | 0 (0.0%) |
| Accommodation & Food Services | 6 (18.2%) | 27 (81.8%) |
| Public Administration | 23 (63.9%) | 13 (36.1%) |
| Total | 255 (53.5%) | 222 (46.5%) |
Education in Morgantown
School Enrollment in Morgantown
The most common levels of schooling among the 379 students in Morgantown are elementary school (128 | 33.8%), middle school (103 | 27.2%), and high school (87 | 23.0%).
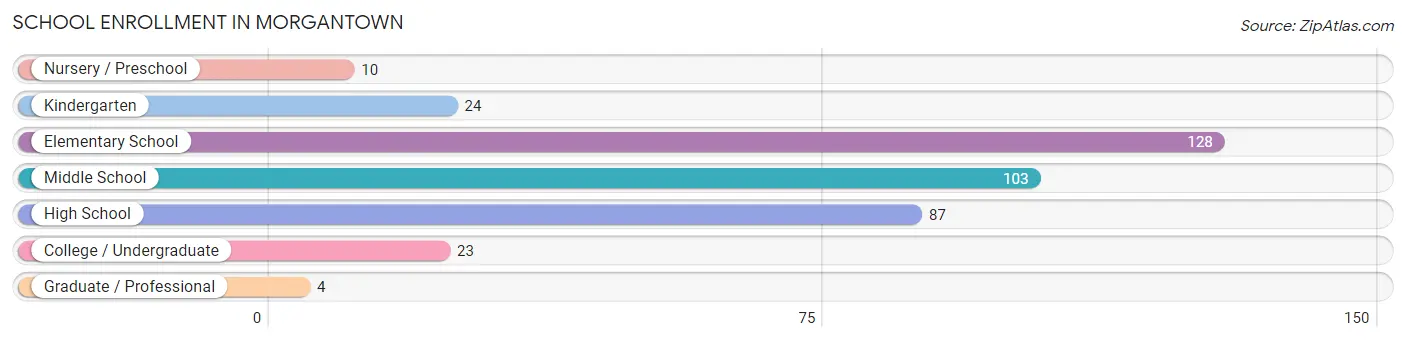
| School Level | # Students | % Students |
| Nursery / Preschool | 10 | 2.6% |
| Kindergarten | 24 | 6.3% |
| Elementary School | 128 | 33.8% |
| Middle School | 103 | 27.2% |
| High School | 87 | 23.0% |
| College / Undergraduate | 23 | 6.1% |
| Graduate / Professional | 4 | 1.1% |
| Total | 379 | 100.0% |
School Enrollment by Age by Funding Source in Morgantown
Out of a total of 379 students who are enrolled in schools in Morgantown, 123 (32.5%) attend a private institution, while the remaining 256 (67.5%) are enrolled in public schools. The age group of 3 to 4 year olds has the highest likelihood of being enrolled in private schools, with 5 (62.5% in the age bracket) enrolled. Conversely, the age group of 15 to 17 year olds has the lowest likelihood of being enrolled in a private school, with 72 (100.0% in the age bracket) attending a public institution.
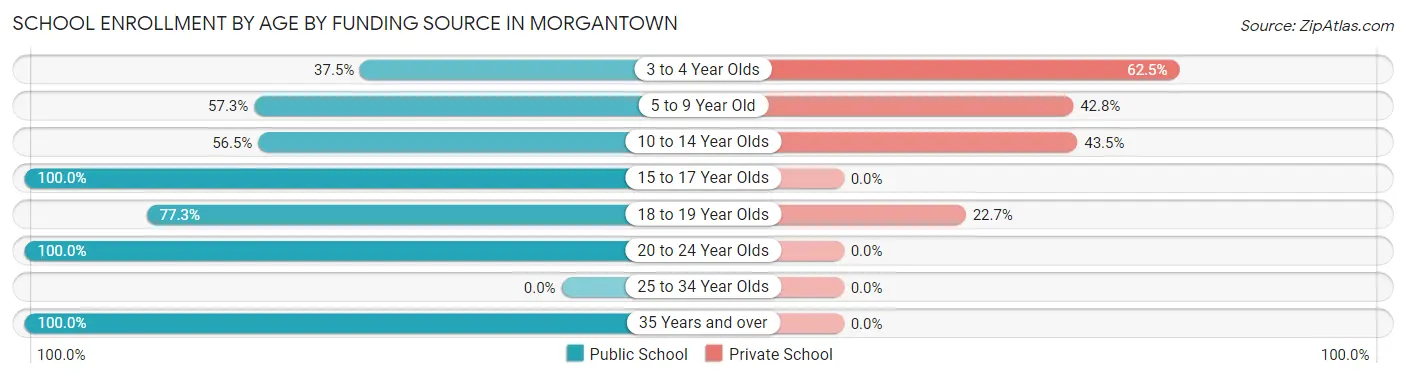
| Age Bracket | Public School | Private School |
| 3 to 4 Year Olds | 3 (37.5%) | 5 (62.5%) |
| 5 to 9 Year Old | 75 (57.3%) | 56 (42.7%) |
| 10 to 14 Year Olds | 74 (56.5%) | 57 (43.5%) |
| 15 to 17 Year Olds | 72 (100.0%) | 0 (0.0%) |
| 18 to 19 Year Olds | 17 (77.3%) | 5 (22.7%) |
| 20 to 24 Year Olds | 13 (100.0%) | 0 (0.0%) |
| 25 to 34 Year Olds | 0 (0.0%) | 0 (0.0%) |
| 35 Years and over | 2 (100.0%) | 0 (0.0%) |
| Total | 256 (67.5%) | 123 (32.5%) |
Educational Attainment by Field of Study in Morgantown
Literature & languages (16 | 27.6%), science & technology (15 | 25.9%), bio, nature & agricultural (12 | 20.7%), education (7 | 12.1%), and psychology (2 | 3.5%) are the most common fields of study among 58 individuals in Morgantown who have obtained a bachelor's degree or higher.
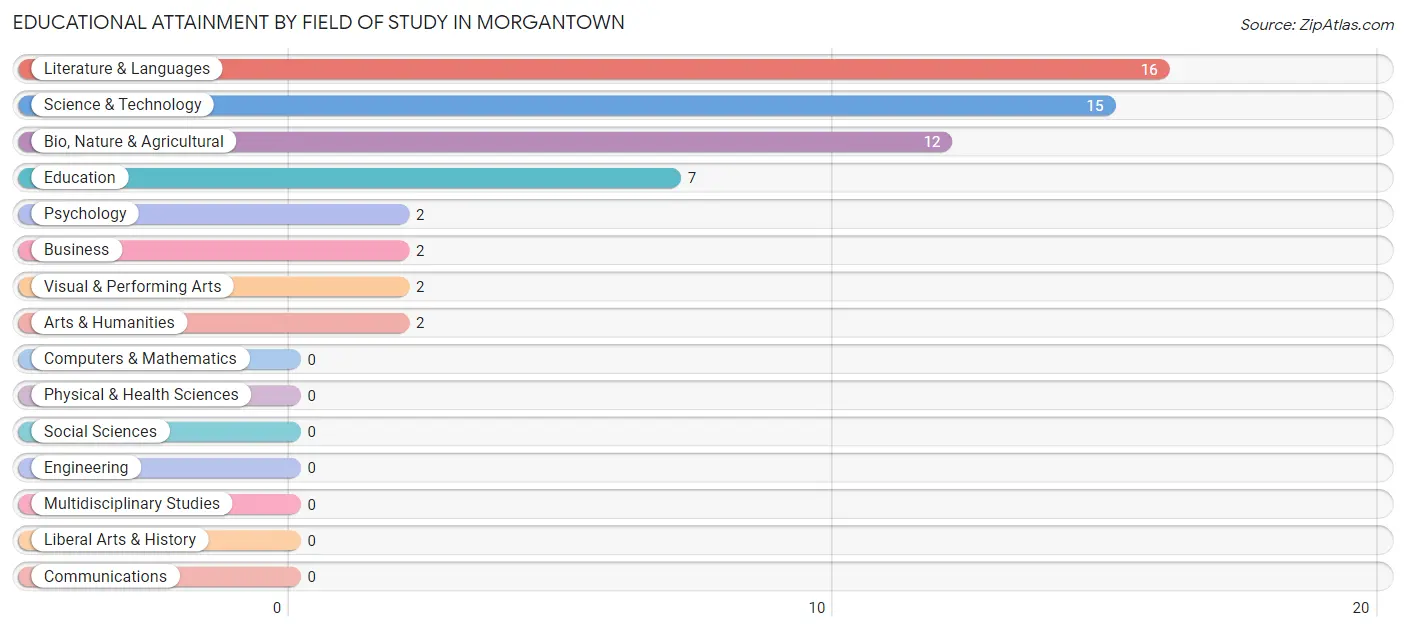
| Field of Study | # Graduates | % Graduates |
| Computers & Mathematics | 0 | 0.0% |
| Bio, Nature & Agricultural | 12 | 20.7% |
| Physical & Health Sciences | 0 | 0.0% |
| Psychology | 2 | 3.5% |
| Social Sciences | 0 | 0.0% |
| Engineering | 0 | 0.0% |
| Multidisciplinary Studies | 0 | 0.0% |
| Science & Technology | 15 | 25.9% |
| Business | 2 | 3.5% |
| Education | 7 | 12.1% |
| Literature & Languages | 16 | 27.6% |
| Liberal Arts & History | 0 | 0.0% |
| Visual & Performing Arts | 2 | 3.5% |
| Communications | 0 | 0.0% |
| Arts & Humanities | 2 | 3.5% |
| Total | 58 | 100.0% |
Transportation & Commute in Morgantown
Vehicle Availability by Sex in Morgantown
The most prevalent vehicle ownership categories in Morgantown are males with 3 vehicles (84, accounting for 33.7%) and females with 3 vehicles (62, making up 38.7%).
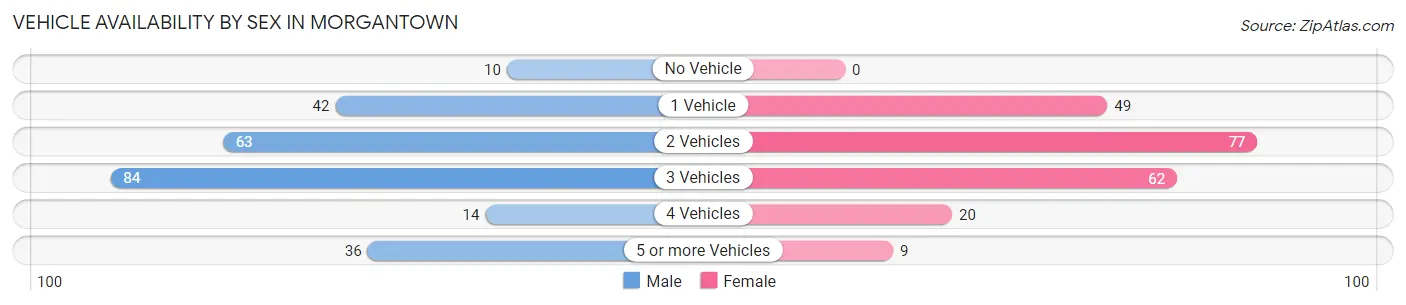
| Vehicles Available | Male | Female |
| No Vehicle | 10 (4.0%) | 0 (0.0%) |
| 1 Vehicle | 42 (16.9%) | 49 (22.6%) |
| 2 Vehicles | 63 (25.3%) | 77 (35.5%) |
| 3 Vehicles | 84 (33.7%) | 62 (28.6%) |
| 4 Vehicles | 14 (5.6%) | 20 (9.2%) |
| 5 or more Vehicles | 36 (14.5%) | 9 (4.2%) |
| Total | 249 (100.0%) | 217 (100.0%) |
Commute Time in Morgantown
The most frequently occuring commute durations in Morgantown are 45 to 59 minutes (89 commuters, 20.1%), 60 to 89 minutes (76 commuters, 17.2%), and 30 to 34 minutes (71 commuters, 16.1%).
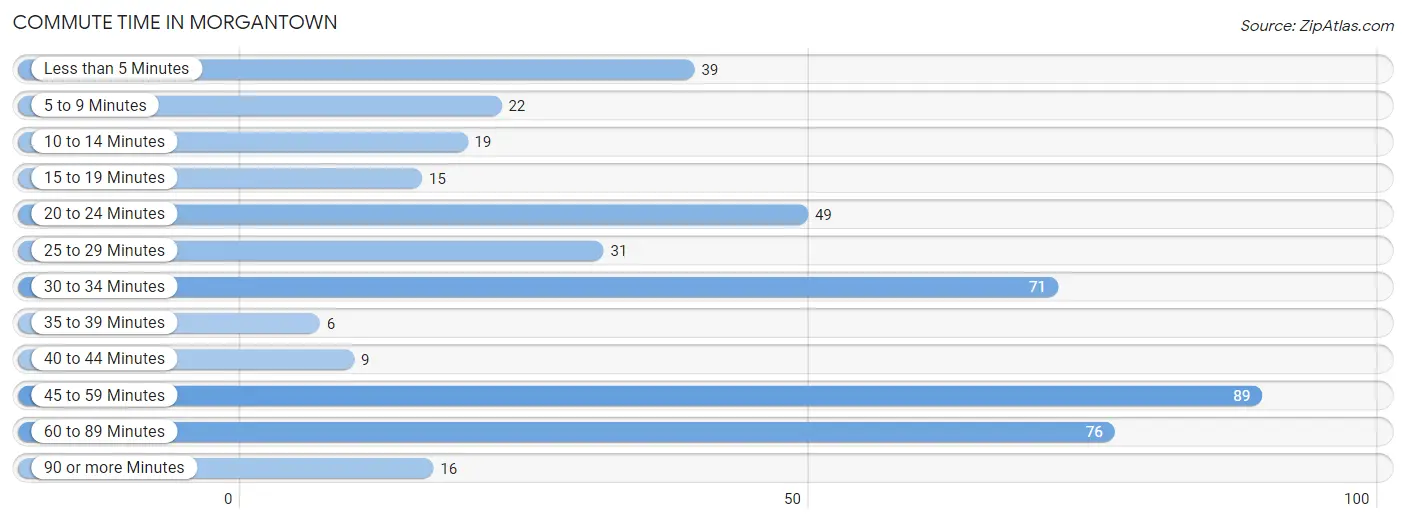
| Commute Time | # Commuters | % Commuters |
| Less than 5 Minutes | 39 | 8.8% |
| 5 to 9 Minutes | 22 | 5.0% |
| 10 to 14 Minutes | 19 | 4.3% |
| 15 to 19 Minutes | 15 | 3.4% |
| 20 to 24 Minutes | 49 | 11.1% |
| 25 to 29 Minutes | 31 | 7.0% |
| 30 to 34 Minutes | 71 | 16.1% |
| 35 to 39 Minutes | 6 | 1.4% |
| 40 to 44 Minutes | 9 | 2.0% |
| 45 to 59 Minutes | 89 | 20.1% |
| 60 to 89 Minutes | 76 | 17.2% |
| 90 or more Minutes | 16 | 3.6% |
Commute Time by Sex in Morgantown
The most common commute times in Morgantown are 60 to 89 minutes (51 commuters, 21.6%) for males and 45 to 59 minutes (44 commuters, 21.4%) for females.
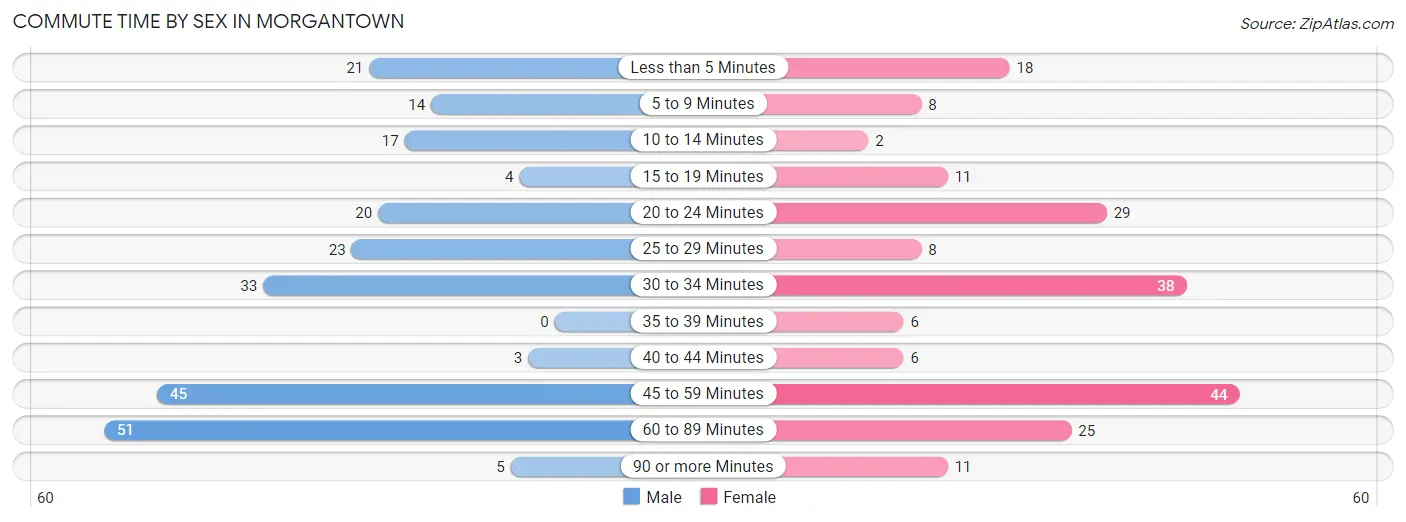
| Commute Time | Male | Female |
| Less than 5 Minutes | 21 (8.9%) | 18 (8.7%) |
| 5 to 9 Minutes | 14 (5.9%) | 8 (3.9%) |
| 10 to 14 Minutes | 17 (7.2%) | 2 (1.0%) |
| 15 to 19 Minutes | 4 (1.7%) | 11 (5.3%) |
| 20 to 24 Minutes | 20 (8.5%) | 29 (14.1%) |
| 25 to 29 Minutes | 23 (9.8%) | 8 (3.9%) |
| 30 to 34 Minutes | 33 (14.0%) | 38 (18.4%) |
| 35 to 39 Minutes | 0 (0.0%) | 6 (2.9%) |
| 40 to 44 Minutes | 3 (1.3%) | 6 (2.9%) |
| 45 to 59 Minutes | 45 (19.1%) | 44 (21.4%) |
| 60 to 89 Minutes | 51 (21.6%) | 25 (12.1%) |
| 90 or more Minutes | 5 (2.1%) | 11 (5.3%) |
Time of Departure to Work by Sex in Morgantown
The most frequent times of departure to work in Morgantown are 5:30 AM to 5:59 AM (56, 23.7%) for males and 5:30 AM to 5:59 AM (37, 18.0%) for females.
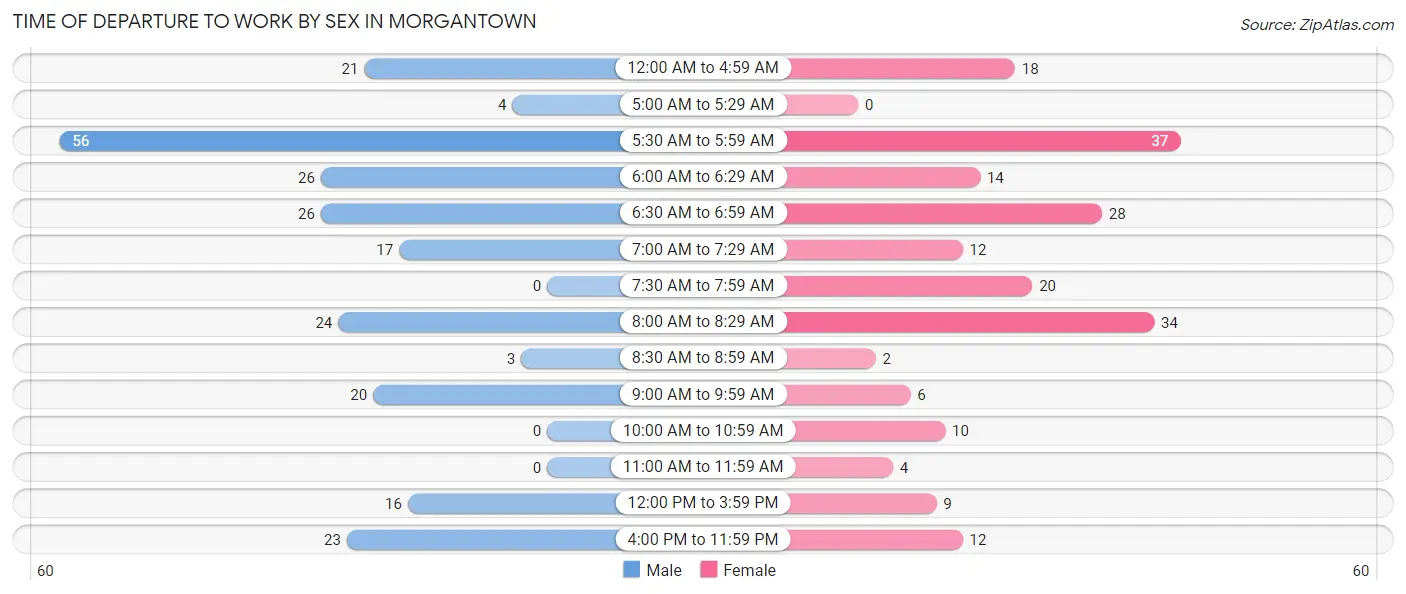
| Time of Departure | Male | Female |
| 12:00 AM to 4:59 AM | 21 (8.9%) | 18 (8.7%) |
| 5:00 AM to 5:29 AM | 4 (1.7%) | 0 (0.0%) |
| 5:30 AM to 5:59 AM | 56 (23.7%) | 37 (18.0%) |
| 6:00 AM to 6:29 AM | 26 (11.0%) | 14 (6.8%) |
| 6:30 AM to 6:59 AM | 26 (11.0%) | 28 (13.6%) |
| 7:00 AM to 7:29 AM | 17 (7.2%) | 12 (5.8%) |
| 7:30 AM to 7:59 AM | 0 (0.0%) | 20 (9.7%) |
| 8:00 AM to 8:29 AM | 24 (10.2%) | 34 (16.5%) |
| 8:30 AM to 8:59 AM | 3 (1.3%) | 2 (1.0%) |
| 9:00 AM to 9:59 AM | 20 (8.5%) | 6 (2.9%) |
| 10:00 AM to 10:59 AM | 0 (0.0%) | 10 (4.9%) |
| 11:00 AM to 11:59 AM | 0 (0.0%) | 4 (1.9%) |
| 12:00 PM to 3:59 PM | 16 (6.8%) | 9 (4.4%) |
| 4:00 PM to 11:59 PM | 23 (9.8%) | 12 (5.8%) |
| Total | 236 (100.0%) | 206 (100.0%) |
Housing Occupancy in Morgantown
Occupancy by Ownership in Morgantown
Of the total 487 dwellings in Morgantown, owner-occupied units account for 361 (74.1%), while renter-occupied units make up 126 (25.9%).
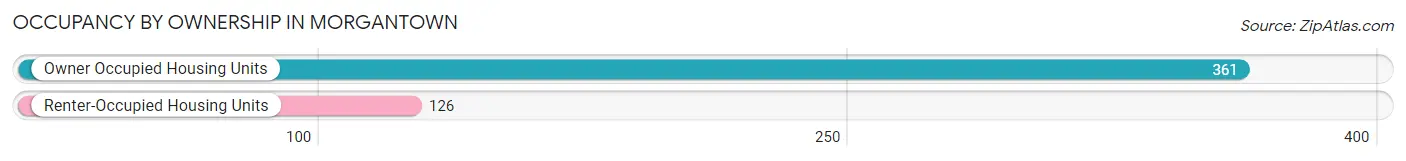
| Occupancy | # Housing Units | % Housing Units |
| Owner Occupied Housing Units | 361 | 74.1% |
| Renter-Occupied Housing Units | 126 | 25.9% |
| Total Occupied Housing Units | 487 | 100.0% |
Occupancy by Household Size in Morgantown
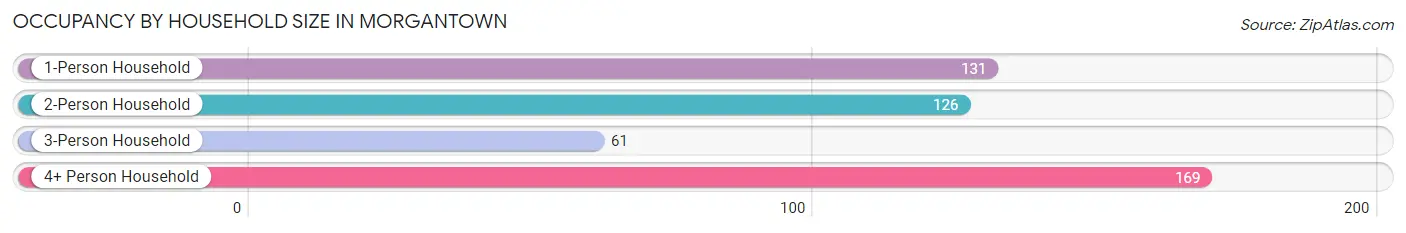
| Household Size | # Housing Units | % Housing Units |
| 1-Person Household | 131 | 26.9% |
| 2-Person Household | 126 | 25.9% |
| 3-Person Household | 61 | 12.5% |
| 4+ Person Household | 169 | 34.7% |
| Total Housing Units | 487 | 100.0% |
Occupancy by Ownership by Household Size in Morgantown
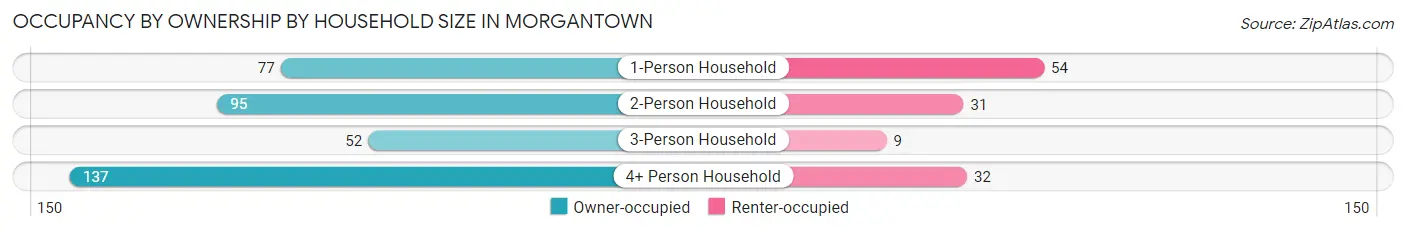
| Household Size | Owner-occupied | Renter-occupied |
| 1-Person Household | 77 (58.8%) | 54 (41.2%) |
| 2-Person Household | 95 (75.4%) | 31 (24.6%) |
| 3-Person Household | 52 (85.3%) | 9 (14.7%) |
| 4+ Person Household | 137 (81.1%) | 32 (18.9%) |
| Total Housing Units | 361 (74.1%) | 126 (25.9%) |
Occupancy by Educational Attainment in Morgantown
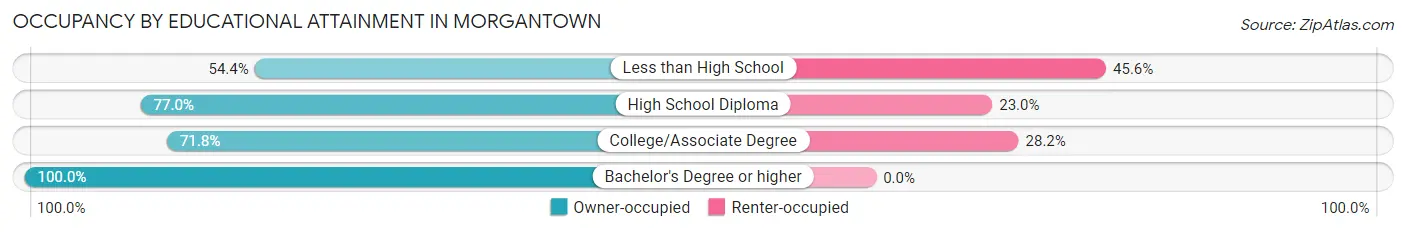
| Household Size | Owner-occupied | Renter-occupied |
| Less than High School | 37 (54.4%) | 31 (45.6%) |
| High School Diploma | 194 (77.0%) | 58 (23.0%) |
| College/Associate Degree | 94 (71.8%) | 37 (28.2%) |
| Bachelor's Degree or higher | 36 (100.0%) | 0 (0.0%) |
Occupancy by Age of Householder in Morgantown
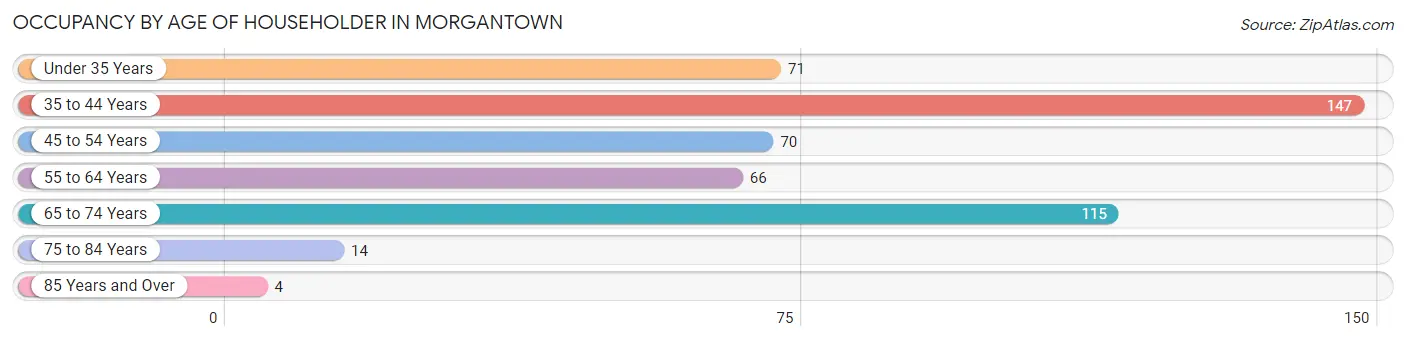
| Age Bracket | # Households | % Households |
| Under 35 Years | 71 | 14.6% |
| 35 to 44 Years | 147 | 30.2% |
| 45 to 54 Years | 70 | 14.4% |
| 55 to 64 Years | 66 | 13.6% |
| 65 to 74 Years | 115 | 23.6% |
| 75 to 84 Years | 14 | 2.9% |
| 85 Years and Over | 4 | 0.8% |
| Total | 487 | 100.0% |
Housing Finances in Morgantown
Median Income by Occupancy in Morgantown
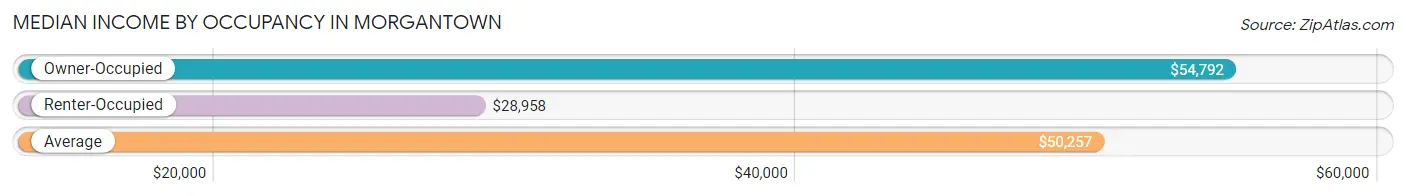
| Occupancy Type | # Households | Median Income |
| Owner-Occupied | 361 (74.1%) | $54,792 |
| Renter-Occupied | 126 (25.9%) | $28,958 |
| Average | 487 (100.0%) | $50,257 |
Occupancy by Householder Income Bracket in Morgantown
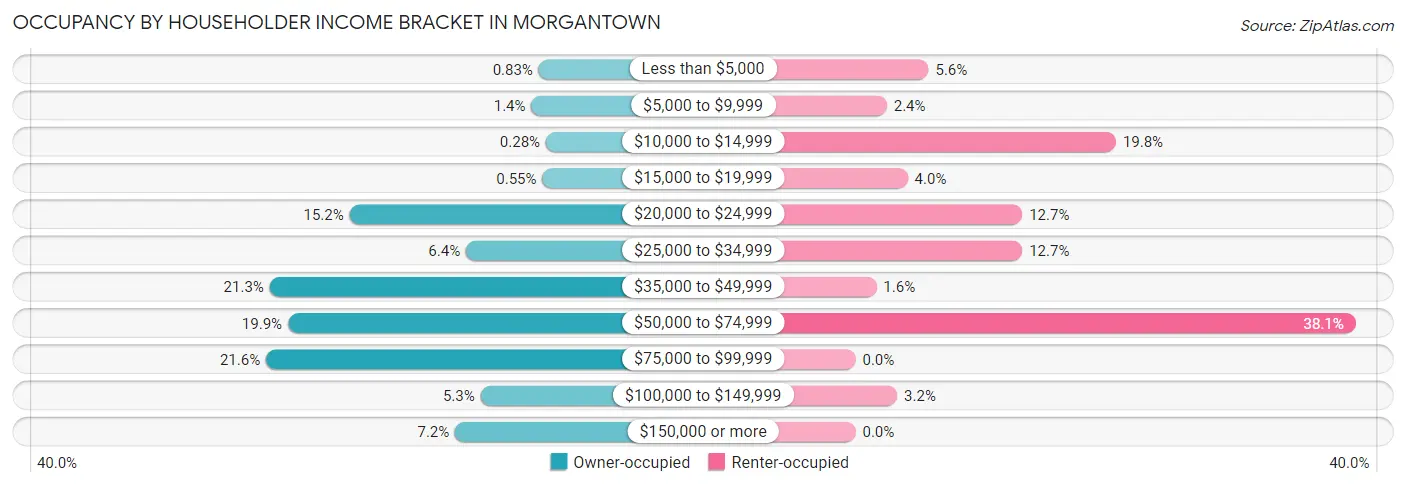
| Income Bracket | Owner-occupied | Renter-occupied |
| Less than $5,000 | 3 (0.8%) | 7 (5.6%) |
| $5,000 to $9,999 | 5 (1.4%) | 3 (2.4%) |
| $10,000 to $14,999 | 1 (0.3%) | 25 (19.8%) |
| $15,000 to $19,999 | 2 (0.5%) | 5 (4.0%) |
| $20,000 to $24,999 | 55 (15.2%) | 16 (12.7%) |
| $25,000 to $34,999 | 23 (6.4%) | 16 (12.7%) |
| $35,000 to $49,999 | 77 (21.3%) | 2 (1.6%) |
| $50,000 to $74,999 | 72 (19.9%) | 48 (38.1%) |
| $75,000 to $99,999 | 78 (21.6%) | 0 (0.0%) |
| $100,000 to $149,999 | 19 (5.3%) | 4 (3.2%) |
| $150,000 or more | 26 (7.2%) | 0 (0.0%) |
| Total | 361 (100.0%) | 126 (100.0%) |
Monthly Housing Cost Tiers in Morgantown
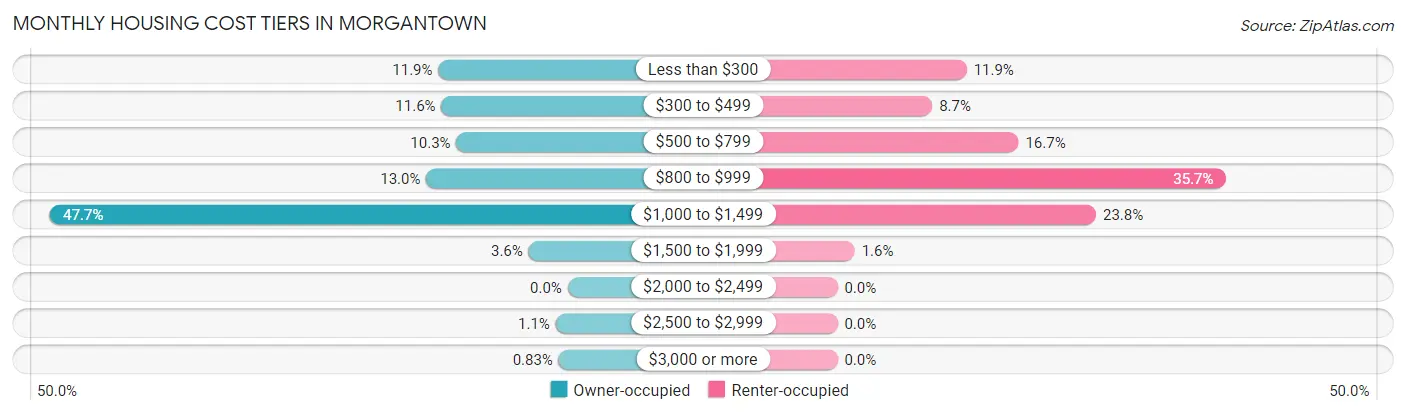
| Monthly Cost | Owner-occupied | Renter-occupied |
| Less than $300 | 43 (11.9%) | 15 (11.9%) |
| $300 to $499 | 42 (11.6%) | 11 (8.7%) |
| $500 to $799 | 37 (10.2%) | 21 (16.7%) |
| $800 to $999 | 47 (13.0%) | 45 (35.7%) |
| $1,000 to $1,499 | 172 (47.6%) | 30 (23.8%) |
| $1,500 to $1,999 | 13 (3.6%) | 2 (1.6%) |
| $2,000 to $2,499 | 0 (0.0%) | 0 (0.0%) |
| $2,500 to $2,999 | 4 (1.1%) | 0 (0.0%) |
| $3,000 or more | 3 (0.8%) | 0 (0.0%) |
| Total | 361 (100.0%) | 126 (100.0%) |
Physical Housing Characteristics in Morgantown
Housing Structures in Morgantown
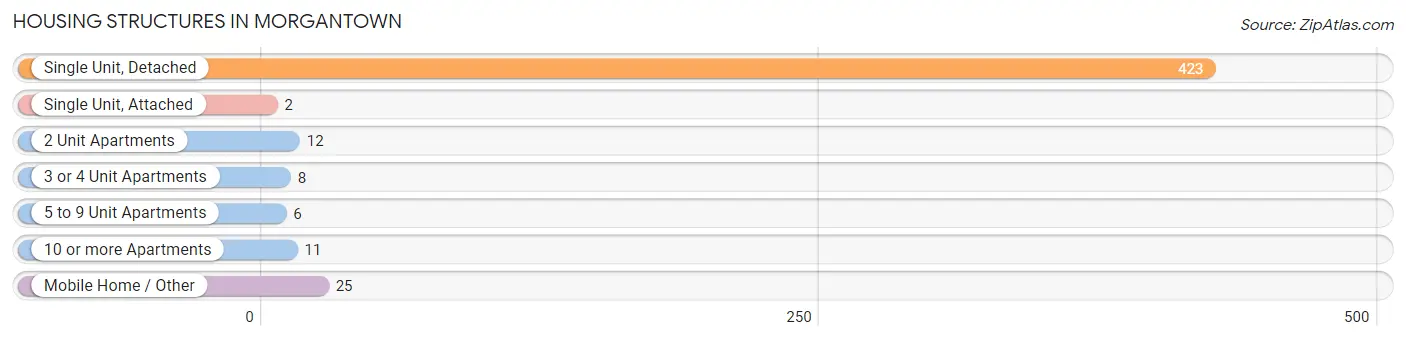
| Structure Type | # Housing Units | % Housing Units |
| Single Unit, Detached | 423 | 86.9% |
| Single Unit, Attached | 2 | 0.4% |
| 2 Unit Apartments | 12 | 2.5% |
| 3 or 4 Unit Apartments | 8 | 1.6% |
| 5 to 9 Unit Apartments | 6 | 1.2% |
| 10 or more Apartments | 11 | 2.3% |
| Mobile Home / Other | 25 | 5.1% |
| Total | 487 | 100.0% |
Housing Structures by Occupancy in Morgantown
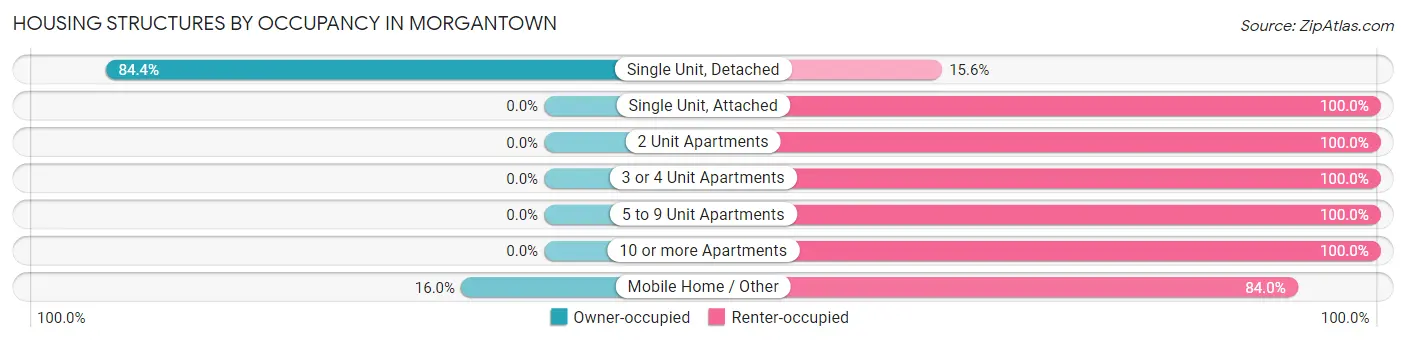
| Structure Type | Owner-occupied | Renter-occupied |
| Single Unit, Detached | 357 (84.4%) | 66 (15.6%) |
| Single Unit, Attached | 0 (0.0%) | 2 (100.0%) |
| 2 Unit Apartments | 0 (0.0%) | 12 (100.0%) |
| 3 or 4 Unit Apartments | 0 (0.0%) | 8 (100.0%) |
| 5 to 9 Unit Apartments | 0 (0.0%) | 6 (100.0%) |
| 10 or more Apartments | 0 (0.0%) | 11 (100.0%) |
| Mobile Home / Other | 4 (16.0%) | 21 (84.0%) |
| Total | 361 (74.1%) | 126 (25.9%) |
Housing Structures by Number of Rooms in Morgantown
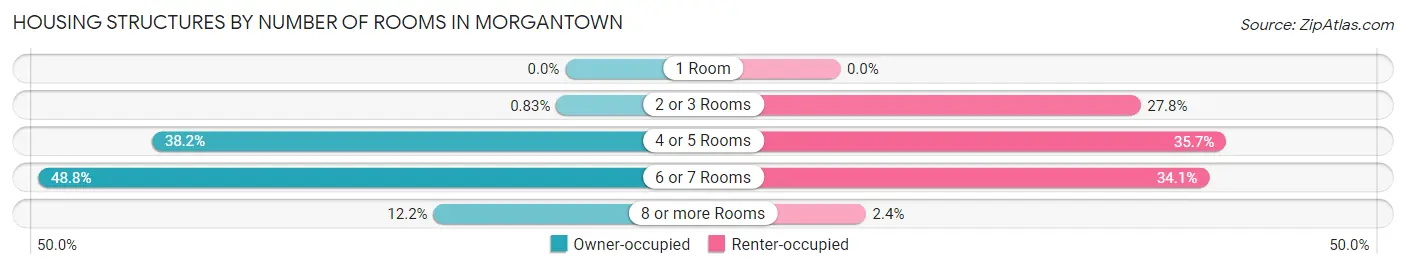
| Number of Rooms | Owner-occupied | Renter-occupied |
| 1 Room | 0 (0.0%) | 0 (0.0%) |
| 2 or 3 Rooms | 3 (0.8%) | 35 (27.8%) |
| 4 or 5 Rooms | 138 (38.2%) | 45 (35.7%) |
| 6 or 7 Rooms | 176 (48.7%) | 43 (34.1%) |
| 8 or more Rooms | 44 (12.2%) | 3 (2.4%) |
| Total | 361 (100.0%) | 126 (100.0%) |
Housing Structure by Heating Type in Morgantown
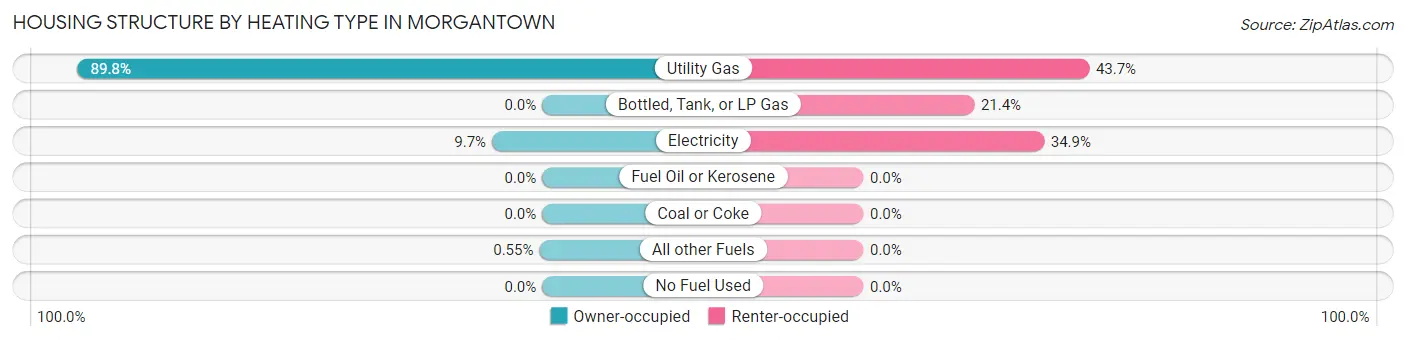
| Heating Type | Owner-occupied | Renter-occupied |
| Utility Gas | 324 (89.7%) | 55 (43.6%) |
| Bottled, Tank, or LP Gas | 0 (0.0%) | 27 (21.4%) |
| Electricity | 35 (9.7%) | 44 (34.9%) |
| Fuel Oil or Kerosene | 0 (0.0%) | 0 (0.0%) |
| Coal or Coke | 0 (0.0%) | 0 (0.0%) |
| All other Fuels | 2 (0.5%) | 0 (0.0%) |
| No Fuel Used | 0 (0.0%) | 0 (0.0%) |
| Total | 361 (100.0%) | 126 (100.0%) |
Household Vehicle Usage in Morgantown
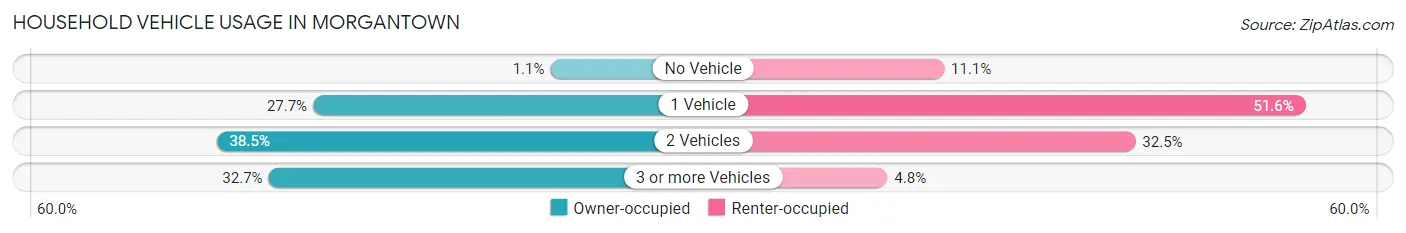
| Vehicles per Household | Owner-occupied | Renter-occupied |
| No Vehicle | 4 (1.1%) | 14 (11.1%) |
| 1 Vehicle | 100 (27.7%) | 65 (51.6%) |
| 2 Vehicles | 139 (38.5%) | 41 (32.5%) |
| 3 or more Vehicles | 118 (32.7%) | 6 (4.8%) |
| Total | 361 (100.0%) | 126 (100.0%) |
Real Estate & Mortgages in Morgantown
Real Estate and Mortgage Overview in Morgantown
| Characteristic | Without Mortgage | With Mortgage |
| Housing Units | 106 | 255 |
| Median Property Value | $109,800 | $126,800 |
| Median Household Income | - | - |
| Monthly Housing Costs | $345 | $3 |
| Real Estate Taxes | $820 | $0 |
Property Value by Mortgage Status in Morgantown
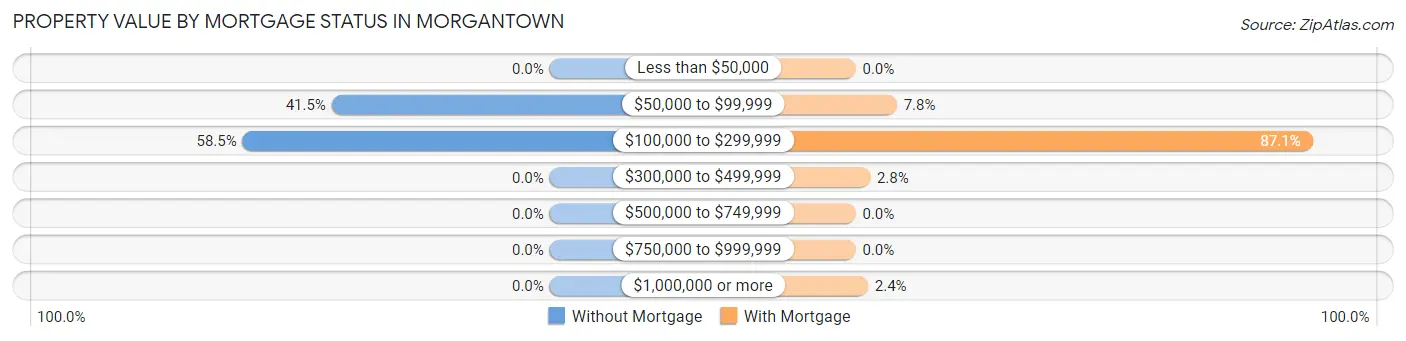
| Property Value | Without Mortgage | With Mortgage |
| Less than $50,000 | 0 (0.0%) | 0 (0.0%) |
| $50,000 to $99,999 | 44 (41.5%) | 20 (7.8%) |
| $100,000 to $299,999 | 62 (58.5%) | 222 (87.1%) |
| $300,000 to $499,999 | 0 (0.0%) | 7 (2.8%) |
| $500,000 to $749,999 | 0 (0.0%) | 0 (0.0%) |
| $750,000 to $999,999 | 0 (0.0%) | 0 (0.0%) |
| $1,000,000 or more | 0 (0.0%) | 6 (2.4%) |
| Total | 106 (100.0%) | 255 (100.0%) |
Household Income by Mortgage Status in Morgantown
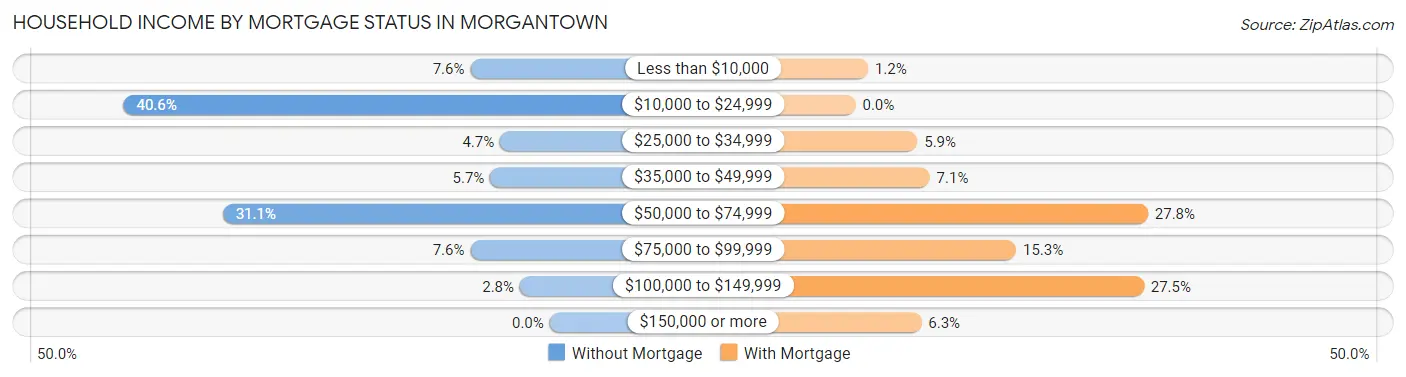
| Household Income | Without Mortgage | With Mortgage |
| Less than $10,000 | 8 (7.5%) | 3 (1.2%) |
| $10,000 to $24,999 | 43 (40.6%) | 0 (0.0%) |
| $25,000 to $34,999 | 5 (4.7%) | 15 (5.9%) |
| $35,000 to $49,999 | 6 (5.7%) | 18 (7.1%) |
| $50,000 to $74,999 | 33 (31.1%) | 71 (27.8%) |
| $75,000 to $99,999 | 8 (7.5%) | 39 (15.3%) |
| $100,000 to $149,999 | 3 (2.8%) | 70 (27.5%) |
| $150,000 or more | 0 (0.0%) | 16 (6.3%) |
| Total | 106 (100.0%) | 255 (100.0%) |
Property Value to Household Income Ratio in Morgantown
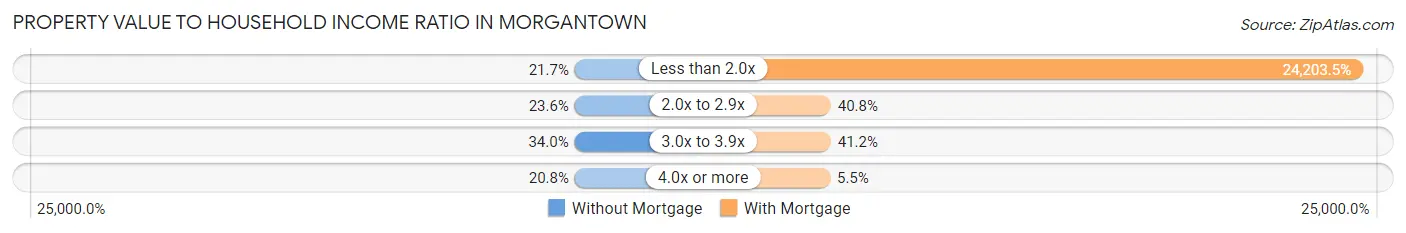
| Value-to-Income Ratio | Without Mortgage | With Mortgage |
| Less than 2.0x | 23 (21.7%) | 61,719 (24,203.5%) |
| 2.0x to 2.9x | 25 (23.6%) | 104 (40.8%) |
| 3.0x to 3.9x | 36 (34.0%) | 105 (41.2%) |
| 4.0x or more | 22 (20.7%) | 14 (5.5%) |
| Total | 106 (100.0%) | 255 (100.0%) |
Real Estate Taxes by Mortgage Status in Morgantown
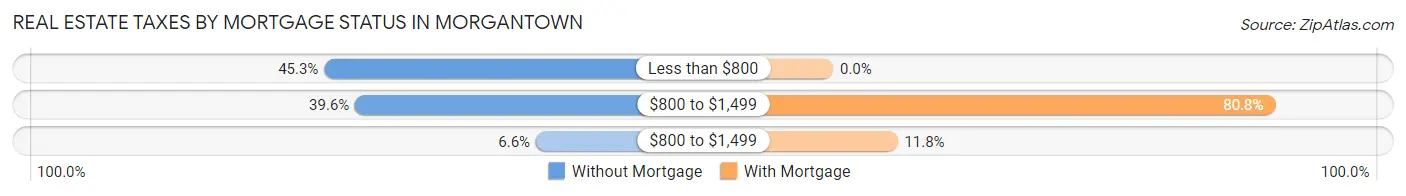
| Property Taxes | Without Mortgage | With Mortgage |
| Less than $800 | 48 (45.3%) | 0 (0.0%) |
| $800 to $1,499 | 42 (39.6%) | 206 (80.8%) |
| $800 to $1,499 | 7 (6.6%) | 30 (11.8%) |
| Total | 106 (100.0%) | 255 (100.0%) |
Health & Disability in Morgantown
Health Insurance Coverage by Age in Morgantown
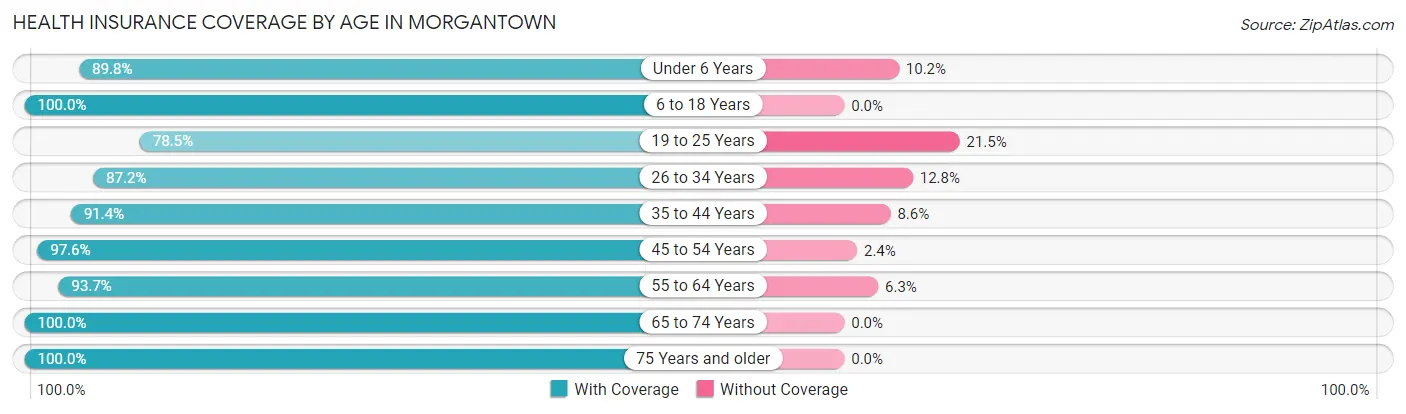
| Age Bracket | With Coverage | Without Coverage |
| Under 6 Years | 53 (89.8%) | 6 (10.2%) |
| 6 to 18 Years | 328 (100.0%) | 0 (0.0%) |
| 19 to 25 Years | 95 (78.5%) | 26 (21.5%) |
| 26 to 34 Years | 116 (87.2%) | 17 (12.8%) |
| 35 to 44 Years | 191 (91.4%) | 18 (8.6%) |
| 45 to 54 Years | 123 (97.6%) | 3 (2.4%) |
| 55 to 64 Years | 104 (93.7%) | 7 (6.3%) |
| 65 to 74 Years | 135 (100.0%) | 0 (0.0%) |
| 75 Years and older | 28 (100.0%) | 0 (0.0%) |
| Total | 1,173 (93.8%) | 77 (6.2%) |
Health Insurance Coverage by Citizenship Status in Morgantown
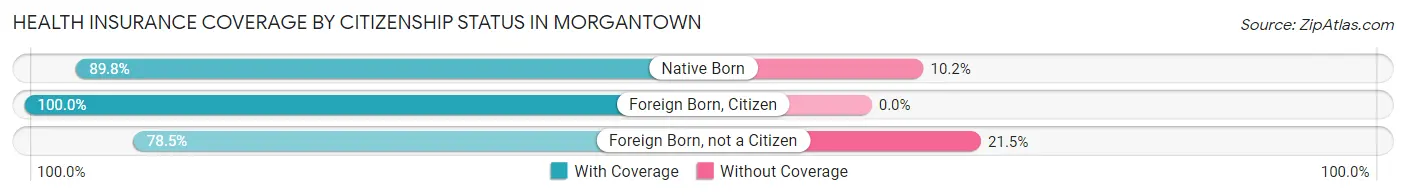
| Citizenship Status | With Coverage | Without Coverage |
| Native Born | 53 (89.8%) | 6 (10.2%) |
| Foreign Born, Citizen | 328 (100.0%) | 0 (0.0%) |
| Foreign Born, not a Citizen | 95 (78.5%) | 26 (21.5%) |
Health Insurance Coverage by Household Income in Morgantown
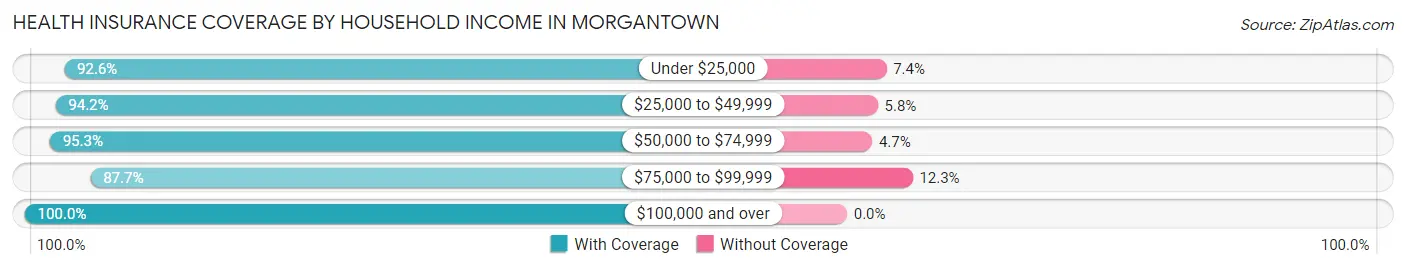
| Household Income | With Coverage | Without Coverage |
| Under $25,000 | 138 (92.6%) | 11 (7.4%) |
| $25,000 to $49,999 | 294 (94.2%) | 18 (5.8%) |
| $50,000 to $74,999 | 363 (95.3%) | 18 (4.7%) |
| $75,000 to $99,999 | 214 (87.7%) | 30 (12.3%) |
| $100,000 and over | 164 (100.0%) | 0 (0.0%) |
Public vs Private Health Insurance Coverage by Age in Morgantown
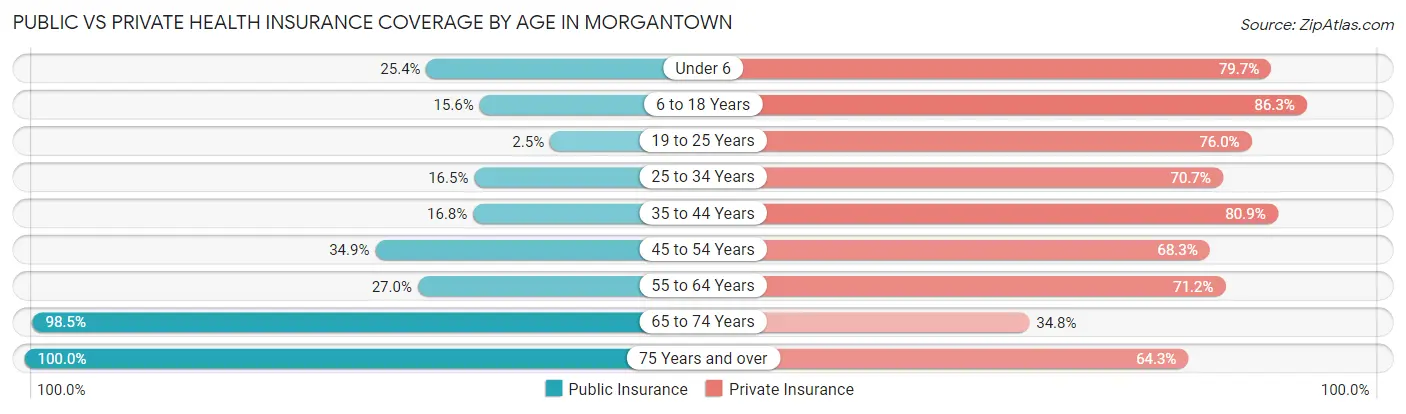
| Age Bracket | Public Insurance | Private Insurance |
| Under 6 | 15 (25.4%) | 47 (79.7%) |
| 6 to 18 Years | 51 (15.5%) | 283 (86.3%) |
| 19 to 25 Years | 3 (2.5%) | 92 (76.0%) |
| 25 to 34 Years | 22 (16.5%) | 94 (70.7%) |
| 35 to 44 Years | 35 (16.8%) | 169 (80.9%) |
| 45 to 54 Years | 44 (34.9%) | 86 (68.2%) |
| 55 to 64 Years | 30 (27.0%) | 79 (71.2%) |
| 65 to 74 Years | 133 (98.5%) | 47 (34.8%) |
| 75 Years and over | 28 (100.0%) | 18 (64.3%) |
| Total | 361 (28.9%) | 915 (73.2%) |
Disability Status by Sex by Age in Morgantown
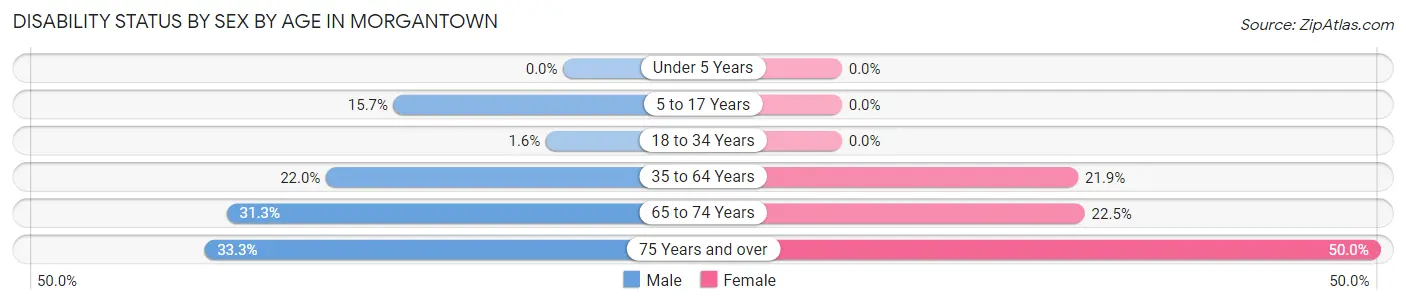
| Age Bracket | Male | Female |
| Under 5 Years | 0 (0.0%) | 0 (0.0%) |
| 5 to 17 Years | 14 (15.7%) | 0 (0.0%) |
| 18 to 34 Years | 2 (1.6%) | 0 (0.0%) |
| 35 to 64 Years | 57 (22.0%) | 41 (21.9%) |
| 65 to 74 Years | 20 (31.2%) | 16 (22.5%) |
| 75 Years and over | 4 (33.3%) | 8 (50.0%) |
Disability Class by Sex by Age in Morgantown
Disability Class: Hearing Difficulty
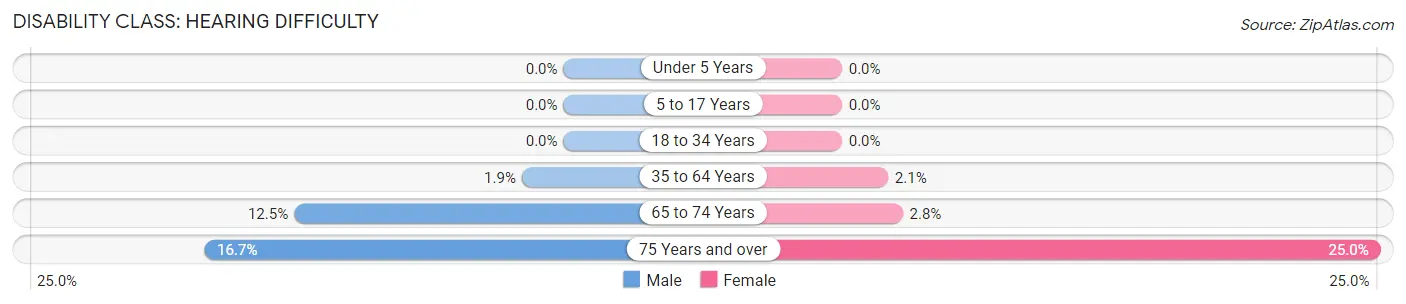
| Age Bracket | Male | Female |
| Under 5 Years | 0 (0.0%) | 0 (0.0%) |
| 5 to 17 Years | 0 (0.0%) | 0 (0.0%) |
| 18 to 34 Years | 0 (0.0%) | 0 (0.0%) |
| 35 to 64 Years | 5 (1.9%) | 4 (2.1%) |
| 65 to 74 Years | 8 (12.5%) | 2 (2.8%) |
| 75 Years and over | 2 (16.7%) | 4 (25.0%) |
Disability Class: Vision Difficulty
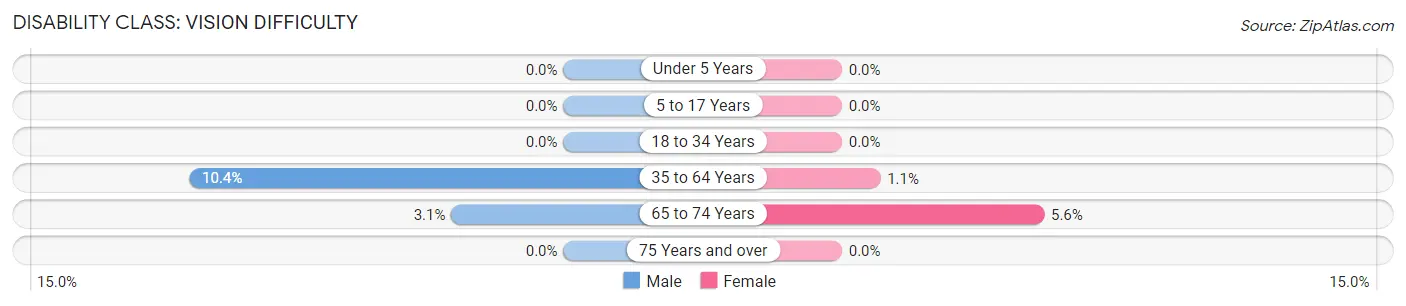
| Age Bracket | Male | Female |
| Under 5 Years | 0 (0.0%) | 0 (0.0%) |
| 5 to 17 Years | 0 (0.0%) | 0 (0.0%) |
| 18 to 34 Years | 0 (0.0%) | 0 (0.0%) |
| 35 to 64 Years | 27 (10.4%) | 2 (1.1%) |
| 65 to 74 Years | 2 (3.1%) | 4 (5.6%) |
| 75 Years and over | 0 (0.0%) | 0 (0.0%) |
Disability Class: Cognitive Difficulty
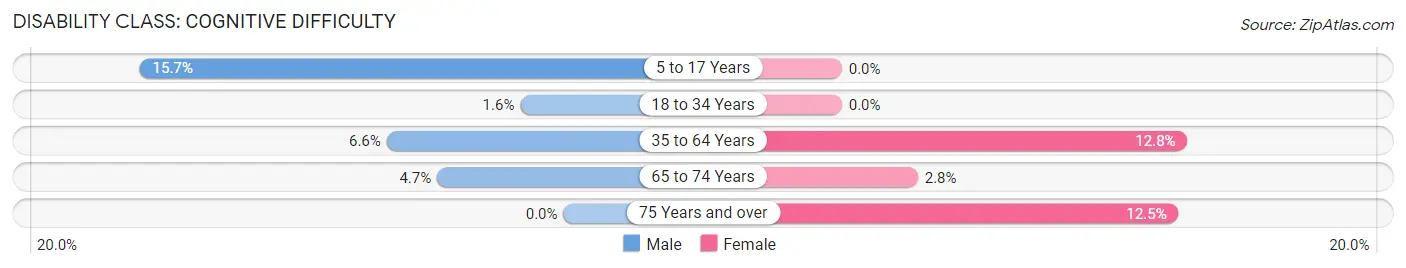
| Age Bracket | Male | Female |
| 5 to 17 Years | 14 (15.7%) | 0 (0.0%) |
| 18 to 34 Years | 2 (1.6%) | 0 (0.0%) |
| 35 to 64 Years | 17 (6.6%) | 24 (12.8%) |
| 65 to 74 Years | 3 (4.7%) | 2 (2.8%) |
| 75 Years and over | 0 (0.0%) | 2 (12.5%) |
Disability Class: Ambulatory Difficulty
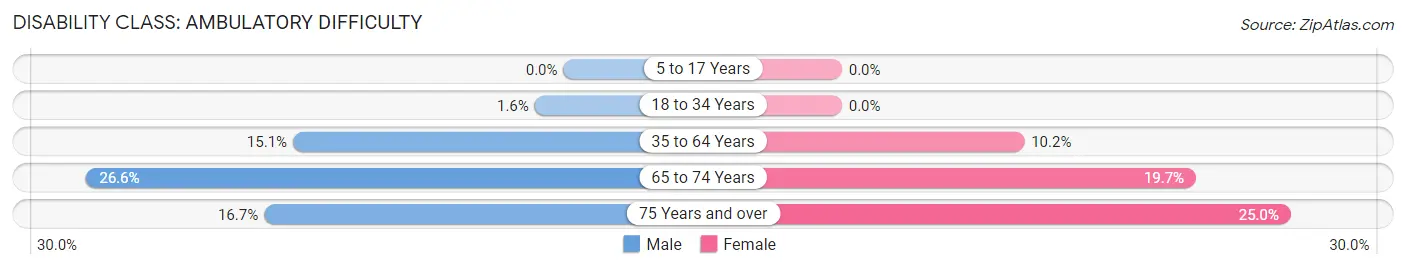
| Age Bracket | Male | Female |
| 5 to 17 Years | 0 (0.0%) | 0 (0.0%) |
| 18 to 34 Years | 2 (1.6%) | 0 (0.0%) |
| 35 to 64 Years | 39 (15.1%) | 19 (10.2%) |
| 65 to 74 Years | 17 (26.6%) | 14 (19.7%) |
| 75 Years and over | 2 (16.7%) | 4 (25.0%) |
Disability Class: Self-Care Difficulty
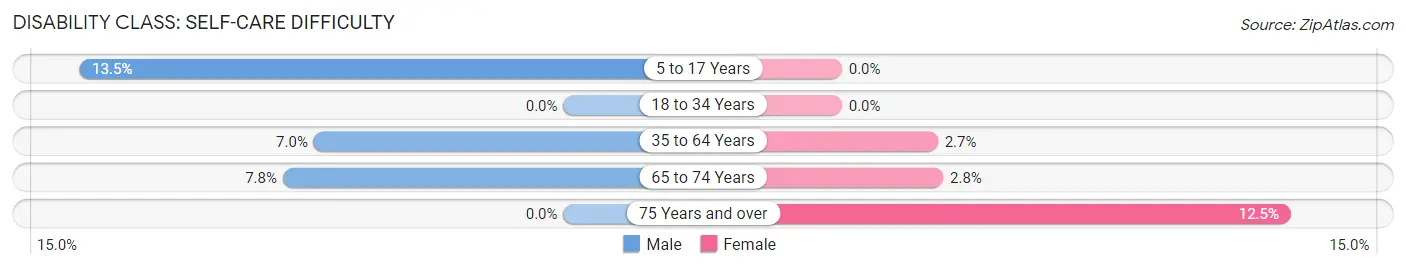
| Age Bracket | Male | Female |
| 5 to 17 Years | 12 (13.5%) | 0 (0.0%) |
| 18 to 34 Years | 0 (0.0%) | 0 (0.0%) |
| 35 to 64 Years | 18 (7.0%) | 5 (2.7%) |
| 65 to 74 Years | 5 (7.8%) | 2 (2.8%) |
| 75 Years and over | 0 (0.0%) | 2 (12.5%) |
Technology Access in Morgantown
Computing Device Access in Morgantown
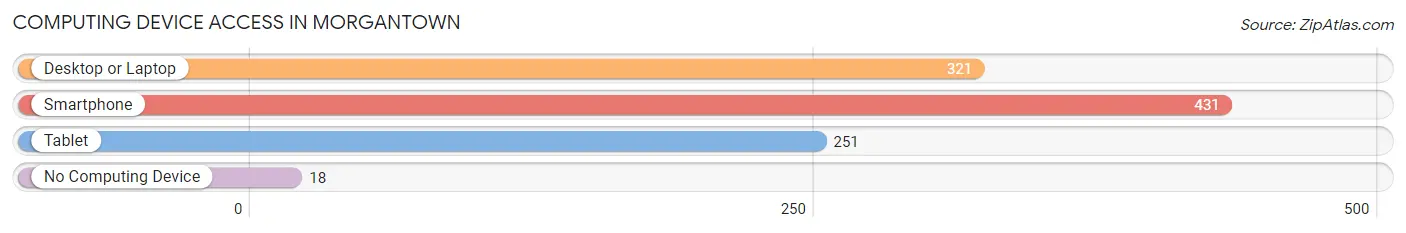
| Device Type | # Households | % Households |
| Desktop or Laptop | 321 | 65.9% |
| Smartphone | 431 | 88.5% |
| Tablet | 251 | 51.5% |
| No Computing Device | 18 | 3.7% |
| Total | 487 | 100.0% |
Internet Access in Morgantown
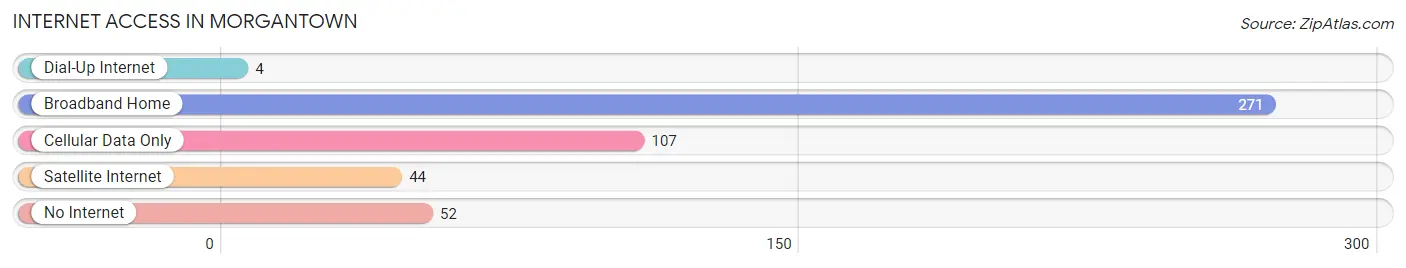
| Internet Type | # Households | % Households |
| Dial-Up Internet | 4 | 0.8% |
| Broadband Home | 271 | 55.6% |
| Cellular Data Only | 107 | 22.0% |
| Satellite Internet | 44 | 9.0% |
| No Internet | 52 | 10.7% |
| Total | 487 | 100.0% |
Morgantown Summary
Morgantown is a small town located in the southeastern part of Indiana, in the United States. It is situated in the county of Morgan, and is part of the Indianapolis metropolitan area. The town has a population of approximately 1,500 people, and is located about 25 miles south of Indianapolis.
History
Morgantown was founded in 1818 by William Morgan, a Revolutionary War veteran. He named the town after himself, and it was incorporated in 1837. The town was originally a farming community, and it was known for its production of corn, wheat, and other grains. In the late 19th century, the town began to grow and develop, and it became a center for manufacturing and industry. The town was home to several factories, including a furniture factory, a canning factory, and a brickyard.
In the early 20th century, the town experienced a period of growth and prosperity. The population increased, and the town was home to several businesses, including a bank, a hotel, and a movie theater. The town also had a railroad station, which connected it to other towns in the area.
Geography
Morgantown is located in the southeastern part of Indiana, in the county of Morgan. It is situated about 25 miles south of Indianapolis, and is part of the Indianapolis metropolitan area. The town is located in a rural area, and is surrounded by farmland and woodlands. The town is situated on the banks of the White River, and is home to several parks and recreational areas.
Economy
Morgantown’s economy is largely based on agriculture and manufacturing. The town is home to several factories, including a furniture factory, a canning factory, and a brickyard. The town is also home to several businesses, including a bank, a hotel, and a movie theater. The town is also home to several small businesses, including restaurants, shops, and other services.
Demographics
Morgantown has a population of approximately 1,500 people. The town is predominantly white, with about 95% of the population being white. The town also has a small Hispanic population, with about 4% of the population being Hispanic. The town also has a small African American population, with about 1% of the population being African American. The median household income in the town is about $45,000, and the median home value is about $100,000. The town has a low unemployment rate, and the poverty rate is about 8%.
Common Questions
What is Per Capita Income in Morgantown?
Per Capita income in Morgantown is $22,369.
What is the Median Family Income in Morgantown?
Median Family Income in Morgantown is $53,542.
What is the Median Household income in Morgantown?
Median Household Income in Morgantown is $50,257.
What is Income or Wage Gap in Morgantown?
Income or Wage Gap in Morgantown is 28.8%.
Women in Morgantown earn 71.2 cents for every dollar earned by a man.
What is Family Income Deficit in Morgantown?
Family Income Deficit in Morgantown is $13,722.
Families that are below poverty line in Morgantown earn $13,722 less on average than the poverty threshold level.
What is Inequality or Gini Index in Morgantown?
Inequality or Gini Index in Morgantown is 0.41.
What is the Total Population of Morgantown?
Total Population of Morgantown is 1,293.
What is the Total Male Population of Morgantown?
Total Male Population of Morgantown is 577.
What is the Total Female Population of Morgantown?
Total Female Population of Morgantown is 716.
What is the Ratio of Males per 100 Females in Morgantown?
There are 80.59 Males per 100 Females in Morgantown.
What is the Ratio of Females per 100 Males in Morgantown?
There are 124.09 Females per 100 Males in Morgantown.
What is the Median Population Age in Morgantown?
Median Population Age in Morgantown is 36.0 Years.
What is the Average Family Size in Morgantown
Average Family Size in Morgantown is 3.0 People.
What is the Average Household Size in Morgantown
Average Household Size in Morgantown is 2.6 People.
How Large is the Labor Force in Morgantown?
There are 589 People in the Labor Forcein in Morgantown.
What is the Percentage of People in the Labor Force in Morgantown?
62.5% of People are in the Labor Force in Morgantown.
What is the Unemployment Rate in Morgantown?
Unemployment Rate in Morgantown is 19.0%.