Montgomery, IN Map & Demographics
Montgomery Map
Montgomery Overview
$32,766
PER CAPITA INCOME
$89,444
AVG FAMILY INCOME
$81,364
AVG HOUSEHOLD INCOME
22.0%
WAGE / INCOME GAP [ % ]
78.0¢/ $1
WAGE / INCOME GAP [ $ ]
0.38
INEQUALITY / GINI INDEX
1,063
TOTAL POPULATION
574
MALE POPULATION
489
FEMALE POPULATION
117.38
MALES / 100 FEMALES
85.19
FEMALES / 100 MALES
50.5
MEDIAN AGE
3.0
AVG FAMILY SIZE
2.8
AVG HOUSEHOLD SIZE
558
LABOR FORCE [ PEOPLE ]
59.4%
PERCENT IN LABOR FORCE
0.4%
UNEMPLOYMENT RATE
Montgomery Zip Codes
Montgomery Area Codes
Income in Montgomery
Income Overview in Montgomery
Per Capita Income in Montgomery is $32,766, while median incomes of families and households are $89,444 and $81,364 respectively.
| Characteristic | Number | Measure |
| Per Capita Income | 1,063 | $32,766 |
| Median Family Income | 328 | $89,444 |
| Mean Family Income | 328 | $99,437 |
| Median Household Income | 382 | $81,364 |
| Mean Household Income | 382 | $91,517 |
| Income Deficit | 328 | $0 |
| Wage / Income Gap (%) | 1,063 | 21.99% |
| Wage / Income Gap ($) | 1,063 | 78.01¢ per $1 |
| Gini / Inequality Index | 1,063 | 0.38 |
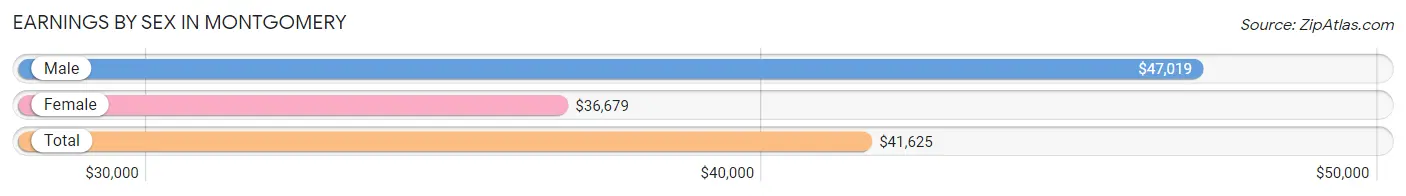
Earnings by Sex in Montgomery
Average Earnings in Montgomery are $41,625, $47,019 for men and $36,679 for women, a difference of 22.0%.
| Sex | Number | Average Earnings |
| Male | 299 (53.0%) | $47,019 |
| Female | 265 (47.0%) | $36,679 |
| Total | 564 (100.0%) | $41,625 |
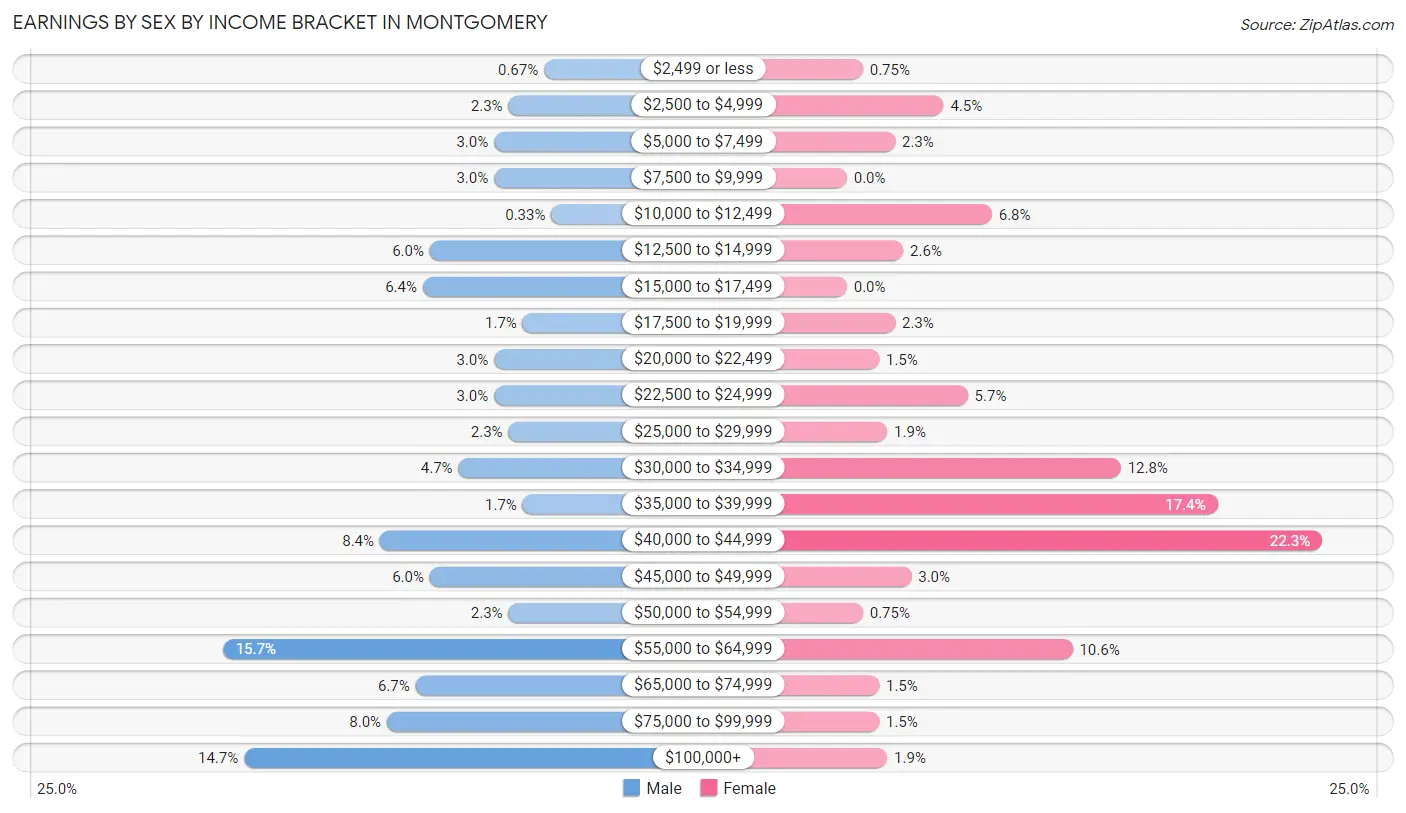
Earnings by Sex by Income Bracket in Montgomery
The most common earnings brackets in Montgomery are $55,000 to $64,999 for men (47 | 15.7%) and $40,000 to $44,999 for women (59 | 22.3%).
| Income | Male | Female |
| $2,499 or less | 2 (0.7%) | 2 (0.7%) |
| $2,500 to $4,999 | 7 (2.3%) | 12 (4.5%) |
| $5,000 to $7,499 | 9 (3.0%) | 6 (2.3%) |
| $7,500 to $9,999 | 9 (3.0%) | 0 (0.0%) |
| $10,000 to $12,499 | 1 (0.3%) | 18 (6.8%) |
| $12,500 to $14,999 | 18 (6.0%) | 7 (2.6%) |
| $15,000 to $17,499 | 19 (6.4%) | 0 (0.0%) |
| $17,500 to $19,999 | 5 (1.7%) | 6 (2.3%) |
| $20,000 to $22,499 | 9 (3.0%) | 4 (1.5%) |
| $22,500 to $24,999 | 9 (3.0%) | 15 (5.7%) |
| $25,000 to $29,999 | 7 (2.3%) | 5 (1.9%) |
| $30,000 to $34,999 | 14 (4.7%) | 34 (12.8%) |
| $35,000 to $39,999 | 5 (1.7%) | 46 (17.4%) |
| $40,000 to $44,999 | 25 (8.4%) | 59 (22.3%) |
| $45,000 to $49,999 | 18 (6.0%) | 8 (3.0%) |
| $50,000 to $54,999 | 7 (2.3%) | 2 (0.7%) |
| $55,000 to $64,999 | 47 (15.7%) | 28 (10.6%) |
| $65,000 to $74,999 | 20 (6.7%) | 4 (1.5%) |
| $75,000 to $99,999 | 24 (8.0%) | 4 (1.5%) |
| $100,000+ | 44 (14.7%) | 5 (1.9%) |
| Total | 299 (100.0%) | 265 (100.0%) |
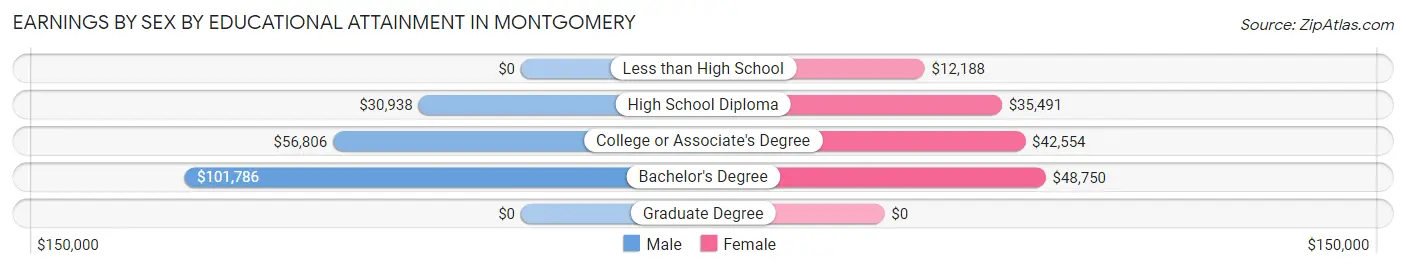
Earnings by Sex by Educational Attainment in Montgomery
Average earnings in Montgomery are $50,000 for men and $37,250 for women, a difference of 25.5%. Men with an educational attainment of bachelor's degree enjoy the highest average annual earnings of $101,786, while those with high school diploma education earn the least with $30,938. Women with an educational attainment of bachelor's degree earn the most with the average annual earnings of $48,750, while those with less than high school education have the smallest earnings of $12,188.
| Educational Attainment | Male Income | Female Income |
| Less than High School | - | - |
| High School Diploma | $30,938 | $35,491 |
| College or Associate's Degree | $56,806 | $42,554 |
| Bachelor's Degree | $101,786 | $48,750 |
| Graduate Degree | - | - |
| Total | $50,000 | $37,250 |
Family Income in Montgomery
Family Income Brackets in Montgomery
According to the Montgomery family income data, there are 76 families falling into the $75,000 to $99,999 income range, which is the most common income bracket and makes up 23.2% of all families.
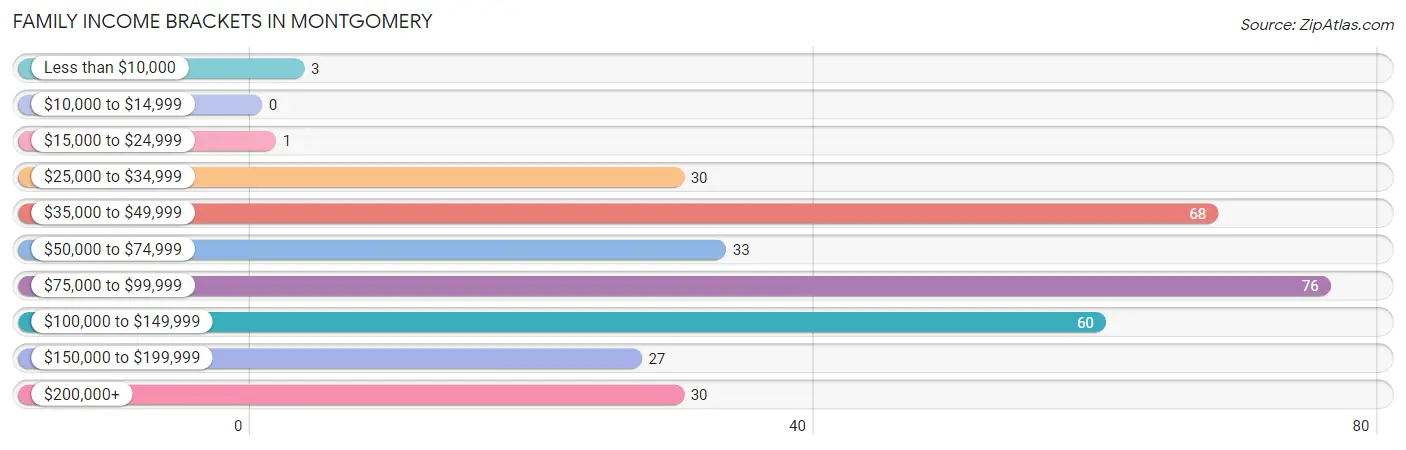
| Income Bracket | # Families | % Families |
| Less than $10,000 | 3 | 0.9% |
| $10,000 to $14,999 | 0 | 0.0% |
| $15,000 to $24,999 | 1 | 0.3% |
| $25,000 to $34,999 | 30 | 9.1% |
| $35,000 to $49,999 | 68 | 20.7% |
| $50,000 to $74,999 | 33 | 10.1% |
| $75,000 to $99,999 | 76 | 23.2% |
| $100,000 to $149,999 | 60 | 18.3% |
| $150,000 to $199,999 | 27 | 8.2% |
| $200,000+ | 30 | 9.1% |
Family Income by Famaliy Size in Montgomery
5-person families (17 | 5.2%) account for the highest median family income in Montgomery with $158,438 per family, while 5-person families (17 | 5.2%) have the highest median income of $31,688 per family member.
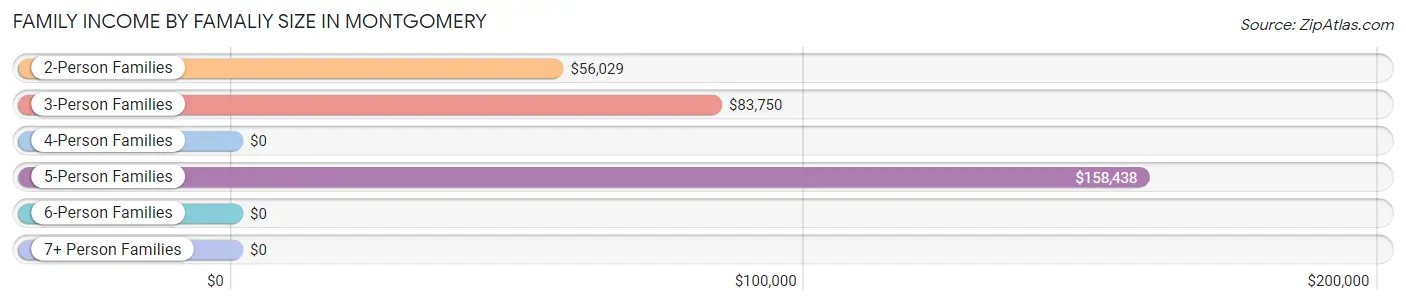
| Income Bracket | # Families | Median Income |
| 2-Person Families | 162 (49.4%) | $56,029 |
| 3-Person Families | 79 (24.1%) | $83,750 |
| 4-Person Families | 64 (19.5%) | $0 |
| 5-Person Families | 17 (5.2%) | $158,438 |
| 6-Person Families | 6 (1.8%) | $0 |
| 7+ Person Families | 0 (0.0%) | $0 |
| Total | 328 (100.0%) | $89,444 |
Family Income by Number of Earners in Montgomery
The median family income in Montgomery is $89,444, with families comprising 3+ earners (36) having the highest median family income of $250,001, while families with no earners (70) have the lowest median family income of $40,870, accounting for 11.0% and 21.3% of families, respectively.
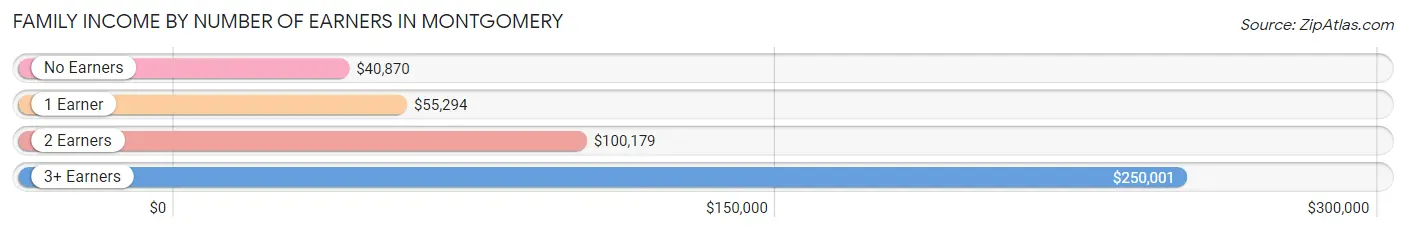
| Number of Earners | # Families | Median Income |
| No Earners | 70 (21.3%) | $40,870 |
| 1 Earner | 72 (22.0%) | $55,294 |
| 2 Earners | 150 (45.7%) | $100,179 |
| 3+ Earners | 36 (11.0%) | $250,001 |
| Total | 328 (100.0%) | $89,444 |
Household Income in Montgomery
Household Income Brackets in Montgomery
With 84 households falling in the category, the $35,000 to $49,999 income range is the most frequent in Montgomery, accounting for 22.0% of all households. In contrast, only 2 households (0.5%) fall into the $10,000 to $14,999 income bracket, making it the least populous group.
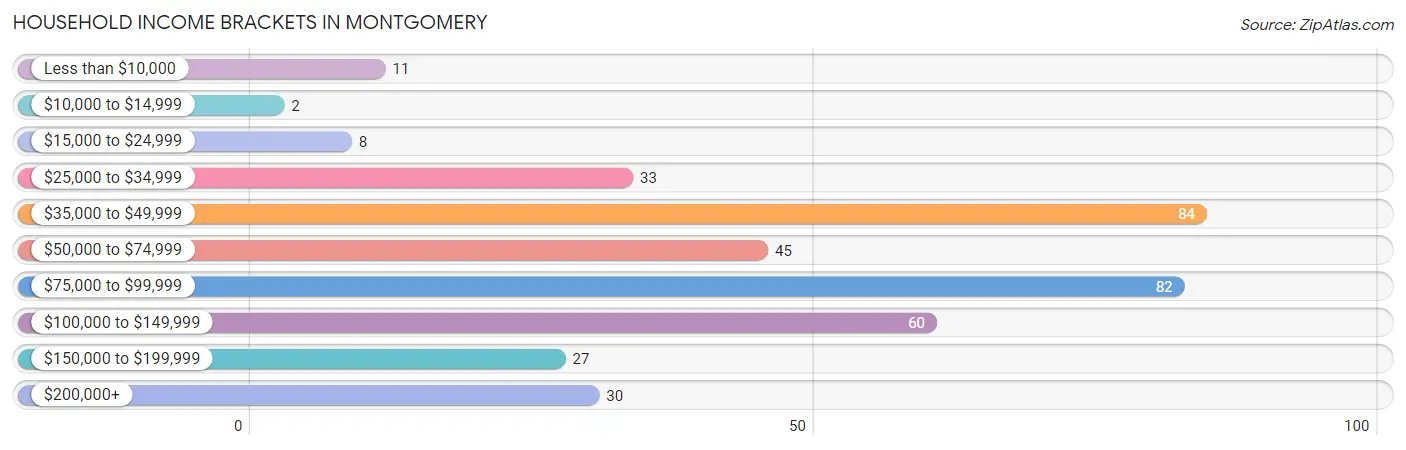
| Income Bracket | # Households | % Households |
| Less than $10,000 | 11 | 2.9% |
| $10,000 to $14,999 | 2 | 0.5% |
| $15,000 to $24,999 | 8 | 2.1% |
| $25,000 to $34,999 | 33 | 8.6% |
| $35,000 to $49,999 | 84 | 22.0% |
| $50,000 to $74,999 | 45 | 11.8% |
| $75,000 to $99,999 | 82 | 21.5% |
| $100,000 to $149,999 | 60 | 15.7% |
| $150,000 to $199,999 | 27 | 7.1% |
| $200,000+ | 30 | 7.9% |
Household Income by Householder Age in Montgomery
The median household income in Montgomery is $81,364, with the highest median household income of $100,000 found in the 25 to 44 years age bracket for the primary householder. A total of 68 households (17.8%) fall into this category. Meanwhile, the 15 to 24 years age bracket for the primary householder has the lowest median household income of $0, with 12 households (3.1%) in this group.
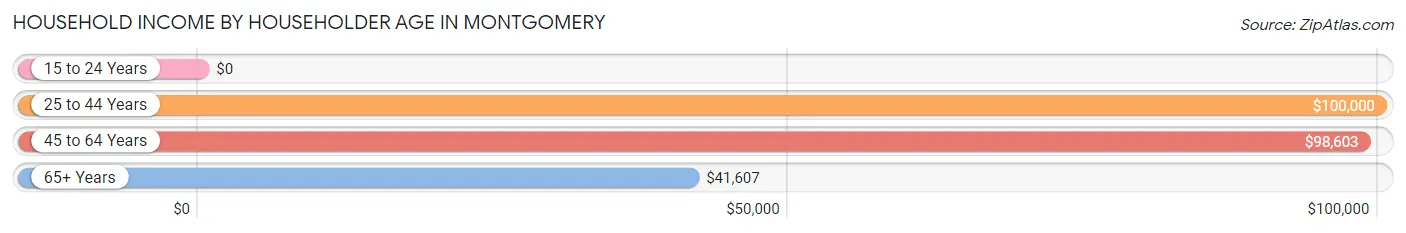
| Income Bracket | # Households | Median Income |
| 15 to 24 Years | 12 (3.1%) | $0 |
| 25 to 44 Years | 68 (17.8%) | $100,000 |
| 45 to 64 Years | 168 (44.0%) | $98,603 |
| 65+ Years | 134 (35.1%) | $41,607 |
| Total | 382 (100.0%) | $81,364 |
Poverty in Montgomery
Income Below Poverty by Sex and Age in Montgomery
With 5.1% poverty level for males and 1.8% for females among the residents of Montgomery, 25 to 34 year old males and 35 to 44 year old females are the most vulnerable to poverty, with 14 males (18.7%) and 3 females (6.0%) in their respective age groups living below the poverty level.
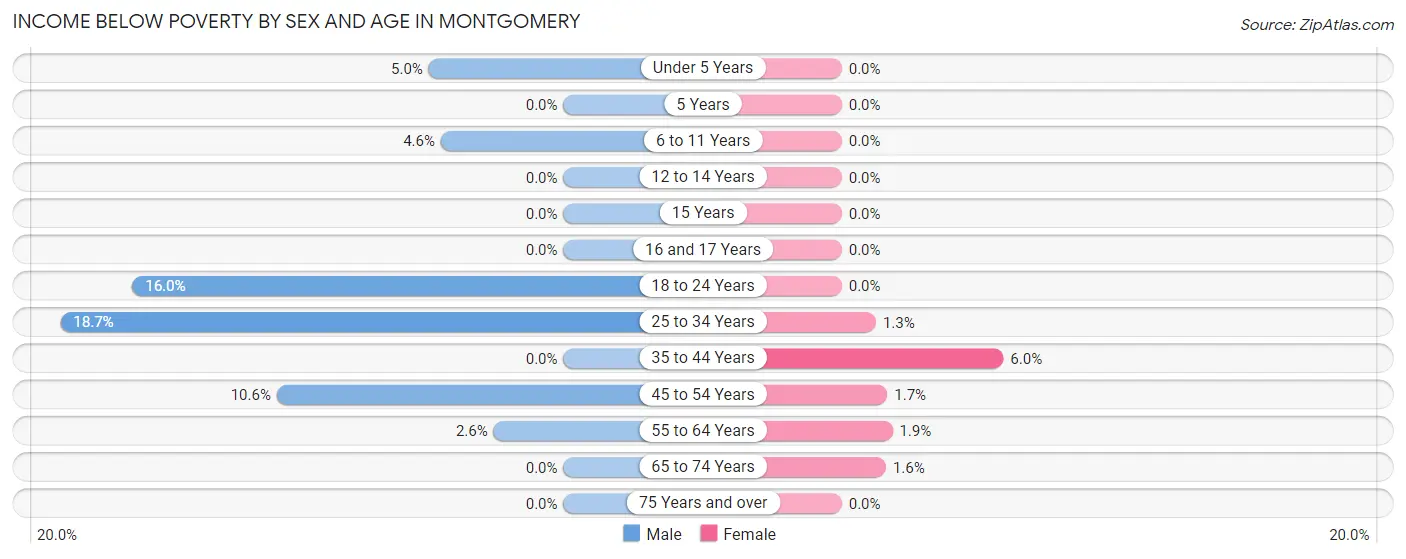
| Age Bracket | Male | Female |
| Under 5 Years | 2 (5.0%) | 0 (0.0%) |
| 5 Years | 0 (0.0%) | 0 (0.0%) |
| 6 to 11 Years | 1 (4.5%) | 0 (0.0%) |
| 12 to 14 Years | 0 (0.0%) | 0 (0.0%) |
| 15 Years | 0 (0.0%) | 0 (0.0%) |
| 16 and 17 Years | 0 (0.0%) | 0 (0.0%) |
| 18 to 24 Years | 4 (16.0%) | 0 (0.0%) |
| 25 to 34 Years | 14 (18.7%) | 1 (1.3%) |
| 35 to 44 Years | 0 (0.0%) | 3 (6.0%) |
| 45 to 54 Years | 5 (10.6%) | 1 (1.7%) |
| 55 to 64 Years | 3 (2.6%) | 3 (1.9%) |
| 65 to 74 Years | 0 (0.0%) | 1 (1.6%) |
| 75 Years and over | 0 (0.0%) | 0 (0.0%) |
| Total | 29 (5.1%) | 9 (1.8%) |
Income Above Poverty by Sex and Age in Montgomery
According to the poverty statistics in Montgomery, males aged 5 years and females aged under 5 years are the age groups that are most secure financially, with 100.0% of males and 100.0% of females in these age groups living above the poverty line.
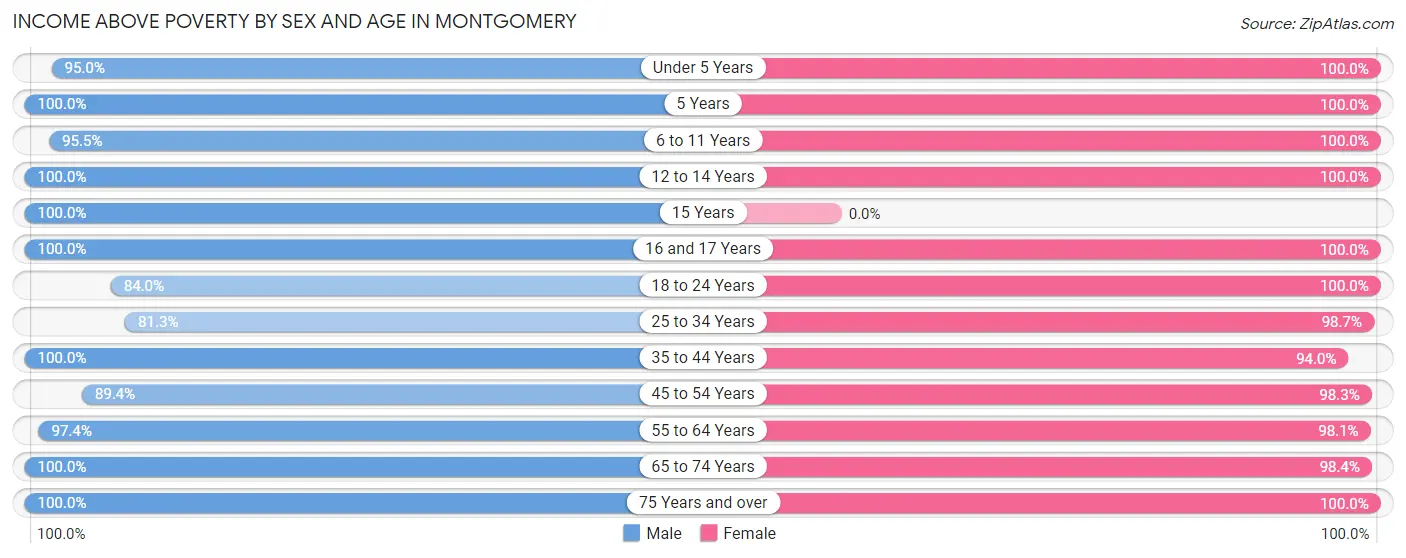
| Age Bracket | Male | Female |
| Under 5 Years | 38 (95.0%) | 3 (100.0%) |
| 5 Years | 1 (100.0%) | 2 (100.0%) |
| 6 to 11 Years | 21 (95.5%) | 26 (100.0%) |
| 12 to 14 Years | 19 (100.0%) | 6 (100.0%) |
| 15 Years | 2 (100.0%) | 0 (0.0%) |
| 16 and 17 Years | 60 (100.0%) | 10 (100.0%) |
| 18 to 24 Years | 21 (84.0%) | 6 (100.0%) |
| 25 to 34 Years | 61 (81.3%) | 78 (98.7%) |
| 35 to 44 Years | 37 (100.0%) | 47 (94.0%) |
| 45 to 54 Years | 42 (89.4%) | 58 (98.3%) |
| 55 to 64 Years | 113 (97.4%) | 157 (98.1%) |
| 65 to 74 Years | 94 (100.0%) | 60 (98.4%) |
| 75 Years and over | 36 (100.0%) | 24 (100.0%) |
| Total | 545 (95.0%) | 477 (98.2%) |
Income Below Poverty Among Married-Couple Families in Montgomery
The poverty statistics for married-couple families in Montgomery show that 0.4% or 1 of the total 284 families live below the poverty line. Families with 1 or 2 children have the highest poverty rate of 1.0%, comprising of 1 families. On the other hand, families with no children have the lowest poverty rate of 0.0%, which includes 0 families.
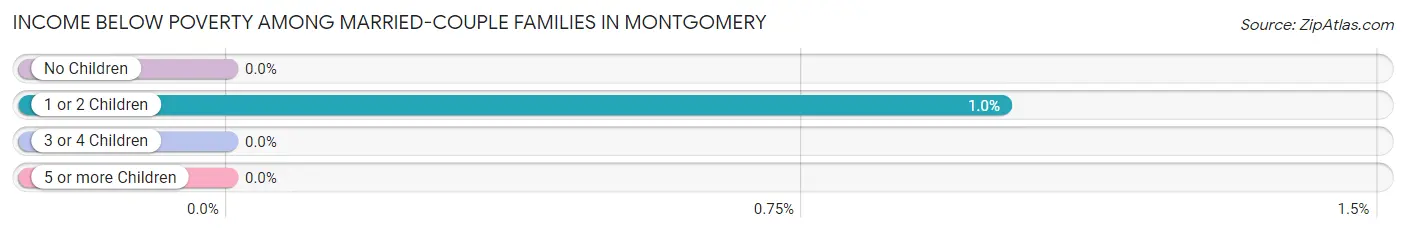
| Children | Above Poverty | Below Poverty |
| No Children | 180 (100.0%) | 0 (0.0%) |
| 1 or 2 Children | 98 (99.0%) | 1 (1.0%) |
| 3 or 4 Children | 5 (100.0%) | 0 (0.0%) |
| 5 or more Children | 0 (0.0%) | 0 (0.0%) |
| Total | 283 (99.7%) | 1 (0.4%) |
Income Below Poverty Among Single-Parent Households in Montgomery
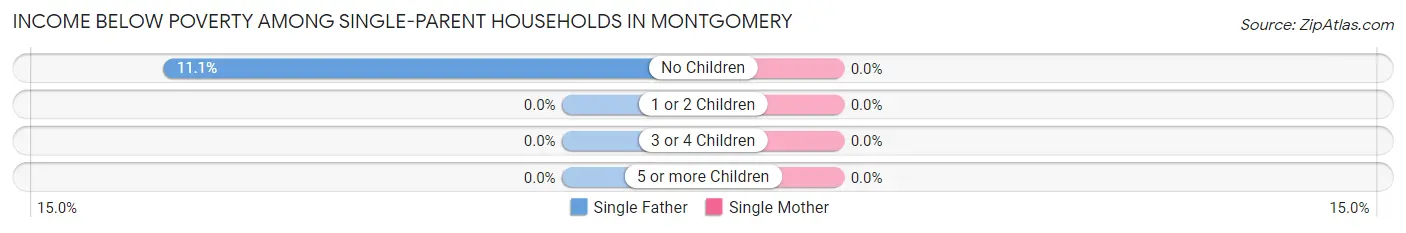
| Children | Single Father | Single Mother |
| No Children | 3 (11.1%) | 0 (0.0%) |
| 1 or 2 Children | 0 (0.0%) | 0 (0.0%) |
| 3 or 4 Children | 0 (0.0%) | 0 (0.0%) |
| 5 or more Children | 0 (0.0%) | 0 (0.0%) |
| Total | 3 (7.5%) | 0 (0.0%) |
Income Below Poverty Among Married-Couple vs Single-Parent Households in Montgomery
The poverty data for Montgomery shows that 1 of the married-couple family households (0.4%) and 3 of the single-parent households (6.8%) are living below the poverty level. Within the married-couple family households, those with 1 or 2 children have the highest poverty rate, with 1 households (1.0%) falling below the poverty line. Among the single-parent households, those with no children have the highest poverty rate, with 3 household (10.0%) living below poverty.
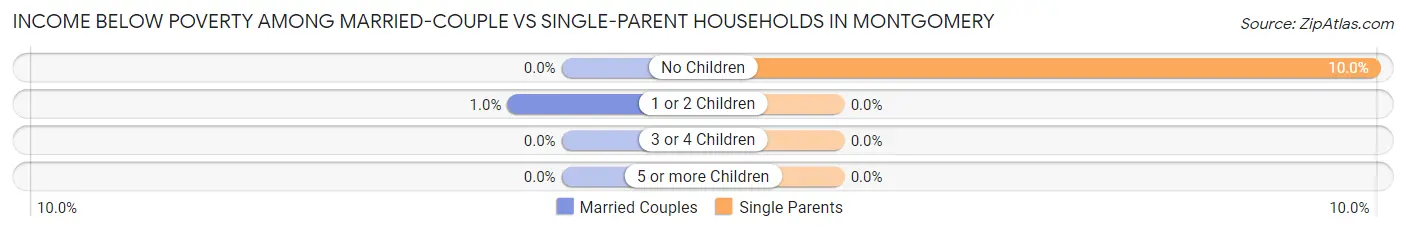
| Children | Married-Couple Families | Single-Parent Households |
| No Children | 0 (0.0%) | 3 (10.0%) |
| 1 or 2 Children | 1 (1.0%) | 0 (0.0%) |
| 3 or 4 Children | 0 (0.0%) | 0 (0.0%) |
| 5 or more Children | 0 (0.0%) | 0 (0.0%) |
| Total | 1 (0.4%) | 3 (6.8%) |
Race in Montgomery
The most populous races in Montgomery are White / Caucasian (1,054 | 99.2%), Native / Alaskan (7 | 0.7%), and Hispanic or Latino (2 | 0.2%).
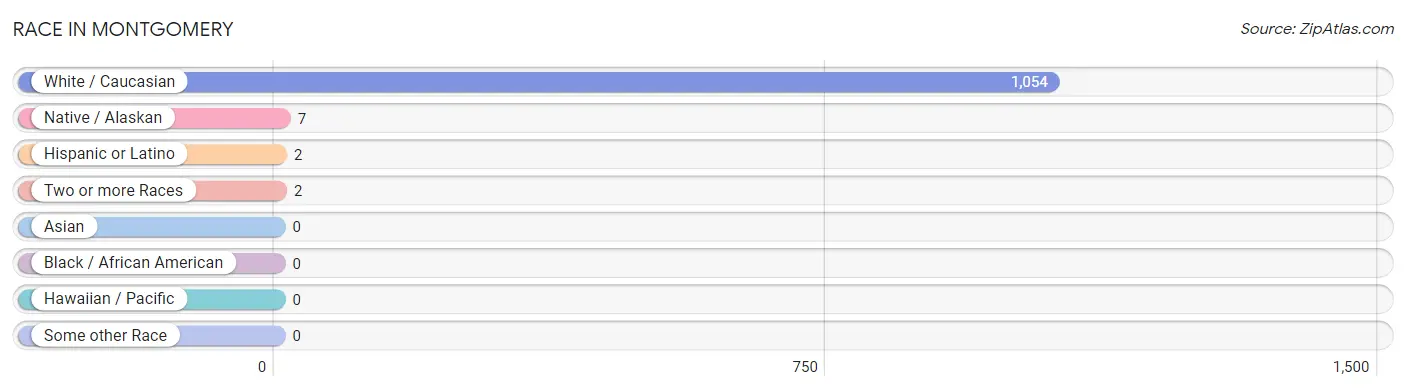
| Race | # Population | % Population |
| Asian | 0 | 0.0% |
| Black / African American | 0 | 0.0% |
| Hawaiian / Pacific | 0 | 0.0% |
| Hispanic or Latino | 2 | 0.2% |
| Native / Alaskan | 7 | 0.7% |
| White / Caucasian | 1,054 | 99.2% |
| Two or more Races | 2 | 0.2% |
| Some other Race | 0 | 0.0% |
| Total | 1,063 | 100.0% |
Ancestry in Montgomery
The most populous ancestries reported in Montgomery are German (329 | 30.9%), Irish (171 | 16.1%), American (71 | 6.7%), English (64 | 6.0%), and Scottish (29 | 2.7%), together accounting for 62.5% of all Montgomery residents.
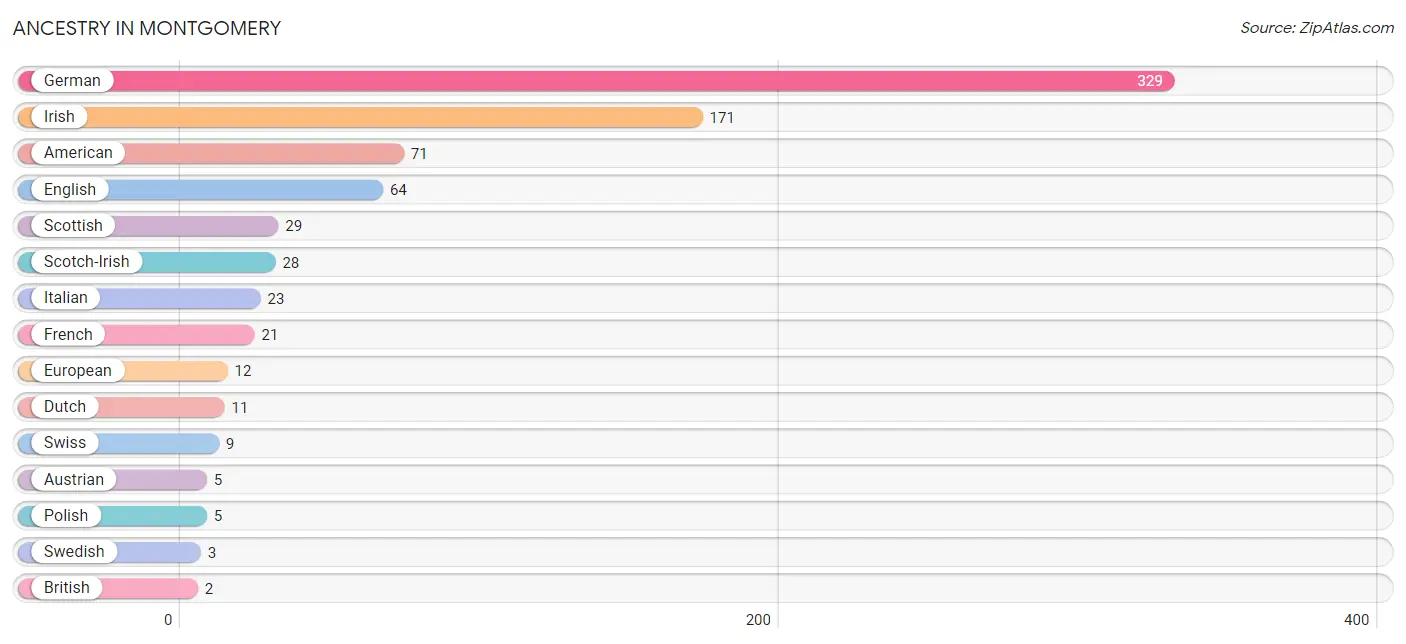
| Ancestry | # Population | % Population |
| American | 71 | 6.7% |
| Austrian | 5 | 0.5% |
| British | 2 | 0.2% |
| Cuban | 2 | 0.2% |
| Dutch | 11 | 1.0% |
| English | 64 | 6.0% |
| European | 12 | 1.1% |
| French | 21 | 2.0% |
| German | 329 | 30.9% |
| Irish | 171 | 16.1% |
| Italian | 23 | 2.2% |
| Polish | 5 | 0.5% |
| Scotch-Irish | 28 | 2.6% |
| Scottish | 29 | 2.7% |
| Swedish | 3 | 0.3% |
| Swiss | 9 | 0.9% | View All 16 Rows |
Immigrants in Montgomery

| Immigration Origin | # Population | % Population | View All 0 Rows |
Sex and Age in Montgomery
Sex and Age in Montgomery
The most populous age groups in Montgomery are 15 to 19 Years (62 | 10.8%) for men and 55 to 59 Years (95 | 19.4%) for women.
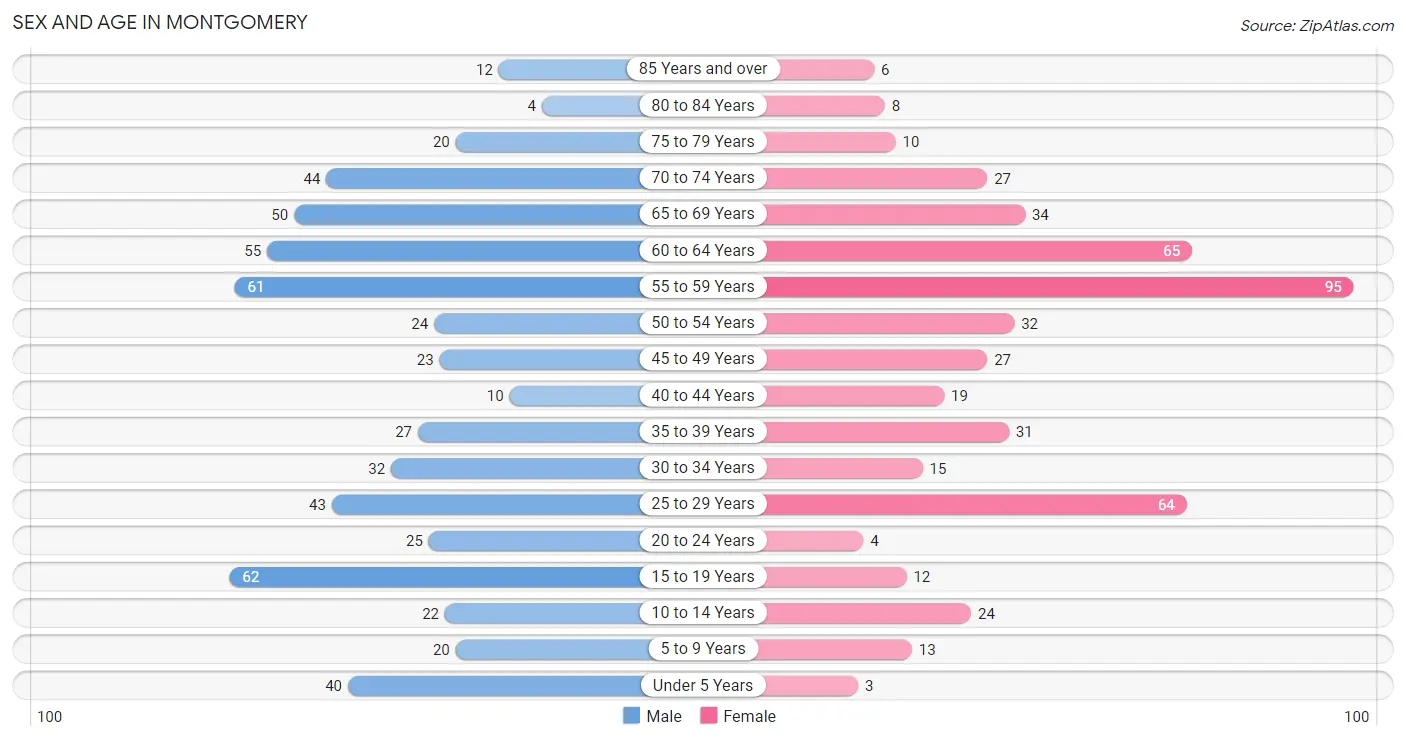
| Age Bracket | Male | Female |
| Under 5 Years | 40 (7.0%) | 3 (0.6%) |
| 5 to 9 Years | 20 (3.5%) | 13 (2.7%) |
| 10 to 14 Years | 22 (3.8%) | 24 (4.9%) |
| 15 to 19 Years | 62 (10.8%) | 12 (2.5%) |
| 20 to 24 Years | 25 (4.4%) | 4 (0.8%) |
| 25 to 29 Years | 43 (7.5%) | 64 (13.1%) |
| 30 to 34 Years | 32 (5.6%) | 15 (3.1%) |
| 35 to 39 Years | 27 (4.7%) | 31 (6.3%) |
| 40 to 44 Years | 10 (1.7%) | 19 (3.9%) |
| 45 to 49 Years | 23 (4.0%) | 27 (5.5%) |
| 50 to 54 Years | 24 (4.2%) | 32 (6.5%) |
| 55 to 59 Years | 61 (10.6%) | 95 (19.4%) |
| 60 to 64 Years | 55 (9.6%) | 65 (13.3%) |
| 65 to 69 Years | 50 (8.7%) | 34 (7.0%) |
| 70 to 74 Years | 44 (7.7%) | 27 (5.5%) |
| 75 to 79 Years | 20 (3.5%) | 10 (2.0%) |
| 80 to 84 Years | 4 (0.7%) | 8 (1.6%) |
| 85 Years and over | 12 (2.1%) | 6 (1.2%) |
| Total | 574 (100.0%) | 489 (100.0%) |
Families and Households in Montgomery
Median Family Size in Montgomery
The median family size in Montgomery is 3.00 persons per family, with married-couple families (284 | 86.6%) accounting for the largest median family size of 3.01 persons per family. On the other hand, single female/mother families (4 | 1.2%) represent the smallest median family size with 2.25 persons per family.
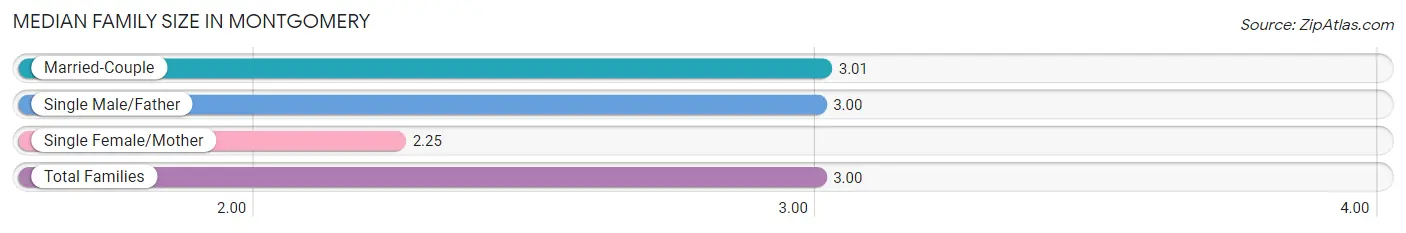
| Family Type | # Families | Family Size |
| Married-Couple | 284 (86.6%) | 3.01 |
| Single Male/Father | 40 (12.2%) | 3.00 |
| Single Female/Mother | 4 (1.2%) | 2.25 |
| Total Families | 328 (100.0%) | 3.00 |
Median Household Size in Montgomery
The median household size in Montgomery is 2.78 persons per household, with single male/father households (40 | 10.5%) accounting for the largest median household size of 3.08 persons per household. non-family households (54 | 14.1%) represent the smallest median household size with 1.11 persons per household.
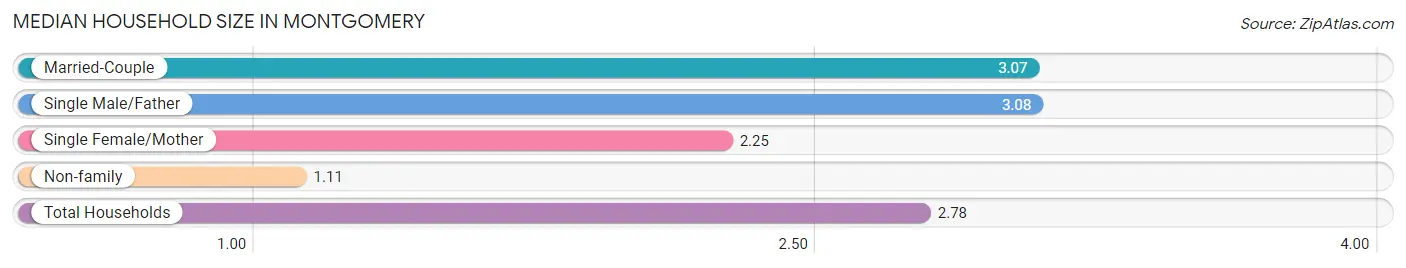
| Household Type | # Households | Household Size |
| Married-Couple | 284 (74.4%) | 3.07 |
| Single Male/Father | 40 (10.5%) | 3.08 |
| Single Female/Mother | 4 (1.1%) | 2.25 |
| Non-family | 54 (14.1%) | 1.11 |
| Total Households | 382 (100.0%) | 2.78 |
Household Size by Marriage Status in Montgomery
Out of a total of 382 households in Montgomery, 328 (85.9%) are family households, while 54 (14.1%) are nonfamily households. The most numerous type of family households are 2-person households, comprising 157, and the most common type of nonfamily households are 1-person households, comprising 47.
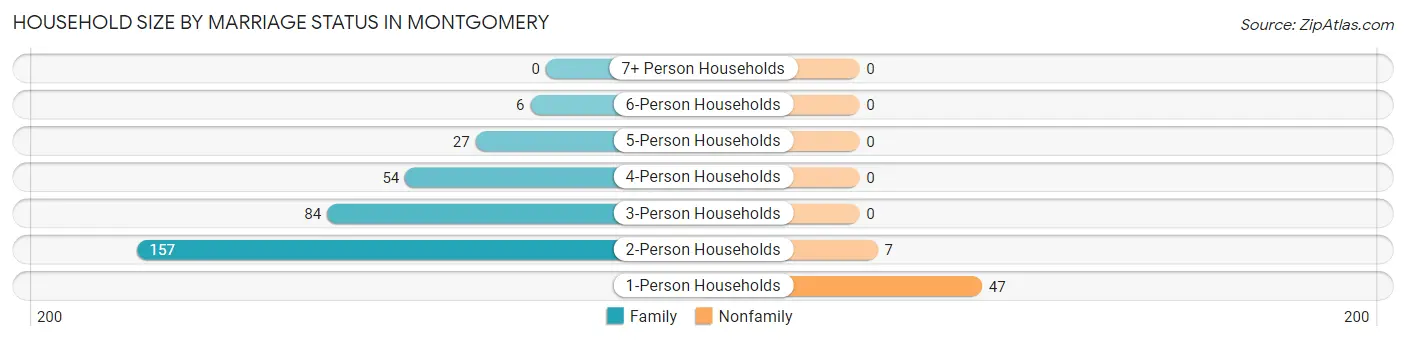
| Household Size | Family Households | Nonfamily Households |
| 1-Person Households | - | 47 (12.3%) |
| 2-Person Households | 157 (41.1%) | 7 (1.8%) |
| 3-Person Households | 84 (22.0%) | 0 (0.0%) |
| 4-Person Households | 54 (14.1%) | 0 (0.0%) |
| 5-Person Households | 27 (7.1%) | 0 (0.0%) |
| 6-Person Households | 6 (1.6%) | 0 (0.0%) |
| 7+ Person Households | 0 (0.0%) | 0 (0.0%) |
| Total | 328 (85.9%) | 54 (14.1%) |
Female Fertility in Montgomery
Fertility by Age in Montgomery
Average fertility rate in Montgomery is 5.0 births per 1,000 women. Women in the age bracket of 20 to 34 years have the highest fertility rate with 12.0 births per 1,000 women. Women in the age bracket of 20 to 34 years acount for 100.0% of all women with births.
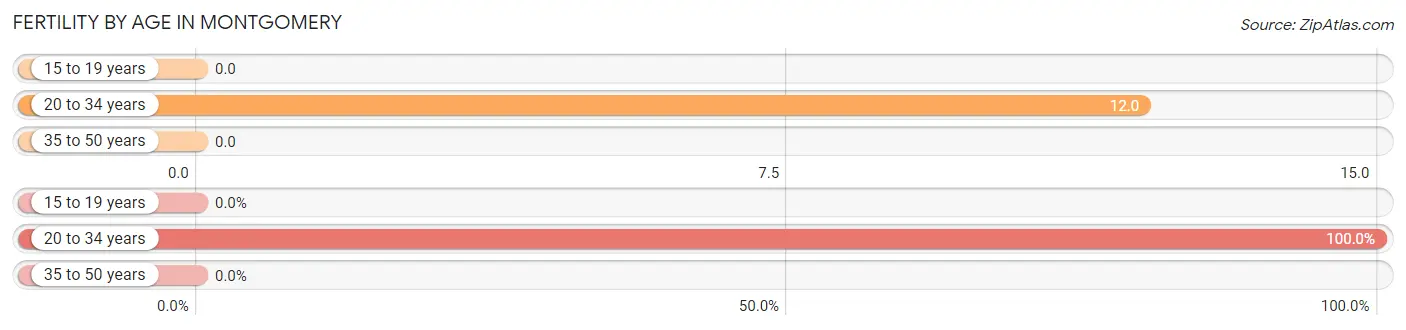
| Age Bracket | Women with Births | Births / 1,000 Women |
| 15 to 19 years | 0 (0.0%) | 0.0 |
| 20 to 34 years | 1 (100.0%) | 12.0 |
| 35 to 50 years | 0 (0.0%) | 0.0 |
| Total | 1 (100.0%) | 5.0 |
Fertility by Age by Marriage Status in Montgomery
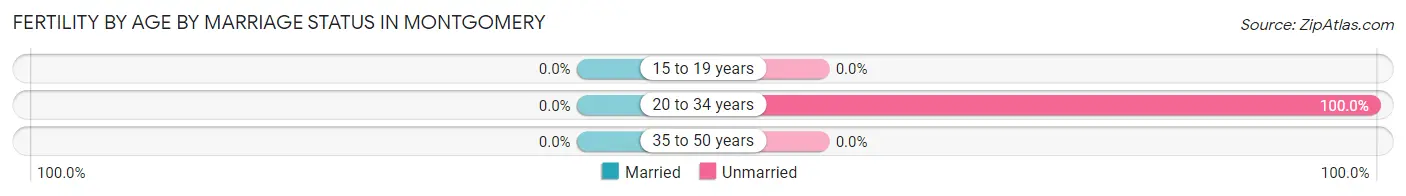
| Age Bracket | Married | Unmarried |
| 15 to 19 years | 0 (0.0%) | 0 (0.0%) |
| 20 to 34 years | 0 (0.0%) | 1 (100.0%) |
| 35 to 50 years | 0 (0.0%) | 0 (0.0%) |
| Total | 0 (0.0%) | 1 (100.0%) |
Fertility by Education in Montgomery
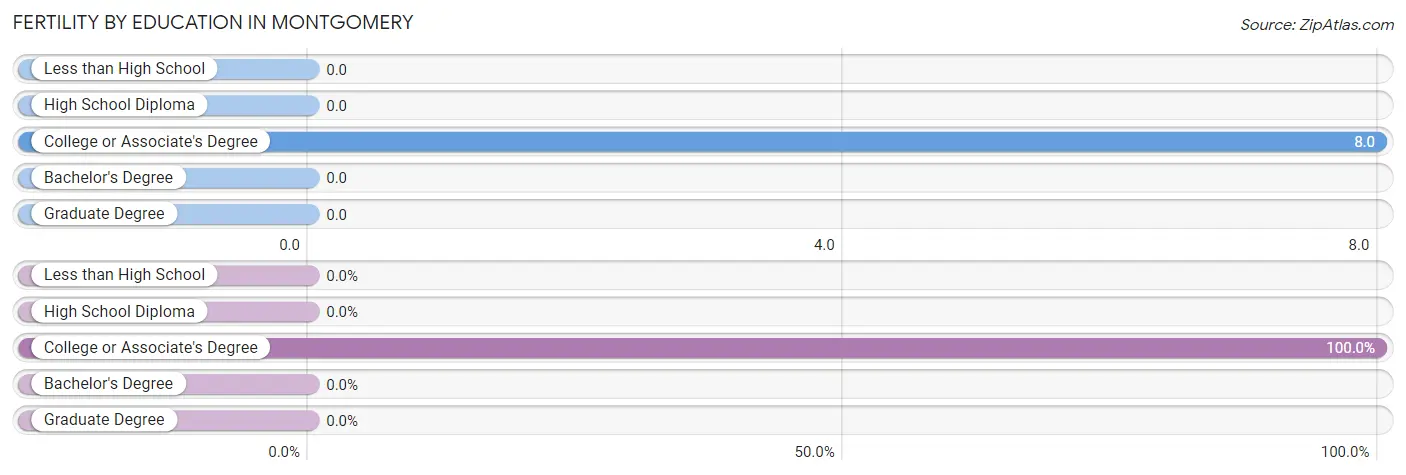
| Educational Attainment | Women with Births | Births / 1,000 Women |
| Less than High School | 0 (0.0%) | 0.0 |
| High School Diploma | 0 (0.0%) | 0.0 |
| College or Associate's Degree | 1 (100.0%) | 8.0 |
| Bachelor's Degree | 0 (0.0%) | 0.0 |
| Graduate Degree | 0 (0.0%) | 0.0 |
| Total | 1 (100.0%) | 5.0 |
Fertility by Education by Marriage Status in Montgomery
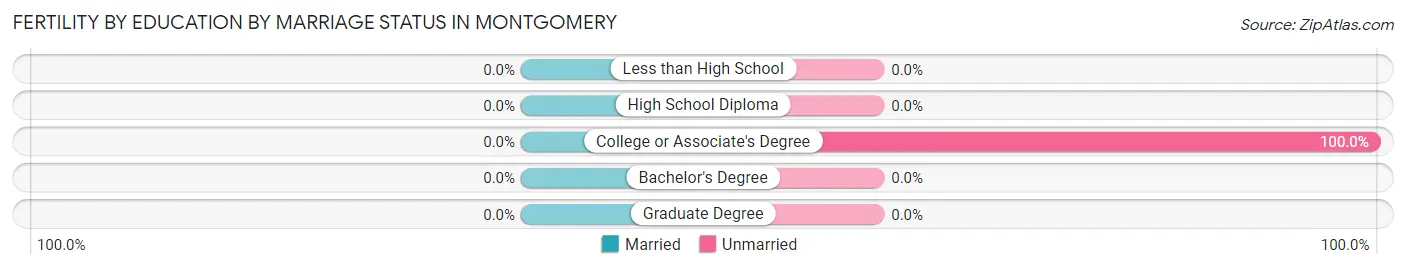
| Educational Attainment | Married | Unmarried |
| Less than High School | 0 (0.0%) | 0 (0.0%) |
| High School Diploma | 0 (0.0%) | 0 (0.0%) |
| College or Associate's Degree | 0 (0.0%) | 1 (100.0%) |
| Bachelor's Degree | 0 (0.0%) | 0 (0.0%) |
| Graduate Degree | 0 (0.0%) | 0 (0.0%) |
| Total | 0 (0.0%) | 1 (100.0%) |
Employment Characteristics in Montgomery
Employment by Class of Employer in Montgomery
Among the 538 employed individuals in Montgomery, private company employees (375 | 69.7%), self-employed (not incorporated) (54 | 10.0%), and not-for-profit organizations (45 | 8.4%) make up the most common classes of employment.
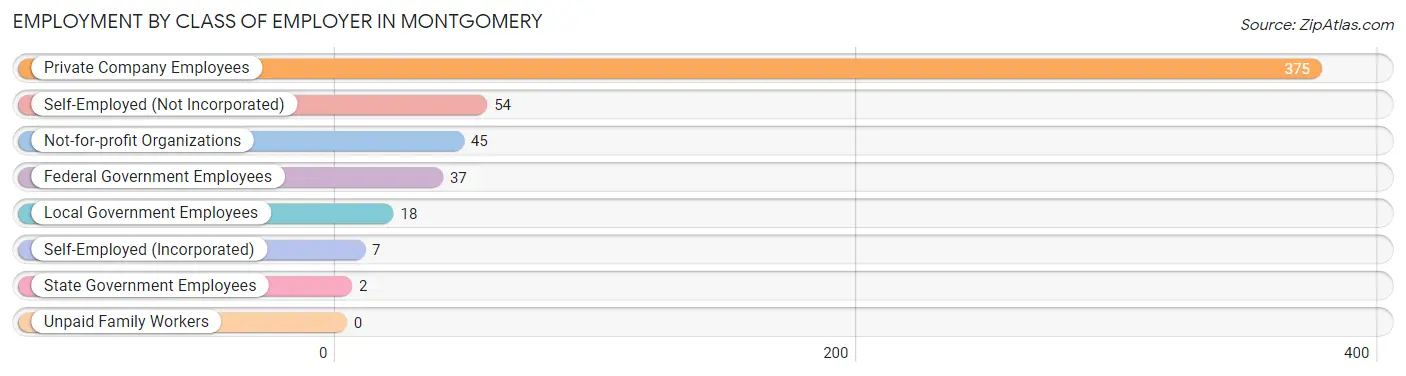
| Employer Class | # Employees | % Employees |
| Private Company Employees | 375 | 69.7% |
| Self-Employed (Incorporated) | 7 | 1.3% |
| Self-Employed (Not Incorporated) | 54 | 10.0% |
| Not-for-profit Organizations | 45 | 8.4% |
| Local Government Employees | 18 | 3.4% |
| State Government Employees | 2 | 0.4% |
| Federal Government Employees | 37 | 6.9% |
| Unpaid Family Workers | 0 | 0.0% |
| Total | 538 | 100.0% |
Employment Status by Age in Montgomery
According to the labor force statistics for Montgomery, out of the total population over 16 years of age (939), 59.4% or 558 individuals are in the labor force, with 0.4% or 2 of them unemployed. The age group with the highest labor force participation rate is 20 to 24 years, with 100.0% or 29 individuals in the labor force. Within the labor force, the 30 to 34 years age range has the highest percentage of unemployed individuals, with 5.1% or 2 of them being unemployed.
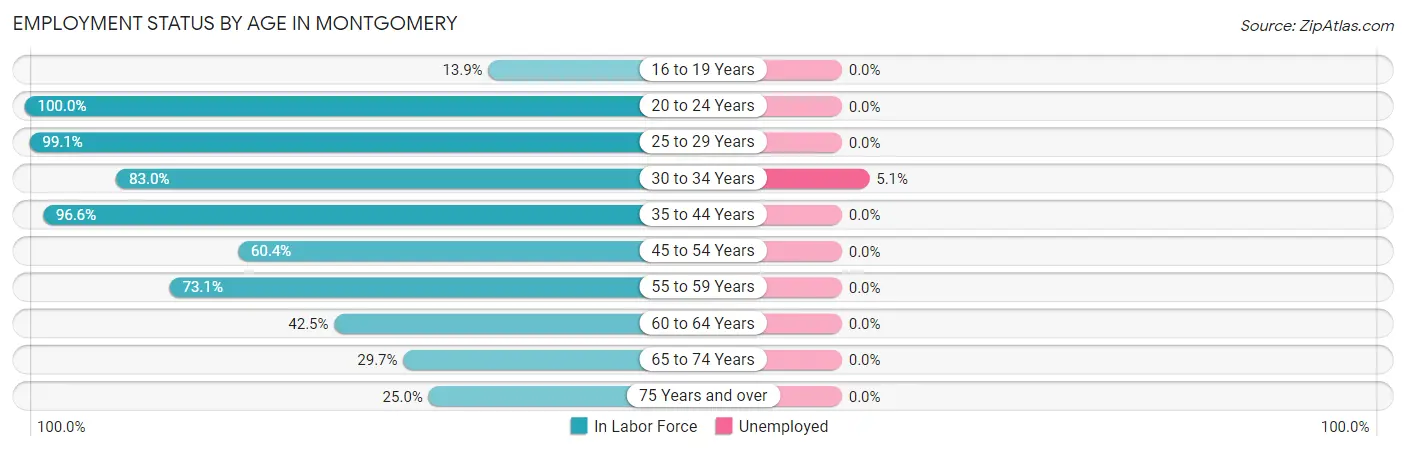
| Age Bracket | In Labor Force | Unemployed |
| 16 to 19 Years | 10 (13.9%) | 0 (0.0%) |
| 20 to 24 Years | 29 (100.0%) | 0 (0.0%) |
| 25 to 29 Years | 106 (99.1%) | 0 (0.0%) |
| 30 to 34 Years | 39 (83.0%) | 2 (5.1%) |
| 35 to 44 Years | 84 (96.6%) | 0 (0.0%) |
| 45 to 54 Years | 64 (60.4%) | 0 (0.0%) |
| 55 to 59 Years | 114 (73.1%) | 0 (0.0%) |
| 60 to 64 Years | 51 (42.5%) | 0 (0.0%) |
| 65 to 74 Years | 46 (29.7%) | 0 (0.0%) |
| 75 Years and over | 15 (25.0%) | 0 (0.0%) |
| Total | 558 (59.4%) | 2 (0.4%) |
Employment Status by Educational Attainment in Montgomery
According to labor force statistics for Montgomery, 73.5% of individuals (458) out of the total population between 25 and 64 years of age (623) are in the labor force, with 0.4% or 2 of them being unemployed. The group with the highest labor force participation rate are those with the educational attainment of bachelor's degree or higher, with 92.9% or 65 individuals in the labor force. Within the labor force, individuals with less than high school education have the highest percentage of unemployment, with 3.9% or 2 of them being unemployed.
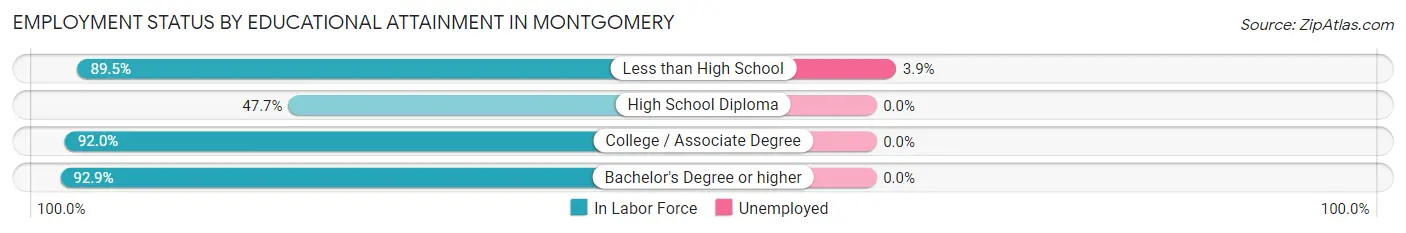
| Educational Attainment | In Labor Force | Unemployed |
| Less than High School | 51 (89.5%) | 2 (3.9%) |
| High School Diploma | 123 (47.7%) | 0 (0.0%) |
| College / Associate Degree | 219 (92.0%) | 0 (0.0%) |
| Bachelor's Degree or higher | 65 (92.9%) | 0 (0.0%) |
| Total | 458 (73.5%) | 2 (0.4%) |
Employment Occupations by Sex in Montgomery
Management, Business, Science and Arts Occupations
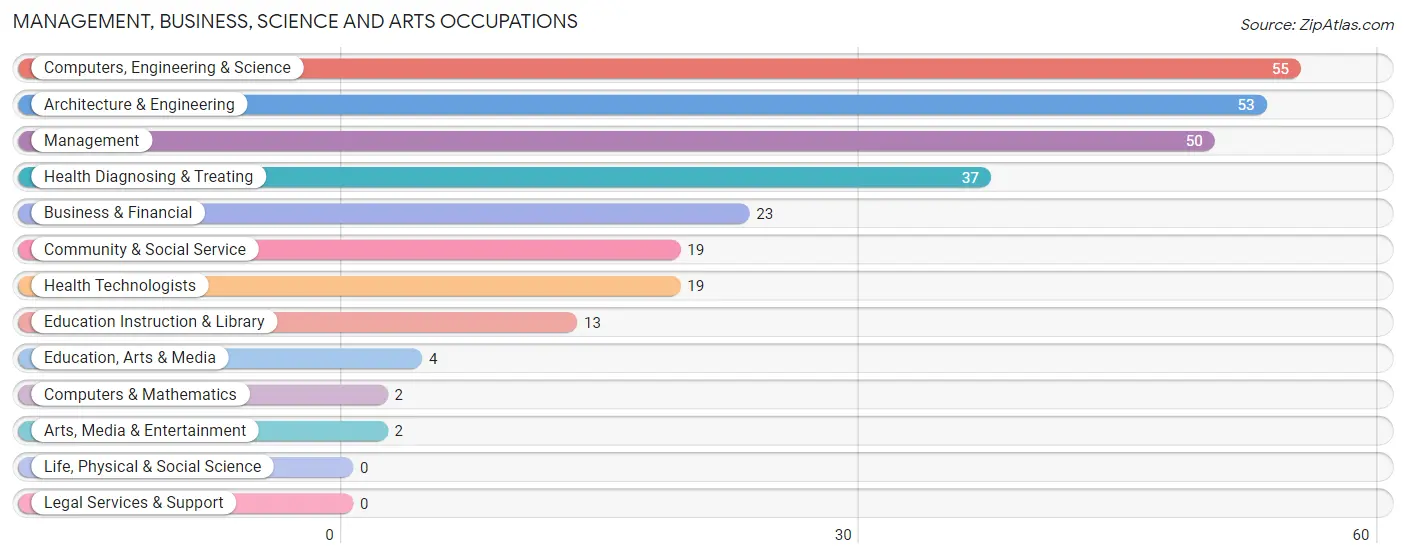
The most common Management, Business, Science and Arts occupations in Montgomery are Computers, Engineering & Science (55 | 9.9%), Architecture & Engineering (53 | 9.5%), Management (50 | 9.0%), Health Diagnosing & Treating (37 | 6.7%), and Business & Financial (23 | 4.1%).
Management, Business, Science and Arts Occupations by Sex
Within the Management, Business, Science and Arts occupations in Montgomery, the most male-oriented occupations are Management (90.0%), Architecture & Engineering (69.8%), and Computers, Engineering & Science (67.3%), while the most female-oriented occupations are Computers & Mathematics (100.0%), Arts, Media & Entertainment (100.0%), and Health Diagnosing & Treating (89.2%).
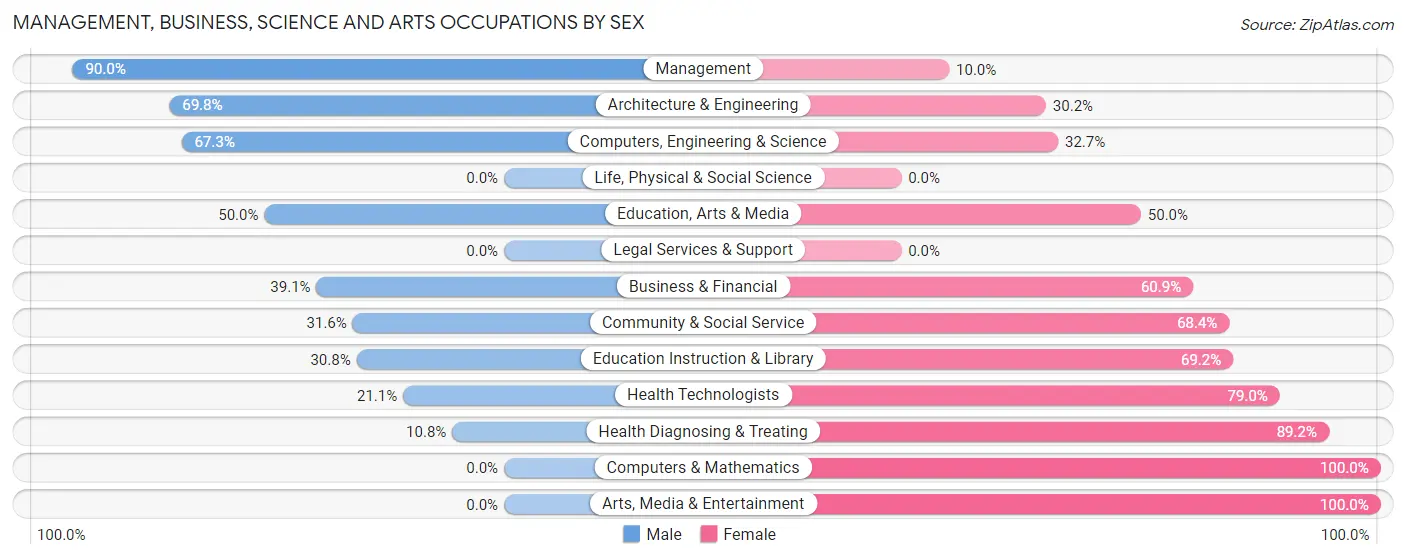
| Occupation | Male | Female |
| Management | 45 (90.0%) | 5 (10.0%) |
| Business & Financial | 9 (39.1%) | 14 (60.9%) |
| Computers, Engineering & Science | 37 (67.3%) | 18 (32.7%) |
| Computers & Mathematics | 0 (0.0%) | 2 (100.0%) |
| Architecture & Engineering | 37 (69.8%) | 16 (30.2%) |
| Life, Physical & Social Science | 0 (0.0%) | 0 (0.0%) |
| Community & Social Service | 6 (31.6%) | 13 (68.4%) |
| Education, Arts & Media | 2 (50.0%) | 2 (50.0%) |
| Legal Services & Support | 0 (0.0%) | 0 (0.0%) |
| Education Instruction & Library | 4 (30.8%) | 9 (69.2%) |
| Arts, Media & Entertainment | 0 (0.0%) | 2 (100.0%) |
| Health Diagnosing & Treating | 4 (10.8%) | 33 (89.2%) |
| Health Technologists | 4 (21.0%) | 15 (78.9%) |
| Total (Category) | 101 (54.9%) | 83 (45.1%) |
| Total (Overall) | 295 (53.1%) | 261 (46.9%) |
Services Occupations
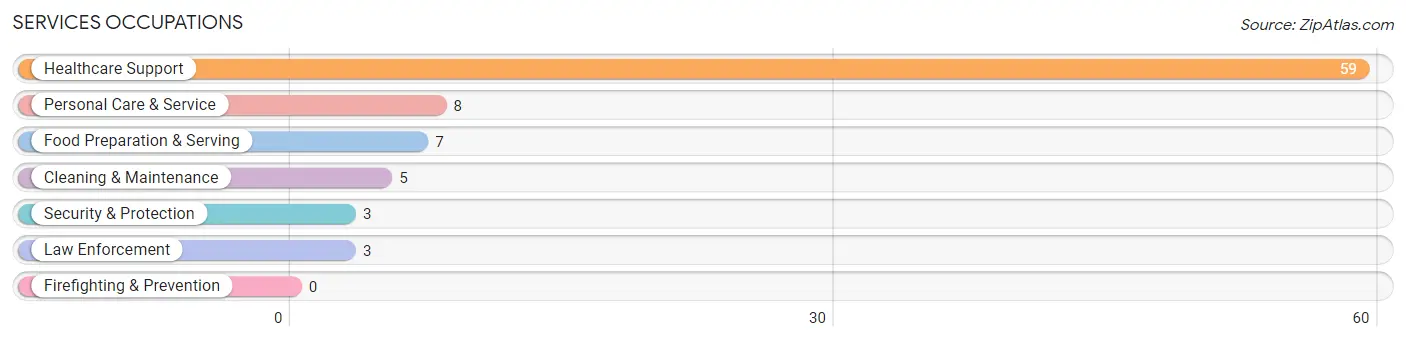
The most common Services occupations in Montgomery are Healthcare Support (59 | 10.6%), Personal Care & Service (8 | 1.4%), Food Preparation & Serving (7 | 1.3%), Cleaning & Maintenance (5 | 0.9%), and Security & Protection (3 | 0.5%).
Services Occupations by Sex
Within the Services occupations in Montgomery, the most male-oriented occupations are Security & Protection (100.0%), Law Enforcement (100.0%), and Cleaning & Maintenance (60.0%), while the most female-oriented occupations are Food Preparation & Serving (100.0%), Personal Care & Service (100.0%), and Healthcare Support (94.9%).
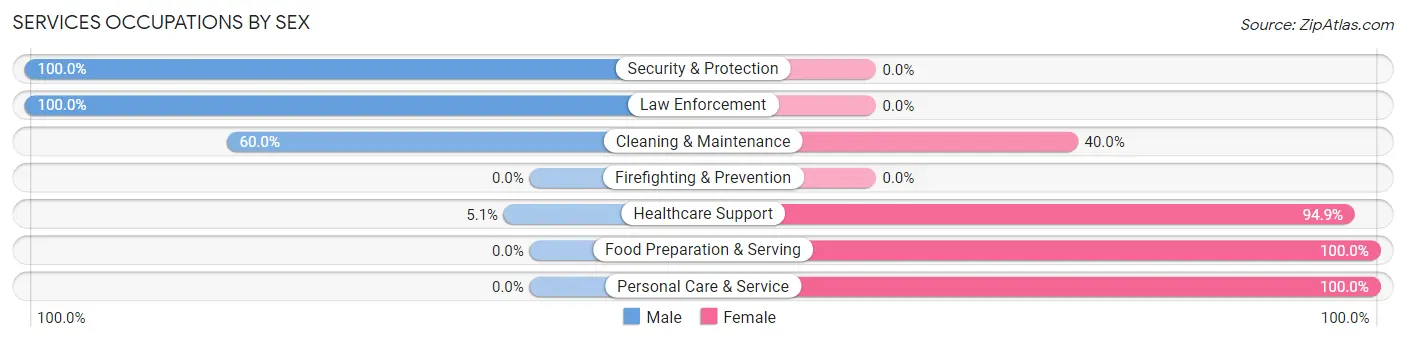
| Occupation | Male | Female |
| Healthcare Support | 3 (5.1%) | 56 (94.9%) |
| Security & Protection | 3 (100.0%) | 0 (0.0%) |
| Firefighting & Prevention | 0 (0.0%) | 0 (0.0%) |
| Law Enforcement | 3 (100.0%) | 0 (0.0%) |
| Food Preparation & Serving | 0 (0.0%) | 7 (100.0%) |
| Cleaning & Maintenance | 3 (60.0%) | 2 (40.0%) |
| Personal Care & Service | 0 (0.0%) | 8 (100.0%) |
| Total (Category) | 9 (11.0%) | 73 (89.0%) |
| Total (Overall) | 295 (53.1%) | 261 (46.9%) |
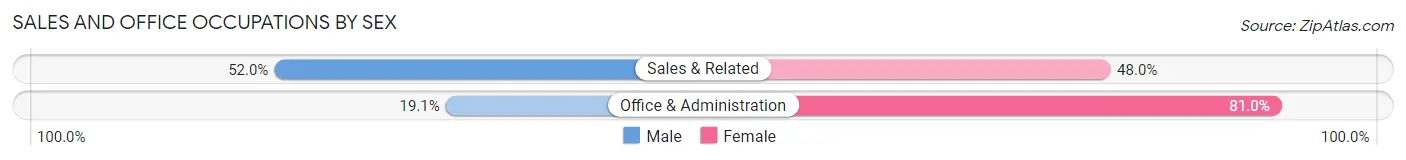
Sales and Office Occupations
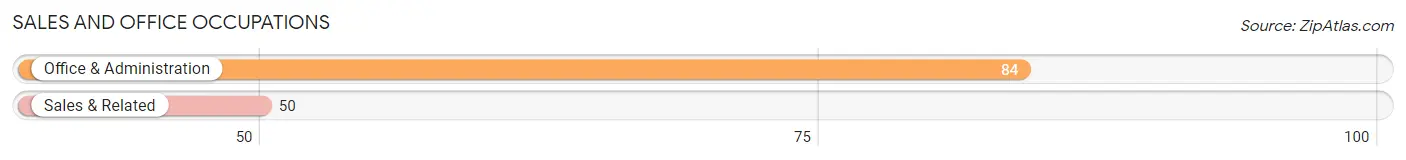
The most common Sales and Office occupations in Montgomery are Office & Administration (84 | 15.1%), and Sales & Related (50 | 9.0%).
Sales and Office Occupations by Sex
| Occupation | Male | Female |
| Sales & Related | 26 (52.0%) | 24 (48.0%) |
| Office & Administration | 16 (19.1%) | 68 (80.9%) |
| Total (Category) | 42 (31.3%) | 92 (68.7%) |
| Total (Overall) | 295 (53.1%) | 261 (46.9%) |
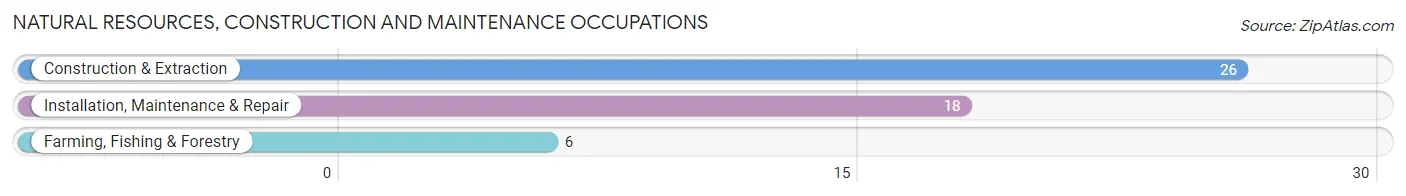
Natural Resources, Construction and Maintenance Occupations
The most common Natural Resources, Construction and Maintenance occupations in Montgomery are Construction & Extraction (26 | 4.7%), Installation, Maintenance & Repair (18 | 3.2%), and Farming, Fishing & Forestry (6 | 1.1%).
Natural Resources, Construction and Maintenance Occupations by Sex
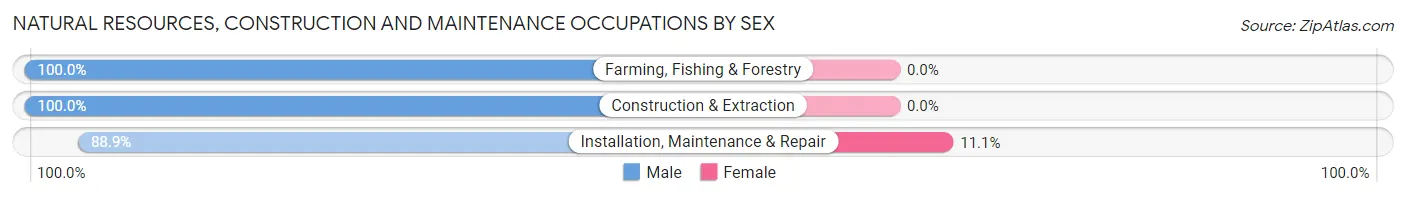
| Occupation | Male | Female |
| Farming, Fishing & Forestry | 6 (100.0%) | 0 (0.0%) |
| Construction & Extraction | 26 (100.0%) | 0 (0.0%) |
| Installation, Maintenance & Repair | 16 (88.9%) | 2 (11.1%) |
| Total (Category) | 48 (96.0%) | 2 (4.0%) |
| Total (Overall) | 295 (53.1%) | 261 (46.9%) |
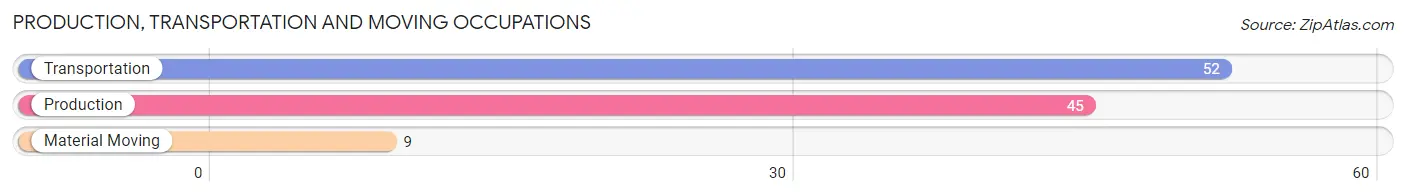
Production, Transportation and Moving Occupations
The most common Production, Transportation and Moving occupations in Montgomery are Transportation (52 | 9.3%), Production (45 | 8.1%), and Material Moving (9 | 1.6%).
Production, Transportation and Moving Occupations by Sex
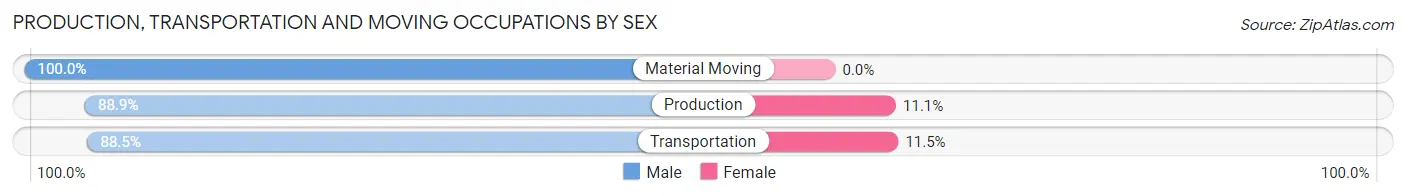
| Occupation | Male | Female |
| Production | 40 (88.9%) | 5 (11.1%) |
| Transportation | 46 (88.5%) | 6 (11.5%) |
| Material Moving | 9 (100.0%) | 0 (0.0%) |
| Total (Category) | 95 (89.6%) | 11 (10.4%) |
| Total (Overall) | 295 (53.1%) | 261 (46.9%) |
Employment Industries by Sex in Montgomery
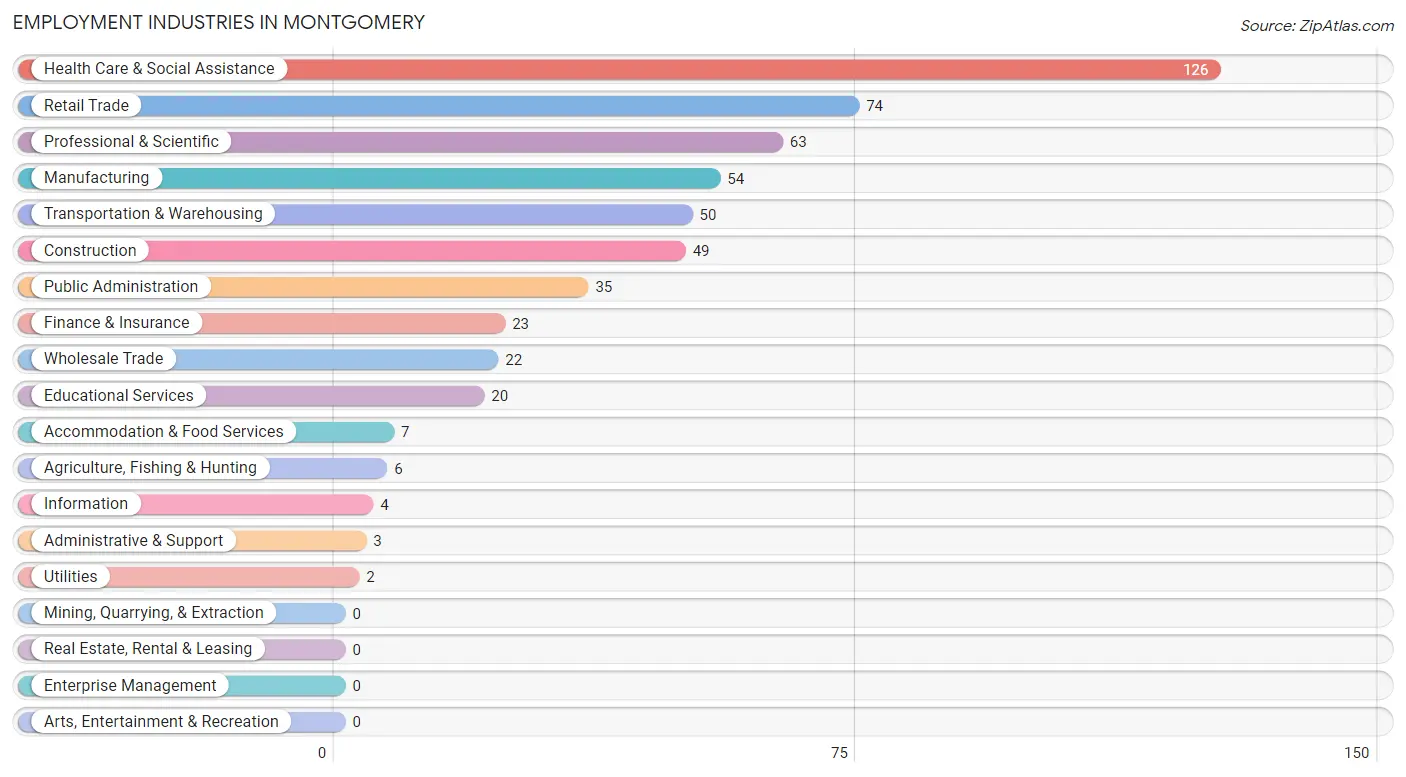
Employment Industries in Montgomery
The major employment industries in Montgomery include Health Care & Social Assistance (126 | 22.7%), Retail Trade (74 | 13.3%), Professional & Scientific (63 | 11.3%), Manufacturing (54 | 9.7%), and Transportation & Warehousing (50 | 9.0%).
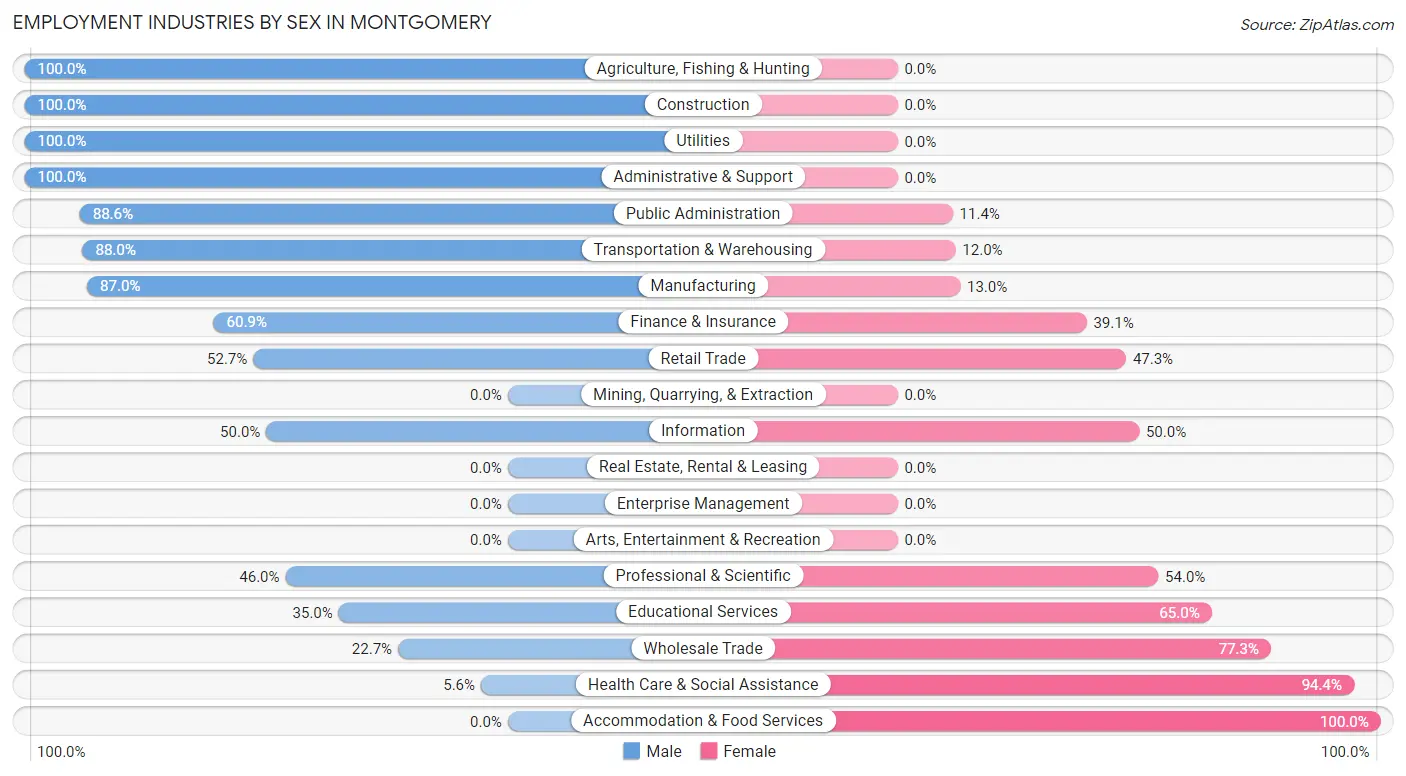
Employment Industries by Sex in Montgomery
The Montgomery industries that see more men than women are Agriculture, Fishing & Hunting (100.0%), Construction (100.0%), and Utilities (100.0%), whereas the industries that tend to have a higher number of women are Accommodation & Food Services (100.0%), Health Care & Social Assistance (94.4%), and Wholesale Trade (77.3%).
| Industry | Male | Female |
| Agriculture, Fishing & Hunting | 6 (100.0%) | 0 (0.0%) |
| Mining, Quarrying, & Extraction | 0 (0.0%) | 0 (0.0%) |
| Construction | 49 (100.0%) | 0 (0.0%) |
| Manufacturing | 47 (87.0%) | 7 (13.0%) |
| Wholesale Trade | 5 (22.7%) | 17 (77.3%) |
| Retail Trade | 39 (52.7%) | 35 (47.3%) |
| Transportation & Warehousing | 44 (88.0%) | 6 (12.0%) |
| Utilities | 2 (100.0%) | 0 (0.0%) |
| Information | 2 (50.0%) | 2 (50.0%) |
| Finance & Insurance | 14 (60.9%) | 9 (39.1%) |
| Real Estate, Rental & Leasing | 0 (0.0%) | 0 (0.0%) |
| Professional & Scientific | 29 (46.0%) | 34 (54.0%) |
| Enterprise Management | 0 (0.0%) | 0 (0.0%) |
| Administrative & Support | 3 (100.0%) | 0 (0.0%) |
| Educational Services | 7 (35.0%) | 13 (65.0%) |
| Health Care & Social Assistance | 7 (5.6%) | 119 (94.4%) |
| Arts, Entertainment & Recreation | 0 (0.0%) | 0 (0.0%) |
| Accommodation & Food Services | 0 (0.0%) | 7 (100.0%) |
| Public Administration | 31 (88.6%) | 4 (11.4%) |
| Total | 295 (53.1%) | 261 (46.9%) |
Education in Montgomery
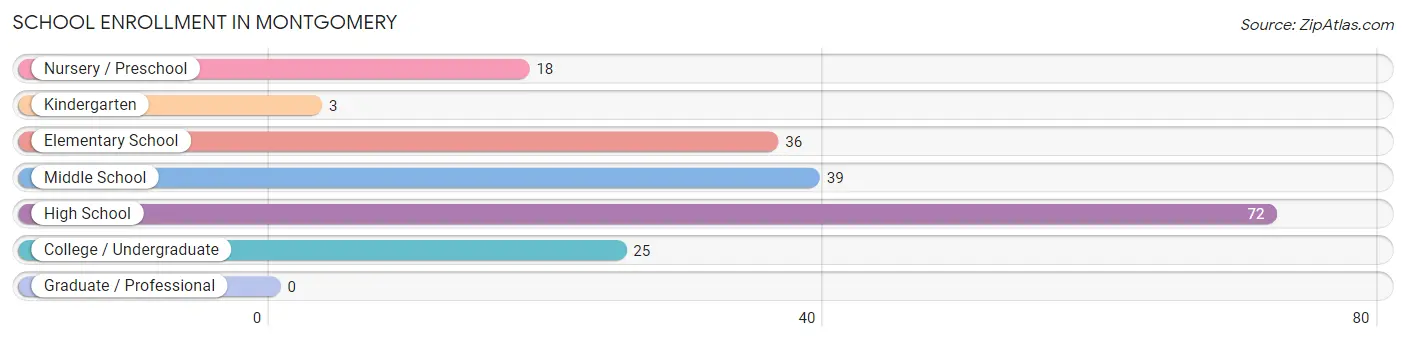
School Enrollment in Montgomery
The most common levels of schooling among the 193 students in Montgomery are high school (72 | 37.3%), middle school (39 | 20.2%), and elementary school (36 | 18.6%).
| School Level | # Students | % Students |
| Nursery / Preschool | 18 | 9.3% |
| Kindergarten | 3 | 1.5% |
| Elementary School | 36 | 18.6% |
| Middle School | 39 | 20.2% |
| High School | 72 | 37.3% |
| College / Undergraduate | 25 | 13.0% |
| Graduate / Professional | 0 | 0.0% |
| Total | 193 | 100.0% |
School Enrollment by Age by Funding Source in Montgomery
Out of a total of 193 students who are enrolled in schools in Montgomery, 25 (13.0%) attend a private institution, while the remaining 168 (87.0%) are enrolled in public schools. The age group of 3 to 4 year olds has the highest likelihood of being enrolled in private schools, with 16 (88.9% in the age bracket) enrolled. Conversely, the age group of 15 to 17 year olds has the lowest likelihood of being enrolled in a private school, with 72 (100.0% in the age bracket) attending a public institution.
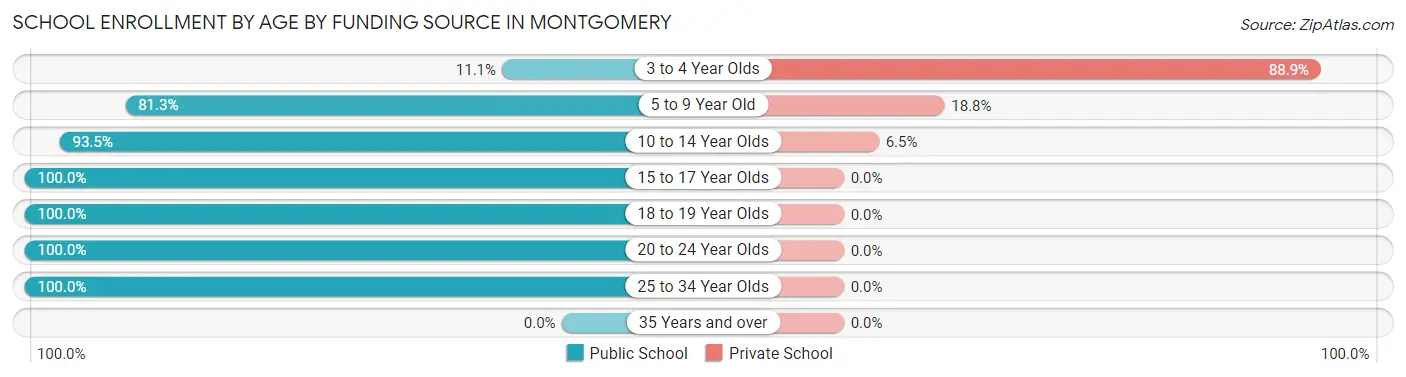
| Age Bracket | Public School | Private School |
| 3 to 4 Year Olds | 2 (11.1%) | 16 (88.9%) |
| 5 to 9 Year Old | 26 (81.2%) | 6 (18.8%) |
| 10 to 14 Year Olds | 43 (93.5%) | 3 (6.5%) |
| 15 to 17 Year Olds | 72 (100.0%) | 0 (0.0%) |
| 18 to 19 Year Olds | 2 (100.0%) | 0 (0.0%) |
| 20 to 24 Year Olds | 9 (100.0%) | 0 (0.0%) |
| 25 to 34 Year Olds | 14 (100.0%) | 0 (0.0%) |
| 35 Years and over | 0 (0.0%) | 0 (0.0%) |
| Total | 168 (87.0%) | 25 (13.0%) |
Educational Attainment by Field of Study in Montgomery
Education (33 | 31.7%), business (24 | 23.1%), science & technology (18 | 17.3%), engineering (15 | 14.4%), and social sciences (10 | 9.6%) are the most common fields of study among 104 individuals in Montgomery who have obtained a bachelor's degree or higher.
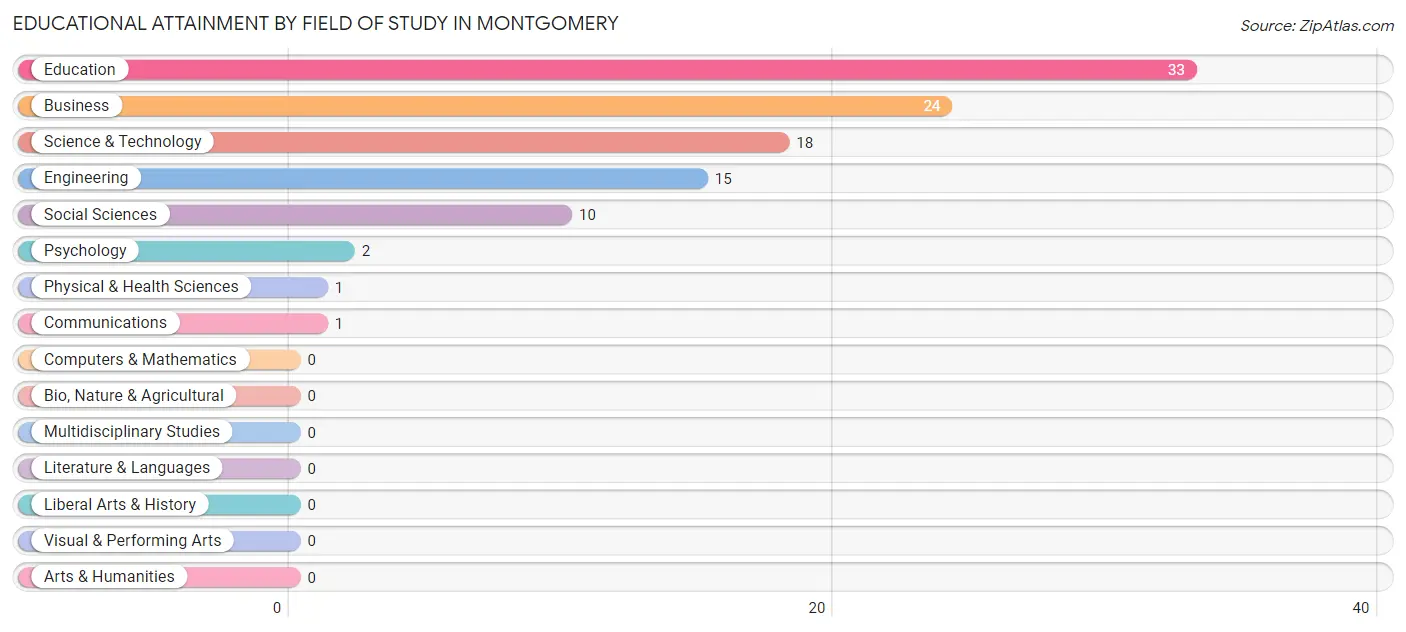
| Field of Study | # Graduates | % Graduates |
| Computers & Mathematics | 0 | 0.0% |
| Bio, Nature & Agricultural | 0 | 0.0% |
| Physical & Health Sciences | 1 | 1.0% |
| Psychology | 2 | 1.9% |
| Social Sciences | 10 | 9.6% |
| Engineering | 15 | 14.4% |
| Multidisciplinary Studies | 0 | 0.0% |
| Science & Technology | 18 | 17.3% |
| Business | 24 | 23.1% |
| Education | 33 | 31.7% |
| Literature & Languages | 0 | 0.0% |
| Liberal Arts & History | 0 | 0.0% |
| Visual & Performing Arts | 0 | 0.0% |
| Communications | 1 | 1.0% |
| Arts & Humanities | 0 | 0.0% |
| Total | 104 | 100.0% |
Transportation & Commute in Montgomery
Vehicle Availability by Sex in Montgomery
The most prevalent vehicle ownership categories in Montgomery are males with 3 vehicles (96, accounting for 34.7%) and females with 3 vehicles (70, making up 36.8%).
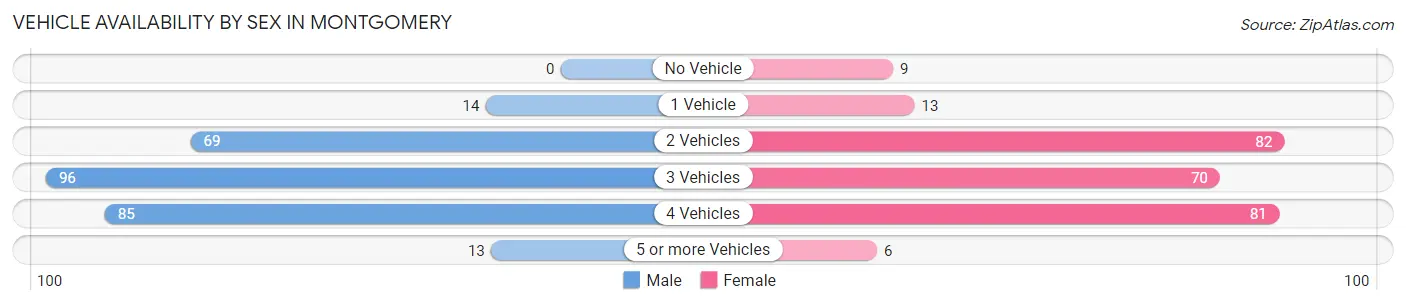
| Vehicles Available | Male | Female |
| No Vehicle | 0 (0.0%) | 9 (3.5%) |
| 1 Vehicle | 14 (5.1%) | 13 (5.0%) |
| 2 Vehicles | 69 (24.9%) | 82 (31.4%) |
| 3 Vehicles | 96 (34.7%) | 70 (26.8%) |
| 4 Vehicles | 85 (30.7%) | 81 (31.0%) |
| 5 or more Vehicles | 13 (4.7%) | 6 (2.3%) |
| Total | 277 (100.0%) | 261 (100.0%) |
Commute Time in Montgomery
The most frequently occuring commute durations in Montgomery are 15 to 19 minutes (127 commuters, 24.2%), 10 to 14 minutes (92 commuters, 17.6%), and 30 to 34 minutes (89 commuters, 17.0%).
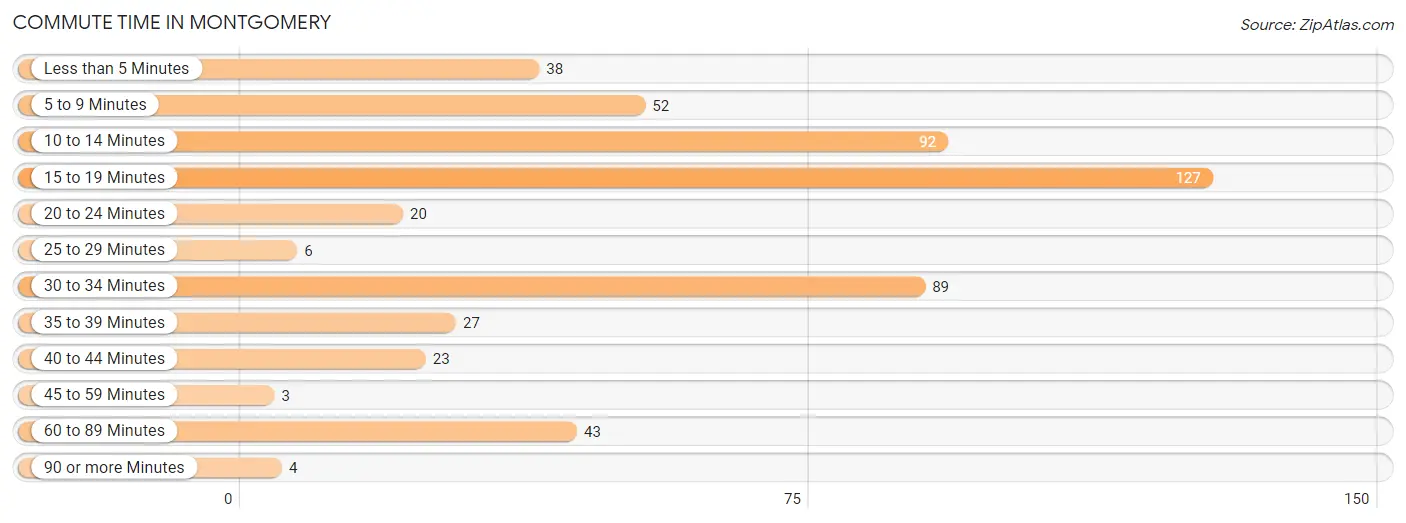
| Commute Time | # Commuters | % Commuters |
| Less than 5 Minutes | 38 | 7.2% |
| 5 to 9 Minutes | 52 | 9.9% |
| 10 to 14 Minutes | 92 | 17.6% |
| 15 to 19 Minutes | 127 | 24.2% |
| 20 to 24 Minutes | 20 | 3.8% |
| 25 to 29 Minutes | 6 | 1.1% |
| 30 to 34 Minutes | 89 | 17.0% |
| 35 to 39 Minutes | 27 | 5.1% |
| 40 to 44 Minutes | 23 | 4.4% |
| 45 to 59 Minutes | 3 | 0.6% |
| 60 to 89 Minutes | 43 | 8.2% |
| 90 or more Minutes | 4 | 0.8% |
Commute Time by Sex in Montgomery
The most common commute times in Montgomery are 15 to 19 minutes (78 commuters, 28.2%) for males and 30 to 34 minutes (68 commuters, 27.5%) for females.
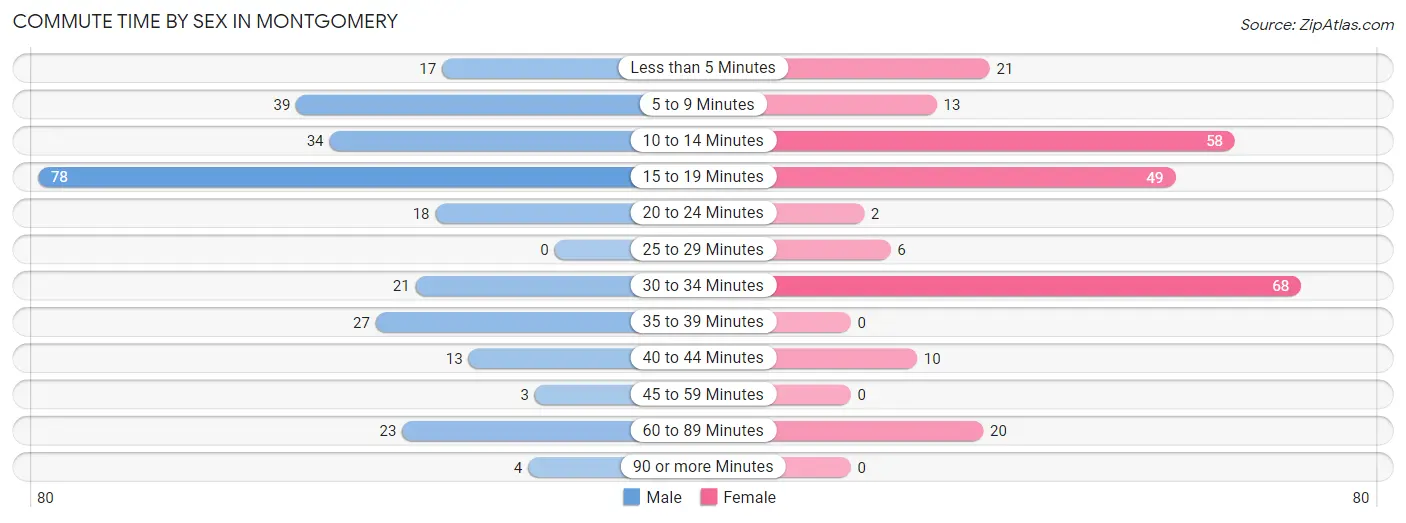
| Commute Time | Male | Female |
| Less than 5 Minutes | 17 (6.1%) | 21 (8.5%) |
| 5 to 9 Minutes | 39 (14.1%) | 13 (5.3%) |
| 10 to 14 Minutes | 34 (12.3%) | 58 (23.5%) |
| 15 to 19 Minutes | 78 (28.2%) | 49 (19.8%) |
| 20 to 24 Minutes | 18 (6.5%) | 2 (0.8%) |
| 25 to 29 Minutes | 0 (0.0%) | 6 (2.4%) |
| 30 to 34 Minutes | 21 (7.6%) | 68 (27.5%) |
| 35 to 39 Minutes | 27 (9.8%) | 0 (0.0%) |
| 40 to 44 Minutes | 13 (4.7%) | 10 (4.1%) |
| 45 to 59 Minutes | 3 (1.1%) | 0 (0.0%) |
| 60 to 89 Minutes | 23 (8.3%) | 20 (8.1%) |
| 90 or more Minutes | 4 (1.4%) | 0 (0.0%) |
Time of Departure to Work by Sex in Montgomery
The most frequent times of departure to work in Montgomery are 7:30 AM to 7:59 AM (56, 20.2%) for males and 6:00 AM to 6:29 AM (50, 20.2%) for females.
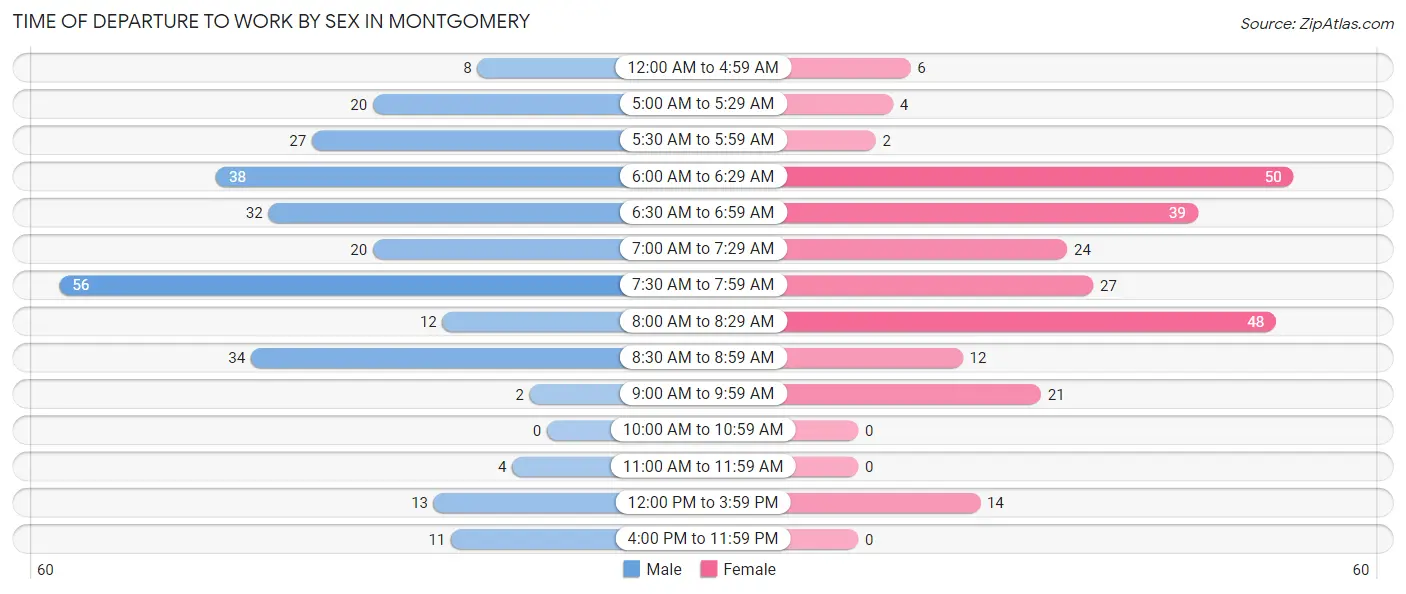
| Time of Departure | Male | Female |
| 12:00 AM to 4:59 AM | 8 (2.9%) | 6 (2.4%) |
| 5:00 AM to 5:29 AM | 20 (7.2%) | 4 (1.6%) |
| 5:30 AM to 5:59 AM | 27 (9.8%) | 2 (0.8%) |
| 6:00 AM to 6:29 AM | 38 (13.7%) | 50 (20.2%) |
| 6:30 AM to 6:59 AM | 32 (11.6%) | 39 (15.8%) |
| 7:00 AM to 7:29 AM | 20 (7.2%) | 24 (9.7%) |
| 7:30 AM to 7:59 AM | 56 (20.2%) | 27 (10.9%) |
| 8:00 AM to 8:29 AM | 12 (4.3%) | 48 (19.4%) |
| 8:30 AM to 8:59 AM | 34 (12.3%) | 12 (4.9%) |
| 9:00 AM to 9:59 AM | 2 (0.7%) | 21 (8.5%) |
| 10:00 AM to 10:59 AM | 0 (0.0%) | 0 (0.0%) |
| 11:00 AM to 11:59 AM | 4 (1.4%) | 0 (0.0%) |
| 12:00 PM to 3:59 PM | 13 (4.7%) | 14 (5.7%) |
| 4:00 PM to 11:59 PM | 11 (4.0%) | 0 (0.0%) |
| Total | 277 (100.0%) | 247 (100.0%) |
Housing Occupancy in Montgomery
Occupancy by Ownership in Montgomery
Of the total 382 dwellings in Montgomery, owner-occupied units account for 339 (88.7%), while renter-occupied units make up 43 (11.3%).
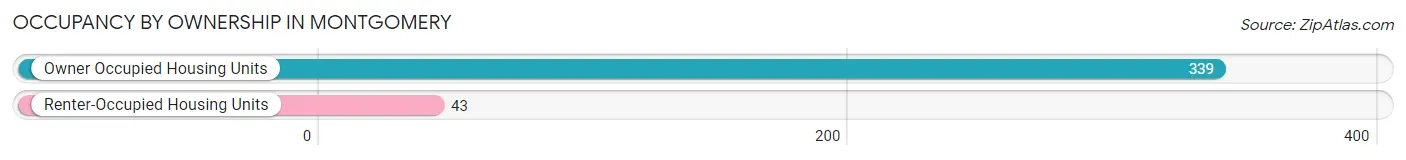
| Occupancy | # Housing Units | % Housing Units |
| Owner Occupied Housing Units | 339 | 88.7% |
| Renter-Occupied Housing Units | 43 | 11.3% |
| Total Occupied Housing Units | 382 | 100.0% |
Occupancy by Household Size in Montgomery
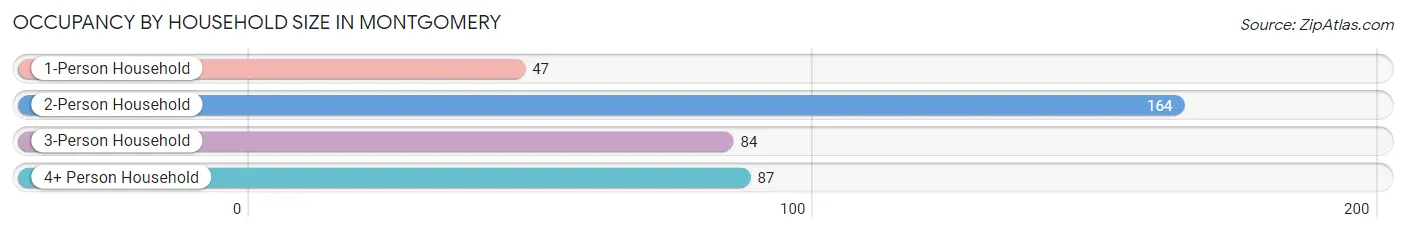
| Household Size | # Housing Units | % Housing Units |
| 1-Person Household | 47 | 12.3% |
| 2-Person Household | 164 | 42.9% |
| 3-Person Household | 84 | 22.0% |
| 4+ Person Household | 87 | 22.8% |
| Total Housing Units | 382 | 100.0% |
Occupancy by Ownership by Household Size in Montgomery
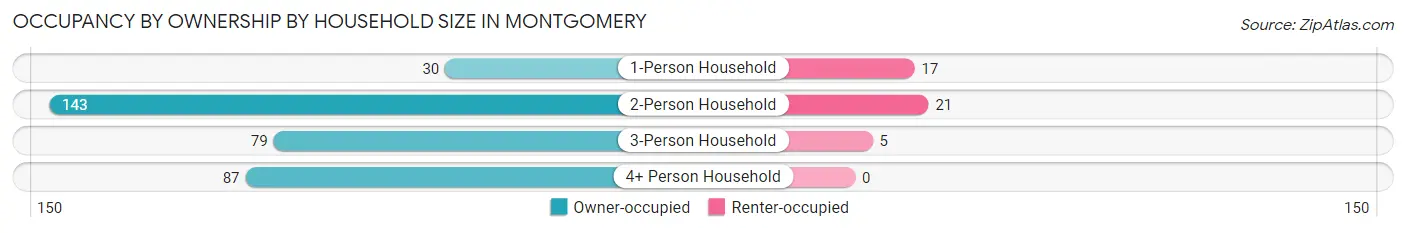
| Household Size | Owner-occupied | Renter-occupied |
| 1-Person Household | 30 (63.8%) | 17 (36.2%) |
| 2-Person Household | 143 (87.2%) | 21 (12.8%) |
| 3-Person Household | 79 (94.1%) | 5 (5.9%) |
| 4+ Person Household | 87 (100.0%) | 0 (0.0%) |
| Total Housing Units | 339 (88.7%) | 43 (11.3%) |
Occupancy by Educational Attainment in Montgomery
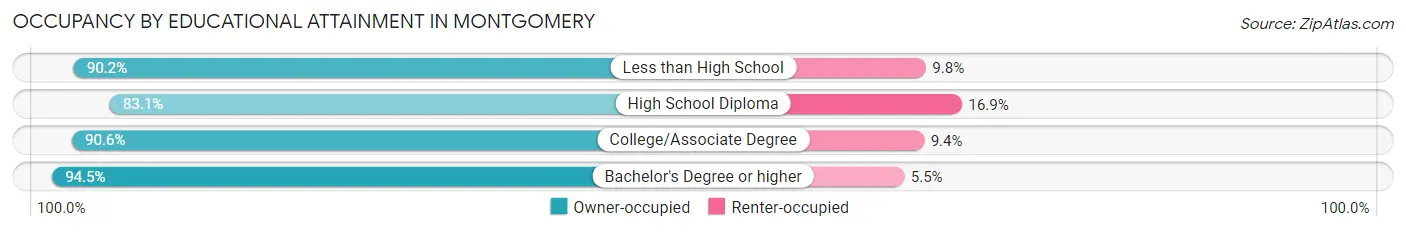
| Household Size | Owner-occupied | Renter-occupied |
| Less than High School | 37 (90.2%) | 4 (9.8%) |
| High School Diploma | 108 (83.1%) | 22 (16.9%) |
| College/Associate Degree | 125 (90.6%) | 13 (9.4%) |
| Bachelor's Degree or higher | 69 (94.5%) | 4 (5.5%) |
Occupancy by Age of Householder in Montgomery
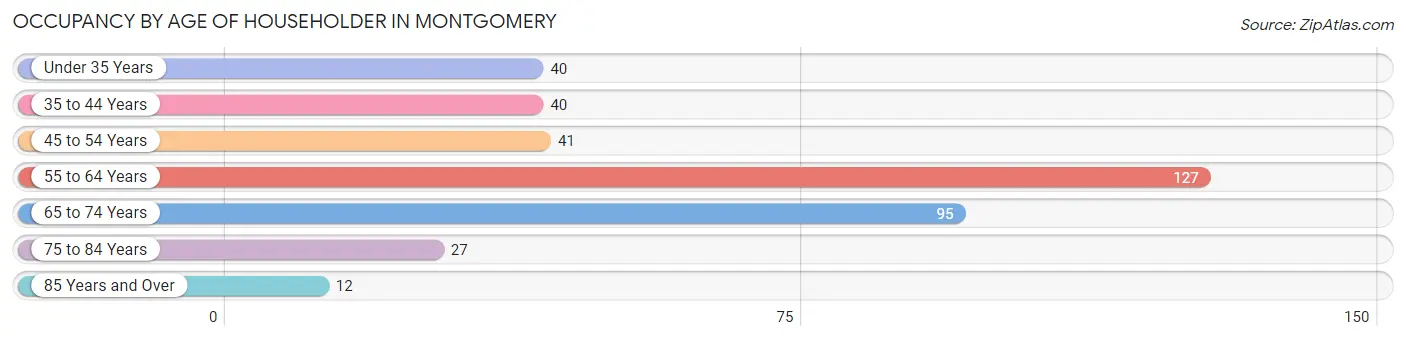
| Age Bracket | # Households | % Households |
| Under 35 Years | 40 | 10.5% |
| 35 to 44 Years | 40 | 10.5% |
| 45 to 54 Years | 41 | 10.7% |
| 55 to 64 Years | 127 | 33.3% |
| 65 to 74 Years | 95 | 24.9% |
| 75 to 84 Years | 27 | 7.1% |
| 85 Years and Over | 12 | 3.1% |
| Total | 382 | 100.0% |
Housing Finances in Montgomery
Median Income by Occupancy in Montgomery
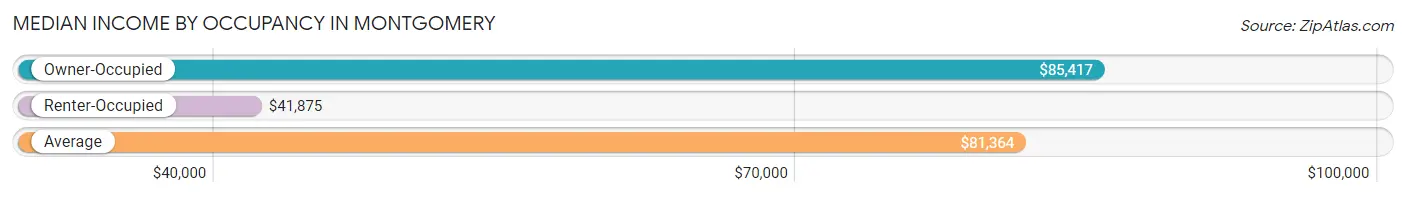
| Occupancy Type | # Households | Median Income |
| Owner-Occupied | 339 (88.7%) | $85,417 |
| Renter-Occupied | 43 (11.3%) | $41,875 |
| Average | 382 (100.0%) | $81,364 |
Occupancy by Householder Income Bracket in Montgomery
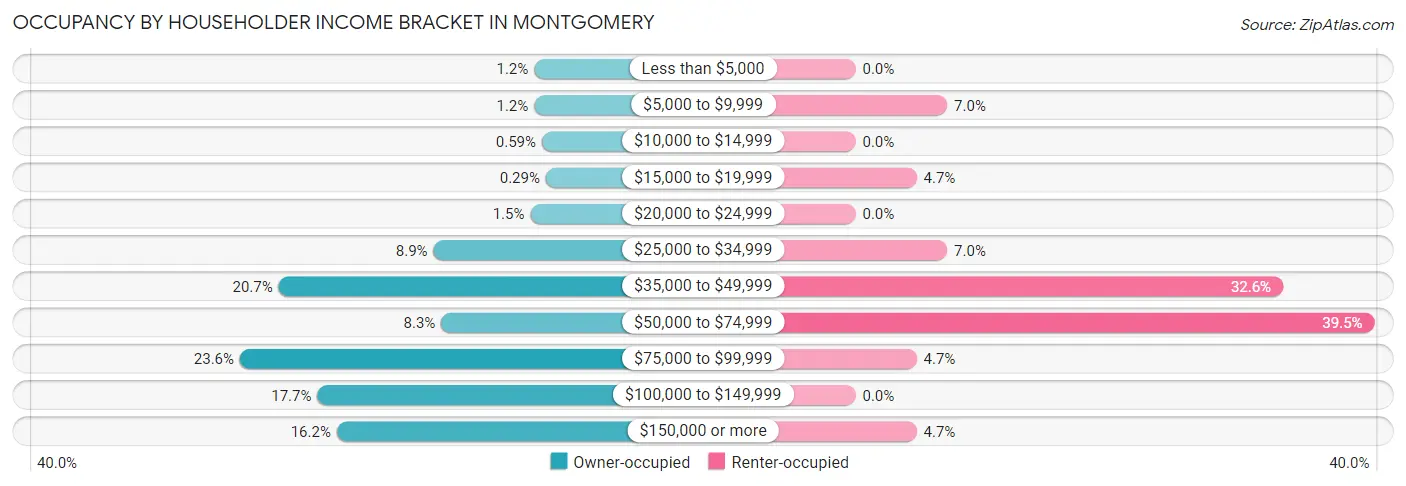
| Income Bracket | Owner-occupied | Renter-occupied |
| Less than $5,000 | 4 (1.2%) | 0 (0.0%) |
| $5,000 to $9,999 | 4 (1.2%) | 3 (7.0%) |
| $10,000 to $14,999 | 2 (0.6%) | 0 (0.0%) |
| $15,000 to $19,999 | 1 (0.3%) | 2 (4.6%) |
| $20,000 to $24,999 | 5 (1.5%) | 0 (0.0%) |
| $25,000 to $34,999 | 30 (8.8%) | 3 (7.0%) |
| $35,000 to $49,999 | 70 (20.6%) | 14 (32.6%) |
| $50,000 to $74,999 | 28 (8.3%) | 17 (39.5%) |
| $75,000 to $99,999 | 80 (23.6%) | 2 (4.6%) |
| $100,000 to $149,999 | 60 (17.7%) | 0 (0.0%) |
| $150,000 or more | 55 (16.2%) | 2 (4.6%) |
| Total | 339 (100.0%) | 43 (100.0%) |
Monthly Housing Cost Tiers in Montgomery
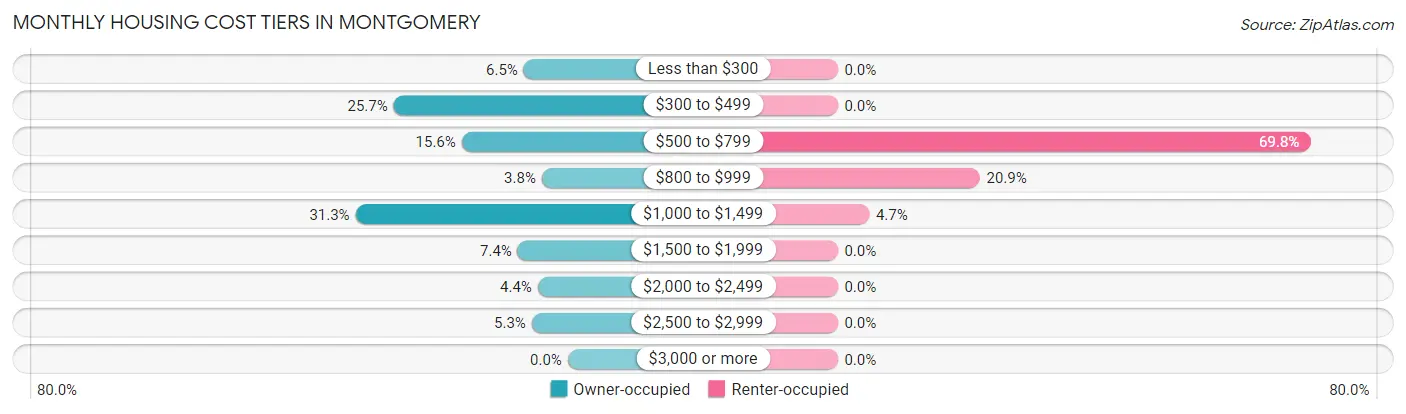
| Monthly Cost | Owner-occupied | Renter-occupied |
| Less than $300 | 22 (6.5%) | 0 (0.0%) |
| $300 to $499 | 87 (25.7%) | 0 (0.0%) |
| $500 to $799 | 53 (15.6%) | 30 (69.8%) |
| $800 to $999 | 13 (3.8%) | 9 (20.9%) |
| $1,000 to $1,499 | 106 (31.3%) | 2 (4.6%) |
| $1,500 to $1,999 | 25 (7.4%) | 0 (0.0%) |
| $2,000 to $2,499 | 15 (4.4%) | 0 (0.0%) |
| $2,500 to $2,999 | 18 (5.3%) | 0 (0.0%) |
| $3,000 or more | 0 (0.0%) | 0 (0.0%) |
| Total | 339 (100.0%) | 43 (100.0%) |
Physical Housing Characteristics in Montgomery
Housing Structures in Montgomery
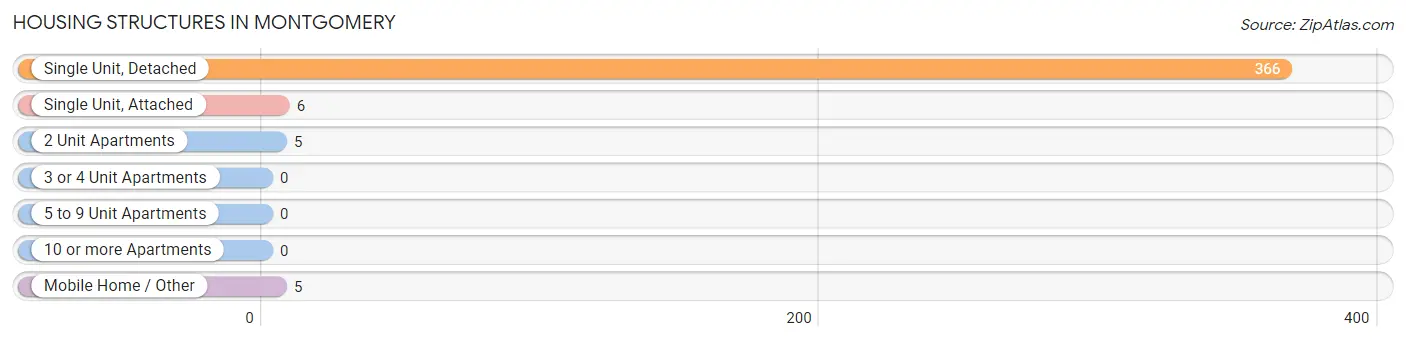
| Structure Type | # Housing Units | % Housing Units |
| Single Unit, Detached | 366 | 95.8% |
| Single Unit, Attached | 6 | 1.6% |
| 2 Unit Apartments | 5 | 1.3% |
| 3 or 4 Unit Apartments | 0 | 0.0% |
| 5 to 9 Unit Apartments | 0 | 0.0% |
| 10 or more Apartments | 0 | 0.0% |
| Mobile Home / Other | 5 | 1.3% |
| Total | 382 | 100.0% |
Housing Structures by Occupancy in Montgomery
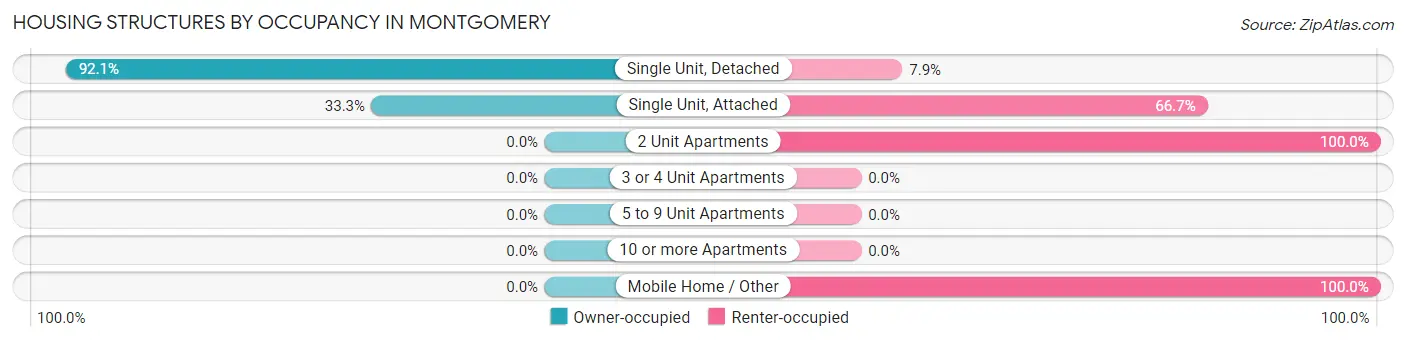
| Structure Type | Owner-occupied | Renter-occupied |
| Single Unit, Detached | 337 (92.1%) | 29 (7.9%) |
| Single Unit, Attached | 2 (33.3%) | 4 (66.7%) |
| 2 Unit Apartments | 0 (0.0%) | 5 (100.0%) |
| 3 or 4 Unit Apartments | 0 (0.0%) | 0 (0.0%) |
| 5 to 9 Unit Apartments | 0 (0.0%) | 0 (0.0%) |
| 10 or more Apartments | 0 (0.0%) | 0 (0.0%) |
| Mobile Home / Other | 0 (0.0%) | 5 (100.0%) |
| Total | 339 (88.7%) | 43 (11.3%) |
Housing Structures by Number of Rooms in Montgomery
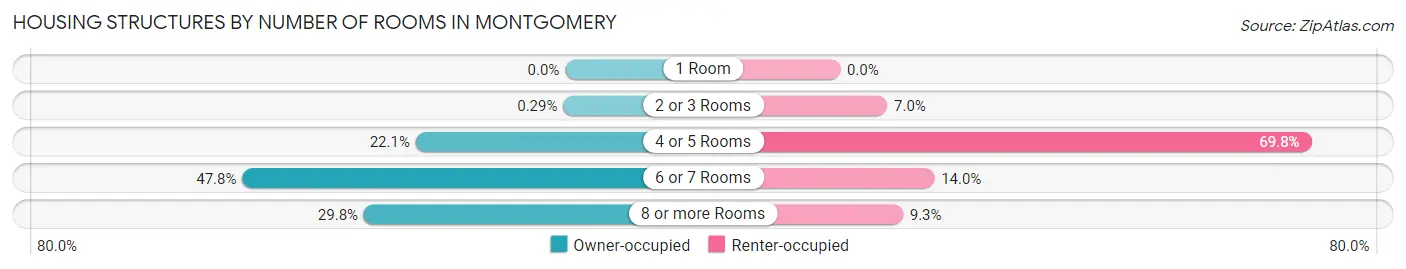
| Number of Rooms | Owner-occupied | Renter-occupied |
| 1 Room | 0 (0.0%) | 0 (0.0%) |
| 2 or 3 Rooms | 1 (0.3%) | 3 (7.0%) |
| 4 or 5 Rooms | 75 (22.1%) | 30 (69.8%) |
| 6 or 7 Rooms | 162 (47.8%) | 6 (14.0%) |
| 8 or more Rooms | 101 (29.8%) | 4 (9.3%) |
| Total | 339 (100.0%) | 43 (100.0%) |
Housing Structure by Heating Type in Montgomery
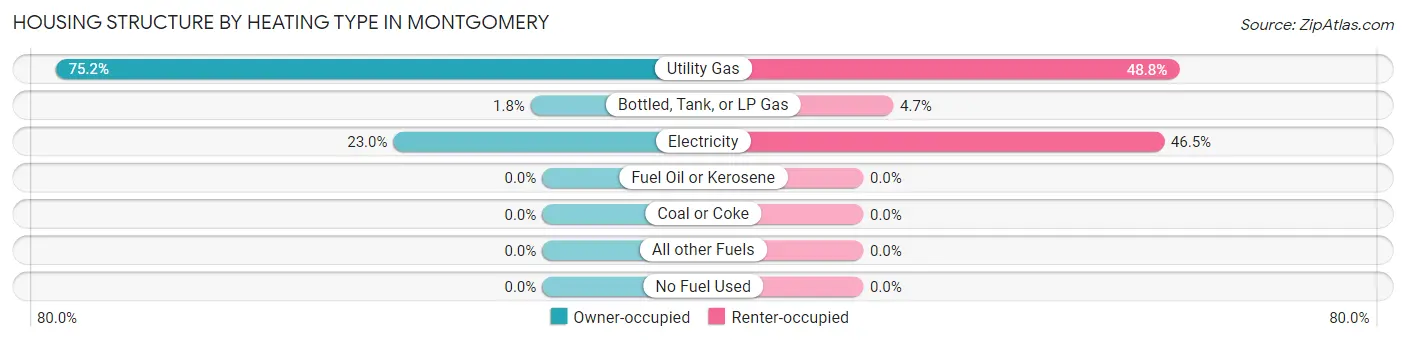
| Heating Type | Owner-occupied | Renter-occupied |
| Utility Gas | 255 (75.2%) | 21 (48.8%) |
| Bottled, Tank, or LP Gas | 6 (1.8%) | 2 (4.6%) |
| Electricity | 78 (23.0%) | 20 (46.5%) |
| Fuel Oil or Kerosene | 0 (0.0%) | 0 (0.0%) |
| Coal or Coke | 0 (0.0%) | 0 (0.0%) |
| All other Fuels | 0 (0.0%) | 0 (0.0%) |
| No Fuel Used | 0 (0.0%) | 0 (0.0%) |
| Total | 339 (100.0%) | 43 (100.0%) |
Household Vehicle Usage in Montgomery
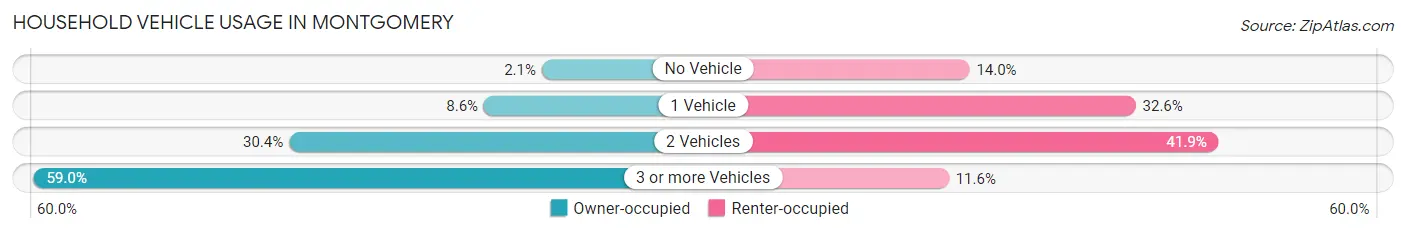
| Vehicles per Household | Owner-occupied | Renter-occupied |
| No Vehicle | 7 (2.1%) | 6 (14.0%) |
| 1 Vehicle | 29 (8.6%) | 14 (32.6%) |
| 2 Vehicles | 103 (30.4%) | 18 (41.9%) |
| 3 or more Vehicles | 200 (59.0%) | 5 (11.6%) |
| Total | 339 (100.0%) | 43 (100.0%) |
Real Estate & Mortgages in Montgomery
Real Estate and Mortgage Overview in Montgomery
| Characteristic | Without Mortgage | With Mortgage |
| Housing Units | 151 | 188 |
| Median Property Value | $183,500 | $225,900 |
| Median Household Income | $79,375 | $35 |
| Monthly Housing Costs | $454 | $0 |
| Real Estate Taxes | $871 | $1 |
Property Value by Mortgage Status in Montgomery
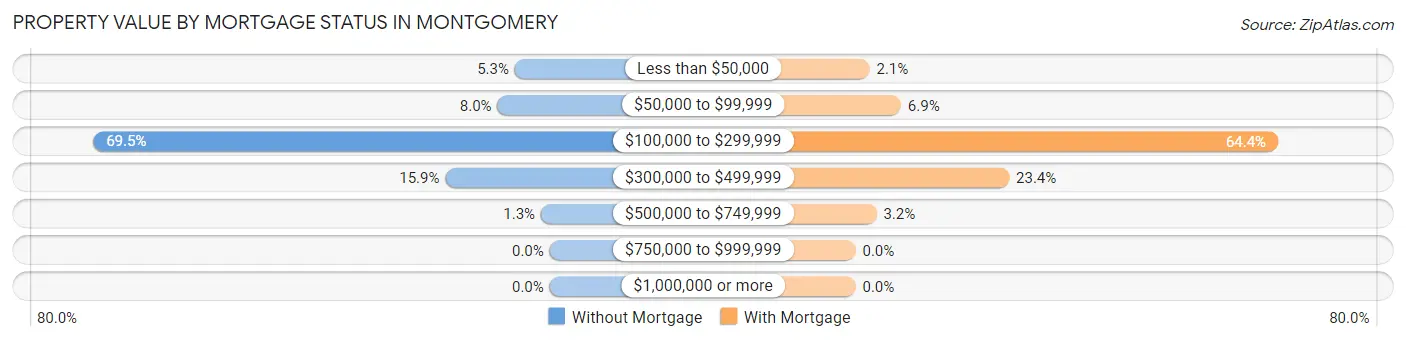
| Property Value | Without Mortgage | With Mortgage |
| Less than $50,000 | 8 (5.3%) | 4 (2.1%) |
| $50,000 to $99,999 | 12 (8.0%) | 13 (6.9%) |
| $100,000 to $299,999 | 105 (69.5%) | 121 (64.4%) |
| $300,000 to $499,999 | 24 (15.9%) | 44 (23.4%) |
| $500,000 to $749,999 | 2 (1.3%) | 6 (3.2%) |
| $750,000 to $999,999 | 0 (0.0%) | 0 (0.0%) |
| $1,000,000 or more | 0 (0.0%) | 0 (0.0%) |
| Total | 151 (100.0%) | 188 (100.0%) |
Household Income by Mortgage Status in Montgomery
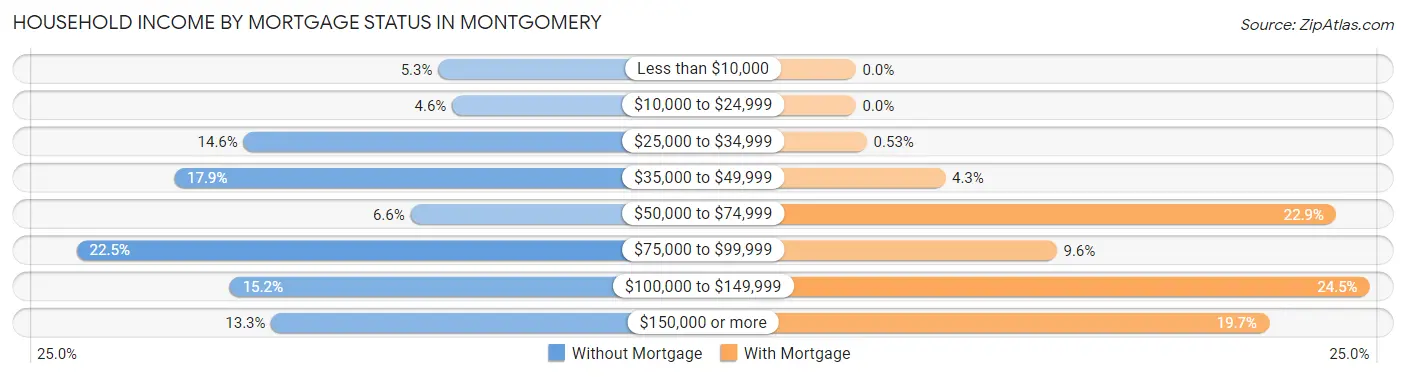
| Household Income | Without Mortgage | With Mortgage |
| Less than $10,000 | 8 (5.3%) | 0 (0.0%) |
| $10,000 to $24,999 | 7 (4.6%) | 0 (0.0%) |
| $25,000 to $34,999 | 22 (14.6%) | 1 (0.5%) |
| $35,000 to $49,999 | 27 (17.9%) | 8 (4.3%) |
| $50,000 to $74,999 | 10 (6.6%) | 43 (22.9%) |
| $75,000 to $99,999 | 34 (22.5%) | 18 (9.6%) |
| $100,000 to $149,999 | 23 (15.2%) | 46 (24.5%) |
| $150,000 or more | 20 (13.3%) | 37 (19.7%) |
| Total | 151 (100.0%) | 188 (100.0%) |
Property Value to Household Income Ratio in Montgomery
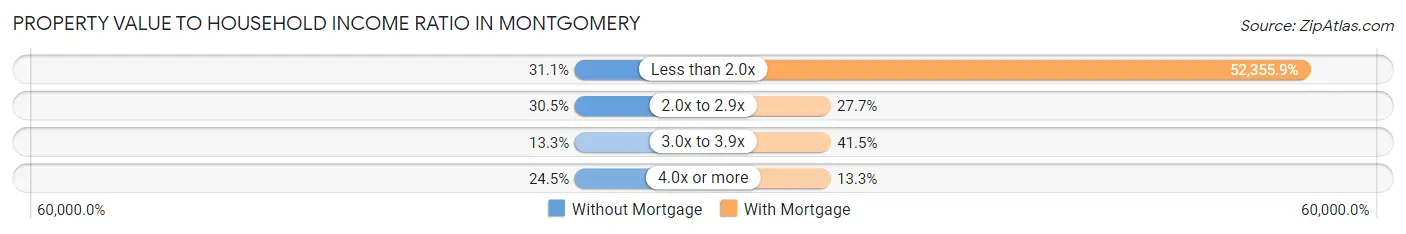
| Value-to-Income Ratio | Without Mortgage | With Mortgage |
| Less than 2.0x | 47 (31.1%) | 98,429 (52,355.8%) |
| 2.0x to 2.9x | 46 (30.5%) | 52 (27.7%) |
| 3.0x to 3.9x | 20 (13.3%) | 78 (41.5%) |
| 4.0x or more | 37 (24.5%) | 25 (13.3%) |
| Total | 151 (100.0%) | 188 (100.0%) |
Real Estate Taxes by Mortgage Status in Montgomery
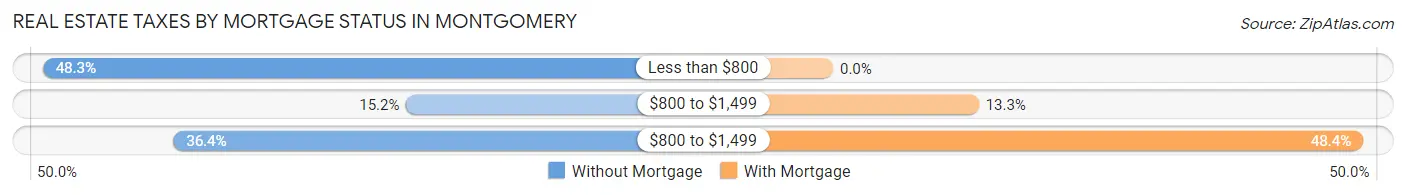
| Property Taxes | Without Mortgage | With Mortgage |
| Less than $800 | 73 (48.3%) | 0 (0.0%) |
| $800 to $1,499 | 23 (15.2%) | 25 (13.3%) |
| $800 to $1,499 | 55 (36.4%) | 91 (48.4%) |
| Total | 151 (100.0%) | 188 (100.0%) |
Health & Disability in Montgomery
Health Insurance Coverage by Age in Montgomery
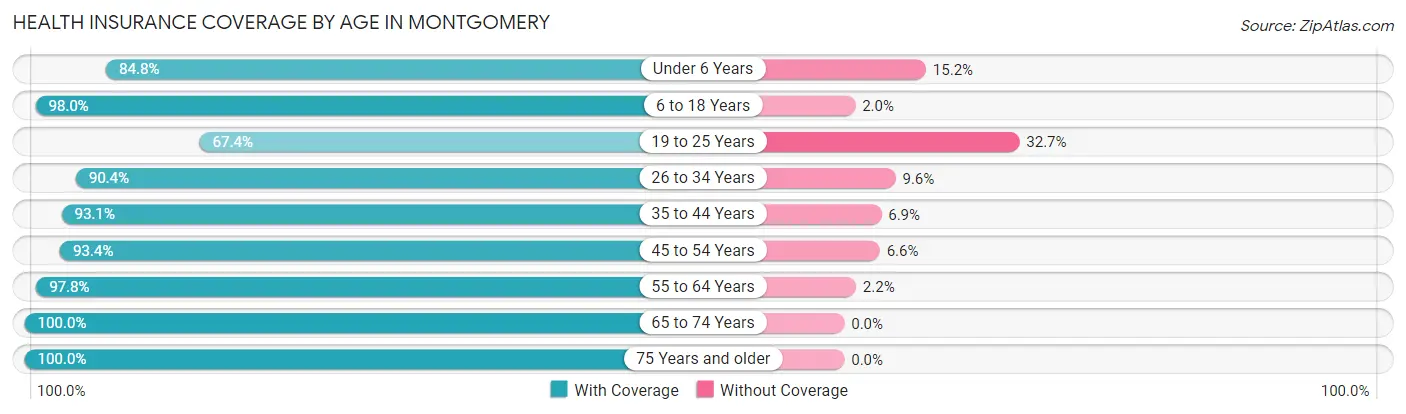
| Age Bracket | With Coverage | Without Coverage |
| Under 6 Years | 39 (84.8%) | 7 (15.2%) |
| 6 to 18 Years | 145 (98.0%) | 3 (2.0%) |
| 19 to 25 Years | 33 (67.3%) | 16 (32.7%) |
| 26 to 34 Years | 123 (90.4%) | 13 (9.6%) |
| 35 to 44 Years | 81 (93.1%) | 6 (6.9%) |
| 45 to 54 Years | 99 (93.4%) | 7 (6.6%) |
| 55 to 64 Years | 270 (97.8%) | 6 (2.2%) |
| 65 to 74 Years | 155 (100.0%) | 0 (0.0%) |
| 75 Years and older | 60 (100.0%) | 0 (0.0%) |
| Total | 1,005 (94.5%) | 58 (5.5%) |
Health Insurance Coverage by Citizenship Status in Montgomery
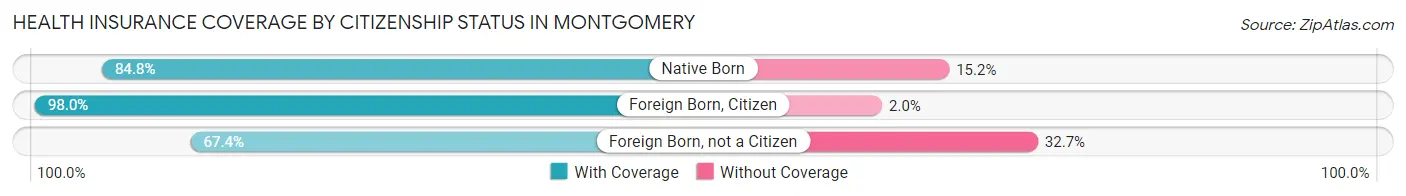
| Citizenship Status | With Coverage | Without Coverage |
| Native Born | 39 (84.8%) | 7 (15.2%) |
| Foreign Born, Citizen | 145 (98.0%) | 3 (2.0%) |
| Foreign Born, not a Citizen | 33 (67.3%) | 16 (32.7%) |
Health Insurance Coverage by Household Income in Montgomery
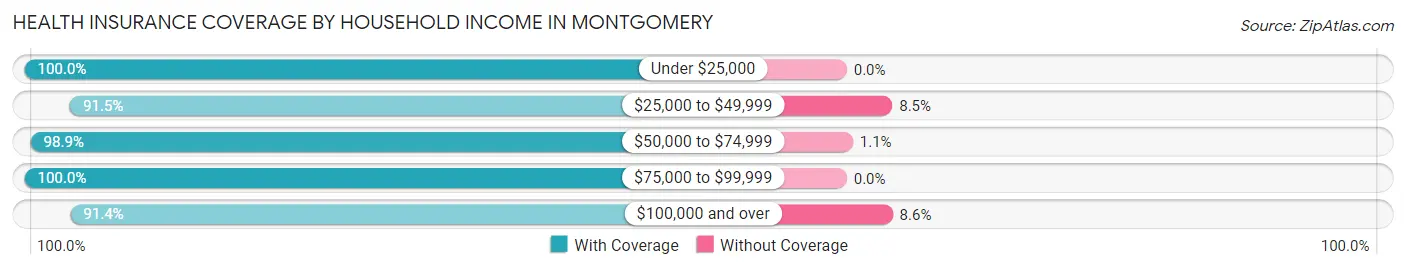
| Household Income | With Coverage | Without Coverage |
| Under $25,000 | 28 (100.0%) | 0 (0.0%) |
| $25,000 to $49,999 | 247 (91.5%) | 23 (8.5%) |
| $50,000 to $74,999 | 87 (98.9%) | 1 (1.1%) |
| $75,000 to $99,999 | 281 (100.0%) | 0 (0.0%) |
| $100,000 and over | 362 (91.4%) | 34 (8.6%) |
Public vs Private Health Insurance Coverage by Age in Montgomery
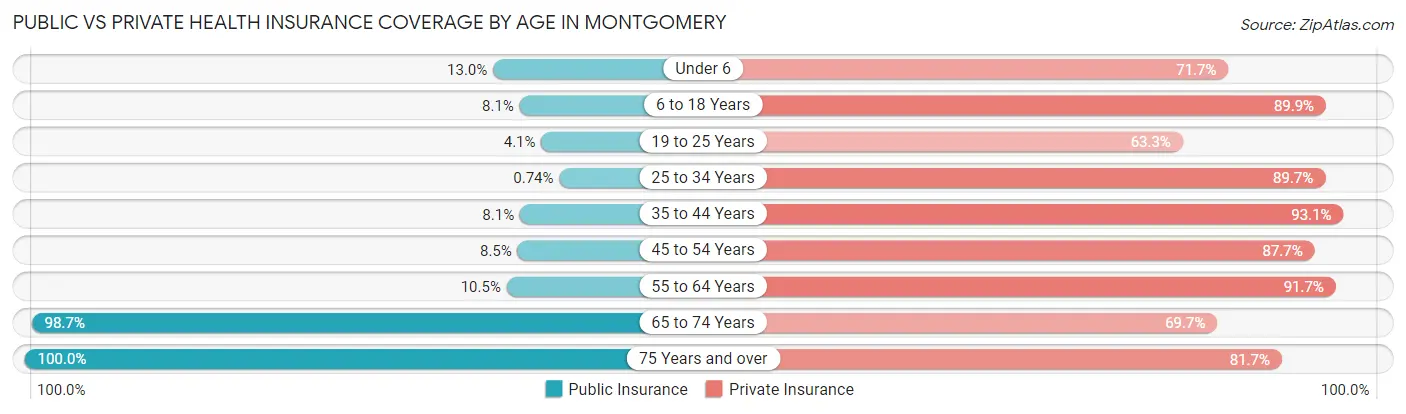
| Age Bracket | Public Insurance | Private Insurance |
| Under 6 | 6 (13.0%) | 33 (71.7%) |
| 6 to 18 Years | 12 (8.1%) | 133 (89.9%) |
| 19 to 25 Years | 2 (4.1%) | 31 (63.3%) |
| 25 to 34 Years | 1 (0.7%) | 122 (89.7%) |
| 35 to 44 Years | 7 (8.1%) | 81 (93.1%) |
| 45 to 54 Years | 9 (8.5%) | 93 (87.7%) |
| 55 to 64 Years | 29 (10.5%) | 253 (91.7%) |
| 65 to 74 Years | 153 (98.7%) | 108 (69.7%) |
| 75 Years and over | 60 (100.0%) | 49 (81.7%) |
| Total | 279 (26.3%) | 903 (85.0%) |
Disability Status by Sex by Age in Montgomery
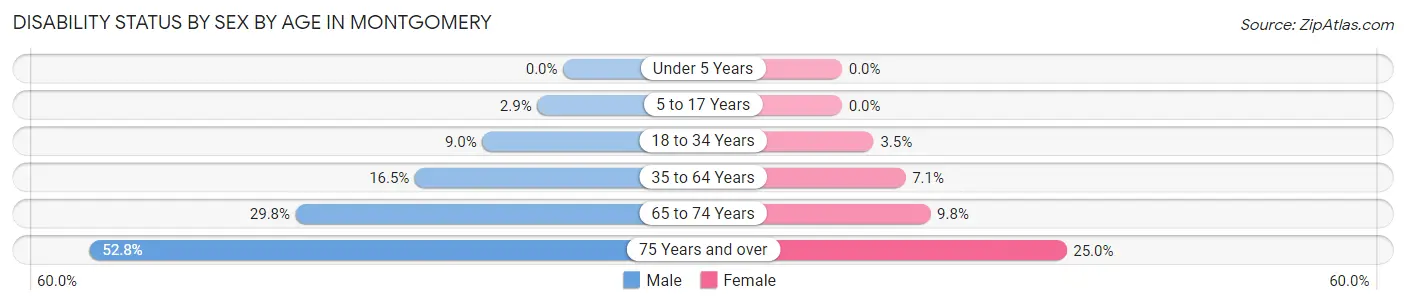
| Age Bracket | Male | Female |
| Under 5 Years | 0 (0.0%) | 0 (0.0%) |
| 5 to 17 Years | 3 (2.9%) | 0 (0.0%) |
| 18 to 34 Years | 9 (9.0%) | 3 (3.5%) |
| 35 to 64 Years | 33 (16.5%) | 19 (7.1%) |
| 65 to 74 Years | 28 (29.8%) | 6 (9.8%) |
| 75 Years and over | 19 (52.8%) | 6 (25.0%) |
Disability Class by Sex by Age in Montgomery
Disability Class: Hearing Difficulty
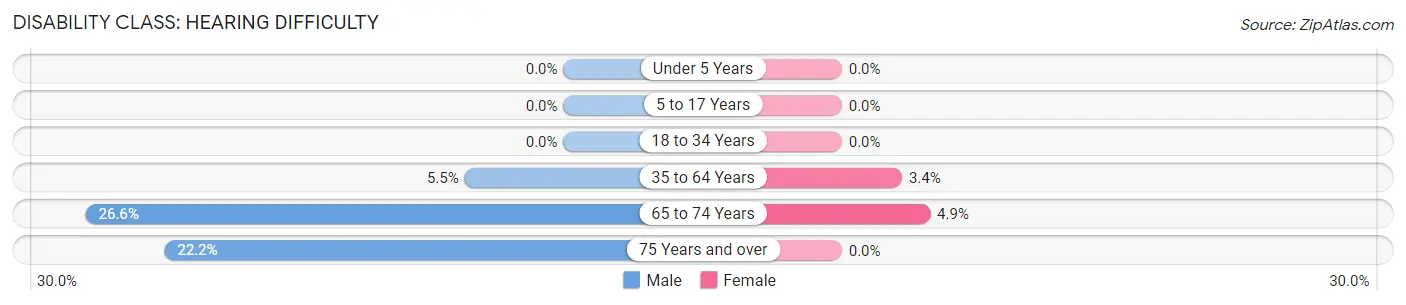
| Age Bracket | Male | Female |
| Under 5 Years | 0 (0.0%) | 0 (0.0%) |
| 5 to 17 Years | 0 (0.0%) | 0 (0.0%) |
| 18 to 34 Years | 0 (0.0%) | 0 (0.0%) |
| 35 to 64 Years | 11 (5.5%) | 9 (3.4%) |
| 65 to 74 Years | 25 (26.6%) | 3 (4.9%) |
| 75 Years and over | 8 (22.2%) | 0 (0.0%) |
Disability Class: Vision Difficulty
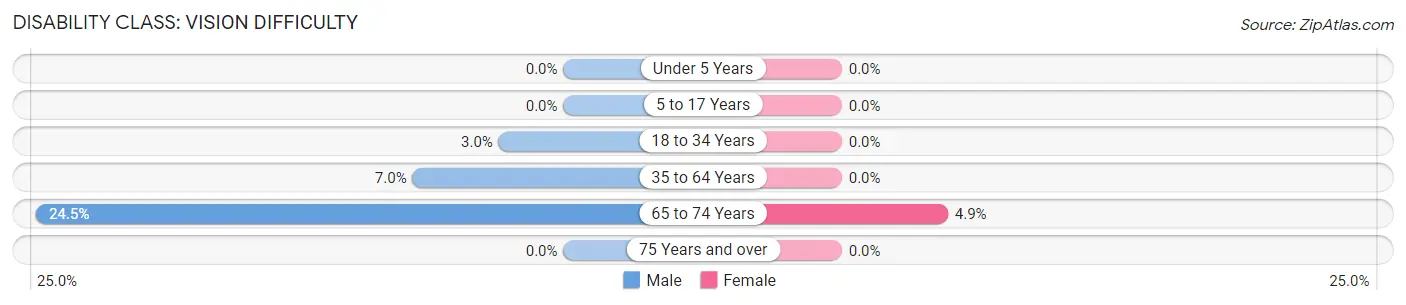
| Age Bracket | Male | Female |
| Under 5 Years | 0 (0.0%) | 0 (0.0%) |
| 5 to 17 Years | 0 (0.0%) | 0 (0.0%) |
| 18 to 34 Years | 3 (3.0%) | 0 (0.0%) |
| 35 to 64 Years | 14 (7.0%) | 0 (0.0%) |
| 65 to 74 Years | 23 (24.5%) | 3 (4.9%) |
| 75 Years and over | 0 (0.0%) | 0 (0.0%) |
Disability Class: Cognitive Difficulty
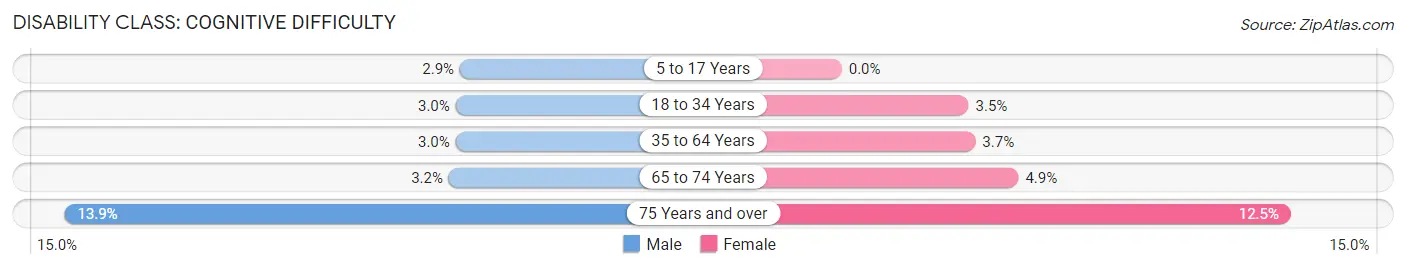
| Age Bracket | Male | Female |
| 5 to 17 Years | 3 (2.9%) | 0 (0.0%) |
| 18 to 34 Years | 3 (3.0%) | 3 (3.5%) |
| 35 to 64 Years | 6 (3.0%) | 10 (3.7%) |
| 65 to 74 Years | 3 (3.2%) | 3 (4.9%) |
| 75 Years and over | 5 (13.9%) | 3 (12.5%) |
Disability Class: Ambulatory Difficulty
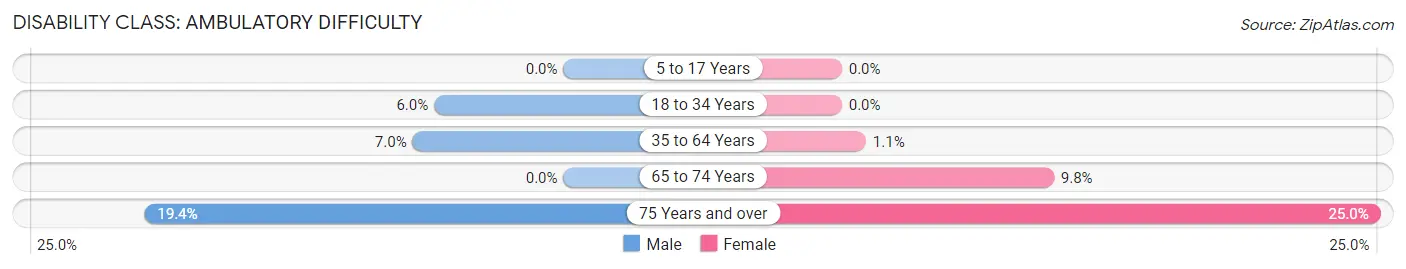
| Age Bracket | Male | Female |
| 5 to 17 Years | 0 (0.0%) | 0 (0.0%) |
| 18 to 34 Years | 6 (6.0%) | 0 (0.0%) |
| 35 to 64 Years | 14 (7.0%) | 3 (1.1%) |
| 65 to 74 Years | 0 (0.0%) | 6 (9.8%) |
| 75 Years and over | 7 (19.4%) | 6 (25.0%) |
Disability Class: Self-Care Difficulty
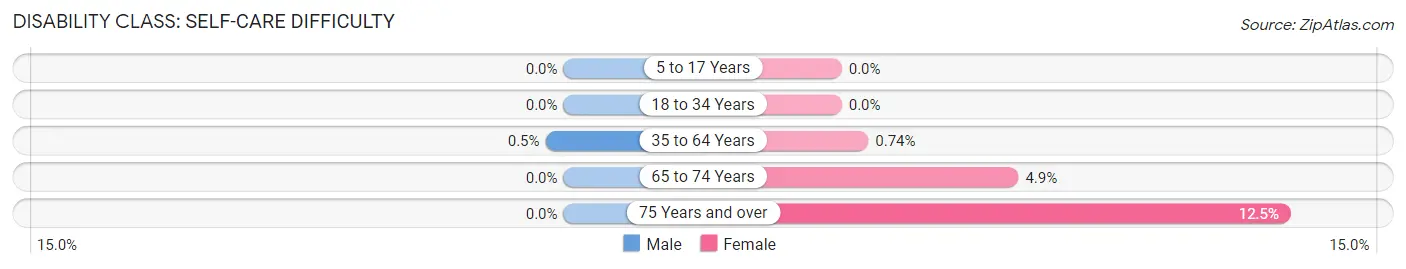
| Age Bracket | Male | Female |
| 5 to 17 Years | 0 (0.0%) | 0 (0.0%) |
| 18 to 34 Years | 0 (0.0%) | 0 (0.0%) |
| 35 to 64 Years | 1 (0.5%) | 2 (0.7%) |
| 65 to 74 Years | 0 (0.0%) | 3 (4.9%) |
| 75 Years and over | 0 (0.0%) | 3 (12.5%) |
Technology Access in Montgomery
Computing Device Access in Montgomery
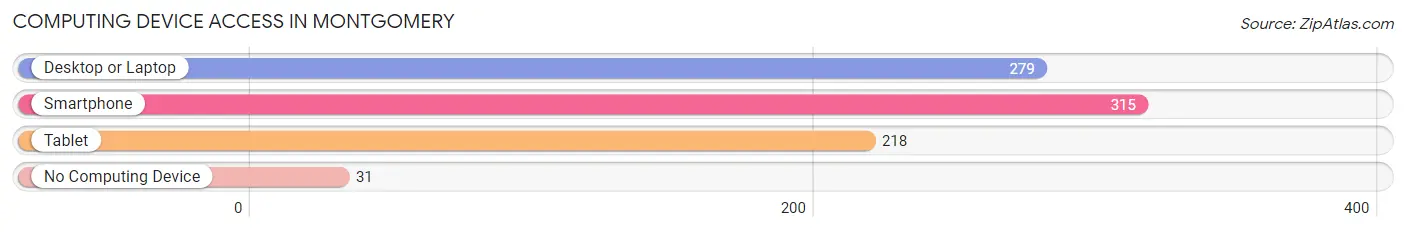
| Device Type | # Households | % Households |
| Desktop or Laptop | 279 | 73.0% |
| Smartphone | 315 | 82.5% |
| Tablet | 218 | 57.1% |
| No Computing Device | 31 | 8.1% |
| Total | 382 | 100.0% |
Internet Access in Montgomery
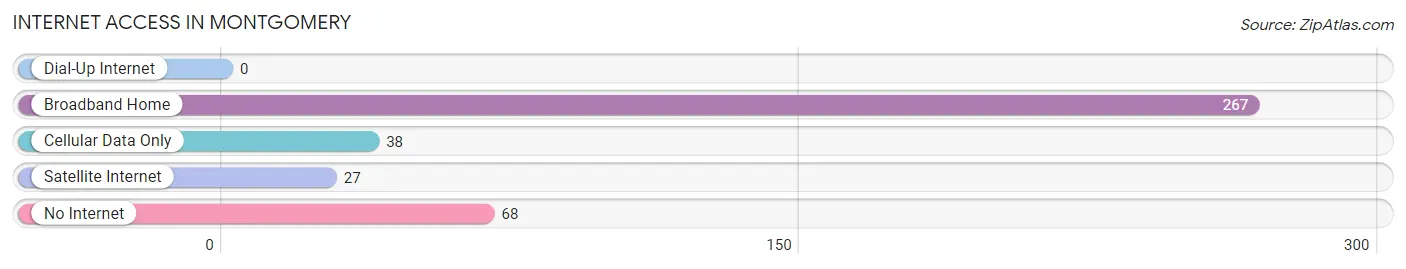
| Internet Type | # Households | % Households |
| Dial-Up Internet | 0 | 0.0% |
| Broadband Home | 267 | 69.9% |
| Cellular Data Only | 38 | 10.0% |
| Satellite Internet | 27 | 7.1% |
| No Internet | 68 | 17.8% |
| Total | 382 | 100.0% |
Montgomery Summary
Montgomery, Indiana is a small town located in Daviess County, Indiana. It is situated on the banks of the White River and is part of the greater metropolitan area of Evansville, Indiana. The town has a population of approximately 1,500 people and is known for its rural charm and small-town atmosphere.
History
Montgomery was founded in 1817 by a group of settlers from Kentucky. The town was named after Richard Montgomery, a Revolutionary War hero. The town was originally a farming community, but it soon developed into a small industrial center. The first industry in the town was a sawmill, which was built in 1820. The sawmill was followed by a gristmill, a woolen mill, and a tannery.
In 1851, the railroad arrived in Montgomery, connecting the town to the larger cities of Evansville and Indianapolis. This allowed the town to become a major shipping center for the surrounding area. The railroad also brought new businesses to the town, including a furniture factory, a brickyard, and a canning factory.
Geography
Montgomery is located in the southwestern corner of Indiana, about 30 miles from Evansville. The town is situated on the banks of the White River, which flows through the town and provides a scenic backdrop. The town is surrounded by rolling hills and farmland, and is home to several parks and recreational areas.
Economy
Montgomery’s economy is largely based on agriculture and manufacturing. The town is home to several large farms, which produce corn, soybeans, and other crops. The town also has several manufacturing plants, including a furniture factory, a brickyard, and a canning factory.
The town also has several small businesses, including restaurants, shops, and other services. The town is also home to several small businesses, such as a local newspaper, a hardware store, and a grocery store.
Demographics
As of the 2010 census, Montgomery had a population of 1,500 people. The town is predominantly white, with a small African American population. The median household income in the town is $37,000, and the median home value is $90,000.
The town is served by the Montgomery Community School Corporation, which includes two elementary schools, a middle school, and a high school. The town also has several churches, including the First Baptist Church, the First United Methodist Church, and the Church of the Nazarene.
Conclusion
Montgomery, Indiana is a small town with a rich history and a strong sense of community. The town is home to several large farms and manufacturing plants, as well as several small businesses. The town is served by the Montgomery Community School Corporation, and is home to several churches. The town has a population of 1,500 people, and the median household income is $37,000. Montgomery is a great place to live and work, and is a great example of small-town America.
Common Questions
What is Per Capita Income in Montgomery?
Per Capita income in Montgomery is $32,766.
What is the Median Family Income in Montgomery?
Median Family Income in Montgomery is $89,444.
What is the Median Household income in Montgomery?
Median Household Income in Montgomery is $81,364.
What is Income or Wage Gap in Montgomery?
Income or Wage Gap in Montgomery is 22.0%.
Women in Montgomery earn 78.0 cents for every dollar earned by a man.
What is Inequality or Gini Index in Montgomery?
Inequality or Gini Index in Montgomery is 0.38.
What is the Total Population of Montgomery?
Total Population of Montgomery is 1,063.
What is the Total Male Population of Montgomery?
Total Male Population of Montgomery is 574.
What is the Total Female Population of Montgomery?
Total Female Population of Montgomery is 489.
What is the Ratio of Males per 100 Females in Montgomery?
There are 117.38 Males per 100 Females in Montgomery.
What is the Ratio of Females per 100 Males in Montgomery?
There are 85.19 Females per 100 Males in Montgomery.
What is the Median Population Age in Montgomery?
Median Population Age in Montgomery is 50.5 Years.
What is the Average Family Size in Montgomery
Average Family Size in Montgomery is 3.0 People.
What is the Average Household Size in Montgomery
Average Household Size in Montgomery is 2.8 People.
How Large is the Labor Force in Montgomery?
There are 558 People in the Labor Forcein in Montgomery.
What is the Percentage of People in the Labor Force in Montgomery?
59.4% of People are in the Labor Force in Montgomery.
What is the Unemployment Rate in Montgomery?
Unemployment Rate in Montgomery is 0.4%.