Monroe City, IN Map & Demographics
Monroe City Map
Monroe City Overview
$27,785
PER CAPITA INCOME
$68,421
AVG FAMILY INCOME
$54,375
AVG HOUSEHOLD INCOME
24.5%
WAGE / INCOME GAP [ % ]
75.5¢/ $1
WAGE / INCOME GAP [ $ ]
0.45
INEQUALITY / GINI INDEX
867
TOTAL POPULATION
405
MALE POPULATION
462
FEMALE POPULATION
87.66
MALES / 100 FEMALES
114.07
FEMALES / 100 MALES
33.8
MEDIAN AGE
3.1
AVG FAMILY SIZE
2.5
AVG HOUSEHOLD SIZE
391
LABOR FORCE [ PEOPLE ]
61.5%
PERCENT IN LABOR FORCE
Monroe City Zip Codes
Monroe City Area Codes
Income in Monroe City
Income Overview in Monroe City
Per Capita Income in Monroe City is $27,785, while median incomes of families and households are $68,421 and $54,375 respectively.
| Characteristic | Number | Measure |
| Per Capita Income | 867 | $27,785 |
| Median Family Income | 228 | $68,421 |
| Mean Family Income | 228 | $72,786 |
| Median Household Income | 341 | $54,375 |
| Mean Household Income | 341 | $70,884 |
| Income Deficit | 228 | $0 |
| Wage / Income Gap (%) | 867 | 24.55% |
| Wage / Income Gap ($) | 867 | 75.45¢ per $1 |
| Gini / Inequality Index | 867 | 0.45 |
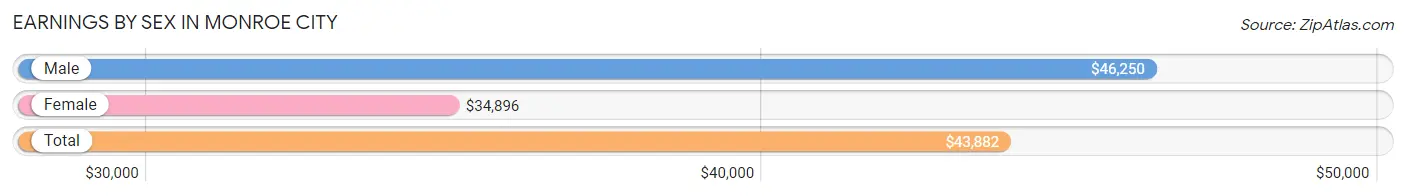
Earnings by Sex in Monroe City
Average Earnings in Monroe City are $43,882, $46,250 for men and $34,896 for women, a difference of 24.5%.
| Sex | Number | Average Earnings |
| Male | 191 (48.5%) | $46,250 |
| Female | 203 (51.5%) | $34,896 |
| Total | 394 (100.0%) | $43,882 |
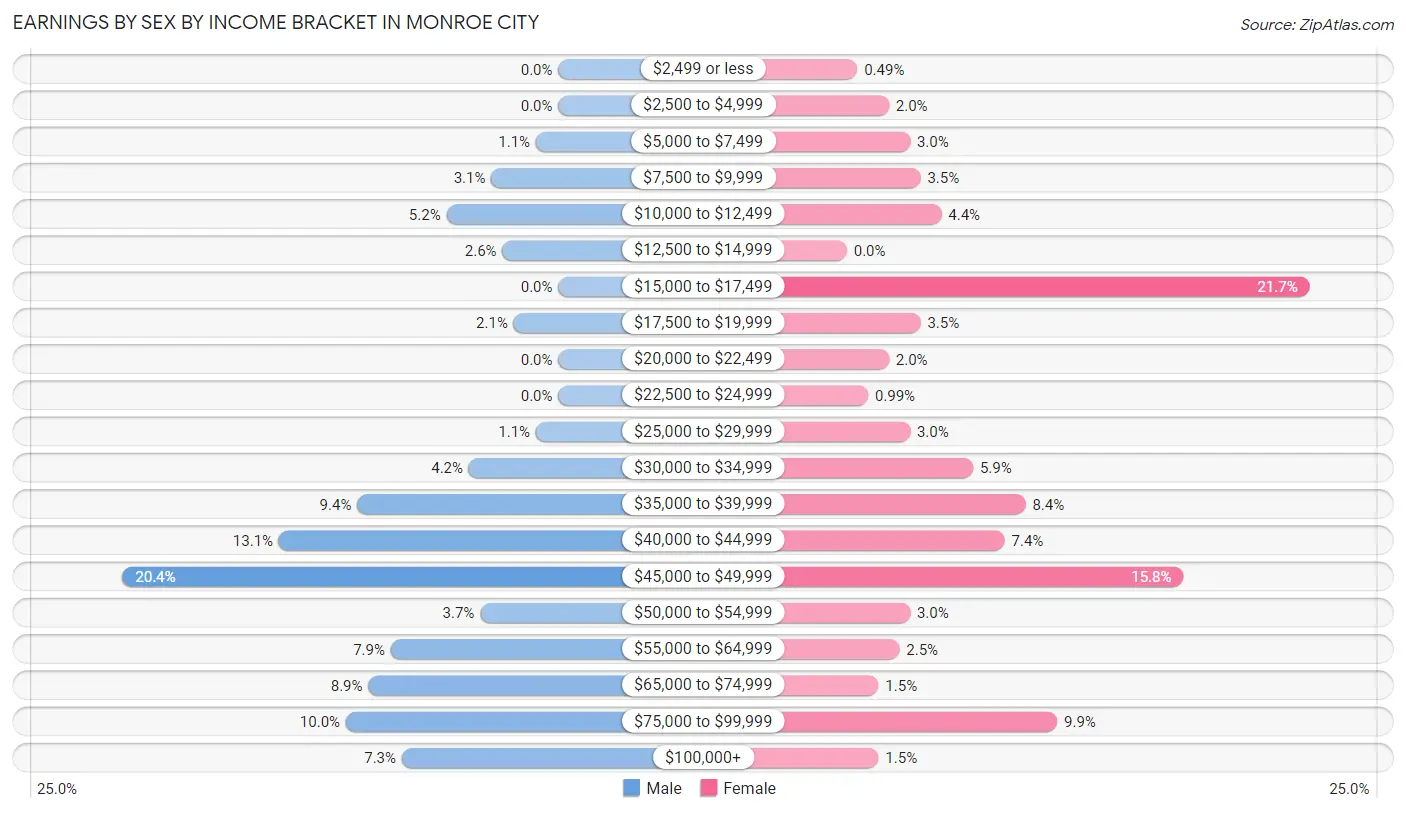
Earnings by Sex by Income Bracket in Monroe City
The most common earnings brackets in Monroe City are $45,000 to $49,999 for men (39 | 20.4%) and $15,000 to $17,499 for women (44 | 21.7%).
| Income | Male | Female |
| $2,499 or less | 0 (0.0%) | 1 (0.5%) |
| $2,500 to $4,999 | 0 (0.0%) | 4 (2.0%) |
| $5,000 to $7,499 | 2 (1.1%) | 6 (3.0%) |
| $7,500 to $9,999 | 6 (3.1%) | 7 (3.5%) |
| $10,000 to $12,499 | 10 (5.2%) | 9 (4.4%) |
| $12,500 to $14,999 | 5 (2.6%) | 0 (0.0%) |
| $15,000 to $17,499 | 0 (0.0%) | 44 (21.7%) |
| $17,500 to $19,999 | 4 (2.1%) | 7 (3.5%) |
| $20,000 to $22,499 | 0 (0.0%) | 4 (2.0%) |
| $22,500 to $24,999 | 0 (0.0%) | 2 (1.0%) |
| $25,000 to $29,999 | 2 (1.1%) | 6 (3.0%) |
| $30,000 to $34,999 | 8 (4.2%) | 12 (5.9%) |
| $35,000 to $39,999 | 18 (9.4%) | 17 (8.4%) |
| $40,000 to $44,999 | 25 (13.1%) | 15 (7.4%) |
| $45,000 to $49,999 | 39 (20.4%) | 32 (15.8%) |
| $50,000 to $54,999 | 7 (3.7%) | 6 (3.0%) |
| $55,000 to $64,999 | 15 (7.9%) | 5 (2.5%) |
| $65,000 to $74,999 | 17 (8.9%) | 3 (1.5%) |
| $75,000 to $99,999 | 19 (10.0%) | 20 (9.9%) |
| $100,000+ | 14 (7.3%) | 3 (1.5%) |
| Total | 191 (100.0%) | 203 (100.0%) |
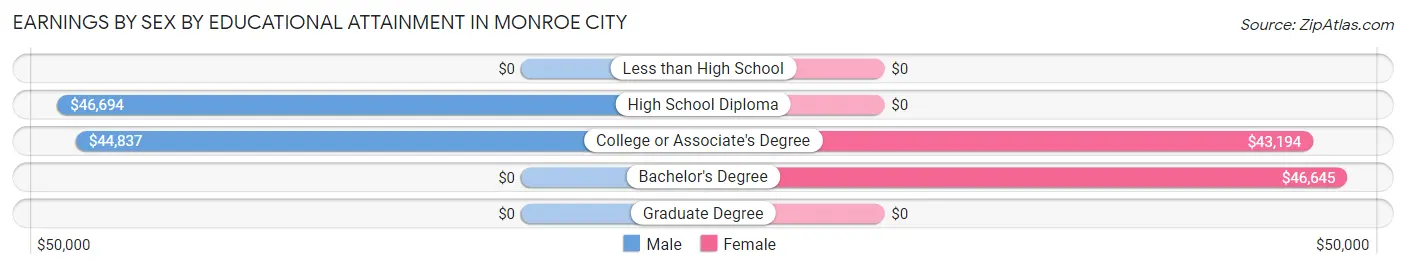
Earnings by Sex by Educational Attainment in Monroe City
Average earnings in Monroe City are $46,613 for men and $37,411 for women, a difference of 19.7%. Men with an educational attainment of high school diploma enjoy the highest average annual earnings of $46,694, while those with college or associate's degree education earn the least with $44,837. Women with an educational attainment of bachelor's degree earn the most with the average annual earnings of $46,645, while those with college or associate's degree education have the smallest earnings of $43,194.
| Educational Attainment | Male Income | Female Income |
| Less than High School | - | - |
| High School Diploma | $46,694 | $0 |
| College or Associate's Degree | $44,837 | $43,194 |
| Bachelor's Degree | - | - |
| Graduate Degree | - | - |
| Total | $46,613 | $37,411 |
Family Income in Monroe City
Family Income Brackets in Monroe City
According to the Monroe City family income data, there are 54 families falling into the $75,000 to $99,999 income range, which is the most common income bracket and makes up 23.7% of all families.
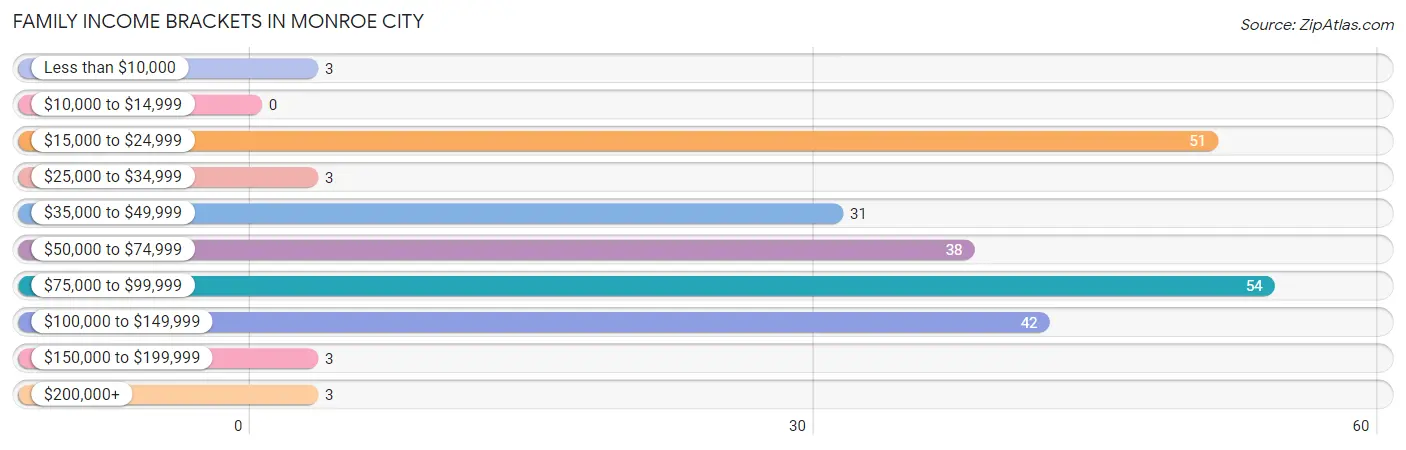
| Income Bracket | # Families | % Families |
| Less than $10,000 | 3 | 1.3% |
| $10,000 to $14,999 | 0 | 0.0% |
| $15,000 to $24,999 | 51 | 22.4% |
| $25,000 to $34,999 | 3 | 1.3% |
| $35,000 to $49,999 | 31 | 13.6% |
| $50,000 to $74,999 | 38 | 16.7% |
| $75,000 to $99,999 | 54 | 23.7% |
| $100,000 to $149,999 | 42 | 18.4% |
| $150,000 to $199,999 | 3 | 1.3% |
| $200,000+ | 3 | 1.3% |
Family Income by Famaliy Size in Monroe City
2-person families (105 | 46.1%) account for the highest median family income in Monroe City with $83,750 per family, while 2-person families (105 | 46.1%) have the highest median income of $41,875 per family member.
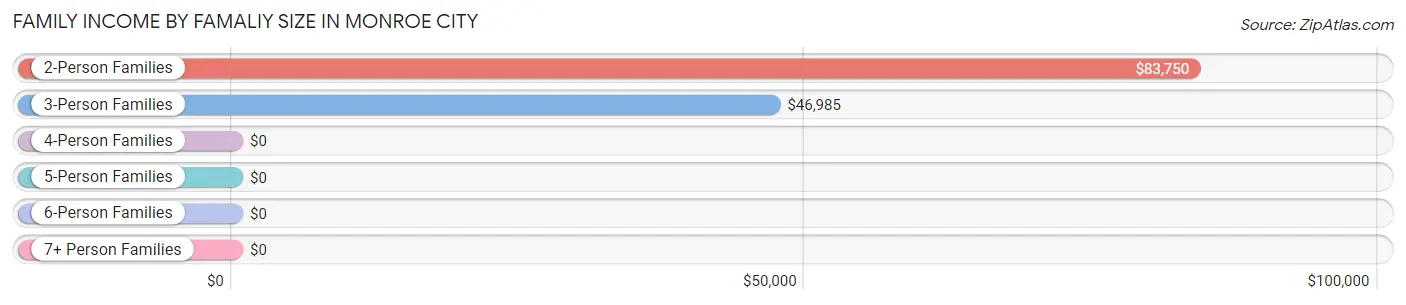
| Income Bracket | # Families | Median Income |
| 2-Person Families | 105 (46.1%) | $83,750 |
| 3-Person Families | 27 (11.8%) | $46,985 |
| 4-Person Families | 81 (35.5%) | $0 |
| 5-Person Families | 12 (5.3%) | $0 |
| 6-Person Families | 3 (1.3%) | $0 |
| 7+ Person Families | 0 (0.0%) | $0 |
| Total | 228 (100.0%) | $68,421 |
Family Income by Number of Earners in Monroe City
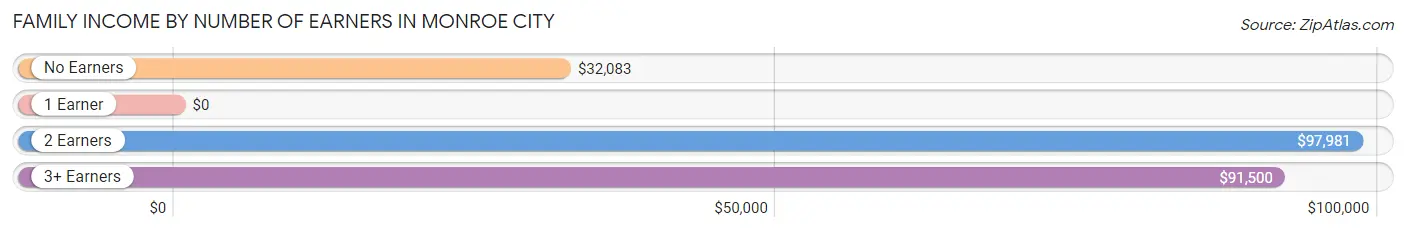
| Number of Earners | # Families | Median Income |
| No Earners | 25 (11.0%) | $32,083 |
| 1 Earner | 98 (43.0%) | $0 |
| 2 Earners | 89 (39.0%) | $97,981 |
| 3+ Earners | 16 (7.0%) | $91,500 |
| Total | 228 (100.0%) | $68,421 |
Household Income in Monroe City
Household Income Brackets in Monroe City
With 85 households falling in the category, the $15,000 to $24,999 income range is the most frequent in Monroe City, accounting for 24.9% of all households. In contrast, only 4 households (1.2%) fall into the $150,000 to $199,999 income bracket, making it the least populous group.
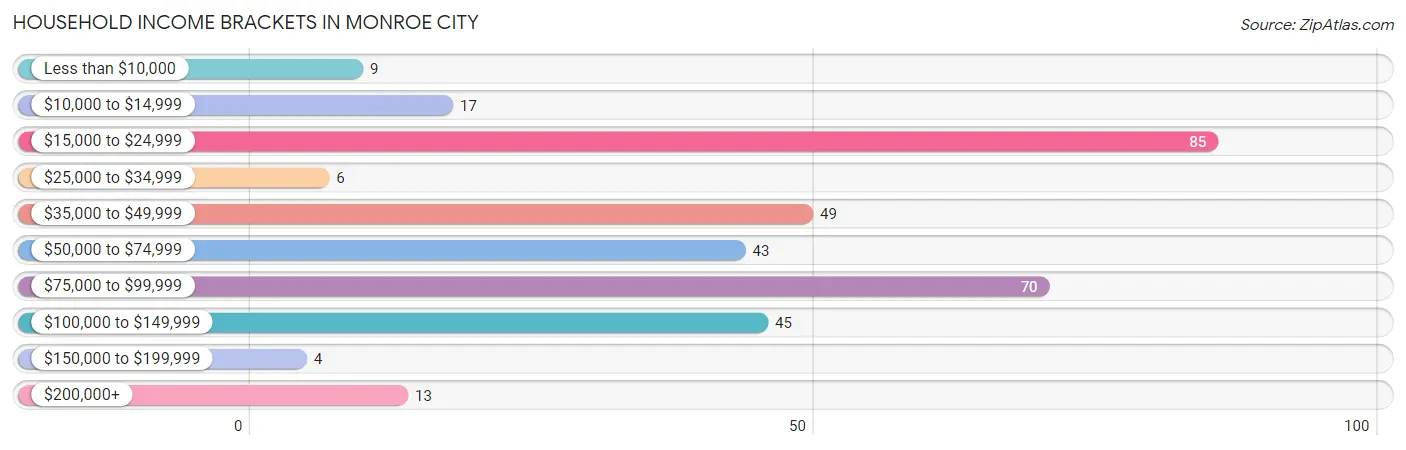
| Income Bracket | # Households | % Households |
| Less than $10,000 | 9 | 2.6% |
| $10,000 to $14,999 | 17 | 5.0% |
| $15,000 to $24,999 | 85 | 24.9% |
| $25,000 to $34,999 | 6 | 1.8% |
| $35,000 to $49,999 | 49 | 14.4% |
| $50,000 to $74,999 | 43 | 12.6% |
| $75,000 to $99,999 | 70 | 20.5% |
| $100,000 to $149,999 | 45 | 13.2% |
| $150,000 to $199,999 | 4 | 1.2% |
| $200,000+ | 13 | 3.8% |
Household Income by Householder Age in Monroe City
The median household income in Monroe City is $54,375, with the highest median household income of $68,618 found in the 25 to 44 years age bracket for the primary householder. A total of 151 households (44.3%) fall into this category. Meanwhile, the 15 to 24 years age bracket for the primary householder has the lowest median household income of $0, with 2 households (0.6%) in this group.
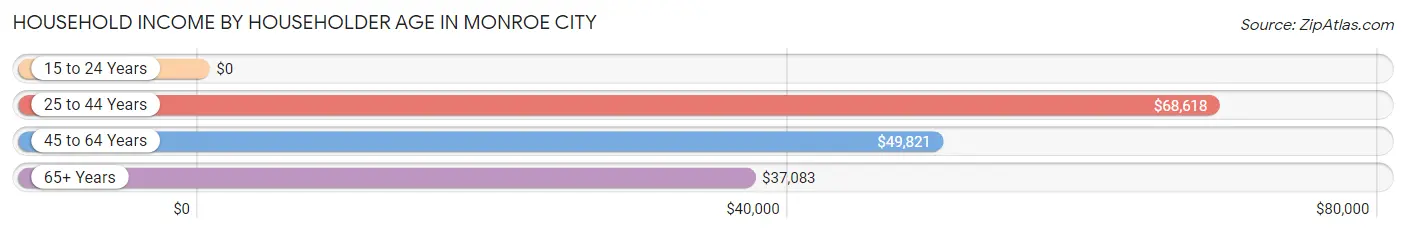
| Income Bracket | # Households | Median Income |
| 15 to 24 Years | 2 (0.6%) | $0 |
| 25 to 44 Years | 151 (44.3%) | $68,618 |
| 45 to 64 Years | 119 (34.9%) | $49,821 |
| 65+ Years | 69 (20.2%) | $37,083 |
| Total | 341 (100.0%) | $54,375 |
Poverty in Monroe City
Income Below Poverty by Sex and Age in Monroe City
With 30.7% poverty level for males and 26.5% for females among the residents of Monroe City, under 5 year old males and 12 to 14 year old females are the most vulnerable to poverty, with 38 males (86.4%) and 51 females (83.6%) in their respective age groups living below the poverty level.
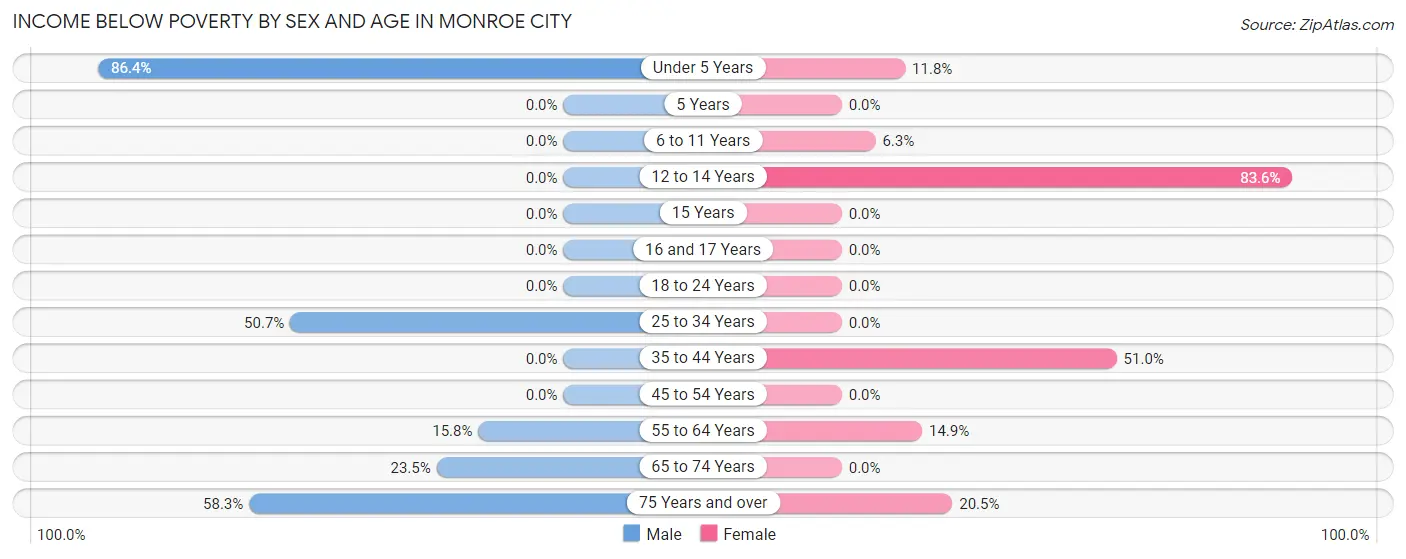
| Age Bracket | Male | Female |
| Under 5 Years | 38 (86.4%) | 2 (11.8%) |
| 5 Years | 0 (0.0%) | 0 (0.0%) |
| 6 to 11 Years | 0 (0.0%) | 2 (6.2%) |
| 12 to 14 Years | 0 (0.0%) | 51 (83.6%) |
| 15 Years | 0 (0.0%) | 0 (0.0%) |
| 16 and 17 Years | 0 (0.0%) | 0 (0.0%) |
| 18 to 24 Years | 0 (0.0%) | 0 (0.0%) |
| 25 to 34 Years | 71 (50.7%) | 0 (0.0%) |
| 35 to 44 Years | 0 (0.0%) | 50 (51.0%) |
| 45 to 54 Years | 0 (0.0%) | 0 (0.0%) |
| 55 to 64 Years | 3 (15.8%) | 7 (14.9%) |
| 65 to 74 Years | 4 (23.5%) | 0 (0.0%) |
| 75 Years and over | 7 (58.3%) | 8 (20.5%) |
| Total | 123 (30.7%) | 120 (26.5%) |
Income Above Poverty by Sex and Age in Monroe City
According to the poverty statistics in Monroe City, males aged 5 years and females aged 5 years are the age groups that are most secure financially, with 100.0% of males and 100.0% of females in these age groups living above the poverty line.
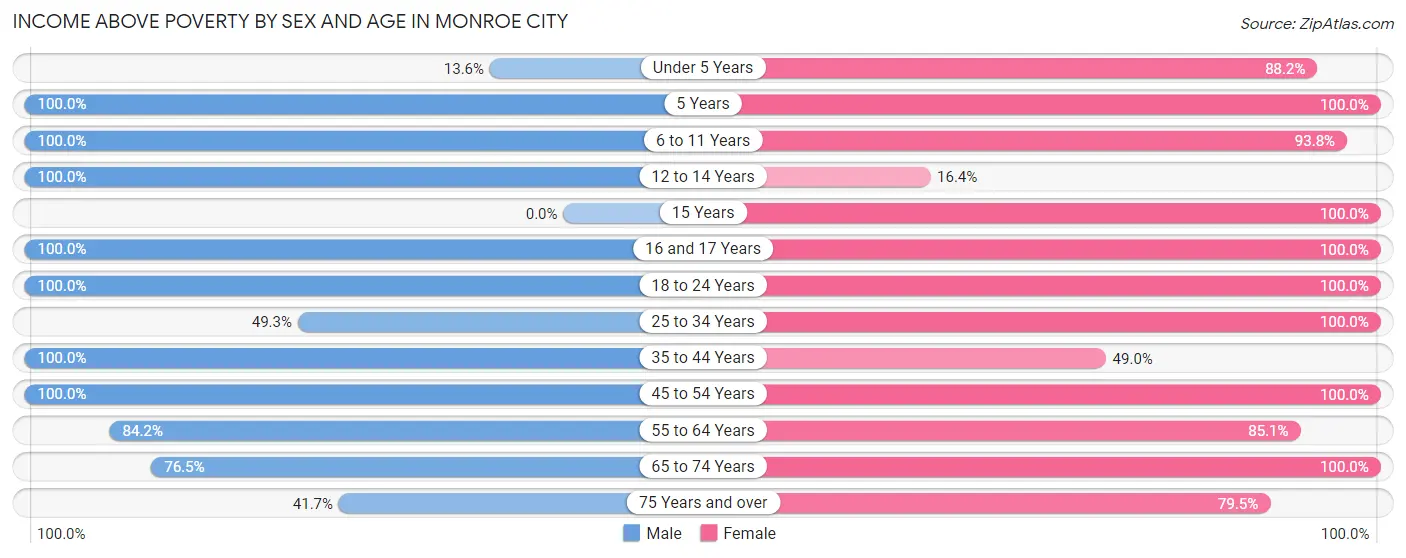
| Age Bracket | Male | Female |
| Under 5 Years | 6 (13.6%) | 15 (88.2%) |
| 5 Years | 19 (100.0%) | 5 (100.0%) |
| 6 to 11 Years | 18 (100.0%) | 30 (93.8%) |
| 12 to 14 Years | 13 (100.0%) | 10 (16.4%) |
| 15 Years | 0 (0.0%) | 8 (100.0%) |
| 16 and 17 Years | 17 (100.0%) | 10 (100.0%) |
| 18 to 24 Years | 4 (100.0%) | 22 (100.0%) |
| 25 to 34 Years | 69 (49.3%) | 28 (100.0%) |
| 35 to 44 Years | 59 (100.0%) | 48 (49.0%) |
| 45 to 54 Years | 38 (100.0%) | 58 (100.0%) |
| 55 to 64 Years | 16 (84.2%) | 40 (85.1%) |
| 65 to 74 Years | 13 (76.5%) | 28 (100.0%) |
| 75 Years and over | 5 (41.7%) | 31 (79.5%) |
| Total | 277 (69.3%) | 333 (73.5%) |
Income Below Poverty Among Married-Couple Families in Monroe City
The poverty statistics for married-couple families in Monroe City show that 31.3% or 52 of the total 166 families live below the poverty line. Families with 1 or 2 children have the highest poverty rate of 53.8%, comprising of 42 families. On the other hand, families with 3 or 4 children have the lowest poverty rate of 0.0%, which includes 0 families.
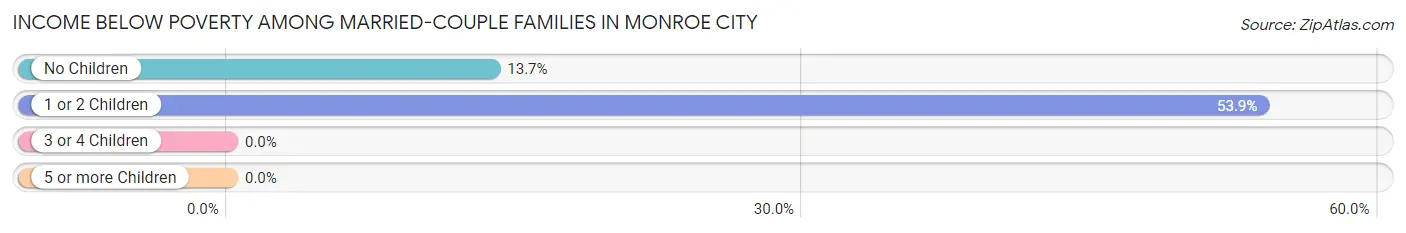
| Children | Above Poverty | Below Poverty |
| No Children | 63 (86.3%) | 10 (13.7%) |
| 1 or 2 Children | 36 (46.2%) | 42 (53.8%) |
| 3 or 4 Children | 15 (100.0%) | 0 (0.0%) |
| 5 or more Children | 0 (0.0%) | 0 (0.0%) |
| Total | 114 (68.7%) | 52 (31.3%) |
Income Below Poverty Among Single-Parent Households in Monroe City
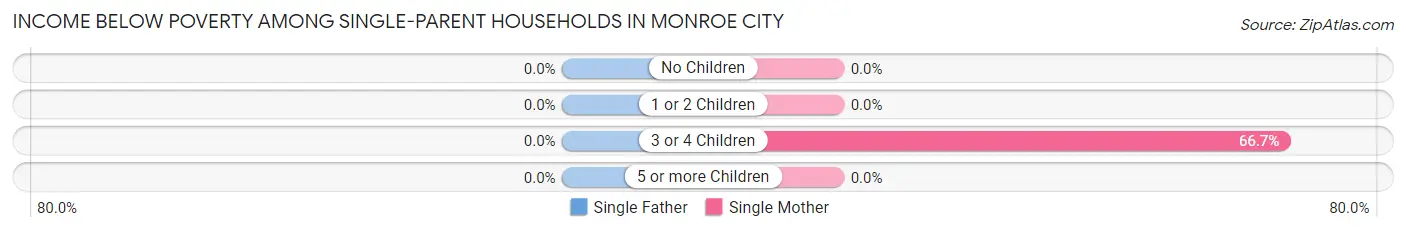
| Children | Single Father | Single Mother |
| No Children | 0 (0.0%) | 0 (0.0%) |
| 1 or 2 Children | 0 (0.0%) | 0 (0.0%) |
| 3 or 4 Children | 0 (0.0%) | 2 (66.7%) |
| 5 or more Children | 0 (0.0%) | 0 (0.0%) |
| Total | 0 (0.0%) | 2 (3.6%) |
Income Below Poverty Among Married-Couple vs Single-Parent Households in Monroe City
The poverty data for Monroe City shows that 52 of the married-couple family households (31.3%) and 2 of the single-parent households (3.2%) are living below the poverty level. Within the married-couple family households, those with 1 or 2 children have the highest poverty rate, with 42 households (53.8%) falling below the poverty line. Among the single-parent households, those with 3 or 4 children have the highest poverty rate, with 2 household (66.7%) living below poverty.
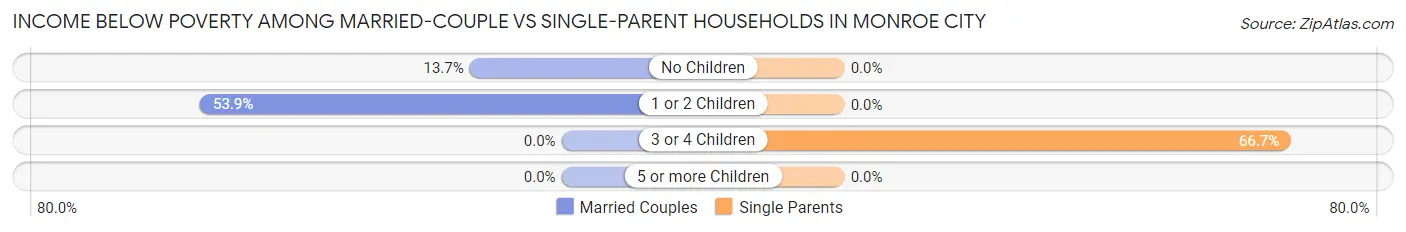
| Children | Married-Couple Families | Single-Parent Households |
| No Children | 10 (13.7%) | 0 (0.0%) |
| 1 or 2 Children | 42 (53.8%) | 0 (0.0%) |
| 3 or 4 Children | 0 (0.0%) | 2 (66.7%) |
| 5 or more Children | 0 (0.0%) | 0 (0.0%) |
| Total | 52 (31.3%) | 2 (3.2%) |
Race in Monroe City
The most populous races in Monroe City are White / Caucasian (855 | 98.6%), and Two or more Races (12 | 1.4%).
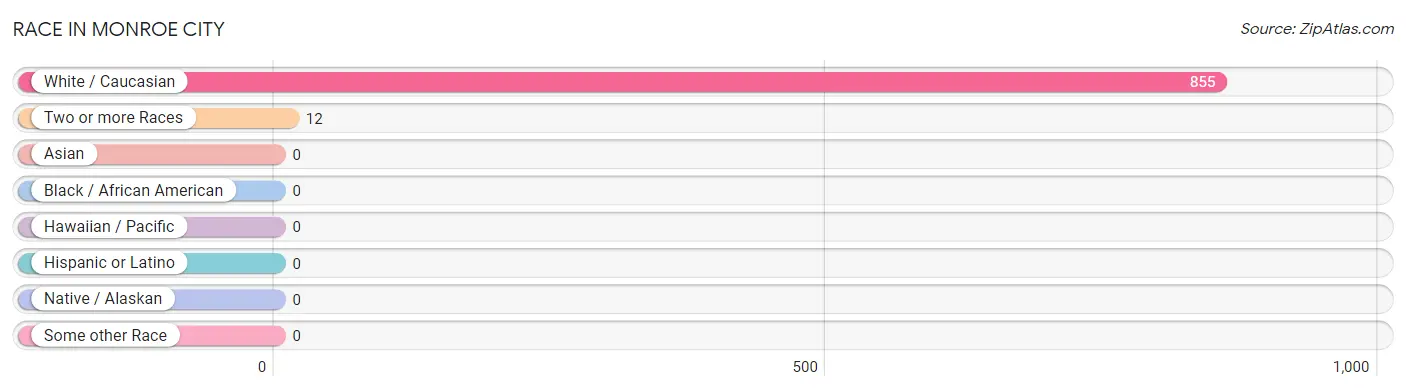
| Race | # Population | % Population |
| Asian | 0 | 0.0% |
| Black / African American | 0 | 0.0% |
| Hawaiian / Pacific | 0 | 0.0% |
| Hispanic or Latino | 0 | 0.0% |
| Native / Alaskan | 0 | 0.0% |
| White / Caucasian | 855 | 98.6% |
| Two or more Races | 12 | 1.4% |
| Some other Race | 0 | 0.0% |
| Total | 867 | 100.0% |
Ancestry in Monroe City
The most populous ancestries reported in Monroe City are German (447 | 51.6%), French (120 | 13.8%), English (101 | 11.7%), Irish (62 | 7.1%), and American (60 | 6.9%), together accounting for 91.1% of all Monroe City residents.
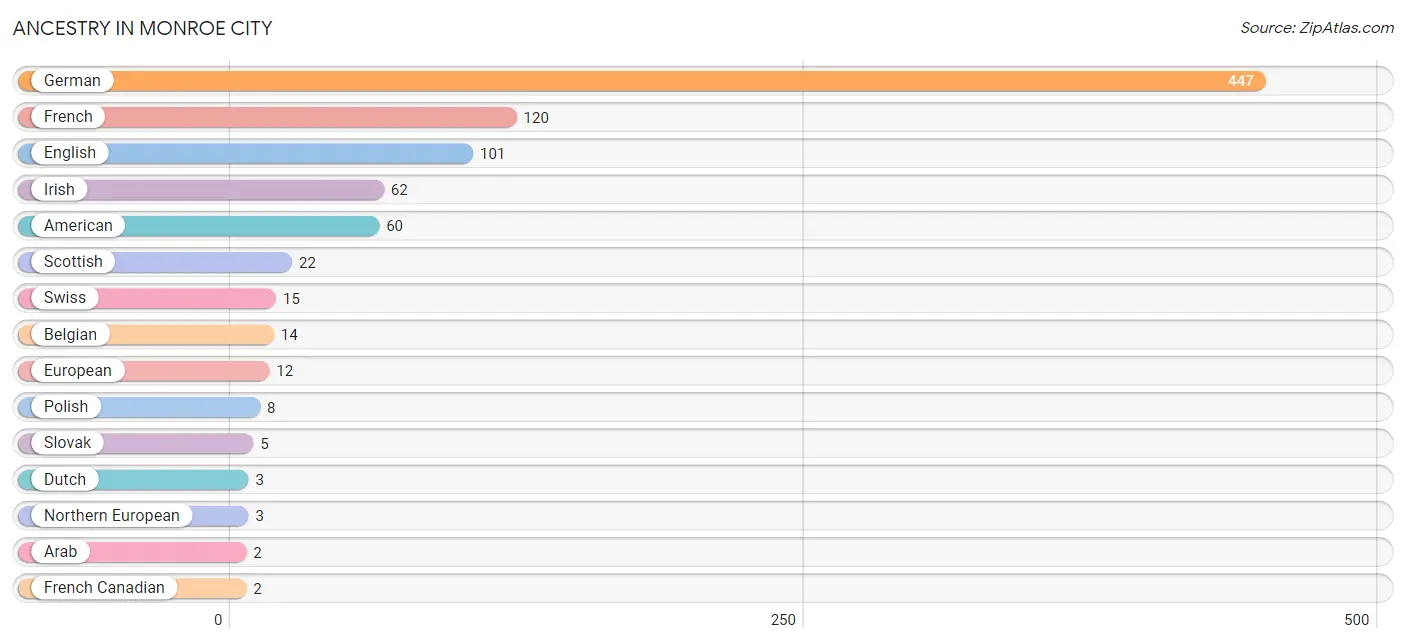
| Ancestry | # Population | % Population |
| American | 60 | 6.9% |
| Arab | 2 | 0.2% |
| Belgian | 14 | 1.6% |
| Dutch | 3 | 0.4% |
| English | 101 | 11.7% |
| European | 12 | 1.4% |
| French | 120 | 13.8% |
| French Canadian | 2 | 0.2% |
| German | 447 | 51.6% |
| Icelander | 1 | 0.1% |
| Irish | 62 | 7.1% |
| Northern European | 3 | 0.4% |
| Polish | 8 | 0.9% |
| Scotch-Irish | 2 | 0.2% |
| Scottish | 22 | 2.5% |
| Slovak | 5 | 0.6% |
| Swedish | 2 | 0.2% |
| Swiss | 15 | 1.7% | View All 18 Rows |
Immigrants in Monroe City

| Immigration Origin | # Population | % Population | View All 0 Rows |
Sex and Age in Monroe City
Sex and Age in Monroe City
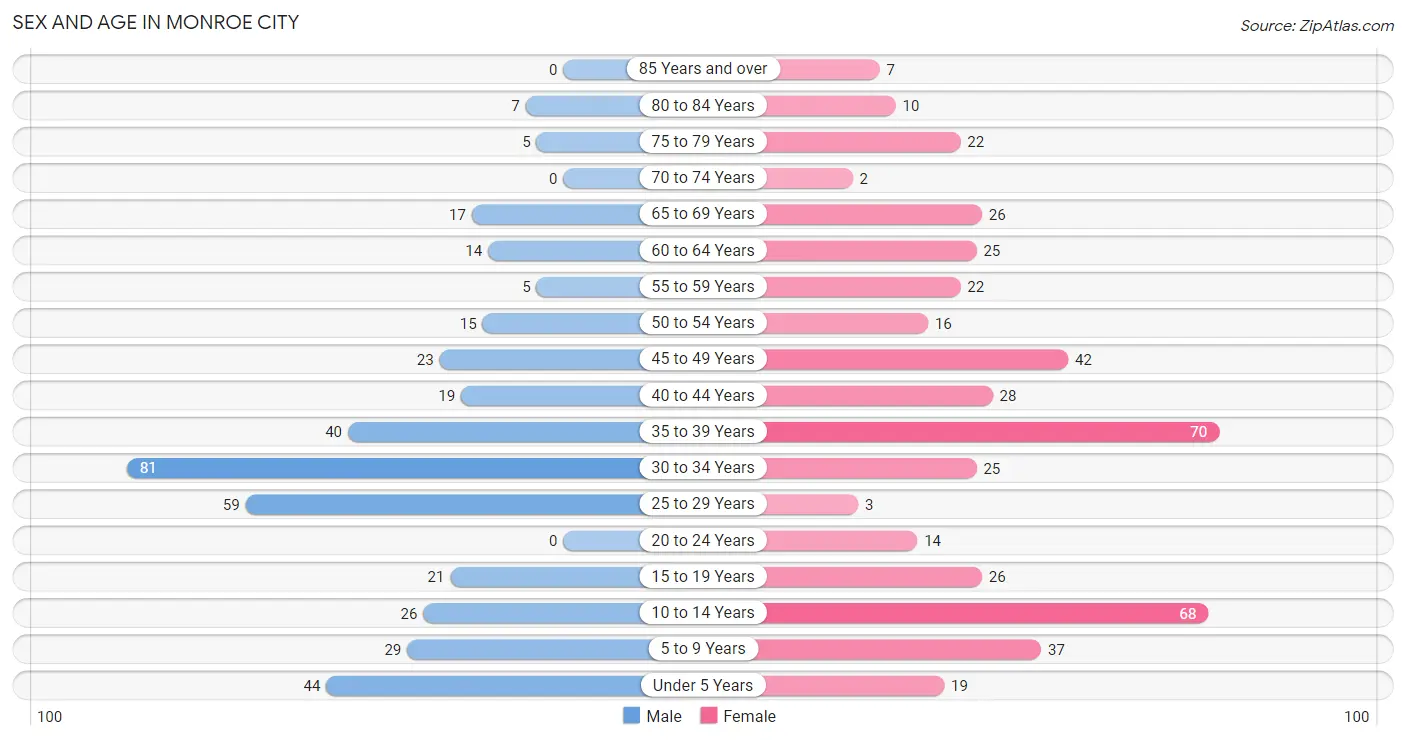
The most populous age groups in Monroe City are 30 to 34 Years (81 | 20.0%) for men and 35 to 39 Years (70 | 15.1%) for women.
| Age Bracket | Male | Female |
| Under 5 Years | 44 (10.9%) | 19 (4.1%) |
| 5 to 9 Years | 29 (7.2%) | 37 (8.0%) |
| 10 to 14 Years | 26 (6.4%) | 68 (14.7%) |
| 15 to 19 Years | 21 (5.2%) | 26 (5.6%) |
| 20 to 24 Years | 0 (0.0%) | 14 (3.0%) |
| 25 to 29 Years | 59 (14.6%) | 3 (0.6%) |
| 30 to 34 Years | 81 (20.0%) | 25 (5.4%) |
| 35 to 39 Years | 40 (9.9%) | 70 (15.1%) |
| 40 to 44 Years | 19 (4.7%) | 28 (6.1%) |
| 45 to 49 Years | 23 (5.7%) | 42 (9.1%) |
| 50 to 54 Years | 15 (3.7%) | 16 (3.5%) |
| 55 to 59 Years | 5 (1.2%) | 22 (4.8%) |
| 60 to 64 Years | 14 (3.5%) | 25 (5.4%) |
| 65 to 69 Years | 17 (4.2%) | 26 (5.6%) |
| 70 to 74 Years | 0 (0.0%) | 2 (0.4%) |
| 75 to 79 Years | 5 (1.2%) | 22 (4.8%) |
| 80 to 84 Years | 7 (1.7%) | 10 (2.2%) |
| 85 Years and over | 0 (0.0%) | 7 (1.5%) |
| Total | 405 (100.0%) | 462 (100.0%) |
Families and Households in Monroe City
Median Family Size in Monroe City
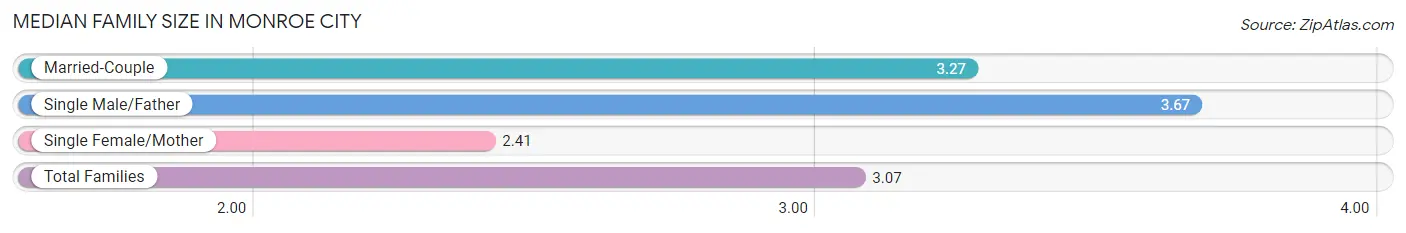
The median family size in Monroe City is 3.07 persons per family, with single male/father families (6 | 2.6%) accounting for the largest median family size of 3.67 persons per family. On the other hand, single female/mother families (56 | 24.6%) represent the smallest median family size with 2.41 persons per family.
| Family Type | # Families | Family Size |
| Married-Couple | 166 (72.8%) | 3.27 |
| Single Male/Father | 6 (2.6%) | 3.67 |
| Single Female/Mother | 56 (24.6%) | 2.41 |
| Total Families | 228 (100.0%) | 3.07 |
Median Household Size in Monroe City
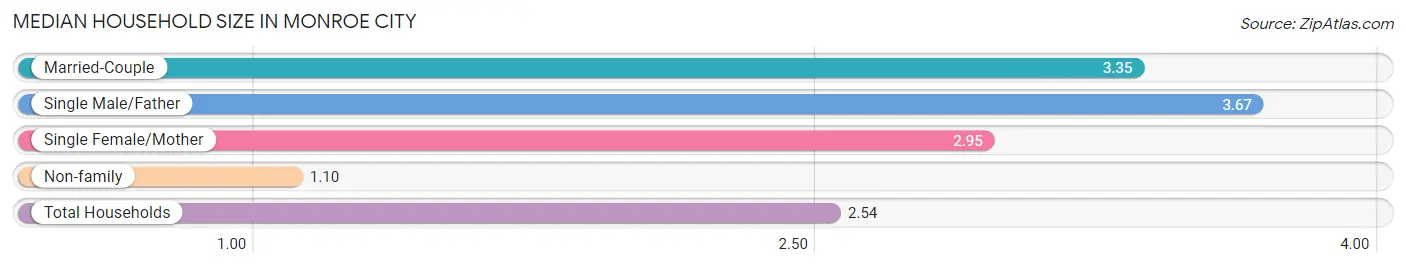
The median household size in Monroe City is 2.54 persons per household, with single male/father households (6 | 1.8%) accounting for the largest median household size of 3.67 persons per household. non-family households (113 | 33.1%) represent the smallest median household size with 1.10 persons per household.
| Household Type | # Households | Household Size |
| Married-Couple | 166 (48.7%) | 3.35 |
| Single Male/Father | 6 (1.8%) | 3.67 |
| Single Female/Mother | 56 (16.4%) | 2.95 |
| Non-family | 113 (33.1%) | 1.10 |
| Total Households | 341 (100.0%) | 2.54 |
Household Size by Marriage Status in Monroe City
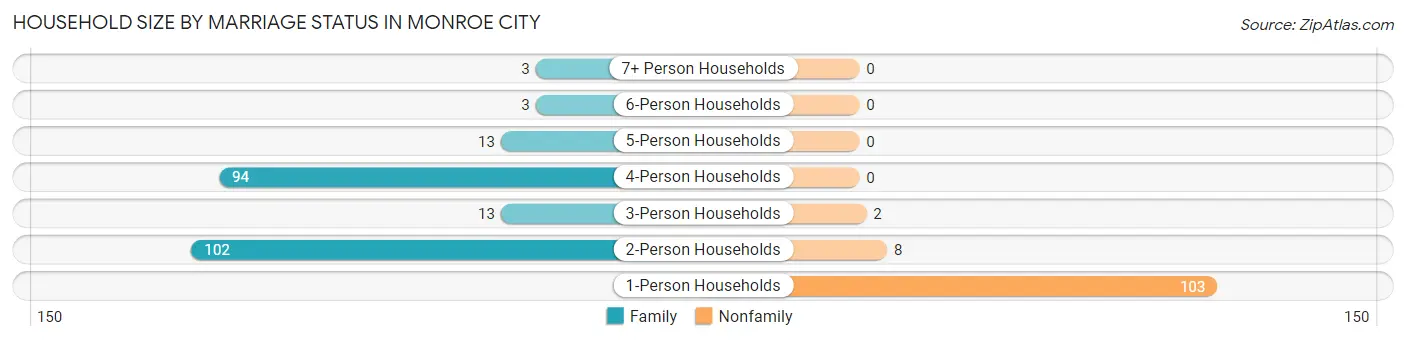
Out of a total of 341 households in Monroe City, 228 (66.9%) are family households, while 113 (33.1%) are nonfamily households. The most numerous type of family households are 2-person households, comprising 102, and the most common type of nonfamily households are 1-person households, comprising 103.
| Household Size | Family Households | Nonfamily Households |
| 1-Person Households | - | 103 (30.2%) |
| 2-Person Households | 102 (29.9%) | 8 (2.4%) |
| 3-Person Households | 13 (3.8%) | 2 (0.6%) |
| 4-Person Households | 94 (27.6%) | 0 (0.0%) |
| 5-Person Households | 13 (3.8%) | 0 (0.0%) |
| 6-Person Households | 3 (0.9%) | 0 (0.0%) |
| 7+ Person Households | 3 (0.9%) | 0 (0.0%) |
| Total | 228 (66.9%) | 113 (33.1%) |
Female Fertility in Monroe City
Fertility by Age in Monroe City
Average fertility rate in Monroe City is 82.0 births per 1,000 women. Women in the age bracket of 20 to 34 years have the highest fertility rate with 405.0 births per 1,000 women. Women in the age bracket of 20 to 34 years acount for 100.0% of all women with births.
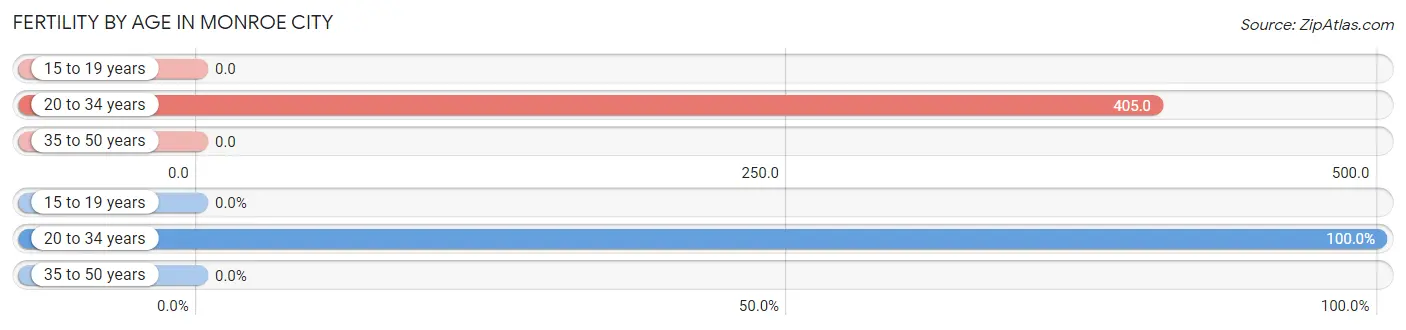
| Age Bracket | Women with Births | Births / 1,000 Women |
| 15 to 19 years | 0 (0.0%) | 0.0 |
| 20 to 34 years | 17 (100.0%) | 405.0 |
| 35 to 50 years | 0 (0.0%) | 0.0 |
| Total | 17 (100.0%) | 82.0 |
Fertility by Age by Marriage Status in Monroe City
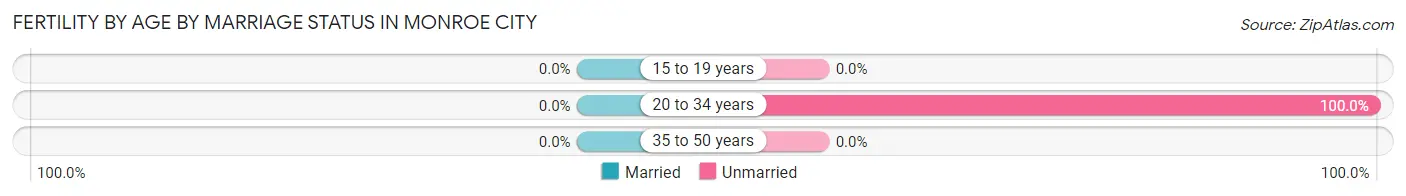
| Age Bracket | Married | Unmarried |
| 15 to 19 years | 0 (0.0%) | 0 (0.0%) |
| 20 to 34 years | 0 (0.0%) | 17 (100.0%) |
| 35 to 50 years | 0 (0.0%) | 0 (0.0%) |
| Total | 0 (0.0%) | 17 (100.0%) |
Fertility by Education in Monroe City
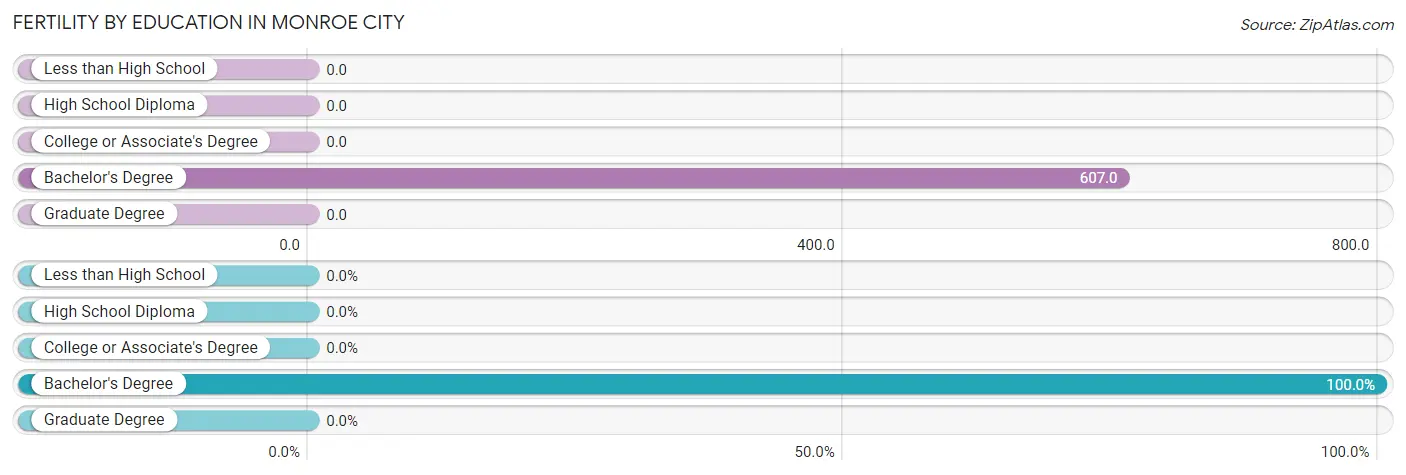
| Educational Attainment | Women with Births | Births / 1,000 Women |
| Less than High School | 0 (0.0%) | 0.0 |
| High School Diploma | 0 (0.0%) | 0.0 |
| College or Associate's Degree | 0 (0.0%) | 0.0 |
| Bachelor's Degree | 17 (100.0%) | 607.0 |
| Graduate Degree | 0 (0.0%) | 0.0 |
| Total | 17 (100.0%) | 82.0 |
Fertility by Education by Marriage Status in Monroe City
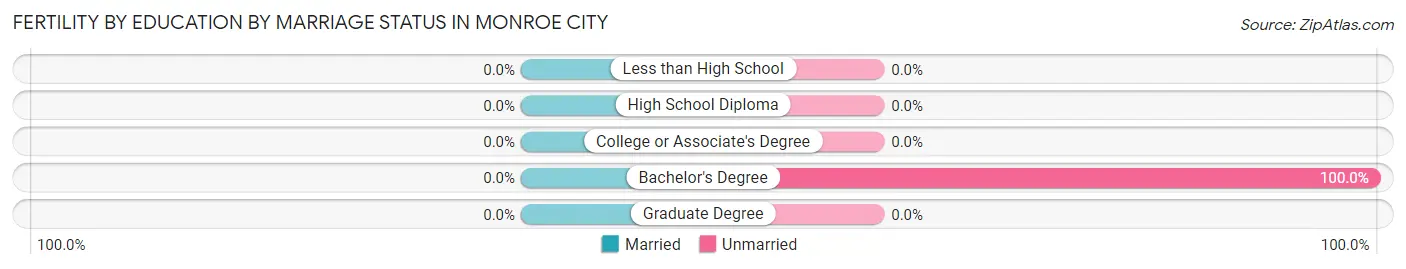
| Educational Attainment | Married | Unmarried |
| Less than High School | 0 (0.0%) | 0 (0.0%) |
| High School Diploma | 0 (0.0%) | 0 (0.0%) |
| College or Associate's Degree | 0 (0.0%) | 0 (0.0%) |
| Bachelor's Degree | 0 (0.0%) | 17 (100.0%) |
| Graduate Degree | 0 (0.0%) | 0 (0.0%) |
| Total | 0 (0.0%) | 17 (100.0%) |
Employment Characteristics in Monroe City
Employment by Class of Employer in Monroe City
Among the 385 employed individuals in Monroe City, private company employees (274 | 71.2%), self-employed (not incorporated) (47 | 12.2%), and not-for-profit organizations (20 | 5.2%) make up the most common classes of employment.
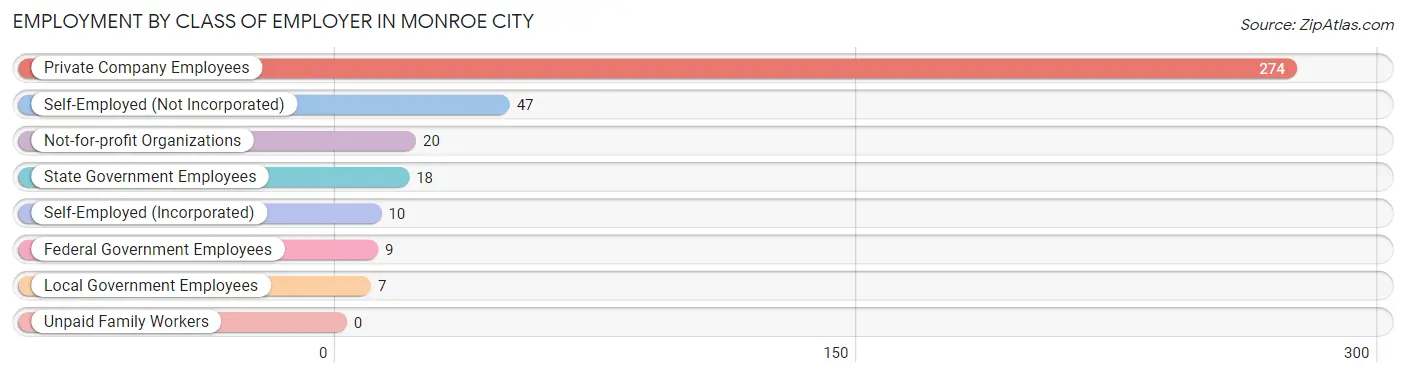
| Employer Class | # Employees | % Employees |
| Private Company Employees | 274 | 71.2% |
| Self-Employed (Incorporated) | 10 | 2.6% |
| Self-Employed (Not Incorporated) | 47 | 12.2% |
| Not-for-profit Organizations | 20 | 5.2% |
| Local Government Employees | 7 | 1.8% |
| State Government Employees | 18 | 4.7% |
| Federal Government Employees | 9 | 2.3% |
| Unpaid Family Workers | 0 | 0.0% |
| Total | 385 | 100.0% |
Employment Status by Age in Monroe City
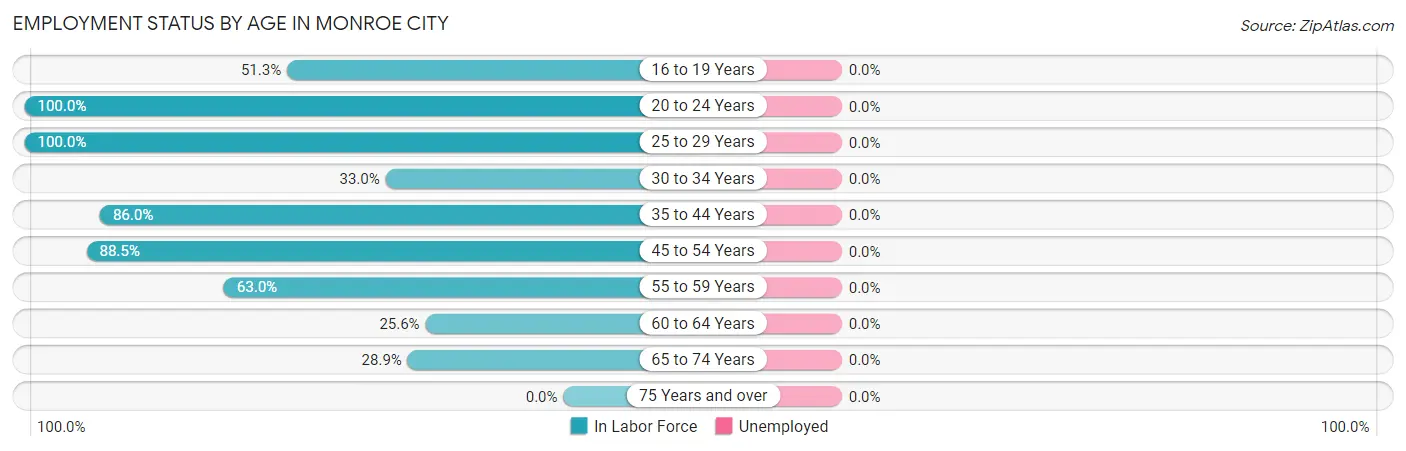
| Age Bracket | In Labor Force | Unemployed |
| 16 to 19 Years | 20 (51.3%) | 0 (0.0%) |
| 20 to 24 Years | 14 (100.0%) | 0 (0.0%) |
| 25 to 29 Years | 62 (100.0%) | 0 (0.0%) |
| 30 to 34 Years | 35 (33.0%) | 0 (0.0%) |
| 35 to 44 Years | 135 (86.0%) | 0 (0.0%) |
| 45 to 54 Years | 85 (88.5%) | 0 (0.0%) |
| 55 to 59 Years | 17 (63.0%) | 0 (0.0%) |
| 60 to 64 Years | 10 (25.6%) | 0 (0.0%) |
| 65 to 74 Years | 13 (28.9%) | 0 (0.0%) |
| 75 Years and over | 0 (0.0%) | 0 (0.0%) |
| Total | 391 (61.5%) | 0 (0.0%) |
Employment Status by Educational Attainment in Monroe City
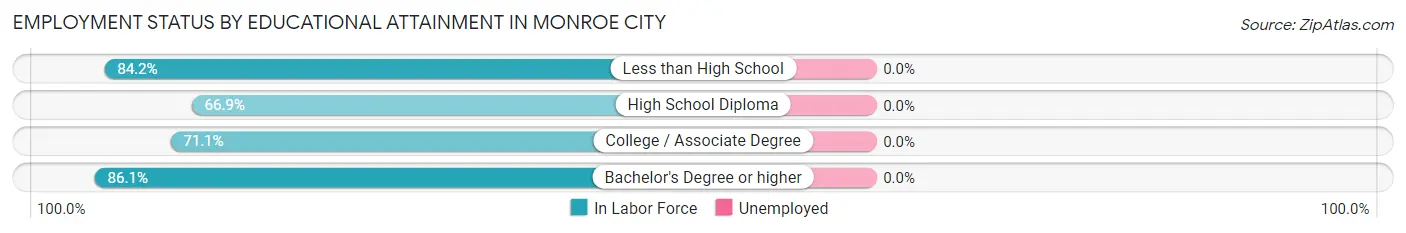
| Educational Attainment | In Labor Force | Unemployed |
| Less than High School | 16 (84.2%) | 0 (0.0%) |
| High School Diploma | 162 (66.9%) | 0 (0.0%) |
| College / Associate Degree | 135 (71.1%) | 0 (0.0%) |
| Bachelor's Degree or higher | 31 (86.1%) | 0 (0.0%) |
| Total | 344 (70.6%) | 0 (0.0%) |
Employment Occupations by Sex in Monroe City
Management, Business, Science and Arts Occupations
The most common Management, Business, Science and Arts occupations in Monroe City are Management (44 | 11.3%), Health Diagnosing & Treating (41 | 10.5%), Community & Social Service (16 | 4.1%), Health Technologists (13 | 3.3%), and Education, Arts & Media (10 | 2.6%).
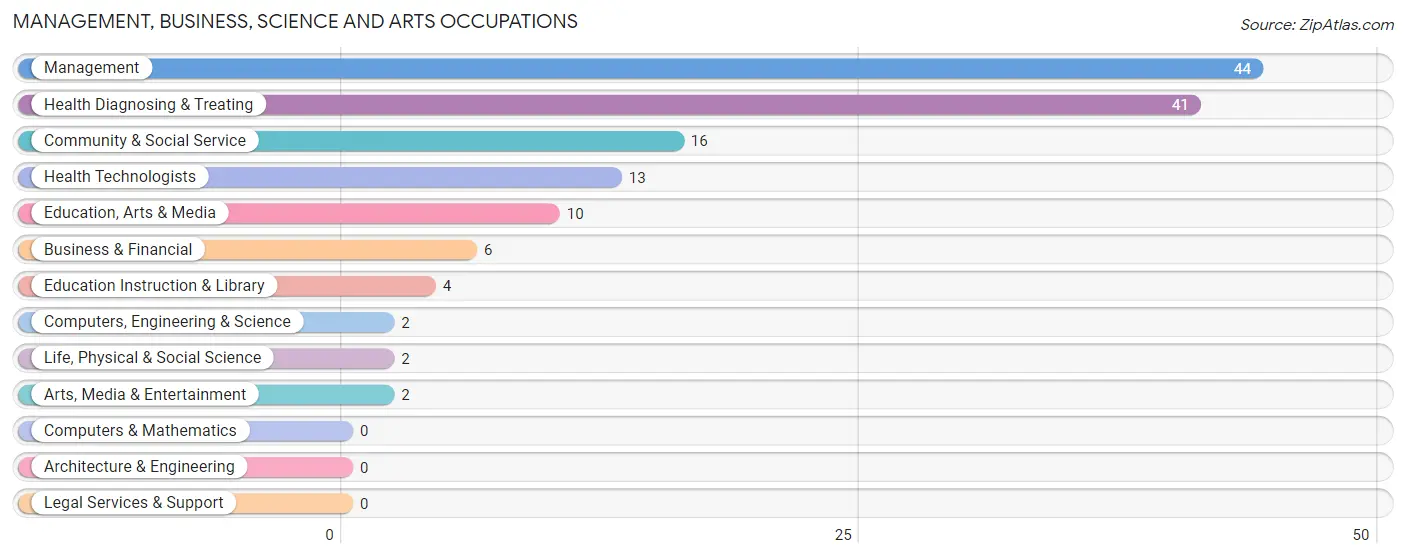
Management, Business, Science and Arts Occupations by Sex
Within the Management, Business, Science and Arts occupations in Monroe City, the most male-oriented occupations are Arts, Media & Entertainment (100.0%), Business & Financial (50.0%), and Education Instruction & Library (50.0%), while the most female-oriented occupations are Computers, Engineering & Science (100.0%), Life, Physical & Social Science (100.0%), and Education, Arts & Media (100.0%).
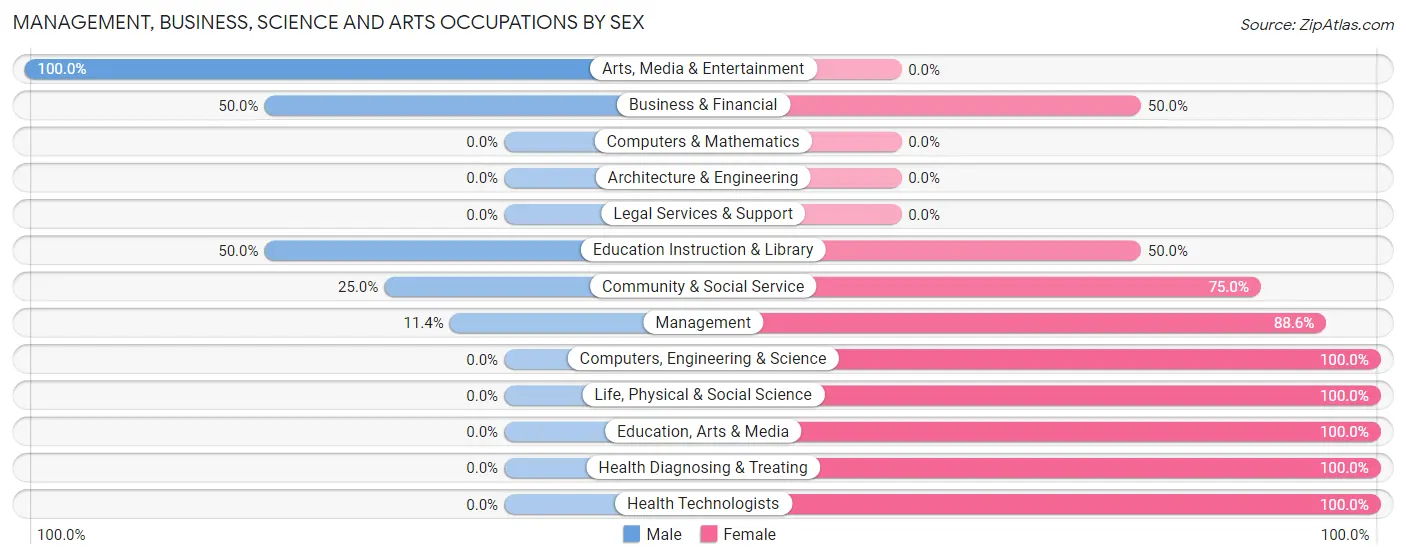
| Occupation | Male | Female |
| Management | 5 (11.4%) | 39 (88.6%) |
| Business & Financial | 3 (50.0%) | 3 (50.0%) |
| Computers, Engineering & Science | 0 (0.0%) | 2 (100.0%) |
| Computers & Mathematics | 0 (0.0%) | 0 (0.0%) |
| Architecture & Engineering | 0 (0.0%) | 0 (0.0%) |
| Life, Physical & Social Science | 0 (0.0%) | 2 (100.0%) |
| Community & Social Service | 4 (25.0%) | 12 (75.0%) |
| Education, Arts & Media | 0 (0.0%) | 10 (100.0%) |
| Legal Services & Support | 0 (0.0%) | 0 (0.0%) |
| Education Instruction & Library | 2 (50.0%) | 2 (50.0%) |
| Arts, Media & Entertainment | 2 (100.0%) | 0 (0.0%) |
| Health Diagnosing & Treating | 0 (0.0%) | 41 (100.0%) |
| Health Technologists | 0 (0.0%) | 13 (100.0%) |
| Total (Category) | 12 (11.0%) | 97 (89.0%) |
| Total (Overall) | 191 (48.8%) | 200 (51.1%) |
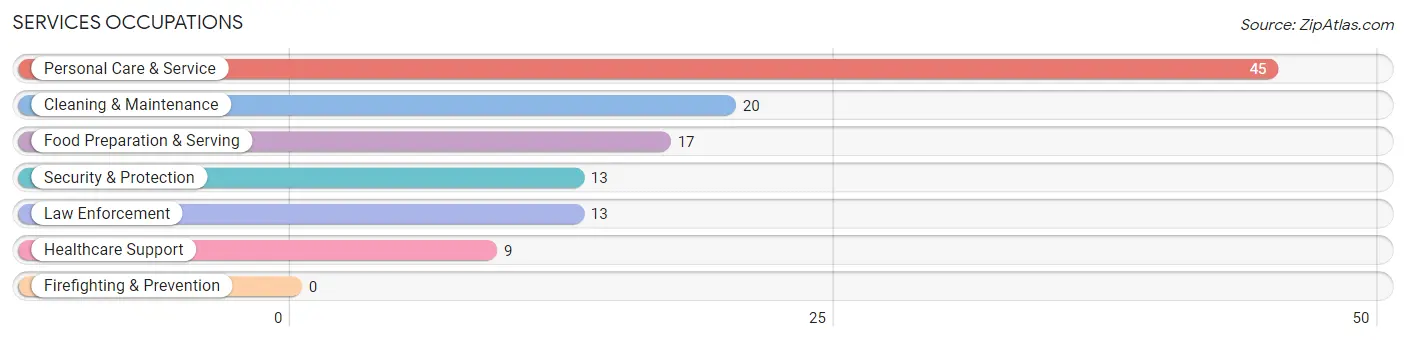
Services Occupations
The most common Services occupations in Monroe City are Personal Care & Service (45 | 11.5%), Cleaning & Maintenance (20 | 5.1%), Food Preparation & Serving (17 | 4.3%), Security & Protection (13 | 3.3%), and Law Enforcement (13 | 3.3%).
Services Occupations by Sex
Within the Services occupations in Monroe City, the most male-oriented occupations are Cleaning & Maintenance (100.0%), Security & Protection (53.8%), and Law Enforcement (53.8%), while the most female-oriented occupations are Healthcare Support (100.0%), Personal Care & Service (100.0%), and Food Preparation & Serving (58.8%).
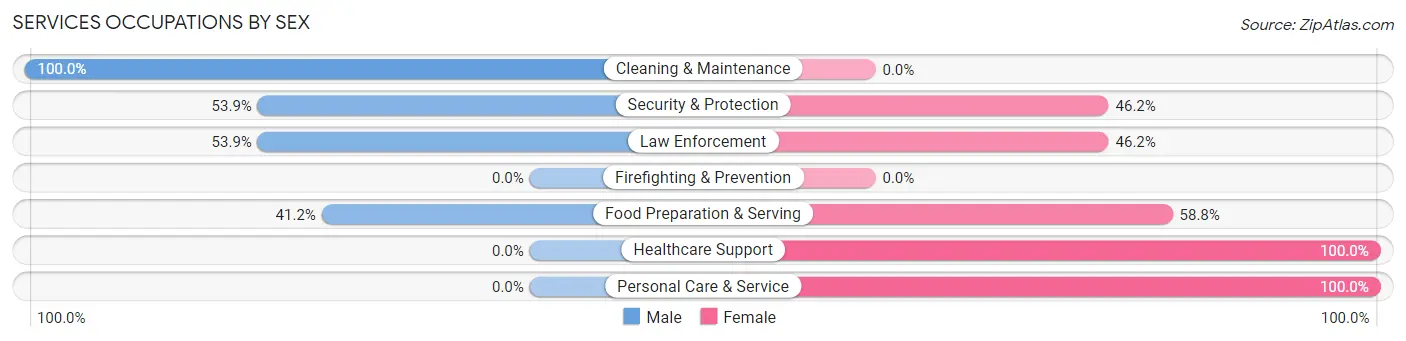
| Occupation | Male | Female |
| Healthcare Support | 0 (0.0%) | 9 (100.0%) |
| Security & Protection | 7 (53.8%) | 6 (46.2%) |
| Firefighting & Prevention | 0 (0.0%) | 0 (0.0%) |
| Law Enforcement | 7 (53.8%) | 6 (46.2%) |
| Food Preparation & Serving | 7 (41.2%) | 10 (58.8%) |
| Cleaning & Maintenance | 20 (100.0%) | 0 (0.0%) |
| Personal Care & Service | 0 (0.0%) | 45 (100.0%) |
| Total (Category) | 34 (32.7%) | 70 (67.3%) |
| Total (Overall) | 191 (48.8%) | 200 (51.1%) |
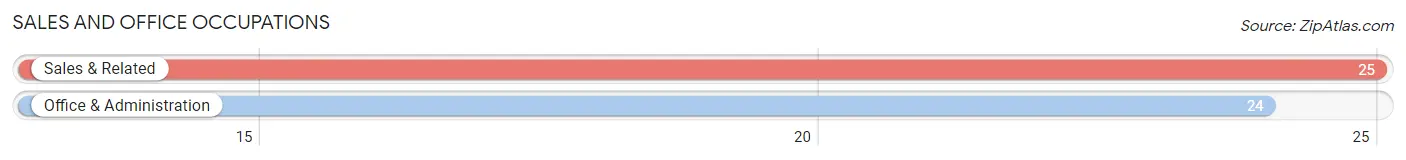
Sales and Office Occupations
The most common Sales and Office occupations in Monroe City are Sales & Related (25 | 6.4%), and Office & Administration (24 | 6.1%).
Sales and Office Occupations by Sex
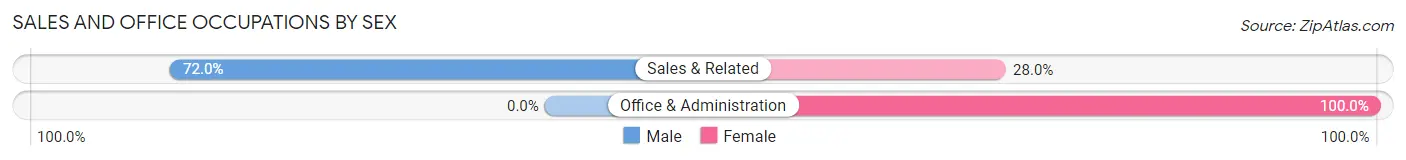
| Occupation | Male | Female |
| Sales & Related | 18 (72.0%) | 7 (28.0%) |
| Office & Administration | 0 (0.0%) | 24 (100.0%) |
| Total (Category) | 18 (36.7%) | 31 (63.3%) |
| Total (Overall) | 191 (48.8%) | 200 (51.1%) |
Natural Resources, Construction and Maintenance Occupations
The most common Natural Resources, Construction and Maintenance occupations in Monroe City are Construction & Extraction (46 | 11.8%), Installation, Maintenance & Repair (10 | 2.6%), and Farming, Fishing & Forestry (5 | 1.3%).
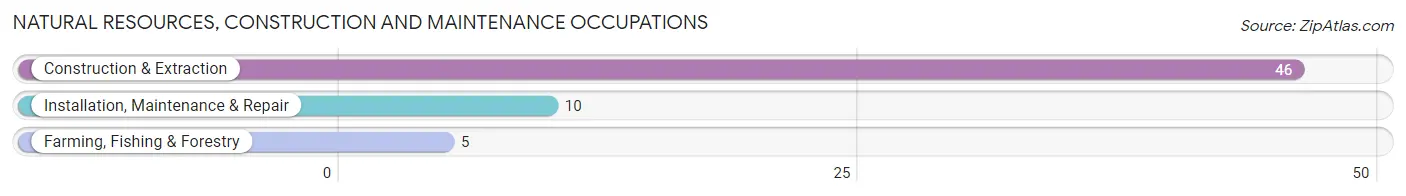
Natural Resources, Construction and Maintenance Occupations by Sex

| Occupation | Male | Female |
| Farming, Fishing & Forestry | 3 (60.0%) | 2 (40.0%) |
| Construction & Extraction | 46 (100.0%) | 0 (0.0%) |
| Installation, Maintenance & Repair | 10 (100.0%) | 0 (0.0%) |
| Total (Category) | 59 (96.7%) | 2 (3.3%) |
| Total (Overall) | 191 (48.8%) | 200 (51.1%) |
Production, Transportation and Moving Occupations
The most common Production, Transportation and Moving occupations in Monroe City are Transportation (39 | 10.0%), Production (15 | 3.8%), and Material Moving (14 | 3.6%).
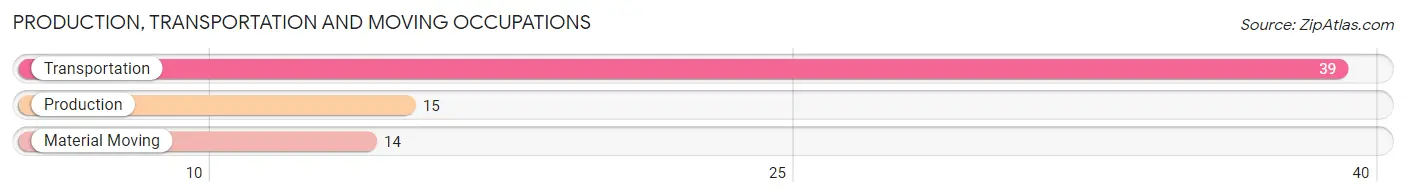
Production, Transportation and Moving Occupations by Sex
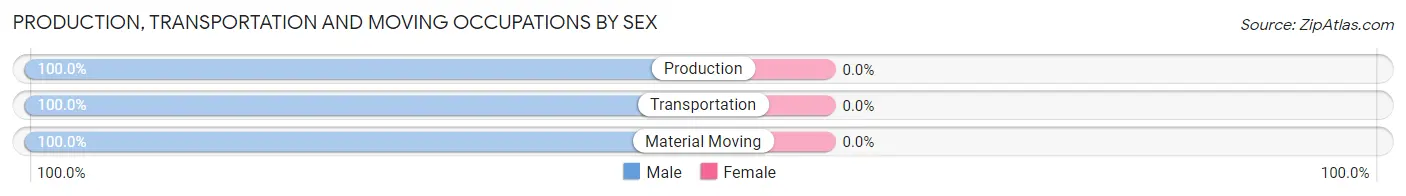
| Occupation | Male | Female |
| Production | 15 (100.0%) | 0 (0.0%) |
| Transportation | 39 (100.0%) | 0 (0.0%) |
| Material Moving | 14 (100.0%) | 0 (0.0%) |
| Total (Category) | 68 (100.0%) | 0 (0.0%) |
| Total (Overall) | 191 (48.8%) | 200 (51.1%) |
Employment Industries by Sex in Monroe City
Employment Industries in Monroe City
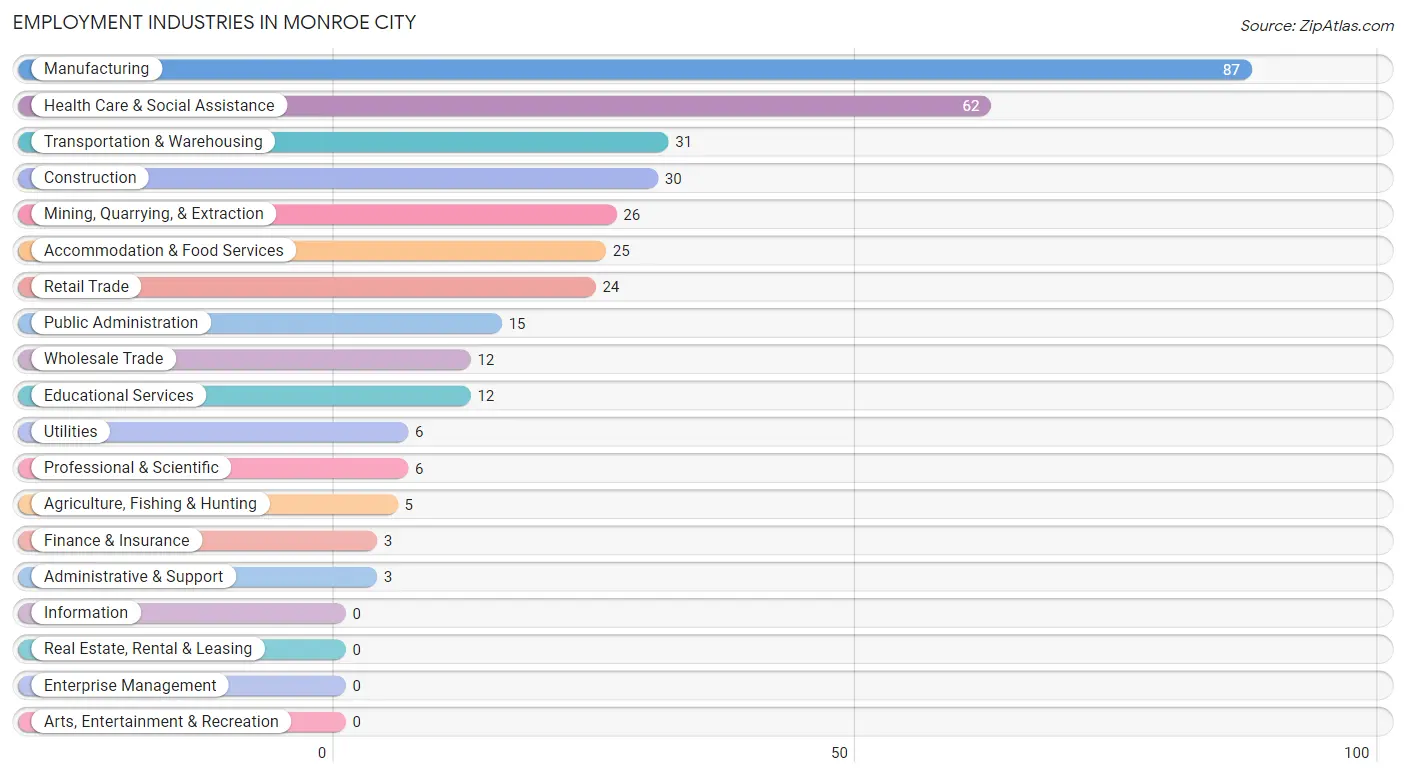
The major employment industries in Monroe City include Manufacturing (87 | 22.3%), Health Care & Social Assistance (62 | 15.9%), Transportation & Warehousing (31 | 7.9%), Construction (30 | 7.7%), and Mining, Quarrying, & Extraction (26 | 6.7%).
Employment Industries by Sex in Monroe City
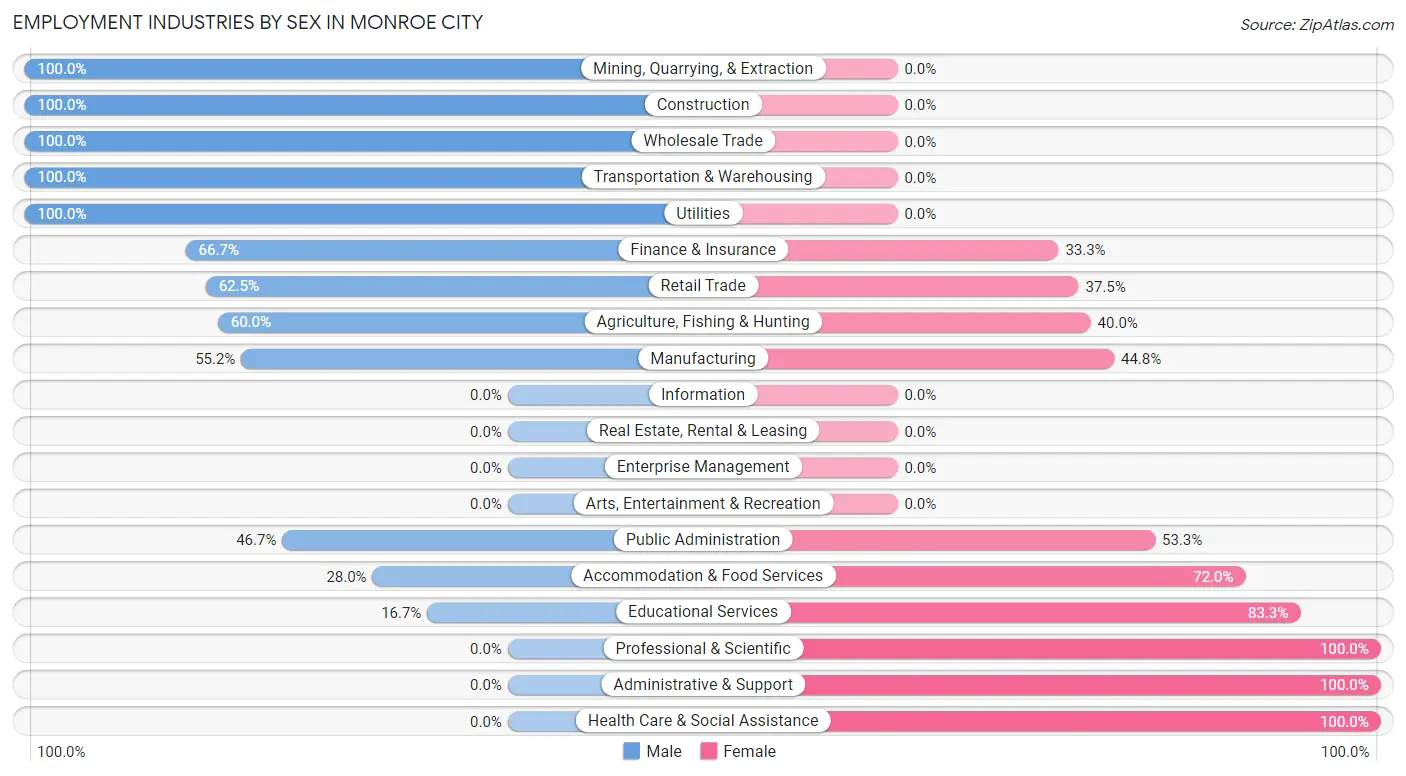
The Monroe City industries that see more men than women are Mining, Quarrying, & Extraction (100.0%), Construction (100.0%), and Wholesale Trade (100.0%), whereas the industries that tend to have a higher number of women are Professional & Scientific (100.0%), Administrative & Support (100.0%), and Health Care & Social Assistance (100.0%).
| Industry | Male | Female |
| Agriculture, Fishing & Hunting | 3 (60.0%) | 2 (40.0%) |
| Mining, Quarrying, & Extraction | 26 (100.0%) | 0 (0.0%) |
| Construction | 30 (100.0%) | 0 (0.0%) |
| Manufacturing | 48 (55.2%) | 39 (44.8%) |
| Wholesale Trade | 12 (100.0%) | 0 (0.0%) |
| Retail Trade | 15 (62.5%) | 9 (37.5%) |
| Transportation & Warehousing | 31 (100.0%) | 0 (0.0%) |
| Utilities | 6 (100.0%) | 0 (0.0%) |
| Information | 0 (0.0%) | 0 (0.0%) |
| Finance & Insurance | 2 (66.7%) | 1 (33.3%) |
| Real Estate, Rental & Leasing | 0 (0.0%) | 0 (0.0%) |
| Professional & Scientific | 0 (0.0%) | 6 (100.0%) |
| Enterprise Management | 0 (0.0%) | 0 (0.0%) |
| Administrative & Support | 0 (0.0%) | 3 (100.0%) |
| Educational Services | 2 (16.7%) | 10 (83.3%) |
| Health Care & Social Assistance | 0 (0.0%) | 62 (100.0%) |
| Arts, Entertainment & Recreation | 0 (0.0%) | 0 (0.0%) |
| Accommodation & Food Services | 7 (28.0%) | 18 (72.0%) |
| Public Administration | 7 (46.7%) | 8 (53.3%) |
| Total | 191 (48.8%) | 200 (51.1%) |
Education in Monroe City
School Enrollment in Monroe City
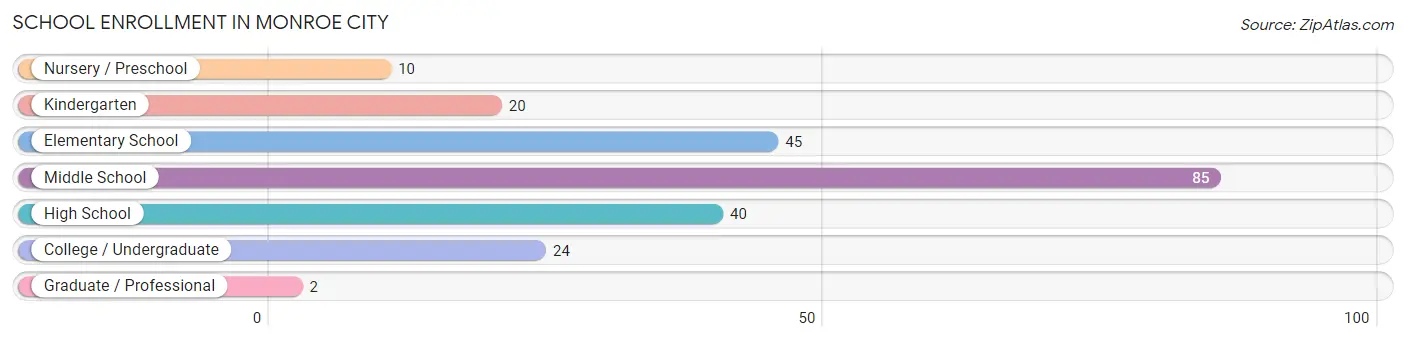
The most common levels of schooling among the 226 students in Monroe City are middle school (85 | 37.6%), elementary school (45 | 19.9%), and high school (40 | 17.7%).
| School Level | # Students | % Students |
| Nursery / Preschool | 10 | 4.4% |
| Kindergarten | 20 | 8.8% |
| Elementary School | 45 | 19.9% |
| Middle School | 85 | 37.6% |
| High School | 40 | 17.7% |
| College / Undergraduate | 24 | 10.6% |
| Graduate / Professional | 2 | 0.9% |
| Total | 226 | 100.0% |
School Enrollment by Age by Funding Source in Monroe City
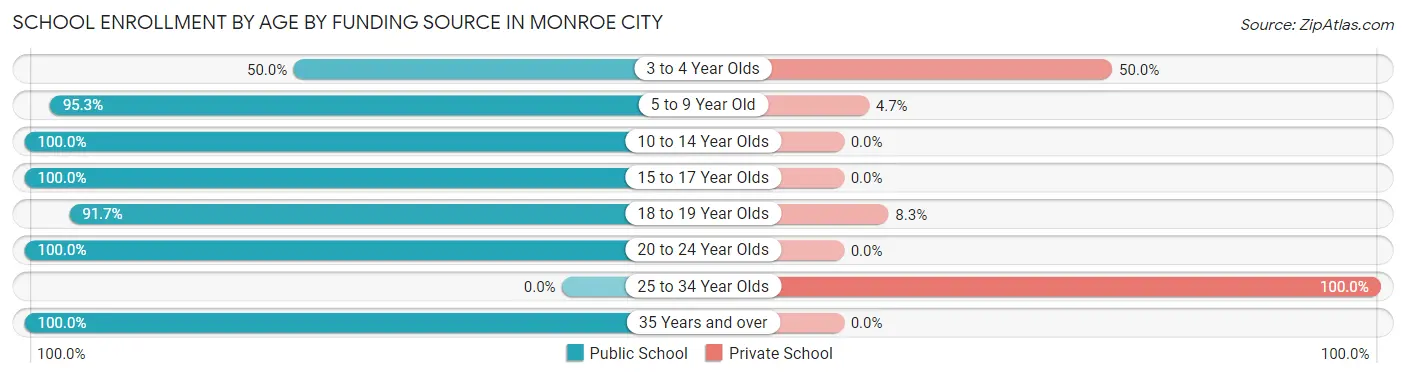
Out of a total of 226 students who are enrolled in schools in Monroe City, 8 (3.5%) attend a private institution, while the remaining 218 (96.5%) are enrolled in public schools. The age group of 25 to 34 year olds has the highest likelihood of being enrolled in private schools, with 2 (100.0% in the age bracket) enrolled. Conversely, the age group of 10 to 14 year olds has the lowest likelihood of being enrolled in a private school, with 94 (100.0% in the age bracket) attending a public institution.
| Age Bracket | Public School | Private School |
| 3 to 4 Year Olds | 2 (50.0%) | 2 (50.0%) |
| 5 to 9 Year Old | 61 (95.3%) | 3 (4.7%) |
| 10 to 14 Year Olds | 94 (100.0%) | 0 (0.0%) |
| 15 to 17 Year Olds | 35 (100.0%) | 0 (0.0%) |
| 18 to 19 Year Olds | 11 (91.7%) | 1 (8.3%) |
| 20 to 24 Year Olds | 3 (100.0%) | 0 (0.0%) |
| 25 to 34 Year Olds | 0 (0.0%) | 2 (100.0%) |
| 35 Years and over | 12 (100.0%) | 0 (0.0%) |
| Total | 218 (96.5%) | 8 (3.5%) |
Educational Attainment by Field of Study in Monroe City
Science & technology (19 | 47.5%), engineering (5 | 12.5%), business (3 | 7.5%), communications (3 | 7.5%), and arts & humanities (3 | 7.5%) are the most common fields of study among 40 individuals in Monroe City who have obtained a bachelor's degree or higher.
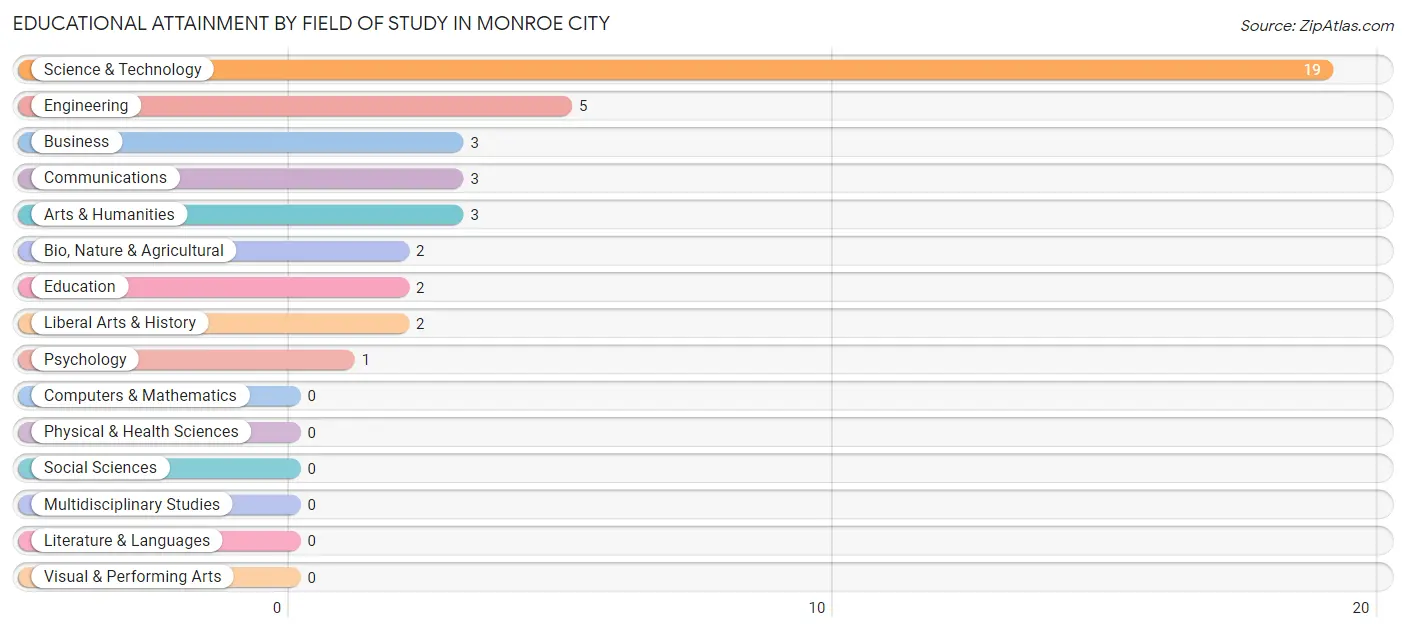
| Field of Study | # Graduates | % Graduates |
| Computers & Mathematics | 0 | 0.0% |
| Bio, Nature & Agricultural | 2 | 5.0% |
| Physical & Health Sciences | 0 | 0.0% |
| Psychology | 1 | 2.5% |
| Social Sciences | 0 | 0.0% |
| Engineering | 5 | 12.5% |
| Multidisciplinary Studies | 0 | 0.0% |
| Science & Technology | 19 | 47.5% |
| Business | 3 | 7.5% |
| Education | 2 | 5.0% |
| Literature & Languages | 0 | 0.0% |
| Liberal Arts & History | 2 | 5.0% |
| Visual & Performing Arts | 0 | 0.0% |
| Communications | 3 | 7.5% |
| Arts & Humanities | 3 | 7.5% |
| Total | 40 | 100.0% |
Transportation & Commute in Monroe City
Vehicle Availability by Sex in Monroe City
The most prevalent vehicle ownership categories in Monroe City are males with 2 vehicles (101, accounting for 52.9%) and females with 2 vehicles (125, making up 52.1%).
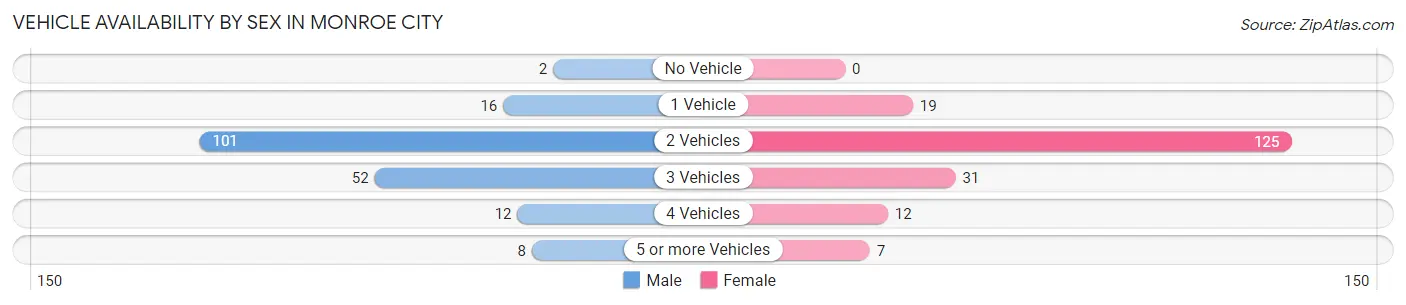
| Vehicles Available | Male | Female |
| No Vehicle | 2 (1.1%) | 0 (0.0%) |
| 1 Vehicle | 16 (8.4%) | 19 (9.8%) |
| 2 Vehicles | 101 (52.9%) | 125 (64.4%) |
| 3 Vehicles | 52 (27.2%) | 31 (16.0%) |
| 4 Vehicles | 12 (6.3%) | 12 (6.2%) |
| 5 or more Vehicles | 8 (4.2%) | 7 (3.6%) |
| Total | 191 (100.0%) | 194 (100.0%) |
Commute Time in Monroe City
The most frequently occuring commute durations in Monroe City are 15 to 19 minutes (123 commuters, 32.0%), 20 to 24 minutes (83 commuters, 21.6%), and 25 to 29 minutes (39 commuters, 10.1%).
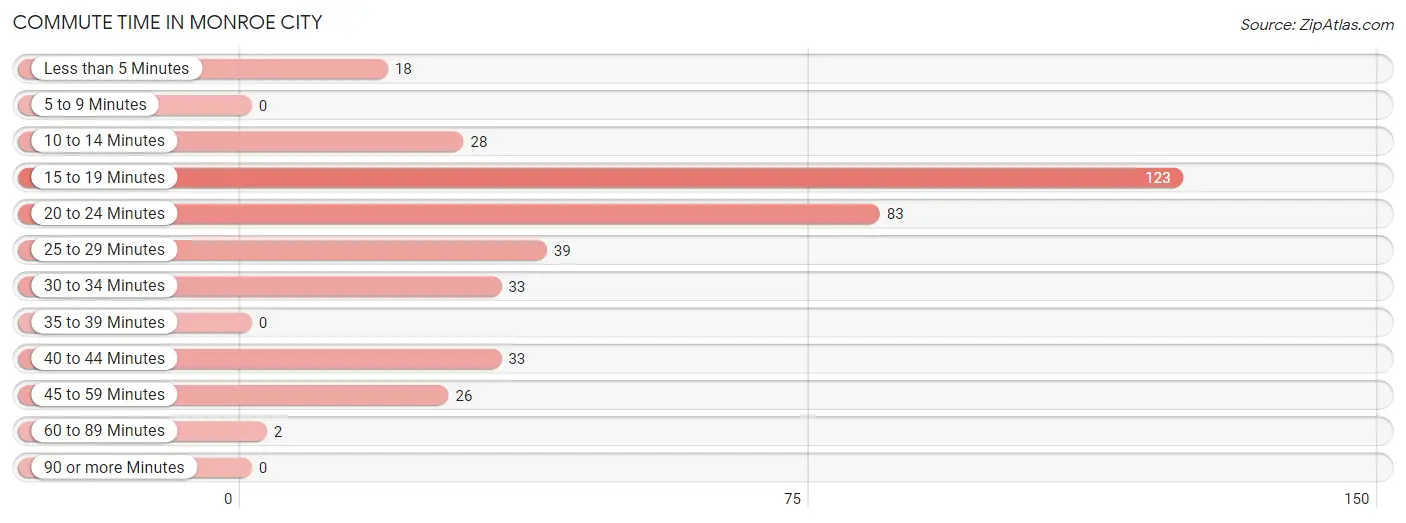
| Commute Time | # Commuters | % Commuters |
| Less than 5 Minutes | 18 | 4.7% |
| 5 to 9 Minutes | 0 | 0.0% |
| 10 to 14 Minutes | 28 | 7.3% |
| 15 to 19 Minutes | 123 | 32.0% |
| 20 to 24 Minutes | 83 | 21.6% |
| 25 to 29 Minutes | 39 | 10.1% |
| 30 to 34 Minutes | 33 | 8.6% |
| 35 to 39 Minutes | 0 | 0.0% |
| 40 to 44 Minutes | 33 | 8.6% |
| 45 to 59 Minutes | 26 | 6.8% |
| 60 to 89 Minutes | 2 | 0.5% |
| 90 or more Minutes | 0 | 0.0% |
Commute Time by Sex in Monroe City
The most common commute times in Monroe City are 15 to 19 minutes (44 commuters, 23.0%) for males and 15 to 19 minutes (79 commuters, 40.7%) for females.
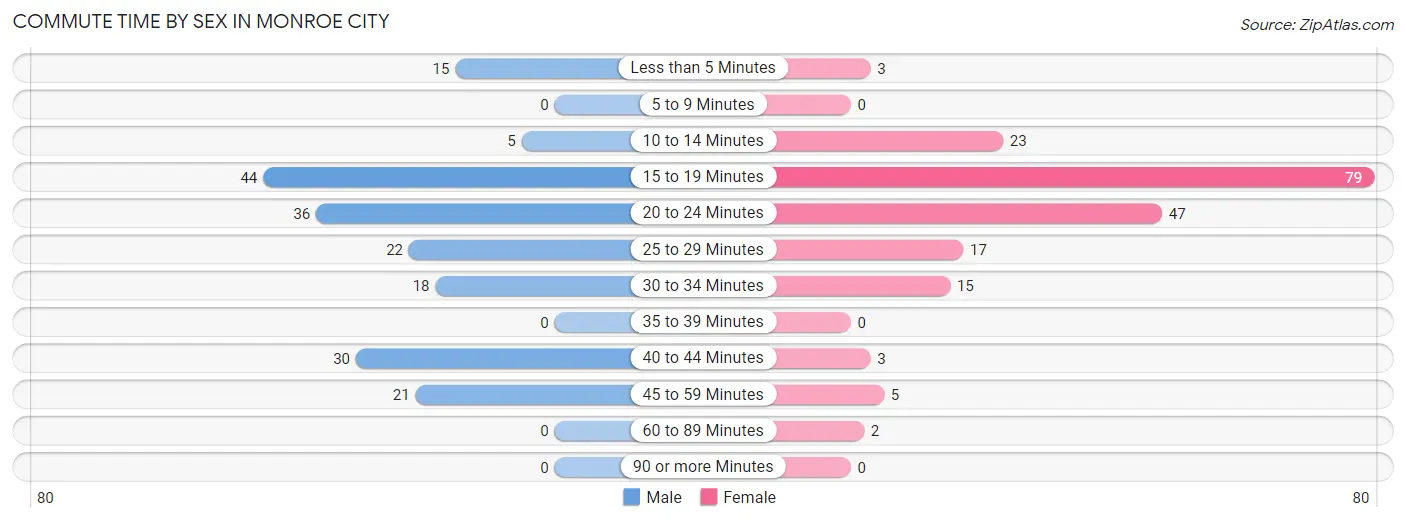
| Commute Time | Male | Female |
| Less than 5 Minutes | 15 (7.9%) | 3 (1.5%) |
| 5 to 9 Minutes | 0 (0.0%) | 0 (0.0%) |
| 10 to 14 Minutes | 5 (2.6%) | 23 (11.9%) |
| 15 to 19 Minutes | 44 (23.0%) | 79 (40.7%) |
| 20 to 24 Minutes | 36 (18.9%) | 47 (24.2%) |
| 25 to 29 Minutes | 22 (11.5%) | 17 (8.8%) |
| 30 to 34 Minutes | 18 (9.4%) | 15 (7.7%) |
| 35 to 39 Minutes | 0 (0.0%) | 0 (0.0%) |
| 40 to 44 Minutes | 30 (15.7%) | 3 (1.5%) |
| 45 to 59 Minutes | 21 (11.0%) | 5 (2.6%) |
| 60 to 89 Minutes | 0 (0.0%) | 2 (1.0%) |
| 90 or more Minutes | 0 (0.0%) | 0 (0.0%) |
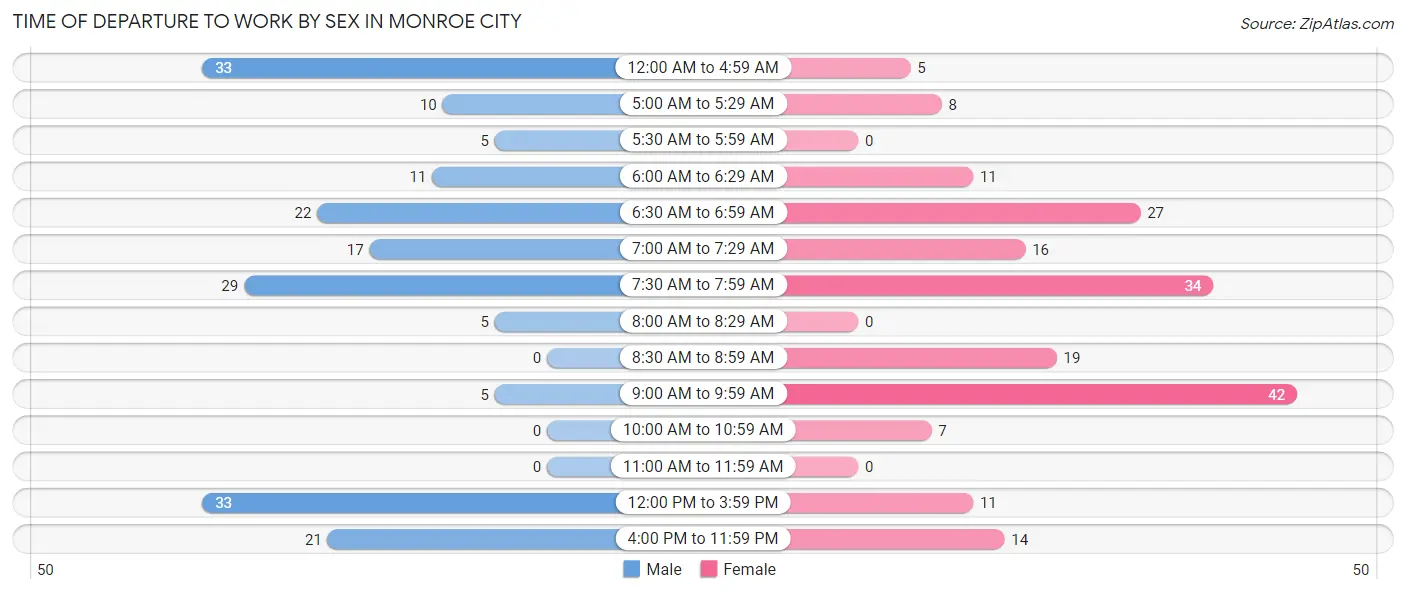
Time of Departure to Work by Sex in Monroe City
The most frequent times of departure to work in Monroe City are 12:00 AM to 4:59 AM (33, 17.3%) for males and 9:00 AM to 9:59 AM (42, 21.6%) for females.
| Time of Departure | Male | Female |
| 12:00 AM to 4:59 AM | 33 (17.3%) | 5 (2.6%) |
| 5:00 AM to 5:29 AM | 10 (5.2%) | 8 (4.1%) |
| 5:30 AM to 5:59 AM | 5 (2.6%) | 0 (0.0%) |
| 6:00 AM to 6:29 AM | 11 (5.8%) | 11 (5.7%) |
| 6:30 AM to 6:59 AM | 22 (11.5%) | 27 (13.9%) |
| 7:00 AM to 7:29 AM | 17 (8.9%) | 16 (8.3%) |
| 7:30 AM to 7:59 AM | 29 (15.2%) | 34 (17.5%) |
| 8:00 AM to 8:29 AM | 5 (2.6%) | 0 (0.0%) |
| 8:30 AM to 8:59 AM | 0 (0.0%) | 19 (9.8%) |
| 9:00 AM to 9:59 AM | 5 (2.6%) | 42 (21.6%) |
| 10:00 AM to 10:59 AM | 0 (0.0%) | 7 (3.6%) |
| 11:00 AM to 11:59 AM | 0 (0.0%) | 0 (0.0%) |
| 12:00 PM to 3:59 PM | 33 (17.3%) | 11 (5.7%) |
| 4:00 PM to 11:59 PM | 21 (11.0%) | 14 (7.2%) |
| Total | 191 (100.0%) | 194 (100.0%) |
Housing Occupancy in Monroe City
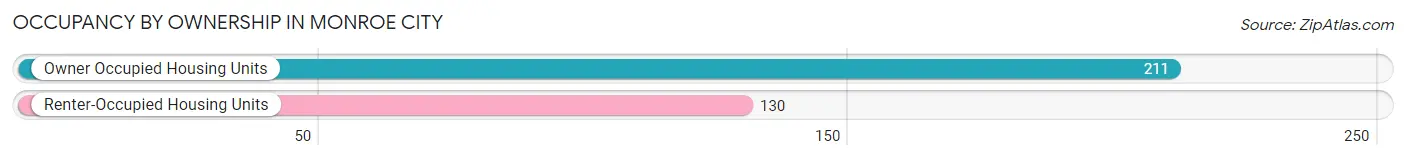
Occupancy by Ownership in Monroe City
Of the total 341 dwellings in Monroe City, owner-occupied units account for 211 (61.9%), while renter-occupied units make up 130 (38.1%).
| Occupancy | # Housing Units | % Housing Units |
| Owner Occupied Housing Units | 211 | 61.9% |
| Renter-Occupied Housing Units | 130 | 38.1% |
| Total Occupied Housing Units | 341 | 100.0% |
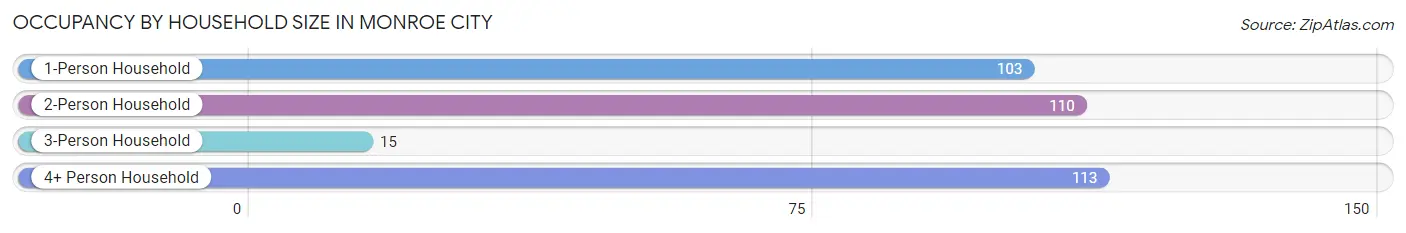
Occupancy by Household Size in Monroe City
| Household Size | # Housing Units | % Housing Units |
| 1-Person Household | 103 | 30.2% |
| 2-Person Household | 110 | 32.3% |
| 3-Person Household | 15 | 4.4% |
| 4+ Person Household | 113 | 33.1% |
| Total Housing Units | 341 | 100.0% |
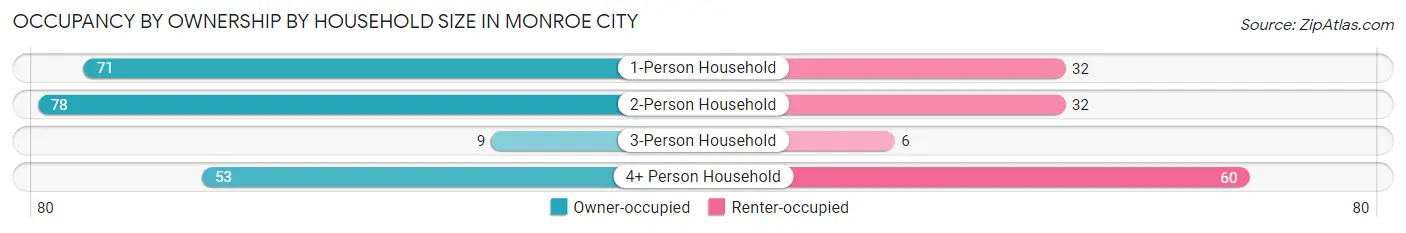
Occupancy by Ownership by Household Size in Monroe City
| Household Size | Owner-occupied | Renter-occupied |
| 1-Person Household | 71 (68.9%) | 32 (31.1%) |
| 2-Person Household | 78 (70.9%) | 32 (29.1%) |
| 3-Person Household | 9 (60.0%) | 6 (40.0%) |
| 4+ Person Household | 53 (46.9%) | 60 (53.1%) |
| Total Housing Units | 211 (61.9%) | 130 (38.1%) |
Occupancy by Educational Attainment in Monroe City
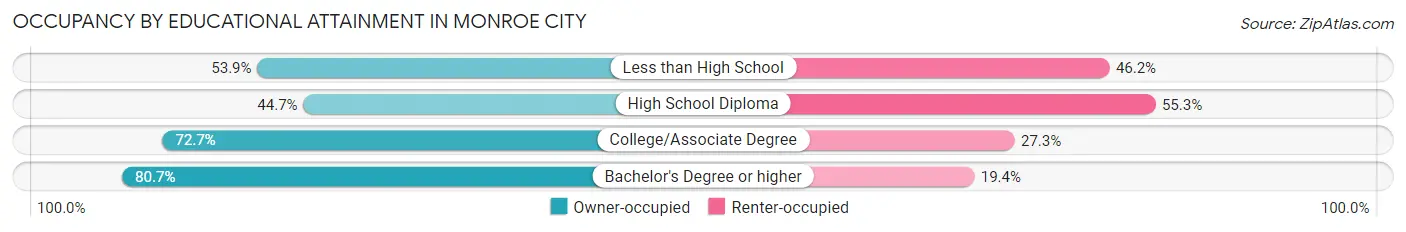
| Household Size | Owner-occupied | Renter-occupied |
| Less than High School | 14 (53.8%) | 12 (46.2%) |
| High School Diploma | 55 (44.7%) | 68 (55.3%) |
| College/Associate Degree | 117 (72.7%) | 44 (27.3%) |
| Bachelor's Degree or higher | 25 (80.6%) | 6 (19.4%) |
Occupancy by Age of Householder in Monroe City
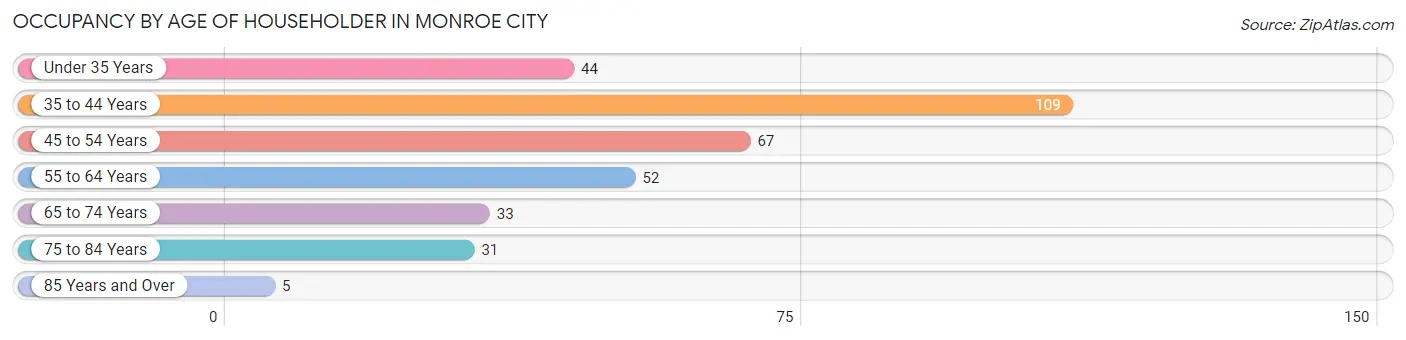
| Age Bracket | # Households | % Households |
| Under 35 Years | 44 | 12.9% |
| 35 to 44 Years | 109 | 32.0% |
| 45 to 54 Years | 67 | 19.7% |
| 55 to 64 Years | 52 | 15.2% |
| 65 to 74 Years | 33 | 9.7% |
| 75 to 84 Years | 31 | 9.1% |
| 85 Years and Over | 5 | 1.5% |
| Total | 341 | 100.0% |
Housing Finances in Monroe City
Median Income by Occupancy in Monroe City
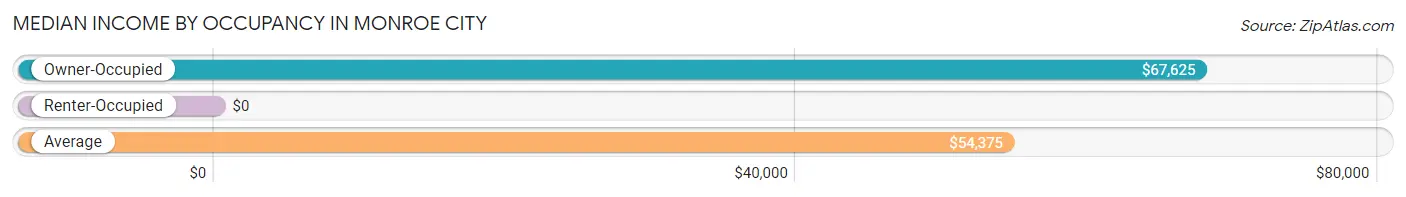
| Occupancy Type | # Households | Median Income |
| Owner-Occupied | 211 (61.9%) | $67,625 |
| Renter-Occupied | 130 (38.1%) | $0 |
| Average | 341 (100.0%) | $54,375 |
Occupancy by Householder Income Bracket in Monroe City
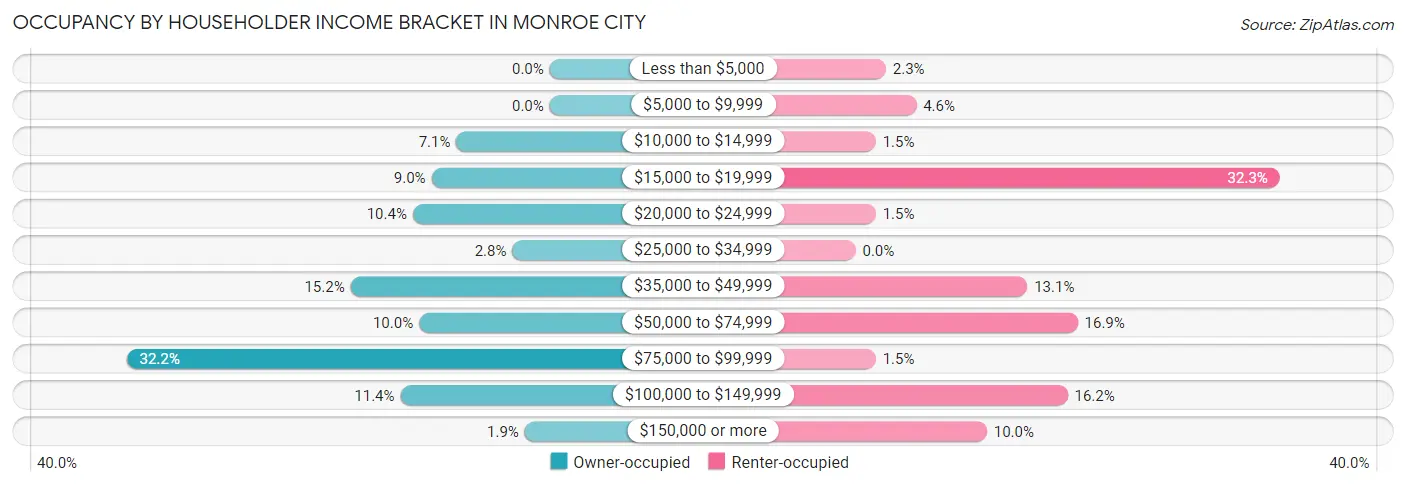
| Income Bracket | Owner-occupied | Renter-occupied |
| Less than $5,000 | 0 (0.0%) | 3 (2.3%) |
| $5,000 to $9,999 | 0 (0.0%) | 6 (4.6%) |
| $10,000 to $14,999 | 15 (7.1%) | 2 (1.5%) |
| $15,000 to $19,999 | 19 (9.0%) | 42 (32.3%) |
| $20,000 to $24,999 | 22 (10.4%) | 2 (1.5%) |
| $25,000 to $34,999 | 6 (2.8%) | 0 (0.0%) |
| $35,000 to $49,999 | 32 (15.2%) | 17 (13.1%) |
| $50,000 to $74,999 | 21 (10.0%) | 22 (16.9%) |
| $75,000 to $99,999 | 68 (32.2%) | 2 (1.5%) |
| $100,000 to $149,999 | 24 (11.4%) | 21 (16.2%) |
| $150,000 or more | 4 (1.9%) | 13 (10.0%) |
| Total | 211 (100.0%) | 130 (100.0%) |
Monthly Housing Cost Tiers in Monroe City
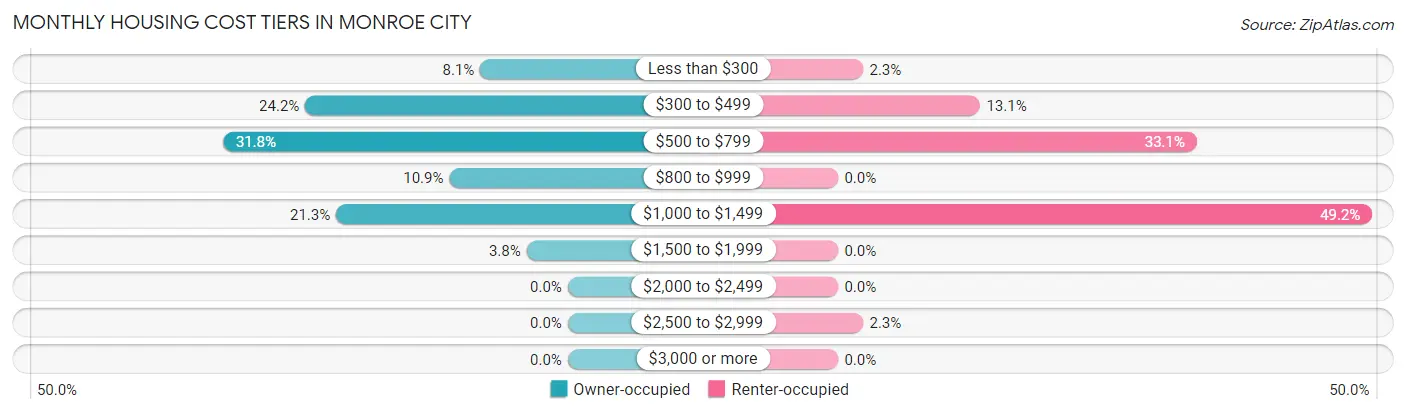
| Monthly Cost | Owner-occupied | Renter-occupied |
| Less than $300 | 17 (8.1%) | 3 (2.3%) |
| $300 to $499 | 51 (24.2%) | 17 (13.1%) |
| $500 to $799 | 67 (31.8%) | 43 (33.1%) |
| $800 to $999 | 23 (10.9%) | 0 (0.0%) |
| $1,000 to $1,499 | 45 (21.3%) | 64 (49.2%) |
| $1,500 to $1,999 | 8 (3.8%) | 0 (0.0%) |
| $2,000 to $2,499 | 0 (0.0%) | 0 (0.0%) |
| $2,500 to $2,999 | 0 (0.0%) | 3 (2.3%) |
| $3,000 or more | 0 (0.0%) | 0 (0.0%) |
| Total | 211 (100.0%) | 130 (100.0%) |
Physical Housing Characteristics in Monroe City
Housing Structures in Monroe City
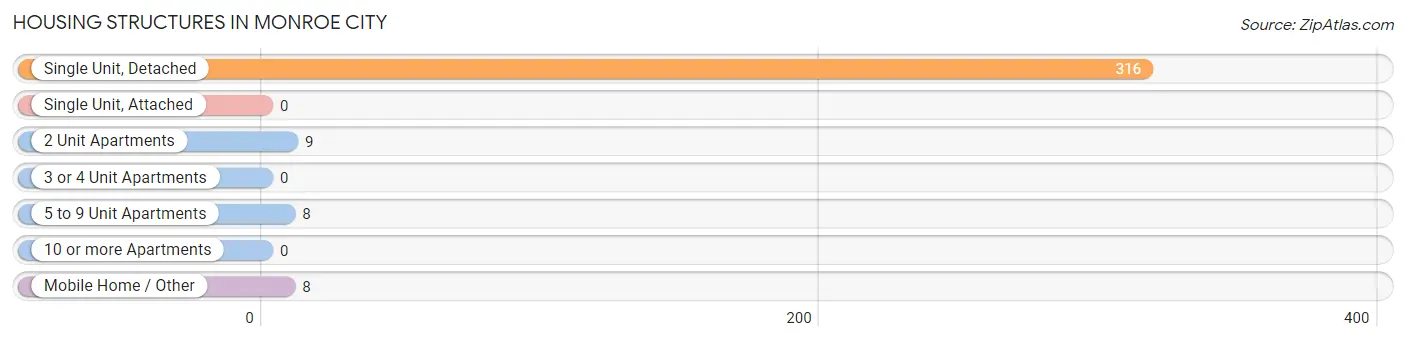
| Structure Type | # Housing Units | % Housing Units |
| Single Unit, Detached | 316 | 92.7% |
| Single Unit, Attached | 0 | 0.0% |
| 2 Unit Apartments | 9 | 2.6% |
| 3 or 4 Unit Apartments | 0 | 0.0% |
| 5 to 9 Unit Apartments | 8 | 2.4% |
| 10 or more Apartments | 0 | 0.0% |
| Mobile Home / Other | 8 | 2.4% |
| Total | 341 | 100.0% |
Housing Structures by Occupancy in Monroe City
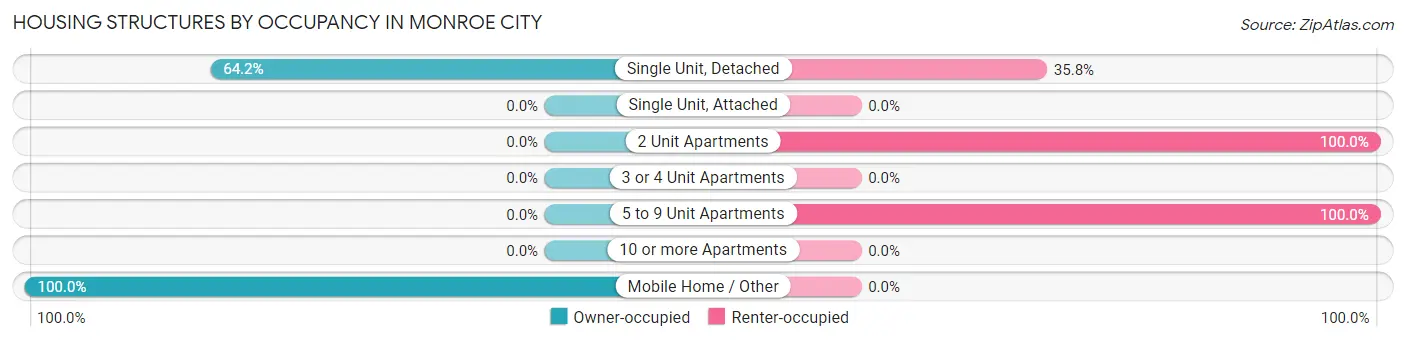
| Structure Type | Owner-occupied | Renter-occupied |
| Single Unit, Detached | 203 (64.2%) | 113 (35.8%) |
| Single Unit, Attached | 0 (0.0%) | 0 (0.0%) |
| 2 Unit Apartments | 0 (0.0%) | 9 (100.0%) |
| 3 or 4 Unit Apartments | 0 (0.0%) | 0 (0.0%) |
| 5 to 9 Unit Apartments | 0 (0.0%) | 8 (100.0%) |
| 10 or more Apartments | 0 (0.0%) | 0 (0.0%) |
| Mobile Home / Other | 8 (100.0%) | 0 (0.0%) |
| Total | 211 (61.9%) | 130 (38.1%) |
Housing Structures by Number of Rooms in Monroe City
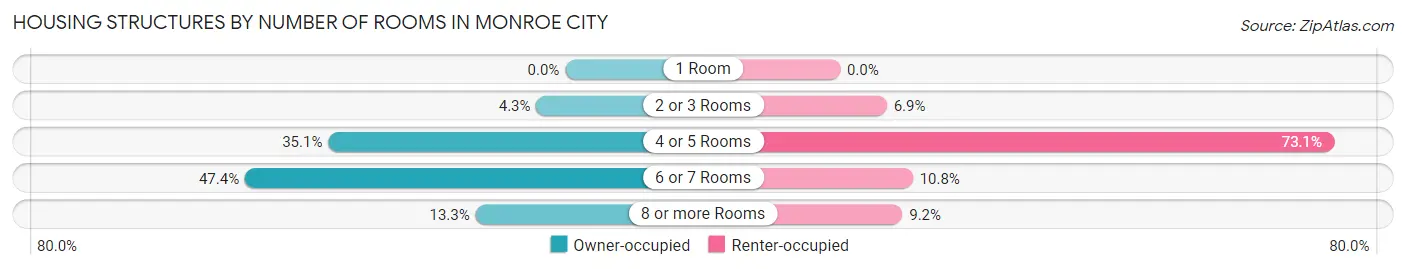
| Number of Rooms | Owner-occupied | Renter-occupied |
| 1 Room | 0 (0.0%) | 0 (0.0%) |
| 2 or 3 Rooms | 9 (4.3%) | 9 (6.9%) |
| 4 or 5 Rooms | 74 (35.1%) | 95 (73.1%) |
| 6 or 7 Rooms | 100 (47.4%) | 14 (10.8%) |
| 8 or more Rooms | 28 (13.3%) | 12 (9.2%) |
| Total | 211 (100.0%) | 130 (100.0%) |
Housing Structure by Heating Type in Monroe City
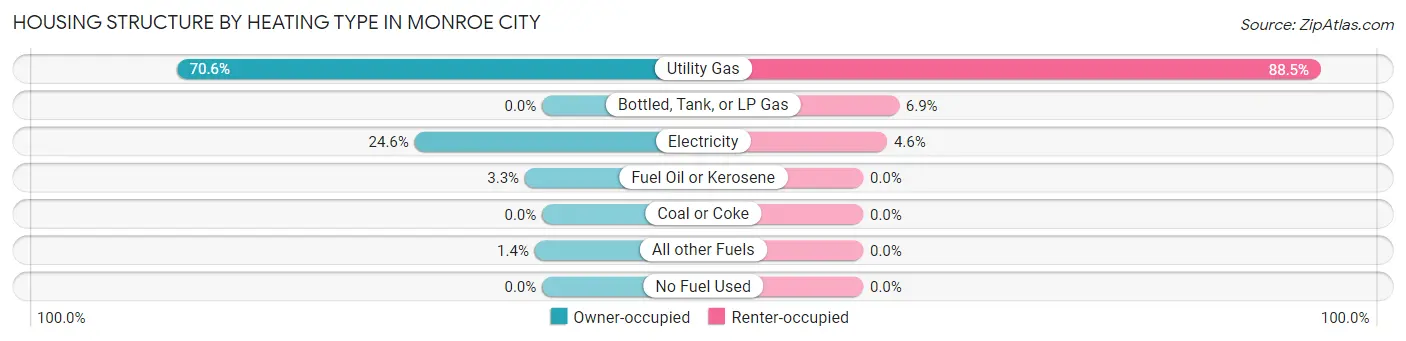
| Heating Type | Owner-occupied | Renter-occupied |
| Utility Gas | 149 (70.6%) | 115 (88.5%) |
| Bottled, Tank, or LP Gas | 0 (0.0%) | 9 (6.9%) |
| Electricity | 52 (24.6%) | 6 (4.6%) |
| Fuel Oil or Kerosene | 7 (3.3%) | 0 (0.0%) |
| Coal or Coke | 0 (0.0%) | 0 (0.0%) |
| All other Fuels | 3 (1.4%) | 0 (0.0%) |
| No Fuel Used | 0 (0.0%) | 0 (0.0%) |
| Total | 211 (100.0%) | 130 (100.0%) |
Household Vehicle Usage in Monroe City
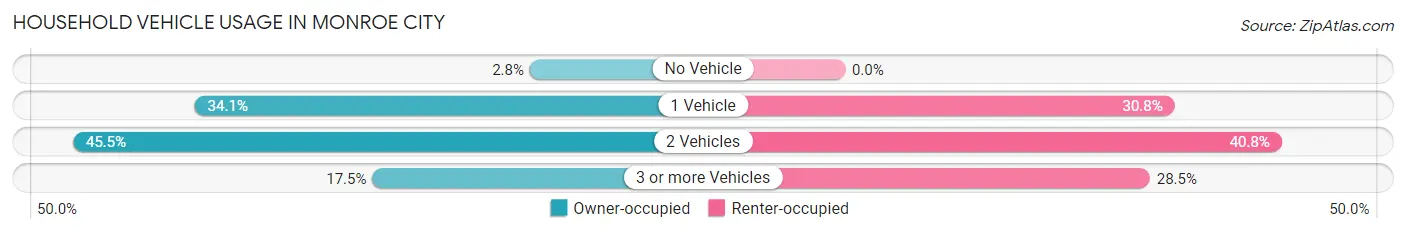
| Vehicles per Household | Owner-occupied | Renter-occupied |
| No Vehicle | 6 (2.8%) | 0 (0.0%) |
| 1 Vehicle | 72 (34.1%) | 40 (30.8%) |
| 2 Vehicles | 96 (45.5%) | 53 (40.8%) |
| 3 or more Vehicles | 37 (17.5%) | 37 (28.5%) |
| Total | 211 (100.0%) | 130 (100.0%) |
Real Estate & Mortgages in Monroe City
Real Estate and Mortgage Overview in Monroe City
| Characteristic | Without Mortgage | With Mortgage |
| Housing Units | 92 | 119 |
| Median Property Value | $86,200 | $89,600 |
| Median Household Income | $47,500 | $1 |
| Monthly Housing Costs | $438 | $0 |
| Real Estate Taxes | $375 | $3 |
Property Value by Mortgage Status in Monroe City
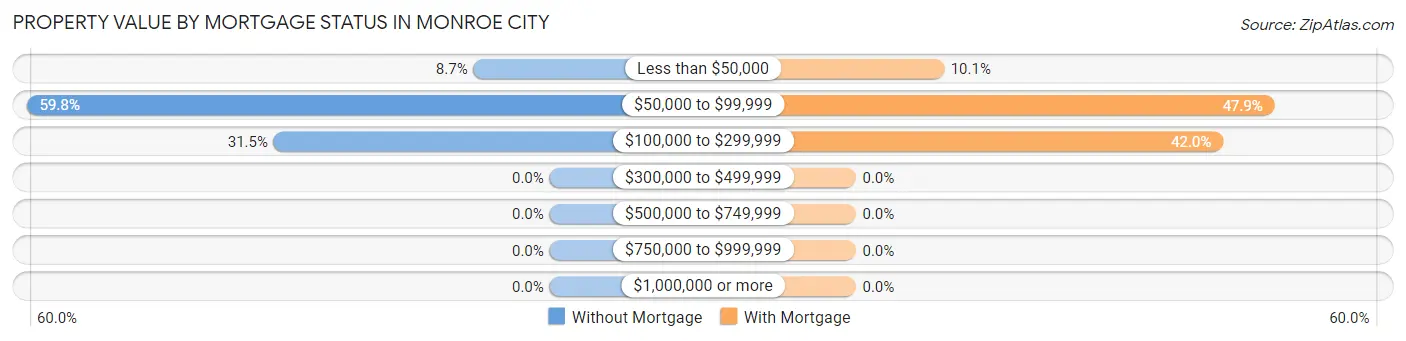
| Property Value | Without Mortgage | With Mortgage |
| Less than $50,000 | 8 (8.7%) | 12 (10.1%) |
| $50,000 to $99,999 | 55 (59.8%) | 57 (47.9%) |
| $100,000 to $299,999 | 29 (31.5%) | 50 (42.0%) |
| $300,000 to $499,999 | 0 (0.0%) | 0 (0.0%) |
| $500,000 to $749,999 | 0 (0.0%) | 0 (0.0%) |
| $750,000 to $999,999 | 0 (0.0%) | 0 (0.0%) |
| $1,000,000 or more | 0 (0.0%) | 0 (0.0%) |
| Total | 92 (100.0%) | 119 (100.0%) |
Household Income by Mortgage Status in Monroe City
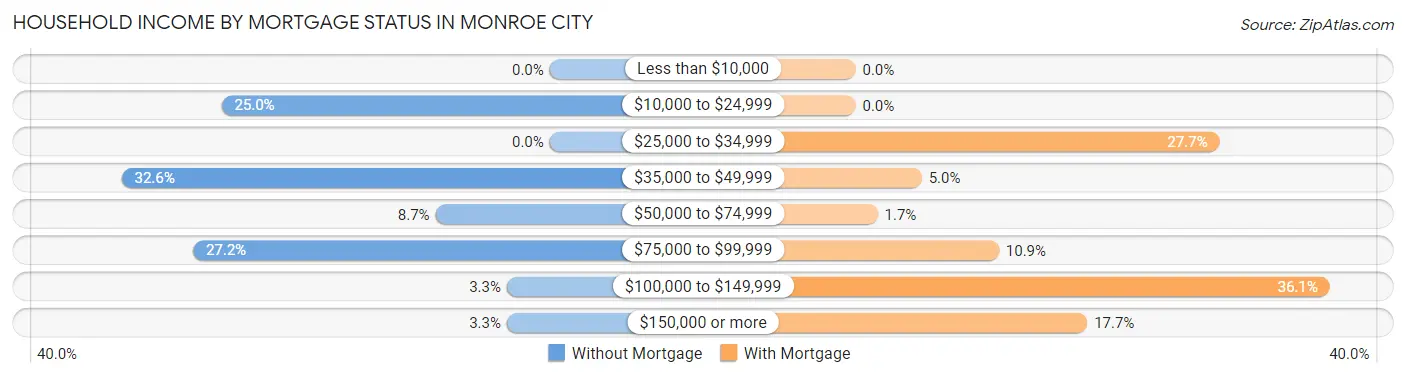
| Household Income | Without Mortgage | With Mortgage |
| Less than $10,000 | 0 (0.0%) | 0 (0.0%) |
| $10,000 to $24,999 | 23 (25.0%) | 0 (0.0%) |
| $25,000 to $34,999 | 0 (0.0%) | 33 (27.7%) |
| $35,000 to $49,999 | 30 (32.6%) | 6 (5.0%) |
| $50,000 to $74,999 | 8 (8.7%) | 2 (1.7%) |
| $75,000 to $99,999 | 25 (27.2%) | 13 (10.9%) |
| $100,000 to $149,999 | 3 (3.3%) | 43 (36.1%) |
| $150,000 or more | 3 (3.3%) | 21 (17.6%) |
| Total | 92 (100.0%) | 119 (100.0%) |
Property Value to Household Income Ratio in Monroe City
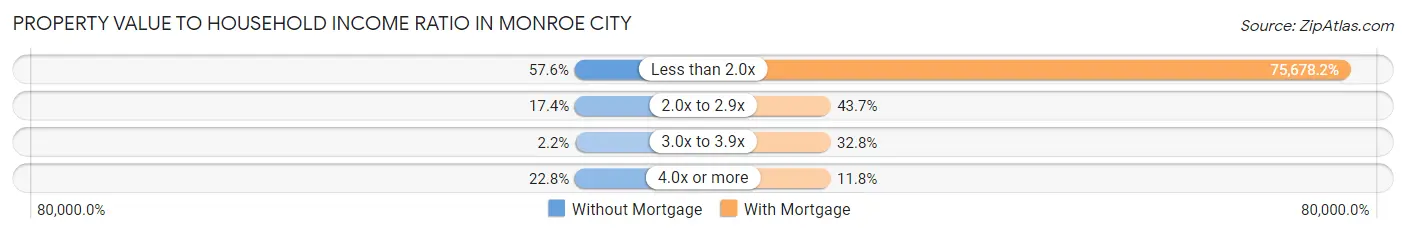
| Value-to-Income Ratio | Without Mortgage | With Mortgage |
| Less than 2.0x | 53 (57.6%) | 90,057 (75,678.2%) |
| 2.0x to 2.9x | 16 (17.4%) | 52 (43.7%) |
| 3.0x to 3.9x | 2 (2.2%) | 39 (32.8%) |
| 4.0x or more | 21 (22.8%) | 14 (11.8%) |
| Total | 92 (100.0%) | 119 (100.0%) |
Real Estate Taxes by Mortgage Status in Monroe City
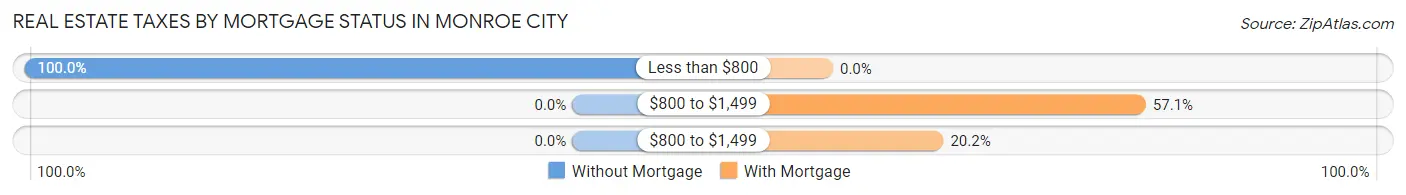
| Property Taxes | Without Mortgage | With Mortgage |
| Less than $800 | 92 (100.0%) | 0 (0.0%) |
| $800 to $1,499 | 0 (0.0%) | 68 (57.1%) |
| $800 to $1,499 | 0 (0.0%) | 24 (20.2%) |
| Total | 92 (100.0%) | 119 (100.0%) |
Health & Disability in Monroe City
Health Insurance Coverage by Age in Monroe City
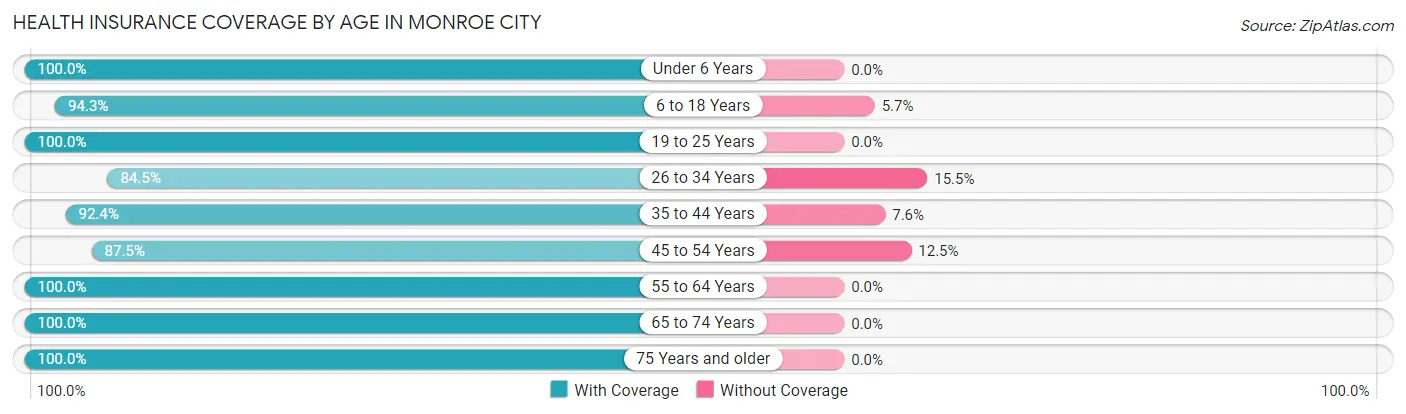
| Age Bracket | With Coverage | Without Coverage |
| Under 6 Years | 89 (100.0%) | 0 (0.0%) |
| 6 to 18 Years | 166 (94.3%) | 10 (5.7%) |
| 19 to 25 Years | 19 (100.0%) | 0 (0.0%) |
| 26 to 34 Years | 142 (84.5%) | 26 (15.5%) |
| 35 to 44 Years | 145 (92.4%) | 12 (7.6%) |
| 45 to 54 Years | 84 (87.5%) | 12 (12.5%) |
| 55 to 64 Years | 66 (100.0%) | 0 (0.0%) |
| 65 to 74 Years | 45 (100.0%) | 0 (0.0%) |
| 75 Years and older | 51 (100.0%) | 0 (0.0%) |
| Total | 807 (93.1%) | 60 (6.9%) |
Health Insurance Coverage by Citizenship Status in Monroe City
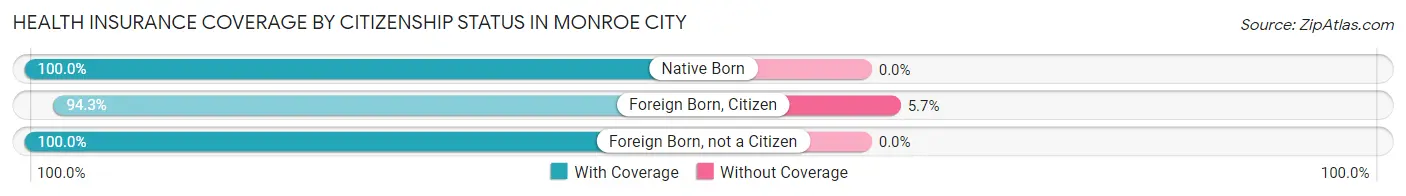
| Citizenship Status | With Coverage | Without Coverage |
| Native Born | 89 (100.0%) | 0 (0.0%) |
| Foreign Born, Citizen | 166 (94.3%) | 10 (5.7%) |
| Foreign Born, not a Citizen | 19 (100.0%) | 0 (0.0%) |
Health Insurance Coverage by Household Income in Monroe City
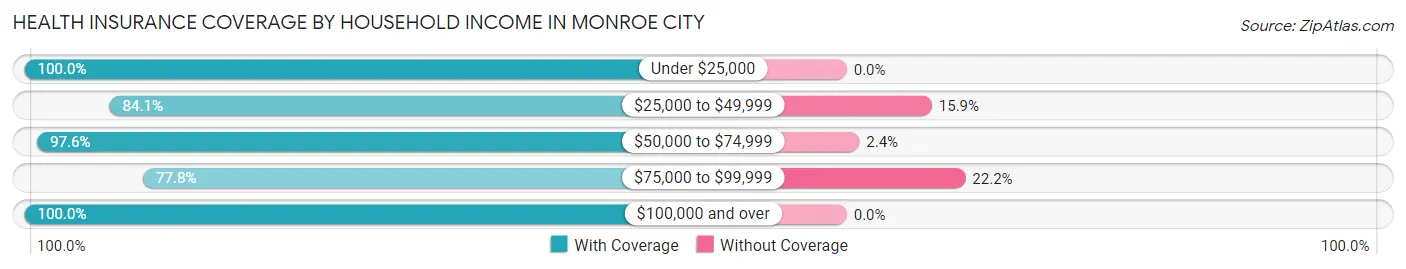
| Household Income | With Coverage | Without Coverage |
| Under $25,000 | 282 (100.0%) | 0 (0.0%) |
| $25,000 to $49,999 | 58 (84.1%) | 11 (15.9%) |
| $50,000 to $74,999 | 124 (97.6%) | 3 (2.4%) |
| $75,000 to $99,999 | 161 (77.8%) | 46 (22.2%) |
| $100,000 and over | 182 (100.0%) | 0 (0.0%) |
Public vs Private Health Insurance Coverage by Age in Monroe City
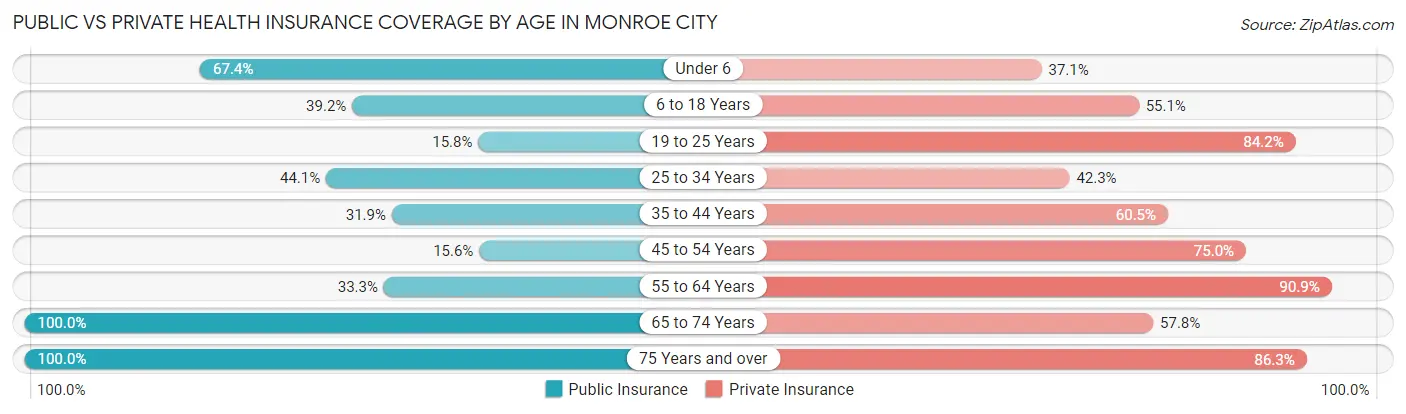
| Age Bracket | Public Insurance | Private Insurance |
| Under 6 | 60 (67.4%) | 33 (37.1%) |
| 6 to 18 Years | 69 (39.2%) | 97 (55.1%) |
| 19 to 25 Years | 3 (15.8%) | 16 (84.2%) |
| 25 to 34 Years | 74 (44.1%) | 71 (42.3%) |
| 35 to 44 Years | 50 (31.9%) | 95 (60.5%) |
| 45 to 54 Years | 15 (15.6%) | 72 (75.0%) |
| 55 to 64 Years | 22 (33.3%) | 60 (90.9%) |
| 65 to 74 Years | 45 (100.0%) | 26 (57.8%) |
| 75 Years and over | 51 (100.0%) | 44 (86.3%) |
| Total | 389 (44.9%) | 514 (59.3%) |
Disability Status by Sex by Age in Monroe City
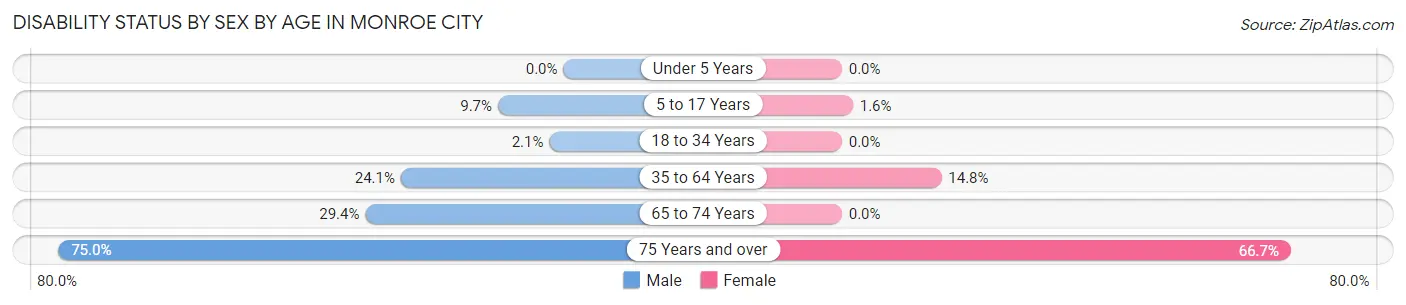
| Age Bracket | Male | Female |
| Under 5 Years | 0 (0.0%) | 0 (0.0%) |
| 5 to 17 Years | 7 (9.7%) | 2 (1.6%) |
| 18 to 34 Years | 3 (2.1%) | 0 (0.0%) |
| 35 to 64 Years | 28 (24.1%) | 30 (14.8%) |
| 65 to 74 Years | 5 (29.4%) | 0 (0.0%) |
| 75 Years and over | 9 (75.0%) | 26 (66.7%) |
Disability Class by Sex by Age in Monroe City
Disability Class: Hearing Difficulty
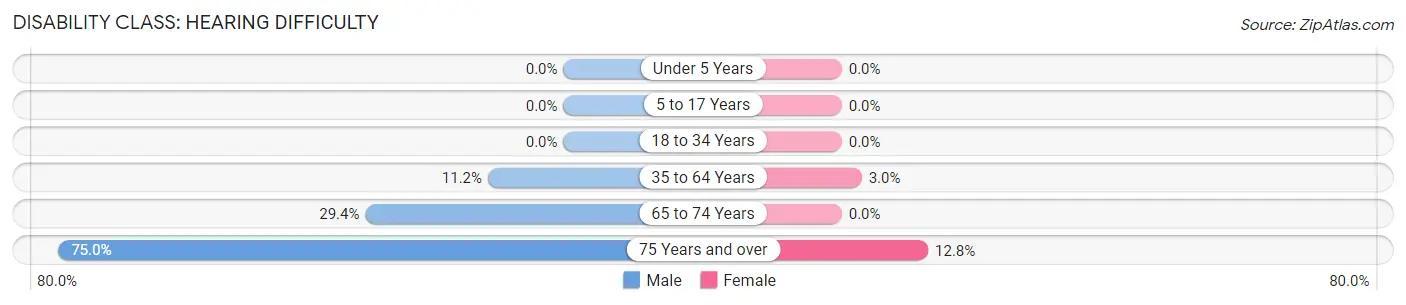
| Age Bracket | Male | Female |
| Under 5 Years | 0 (0.0%) | 0 (0.0%) |
| 5 to 17 Years | 0 (0.0%) | 0 (0.0%) |
| 18 to 34 Years | 0 (0.0%) | 0 (0.0%) |
| 35 to 64 Years | 13 (11.2%) | 6 (3.0%) |
| 65 to 74 Years | 5 (29.4%) | 0 (0.0%) |
| 75 Years and over | 9 (75.0%) | 5 (12.8%) |
Disability Class: Vision Difficulty
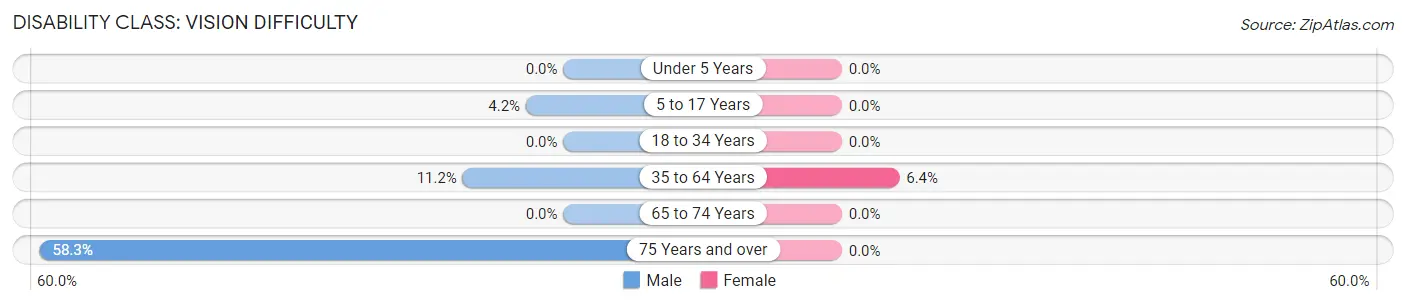
| Age Bracket | Male | Female |
| Under 5 Years | 0 (0.0%) | 0 (0.0%) |
| 5 to 17 Years | 3 (4.2%) | 0 (0.0%) |
| 18 to 34 Years | 0 (0.0%) | 0 (0.0%) |
| 35 to 64 Years | 13 (11.2%) | 13 (6.4%) |
| 65 to 74 Years | 0 (0.0%) | 0 (0.0%) |
| 75 Years and over | 7 (58.3%) | 0 (0.0%) |
Disability Class: Cognitive Difficulty
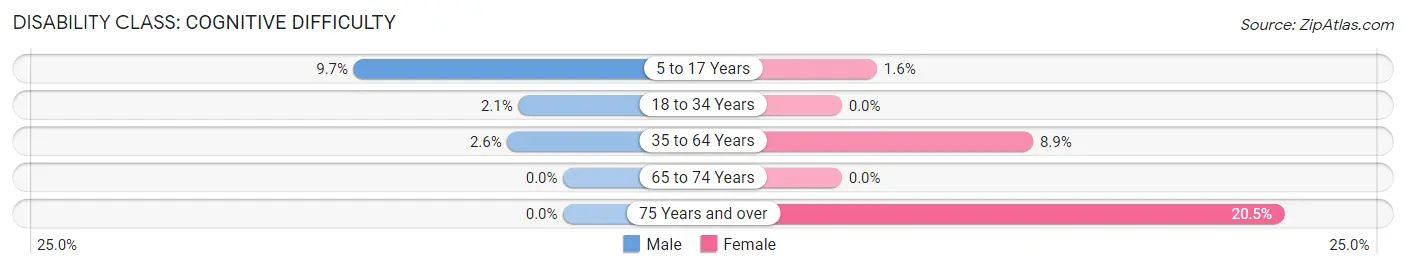
| Age Bracket | Male | Female |
| 5 to 17 Years | 7 (9.7%) | 2 (1.6%) |
| 18 to 34 Years | 3 (2.1%) | 0 (0.0%) |
| 35 to 64 Years | 3 (2.6%) | 18 (8.9%) |
| 65 to 74 Years | 0 (0.0%) | 0 (0.0%) |
| 75 Years and over | 0 (0.0%) | 8 (20.5%) |
Disability Class: Ambulatory Difficulty
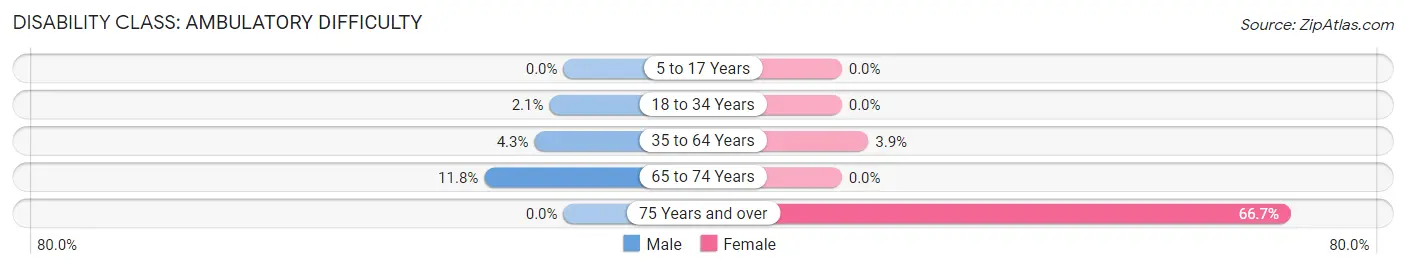
| Age Bracket | Male | Female |
| 5 to 17 Years | 0 (0.0%) | 0 (0.0%) |
| 18 to 34 Years | 3 (2.1%) | 0 (0.0%) |
| 35 to 64 Years | 5 (4.3%) | 8 (3.9%) |
| 65 to 74 Years | 2 (11.8%) | 0 (0.0%) |
| 75 Years and over | 0 (0.0%) | 26 (66.7%) |
Disability Class: Self-Care Difficulty
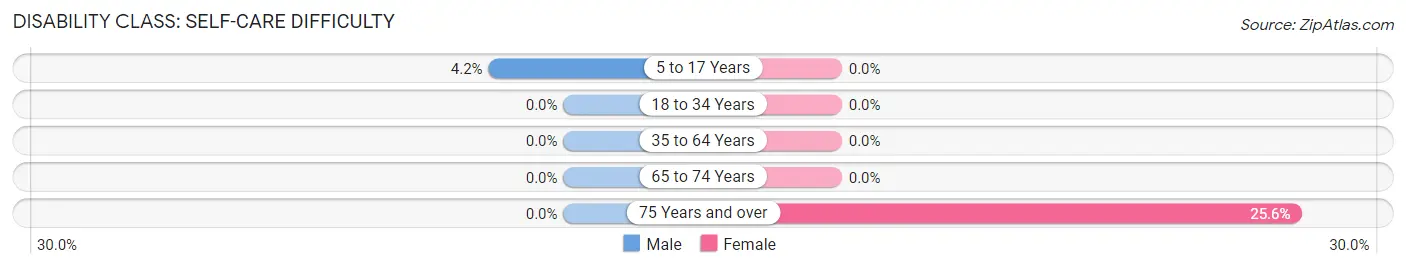
| Age Bracket | Male | Female |
| 5 to 17 Years | 3 (4.2%) | 0 (0.0%) |
| 18 to 34 Years | 0 (0.0%) | 0 (0.0%) |
| 35 to 64 Years | 0 (0.0%) | 0 (0.0%) |
| 65 to 74 Years | 0 (0.0%) | 0 (0.0%) |
| 75 Years and over | 0 (0.0%) | 10 (25.6%) |
Technology Access in Monroe City
Computing Device Access in Monroe City
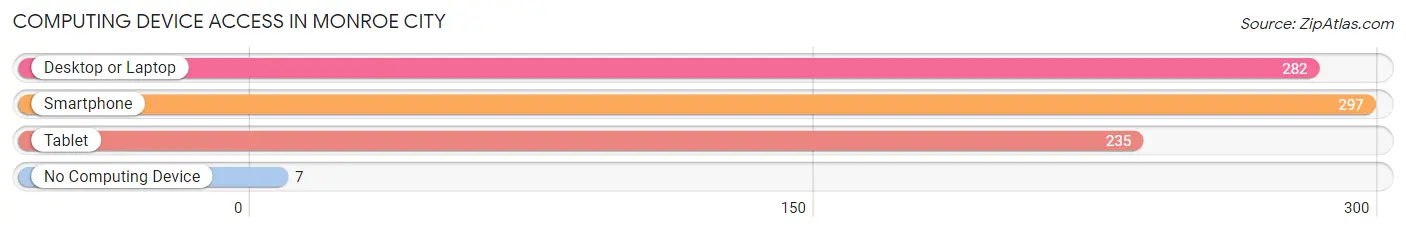
| Device Type | # Households | % Households |
| Desktop or Laptop | 282 | 82.7% |
| Smartphone | 297 | 87.1% |
| Tablet | 235 | 68.9% |
| No Computing Device | 7 | 2.1% |
| Total | 341 | 100.0% |
Internet Access in Monroe City
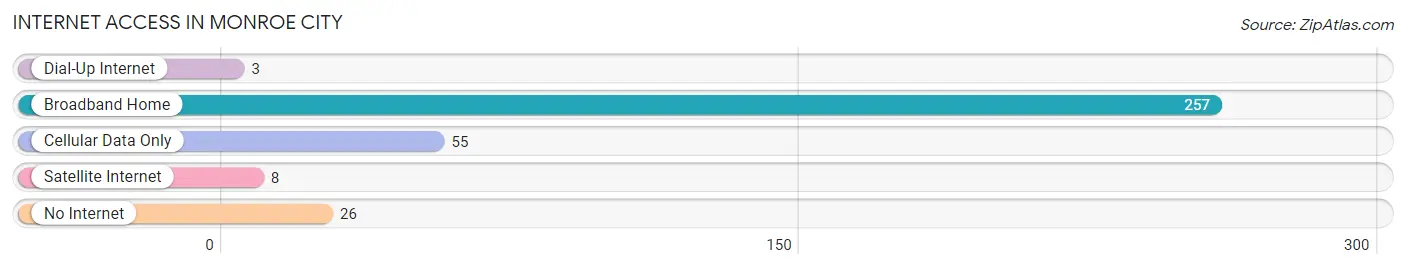
| Internet Type | # Households | % Households |
| Dial-Up Internet | 3 | 0.9% |
| Broadband Home | 257 | 75.4% |
| Cellular Data Only | 55 | 16.1% |
| Satellite Internet | 8 | 2.4% |
| No Internet | 26 | 7.6% |
| Total | 341 | 100.0% |
Monroe City Summary
Monroe City is a small town located in Knox County, Indiana, United States. It is situated on the banks of the Wabash River, about 25 miles south of the state capital of Indianapolis. The town was founded in 1818 and has a population of approximately 1,500 people.
History
Monroe City was founded in 1818 by William Monroe, a Revolutionary War veteran. He named the town after himself and it was incorporated in 1837. The town was originally a farming community, but it soon became a center for industry and commerce. The Wabash and Erie Canal was built in the area in the 1840s, connecting the town to the Ohio River and providing a transportation route for goods and services.
In the late 19th century, Monroe City became a major hub for the railroad industry. The town was home to several major railroads, including the Chicago, Indianapolis and Louisville Railway, the Chicago and Eastern Illinois Railroad, and the Monon Railroad. The railroads provided jobs and economic growth to the area, and the town flourished.
In the early 20th century, Monroe City was a popular tourist destination. The town was home to several resorts and hotels, and it was a popular spot for fishing and hunting. The town also had a thriving entertainment scene, with several theaters and vaudeville shows.
Geography
Monroe City is located in Knox County, Indiana, on the banks of the Wabash River. The town is situated about 25 miles south of the state capital of Indianapolis. The town is surrounded by rolling hills and farmland, and it is located in the Wabash Valley.
The climate in Monroe City is humid continental, with hot summers and cold winters. The average annual temperature is around 50 degrees Fahrenheit, and the average annual precipitation is around 40 inches.
Economy
Monroe City’s economy is largely based on agriculture and manufacturing. The town is home to several large farms, and it is a major producer of corn, soybeans, and wheat. The town is also home to several manufacturing companies, including a steel mill and a paper mill.
The town is also home to several small businesses, including restaurants, shops, and services. The town is also home to several tourist attractions, including the Wabash and Erie Canal Museum and the Monroe City Historical Museum.
Demographics
As of the 2010 census, Monroe City had a population of 1,500 people. The racial makeup of the town was 97.3% White, 0.7% African American, 0.3% Native American, 0.3% Asian, and 1.3% from other races. The median household income was $37,500, and the median family income was $45,000.
Monroe City is a small, rural town with a close-knit community. The town is home to several churches, and it is a popular spot for fishing and hunting. The town is also home to several parks and recreational areas, including the Wabash and Erie Canal Park and the Monroe City Historical Park.
Common Questions
What is Per Capita Income in Monroe City?
Per Capita income in Monroe City is $27,785.
What is the Median Family Income in Monroe City?
Median Family Income in Monroe City is $68,421.
What is the Median Household income in Monroe City?
Median Household Income in Monroe City is $54,375.
What is Income or Wage Gap in Monroe City?
Income or Wage Gap in Monroe City is 24.5%.
Women in Monroe City earn 75.5 cents for every dollar earned by a man.
What is Inequality or Gini Index in Monroe City?
Inequality or Gini Index in Monroe City is 0.45.
What is the Total Population of Monroe City?
Total Population of Monroe City is 867.
What is the Total Male Population of Monroe City?
Total Male Population of Monroe City is 405.
What is the Total Female Population of Monroe City?
Total Female Population of Monroe City is 462.
What is the Ratio of Males per 100 Females in Monroe City?
There are 87.66 Males per 100 Females in Monroe City.
What is the Ratio of Females per 100 Males in Monroe City?
There are 114.07 Females per 100 Males in Monroe City.
What is the Median Population Age in Monroe City?
Median Population Age in Monroe City is 33.8 Years.
What is the Average Family Size in Monroe City
Average Family Size in Monroe City is 3.1 People.
What is the Average Household Size in Monroe City
Average Household Size in Monroe City is 2.5 People.
How Large is the Labor Force in Monroe City?
There are 391 People in the Labor Forcein in Monroe City.
What is the Percentage of People in the Labor Force in Monroe City?
61.5% of People are in the Labor Force in Monroe City.