Mitchell, IN Map & Demographics
Mitchell Map
Mitchell Overview
$20,294
PER CAPITA INCOME
$61,641
AVG FAMILY INCOME
$51,025
AVG HOUSEHOLD INCOME
23.2%
WAGE / INCOME GAP [ % ]
76.8¢/ $1
WAGE / INCOME GAP [ $ ]
0.38
INEQUALITY / GINI INDEX
3,947
TOTAL POPULATION
1,825
MALE POPULATION
2,122
FEMALE POPULATION
86.00
MALES / 100 FEMALES
116.27
FEMALES / 100 MALES
35.5
MEDIAN AGE
3.8
AVG FAMILY SIZE
2.8
AVG HOUSEHOLD SIZE
1,596
LABOR FORCE [ PEOPLE ]
55.8%
PERCENT IN LABOR FORCE
5.8%
UNEMPLOYMENT RATE
Mitchell Zip Codes
Mitchell Area Codes
Income in Mitchell
Income Overview in Mitchell
Per Capita Income in Mitchell is $20,294, while median incomes of families and households are $61,641 and $51,025 respectively.
| Characteristic | Number | Measure |
| Per Capita Income | 3,947 | $20,294 |
| Median Family Income | 824 | $61,641 |
| Mean Family Income | 824 | $71,112 |
| Median Household Income | 1,394 | $51,025 |
| Mean Household Income | 1,394 | $57,872 |
| Income Deficit | 824 | $0 |
| Wage / Income Gap (%) | 3,947 | 23.18% |
| Wage / Income Gap ($) | 3,947 | 76.82¢ per $1 |
| Gini / Inequality Index | 3,947 | 0.38 |
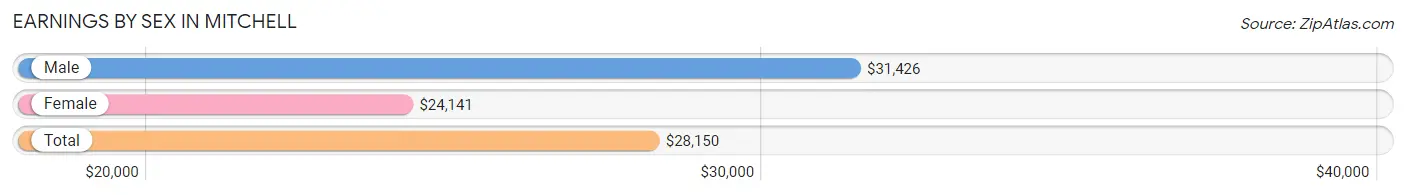
Earnings by Sex in Mitchell
Average Earnings in Mitchell are $28,150, $31,426 for men and $24,141 for women, a difference of 23.2%.
| Sex | Number | Average Earnings |
| Male | 771 (45.3%) | $31,426 |
| Female | 930 (54.7%) | $24,141 |
| Total | 1,701 (100.0%) | $28,150 |
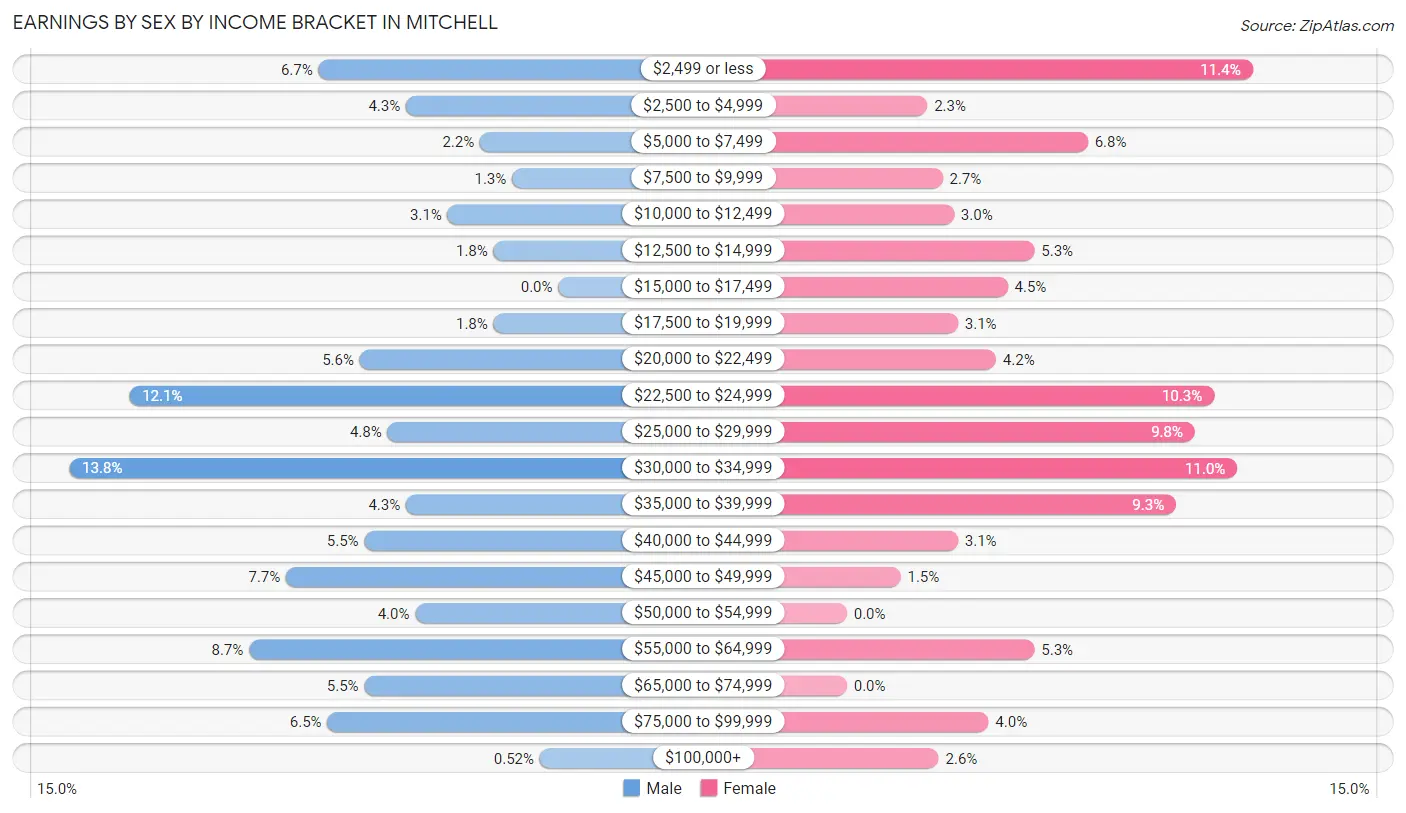
Earnings by Sex by Income Bracket in Mitchell
The most common earnings brackets in Mitchell are $30,000 to $34,999 for men (106 | 13.8%) and $2,499 or less for women (106 | 11.4%).
| Income | Male | Female |
| $2,499 or less | 52 (6.7%) | 106 (11.4%) |
| $2,500 to $4,999 | 33 (4.3%) | 21 (2.3%) |
| $5,000 to $7,499 | 17 (2.2%) | 63 (6.8%) |
| $7,500 to $9,999 | 10 (1.3%) | 25 (2.7%) |
| $10,000 to $12,499 | 24 (3.1%) | 28 (3.0%) |
| $12,500 to $14,999 | 14 (1.8%) | 49 (5.3%) |
| $15,000 to $17,499 | 0 (0.0%) | 42 (4.5%) |
| $17,500 to $19,999 | 14 (1.8%) | 29 (3.1%) |
| $20,000 to $22,499 | 43 (5.6%) | 39 (4.2%) |
| $22,500 to $24,999 | 93 (12.1%) | 96 (10.3%) |
| $25,000 to $29,999 | 37 (4.8%) | 91 (9.8%) |
| $30,000 to $34,999 | 106 (13.8%) | 102 (11.0%) |
| $35,000 to $39,999 | 33 (4.3%) | 86 (9.2%) |
| $40,000 to $44,999 | 42 (5.4%) | 29 (3.1%) |
| $45,000 to $49,999 | 59 (7.6%) | 14 (1.5%) |
| $50,000 to $54,999 | 31 (4.0%) | 0 (0.0%) |
| $55,000 to $64,999 | 67 (8.7%) | 49 (5.3%) |
| $65,000 to $74,999 | 42 (5.4%) | 0 (0.0%) |
| $75,000 to $99,999 | 50 (6.5%) | 37 (4.0%) |
| $100,000+ | 4 (0.5%) | 24 (2.6%) |
| Total | 771 (100.0%) | 930 (100.0%) |
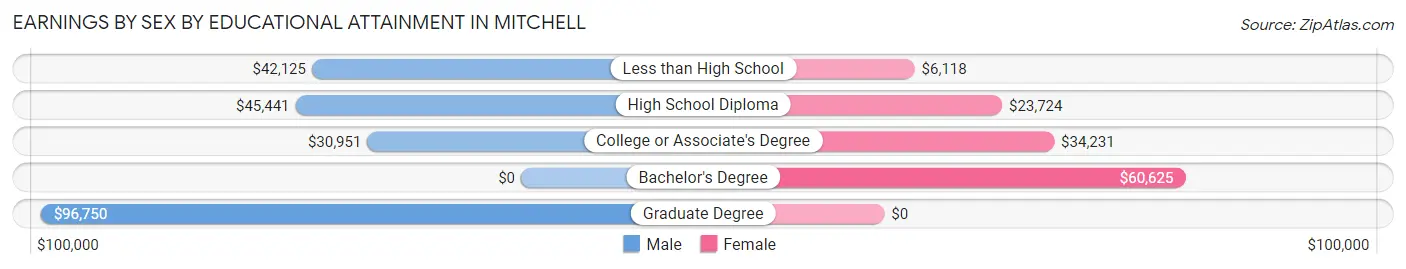
Earnings by Sex by Educational Attainment in Mitchell
Average earnings in Mitchell are $35,938 for men and $24,536 for women, a difference of 31.7%. Men with an educational attainment of graduate degree enjoy the highest average annual earnings of $96,750, while those with college or associate's degree education earn the least with $30,951. Women with an educational attainment of bachelor's degree earn the most with the average annual earnings of $60,625, while those with less than high school education have the smallest earnings of $6,118.
| Educational Attainment | Male Income | Female Income |
| Less than High School | $42,125 | $6,118 |
| High School Diploma | $45,441 | $23,724 |
| College or Associate's Degree | $30,951 | $34,231 |
| Bachelor's Degree | - | - |
| Graduate Degree | $96,750 | $0 |
| Total | $35,938 | $24,536 |
Family Income in Mitchell
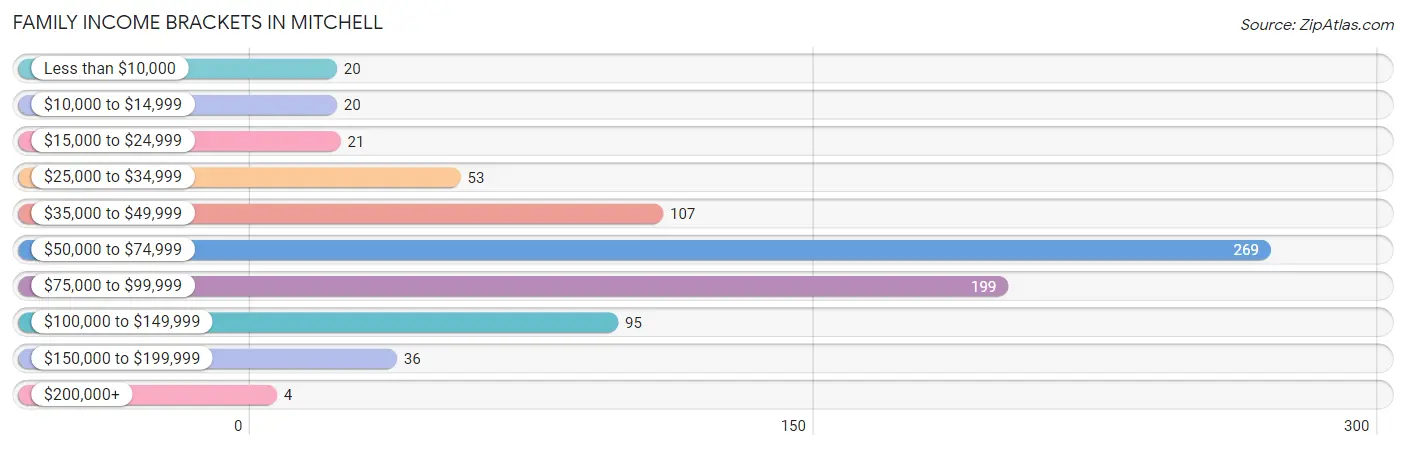
Family Income Brackets in Mitchell
According to the Mitchell family income data, there are 269 families falling into the $50,000 to $74,999 income range, which is the most common income bracket and makes up 32.7% of all families. Conversely, the $200,000+ income bracket is the least frequent group with only 4 families (0.5%) belonging to this category.
| Income Bracket | # Families | % Families |
| Less than $10,000 | 20 | 2.4% |
| $10,000 to $14,999 | 20 | 2.4% |
| $15,000 to $24,999 | 21 | 2.5% |
| $25,000 to $34,999 | 53 | 6.4% |
| $35,000 to $49,999 | 107 | 13.0% |
| $50,000 to $74,999 | 269 | 32.6% |
| $75,000 to $99,999 | 199 | 24.2% |
| $100,000 to $149,999 | 95 | 11.5% |
| $150,000 to $199,999 | 36 | 4.4% |
| $200,000+ | 4 | 0.5% |
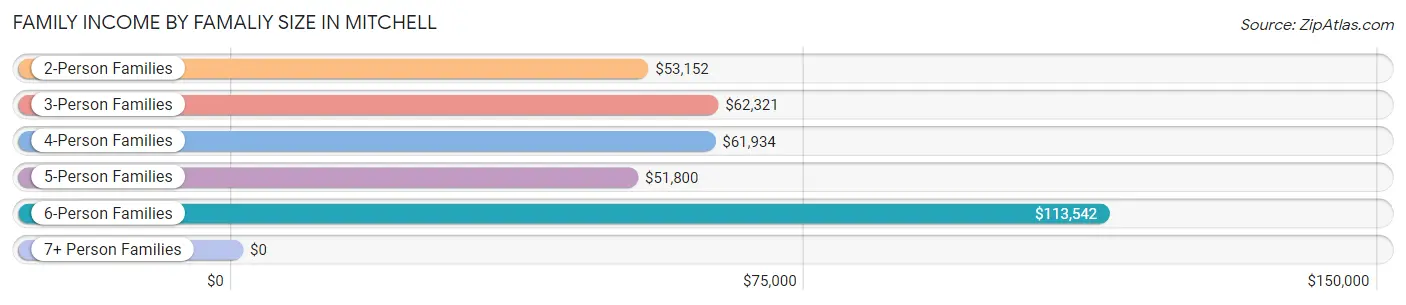
Family Income by Famaliy Size in Mitchell
6-person families (46 | 5.6%) account for the highest median family income in Mitchell with $113,542 per family, while 2-person families (288 | 34.9%) have the highest median income of $26,576 per family member.
| Income Bracket | # Families | Median Income |
| 2-Person Families | 288 (34.9%) | $53,152 |
| 3-Person Families | 131 (15.9%) | $62,321 |
| 4-Person Families | 175 (21.2%) | $61,934 |
| 5-Person Families | 118 (14.3%) | $51,800 |
| 6-Person Families | 46 (5.6%) | $113,542 |
| 7+ Person Families | 66 (8.0%) | $0 |
| Total | 824 (100.0%) | $61,641 |
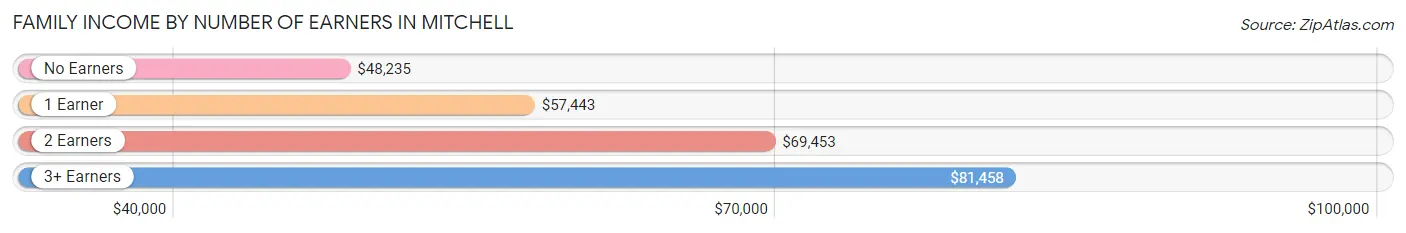
Family Income by Number of Earners in Mitchell
The median family income in Mitchell is $61,641, with families comprising 3+ earners (162) having the highest median family income of $81,458, while families with no earners (100) have the lowest median family income of $48,235, accounting for 19.7% and 12.1% of families, respectively.
| Number of Earners | # Families | Median Income |
| No Earners | 100 (12.1%) | $48,235 |
| 1 Earner | 321 (39.0%) | $57,443 |
| 2 Earners | 241 (29.2%) | $69,453 |
| 3+ Earners | 162 (19.7%) | $81,458 |
| Total | 824 (100.0%) | $61,641 |
Household Income in Mitchell
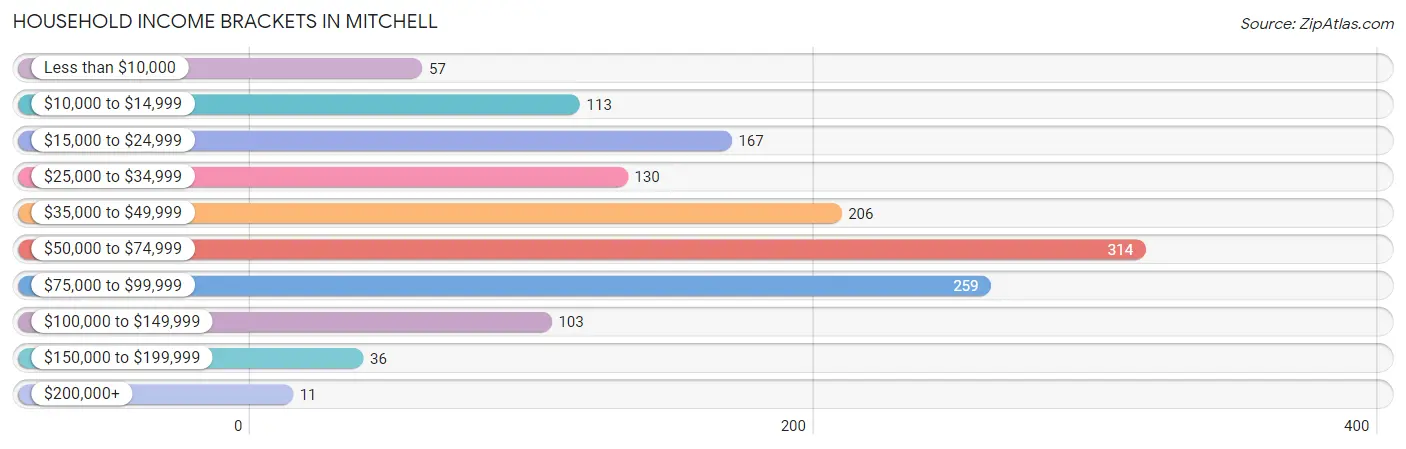
Household Income Brackets in Mitchell
With 314 households falling in the category, the $50,000 to $74,999 income range is the most frequent in Mitchell, accounting for 22.5% of all households. In contrast, only 11 households (0.8%) fall into the $200,000+ income bracket, making it the least populous group.
| Income Bracket | # Households | % Households |
| Less than $10,000 | 57 | 4.1% |
| $10,000 to $14,999 | 113 | 8.1% |
| $15,000 to $24,999 | 167 | 12.0% |
| $25,000 to $34,999 | 130 | 9.3% |
| $35,000 to $49,999 | 206 | 14.8% |
| $50,000 to $74,999 | 314 | 22.5% |
| $75,000 to $99,999 | 259 | 18.6% |
| $100,000 to $149,999 | 103 | 7.4% |
| $150,000 to $199,999 | 36 | 2.6% |
| $200,000+ | 11 | 0.8% |
Household Income by Householder Age in Mitchell
The median household income in Mitchell is $51,025, with the highest median household income of $60,243 found in the 45 to 64 years age bracket for the primary householder. A total of 567 households (40.7%) fall into this category. Meanwhile, the 15 to 24 years age bracket for the primary householder has the lowest median household income of $0, with 23 households (1.7%) in this group.
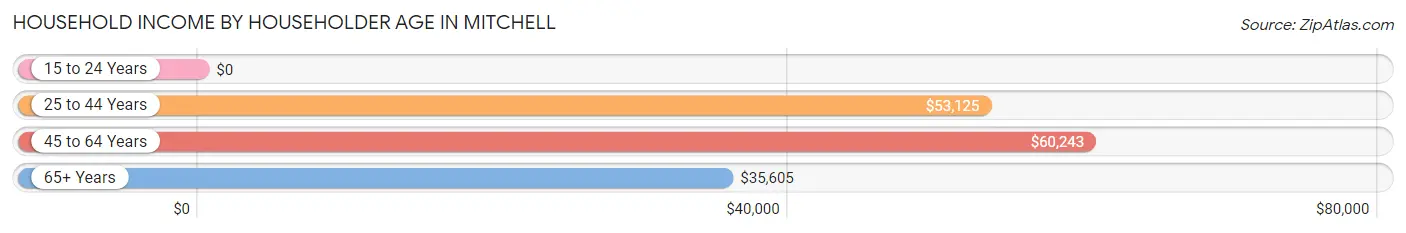
| Income Bracket | # Households | Median Income |
| 15 to 24 Years | 23 (1.7%) | $0 |
| 25 to 44 Years | 431 (30.9%) | $53,125 |
| 45 to 64 Years | 567 (40.7%) | $60,243 |
| 65+ Years | 373 (26.8%) | $35,605 |
| Total | 1,394 (100.0%) | $51,025 |
Poverty in Mitchell
Income Below Poverty by Sex and Age in Mitchell
With 6.9% poverty level for males and 17.6% for females among the residents of Mitchell, 16 and 17 year old males and under 5 year old females are the most vulnerable to poverty, with 9 males (31.0%) and 47 females (35.9%) in their respective age groups living below the poverty level.
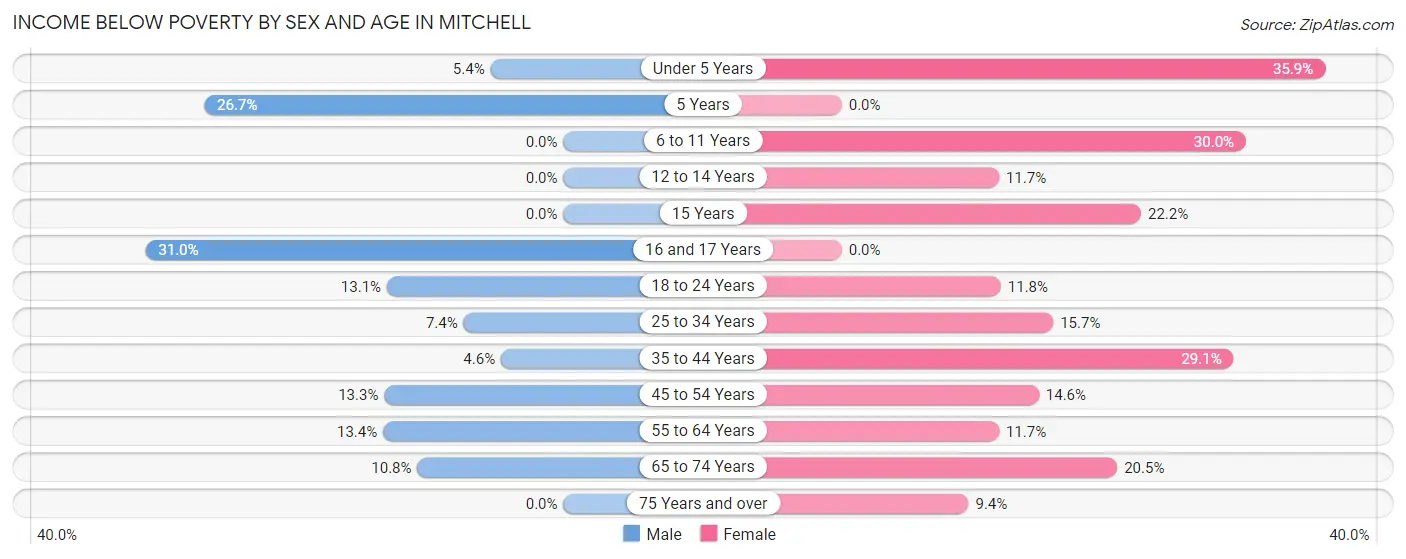
| Age Bracket | Male | Female |
| Under 5 Years | 10 (5.4%) | 47 (35.9%) |
| 5 Years | 8 (26.7%) | 0 (0.0%) |
| 6 to 11 Years | 0 (0.0%) | 54 (30.0%) |
| 12 to 14 Years | 0 (0.0%) | 7 (11.7%) |
| 15 Years | 0 (0.0%) | 6 (22.2%) |
| 16 and 17 Years | 9 (31.0%) | 0 (0.0%) |
| 18 to 24 Years | 22 (13.1%) | 15 (11.8%) |
| 25 to 34 Years | 14 (7.4%) | 54 (15.7%) |
| 35 to 44 Years | 12 (4.6%) | 57 (29.1%) |
| 45 to 54 Years | 25 (13.3%) | 36 (14.6%) |
| 55 to 64 Years | 15 (13.4%) | 42 (11.7%) |
| 65 to 74 Years | 9 (10.8%) | 18 (20.4%) |
| 75 Years and over | 0 (0.0%) | 24 (9.4%) |
| Total | 124 (6.9%) | 360 (17.6%) |
Income Above Poverty by Sex and Age in Mitchell
According to the poverty statistics in Mitchell, males aged 6 to 11 years and females aged 5 years are the age groups that are most secure financially, with 100.0% of males and 100.0% of females in these age groups living above the poverty line.
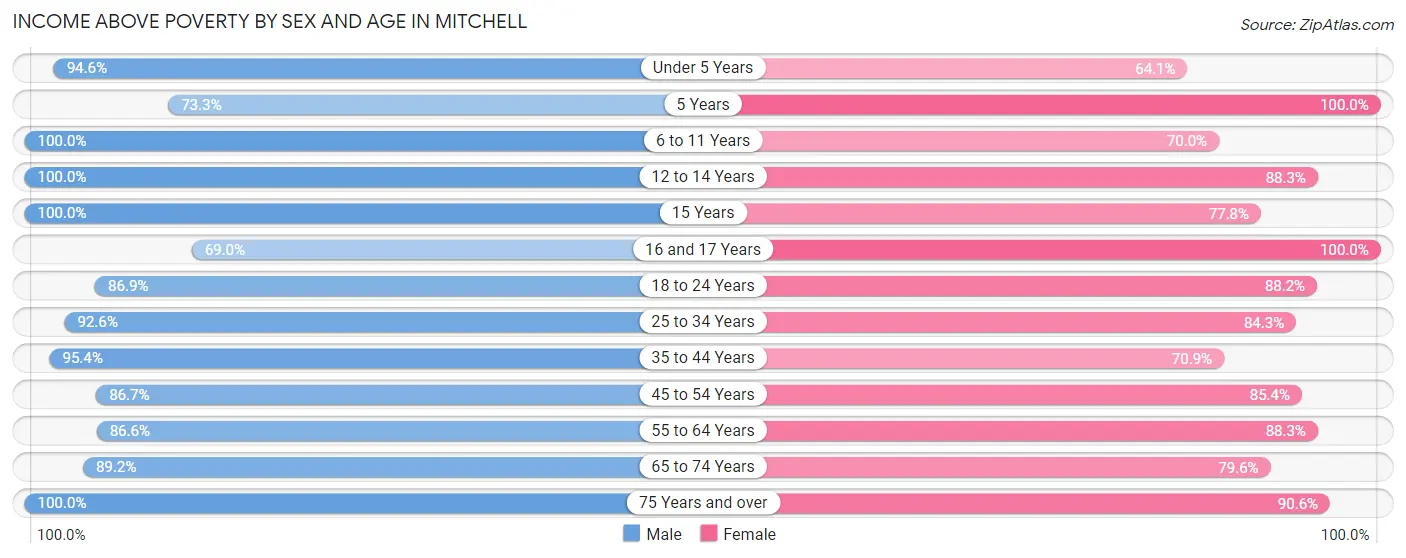
| Age Bracket | Male | Female |
| Under 5 Years | 175 (94.6%) | 84 (64.1%) |
| 5 Years | 22 (73.3%) | 23 (100.0%) |
| 6 to 11 Years | 183 (100.0%) | 126 (70.0%) |
| 12 to 14 Years | 251 (100.0%) | 53 (88.3%) |
| 15 Years | 4 (100.0%) | 21 (77.8%) |
| 16 and 17 Years | 20 (69.0%) | 10 (100.0%) |
| 18 to 24 Years | 146 (86.9%) | 112 (88.2%) |
| 25 to 34 Years | 175 (92.6%) | 290 (84.3%) |
| 35 to 44 Years | 247 (95.4%) | 139 (70.9%) |
| 45 to 54 Years | 163 (86.7%) | 210 (85.4%) |
| 55 to 64 Years | 97 (86.6%) | 318 (88.3%) |
| 65 to 74 Years | 74 (89.2%) | 70 (79.5%) |
| 75 Years and over | 124 (100.0%) | 231 (90.6%) |
| Total | 1,681 (93.1%) | 1,687 (82.4%) |
Income Below Poverty Among Married-Couple Families in Mitchell
The poverty statistics for married-couple families in Mitchell show that 3.5% or 18 of the total 512 families live below the poverty line. Families with no children have the highest poverty rate of 4.9%, comprising of 9 families. On the other hand, families with 3 or 4 children have the lowest poverty rate of 0.0%, which includes 0 families.
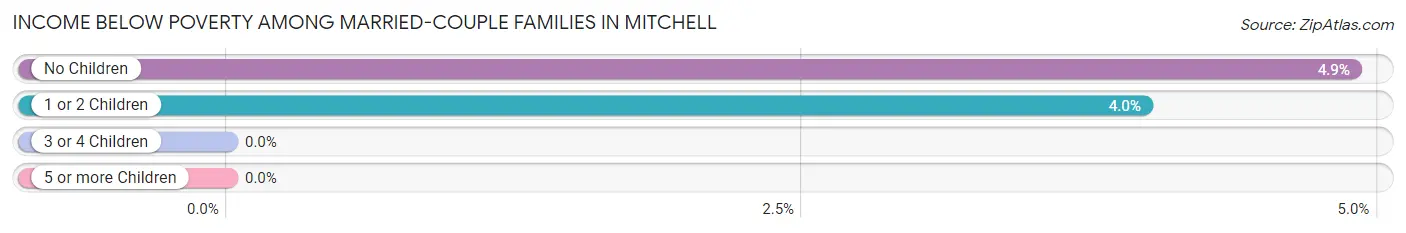
| Children | Above Poverty | Below Poverty |
| No Children | 175 (95.1%) | 9 (4.9%) |
| 1 or 2 Children | 217 (96.0%) | 9 (4.0%) |
| 3 or 4 Children | 102 (100.0%) | 0 (0.0%) |
| 5 or more Children | 0 (0.0%) | 0 (0.0%) |
| Total | 494 (96.5%) | 18 (3.5%) |
Income Below Poverty Among Single-Parent Households in Mitchell
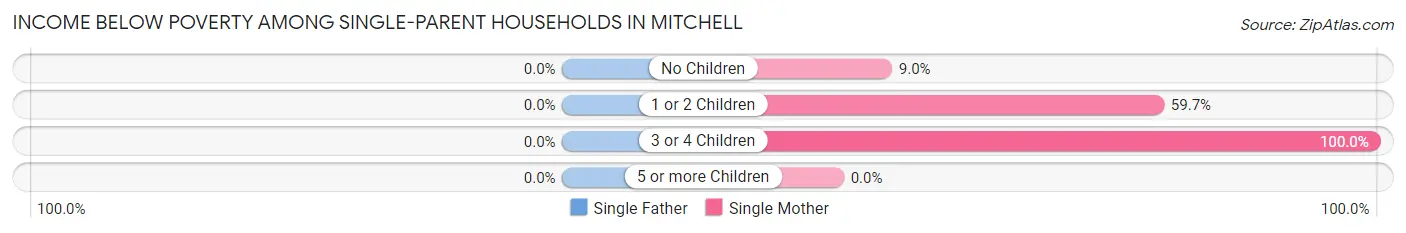
| Children | Single Father | Single Mother |
| No Children | 0 (0.0%) | 7 (9.0%) |
| 1 or 2 Children | 0 (0.0%) | 34 (59.7%) |
| 3 or 4 Children | 0 (0.0%) | 11 (100.0%) |
| 5 or more Children | 0 (0.0%) | 0 (0.0%) |
| Total | 0 (0.0%) | 52 (24.5%) |
Income Below Poverty Among Married-Couple vs Single-Parent Households in Mitchell
The poverty data for Mitchell shows that 18 of the married-couple family households (3.5%) and 52 of the single-parent households (16.7%) are living below the poverty level. Within the married-couple family households, those with no children have the highest poverty rate, with 9 households (4.9%) falling below the poverty line. Among the single-parent households, those with 3 or 4 children have the highest poverty rate, with 11 household (64.7%) living below poverty.
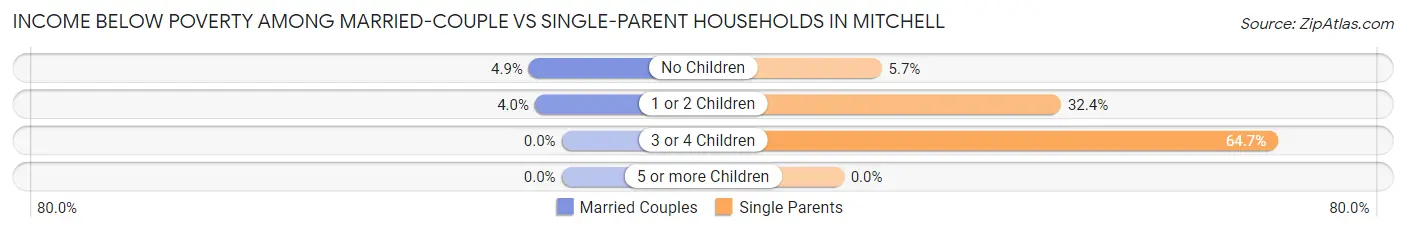
| Children | Married-Couple Families | Single-Parent Households |
| No Children | 9 (4.9%) | 7 (5.7%) |
| 1 or 2 Children | 9 (4.0%) | 34 (32.4%) |
| 3 or 4 Children | 0 (0.0%) | 11 (64.7%) |
| 5 or more Children | 0 (0.0%) | 0 (0.0%) |
| Total | 18 (3.5%) | 52 (16.7%) |
Race in Mitchell
The most populous races in Mitchell are White / Caucasian (3,637 | 92.1%), Asian (176 | 4.5%), and Two or more Races (86 | 2.2%).
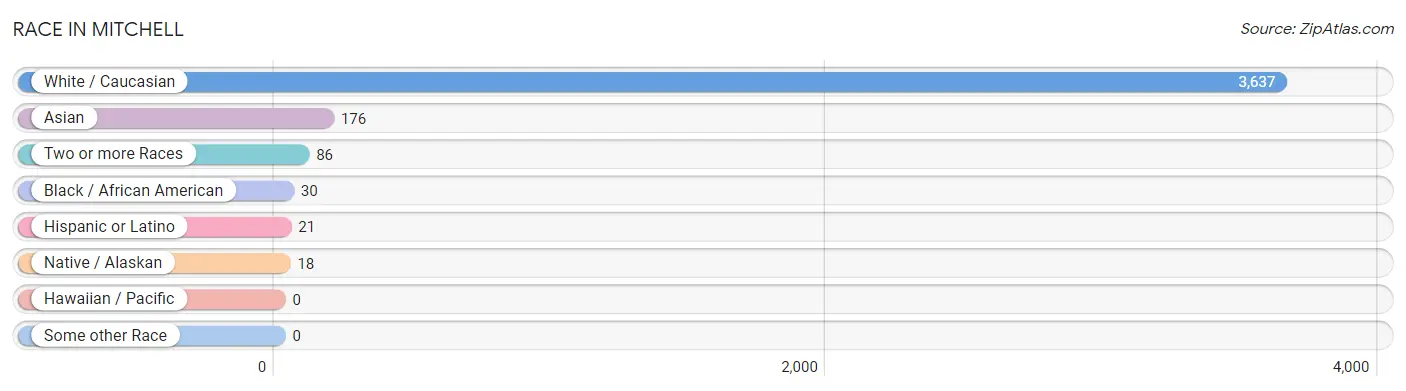
| Race | # Population | % Population |
| Asian | 176 | 4.5% |
| Black / African American | 30 | 0.8% |
| Hawaiian / Pacific | 0 | 0.0% |
| Hispanic or Latino | 21 | 0.5% |
| Native / Alaskan | 18 | 0.5% |
| White / Caucasian | 3,637 | 92.1% |
| Two or more Races | 86 | 2.2% |
| Some other Race | 0 | 0.0% |
| Total | 3,947 | 100.0% |
Ancestry in Mitchell
The most populous ancestries reported in Mitchell are German (727 | 18.4%), Irish (340 | 8.6%), American (300 | 7.6%), English (179 | 4.5%), and Scottish (127 | 3.2%), together accounting for 42.4% of all Mitchell residents.
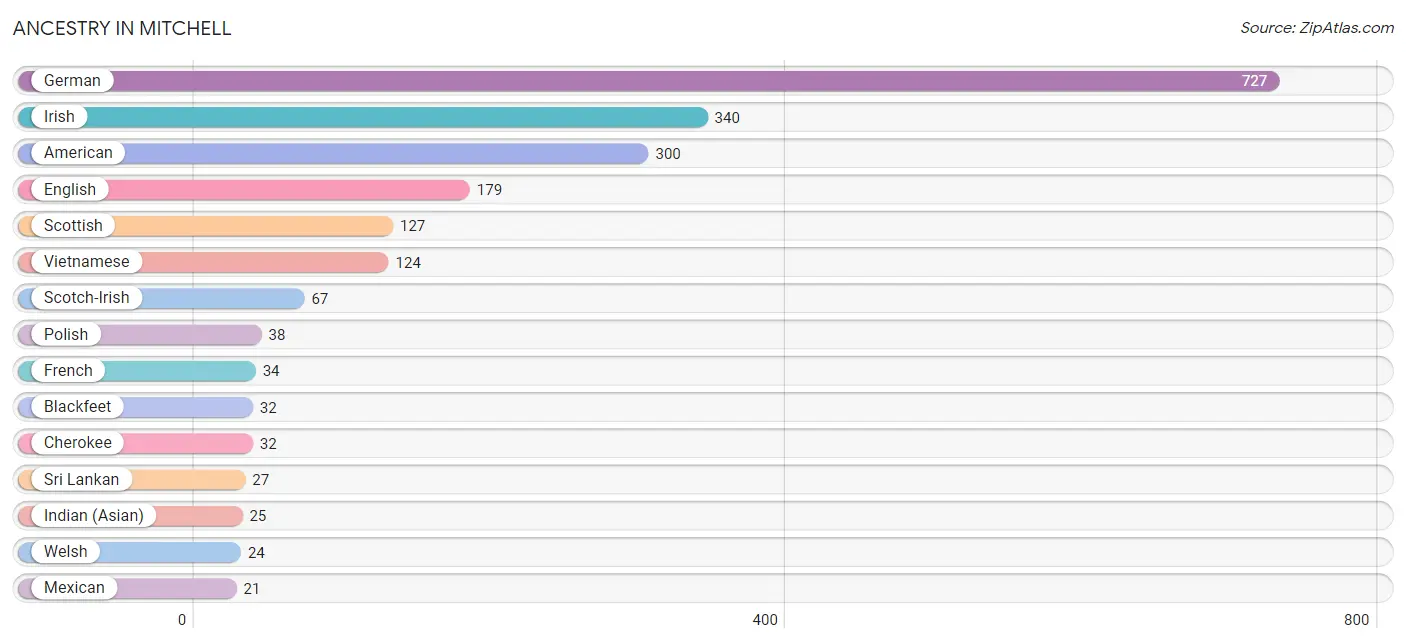
| Ancestry | # Population | % Population |
| American | 300 | 7.6% |
| Blackfeet | 32 | 0.8% |
| Cherokee | 32 | 0.8% |
| Comanche | 7 | 0.2% |
| Eastern European | 8 | 0.2% |
| English | 179 | 4.5% |
| French | 34 | 0.9% |
| German | 727 | 18.4% |
| Indian (Asian) | 25 | 0.6% |
| Irish | 340 | 8.6% |
| Italian | 18 | 0.5% |
| Mexican | 21 | 0.5% |
| Mexican American Indian | 11 | 0.3% |
| Polish | 38 | 1.0% |
| Scotch-Irish | 67 | 1.7% |
| Scottish | 127 | 3.2% |
| Sri Lankan | 27 | 0.7% |
| Swiss | 13 | 0.3% |
| Vietnamese | 124 | 3.1% |
| Welsh | 24 | 0.6% | View All 20 Rows |
Immigrants in Mitchell
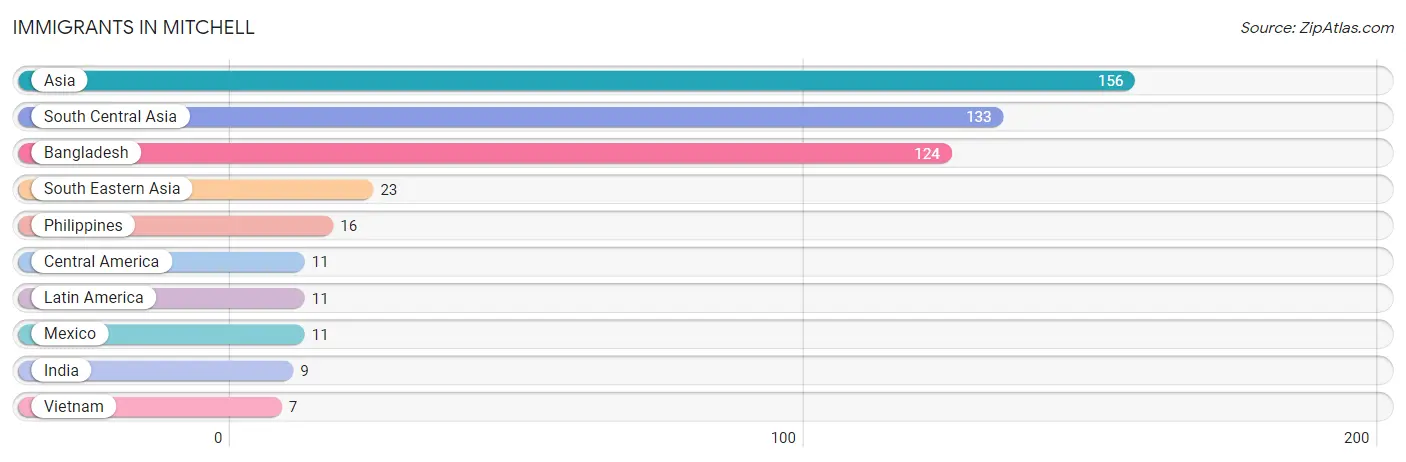
The most numerous immigrant groups reported in Mitchell came from Asia (156 | 4.0%), South Central Asia (133 | 3.4%), Bangladesh (124 | 3.1%), South Eastern Asia (23 | 0.6%), and Philippines (16 | 0.4%), together accounting for 11.5% of all Mitchell residents.
| Immigration Origin | # Population | % Population |
| Asia | 156 | 4.0% |
| Bangladesh | 124 | 3.1% |
| Central America | 11 | 0.3% |
| India | 9 | 0.2% |
| Latin America | 11 | 0.3% |
| Mexico | 11 | 0.3% |
| Philippines | 16 | 0.4% |
| South Central Asia | 133 | 3.4% |
| South Eastern Asia | 23 | 0.6% |
| Vietnam | 7 | 0.2% | View All 10 Rows |
Sex and Age in Mitchell
Sex and Age in Mitchell
The most populous age groups in Mitchell are 10 to 14 Years (364 | 20.0%) for men and 25 to 29 Years (181 | 8.5%) for women.
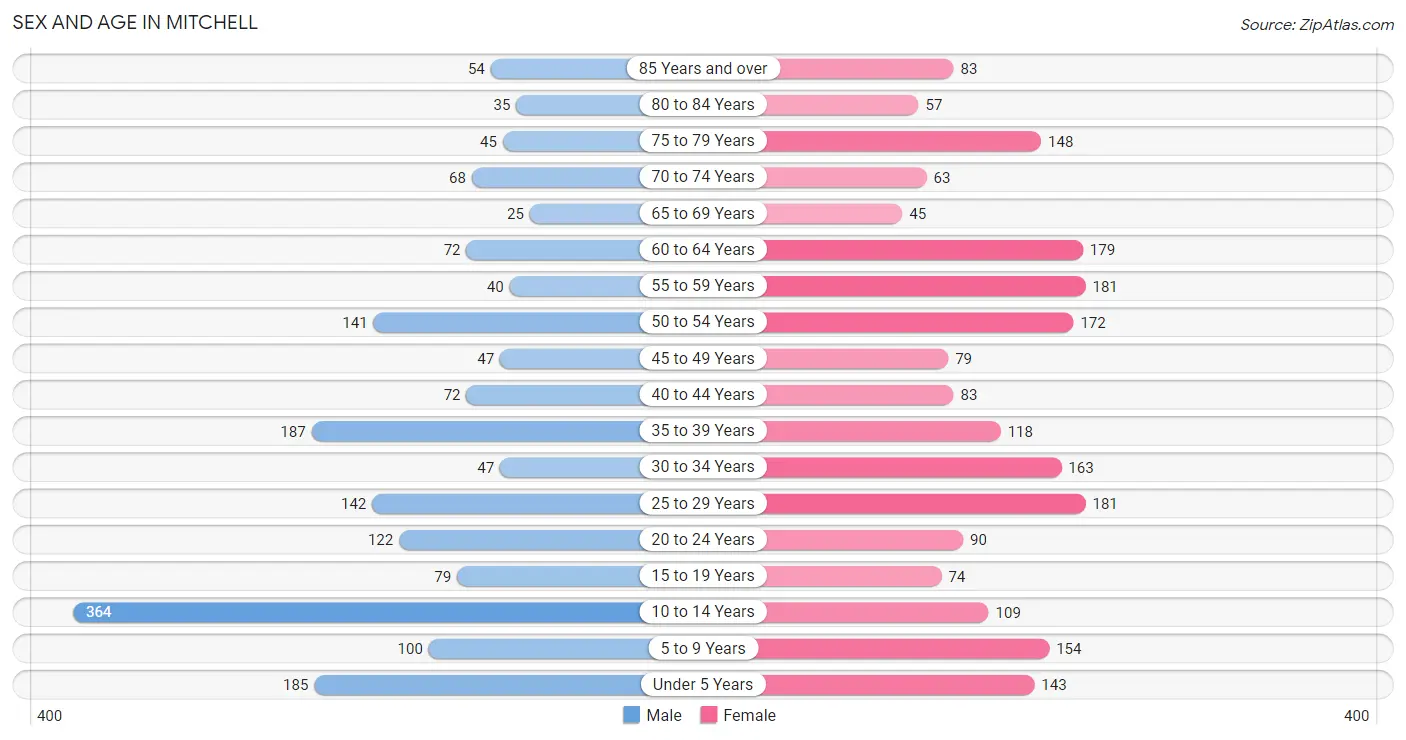
| Age Bracket | Male | Female |
| Under 5 Years | 185 (10.1%) | 143 (6.7%) |
| 5 to 9 Years | 100 (5.5%) | 154 (7.3%) |
| 10 to 14 Years | 364 (20.0%) | 109 (5.1%) |
| 15 to 19 Years | 79 (4.3%) | 74 (3.5%) |
| 20 to 24 Years | 122 (6.7%) | 90 (4.2%) |
| 25 to 29 Years | 142 (7.8%) | 181 (8.5%) |
| 30 to 34 Years | 47 (2.6%) | 163 (7.7%) |
| 35 to 39 Years | 187 (10.2%) | 118 (5.6%) |
| 40 to 44 Years | 72 (4.0%) | 83 (3.9%) |
| 45 to 49 Years | 47 (2.6%) | 79 (3.7%) |
| 50 to 54 Years | 141 (7.7%) | 172 (8.1%) |
| 55 to 59 Years | 40 (2.2%) | 181 (8.5%) |
| 60 to 64 Years | 72 (4.0%) | 179 (8.4%) |
| 65 to 69 Years | 25 (1.4%) | 45 (2.1%) |
| 70 to 74 Years | 68 (3.7%) | 63 (3.0%) |
| 75 to 79 Years | 45 (2.5%) | 148 (7.0%) |
| 80 to 84 Years | 35 (1.9%) | 57 (2.7%) |
| 85 Years and over | 54 (3.0%) | 83 (3.9%) |
| Total | 1,825 (100.0%) | 2,122 (100.0%) |
Families and Households in Mitchell
Median Family Size in Mitchell
The median family size in Mitchell is 3.76 persons per family, with single female/mother families (212 | 25.7%) accounting for the largest median family size of 3.99 persons per family. On the other hand, single male/father families (100 | 12.1%) represent the smallest median family size with 2.36 persons per family.
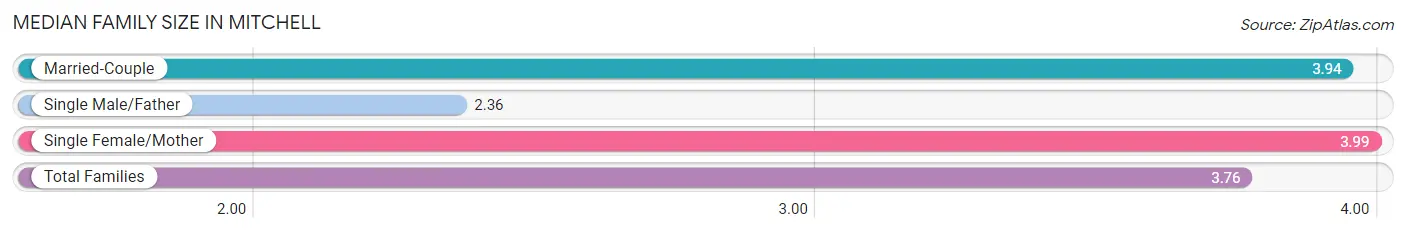
| Family Type | # Families | Family Size |
| Married-Couple | 512 (62.1%) | 3.94 |
| Single Male/Father | 100 (12.1%) | 2.36 |
| Single Female/Mother | 212 (25.7%) | 3.99 |
| Total Families | 824 (100.0%) | 3.76 |
Median Household Size in Mitchell
The median household size in Mitchell is 2.77 persons per household, with single female/mother households (212 | 15.2%) accounting for the largest median household size of 4.2 persons per household. non-family households (570 | 40.9%) represent the smallest median household size with 1.17 persons per household.
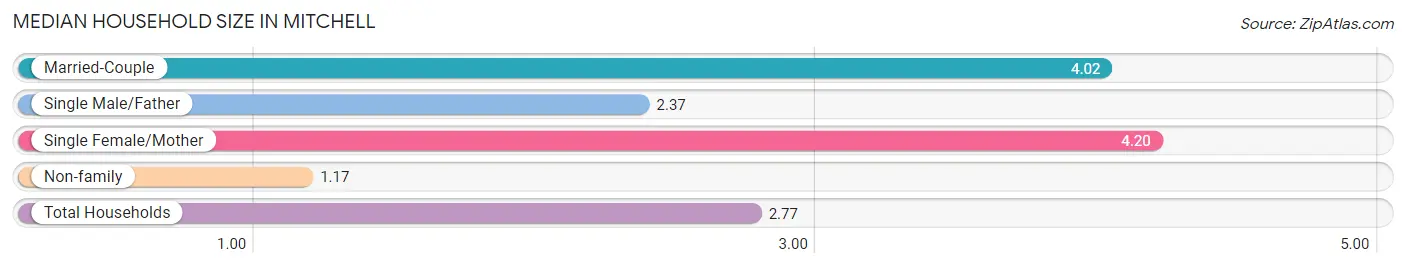
| Household Type | # Households | Household Size |
| Married-Couple | 512 (36.7%) | 4.02 |
| Single Male/Father | 100 (7.2%) | 2.37 |
| Single Female/Mother | 212 (15.2%) | 4.20 |
| Non-family | 570 (40.9%) | 1.17 |
| Total Households | 1,394 (100.0%) | 2.77 |
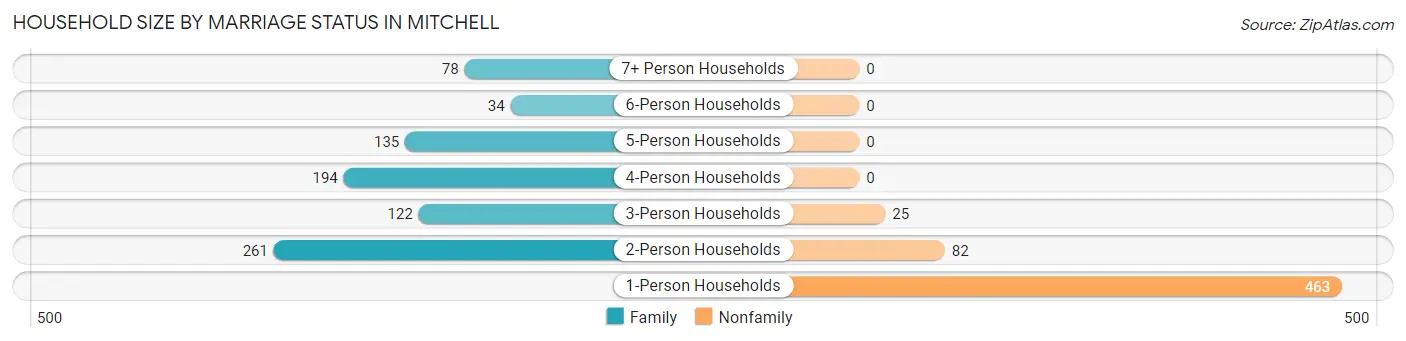
Household Size by Marriage Status in Mitchell
Out of a total of 1,394 households in Mitchell, 824 (59.1%) are family households, while 570 (40.9%) are nonfamily households. The most numerous type of family households are 2-person households, comprising 261, and the most common type of nonfamily households are 1-person households, comprising 463.
| Household Size | Family Households | Nonfamily Households |
| 1-Person Households | - | 463 (33.2%) |
| 2-Person Households | 261 (18.7%) | 82 (5.9%) |
| 3-Person Households | 122 (8.7%) | 25 (1.8%) |
| 4-Person Households | 194 (13.9%) | 0 (0.0%) |
| 5-Person Households | 135 (9.7%) | 0 (0.0%) |
| 6-Person Households | 34 (2.4%) | 0 (0.0%) |
| 7+ Person Households | 78 (5.6%) | 0 (0.0%) |
| Total | 824 (59.1%) | 570 (40.9%) |
Female Fertility in Mitchell
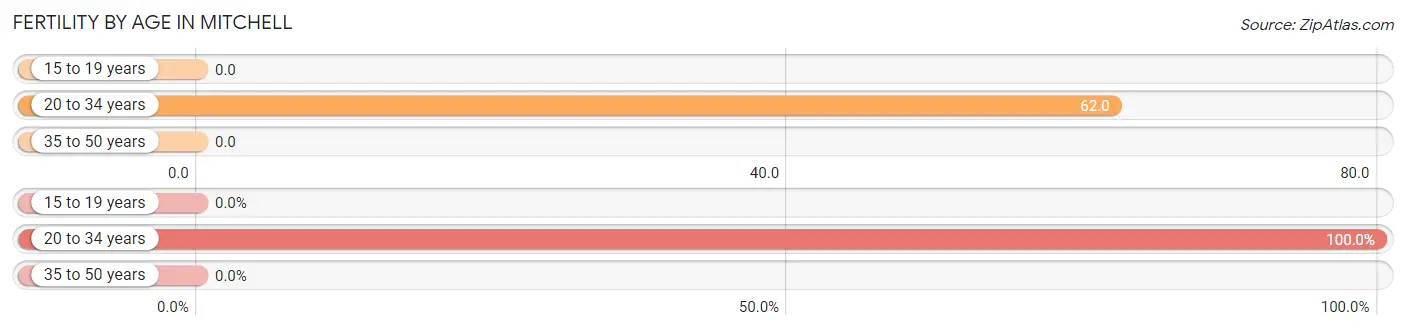
Fertility by Age in Mitchell
Average fertility rate in Mitchell is 31.0 births per 1,000 women. Women in the age bracket of 20 to 34 years have the highest fertility rate with 62.0 births per 1,000 women. Women in the age bracket of 20 to 34 years acount for 100.0% of all women with births.
| Age Bracket | Women with Births | Births / 1,000 Women |
| 15 to 19 years | 0 (0.0%) | 0.0 |
| 20 to 34 years | 27 (100.0%) | 62.0 |
| 35 to 50 years | 0 (0.0%) | 0.0 |
| Total | 27 (100.0%) | 31.0 |
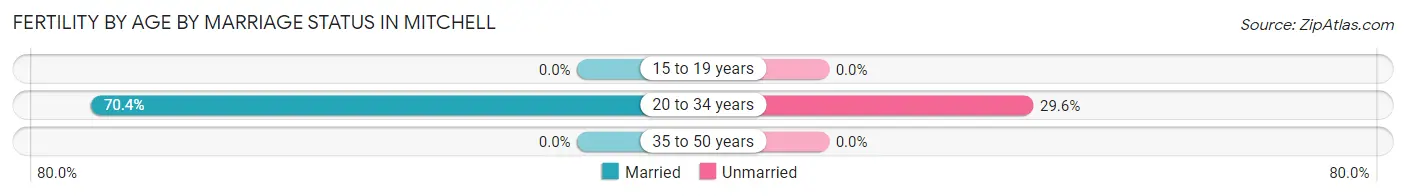
Fertility by Age by Marriage Status in Mitchell
70.4% of women with births (27) in Mitchell are married. The highest percentage of unmarried women with births falls into 20 to 34 years age bracket with 29.6% of them unmarried at the time of birth, while the lowest percentage of unmarried women with births belong to 20 to 34 years age bracket with 29.6% of them unmarried.
| Age Bracket | Married | Unmarried |
| 15 to 19 years | 0 (0.0%) | 0 (0.0%) |
| 20 to 34 years | 19 (70.4%) | 8 (29.6%) |
| 35 to 50 years | 0 (0.0%) | 0 (0.0%) |
| Total | 19 (70.4%) | 8 (29.6%) |
Fertility by Education in Mitchell
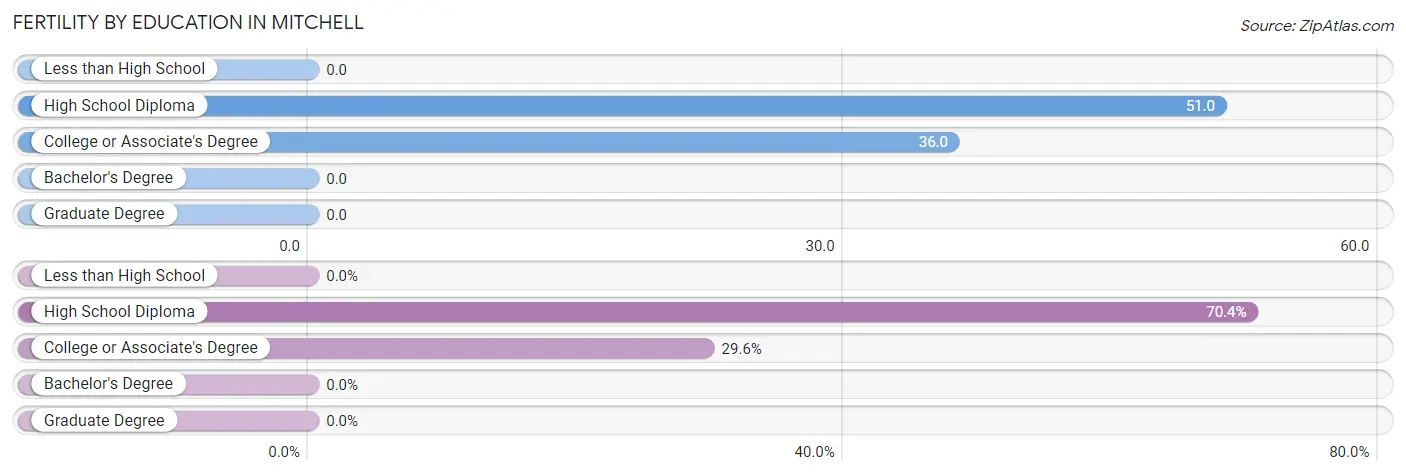
| Educational Attainment | Women with Births | Births / 1,000 Women |
| Less than High School | 0 (0.0%) | 0.0 |
| High School Diploma | 19 (70.4%) | 51.0 |
| College or Associate's Degree | 8 (29.6%) | 36.0 |
| Bachelor's Degree | 0 (0.0%) | 0.0 |
| Graduate Degree | 0 (0.0%) | 0.0 |
| Total | 27 (100.0%) | 31.0 |
Fertility by Education by Marriage Status in Mitchell
29.6% of women with births in Mitchell are unmarried. Women with the educational attainment of high school diploma are most likely to be married with 100.0% of them married at childbirth, while women with the educational attainment of college or associate's degree are least likely to be married with 100.0% of them unmarried at childbirth.
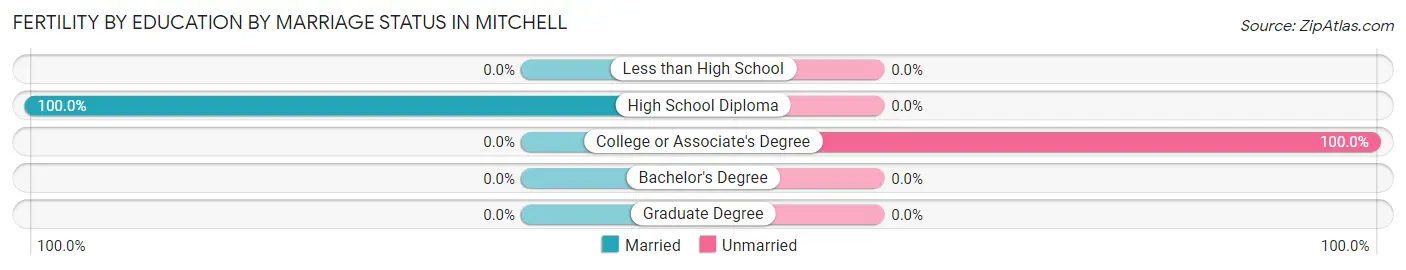
| Educational Attainment | Married | Unmarried |
| Less than High School | 0 (0.0%) | 0 (0.0%) |
| High School Diploma | 19 (100.0%) | 0 (0.0%) |
| College or Associate's Degree | 0 (0.0%) | 8 (100.0%) |
| Bachelor's Degree | 0 (0.0%) | 0 (0.0%) |
| Graduate Degree | 0 (0.0%) | 0 (0.0%) |
| Total | 19 (70.4%) | 8 (29.6%) |
Employment Characteristics in Mitchell
Employment by Class of Employer in Mitchell
Among the 1,478 employed individuals in Mitchell, private company employees (1,265 | 85.6%), local government employees (64 | 4.3%), and not-for-profit organizations (53 | 3.6%) make up the most common classes of employment.
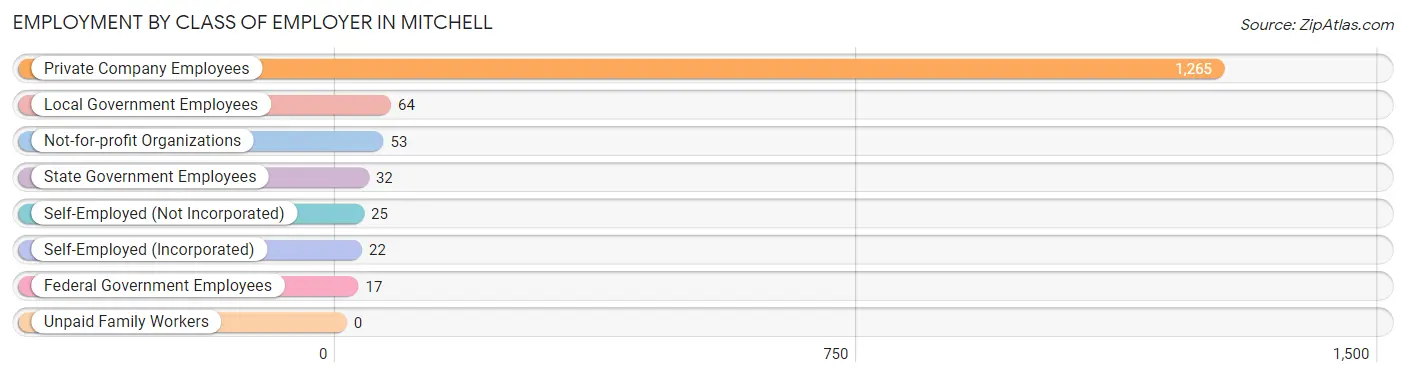
| Employer Class | # Employees | % Employees |
| Private Company Employees | 1,265 | 85.6% |
| Self-Employed (Incorporated) | 22 | 1.5% |
| Self-Employed (Not Incorporated) | 25 | 1.7% |
| Not-for-profit Organizations | 53 | 3.6% |
| Local Government Employees | 64 | 4.3% |
| State Government Employees | 32 | 2.2% |
| Federal Government Employees | 17 | 1.1% |
| Unpaid Family Workers | 0 | 0.0% |
| Total | 1,478 | 100.0% |
Employment Status by Age in Mitchell
According to the labor force statistics for Mitchell, out of the total population over 16 years of age (2,861), 55.8% or 1,596 individuals are in the labor force, with 5.8% or 93 of them unemployed. The age group with the highest labor force participation rate is 20 to 24 years, with 95.8% or 203 individuals in the labor force. Within the labor force, the 30 to 34 years age range has the highest percentage of unemployed individuals, with 21.0% or 26 of them being unemployed.
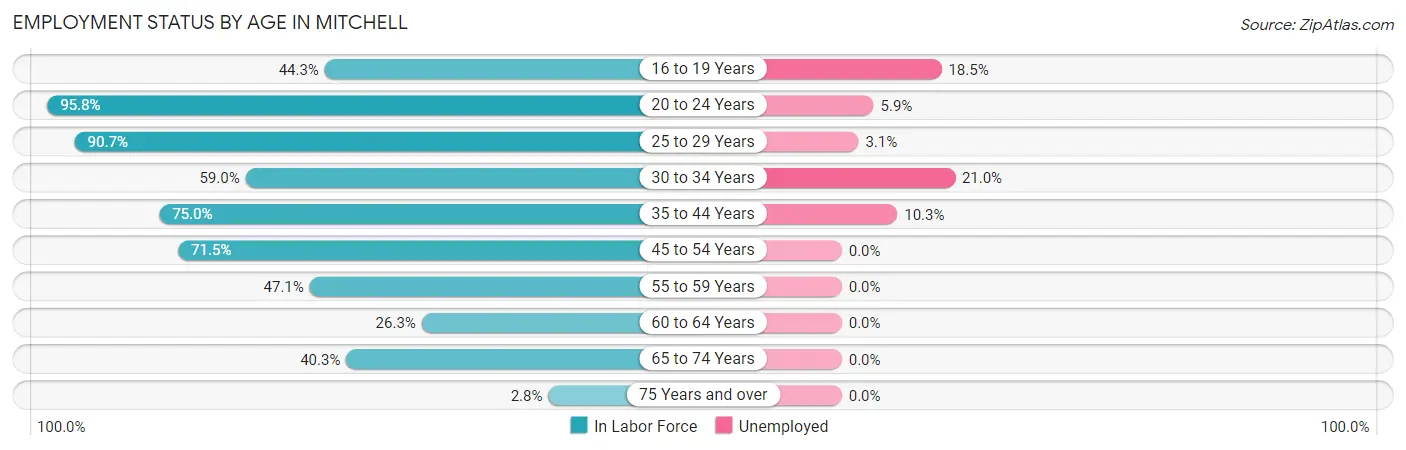
| Age Bracket | In Labor Force | Unemployed |
| 16 to 19 Years | 54 (44.3%) | 10 (18.5%) |
| 20 to 24 Years | 203 (95.8%) | 12 (5.9%) |
| 25 to 29 Years | 293 (90.7%) | 9 (3.1%) |
| 30 to 34 Years | 124 (59.0%) | 26 (21.0%) |
| 35 to 44 Years | 345 (75.0%) | 36 (10.3%) |
| 45 to 54 Years | 314 (71.5%) | 0 (0.0%) |
| 55 to 59 Years | 104 (47.1%) | 0 (0.0%) |
| 60 to 64 Years | 66 (26.3%) | 0 (0.0%) |
| 65 to 74 Years | 81 (40.3%) | 0 (0.0%) |
| 75 Years and over | 12 (2.8%) | 0 (0.0%) |
| Total | 1,596 (55.8%) | 93 (5.8%) |
Employment Status by Educational Attainment in Mitchell
According to labor force statistics for Mitchell, 65.4% of individuals (1,245) out of the total population between 25 and 64 years of age (1,904) are in the labor force, with 5.6% or 70 of them being unemployed. The group with the highest labor force participation rate are those with the educational attainment of college / associate degree, with 83.0% or 387 individuals in the labor force. Within the labor force, individuals with less than high school education have the highest percentage of unemployment, with 34.9% or 52 of them being unemployed.
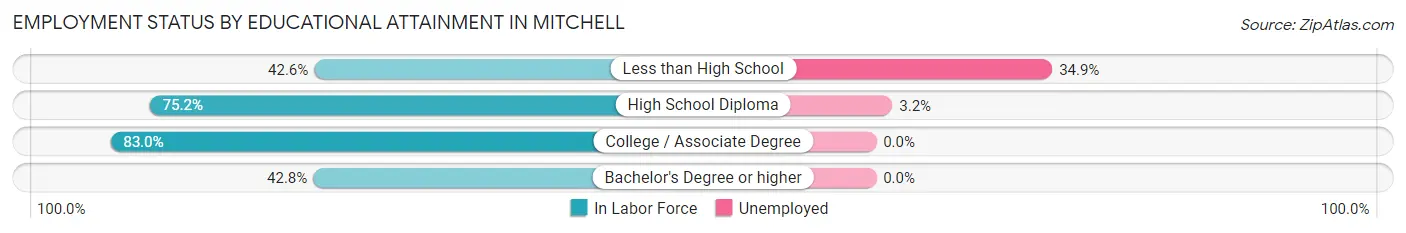
| Educational Attainment | In Labor Force | Unemployed |
| Less than High School | 149 (42.6%) | 122 (34.9%) |
| High School Diploma | 567 (75.2%) | 24 (3.2%) |
| College / Associate Degree | 387 (83.0%) | 0 (0.0%) |
| Bachelor's Degree or higher | 143 (42.8%) | 0 (0.0%) |
| Total | 1,245 (65.4%) | 107 (5.6%) |
Employment Occupations by Sex in Mitchell
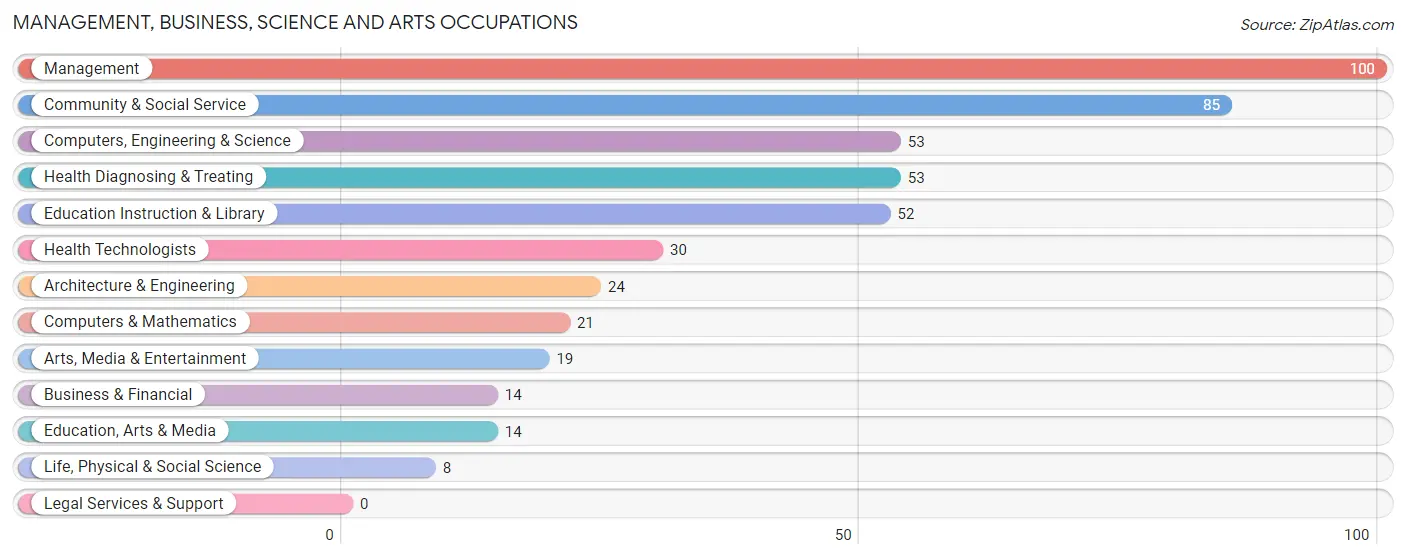
Management, Business, Science and Arts Occupations
The most common Management, Business, Science and Arts occupations in Mitchell are Management (100 | 6.7%), Community & Social Service (85 | 5.7%), Computers, Engineering & Science (53 | 3.5%), Health Diagnosing & Treating (53 | 3.5%), and Education Instruction & Library (52 | 3.5%).
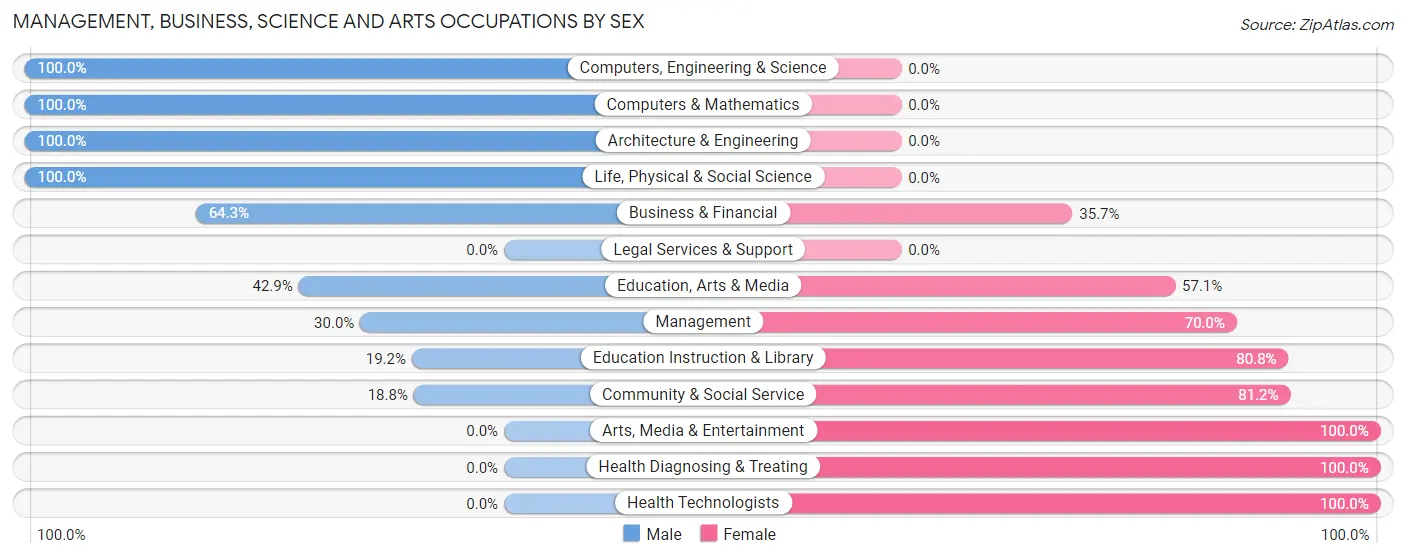
Management, Business, Science and Arts Occupations by Sex
Within the Management, Business, Science and Arts occupations in Mitchell, the most male-oriented occupations are Computers, Engineering & Science (100.0%), Computers & Mathematics (100.0%), and Architecture & Engineering (100.0%), while the most female-oriented occupations are Arts, Media & Entertainment (100.0%), Health Diagnosing & Treating (100.0%), and Health Technologists (100.0%).
| Occupation | Male | Female |
| Management | 30 (30.0%) | 70 (70.0%) |
| Business & Financial | 9 (64.3%) | 5 (35.7%) |
| Computers, Engineering & Science | 53 (100.0%) | 0 (0.0%) |
| Computers & Mathematics | 21 (100.0%) | 0 (0.0%) |
| Architecture & Engineering | 24 (100.0%) | 0 (0.0%) |
| Life, Physical & Social Science | 8 (100.0%) | 0 (0.0%) |
| Community & Social Service | 16 (18.8%) | 69 (81.2%) |
| Education, Arts & Media | 6 (42.9%) | 8 (57.1%) |
| Legal Services & Support | 0 (0.0%) | 0 (0.0%) |
| Education Instruction & Library | 10 (19.2%) | 42 (80.8%) |
| Arts, Media & Entertainment | 0 (0.0%) | 19 (100.0%) |
| Health Diagnosing & Treating | 0 (0.0%) | 53 (100.0%) |
| Health Technologists | 0 (0.0%) | 30 (100.0%) |
| Total (Category) | 108 (35.4%) | 197 (64.6%) |
| Total (Overall) | 713 (47.6%) | 785 (52.4%) |
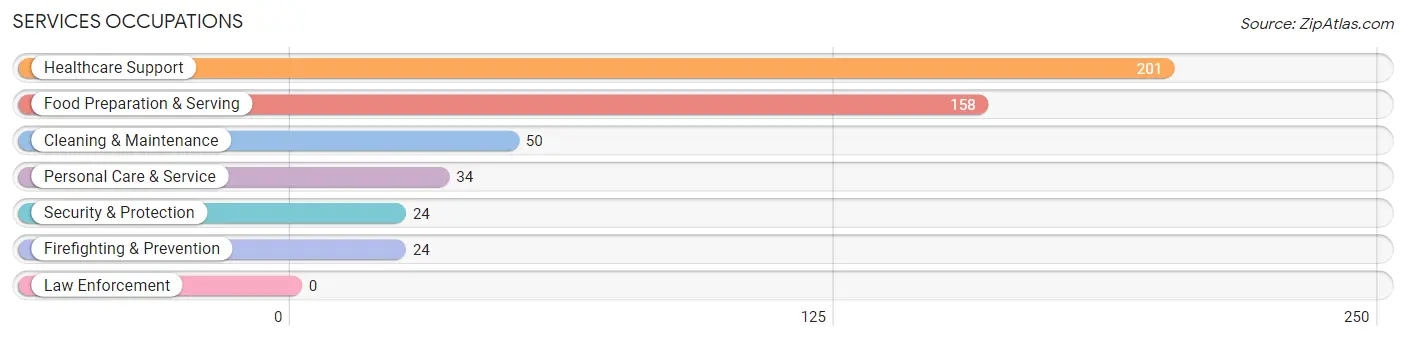
Services Occupations
The most common Services occupations in Mitchell are Healthcare Support (201 | 13.4%), Food Preparation & Serving (158 | 10.5%), Cleaning & Maintenance (50 | 3.3%), Personal Care & Service (34 | 2.3%), and Security & Protection (24 | 1.6%).
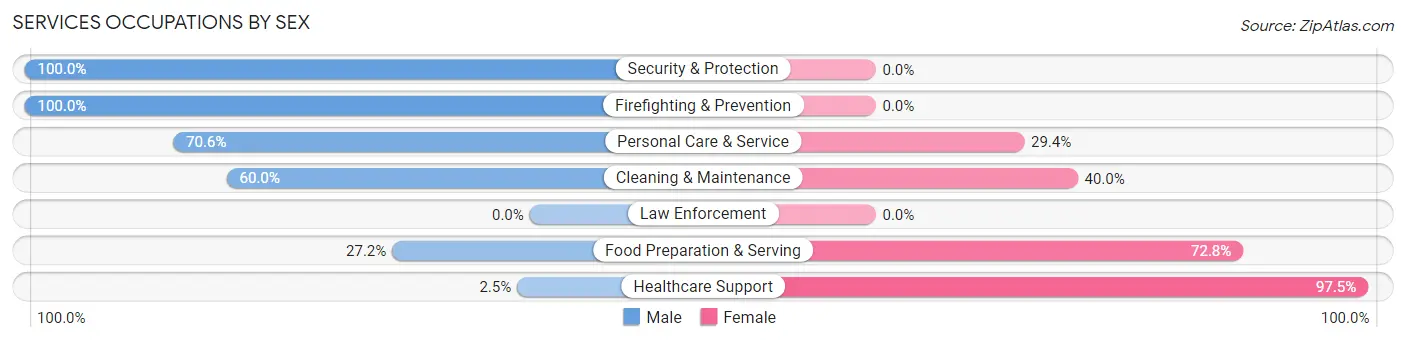
Services Occupations by Sex
Within the Services occupations in Mitchell, the most male-oriented occupations are Security & Protection (100.0%), Firefighting & Prevention (100.0%), and Personal Care & Service (70.6%), while the most female-oriented occupations are Healthcare Support (97.5%), Food Preparation & Serving (72.8%), and Cleaning & Maintenance (40.0%).
| Occupation | Male | Female |
| Healthcare Support | 5 (2.5%) | 196 (97.5%) |
| Security & Protection | 24 (100.0%) | 0 (0.0%) |
| Firefighting & Prevention | 24 (100.0%) | 0 (0.0%) |
| Law Enforcement | 0 (0.0%) | 0 (0.0%) |
| Food Preparation & Serving | 43 (27.2%) | 115 (72.8%) |
| Cleaning & Maintenance | 30 (60.0%) | 20 (40.0%) |
| Personal Care & Service | 24 (70.6%) | 10 (29.4%) |
| Total (Category) | 126 (27.0%) | 341 (73.0%) |
| Total (Overall) | 713 (47.6%) | 785 (52.4%) |
Sales and Office Occupations
The most common Sales and Office occupations in Mitchell are Sales & Related (111 | 7.4%), and Office & Administration (95 | 6.3%).
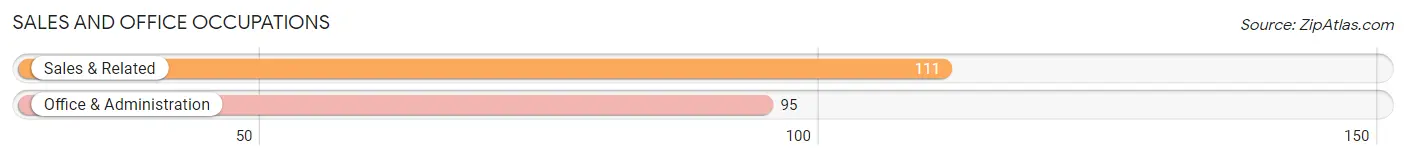
Sales and Office Occupations by Sex
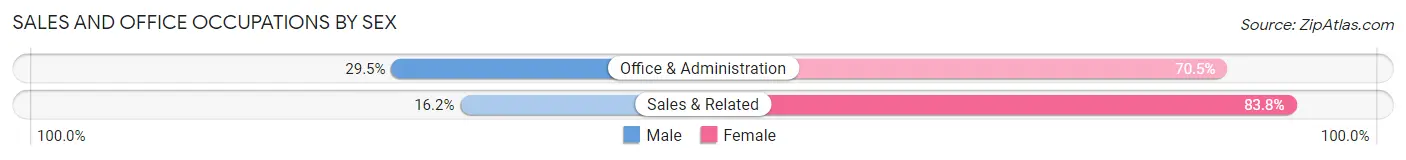
| Occupation | Male | Female |
| Sales & Related | 18 (16.2%) | 93 (83.8%) |
| Office & Administration | 28 (29.5%) | 67 (70.5%) |
| Total (Category) | 46 (22.3%) | 160 (77.7%) |
| Total (Overall) | 713 (47.6%) | 785 (52.4%) |
Natural Resources, Construction and Maintenance Occupations
The most common Natural Resources, Construction and Maintenance occupations in Mitchell are Construction & Extraction (88 | 5.9%), and Installation, Maintenance & Repair (81 | 5.4%).
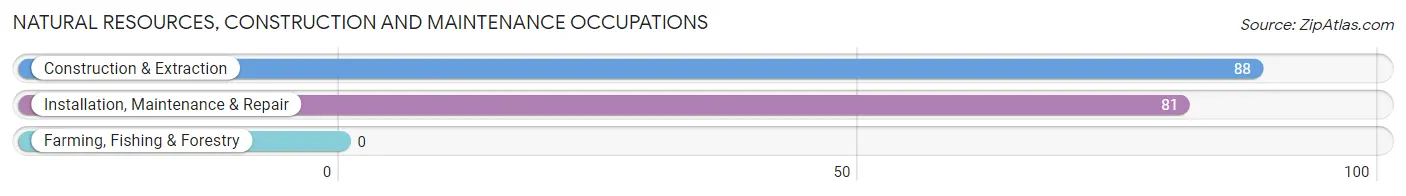
Natural Resources, Construction and Maintenance Occupations by Sex
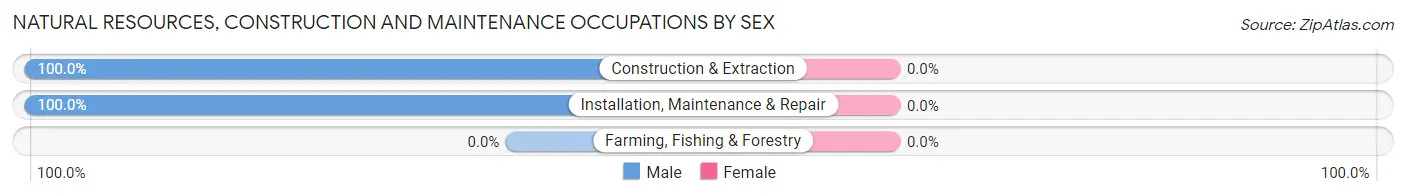
| Occupation | Male | Female |
| Farming, Fishing & Forestry | 0 (0.0%) | 0 (0.0%) |
| Construction & Extraction | 88 (100.0%) | 0 (0.0%) |
| Installation, Maintenance & Repair | 81 (100.0%) | 0 (0.0%) |
| Total (Category) | 169 (100.0%) | 0 (0.0%) |
| Total (Overall) | 713 (47.6%) | 785 (52.4%) |
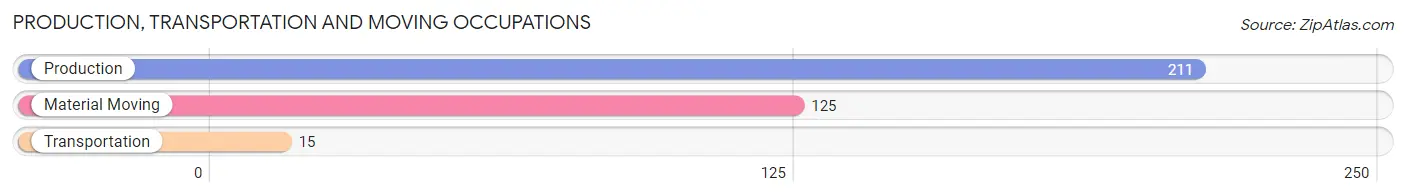
Production, Transportation and Moving Occupations
The most common Production, Transportation and Moving occupations in Mitchell are Production (211 | 14.1%), Material Moving (125 | 8.3%), and Transportation (15 | 1.0%).
Production, Transportation and Moving Occupations by Sex
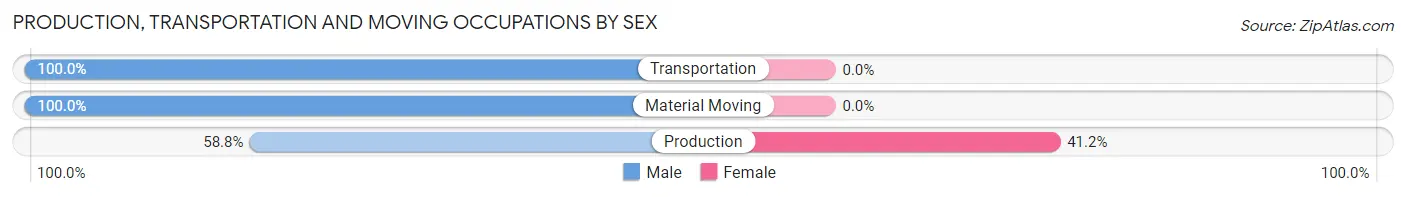
| Occupation | Male | Female |
| Production | 124 (58.8%) | 87 (41.2%) |
| Transportation | 15 (100.0%) | 0 (0.0%) |
| Material Moving | 125 (100.0%) | 0 (0.0%) |
| Total (Category) | 264 (75.2%) | 87 (24.8%) |
| Total (Overall) | 713 (47.6%) | 785 (52.4%) |
Employment Industries by Sex in Mitchell
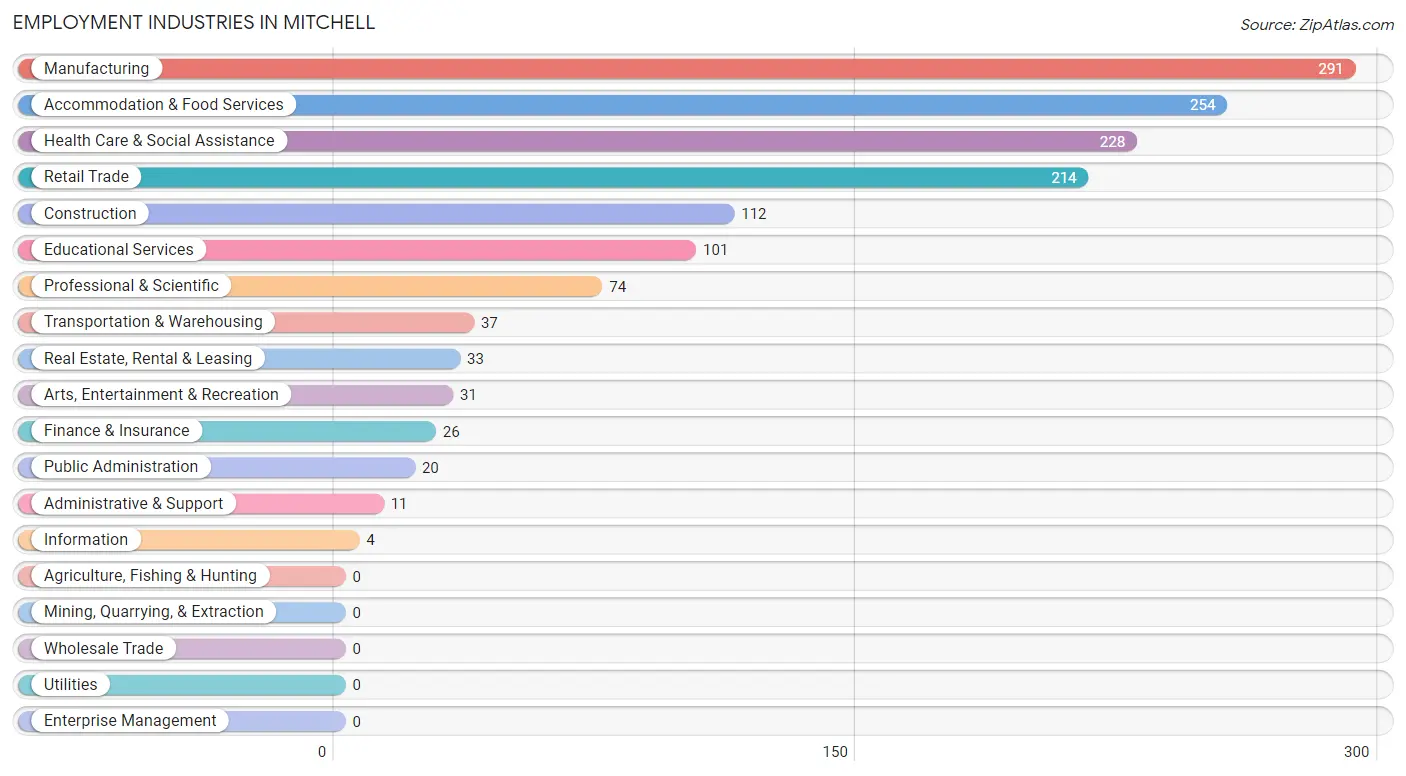
Employment Industries in Mitchell
The major employment industries in Mitchell include Manufacturing (291 | 19.4%), Accommodation & Food Services (254 | 17.0%), Health Care & Social Assistance (228 | 15.2%), Retail Trade (214 | 14.3%), and Construction (112 | 7.5%).
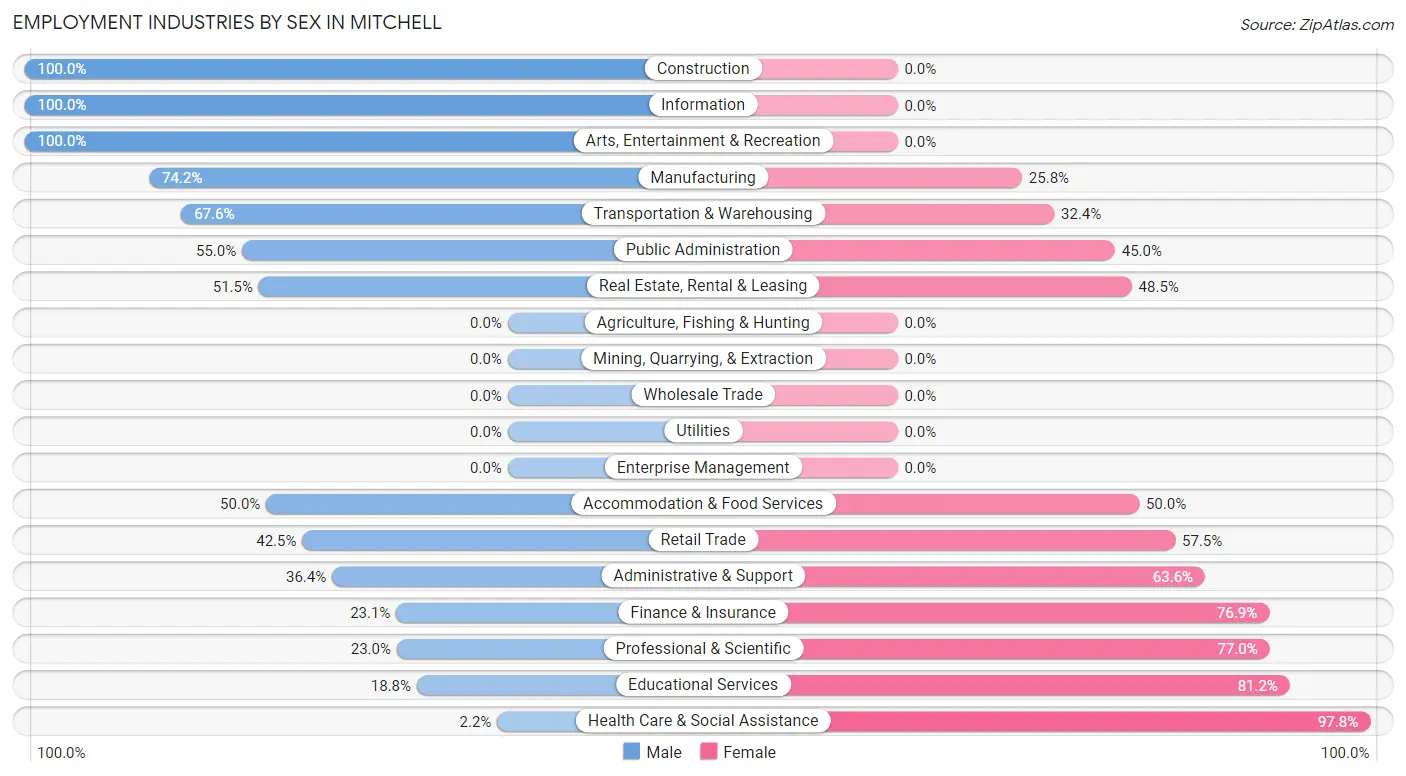
Employment Industries by Sex in Mitchell
The Mitchell industries that see more men than women are Construction (100.0%), Information (100.0%), and Arts, Entertainment & Recreation (100.0%), whereas the industries that tend to have a higher number of women are Health Care & Social Assistance (97.8%), Educational Services (81.2%), and Professional & Scientific (77.0%).
| Industry | Male | Female |
| Agriculture, Fishing & Hunting | 0 (0.0%) | 0 (0.0%) |
| Mining, Quarrying, & Extraction | 0 (0.0%) | 0 (0.0%) |
| Construction | 112 (100.0%) | 0 (0.0%) |
| Manufacturing | 216 (74.2%) | 75 (25.8%) |
| Wholesale Trade | 0 (0.0%) | 0 (0.0%) |
| Retail Trade | 91 (42.5%) | 123 (57.5%) |
| Transportation & Warehousing | 25 (67.6%) | 12 (32.4%) |
| Utilities | 0 (0.0%) | 0 (0.0%) |
| Information | 4 (100.0%) | 0 (0.0%) |
| Finance & Insurance | 6 (23.1%) | 20 (76.9%) |
| Real Estate, Rental & Leasing | 17 (51.5%) | 16 (48.5%) |
| Professional & Scientific | 17 (23.0%) | 57 (77.0%) |
| Enterprise Management | 0 (0.0%) | 0 (0.0%) |
| Administrative & Support | 4 (36.4%) | 7 (63.6%) |
| Educational Services | 19 (18.8%) | 82 (81.2%) |
| Health Care & Social Assistance | 5 (2.2%) | 223 (97.8%) |
| Arts, Entertainment & Recreation | 31 (100.0%) | 0 (0.0%) |
| Accommodation & Food Services | 127 (50.0%) | 127 (50.0%) |
| Public Administration | 11 (55.0%) | 9 (45.0%) |
| Total | 713 (47.6%) | 785 (52.4%) |
Education in Mitchell
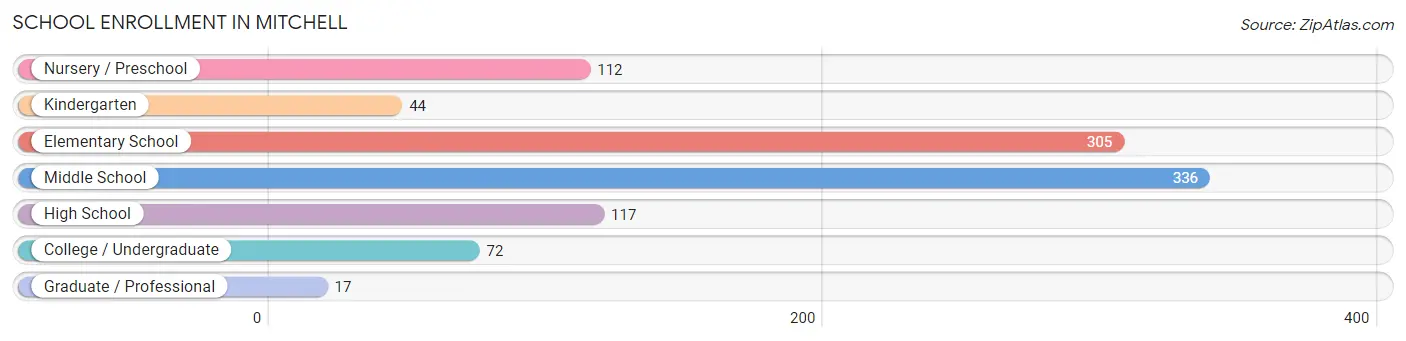
School Enrollment in Mitchell
The most common levels of schooling among the 1,003 students in Mitchell are middle school (336 | 33.5%), elementary school (305 | 30.4%), and high school (117 | 11.7%).
| School Level | # Students | % Students |
| Nursery / Preschool | 112 | 11.2% |
| Kindergarten | 44 | 4.4% |
| Elementary School | 305 | 30.4% |
| Middle School | 336 | 33.5% |
| High School | 117 | 11.7% |
| College / Undergraduate | 72 | 7.2% |
| Graduate / Professional | 17 | 1.7% |
| Total | 1,003 | 100.0% |
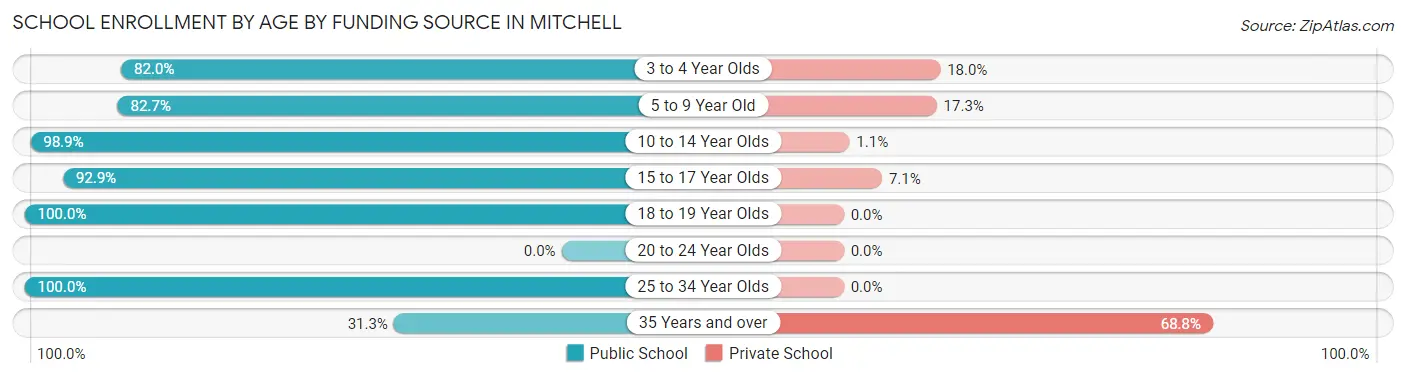
School Enrollment by Age by Funding Source in Mitchell
Out of a total of 1,003 students who are enrolled in schools in Mitchell, 92 (9.2%) attend a private institution, while the remaining 911 (90.8%) are enrolled in public schools. The age group of 35 years and over has the highest likelihood of being enrolled in private schools, with 22 (68.8% in the age bracket) enrolled. Conversely, the age group of 18 to 19 year olds has the lowest likelihood of being enrolled in a private school, with 73 (100.0% in the age bracket) attending a public institution.
| Age Bracket | Public School | Private School |
| 3 to 4 Year Olds | 73 (82.0%) | 16 (18.0%) |
| 5 to 9 Year Old | 210 (82.7%) | 44 (17.3%) |
| 10 to 14 Year Olds | 463 (98.9%) | 5 (1.1%) |
| 15 to 17 Year Olds | 65 (92.9%) | 5 (7.1%) |
| 18 to 19 Year Olds | 73 (100.0%) | 0 (0.0%) |
| 20 to 24 Year Olds | 0 (0.0%) | 0 (0.0%) |
| 25 to 34 Year Olds | 17 (100.0%) | 0 (0.0%) |
| 35 Years and over | 10 (31.2%) | 22 (68.8%) |
| Total | 911 (90.8%) | 92 (9.2%) |
Educational Attainment by Field of Study in Mitchell
Literature & languages (145 | 35.2%), education (69 | 16.8%), liberal arts & history (38 | 9.2%), arts & humanities (37 | 9.0%), and psychology (25 | 6.1%) are the most common fields of study among 412 individuals in Mitchell who have obtained a bachelor's degree or higher.
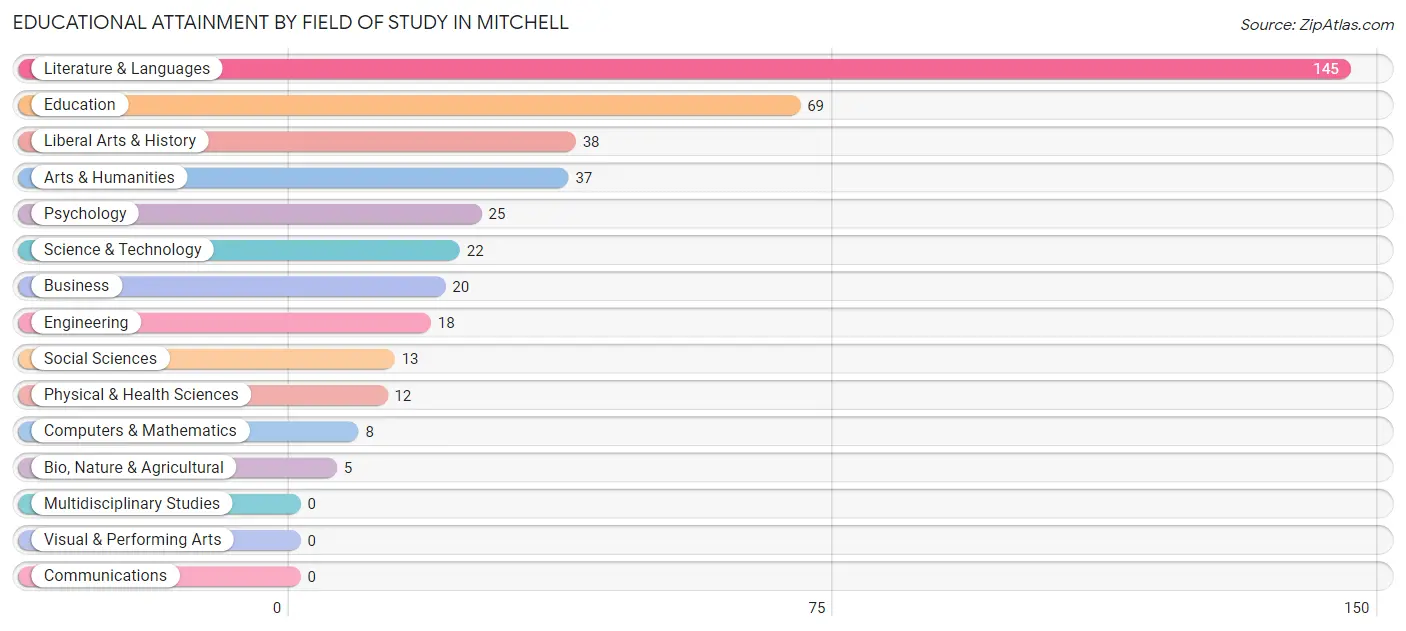
| Field of Study | # Graduates | % Graduates |
| Computers & Mathematics | 8 | 1.9% |
| Bio, Nature & Agricultural | 5 | 1.2% |
| Physical & Health Sciences | 12 | 2.9% |
| Psychology | 25 | 6.1% |
| Social Sciences | 13 | 3.2% |
| Engineering | 18 | 4.4% |
| Multidisciplinary Studies | 0 | 0.0% |
| Science & Technology | 22 | 5.3% |
| Business | 20 | 4.9% |
| Education | 69 | 16.8% |
| Literature & Languages | 145 | 35.2% |
| Liberal Arts & History | 38 | 9.2% |
| Visual & Performing Arts | 0 | 0.0% |
| Communications | 0 | 0.0% |
| Arts & Humanities | 37 | 9.0% |
| Total | 412 | 100.0% |
Transportation & Commute in Mitchell
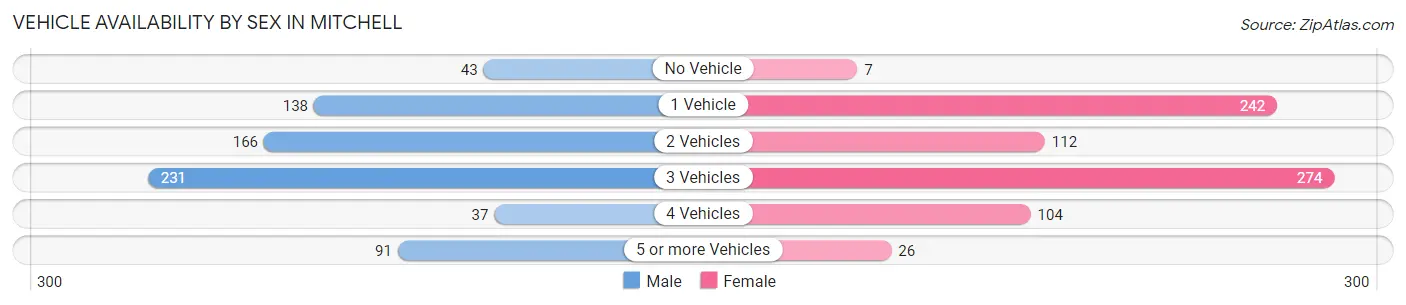
Vehicle Availability by Sex in Mitchell
The most prevalent vehicle ownership categories in Mitchell are males with 3 vehicles (231, accounting for 32.7%) and females with 3 vehicles (274, making up 30.2%).
| Vehicles Available | Male | Female |
| No Vehicle | 43 (6.1%) | 7 (0.9%) |
| 1 Vehicle | 138 (19.6%) | 242 (31.6%) |
| 2 Vehicles | 166 (23.5%) | 112 (14.6%) |
| 3 Vehicles | 231 (32.7%) | 274 (35.8%) |
| 4 Vehicles | 37 (5.2%) | 104 (13.6%) |
| 5 or more Vehicles | 91 (12.9%) | 26 (3.4%) |
| Total | 706 (100.0%) | 765 (100.0%) |
Commute Time in Mitchell
The most frequently occuring commute durations in Mitchell are 20 to 24 minutes (486 commuters, 33.4%), 15 to 19 minutes (280 commuters, 19.2%), and 45 to 59 minutes (115 commuters, 7.9%).
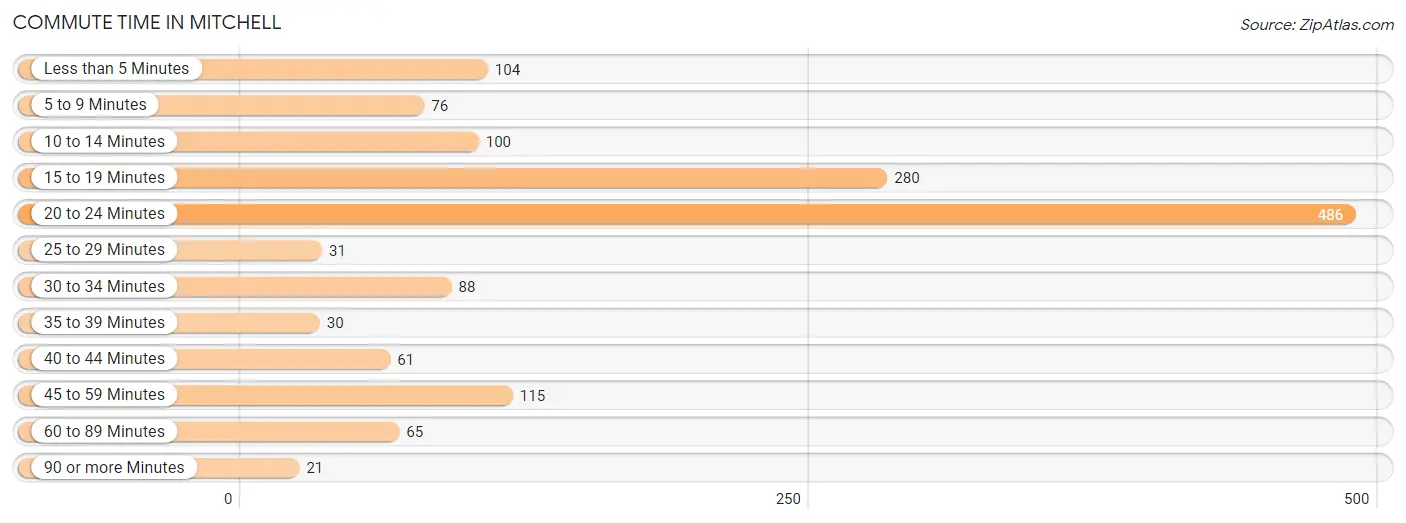
| Commute Time | # Commuters | % Commuters |
| Less than 5 Minutes | 104 | 7.1% |
| 5 to 9 Minutes | 76 | 5.2% |
| 10 to 14 Minutes | 100 | 6.9% |
| 15 to 19 Minutes | 280 | 19.2% |
| 20 to 24 Minutes | 486 | 33.4% |
| 25 to 29 Minutes | 31 | 2.1% |
| 30 to 34 Minutes | 88 | 6.0% |
| 35 to 39 Minutes | 30 | 2.1% |
| 40 to 44 Minutes | 61 | 4.2% |
| 45 to 59 Minutes | 115 | 7.9% |
| 60 to 89 Minutes | 65 | 4.5% |
| 90 or more Minutes | 21 | 1.4% |
Commute Time by Sex in Mitchell
The most common commute times in Mitchell are 20 to 24 minutes (188 commuters, 26.9%) for males and 20 to 24 minutes (298 commuters, 39.4%) for females.
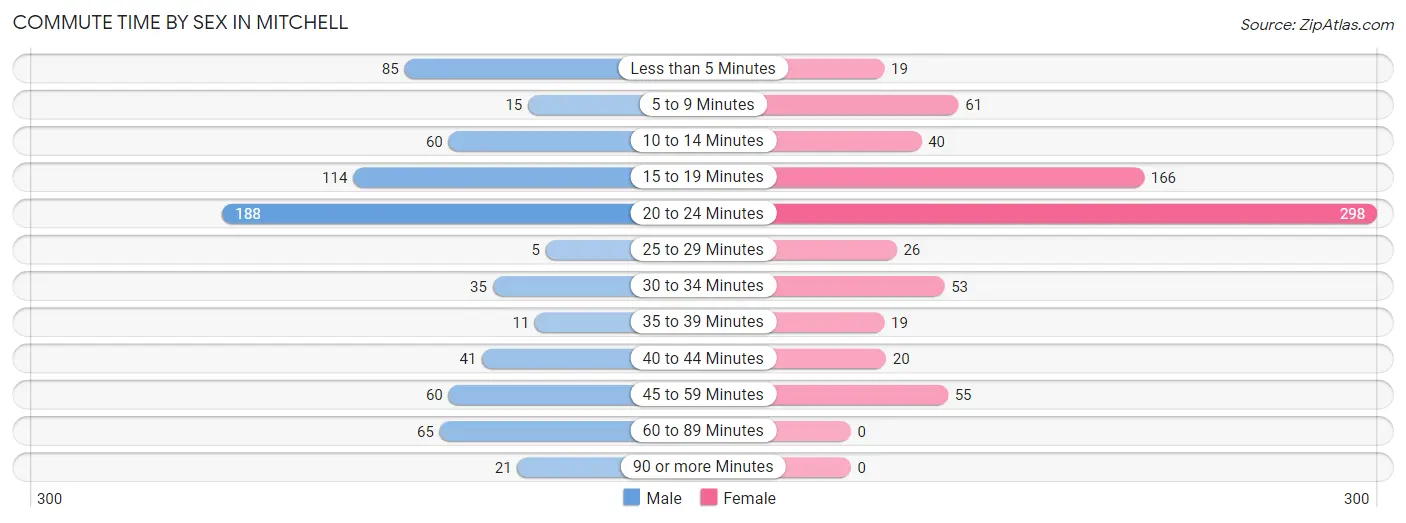
| Commute Time | Male | Female |
| Less than 5 Minutes | 85 (12.1%) | 19 (2.5%) |
| 5 to 9 Minutes | 15 (2.1%) | 61 (8.1%) |
| 10 to 14 Minutes | 60 (8.6%) | 40 (5.3%) |
| 15 to 19 Minutes | 114 (16.3%) | 166 (21.9%) |
| 20 to 24 Minutes | 188 (26.9%) | 298 (39.4%) |
| 25 to 29 Minutes | 5 (0.7%) | 26 (3.4%) |
| 30 to 34 Minutes | 35 (5.0%) | 53 (7.0%) |
| 35 to 39 Minutes | 11 (1.6%) | 19 (2.5%) |
| 40 to 44 Minutes | 41 (5.9%) | 20 (2.6%) |
| 45 to 59 Minutes | 60 (8.6%) | 55 (7.3%) |
| 60 to 89 Minutes | 65 (9.3%) | 0 (0.0%) |
| 90 or more Minutes | 21 (3.0%) | 0 (0.0%) |
Time of Departure to Work by Sex in Mitchell
The most frequent times of departure to work in Mitchell are 6:00 AM to 6:29 AM (151, 21.6%) for males and 8:00 AM to 8:29 AM (109, 14.4%) for females.
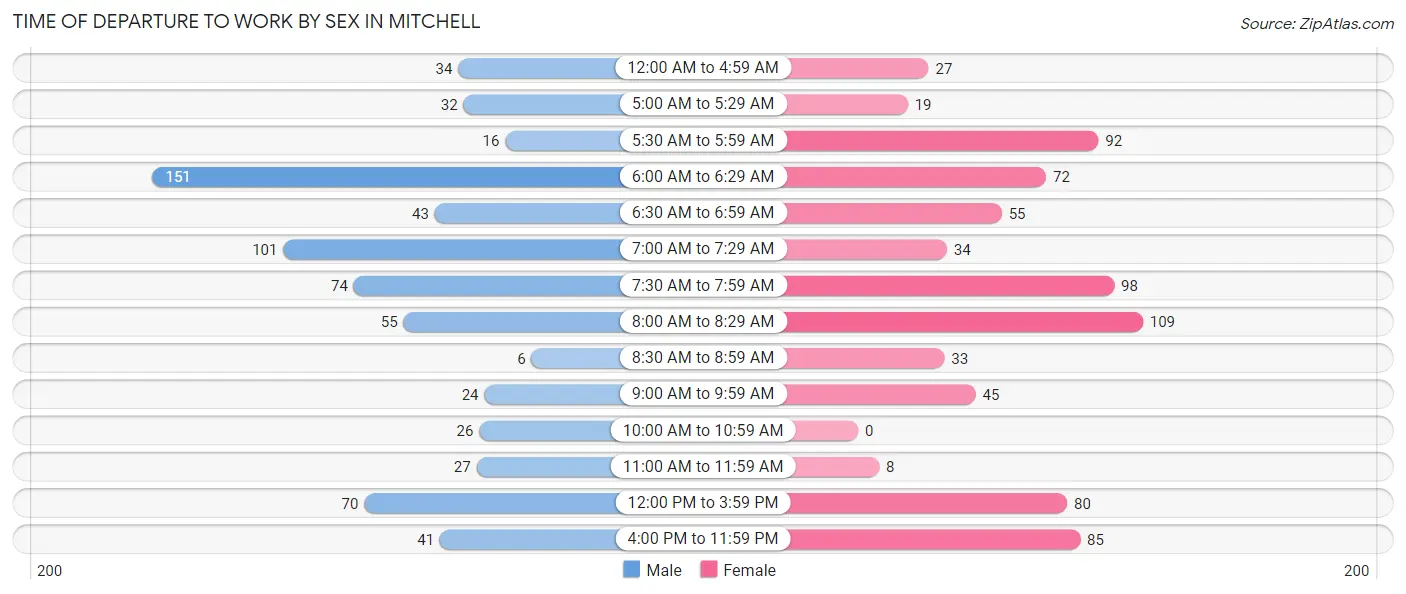
| Time of Departure | Male | Female |
| 12:00 AM to 4:59 AM | 34 (4.9%) | 27 (3.6%) |
| 5:00 AM to 5:29 AM | 32 (4.6%) | 19 (2.5%) |
| 5:30 AM to 5:59 AM | 16 (2.3%) | 92 (12.1%) |
| 6:00 AM to 6:29 AM | 151 (21.6%) | 72 (9.5%) |
| 6:30 AM to 6:59 AM | 43 (6.1%) | 55 (7.3%) |
| 7:00 AM to 7:29 AM | 101 (14.4%) | 34 (4.5%) |
| 7:30 AM to 7:59 AM | 74 (10.6%) | 98 (13.0%) |
| 8:00 AM to 8:29 AM | 55 (7.9%) | 109 (14.4%) |
| 8:30 AM to 8:59 AM | 6 (0.9%) | 33 (4.4%) |
| 9:00 AM to 9:59 AM | 24 (3.4%) | 45 (5.9%) |
| 10:00 AM to 10:59 AM | 26 (3.7%) | 0 (0.0%) |
| 11:00 AM to 11:59 AM | 27 (3.9%) | 8 (1.1%) |
| 12:00 PM to 3:59 PM | 70 (10.0%) | 80 (10.6%) |
| 4:00 PM to 11:59 PM | 41 (5.9%) | 85 (11.2%) |
| Total | 700 (100.0%) | 757 (100.0%) |
Housing Occupancy in Mitchell
Occupancy by Ownership in Mitchell
Of the total 1,394 dwellings in Mitchell, owner-occupied units account for 904 (64.8%), while renter-occupied units make up 490 (35.1%).
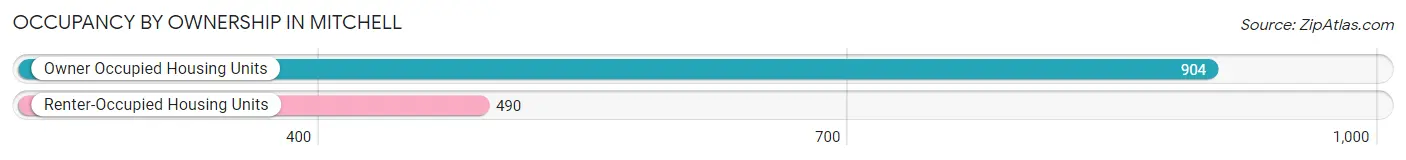
| Occupancy | # Housing Units | % Housing Units |
| Owner Occupied Housing Units | 904 | 64.8% |
| Renter-Occupied Housing Units | 490 | 35.1% |
| Total Occupied Housing Units | 1,394 | 100.0% |
Occupancy by Household Size in Mitchell
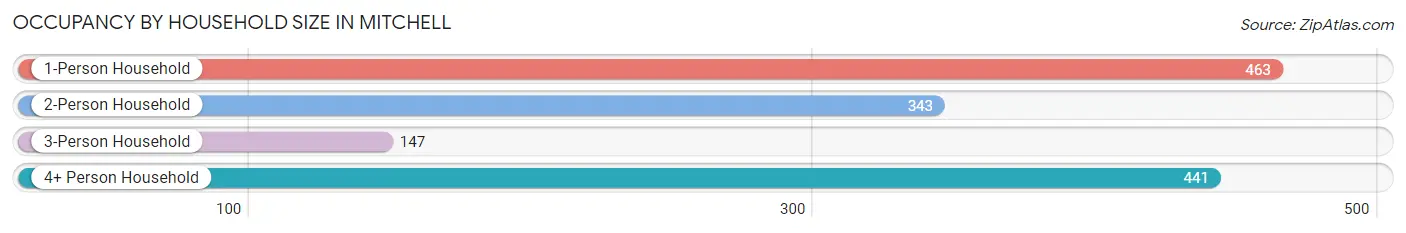
| Household Size | # Housing Units | % Housing Units |
| 1-Person Household | 463 | 33.2% |
| 2-Person Household | 343 | 24.6% |
| 3-Person Household | 147 | 10.5% |
| 4+ Person Household | 441 | 31.6% |
| Total Housing Units | 1,394 | 100.0% |
Occupancy by Ownership by Household Size in Mitchell
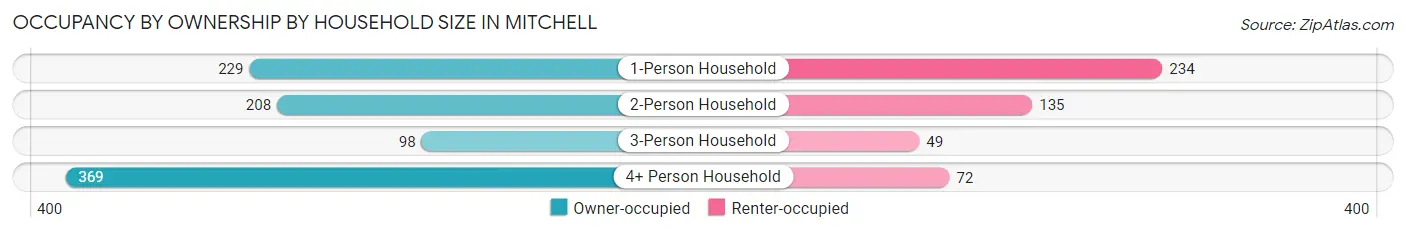
| Household Size | Owner-occupied | Renter-occupied |
| 1-Person Household | 229 (49.5%) | 234 (50.5%) |
| 2-Person Household | 208 (60.6%) | 135 (39.4%) |
| 3-Person Household | 98 (66.7%) | 49 (33.3%) |
| 4+ Person Household | 369 (83.7%) | 72 (16.3%) |
| Total Housing Units | 904 (64.8%) | 490 (35.1%) |
Occupancy by Educational Attainment in Mitchell
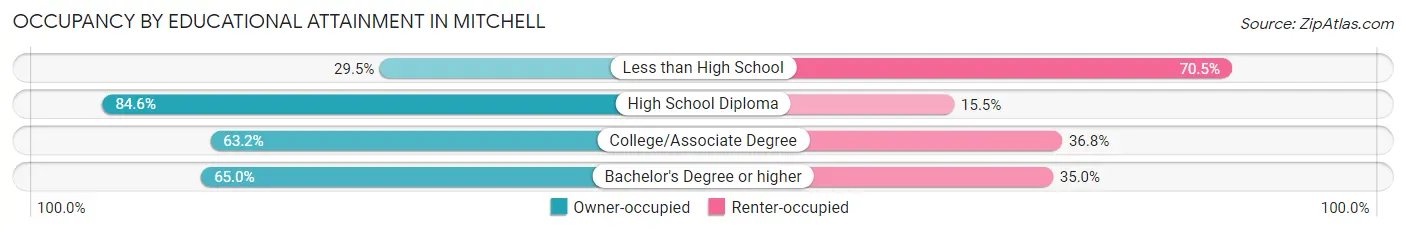
| Household Size | Owner-occupied | Renter-occupied |
| Less than High School | 85 (29.5%) | 203 (70.5%) |
| High School Diploma | 465 (84.6%) | 85 (15.4%) |
| College/Associate Degree | 252 (63.2%) | 147 (36.8%) |
| Bachelor's Degree or higher | 102 (65.0%) | 55 (35.0%) |
Occupancy by Age of Householder in Mitchell
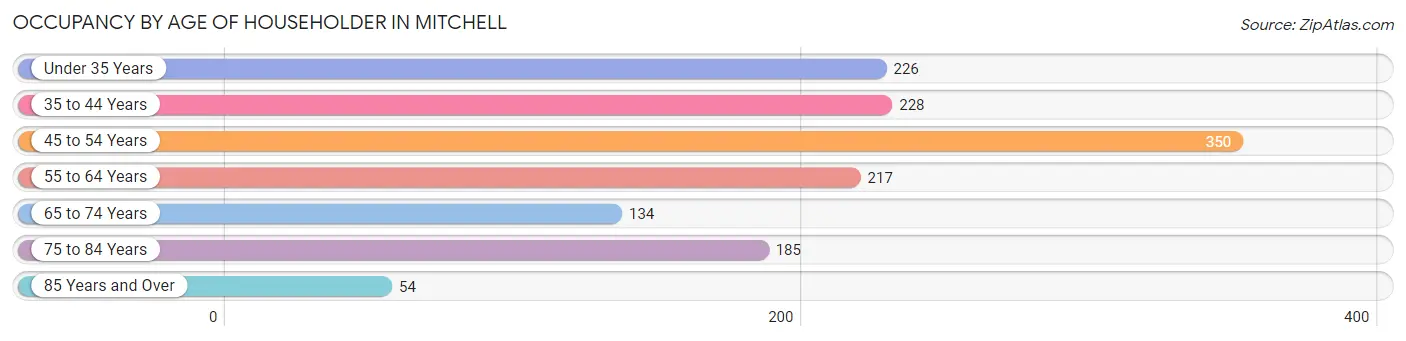
| Age Bracket | # Households | % Households |
| Under 35 Years | 226 | 16.2% |
| 35 to 44 Years | 228 | 16.4% |
| 45 to 54 Years | 350 | 25.1% |
| 55 to 64 Years | 217 | 15.6% |
| 65 to 74 Years | 134 | 9.6% |
| 75 to 84 Years | 185 | 13.3% |
| 85 Years and Over | 54 | 3.9% |
| Total | 1,394 | 100.0% |
Housing Finances in Mitchell
Median Income by Occupancy in Mitchell
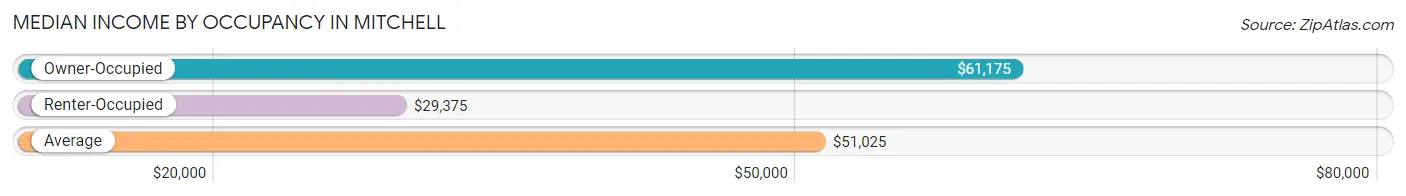
| Occupancy Type | # Households | Median Income |
| Owner-Occupied | 904 (64.8%) | $61,175 |
| Renter-Occupied | 490 (35.1%) | $29,375 |
| Average | 1,394 (100.0%) | $51,025 |
Occupancy by Householder Income Bracket in Mitchell
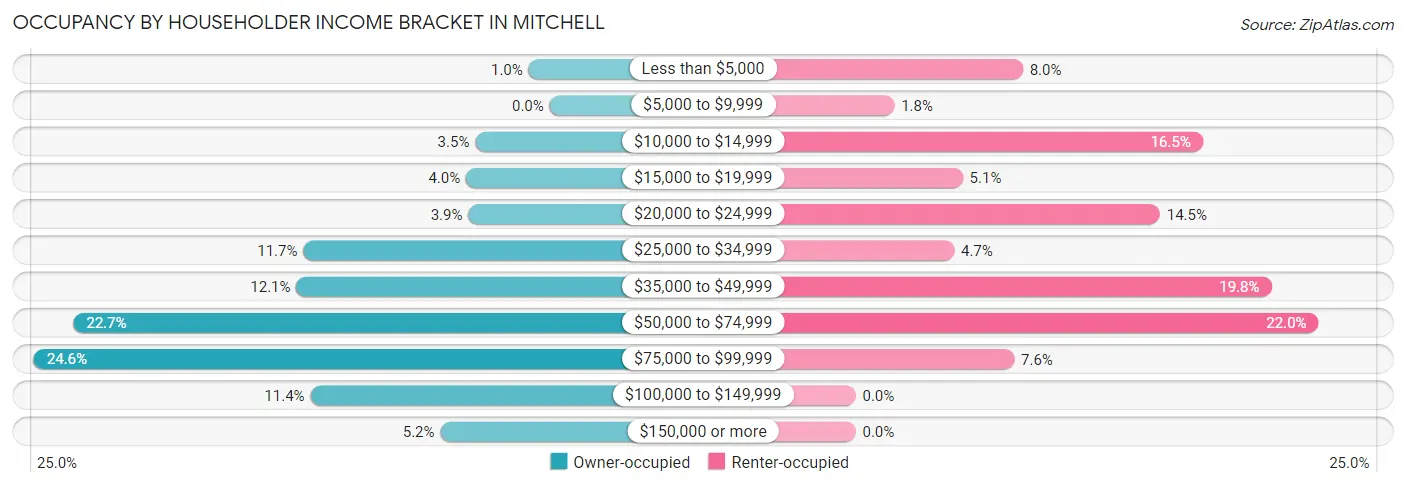
| Income Bracket | Owner-occupied | Renter-occupied |
| Less than $5,000 | 9 (1.0%) | 39 (8.0%) |
| $5,000 to $9,999 | 0 (0.0%) | 9 (1.8%) |
| $10,000 to $14,999 | 32 (3.5%) | 81 (16.5%) |
| $15,000 to $19,999 | 36 (4.0%) | 25 (5.1%) |
| $20,000 to $24,999 | 35 (3.9%) | 71 (14.5%) |
| $25,000 to $34,999 | 106 (11.7%) | 23 (4.7%) |
| $35,000 to $49,999 | 109 (12.1%) | 97 (19.8%) |
| $50,000 to $74,999 | 205 (22.7%) | 108 (22.0%) |
| $75,000 to $99,999 | 222 (24.6%) | 37 (7.5%) |
| $100,000 to $149,999 | 103 (11.4%) | 0 (0.0%) |
| $150,000 or more | 47 (5.2%) | 0 (0.0%) |
| Total | 904 (100.0%) | 490 (100.0%) |
Monthly Housing Cost Tiers in Mitchell
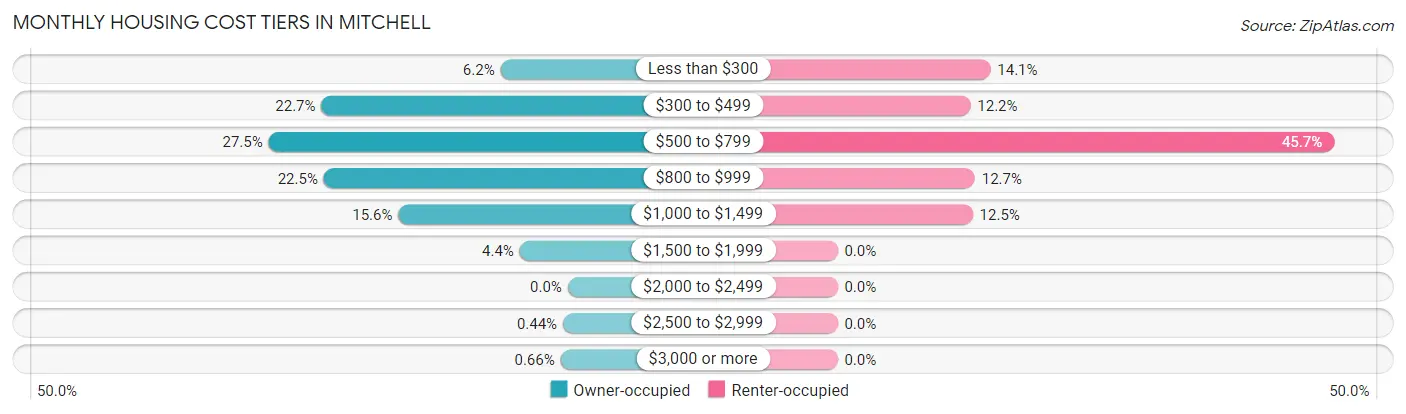
| Monthly Cost | Owner-occupied | Renter-occupied |
| Less than $300 | 56 (6.2%) | 69 (14.1%) |
| $300 to $499 | 205 (22.7%) | 60 (12.2%) |
| $500 to $799 | 249 (27.5%) | 224 (45.7%) |
| $800 to $999 | 203 (22.5%) | 62 (12.7%) |
| $1,000 to $1,499 | 141 (15.6%) | 61 (12.4%) |
| $1,500 to $1,999 | 40 (4.4%) | 0 (0.0%) |
| $2,000 to $2,499 | 0 (0.0%) | 0 (0.0%) |
| $2,500 to $2,999 | 4 (0.4%) | 0 (0.0%) |
| $3,000 or more | 6 (0.7%) | 0 (0.0%) |
| Total | 904 (100.0%) | 490 (100.0%) |
Physical Housing Characteristics in Mitchell
Housing Structures in Mitchell
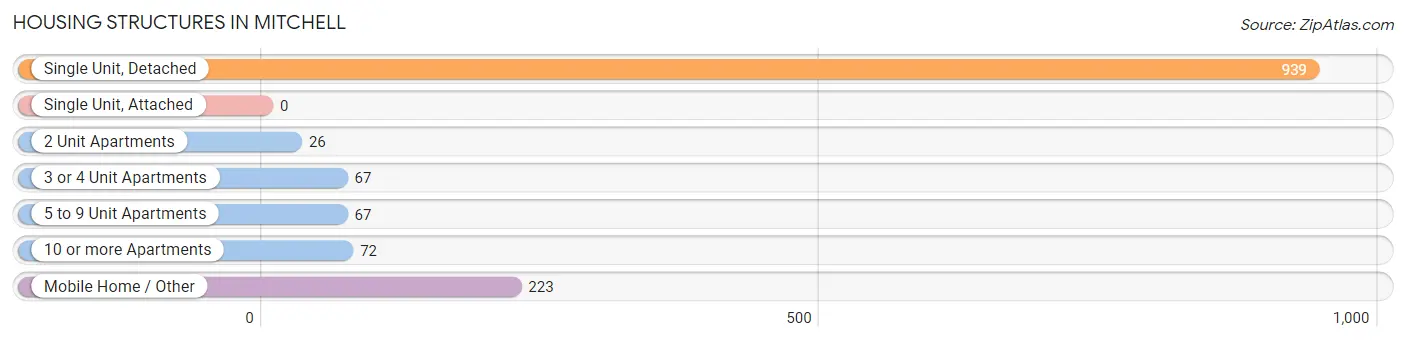
| Structure Type | # Housing Units | % Housing Units |
| Single Unit, Detached | 939 | 67.4% |
| Single Unit, Attached | 0 | 0.0% |
| 2 Unit Apartments | 26 | 1.9% |
| 3 or 4 Unit Apartments | 67 | 4.8% |
| 5 to 9 Unit Apartments | 67 | 4.8% |
| 10 or more Apartments | 72 | 5.2% |
| Mobile Home / Other | 223 | 16.0% |
| Total | 1,394 | 100.0% |
Housing Structures by Occupancy in Mitchell
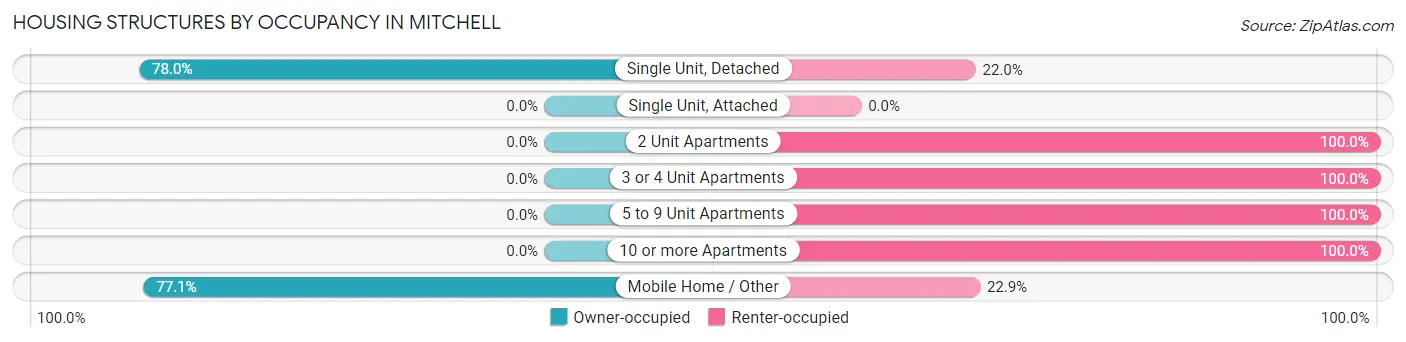
| Structure Type | Owner-occupied | Renter-occupied |
| Single Unit, Detached | 732 (78.0%) | 207 (22.0%) |
| Single Unit, Attached | 0 (0.0%) | 0 (0.0%) |
| 2 Unit Apartments | 0 (0.0%) | 26 (100.0%) |
| 3 or 4 Unit Apartments | 0 (0.0%) | 67 (100.0%) |
| 5 to 9 Unit Apartments | 0 (0.0%) | 67 (100.0%) |
| 10 or more Apartments | 0 (0.0%) | 72 (100.0%) |
| Mobile Home / Other | 172 (77.1%) | 51 (22.9%) |
| Total | 904 (64.8%) | 490 (35.1%) |
Housing Structures by Number of Rooms in Mitchell
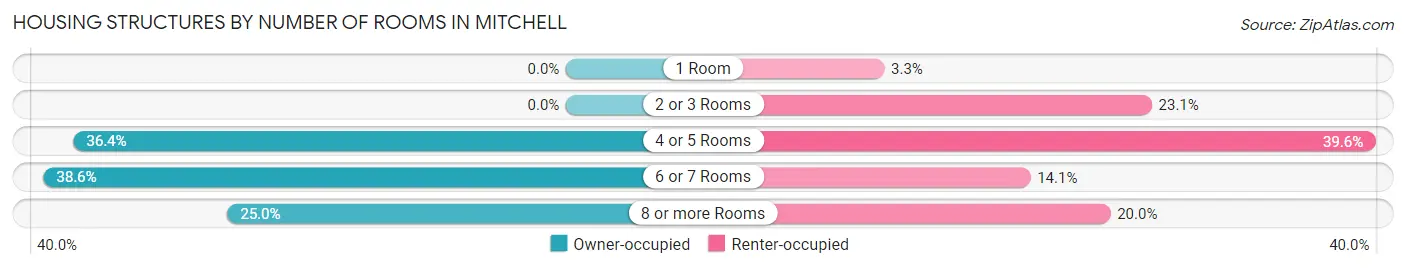
| Number of Rooms | Owner-occupied | Renter-occupied |
| 1 Room | 0 (0.0%) | 16 (3.3%) |
| 2 or 3 Rooms | 0 (0.0%) | 113 (23.1%) |
| 4 or 5 Rooms | 329 (36.4%) | 194 (39.6%) |
| 6 or 7 Rooms | 349 (38.6%) | 69 (14.1%) |
| 8 or more Rooms | 226 (25.0%) | 98 (20.0%) |
| Total | 904 (100.0%) | 490 (100.0%) |
Housing Structure by Heating Type in Mitchell
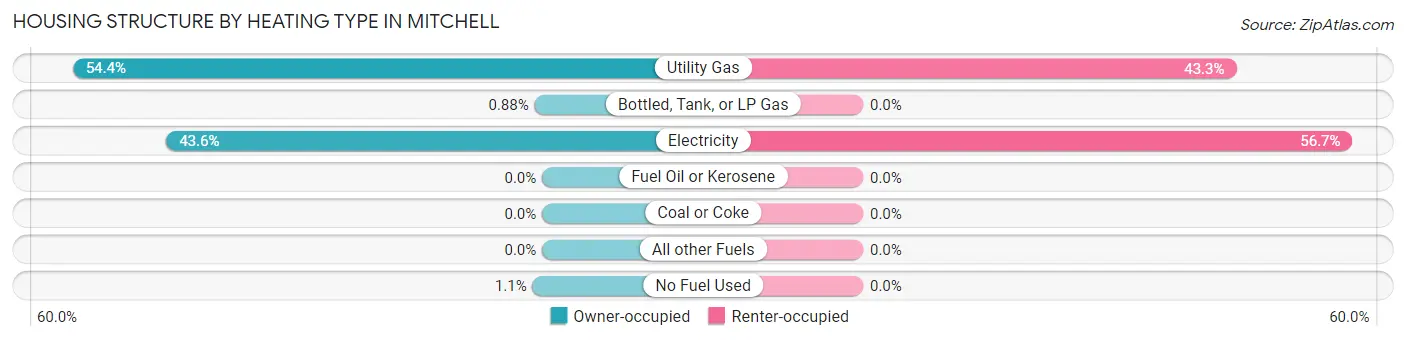
| Heating Type | Owner-occupied | Renter-occupied |
| Utility Gas | 492 (54.4%) | 212 (43.3%) |
| Bottled, Tank, or LP Gas | 8 (0.9%) | 0 (0.0%) |
| Electricity | 394 (43.6%) | 278 (56.7%) |
| Fuel Oil or Kerosene | 0 (0.0%) | 0 (0.0%) |
| Coal or Coke | 0 (0.0%) | 0 (0.0%) |
| All other Fuels | 0 (0.0%) | 0 (0.0%) |
| No Fuel Used | 10 (1.1%) | 0 (0.0%) |
| Total | 904 (100.0%) | 490 (100.0%) |
Household Vehicle Usage in Mitchell
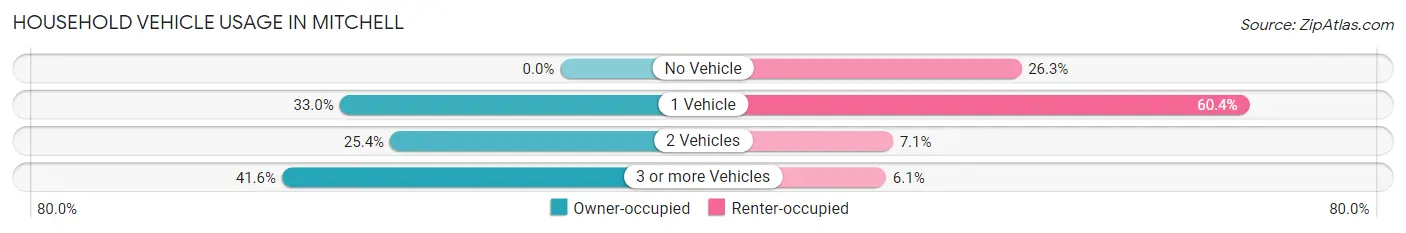
| Vehicles per Household | Owner-occupied | Renter-occupied |
| No Vehicle | 0 (0.0%) | 129 (26.3%) |
| 1 Vehicle | 298 (33.0%) | 296 (60.4%) |
| 2 Vehicles | 230 (25.4%) | 35 (7.1%) |
| 3 or more Vehicles | 376 (41.6%) | 30 (6.1%) |
| Total | 904 (100.0%) | 490 (100.0%) |
Real Estate & Mortgages in Mitchell
Real Estate and Mortgage Overview in Mitchell
| Characteristic | Without Mortgage | With Mortgage |
| Housing Units | 375 | 529 |
| Median Property Value | $113,400 | $95,600 |
| Median Household Income | $68,295 | $42 |
| Monthly Housing Costs | $459 | $6 |
| Real Estate Taxes | $610 | $32 |
Property Value by Mortgage Status in Mitchell
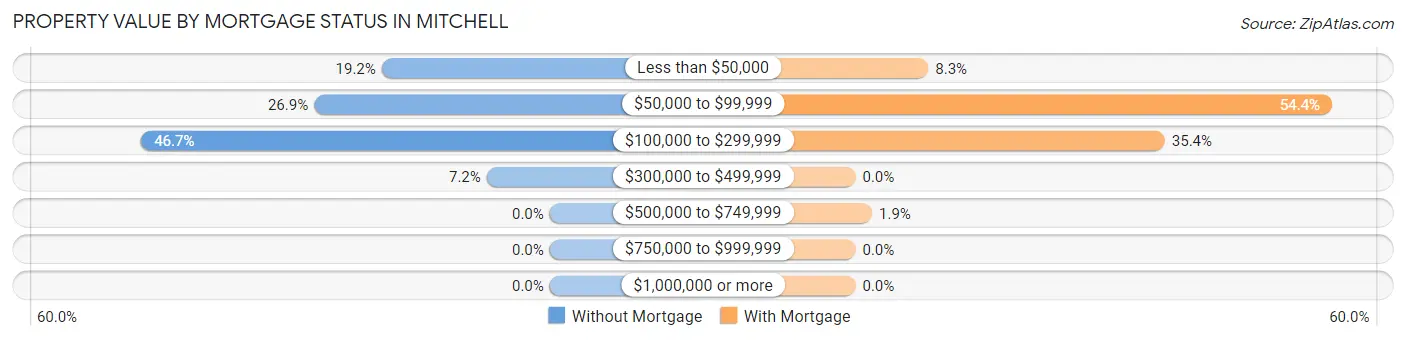
| Property Value | Without Mortgage | With Mortgage |
| Less than $50,000 | 72 (19.2%) | 44 (8.3%) |
| $50,000 to $99,999 | 101 (26.9%) | 288 (54.4%) |
| $100,000 to $299,999 | 175 (46.7%) | 187 (35.3%) |
| $300,000 to $499,999 | 27 (7.2%) | 0 (0.0%) |
| $500,000 to $749,999 | 0 (0.0%) | 10 (1.9%) |
| $750,000 to $999,999 | 0 (0.0%) | 0 (0.0%) |
| $1,000,000 or more | 0 (0.0%) | 0 (0.0%) |
| Total | 375 (100.0%) | 529 (100.0%) |
Household Income by Mortgage Status in Mitchell
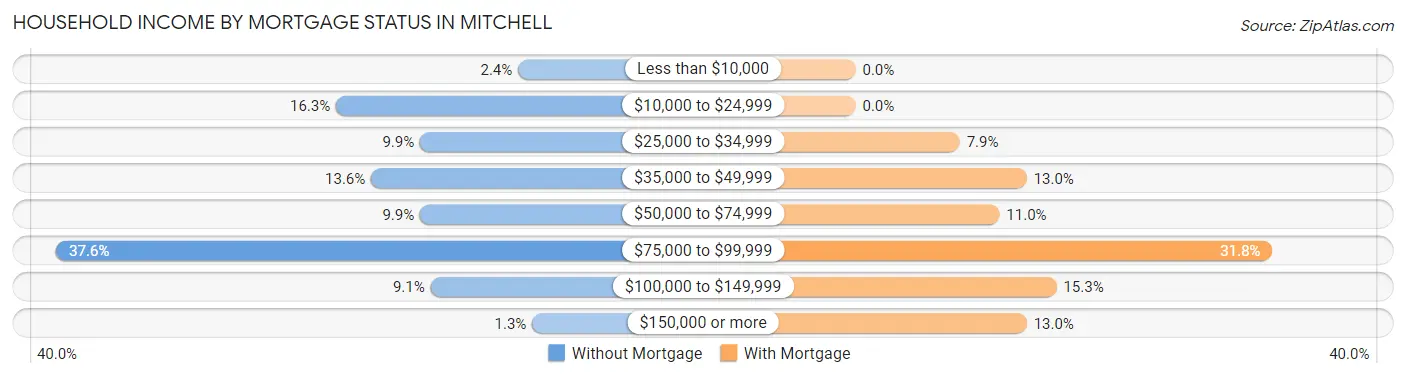
| Household Income | Without Mortgage | With Mortgage |
| Less than $10,000 | 9 (2.4%) | 0 (0.0%) |
| $10,000 to $24,999 | 61 (16.3%) | 0 (0.0%) |
| $25,000 to $34,999 | 37 (9.9%) | 42 (7.9%) |
| $35,000 to $49,999 | 51 (13.6%) | 69 (13.0%) |
| $50,000 to $74,999 | 37 (9.9%) | 58 (11.0%) |
| $75,000 to $99,999 | 141 (37.6%) | 168 (31.8%) |
| $100,000 to $149,999 | 34 (9.1%) | 81 (15.3%) |
| $150,000 or more | 5 (1.3%) | 69 (13.0%) |
| Total | 375 (100.0%) | 529 (100.0%) |
Property Value to Household Income Ratio in Mitchell
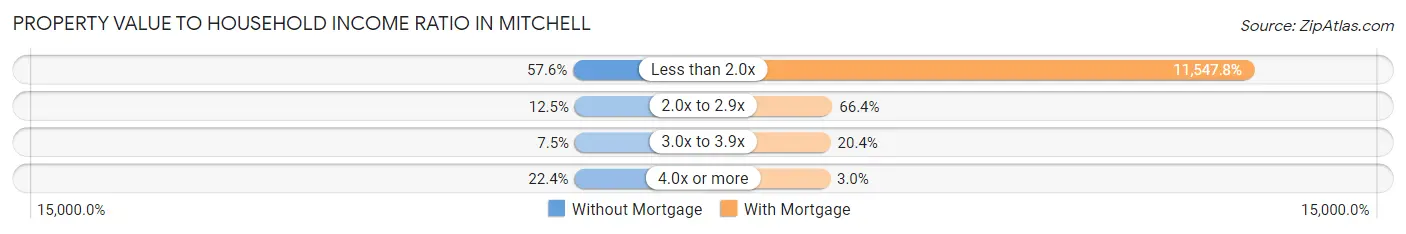
| Value-to-Income Ratio | Without Mortgage | With Mortgage |
| Less than 2.0x | 216 (57.6%) | 61,088 (11,547.8%) |
| 2.0x to 2.9x | 47 (12.5%) | 351 (66.3%) |
| 3.0x to 3.9x | 28 (7.5%) | 108 (20.4%) |
| 4.0x or more | 84 (22.4%) | 16 (3.0%) |
| Total | 375 (100.0%) | 529 (100.0%) |
Real Estate Taxes by Mortgage Status in Mitchell
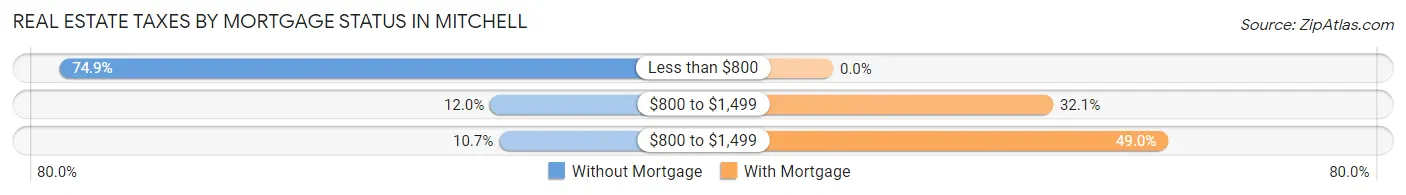
| Property Taxes | Without Mortgage | With Mortgage |
| Less than $800 | 281 (74.9%) | 0 (0.0%) |
| $800 to $1,499 | 45 (12.0%) | 170 (32.1%) |
| $800 to $1,499 | 40 (10.7%) | 259 (49.0%) |
| Total | 375 (100.0%) | 529 (100.0%) |
Health & Disability in Mitchell
Health Insurance Coverage by Age in Mitchell
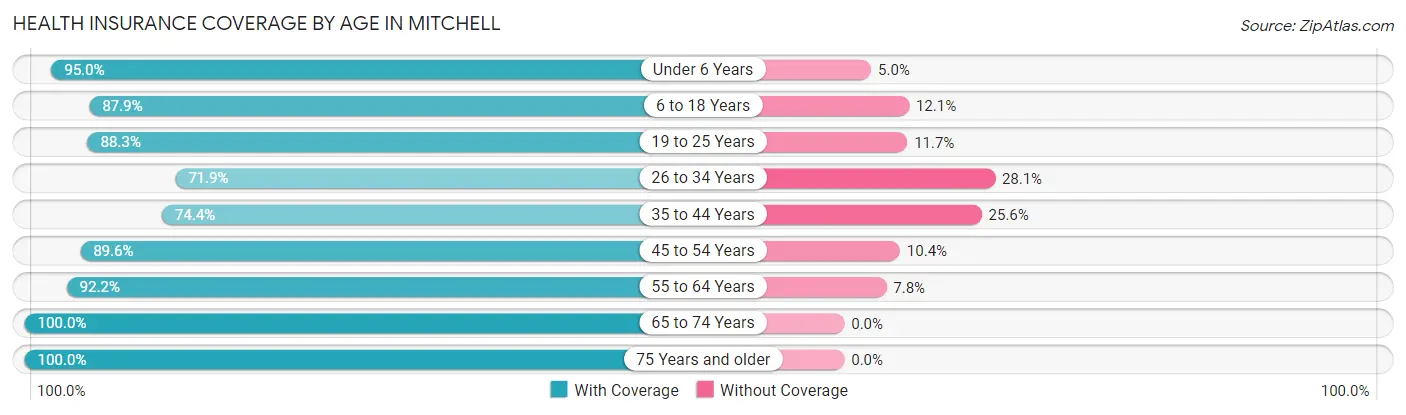
| Age Bracket | With Coverage | Without Coverage |
| Under 6 Years | 362 (95.0%) | 19 (5.0%) |
| 6 to 18 Years | 671 (87.9%) | 92 (12.1%) |
| 19 to 25 Years | 271 (88.3%) | 36 (11.7%) |
| 26 to 34 Years | 361 (71.9%) | 141 (28.1%) |
| 35 to 44 Years | 334 (74.4%) | 115 (25.6%) |
| 45 to 54 Years | 389 (89.6%) | 45 (10.4%) |
| 55 to 64 Years | 435 (92.2%) | 37 (7.8%) |
| 65 to 74 Years | 171 (100.0%) | 0 (0.0%) |
| 75 Years and older | 379 (100.0%) | 0 (0.0%) |
| Total | 3,373 (87.4%) | 485 (12.6%) |
Health Insurance Coverage by Citizenship Status in Mitchell
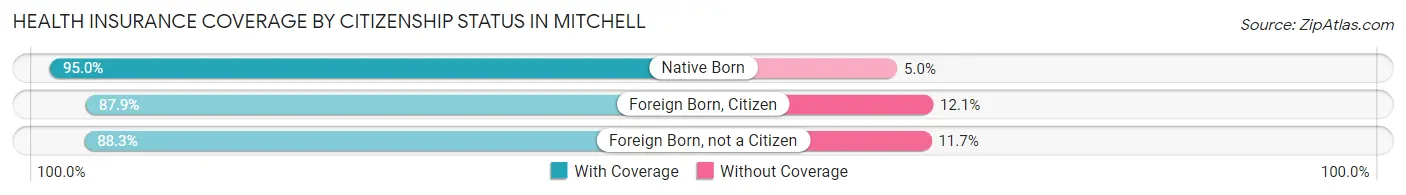
| Citizenship Status | With Coverage | Without Coverage |
| Native Born | 362 (95.0%) | 19 (5.0%) |
| Foreign Born, Citizen | 671 (87.9%) | 92 (12.1%) |
| Foreign Born, not a Citizen | 271 (88.3%) | 36 (11.7%) |
Health Insurance Coverage by Household Income in Mitchell
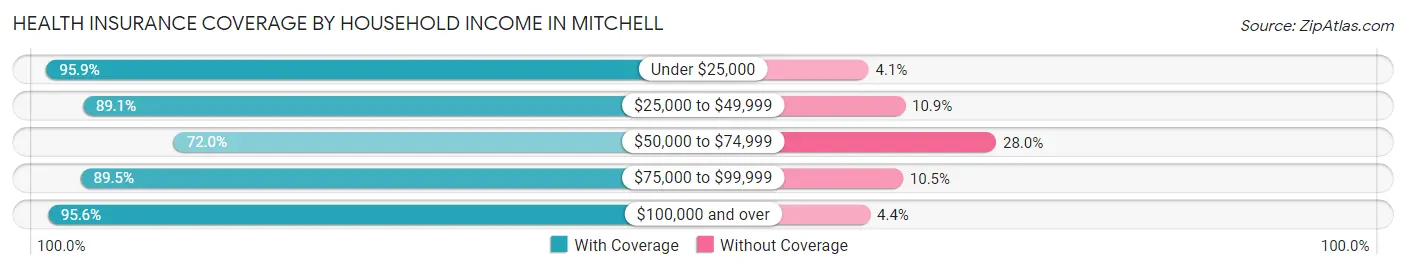
| Household Income | With Coverage | Without Coverage |
| Under $25,000 | 517 (95.9%) | 22 (4.1%) |
| $25,000 to $49,999 | 604 (89.1%) | 74 (10.9%) |
| $50,000 to $74,999 | 644 (72.0%) | 250 (28.0%) |
| $75,000 to $99,999 | 921 (89.5%) | 108 (10.5%) |
| $100,000 and over | 680 (95.6%) | 31 (4.4%) |
Public vs Private Health Insurance Coverage by Age in Mitchell
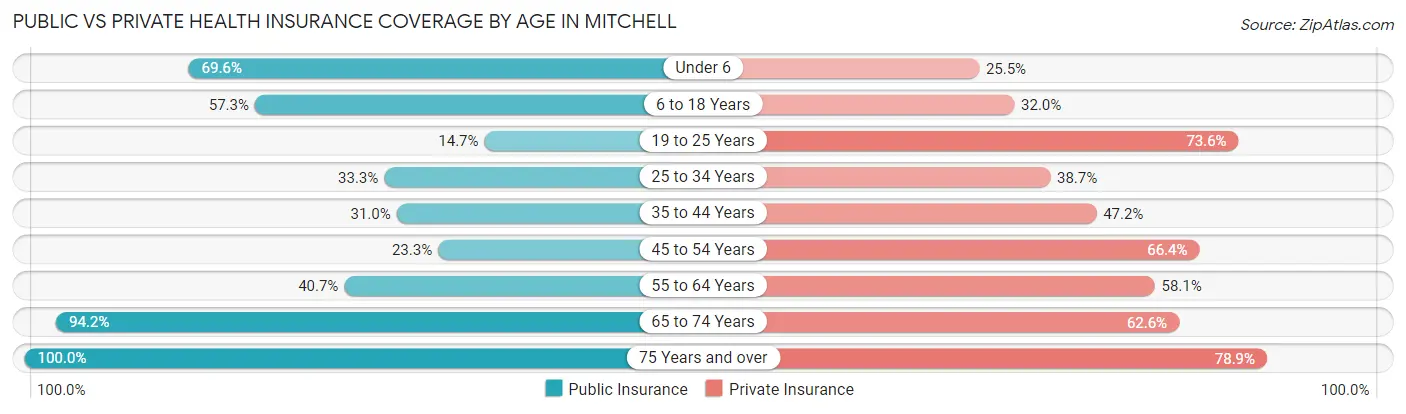
| Age Bracket | Public Insurance | Private Insurance |
| Under 6 | 265 (69.6%) | 97 (25.5%) |
| 6 to 18 Years | 437 (57.3%) | 244 (32.0%) |
| 19 to 25 Years | 45 (14.7%) | 226 (73.6%) |
| 25 to 34 Years | 167 (33.3%) | 194 (38.7%) |
| 35 to 44 Years | 139 (31.0%) | 212 (47.2%) |
| 45 to 54 Years | 101 (23.3%) | 288 (66.4%) |
| 55 to 64 Years | 192 (40.7%) | 274 (58.1%) |
| 65 to 74 Years | 161 (94.2%) | 107 (62.6%) |
| 75 Years and over | 379 (100.0%) | 299 (78.9%) |
| Total | 1,886 (48.9%) | 1,941 (50.3%) |
Disability Status by Sex by Age in Mitchell
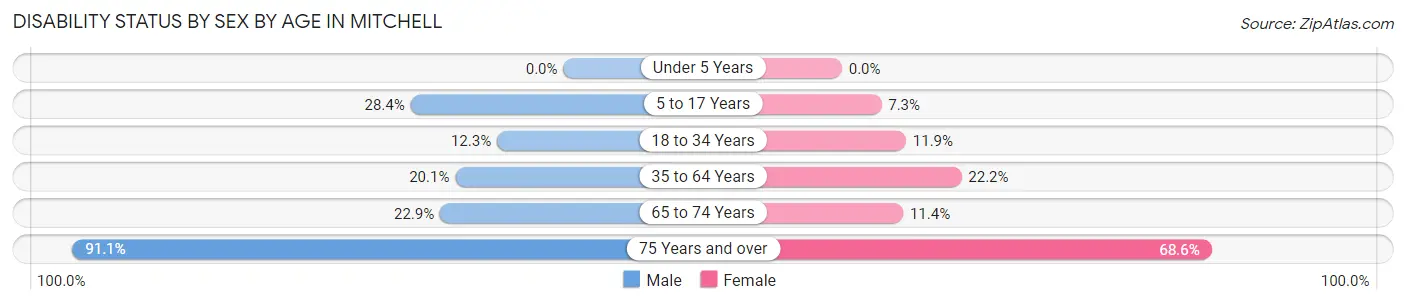
| Age Bracket | Male | Female |
| Under 5 Years | 0 (0.0%) | 0 (0.0%) |
| 5 to 17 Years | 141 (28.4%) | 22 (7.3%) |
| 18 to 34 Years | 44 (12.3%) | 56 (11.9%) |
| 35 to 64 Years | 111 (20.1%) | 178 (22.2%) |
| 65 to 74 Years | 19 (22.9%) | 10 (11.4%) |
| 75 Years and over | 113 (91.1%) | 175 (68.6%) |
Disability Class by Sex by Age in Mitchell
Disability Class: Hearing Difficulty
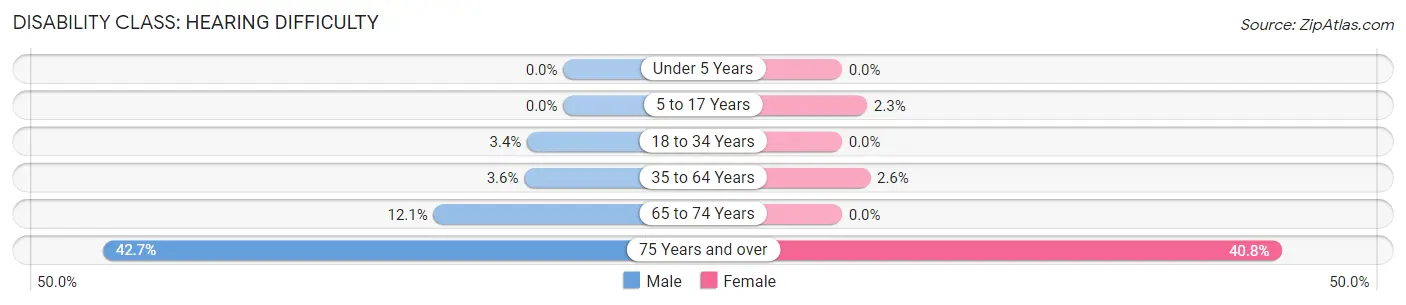
| Age Bracket | Male | Female |
| Under 5 Years | 0 (0.0%) | 0 (0.0%) |
| 5 to 17 Years | 0 (0.0%) | 7 (2.3%) |
| 18 to 34 Years | 12 (3.4%) | 0 (0.0%) |
| 35 to 64 Years | 20 (3.6%) | 21 (2.6%) |
| 65 to 74 Years | 10 (12.0%) | 0 (0.0%) |
| 75 Years and over | 53 (42.7%) | 104 (40.8%) |
Disability Class: Vision Difficulty
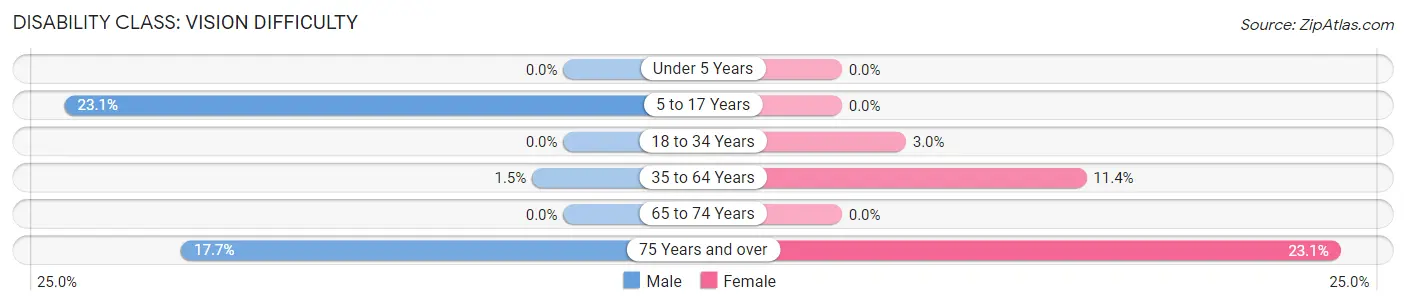
| Age Bracket | Male | Female |
| Under 5 Years | 0 (0.0%) | 0 (0.0%) |
| 5 to 17 Years | 115 (23.1%) | 0 (0.0%) |
| 18 to 34 Years | 0 (0.0%) | 14 (3.0%) |
| 35 to 64 Years | 8 (1.5%) | 91 (11.4%) |
| 65 to 74 Years | 0 (0.0%) | 0 (0.0%) |
| 75 Years and over | 22 (17.7%) | 59 (23.1%) |
Disability Class: Cognitive Difficulty
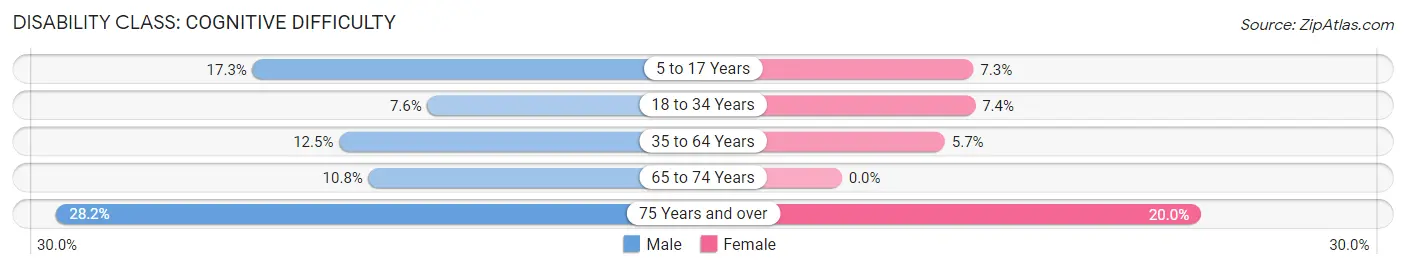
| Age Bracket | Male | Female |
| 5 to 17 Years | 86 (17.3%) | 22 (7.3%) |
| 18 to 34 Years | 27 (7.6%) | 35 (7.4%) |
| 35 to 64 Years | 69 (12.5%) | 46 (5.7%) |
| 65 to 74 Years | 9 (10.8%) | 0 (0.0%) |
| 75 Years and over | 35 (28.2%) | 51 (20.0%) |
Disability Class: Ambulatory Difficulty
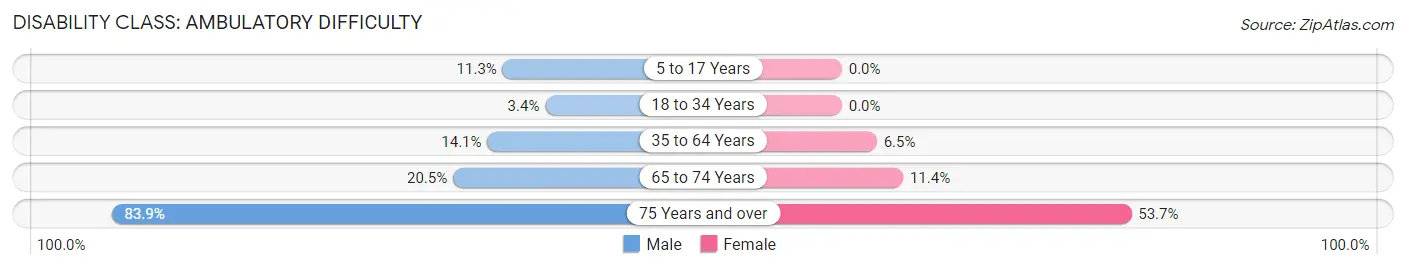
| Age Bracket | Male | Female |
| 5 to 17 Years | 56 (11.3%) | 0 (0.0%) |
| 18 to 34 Years | 12 (3.4%) | 0 (0.0%) |
| 35 to 64 Years | 78 (14.1%) | 52 (6.5%) |
| 65 to 74 Years | 17 (20.5%) | 10 (11.4%) |
| 75 Years and over | 104 (83.9%) | 137 (53.7%) |
Disability Class: Self-Care Difficulty
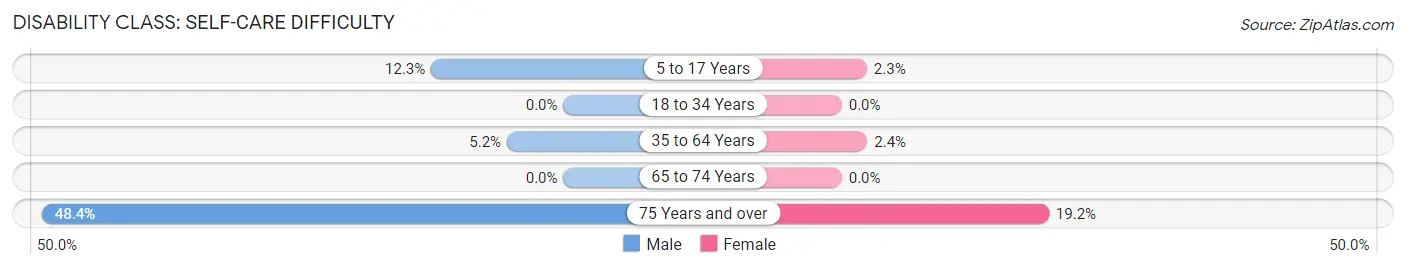
| Age Bracket | Male | Female |
| 5 to 17 Years | 61 (12.3%) | 7 (2.3%) |
| 18 to 34 Years | 0 (0.0%) | 0 (0.0%) |
| 35 to 64 Years | 29 (5.2%) | 19 (2.4%) |
| 65 to 74 Years | 0 (0.0%) | 0 (0.0%) |
| 75 Years and over | 60 (48.4%) | 49 (19.2%) |
Technology Access in Mitchell
Computing Device Access in Mitchell
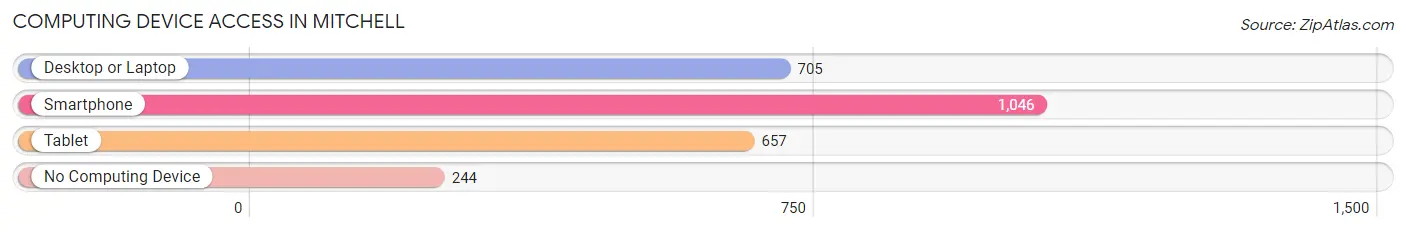
| Device Type | # Households | % Households |
| Desktop or Laptop | 705 | 50.6% |
| Smartphone | 1,046 | 75.0% |
| Tablet | 657 | 47.1% |
| No Computing Device | 244 | 17.5% |
| Total | 1,394 | 100.0% |
Internet Access in Mitchell
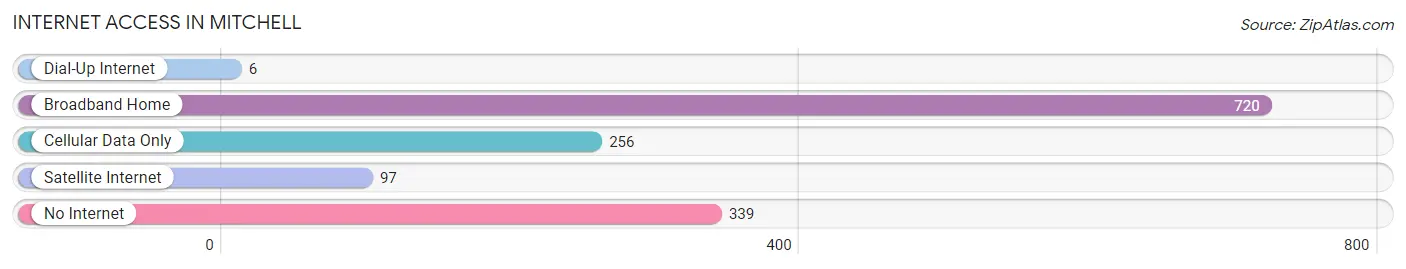
| Internet Type | # Households | % Households |
| Dial-Up Internet | 6 | 0.4% |
| Broadband Home | 720 | 51.6% |
| Cellular Data Only | 256 | 18.4% |
| Satellite Internet | 97 | 7.0% |
| No Internet | 339 | 24.3% |
| Total | 1,394 | 100.0% |
Mitchell Summary
Mitchell, Indiana is a city located in Lawrence County, Indiana, United States. It is the county seat of Lawrence County and is located along the East Fork of the White River. The population was estimated to be 4,845 in 2019.
History
The area that is now Mitchell was first settled in 1817 by John and Mary Mitchell, who were among the first settlers in Lawrence County. The town was officially founded in 1837 and was named after the Mitchells. The town was incorporated in 1858.
In the late 19th century, Mitchell was a major center for the coal mining industry. The coal industry was the main source of employment for the town until the early 20th century. The town also had a large number of factories, including a glass factory, a furniture factory, and a brick factory.
Geography
Mitchell is located in the East Fork of the White River Valley in Lawrence County, Indiana. The city is situated at an elevation of 590 feet above sea level. The city has a total area of 4.2 square miles, all of which is land.
The climate in Mitchell is classified as humid continental, with hot summers and cold winters. The average annual temperature is 54°F, with an average high of 79°F in July and an average low of 28°F in January. The average annual precipitation is 40 inches.
Economy
The economy of Mitchell is largely based on manufacturing and services. The city is home to several manufacturing companies, including a glass factory, a furniture factory, and a brick factory. The city also has a number of retail stores, restaurants, and other businesses.
The city is also home to a number of educational institutions, including Mitchell High School, Mitchell Middle School, and Mitchell Elementary School. The city is also home to a branch of the Ivy Tech Community College.
Demographics
As of the 2019 census, the population of Mitchell was estimated to be 4,845. The racial makeup of the city was 97.2% White, 0.7% African American, 0.3% Native American, 0.2% Asian, 0.1% Pacific Islander, 0.4% from other races, and 1.1% from two or more races. Hispanic or Latino of any race were 1.3% of the population.
The median household income in Mitchell was $37,917 in 2019. The median age of the population was 40.7 years. The city had a poverty rate of 17.3%.
Conclusion
Mitchell, Indiana is a city located in Lawrence County, Indiana, United States. It is the county seat of Lawrence County and is located along the East Fork of the White River. The city was founded in 1837 and has a population of 4,845 as of 2019. The economy of Mitchell is largely based on manufacturing and services, and the city is home to several educational institutions. The racial makeup of the city is 97.2% White, 0.7% African American, 0.3% Native American, 0.2% Asian, 0.1% Pacific Islander, 0.4% from other races, and 1.1% from two or more races. The median household income in Mitchell was $37,917 in 2019.
Common Questions
What is Per Capita Income in Mitchell?
Per Capita income in Mitchell is $20,294.
What is the Median Family Income in Mitchell?
Median Family Income in Mitchell is $61,641.
What is the Median Household income in Mitchell?
Median Household Income in Mitchell is $51,025.
What is Income or Wage Gap in Mitchell?
Income or Wage Gap in Mitchell is 23.2%.
Women in Mitchell earn 76.8 cents for every dollar earned by a man.
What is Inequality or Gini Index in Mitchell?
Inequality or Gini Index in Mitchell is 0.38.
What is the Total Population of Mitchell?
Total Population of Mitchell is 3,947.
What is the Total Male Population of Mitchell?
Total Male Population of Mitchell is 1,825.
What is the Total Female Population of Mitchell?
Total Female Population of Mitchell is 2,122.
What is the Ratio of Males per 100 Females in Mitchell?
There are 86.00 Males per 100 Females in Mitchell.
What is the Ratio of Females per 100 Males in Mitchell?
There are 116.27 Females per 100 Males in Mitchell.
What is the Median Population Age in Mitchell?
Median Population Age in Mitchell is 35.5 Years.
What is the Average Family Size in Mitchell
Average Family Size in Mitchell is 3.8 People.
What is the Average Household Size in Mitchell
Average Household Size in Mitchell is 2.8 People.
How Large is the Labor Force in Mitchell?
There are 1,596 People in the Labor Forcein in Mitchell.
What is the Percentage of People in the Labor Force in Mitchell?
55.8% of People are in the Labor Force in Mitchell.
What is the Unemployment Rate in Mitchell?
Unemployment Rate in Mitchell is 5.8%.