Mexico, IN Map & Demographics
Mexico Map
Mexico Overview
$31,786
PER CAPITA INCOME
$82,250
AVG FAMILY INCOME
$78,125
AVG HOUSEHOLD INCOME
0.27
INEQUALITY / GINI INDEX
1,128
TOTAL POPULATION
678
MALE POPULATION
450
FEMALE POPULATION
150.67
MALES / 100 FEMALES
66.37
FEMALES / 100 MALES
44.7
MEDIAN AGE
3.2
AVG FAMILY SIZE
2.0
AVG HOUSEHOLD SIZE
390
LABOR FORCE [ PEOPLE ]
38.1%
PERCENT IN LABOR FORCE
1.0%
UNEMPLOYMENT RATE
Mexico Zip Codes
Income in Mexico
Income Overview in Mexico
Per Capita Income in Mexico is $31,786, while median incomes of families and households are $82,250 and $78,125 respectively.
| Characteristic | Number | Measure |
| Per Capita Income | 1,128 | $31,786 |
| Median Family Income | 192 | $82,250 |
| Mean Family Income | 192 | $83,760 |
| Median Household Income | 446 | $78,125 |
| Mean Household Income | 446 | $69,409 |
| Income Deficit | 192 | $0 |
| Wage / Income Gap (%) | 1,128 | 0.00% |
| Wage / Income Gap ($) | 1,128 | 100.00¢ per $1 |
| Gini / Inequality Index | 1,128 | 0.27 |
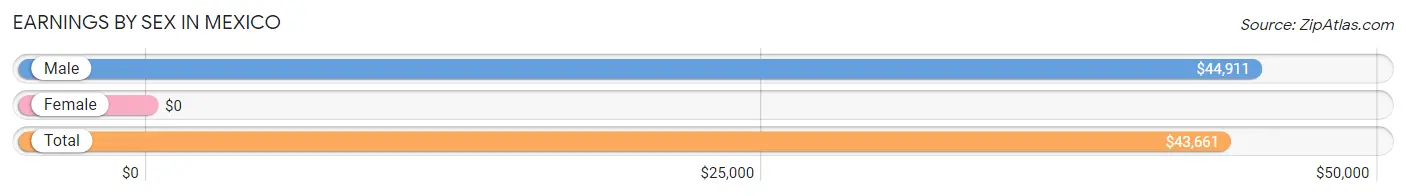
Earnings by Sex in Mexico
| Sex | Number | Average Earnings |
| Male | 261 (52.9%) | $44,911 |
| Female | 232 (47.1%) | $0 |
| Total | 493 (100.0%) | $43,661 |
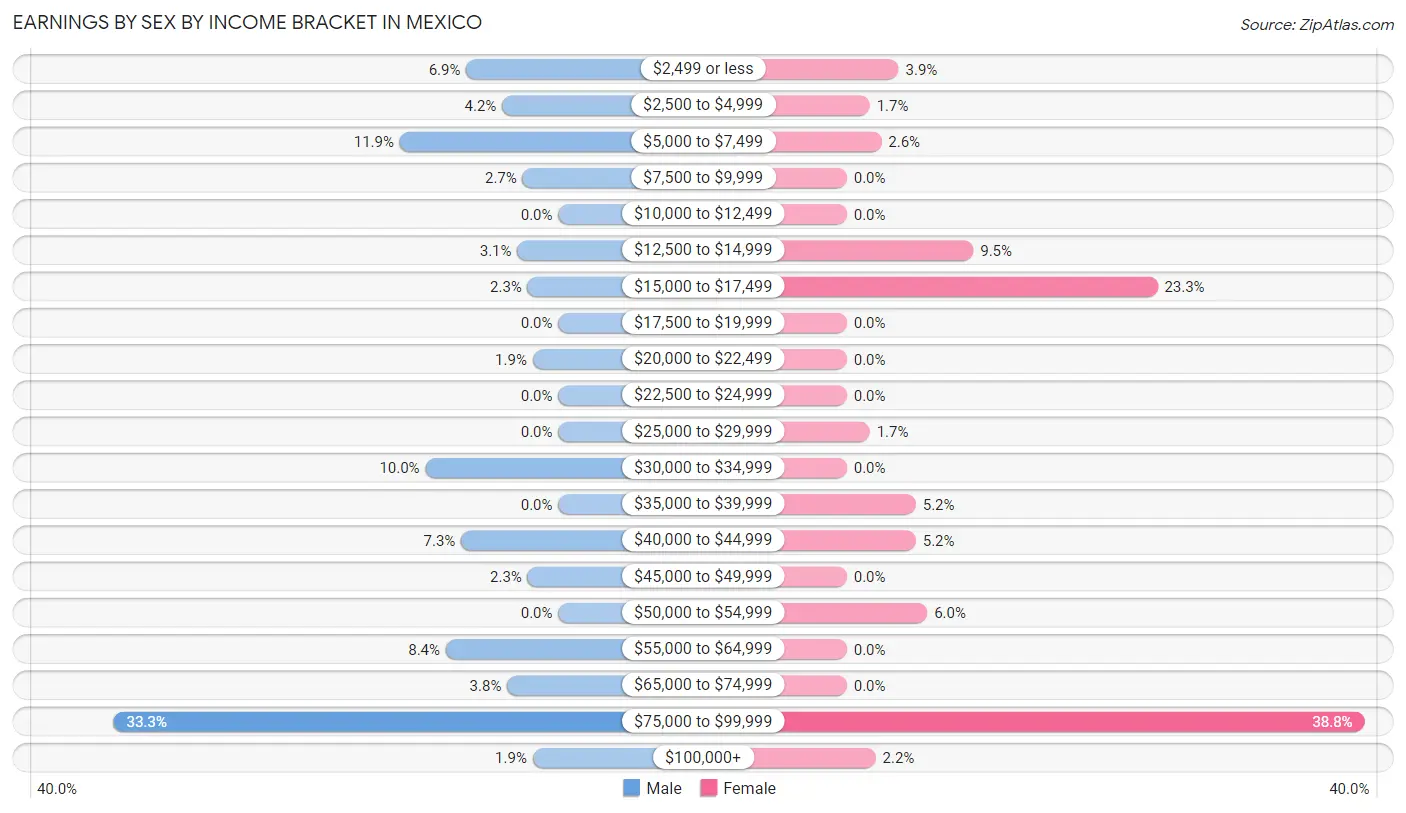
Earnings by Sex by Income Bracket in Mexico
The most common earnings brackets in Mexico are $75,000 to $99,999 for men (87 | 33.3%) and $75,000 to $99,999 for women (90 | 38.8%).
| Income | Male | Female |
| $2,499 or less | 18 (6.9%) | 9 (3.9%) |
| $2,500 to $4,999 | 11 (4.2%) | 4 (1.7%) |
| $5,000 to $7,499 | 31 (11.9%) | 6 (2.6%) |
| $7,500 to $9,999 | 7 (2.7%) | 0 (0.0%) |
| $10,000 to $12,499 | 0 (0.0%) | 0 (0.0%) |
| $12,500 to $14,999 | 8 (3.1%) | 22 (9.5%) |
| $15,000 to $17,499 | 6 (2.3%) | 54 (23.3%) |
| $17,500 to $19,999 | 0 (0.0%) | 0 (0.0%) |
| $20,000 to $22,499 | 5 (1.9%) | 0 (0.0%) |
| $22,500 to $24,999 | 0 (0.0%) | 0 (0.0%) |
| $25,000 to $29,999 | 0 (0.0%) | 4 (1.7%) |
| $30,000 to $34,999 | 26 (10.0%) | 0 (0.0%) |
| $35,000 to $39,999 | 0 (0.0%) | 12 (5.2%) |
| $40,000 to $44,999 | 19 (7.3%) | 12 (5.2%) |
| $45,000 to $49,999 | 6 (2.3%) | 0 (0.0%) |
| $50,000 to $54,999 | 0 (0.0%) | 14 (6.0%) |
| $55,000 to $64,999 | 22 (8.4%) | 0 (0.0%) |
| $65,000 to $74,999 | 10 (3.8%) | 0 (0.0%) |
| $75,000 to $99,999 | 87 (33.3%) | 90 (38.8%) |
| $100,000+ | 5 (1.9%) | 5 (2.2%) |
| Total | 261 (100.0%) | 232 (100.0%) |
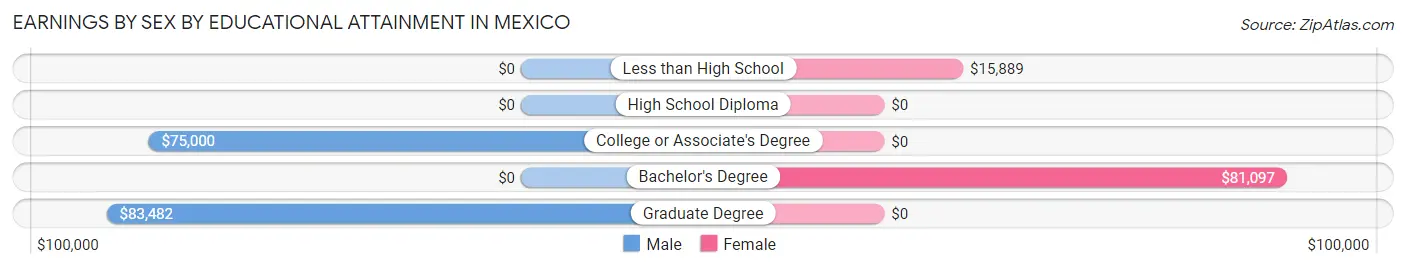
Earnings by Sex by Educational Attainment in Mexico
| Educational Attainment | Male Income | Female Income |
| Less than High School | - | - |
| High School Diploma | - | - |
| College or Associate's Degree | $75,000 | $0 |
| Bachelor's Degree | - | - |
| Graduate Degree | $83,482 | $0 |
| Total | $55,455 | $0 |
Family Income in Mexico
Family Income Brackets in Mexico
According to the Mexico family income data, there are 72 families falling into the $75,000 to $99,999 income range, which is the most common income bracket and makes up 37.5% of all families.
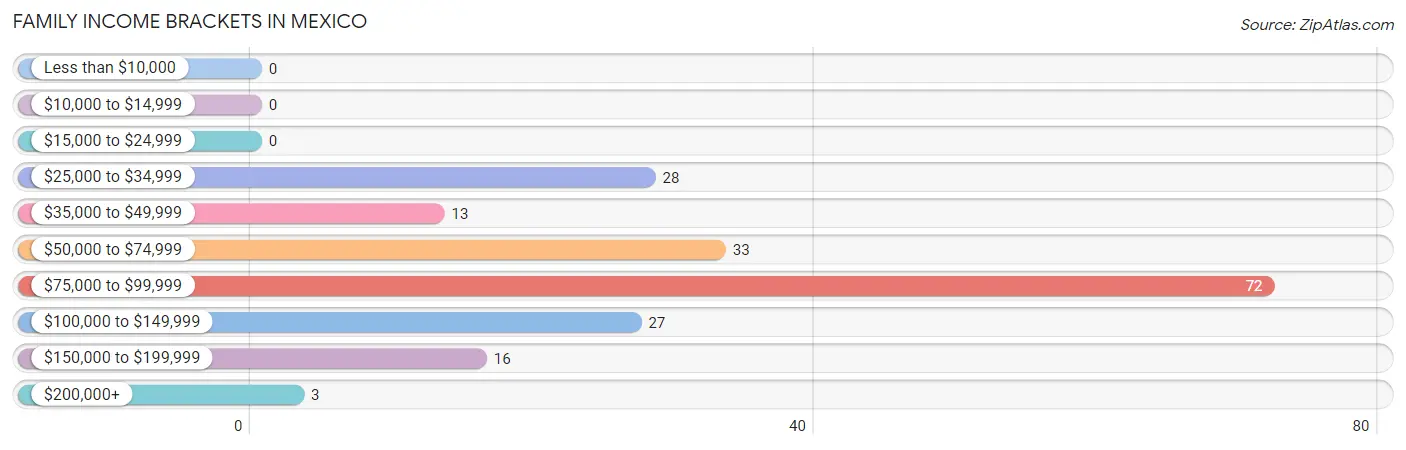
| Income Bracket | # Families | % Families |
| Less than $10,000 | 0 | 0.0% |
| $10,000 to $14,999 | 0 | 0.0% |
| $15,000 to $24,999 | 0 | 0.0% |
| $25,000 to $34,999 | 28 | 14.6% |
| $35,000 to $49,999 | 13 | 6.8% |
| $50,000 to $74,999 | 33 | 17.2% |
| $75,000 to $99,999 | 72 | 37.5% |
| $100,000 to $149,999 | 27 | 14.1% |
| $150,000 to $199,999 | 16 | 8.3% |
| $200,000+ | 3 | 1.6% |
Family Income by Famaliy Size in Mexico
3-person families (24 | 12.5%) account for the highest median family income in Mexico with $122,857 per family, while 3-person families (24 | 12.5%) have the highest median income of $40,952 per family member.
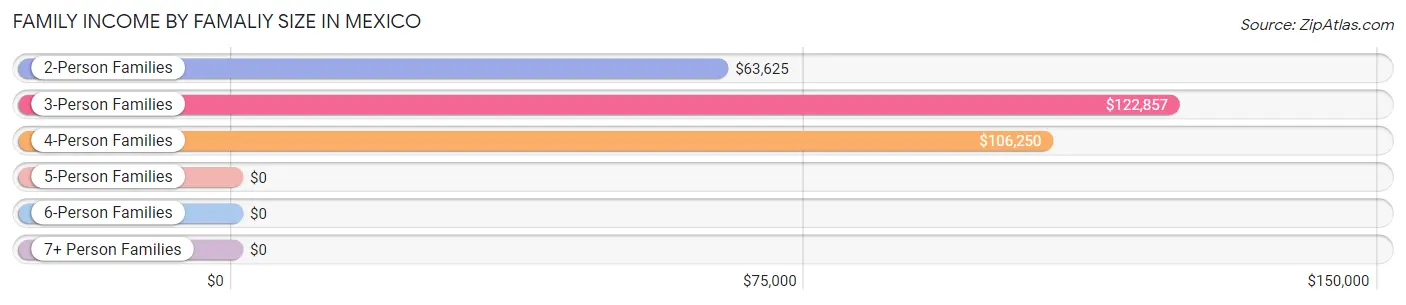
| Income Bracket | # Families | Median Income |
| 2-Person Families | 125 (65.1%) | $63,625 |
| 3-Person Families | 24 (12.5%) | $122,857 |
| 4-Person Families | 40 (20.8%) | $106,250 |
| 5-Person Families | 0 (0.0%) | $0 |
| 6-Person Families | 3 (1.6%) | $0 |
| 7+ Person Families | 0 (0.0%) | $0 |
| Total | 192 (100.0%) | $82,250 |
Family Income by Number of Earners in Mexico
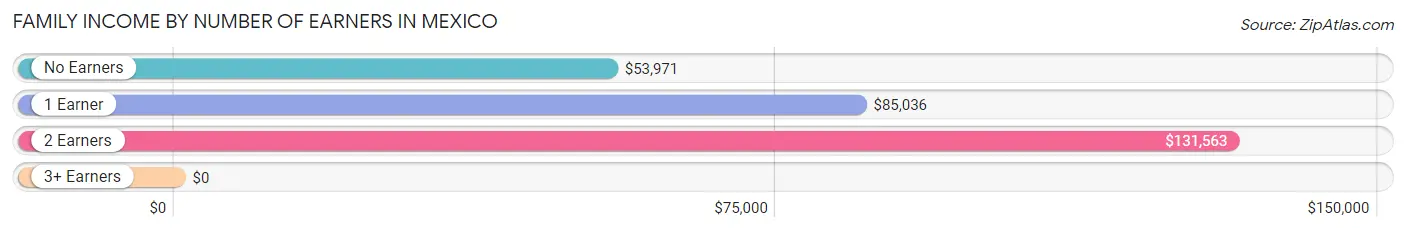
| Number of Earners | # Families | Median Income |
| No Earners | 60 (31.2%) | $53,971 |
| 1 Earner | 69 (35.9%) | $85,036 |
| 2 Earners | 59 (30.7%) | $131,563 |
| 3+ Earners | 4 (2.1%) | $0 |
| Total | 192 (100.0%) | $82,250 |
Household Income in Mexico
Household Income Brackets in Mexico
With 178 households falling in the category, the $75,000 to $99,999 income range is the most frequent in Mexico, accounting for 39.9% of all households.
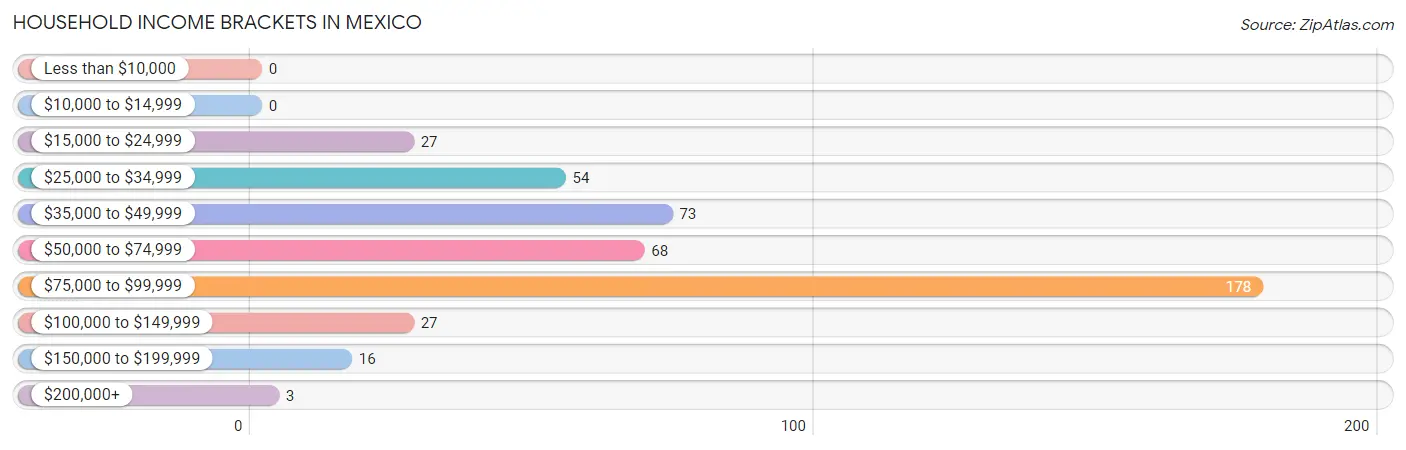
| Income Bracket | # Households | % Households |
| Less than $10,000 | 0 | 0.0% |
| $10,000 to $14,999 | 0 | 0.0% |
| $15,000 to $24,999 | 27 | 6.1% |
| $25,000 to $34,999 | 54 | 12.1% |
| $35,000 to $49,999 | 73 | 16.4% |
| $50,000 to $74,999 | 68 | 15.2% |
| $75,000 to $99,999 | 178 | 39.9% |
| $100,000 to $149,999 | 27 | 6.1% |
| $150,000 to $199,999 | 16 | 3.6% |
| $200,000+ | 3 | 0.7% |
Household Income by Householder Age in Mexico
The median household income in Mexico is $78,125, with the highest median household income of $83,528 found in the 45 to 64 years age bracket for the primary householder. A total of 206 households (46.2%) fall into this category.
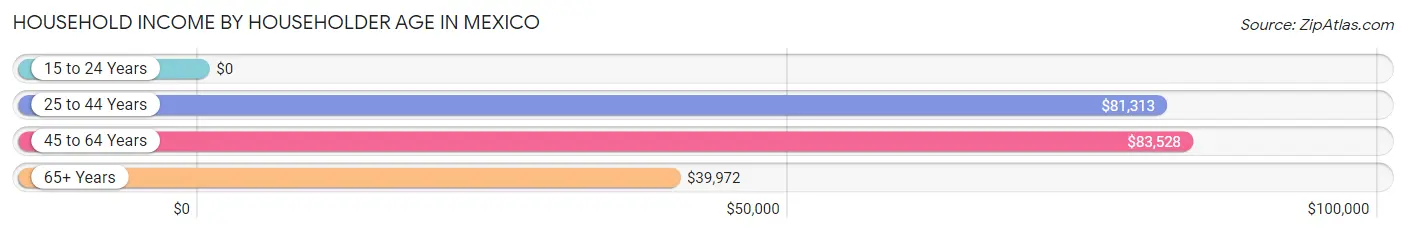
| Income Bracket | # Households | Median Income |
| 15 to 24 Years | 0 (0.0%) | $0 |
| 25 to 44 Years | 81 (18.2%) | $81,313 |
| 45 to 64 Years | 206 (46.2%) | $83,528 |
| 65+ Years | 159 (35.6%) | $39,972 |
| Total | 446 (100.0%) | $78,125 |
Poverty in Mexico
Income Below Poverty by Sex and Age in Mexico
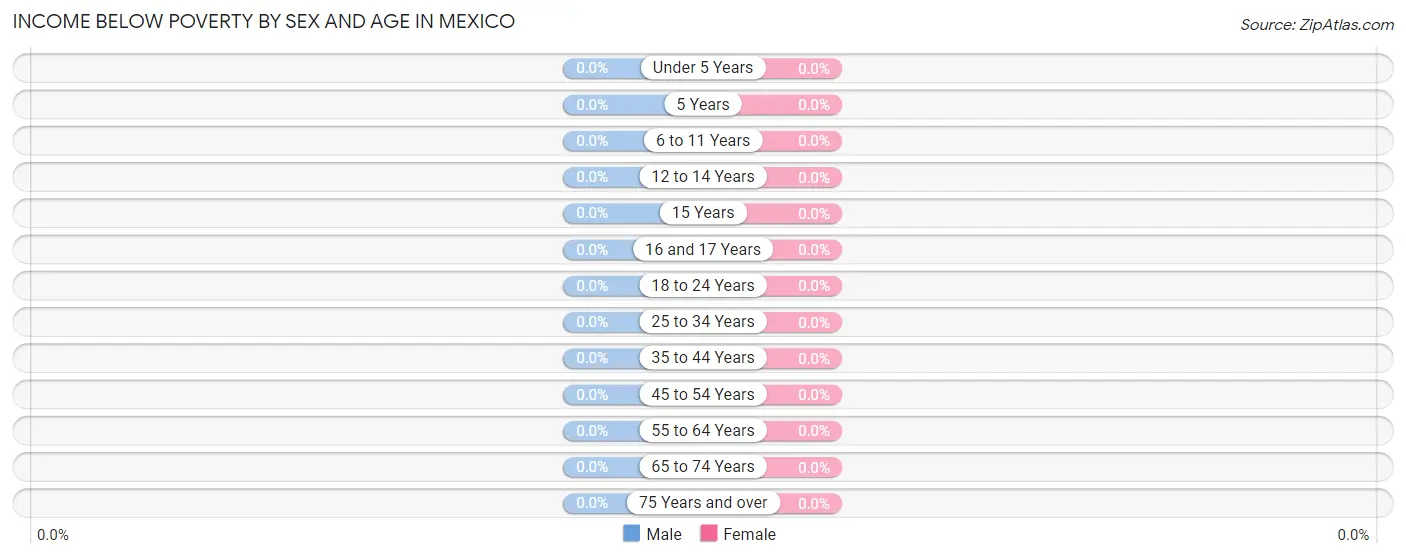
| Age Bracket | Male | Female |
| Under 5 Years | 0 (0.0%) | 0 (0.0%) |
| 5 Years | 0 (0.0%) | 0 (0.0%) |
| 6 to 11 Years | 0 (0.0%) | 0 (0.0%) |
| 12 to 14 Years | 0 (0.0%) | 0 (0.0%) |
| 15 Years | 0 (0.0%) | 0 (0.0%) |
| 16 and 17 Years | 0 (0.0%) | 0 (0.0%) |
| 18 to 24 Years | 0 (0.0%) | 0 (0.0%) |
| 25 to 34 Years | 0 (0.0%) | 0 (0.0%) |
| 35 to 44 Years | 0 (0.0%) | 0 (0.0%) |
| 45 to 54 Years | 0 (0.0%) | 0 (0.0%) |
| 55 to 64 Years | 0 (0.0%) | 0 (0.0%) |
| 65 to 74 Years | 0 (0.0%) | 0 (0.0%) |
| 75 Years and over | 0 (0.0%) | 0 (0.0%) |
| Total | 0 (0.0%) | 0 (0.0%) |
Income Above Poverty by Sex and Age in Mexico
According to the poverty statistics in Mexico, males aged under 5 years and females aged under 5 years are the age groups that are most secure financially, with 100.0% of males and 100.0% of females in these age groups living above the poverty line.
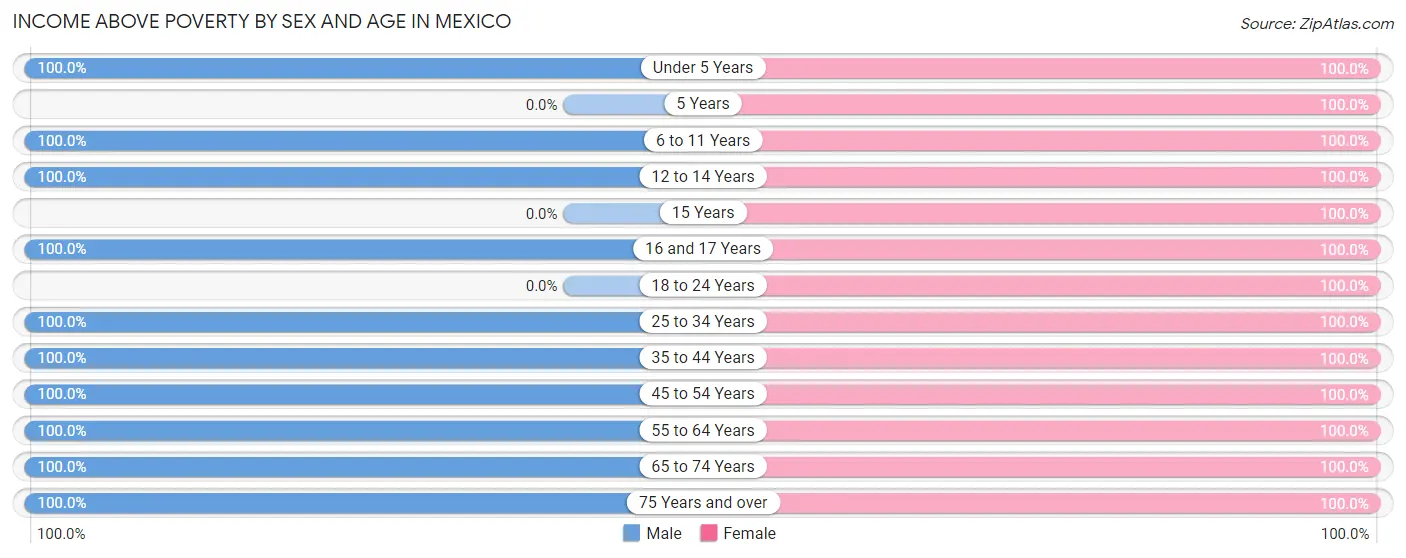
| Age Bracket | Male | Female |
| Under 5 Years | 4 (100.0%) | 26 (100.0%) |
| 5 Years | 0 (0.0%) | 16 (100.0%) |
| 6 to 11 Years | 33 (100.0%) | 9 (100.0%) |
| 12 to 14 Years | 5 (100.0%) | 8 (100.0%) |
| 15 Years | 0 (0.0%) | 4 (100.0%) |
| 16 and 17 Years | 5 (100.0%) | 4 (100.0%) |
| 18 to 24 Years | 0 (0.0%) | 6 (100.0%) |
| 25 to 34 Years | 69 (100.0%) | 33 (100.0%) |
| 35 to 44 Years | 158 (100.0%) | 16 (100.0%) |
| 45 to 54 Years | 6 (100.0%) | 6 (100.0%) |
| 55 to 64 Years | 114 (100.0%) | 145 (100.0%) |
| 65 to 74 Years | 47 (100.0%) | 34 (100.0%) |
| 75 Years and over | 26 (100.0%) | 108 (100.0%) |
| Total | 467 (100.0%) | 415 (100.0%) |
Income Below Poverty Among Married-Couple Families in Mexico
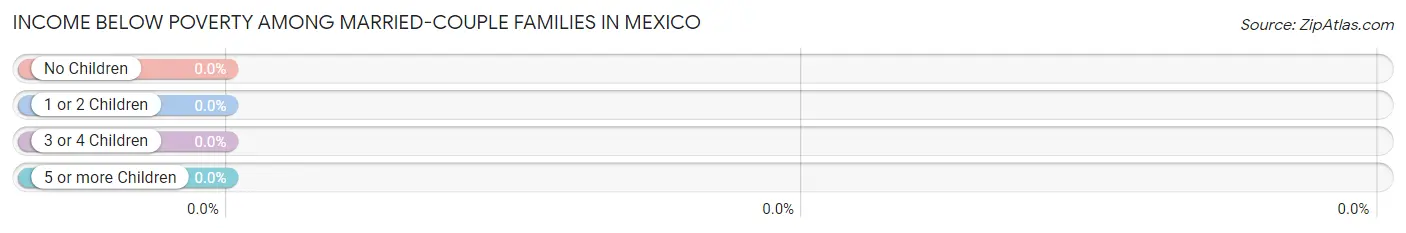
| Children | Above Poverty | Below Poverty |
| No Children | 112 (100.0%) | 0 (0.0%) |
| 1 or 2 Children | 60 (100.0%) | 0 (0.0%) |
| 3 or 4 Children | 3 (100.0%) | 0 (0.0%) |
| 5 or more Children | 0 (0.0%) | 0 (0.0%) |
| Total | 175 (100.0%) | 0 (0.0%) |
Income Below Poverty Among Single-Parent Households in Mexico
| Children | Single Father | Single Mother |
| No Children | 0 (0.0%) | 0 (0.0%) |
| 1 or 2 Children | 0 (0.0%) | 0 (0.0%) |
| 3 or 4 Children | 0 (0.0%) | 0 (0.0%) |
| 5 or more Children | 0 (0.0%) | 0 (0.0%) |
| Total | 0 (0.0%) | 0 (0.0%) |
Income Below Poverty Among Married-Couple vs Single-Parent Households in Mexico
| Children | Married-Couple Families | Single-Parent Households |
| No Children | 0 (0.0%) | 0 (0.0%) |
| 1 or 2 Children | 0 (0.0%) | 0 (0.0%) |
| 3 or 4 Children | 0 (0.0%) | 0 (0.0%) |
| 5 or more Children | 0 (0.0%) | 0 (0.0%) |
| Total | 0 (0.0%) | 0 (0.0%) |
Race in Mexico
The most populous races in Mexico are White / Caucasian (1,071 | 95.0%), Black / African American (36 | 3.2%), and Two or more Races (9 | 0.8%).
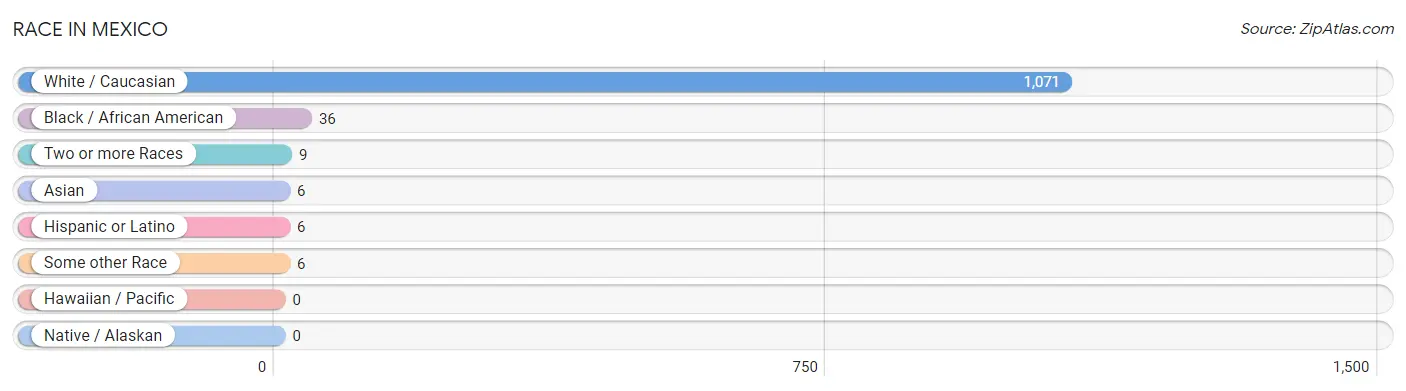
| Race | # Population | % Population |
| Asian | 6 | 0.5% |
| Black / African American | 36 | 3.2% |
| Hawaiian / Pacific | 0 | 0.0% |
| Hispanic or Latino | 6 | 0.5% |
| Native / Alaskan | 0 | 0.0% |
| White / Caucasian | 1,071 | 95.0% |
| Two or more Races | 9 | 0.8% |
| Some other Race | 6 | 0.5% |
| Total | 1,128 | 100.0% |
Ancestry in Mexico
The most populous ancestries reported in Mexico are German (303 | 26.9%), English (168 | 14.9%), American (68 | 6.0%), Irish (67 | 5.9%), and Dutch (30 | 2.7%), together accounting for 56.4% of all Mexico residents.
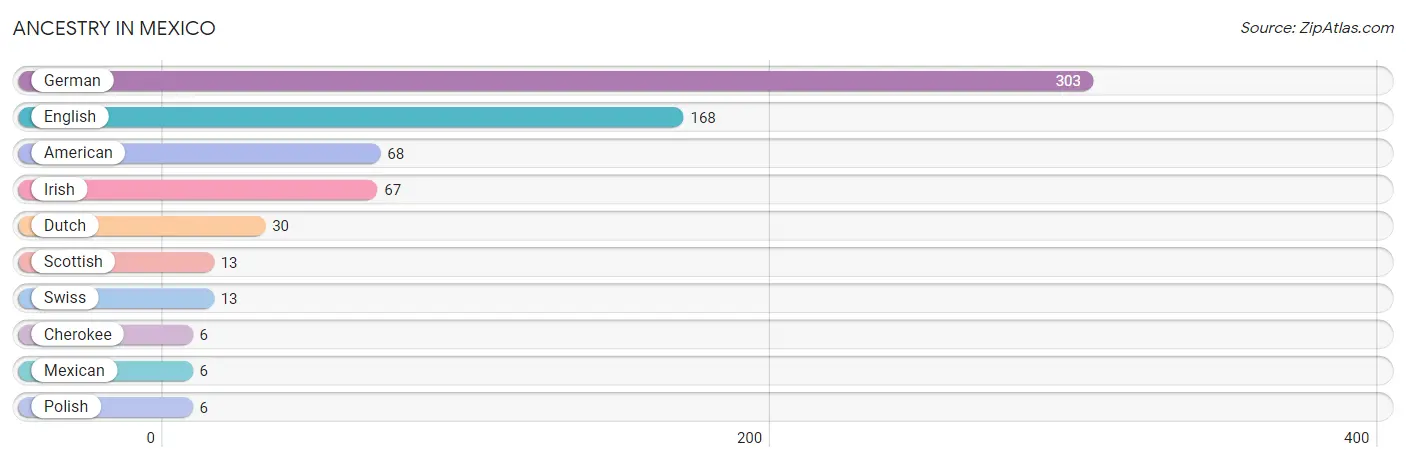
| Ancestry | # Population | % Population |
| American | 68 | 6.0% |
| Cherokee | 6 | 0.5% |
| Dutch | 30 | 2.7% |
| English | 168 | 14.9% |
| German | 303 | 26.9% |
| Irish | 67 | 5.9% |
| Mexican | 6 | 0.5% |
| Polish | 6 | 0.5% |
| Scottish | 13 | 1.1% |
| Swiss | 13 | 1.1% | View All 10 Rows |
Immigrants in Mexico
The most numerous immigrant groups reported in Mexico came from Asia (6 | 0.5%), Central America (6 | 0.5%), Guatemala (6 | 0.5%), Latin America (6 | 0.5%), and South Eastern Asia (6 | 0.5%), together accounting for 2.6% of all Mexico residents.
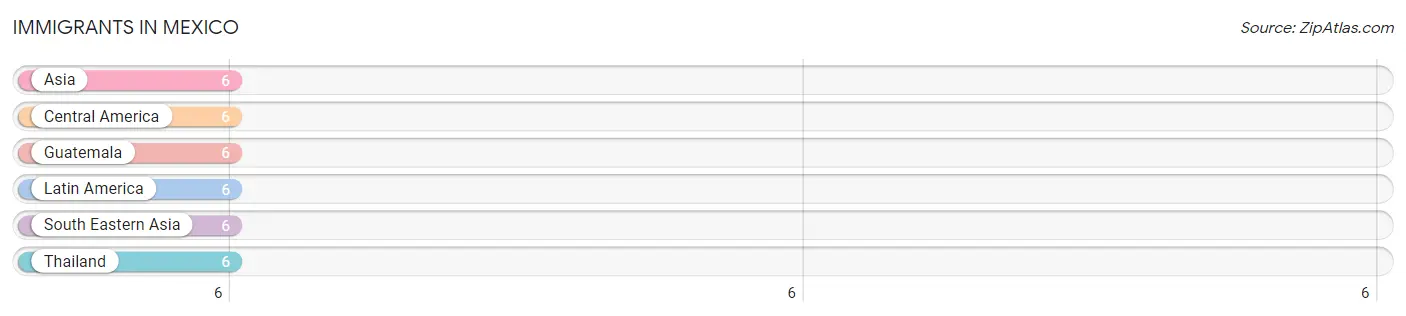
| Immigration Origin | # Population | % Population |
| Asia | 6 | 0.5% |
| Central America | 6 | 0.5% |
| Guatemala | 6 | 0.5% |
| Latin America | 6 | 0.5% |
| South Eastern Asia | 6 | 0.5% |
| Thailand | 6 | 0.5% | View All 6 Rows |
Sex and Age in Mexico
Sex and Age in Mexico
The most populous age groups in Mexico are 40 to 44 Years (171 | 25.2%) for men and 55 to 59 Years (145 | 32.2%) for women.
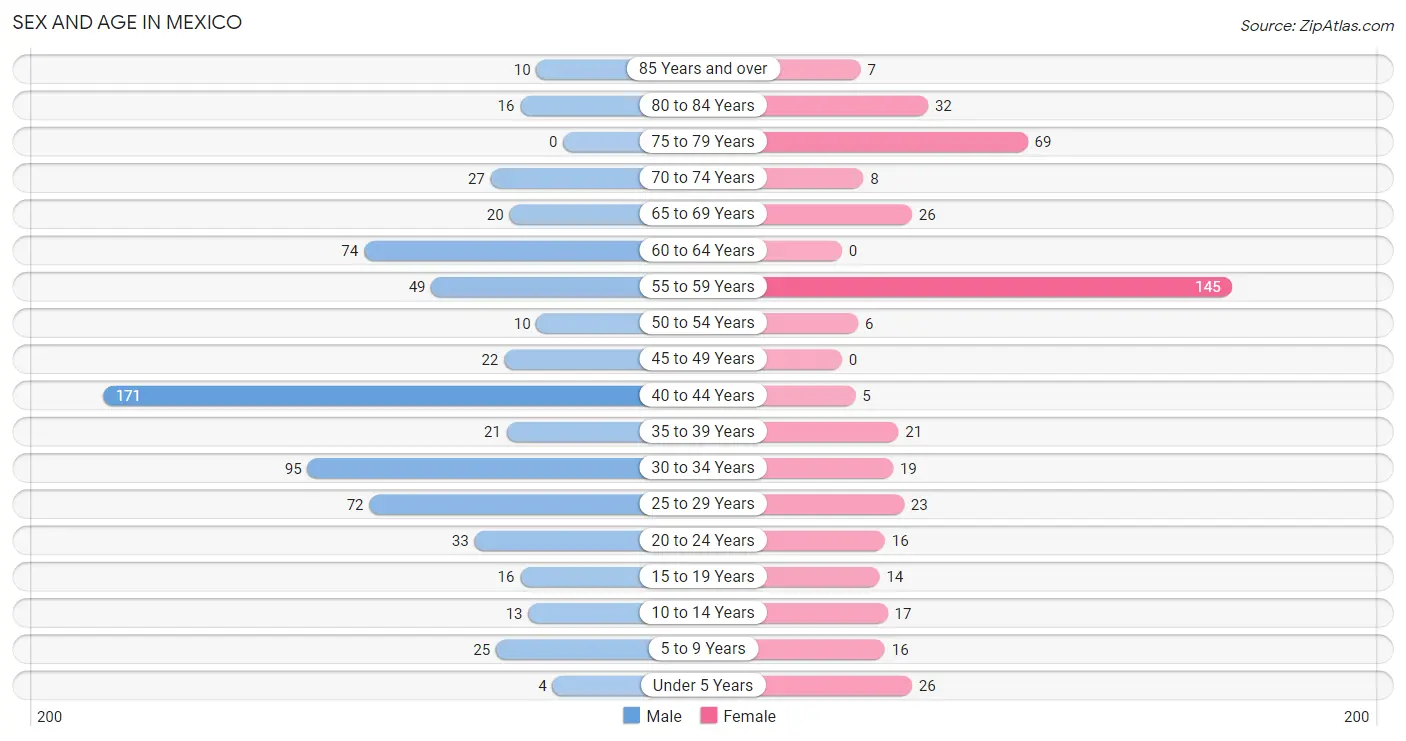
| Age Bracket | Male | Female |
| Under 5 Years | 4 (0.6%) | 26 (5.8%) |
| 5 to 9 Years | 25 (3.7%) | 16 (3.6%) |
| 10 to 14 Years | 13 (1.9%) | 17 (3.8%) |
| 15 to 19 Years | 16 (2.4%) | 14 (3.1%) |
| 20 to 24 Years | 33 (4.9%) | 16 (3.6%) |
| 25 to 29 Years | 72 (10.6%) | 23 (5.1%) |
| 30 to 34 Years | 95 (14.0%) | 19 (4.2%) |
| 35 to 39 Years | 21 (3.1%) | 21 (4.7%) |
| 40 to 44 Years | 171 (25.2%) | 5 (1.1%) |
| 45 to 49 Years | 22 (3.2%) | 0 (0.0%) |
| 50 to 54 Years | 10 (1.5%) | 6 (1.3%) |
| 55 to 59 Years | 49 (7.2%) | 145 (32.2%) |
| 60 to 64 Years | 74 (10.9%) | 0 (0.0%) |
| 65 to 69 Years | 20 (2.9%) | 26 (5.8%) |
| 70 to 74 Years | 27 (4.0%) | 8 (1.8%) |
| 75 to 79 Years | 0 (0.0%) | 69 (15.3%) |
| 80 to 84 Years | 16 (2.4%) | 32 (7.1%) |
| 85 Years and over | 10 (1.5%) | 7 (1.6%) |
| Total | 678 (100.0%) | 450 (100.0%) |
Families and Households in Mexico
Median Family Size in Mexico
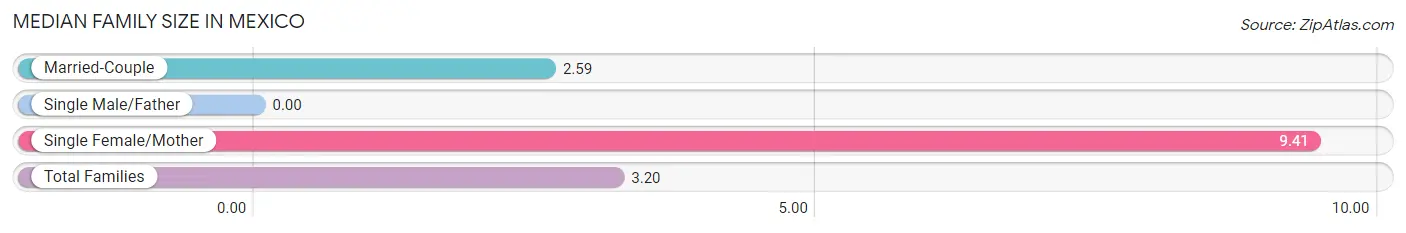
| Family Type | # Families | Family Size |
| Married-Couple | 175 (91.1%) | 2.59 |
| Single Male/Father | 0 (0.0%) | - |
| Single Female/Mother | 17 (8.8%) | 9.41 |
| Total Families | 192 (100.0%) | 3.20 |
Median Household Size in Mexico
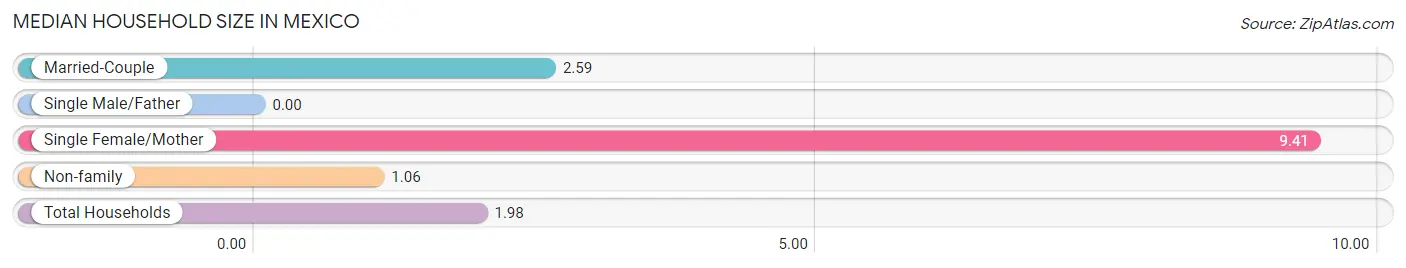
| Household Type | # Households | Household Size |
| Married-Couple | 175 (39.2%) | 2.59 |
| Single Male/Father | 0 (0.0%) | - |
| Single Female/Mother | 17 (3.8%) | 9.41 |
| Non-family | 254 (57.0%) | 1.06 |
| Total Households | 446 (100.0%) | 1.98 |
Household Size by Marriage Status in Mexico
Out of a total of 446 households in Mexico, 192 (43.0%) are family households, while 254 (57.0%) are nonfamily households. The most numerous type of family households are 2-person households, comprising 125, and the most common type of nonfamily households are 1-person households, comprising 238.
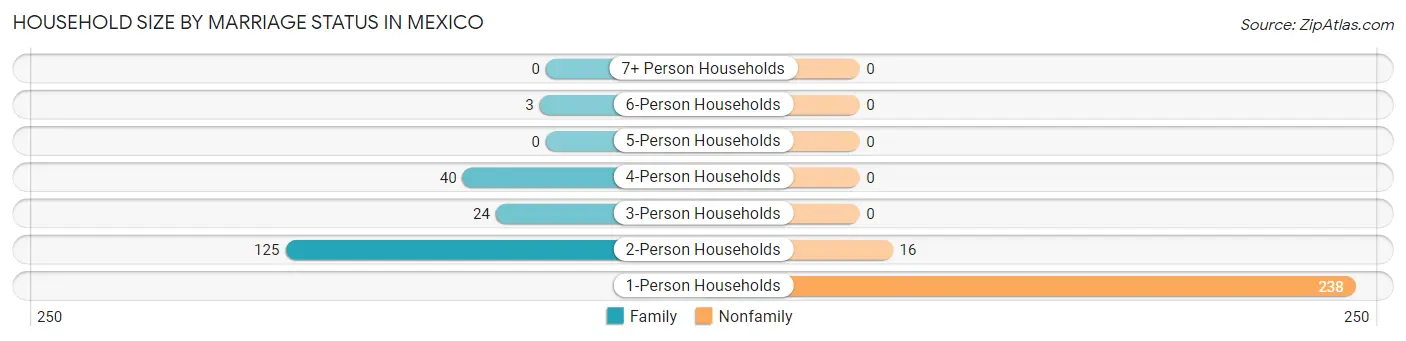
| Household Size | Family Households | Nonfamily Households |
| 1-Person Households | - | 238 (53.4%) |
| 2-Person Households | 125 (28.0%) | 16 (3.6%) |
| 3-Person Households | 24 (5.4%) | 0 (0.0%) |
| 4-Person Households | 40 (9.0%) | 0 (0.0%) |
| 5-Person Households | 0 (0.0%) | 0 (0.0%) |
| 6-Person Households | 3 (0.7%) | 0 (0.0%) |
| 7+ Person Households | 0 (0.0%) | 0 (0.0%) |
| Total | 192 (43.0%) | 254 (57.0%) |
Female Fertility in Mexico
Fertility by Age in Mexico
Average fertility rate in Mexico is 41.0 births per 1,000 women. Women in the age bracket of 20 to 34 years have the highest fertility rate with 69.0 births per 1,000 women. Women in the age bracket of 20 to 34 years acount for 100.0% of all women with births.
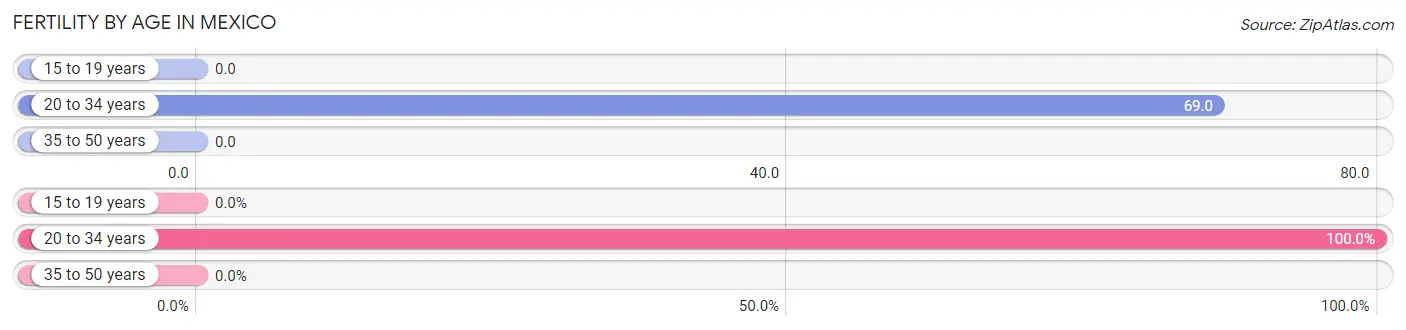
| Age Bracket | Women with Births | Births / 1,000 Women |
| 15 to 19 years | 0 (0.0%) | 0.0 |
| 20 to 34 years | 4 (100.0%) | 69.0 |
| 35 to 50 years | 0 (0.0%) | 0.0 |
| Total | 4 (100.0%) | 41.0 |
Fertility by Age by Marriage Status in Mexico
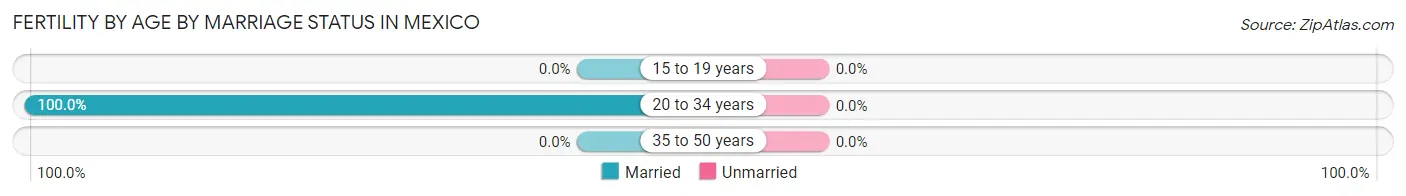
| Age Bracket | Married | Unmarried |
| 15 to 19 years | 0 (0.0%) | 0 (0.0%) |
| 20 to 34 years | 4 (100.0%) | 0 (0.0%) |
| 35 to 50 years | 0 (0.0%) | 0 (0.0%) |
| Total | 4 (100.0%) | 0 (0.0%) |
Fertility by Education in Mexico
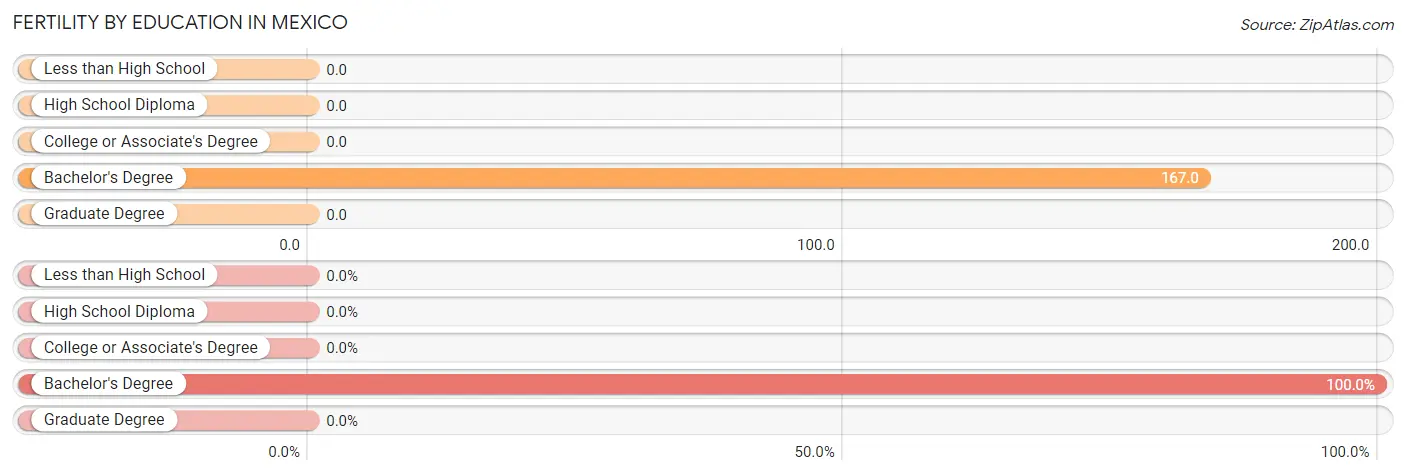
| Educational Attainment | Women with Births | Births / 1,000 Women |
| Less than High School | 0 (0.0%) | 0.0 |
| High School Diploma | 0 (0.0%) | 0.0 |
| College or Associate's Degree | 0 (0.0%) | 0.0 |
| Bachelor's Degree | 4 (100.0%) | 167.0 |
| Graduate Degree | 0 (0.0%) | 0.0 |
| Total | 4 (100.0%) | 41.0 |
Fertility by Education by Marriage Status in Mexico
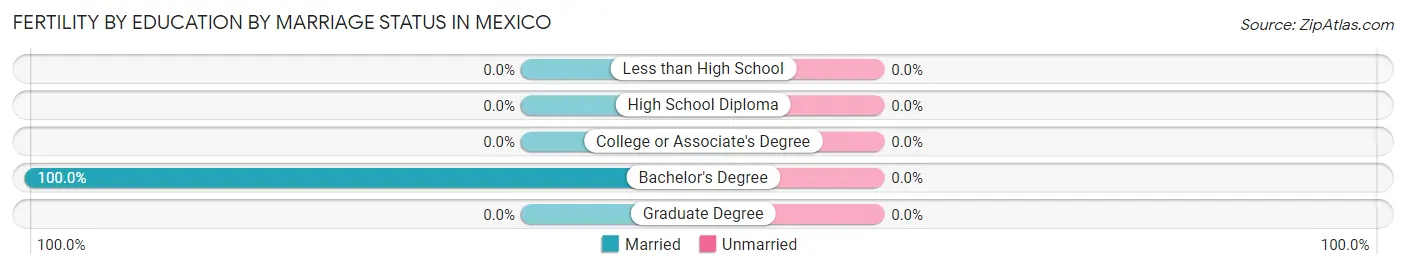
| Educational Attainment | Married | Unmarried |
| Less than High School | 0 (0.0%) | 0 (0.0%) |
| High School Diploma | 0 (0.0%) | 0 (0.0%) |
| College or Associate's Degree | 0 (0.0%) | 0 (0.0%) |
| Bachelor's Degree | 4 (100.0%) | 0 (0.0%) |
| Graduate Degree | 0 (0.0%) | 0 (0.0%) |
| Total | 4 (100.0%) | 0 (0.0%) |
Employment Characteristics in Mexico
Employment by Class of Employer in Mexico
Among the 386 employed individuals in Mexico, private company employees (230 | 59.6%), federal government employees (90 | 23.3%), and not-for-profit organizations (40 | 10.4%) make up the most common classes of employment.
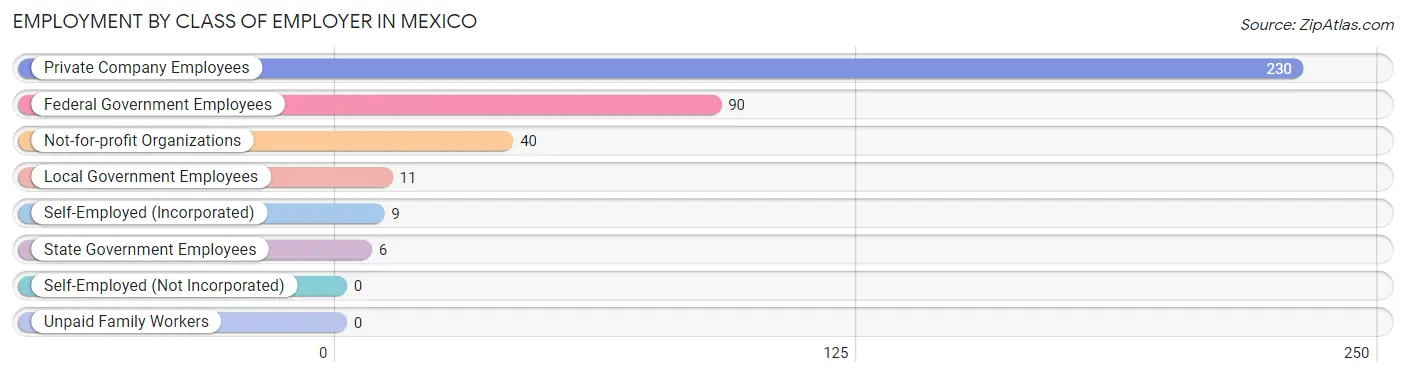
| Employer Class | # Employees | % Employees |
| Private Company Employees | 230 | 59.6% |
| Self-Employed (Incorporated) | 9 | 2.3% |
| Self-Employed (Not Incorporated) | 0 | 0.0% |
| Not-for-profit Organizations | 40 | 10.4% |
| Local Government Employees | 11 | 2.9% |
| State Government Employees | 6 | 1.5% |
| Federal Government Employees | 90 | 23.3% |
| Unpaid Family Workers | 0 | 0.0% |
| Total | 386 | 100.0% |
Employment Status by Age in Mexico
According to the labor force statistics for Mexico, out of the total population over 16 years of age (1,023), 38.1% or 390 individuals are in the labor force, with 1.0% or 4 of them unemployed. The age group with the highest labor force participation rate is 55 to 59 years, with 75.8% or 147 individuals in the labor force. Within the labor force, the 30 to 34 years age range has the highest percentage of unemployed individuals, with 5.0% or 4 of them being unemployed.
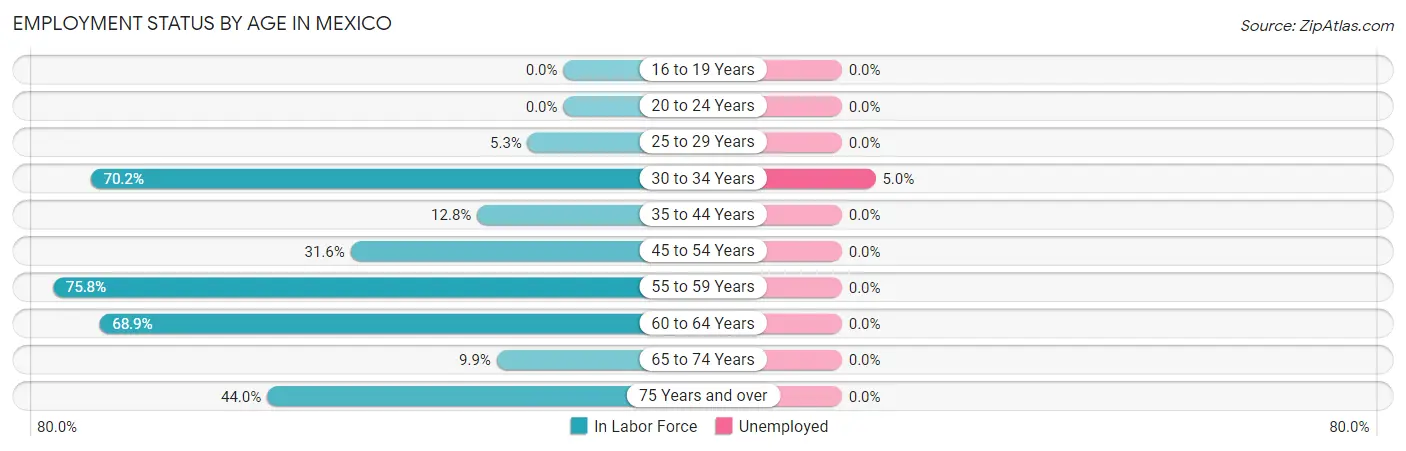
| Age Bracket | In Labor Force | Unemployed |
| 16 to 19 Years | 0 (0.0%) | 0 (0.0%) |
| 20 to 24 Years | 0 (0.0%) | 0 (0.0%) |
| 25 to 29 Years | 5 (5.3%) | 0 (0.0%) |
| 30 to 34 Years | 80 (70.2%) | 4 (5.0%) |
| 35 to 44 Years | 28 (12.8%) | 0 (0.0%) |
| 45 to 54 Years | 12 (31.6%) | 0 (0.0%) |
| 55 to 59 Years | 147 (75.8%) | 0 (0.0%) |
| 60 to 64 Years | 51 (68.9%) | 0 (0.0%) |
| 65 to 74 Years | 8 (9.9%) | 0 (0.0%) |
| 75 Years and over | 59 (44.0%) | 0 (0.0%) |
| Total | 390 (38.1%) | 4 (1.0%) |
Employment Status by Educational Attainment in Mexico
According to labor force statistics for Mexico, 44.1% of individuals (323) out of the total population between 25 and 64 years of age (733) are in the labor force, with 1.2% or 4 of them being unemployed. The group with the highest labor force participation rate are those with the educational attainment of bachelor's degree or higher, with 95.6% or 130 individuals in the labor force. Within the labor force, individuals with less than high school education have the highest percentage of unemployment, with 14.3% or 4 of them being unemployed.
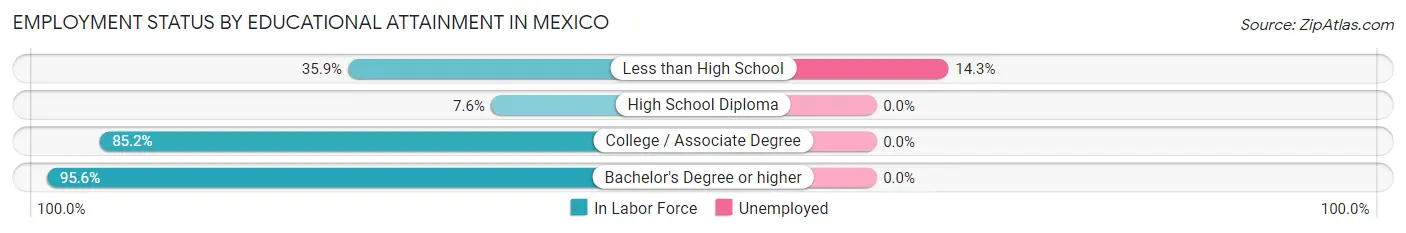
| Educational Attainment | In Labor Force | Unemployed |
| Less than High School | 28 (35.9%) | 11 (14.3%) |
| High School Diploma | 27 (7.6%) | 0 (0.0%) |
| College / Associate Degree | 138 (85.2%) | 0 (0.0%) |
| Bachelor's Degree or higher | 130 (95.6%) | 0 (0.0%) |
| Total | 323 (44.1%) | 9 (1.2%) |
Employment Occupations by Sex in Mexico
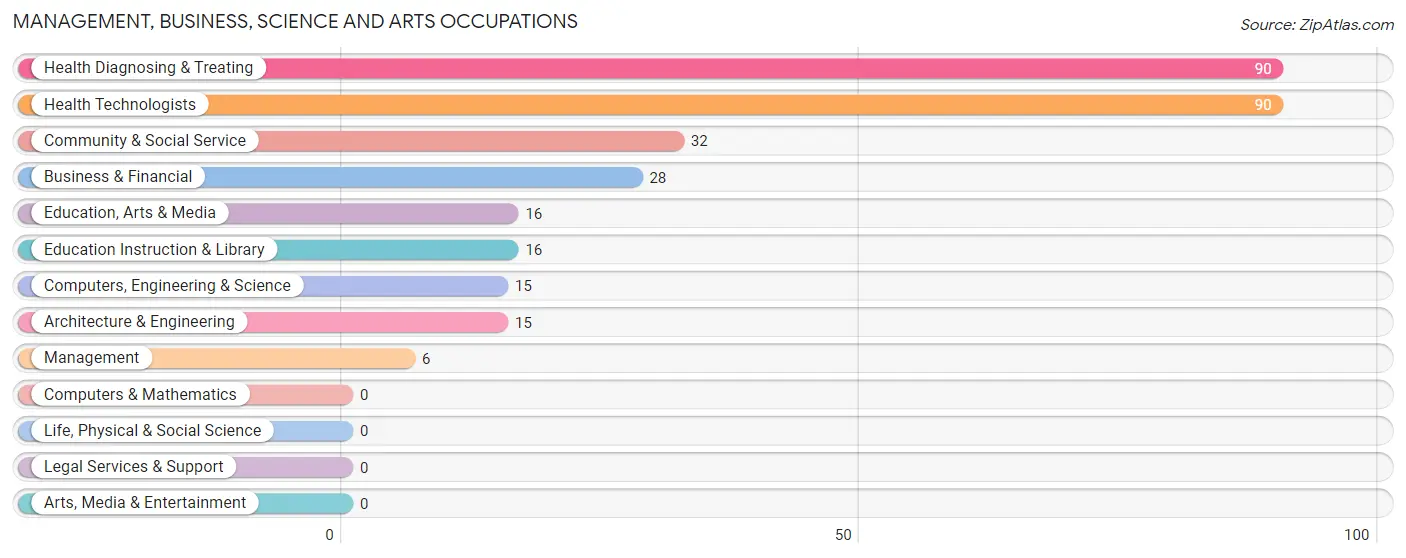
Management, Business, Science and Arts Occupations
The most common Management, Business, Science and Arts occupations in Mexico are Health Diagnosing & Treating (90 | 23.3%), Health Technologists (90 | 23.3%), Community & Social Service (32 | 8.3%), Business & Financial (28 | 7.2%), and Education, Arts & Media (16 | 4.2%).
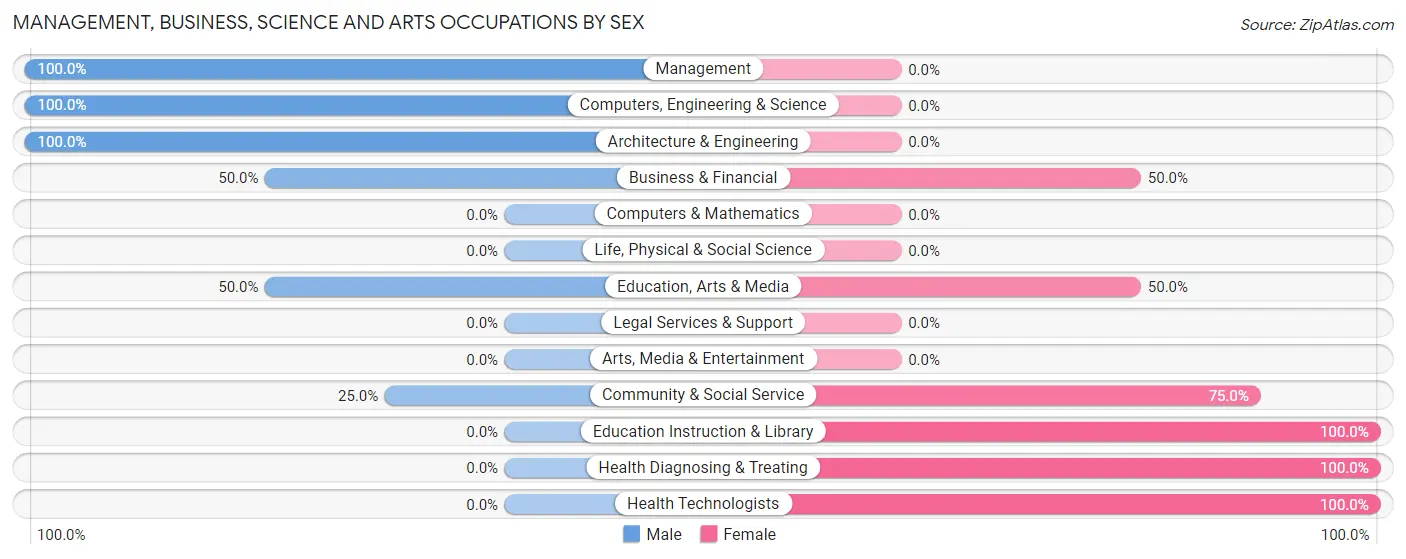
Management, Business, Science and Arts Occupations by Sex
Within the Management, Business, Science and Arts occupations in Mexico, the most male-oriented occupations are Management (100.0%), Computers, Engineering & Science (100.0%), and Architecture & Engineering (100.0%), while the most female-oriented occupations are Education Instruction & Library (100.0%), Health Diagnosing & Treating (100.0%), and Health Technologists (100.0%).
| Occupation | Male | Female |
| Management | 6 (100.0%) | 0 (0.0%) |
| Business & Financial | 14 (50.0%) | 14 (50.0%) |
| Computers, Engineering & Science | 15 (100.0%) | 0 (0.0%) |
| Computers & Mathematics | 0 (0.0%) | 0 (0.0%) |
| Architecture & Engineering | 15 (100.0%) | 0 (0.0%) |
| Life, Physical & Social Science | 0 (0.0%) | 0 (0.0%) |
| Community & Social Service | 8 (25.0%) | 24 (75.0%) |
| Education, Arts & Media | 8 (50.0%) | 8 (50.0%) |
| Legal Services & Support | 0 (0.0%) | 0 (0.0%) |
| Education Instruction & Library | 0 (0.0%) | 16 (100.0%) |
| Arts, Media & Entertainment | 0 (0.0%) | 0 (0.0%) |
| Health Diagnosing & Treating | 0 (0.0%) | 90 (100.0%) |
| Health Technologists | 0 (0.0%) | 90 (100.0%) |
| Total (Category) | 43 (25.2%) | 128 (74.9%) |
| Total (Overall) | 182 (47.1%) | 204 (52.8%) |
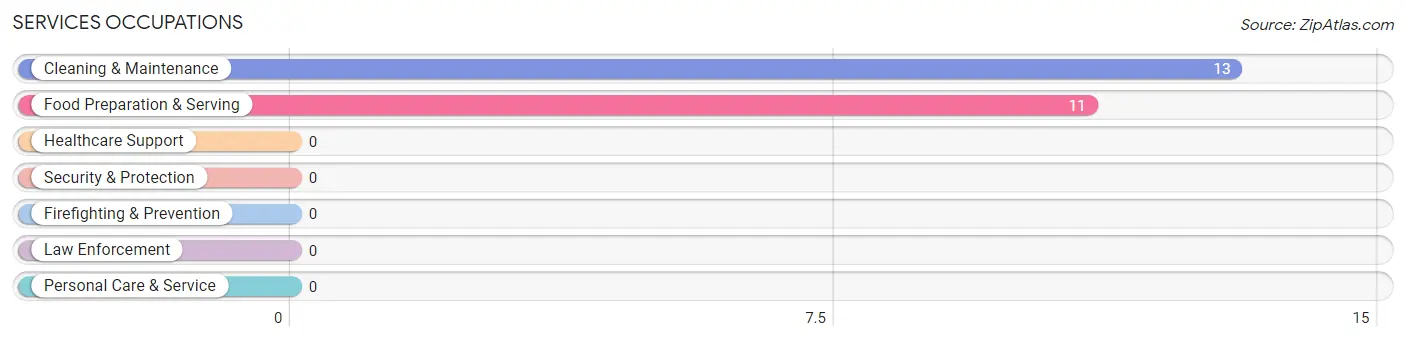
Services Occupations
The most common Services occupations in Mexico are Cleaning & Maintenance (13 | 3.4%), and Food Preparation & Serving (11 | 2.9%).
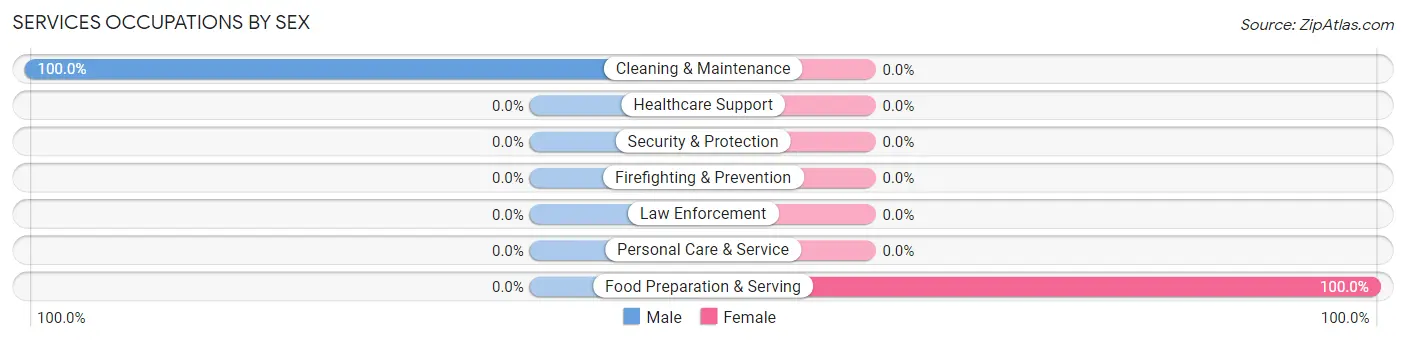
Services Occupations by Sex
| Occupation | Male | Female |
| Healthcare Support | 0 (0.0%) | 0 (0.0%) |
| Security & Protection | 0 (0.0%) | 0 (0.0%) |
| Firefighting & Prevention | 0 (0.0%) | 0 (0.0%) |
| Law Enforcement | 0 (0.0%) | 0 (0.0%) |
| Food Preparation & Serving | 0 (0.0%) | 11 (100.0%) |
| Cleaning & Maintenance | 13 (100.0%) | 0 (0.0%) |
| Personal Care & Service | 0 (0.0%) | 0 (0.0%) |
| Total (Category) | 13 (54.2%) | 11 (45.8%) |
| Total (Overall) | 182 (47.1%) | 204 (52.8%) |
Sales and Office Occupations
The most common Sales and Office occupations in Mexico are Sales & Related (50 | 13.0%), and Office & Administration (14 | 3.6%).

Sales and Office Occupations by Sex

| Occupation | Male | Female |
| Sales & Related | 5 (10.0%) | 45 (90.0%) |
| Office & Administration | 0 (0.0%) | 14 (100.0%) |
| Total (Category) | 5 (7.8%) | 59 (92.2%) |
| Total (Overall) | 182 (47.1%) | 204 (52.8%) |
Natural Resources, Construction and Maintenance Occupations
The most common Natural Resources, Construction and Maintenance occupations in Mexico are , and Installation, Maintenance & Repair (65 | 16.8%).
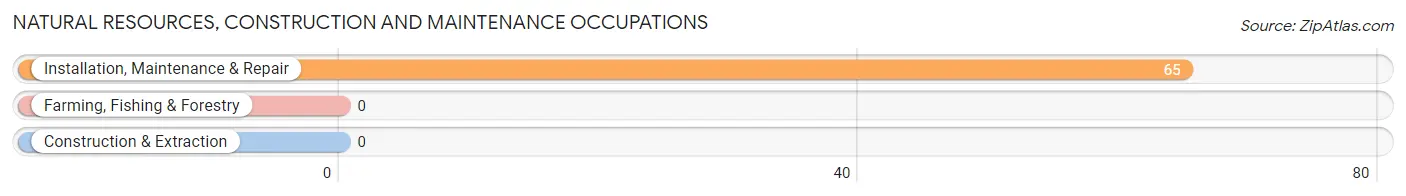
Natural Resources, Construction and Maintenance Occupations by Sex
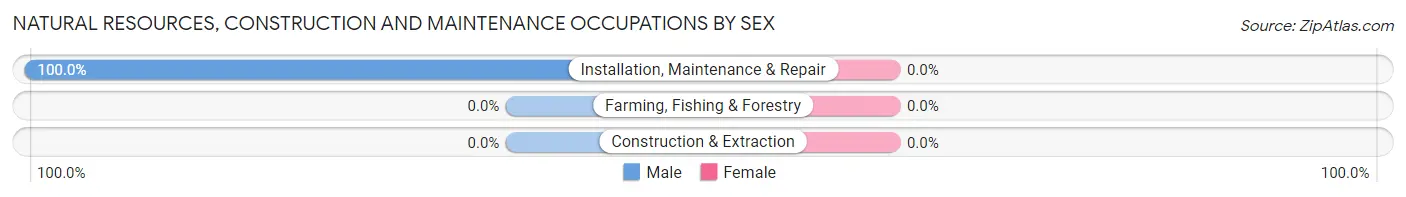
| Occupation | Male | Female |
| Farming, Fishing & Forestry | 0 (0.0%) | 0 (0.0%) |
| Construction & Extraction | 0 (0.0%) | 0 (0.0%) |
| Installation, Maintenance & Repair | 65 (100.0%) | 0 (0.0%) |
| Total (Category) | 65 (100.0%) | 0 (0.0%) |
| Total (Overall) | 182 (47.1%) | 204 (52.8%) |
Production, Transportation and Moving Occupations
The most common Production, Transportation and Moving occupations in Mexico are Production (30 | 7.8%), Material Moving (26 | 6.7%), and Transportation (6 | 1.5%).
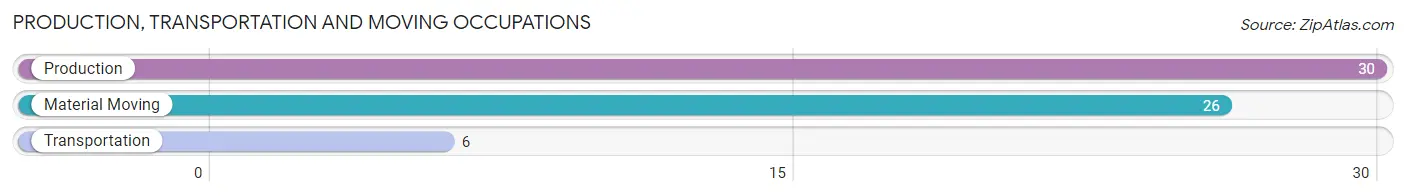
Production, Transportation and Moving Occupations by Sex
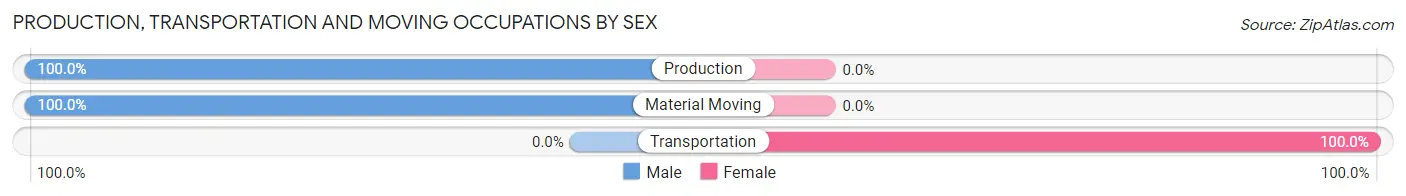
| Occupation | Male | Female |
| Production | 30 (100.0%) | 0 (0.0%) |
| Transportation | 0 (0.0%) | 6 (100.0%) |
| Material Moving | 26 (100.0%) | 0 (0.0%) |
| Total (Category) | 56 (90.3%) | 6 (9.7%) |
| Total (Overall) | 182 (47.1%) | 204 (52.8%) |
Employment Industries by Sex in Mexico
Employment Industries in Mexico
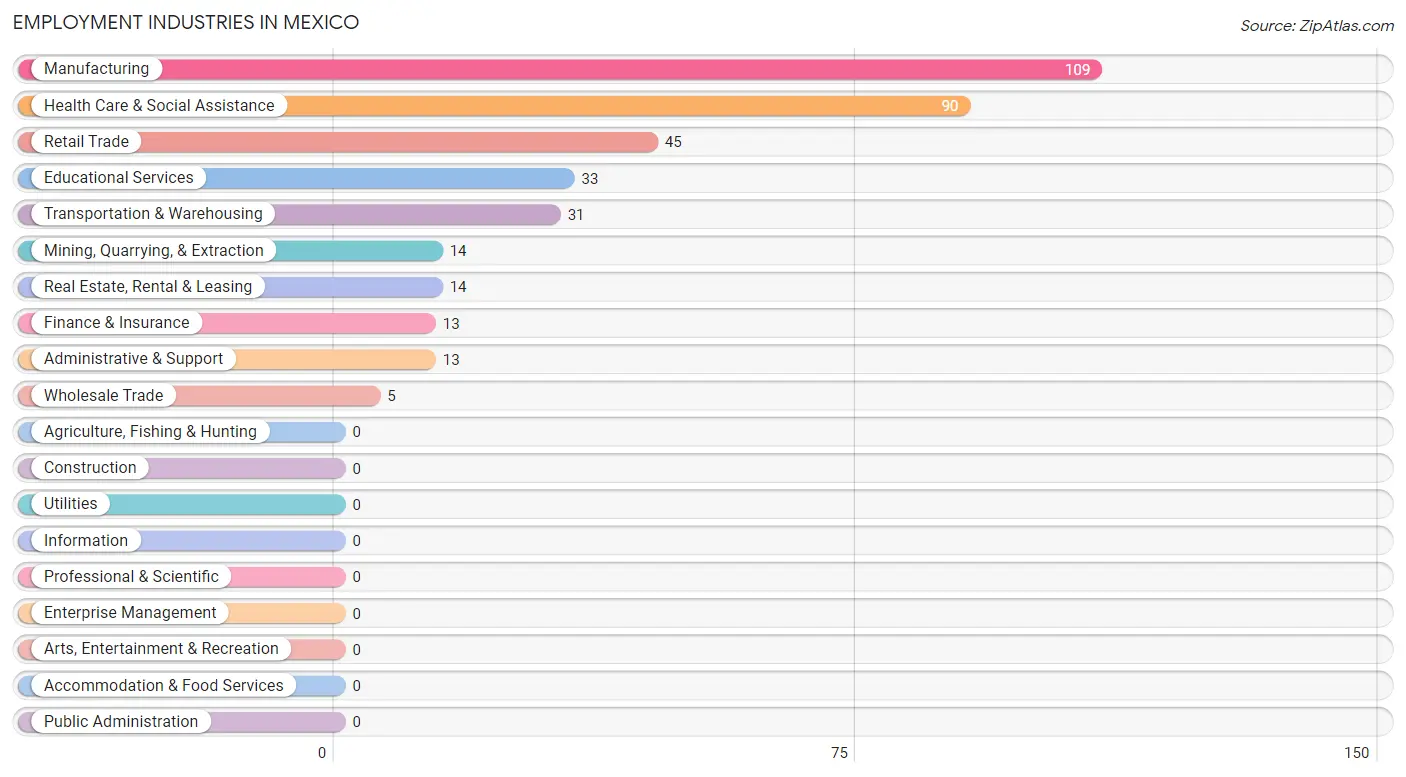
The major employment industries in Mexico include Manufacturing (109 | 28.2%), Health Care & Social Assistance (90 | 23.3%), Retail Trade (45 | 11.7%), Educational Services (33 | 8.6%), and Transportation & Warehousing (31 | 8.0%).
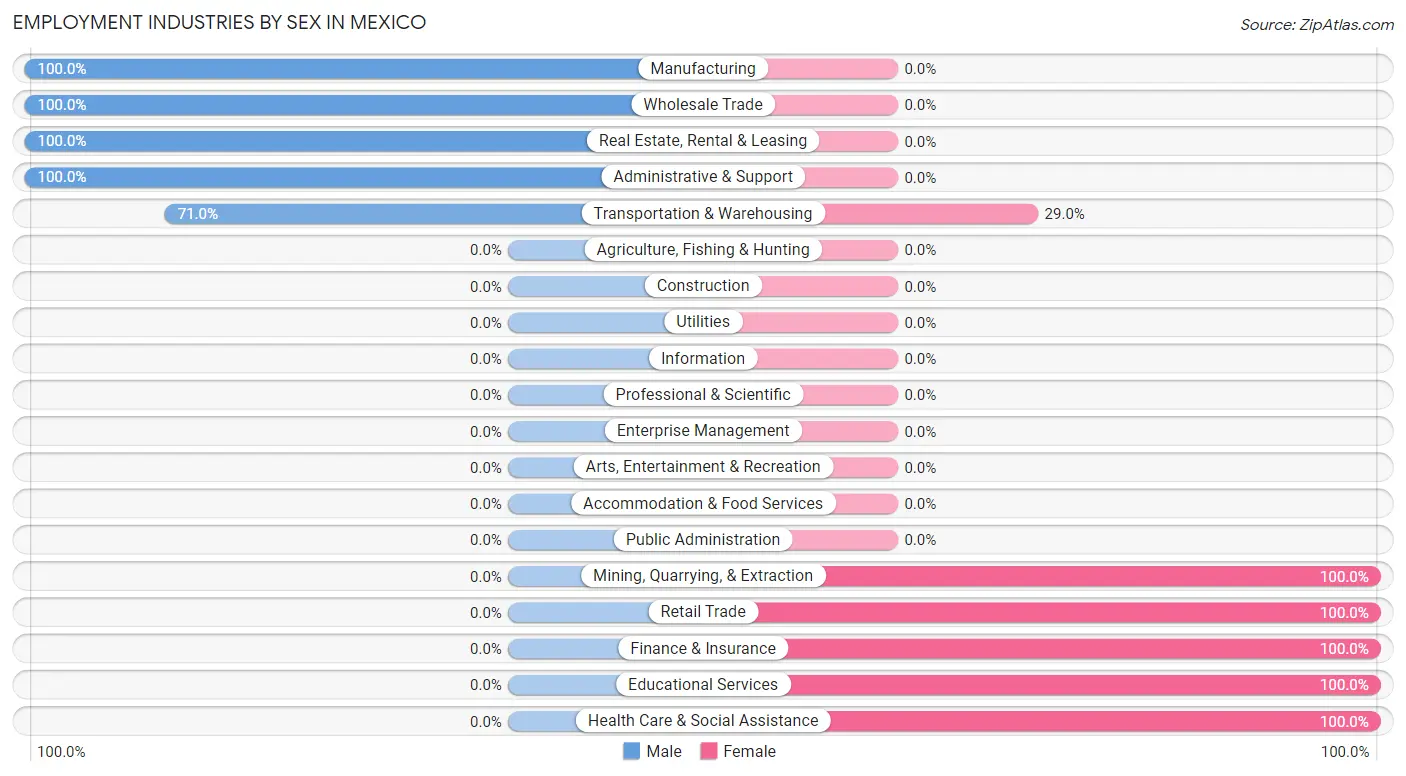
Employment Industries by Sex in Mexico
The Mexico industries that see more men than women are Manufacturing (100.0%), Wholesale Trade (100.0%), and Real Estate, Rental & Leasing (100.0%), whereas the industries that tend to have a higher number of women are Mining, Quarrying, & Extraction (100.0%), Retail Trade (100.0%), and Finance & Insurance (100.0%).
| Industry | Male | Female |
| Agriculture, Fishing & Hunting | 0 (0.0%) | 0 (0.0%) |
| Mining, Quarrying, & Extraction | 0 (0.0%) | 14 (100.0%) |
| Construction | 0 (0.0%) | 0 (0.0%) |
| Manufacturing | 109 (100.0%) | 0 (0.0%) |
| Wholesale Trade | 5 (100.0%) | 0 (0.0%) |
| Retail Trade | 0 (0.0%) | 45 (100.0%) |
| Transportation & Warehousing | 22 (71.0%) | 9 (29.0%) |
| Utilities | 0 (0.0%) | 0 (0.0%) |
| Information | 0 (0.0%) | 0 (0.0%) |
| Finance & Insurance | 0 (0.0%) | 13 (100.0%) |
| Real Estate, Rental & Leasing | 14 (100.0%) | 0 (0.0%) |
| Professional & Scientific | 0 (0.0%) | 0 (0.0%) |
| Enterprise Management | 0 (0.0%) | 0 (0.0%) |
| Administrative & Support | 13 (100.0%) | 0 (0.0%) |
| Educational Services | 0 (0.0%) | 33 (100.0%) |
| Health Care & Social Assistance | 0 (0.0%) | 90 (100.0%) |
| Arts, Entertainment & Recreation | 0 (0.0%) | 0 (0.0%) |
| Accommodation & Food Services | 0 (0.0%) | 0 (0.0%) |
| Public Administration | 0 (0.0%) | 0 (0.0%) |
| Total | 182 (47.1%) | 204 (52.8%) |
Education in Mexico
School Enrollment in Mexico
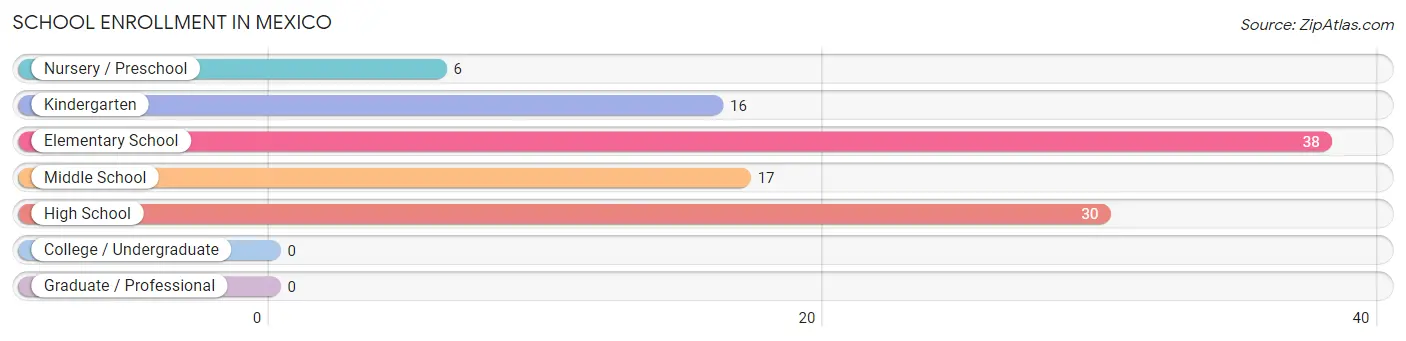
The most common levels of schooling among the 107 students in Mexico are elementary school (38 | 35.5%), high school (30 | 28.0%), and middle school (17 | 15.9%).
| School Level | # Students | % Students |
| Nursery / Preschool | 6 | 5.6% |
| Kindergarten | 16 | 14.9% |
| Elementary School | 38 | 35.5% |
| Middle School | 17 | 15.9% |
| High School | 30 | 28.0% |
| College / Undergraduate | 0 | 0.0% |
| Graduate / Professional | 0 | 0.0% |
| Total | 107 | 100.0% |
School Enrollment by Age by Funding Source in Mexico
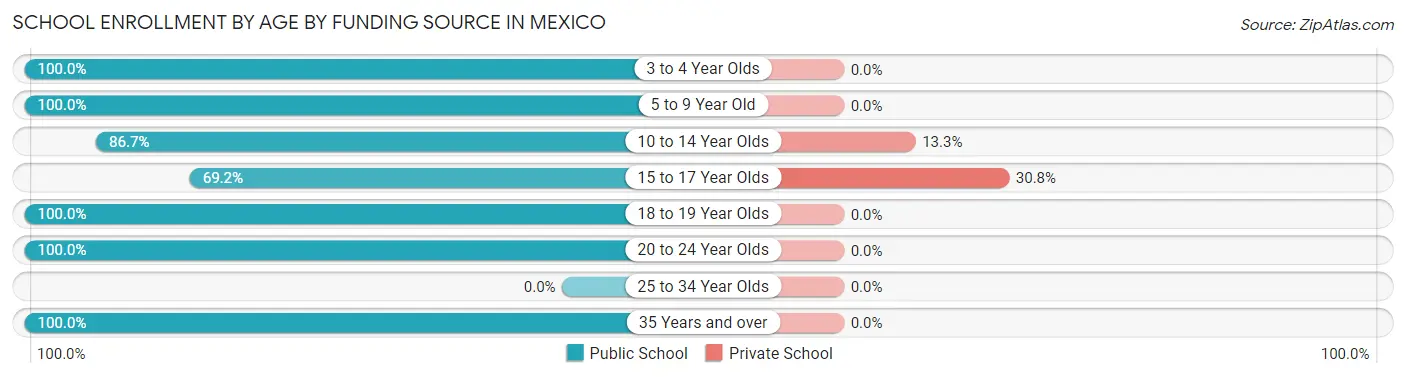
Out of a total of 107 students who are enrolled in schools in Mexico, 8 (7.5%) attend a private institution, while the remaining 99 (92.5%) are enrolled in public schools. The age group of 15 to 17 year olds has the highest likelihood of being enrolled in private schools, with 4 (30.8% in the age bracket) enrolled. Conversely, the age group of 3 to 4 year olds has the lowest likelihood of being enrolled in a private school, with 6 (100.0% in the age bracket) attending a public institution.
| Age Bracket | Public School | Private School |
| 3 to 4 Year Olds | 6 (100.0%) | 0 (0.0%) |
| 5 to 9 Year Old | 41 (100.0%) | 0 (0.0%) |
| 10 to 14 Year Olds | 26 (86.7%) | 4 (13.3%) |
| 15 to 17 Year Olds | 9 (69.2%) | 4 (30.8%) |
| 18 to 19 Year Olds | 6 (100.0%) | 0 (0.0%) |
| 20 to 24 Year Olds | 5 (100.0%) | 0 (0.0%) |
| 25 to 34 Year Olds | 0 (0.0%) | 0 (0.0%) |
| 35 Years and over | 6 (100.0%) | 0 (0.0%) |
| Total | 99 (92.5%) | 8 (7.5%) |
Educational Attainment by Field of Study in Mexico
Science & technology (90 | 61.2%), education (27 | 18.4%), business (19 | 12.9%), computers & mathematics (5 | 3.4%), and social sciences (3 | 2.0%) are the most common fields of study among 147 individuals in Mexico who have obtained a bachelor's degree or higher.
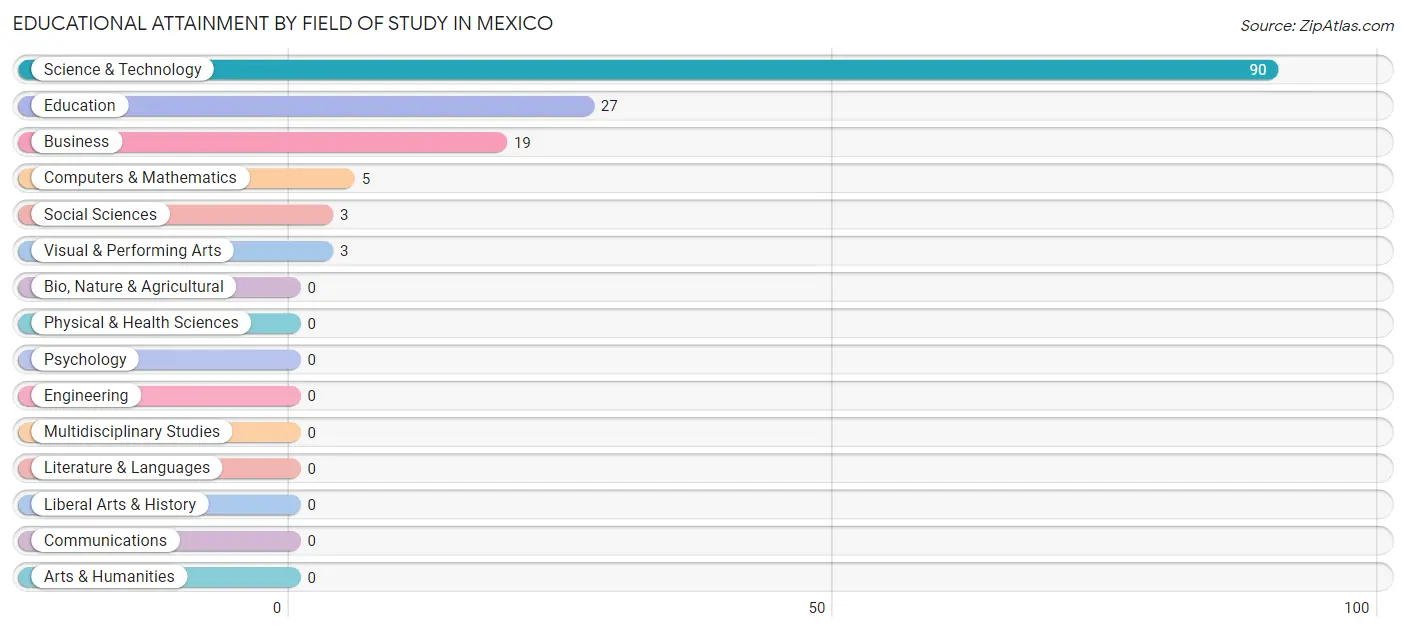
| Field of Study | # Graduates | % Graduates |
| Computers & Mathematics | 5 | 3.4% |
| Bio, Nature & Agricultural | 0 | 0.0% |
| Physical & Health Sciences | 0 | 0.0% |
| Psychology | 0 | 0.0% |
| Social Sciences | 3 | 2.0% |
| Engineering | 0 | 0.0% |
| Multidisciplinary Studies | 0 | 0.0% |
| Science & Technology | 90 | 61.2% |
| Business | 19 | 12.9% |
| Education | 27 | 18.4% |
| Literature & Languages | 0 | 0.0% |
| Liberal Arts & History | 0 | 0.0% |
| Visual & Performing Arts | 3 | 2.0% |
| Communications | 0 | 0.0% |
| Arts & Humanities | 0 | 0.0% |
| Total | 147 | 100.0% |
Transportation & Commute in Mexico
Vehicle Availability by Sex in Mexico
The most prevalent vehicle ownership categories in Mexico are males with 3 vehicles (78, accounting for 42.9%) and females with 3 vehicles (31, making up 38.2%).
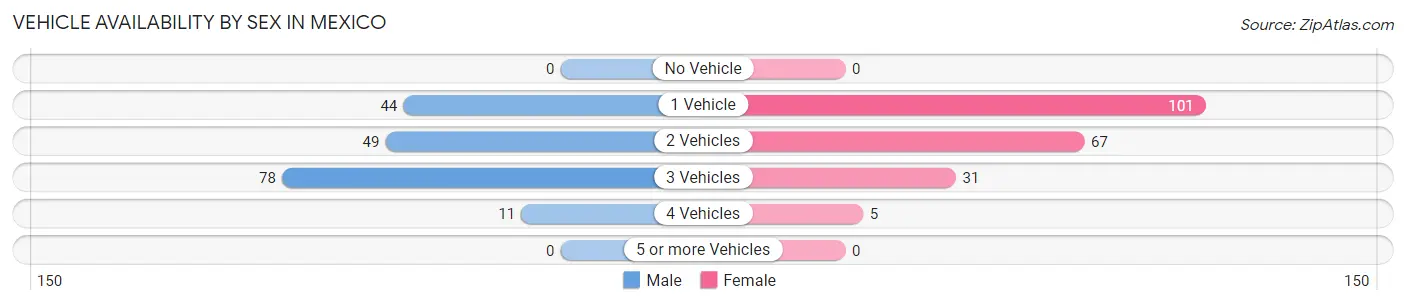
| Vehicles Available | Male | Female |
| No Vehicle | 0 (0.0%) | 0 (0.0%) |
| 1 Vehicle | 44 (24.2%) | 101 (49.5%) |
| 2 Vehicles | 49 (26.9%) | 67 (32.8%) |
| 3 Vehicles | 78 (42.9%) | 31 (15.2%) |
| 4 Vehicles | 11 (6.0%) | 5 (2.5%) |
| 5 or more Vehicles | 0 (0.0%) | 0 (0.0%) |
| Total | 182 (100.0%) | 204 (100.0%) |
Commute Time in Mexico
The most frequently occuring commute durations in Mexico are 30 to 34 minutes (122 commuters, 32.5%), 10 to 14 minutes (107 commuters, 28.5%), and 60 to 89 minutes (39 commuters, 10.4%).
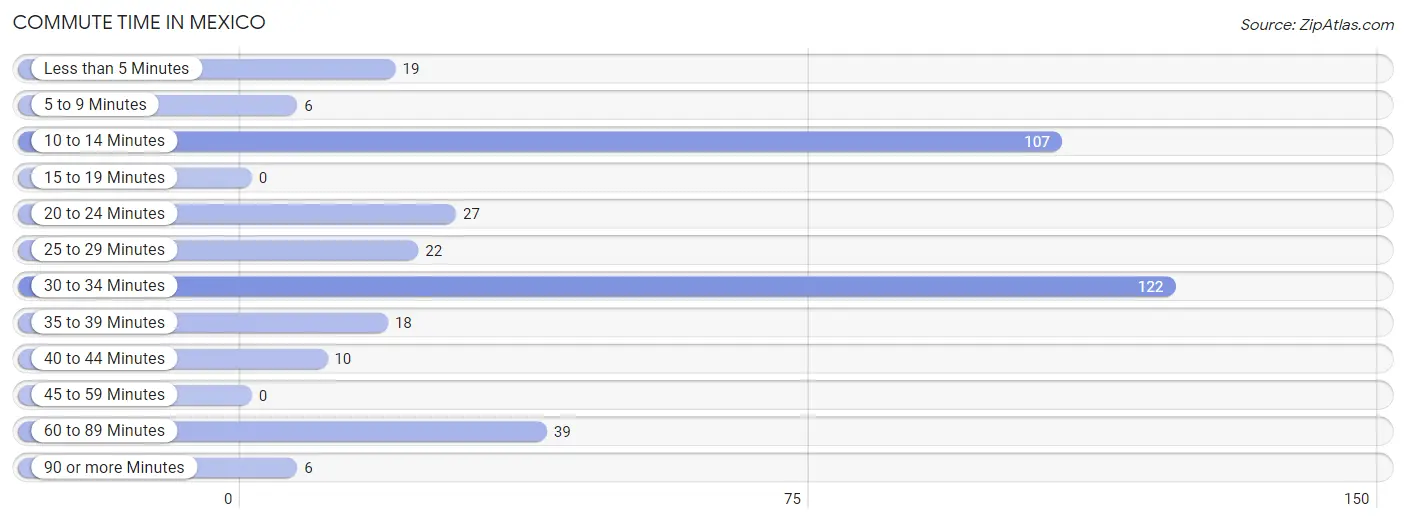
| Commute Time | # Commuters | % Commuters |
| Less than 5 Minutes | 19 | 5.1% |
| 5 to 9 Minutes | 6 | 1.6% |
| 10 to 14 Minutes | 107 | 28.5% |
| 15 to 19 Minutes | 0 | 0.0% |
| 20 to 24 Minutes | 27 | 7.2% |
| 25 to 29 Minutes | 22 | 5.9% |
| 30 to 34 Minutes | 122 | 32.5% |
| 35 to 39 Minutes | 18 | 4.8% |
| 40 to 44 Minutes | 10 | 2.7% |
| 45 to 59 Minutes | 0 | 0.0% |
| 60 to 89 Minutes | 39 | 10.4% |
| 90 or more Minutes | 6 | 1.6% |
Commute Time by Sex in Mexico
The most common commute times in Mexico are 30 to 34 minutes (63 commuters, 35.6%) for males and 10 to 14 minutes (107 commuters, 53.8%) for females.
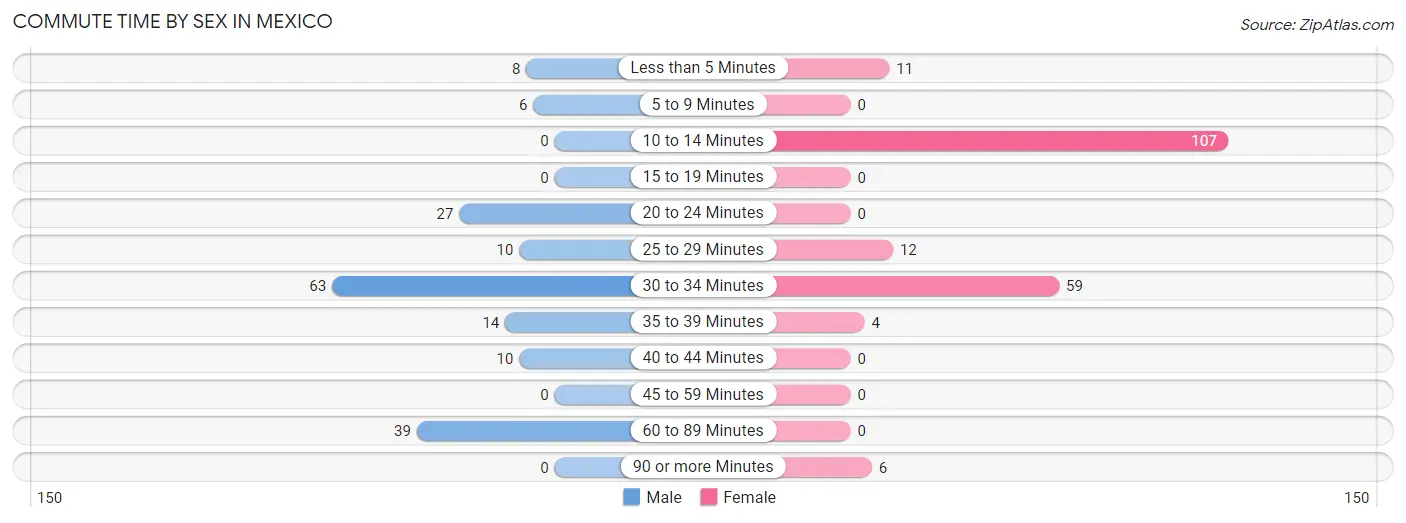
| Commute Time | Male | Female |
| Less than 5 Minutes | 8 (4.5%) | 11 (5.5%) |
| 5 to 9 Minutes | 6 (3.4%) | 0 (0.0%) |
| 10 to 14 Minutes | 0 (0.0%) | 107 (53.8%) |
| 15 to 19 Minutes | 0 (0.0%) | 0 (0.0%) |
| 20 to 24 Minutes | 27 (15.2%) | 0 (0.0%) |
| 25 to 29 Minutes | 10 (5.7%) | 12 (6.0%) |
| 30 to 34 Minutes | 63 (35.6%) | 59 (29.6%) |
| 35 to 39 Minutes | 14 (7.9%) | 4 (2.0%) |
| 40 to 44 Minutes | 10 (5.7%) | 0 (0.0%) |
| 45 to 59 Minutes | 0 (0.0%) | 0 (0.0%) |
| 60 to 89 Minutes | 39 (22.0%) | 0 (0.0%) |
| 90 or more Minutes | 0 (0.0%) | 6 (3.0%) |
Time of Departure to Work by Sex in Mexico
The most frequent times of departure to work in Mexico are 12:00 PM to 3:59 PM (64, 36.2%) for males and 7:00 AM to 7:29 AM (105, 52.8%) for females.
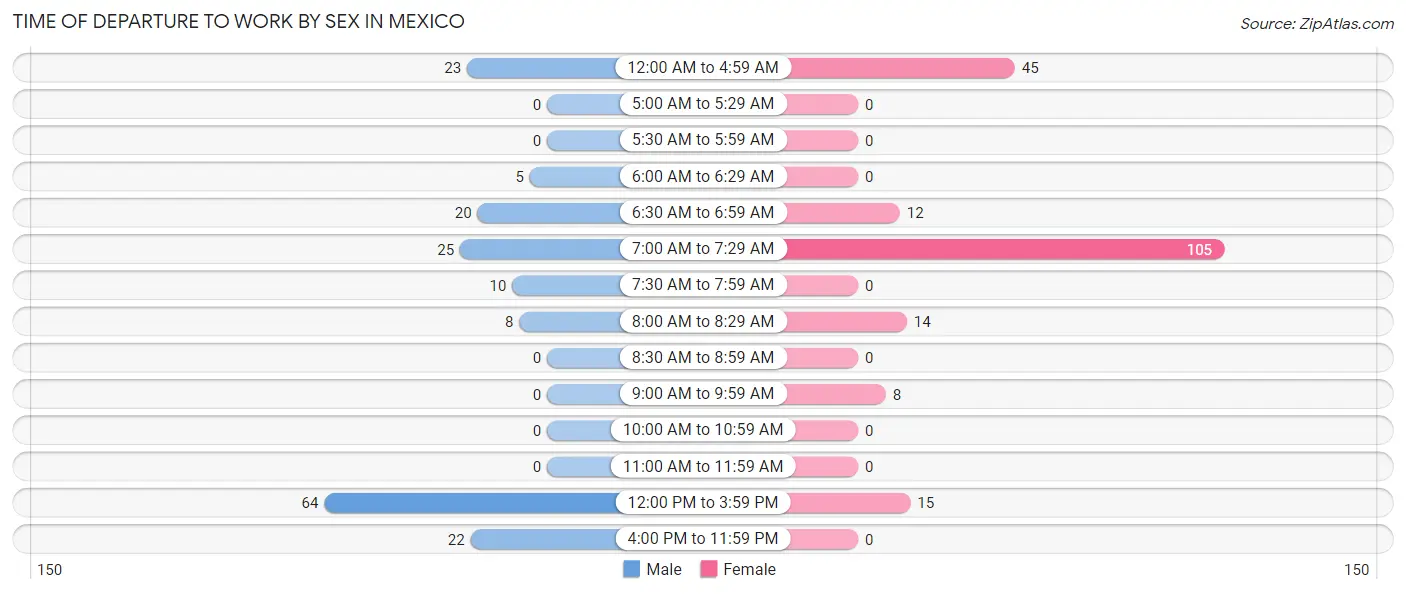
| Time of Departure | Male | Female |
| 12:00 AM to 4:59 AM | 23 (13.0%) | 45 (22.6%) |
| 5:00 AM to 5:29 AM | 0 (0.0%) | 0 (0.0%) |
| 5:30 AM to 5:59 AM | 0 (0.0%) | 0 (0.0%) |
| 6:00 AM to 6:29 AM | 5 (2.8%) | 0 (0.0%) |
| 6:30 AM to 6:59 AM | 20 (11.3%) | 12 (6.0%) |
| 7:00 AM to 7:29 AM | 25 (14.1%) | 105 (52.8%) |
| 7:30 AM to 7:59 AM | 10 (5.7%) | 0 (0.0%) |
| 8:00 AM to 8:29 AM | 8 (4.5%) | 14 (7.0%) |
| 8:30 AM to 8:59 AM | 0 (0.0%) | 0 (0.0%) |
| 9:00 AM to 9:59 AM | 0 (0.0%) | 8 (4.0%) |
| 10:00 AM to 10:59 AM | 0 (0.0%) | 0 (0.0%) |
| 11:00 AM to 11:59 AM | 0 (0.0%) | 0 (0.0%) |
| 12:00 PM to 3:59 PM | 64 (36.2%) | 15 (7.5%) |
| 4:00 PM to 11:59 PM | 22 (12.4%) | 0 (0.0%) |
| Total | 177 (100.0%) | 199 (100.0%) |
Housing Occupancy in Mexico
Occupancy by Ownership in Mexico
Of the total 446 dwellings in Mexico, owner-occupied units account for 384 (86.1%), while renter-occupied units make up 62 (13.9%).
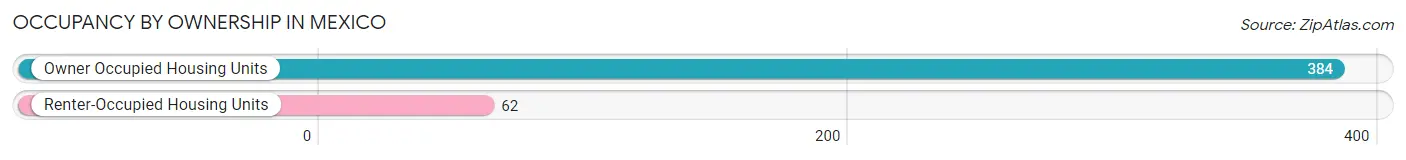
| Occupancy | # Housing Units | % Housing Units |
| Owner Occupied Housing Units | 384 | 86.1% |
| Renter-Occupied Housing Units | 62 | 13.9% |
| Total Occupied Housing Units | 446 | 100.0% |
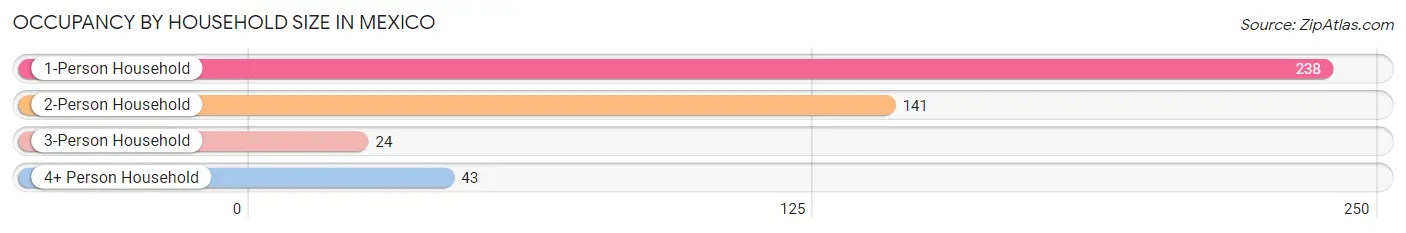
Occupancy by Household Size in Mexico
| Household Size | # Housing Units | % Housing Units |
| 1-Person Household | 238 | 53.4% |
| 2-Person Household | 141 | 31.6% |
| 3-Person Household | 24 | 5.4% |
| 4+ Person Household | 43 | 9.6% |
| Total Housing Units | 446 | 100.0% |
Occupancy by Ownership by Household Size in Mexico
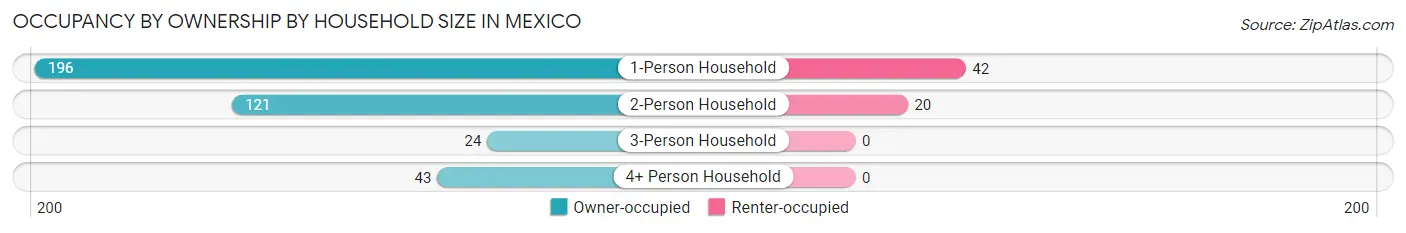
| Household Size | Owner-occupied | Renter-occupied |
| 1-Person Household | 196 (82.4%) | 42 (17.6%) |
| 2-Person Household | 121 (85.8%) | 20 (14.2%) |
| 3-Person Household | 24 (100.0%) | 0 (0.0%) |
| 4+ Person Household | 43 (100.0%) | 0 (0.0%) |
| Total Housing Units | 384 (86.1%) | 62 (13.9%) |
Occupancy by Educational Attainment in Mexico
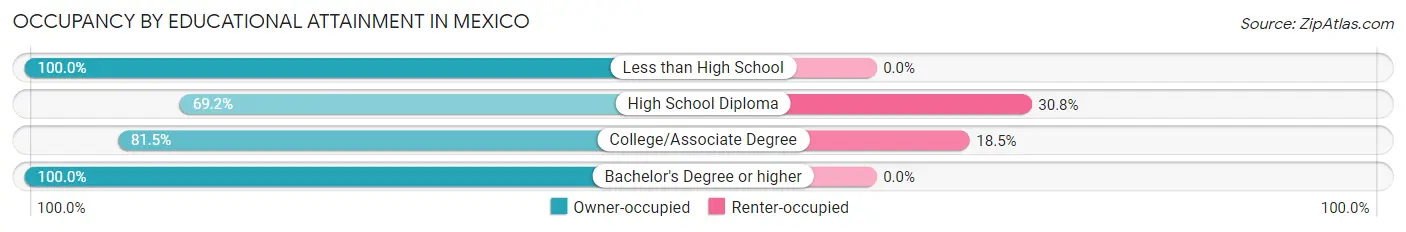
| Household Size | Owner-occupied | Renter-occupied |
| Less than High School | 78 (100.0%) | 0 (0.0%) |
| High School Diploma | 90 (69.2%) | 40 (30.8%) |
| College/Associate Degree | 97 (81.5%) | 22 (18.5%) |
| Bachelor's Degree or higher | 119 (100.0%) | 0 (0.0%) |
Occupancy by Age of Householder in Mexico
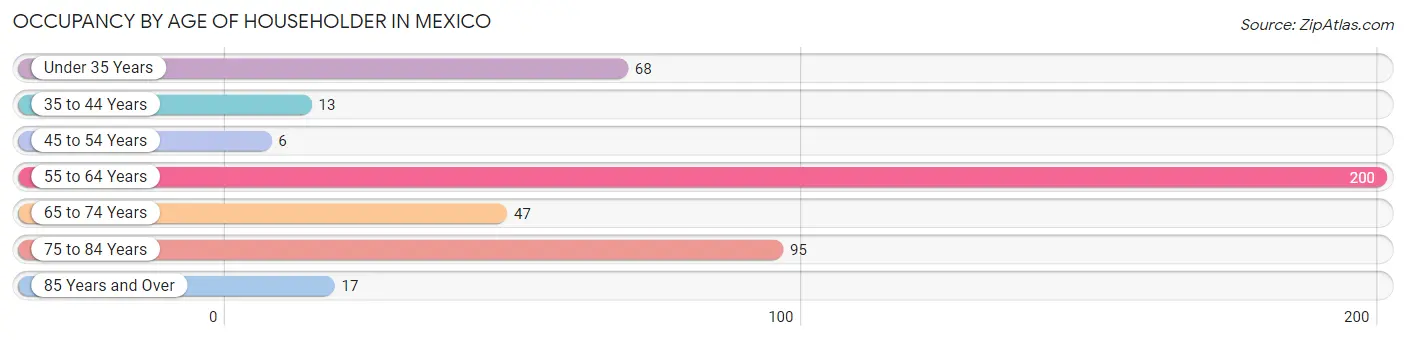
| Age Bracket | # Households | % Households |
| Under 35 Years | 68 | 15.2% |
| 35 to 44 Years | 13 | 2.9% |
| 45 to 54 Years | 6 | 1.3% |
| 55 to 64 Years | 200 | 44.8% |
| 65 to 74 Years | 47 | 10.5% |
| 75 to 84 Years | 95 | 21.3% |
| 85 Years and Over | 17 | 3.8% |
| Total | 446 | 100.0% |
Housing Finances in Mexico
Median Income by Occupancy in Mexico
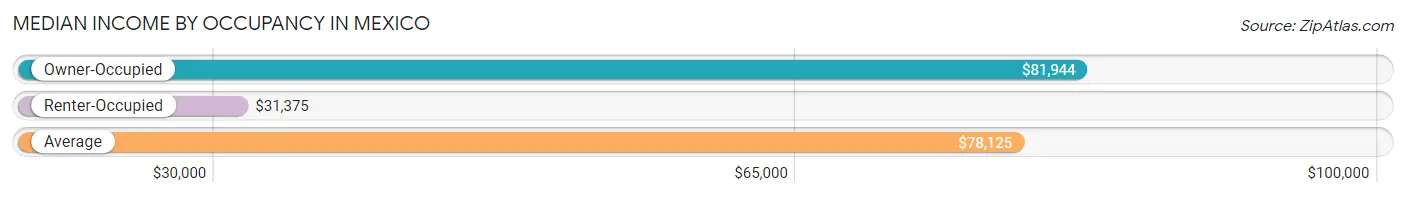
| Occupancy Type | # Households | Median Income |
| Owner-Occupied | 384 (86.1%) | $81,944 |
| Renter-Occupied | 62 (13.9%) | $31,375 |
| Average | 446 (100.0%) | $78,125 |
Occupancy by Householder Income Bracket in Mexico
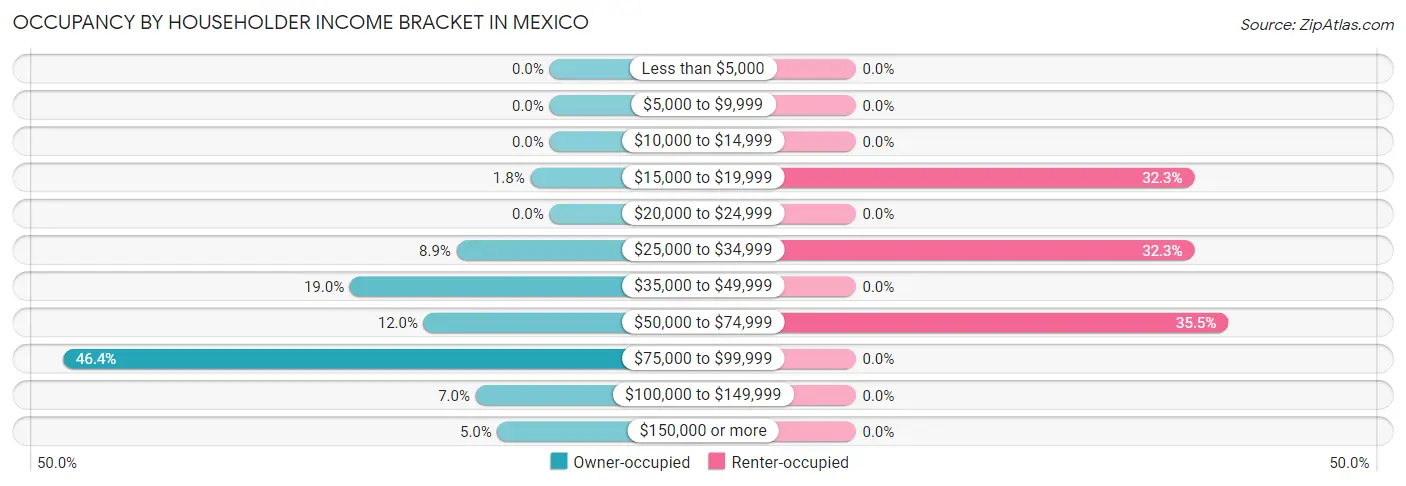
| Income Bracket | Owner-occupied | Renter-occupied |
| Less than $5,000 | 0 (0.0%) | 0 (0.0%) |
| $5,000 to $9,999 | 0 (0.0%) | 0 (0.0%) |
| $10,000 to $14,999 | 0 (0.0%) | 0 (0.0%) |
| $15,000 to $19,999 | 7 (1.8%) | 20 (32.3%) |
| $20,000 to $24,999 | 0 (0.0%) | 0 (0.0%) |
| $25,000 to $34,999 | 34 (8.8%) | 20 (32.3%) |
| $35,000 to $49,999 | 73 (19.0%) | 0 (0.0%) |
| $50,000 to $74,999 | 46 (12.0%) | 22 (35.5%) |
| $75,000 to $99,999 | 178 (46.4%) | 0 (0.0%) |
| $100,000 to $149,999 | 27 (7.0%) | 0 (0.0%) |
| $150,000 or more | 19 (5.0%) | 0 (0.0%) |
| Total | 384 (100.0%) | 62 (100.0%) |
Monthly Housing Cost Tiers in Mexico
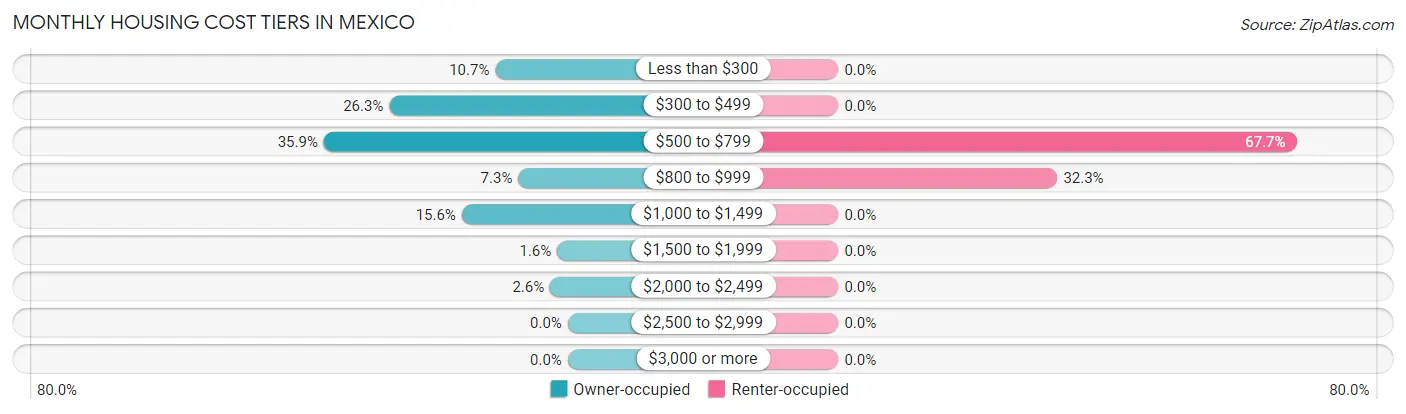
| Monthly Cost | Owner-occupied | Renter-occupied |
| Less than $300 | 41 (10.7%) | 0 (0.0%) |
| $300 to $499 | 101 (26.3%) | 0 (0.0%) |
| $500 to $799 | 138 (35.9%) | 42 (67.7%) |
| $800 to $999 | 28 (7.3%) | 20 (32.3%) |
| $1,000 to $1,499 | 60 (15.6%) | 0 (0.0%) |
| $1,500 to $1,999 | 6 (1.6%) | 0 (0.0%) |
| $2,000 to $2,499 | 10 (2.6%) | 0 (0.0%) |
| $2,500 to $2,999 | 0 (0.0%) | 0 (0.0%) |
| $3,000 or more | 0 (0.0%) | 0 (0.0%) |
| Total | 384 (100.0%) | 62 (100.0%) |
Physical Housing Characteristics in Mexico
Housing Structures in Mexico
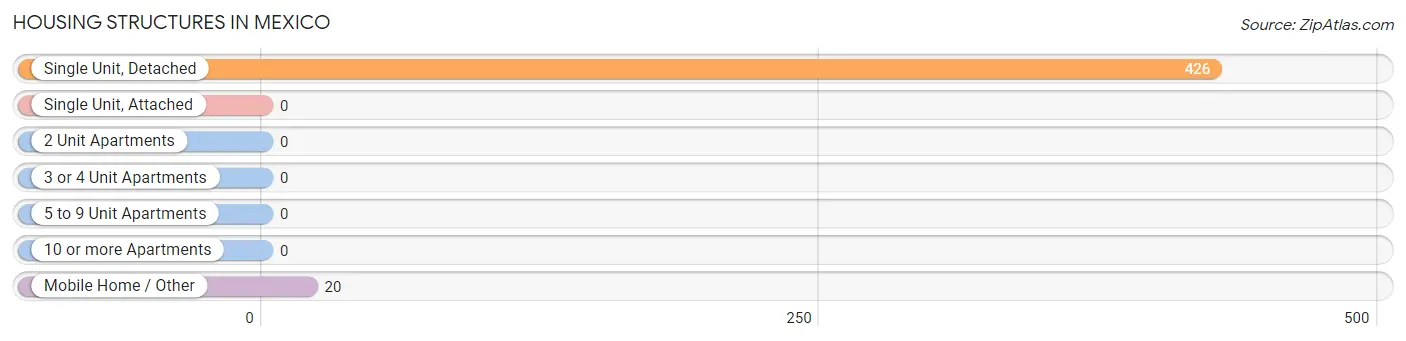
| Structure Type | # Housing Units | % Housing Units |
| Single Unit, Detached | 426 | 95.5% |
| Single Unit, Attached | 0 | 0.0% |
| 2 Unit Apartments | 0 | 0.0% |
| 3 or 4 Unit Apartments | 0 | 0.0% |
| 5 to 9 Unit Apartments | 0 | 0.0% |
| 10 or more Apartments | 0 | 0.0% |
| Mobile Home / Other | 20 | 4.5% |
| Total | 446 | 100.0% |
Housing Structures by Occupancy in Mexico
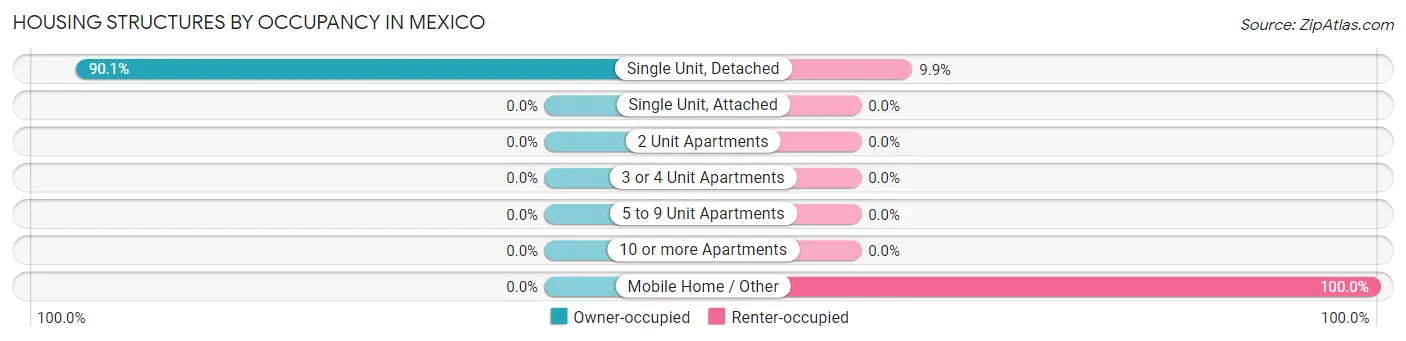
| Structure Type | Owner-occupied | Renter-occupied |
| Single Unit, Detached | 384 (90.1%) | 42 (9.9%) |
| Single Unit, Attached | 0 (0.0%) | 0 (0.0%) |
| 2 Unit Apartments | 0 (0.0%) | 0 (0.0%) |
| 3 or 4 Unit Apartments | 0 (0.0%) | 0 (0.0%) |
| 5 to 9 Unit Apartments | 0 (0.0%) | 0 (0.0%) |
| 10 or more Apartments | 0 (0.0%) | 0 (0.0%) |
| Mobile Home / Other | 0 (0.0%) | 20 (100.0%) |
| Total | 384 (86.1%) | 62 (13.9%) |
Housing Structures by Number of Rooms in Mexico
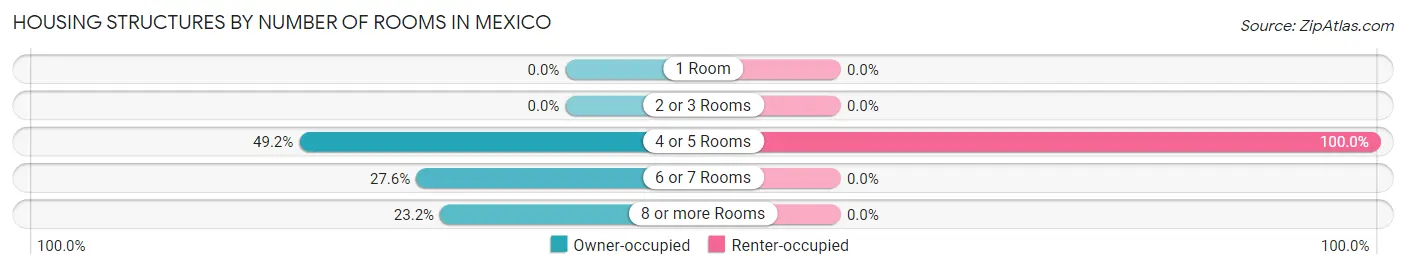
| Number of Rooms | Owner-occupied | Renter-occupied |
| 1 Room | 0 (0.0%) | 0 (0.0%) |
| 2 or 3 Rooms | 0 (0.0%) | 0 (0.0%) |
| 4 or 5 Rooms | 189 (49.2%) | 62 (100.0%) |
| 6 or 7 Rooms | 106 (27.6%) | 0 (0.0%) |
| 8 or more Rooms | 89 (23.2%) | 0 (0.0%) |
| Total | 384 (100.0%) | 62 (100.0%) |
Housing Structure by Heating Type in Mexico
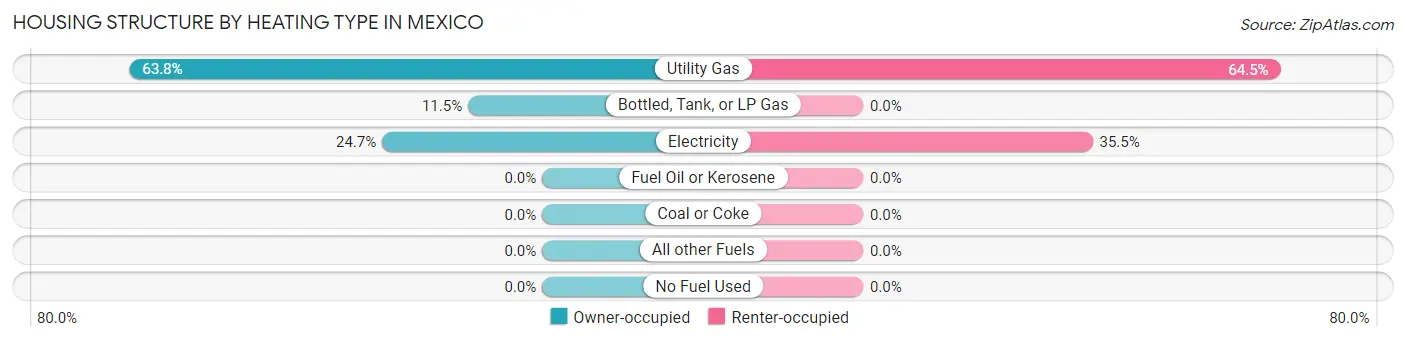
| Heating Type | Owner-occupied | Renter-occupied |
| Utility Gas | 245 (63.8%) | 40 (64.5%) |
| Bottled, Tank, or LP Gas | 44 (11.5%) | 0 (0.0%) |
| Electricity | 95 (24.7%) | 22 (35.5%) |
| Fuel Oil or Kerosene | 0 (0.0%) | 0 (0.0%) |
| Coal or Coke | 0 (0.0%) | 0 (0.0%) |
| All other Fuels | 0 (0.0%) | 0 (0.0%) |
| No Fuel Used | 0 (0.0%) | 0 (0.0%) |
| Total | 384 (100.0%) | 62 (100.0%) |
Household Vehicle Usage in Mexico
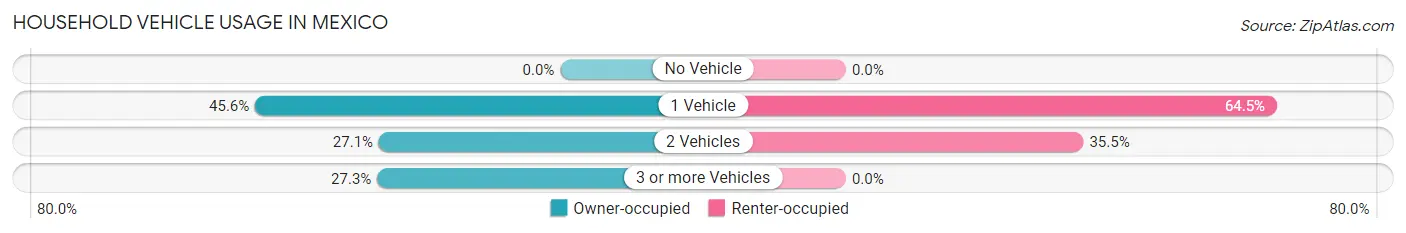
| Vehicles per Household | Owner-occupied | Renter-occupied |
| No Vehicle | 0 (0.0%) | 0 (0.0%) |
| 1 Vehicle | 175 (45.6%) | 40 (64.5%) |
| 2 Vehicles | 104 (27.1%) | 22 (35.5%) |
| 3 or more Vehicles | 105 (27.3%) | 0 (0.0%) |
| Total | 384 (100.0%) | 62 (100.0%) |
Real Estate & Mortgages in Mexico
Real Estate and Mortgage Overview in Mexico
| Characteristic | Without Mortgage | With Mortgage |
| Housing Units | 184 | 200 |
| Median Property Value | $103,200 | $86,300 |
| Median Household Income | $53,824 | $16 |
| Monthly Housing Costs | $388 | $0 |
| Real Estate Taxes | - | - |
Property Value by Mortgage Status in Mexico
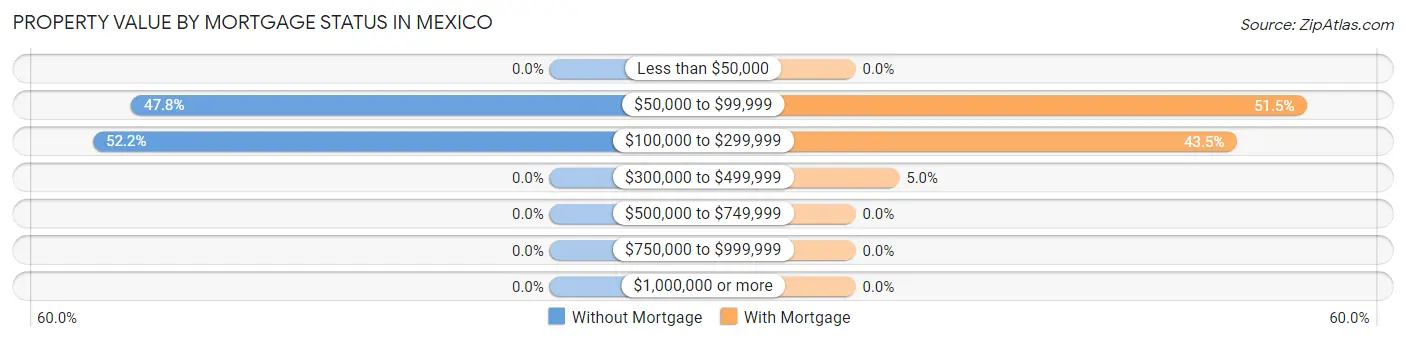
| Property Value | Without Mortgage | With Mortgage |
| Less than $50,000 | 0 (0.0%) | 0 (0.0%) |
| $50,000 to $99,999 | 88 (47.8%) | 103 (51.5%) |
| $100,000 to $299,999 | 96 (52.2%) | 87 (43.5%) |
| $300,000 to $499,999 | 0 (0.0%) | 10 (5.0%) |
| $500,000 to $749,999 | 0 (0.0%) | 0 (0.0%) |
| $750,000 to $999,999 | 0 (0.0%) | 0 (0.0%) |
| $1,000,000 or more | 0 (0.0%) | 0 (0.0%) |
| Total | 184 (100.0%) | 200 (100.0%) |
Household Income by Mortgage Status in Mexico
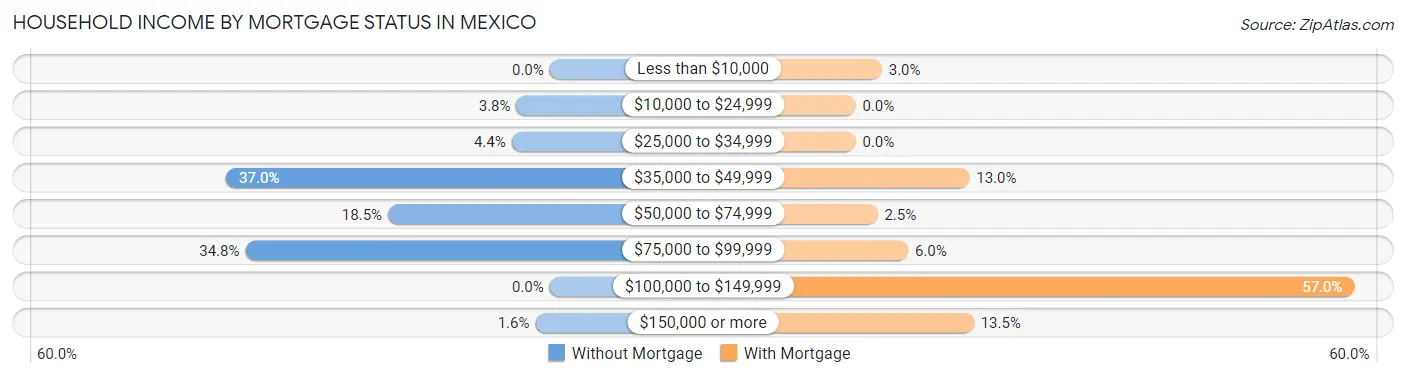
| Household Income | Without Mortgage | With Mortgage |
| Less than $10,000 | 0 (0.0%) | 6 (3.0%) |
| $10,000 to $24,999 | 7 (3.8%) | 0 (0.0%) |
| $25,000 to $34,999 | 8 (4.3%) | 0 (0.0%) |
| $35,000 to $49,999 | 68 (37.0%) | 26 (13.0%) |
| $50,000 to $74,999 | 34 (18.5%) | 5 (2.5%) |
| $75,000 to $99,999 | 64 (34.8%) | 12 (6.0%) |
| $100,000 to $149,999 | 0 (0.0%) | 114 (57.0%) |
| $150,000 or more | 3 (1.6%) | 27 (13.5%) |
| Total | 184 (100.0%) | 200 (100.0%) |
Property Value to Household Income Ratio in Mexico
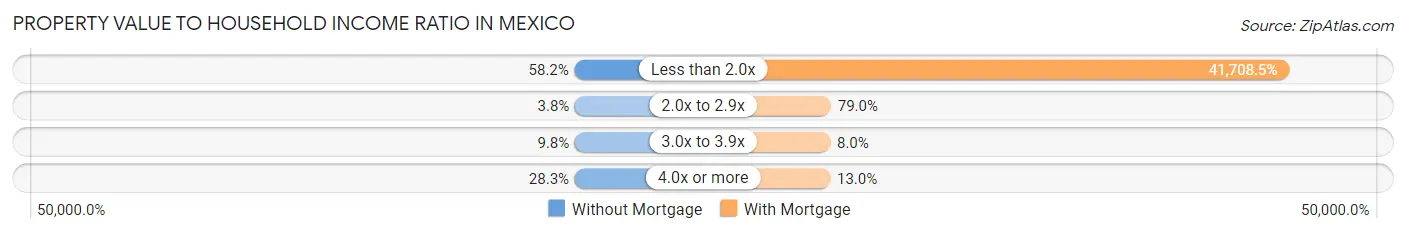
| Value-to-Income Ratio | Without Mortgage | With Mortgage |
| Less than 2.0x | 107 (58.2%) | 83,417 (41,708.5%) |
| 2.0x to 2.9x | 7 (3.8%) | 158 (79.0%) |
| 3.0x to 3.9x | 18 (9.8%) | 16 (8.0%) |
| 4.0x or more | 52 (28.3%) | 26 (13.0%) |
| Total | 184 (100.0%) | 200 (100.0%) |
Real Estate Taxes by Mortgage Status in Mexico
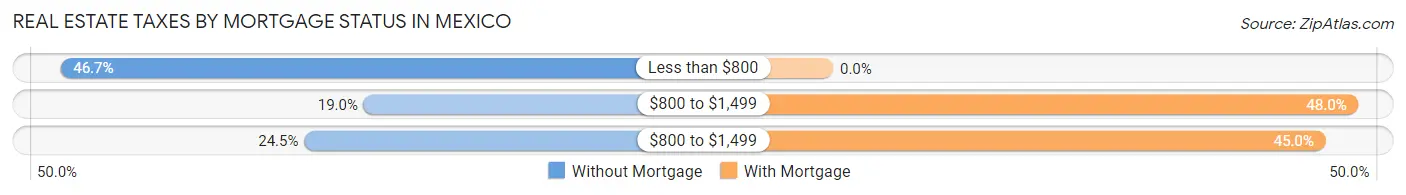
| Property Taxes | Without Mortgage | With Mortgage |
| Less than $800 | 86 (46.7%) | 0 (0.0%) |
| $800 to $1,499 | 35 (19.0%) | 96 (48.0%) |
| $800 to $1,499 | 45 (24.5%) | 90 (45.0%) |
| Total | 184 (100.0%) | 200 (100.0%) |
Health & Disability in Mexico
Health Insurance Coverage by Age in Mexico
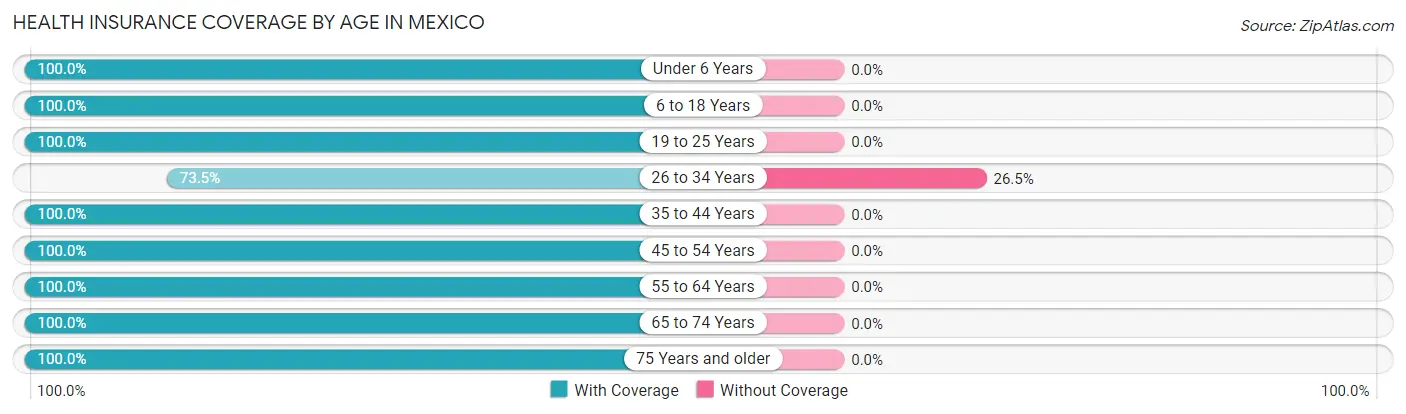
| Age Bracket | With Coverage | Without Coverage |
| Under 6 Years | 46 (100.0%) | 0 (0.0%) |
| 6 to 18 Years | 74 (100.0%) | 0 (0.0%) |
| 19 to 25 Years | 4 (100.0%) | 0 (0.0%) |
| 26 to 34 Years | 72 (73.5%) | 26 (26.5%) |
| 35 to 44 Years | 174 (100.0%) | 0 (0.0%) |
| 45 to 54 Years | 12 (100.0%) | 0 (0.0%) |
| 55 to 64 Years | 259 (100.0%) | 0 (0.0%) |
| 65 to 74 Years | 81 (100.0%) | 0 (0.0%) |
| 75 Years and older | 134 (100.0%) | 0 (0.0%) |
| Total | 856 (97.1%) | 26 (2.9%) |
Health Insurance Coverage by Citizenship Status in Mexico
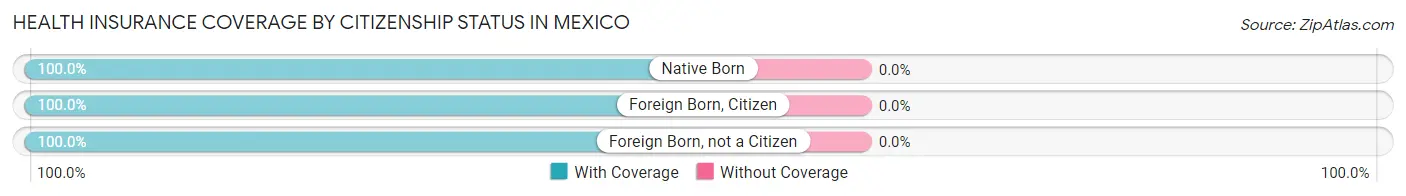
| Citizenship Status | With Coverage | Without Coverage |
| Native Born | 46 (100.0%) | 0 (0.0%) |
| Foreign Born, Citizen | 74 (100.0%) | 0 (0.0%) |
| Foreign Born, not a Citizen | 4 (100.0%) | 0 (0.0%) |
Health Insurance Coverage by Household Income in Mexico
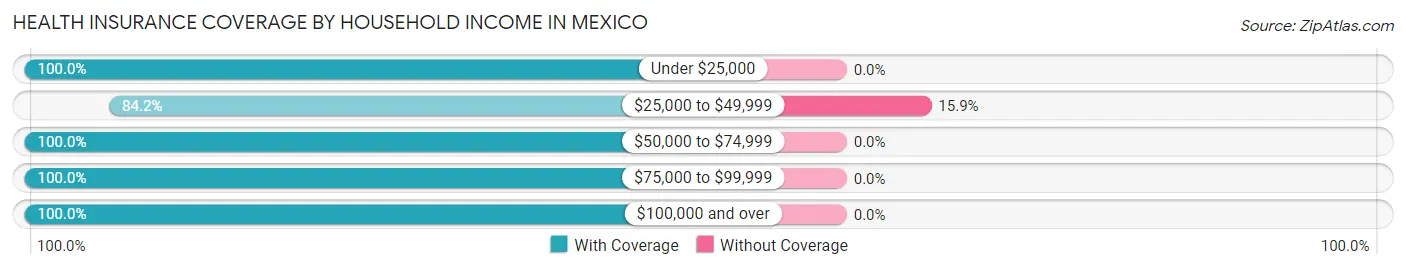
| Household Income | With Coverage | Without Coverage |
| Under $25,000 | 27 (100.0%) | 0 (0.0%) |
| $25,000 to $49,999 | 138 (84.2%) | 26 (15.9%) |
| $50,000 to $74,999 | 230 (100.0%) | 0 (0.0%) |
| $75,000 to $99,999 | 302 (100.0%) | 0 (0.0%) |
| $100,000 and over | 159 (100.0%) | 0 (0.0%) |
Public vs Private Health Insurance Coverage by Age in Mexico
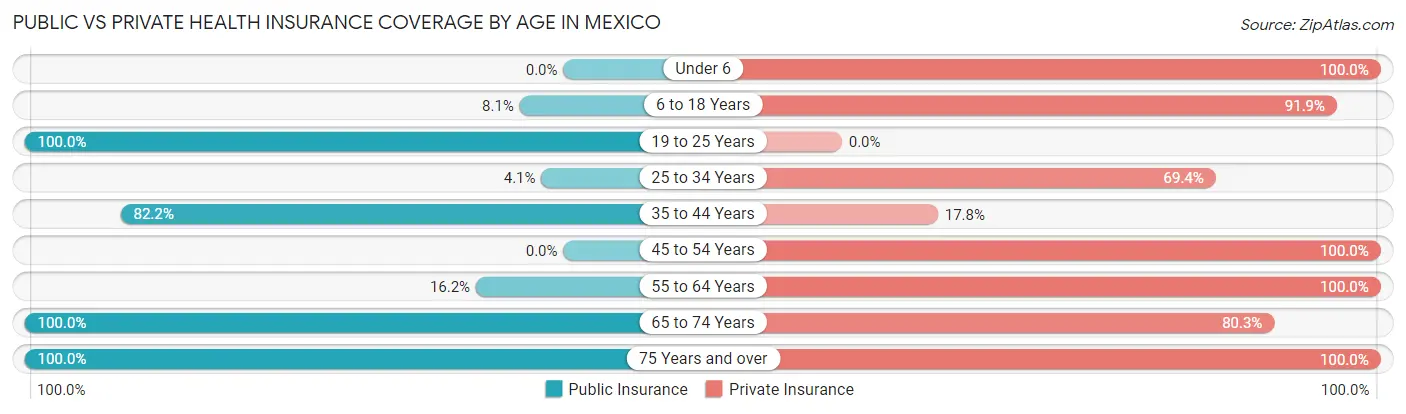
| Age Bracket | Public Insurance | Private Insurance |
| Under 6 | 0 (0.0%) | 46 (100.0%) |
| 6 to 18 Years | 6 (8.1%) | 68 (91.9%) |
| 19 to 25 Years | 4 (100.0%) | 0 (0.0%) |
| 25 to 34 Years | 4 (4.1%) | 68 (69.4%) |
| 35 to 44 Years | 143 (82.2%) | 31 (17.8%) |
| 45 to 54 Years | 0 (0.0%) | 12 (100.0%) |
| 55 to 64 Years | 42 (16.2%) | 259 (100.0%) |
| 65 to 74 Years | 81 (100.0%) | 65 (80.2%) |
| 75 Years and over | 134 (100.0%) | 134 (100.0%) |
| Total | 414 (46.9%) | 683 (77.4%) |
Disability Status by Sex by Age in Mexico
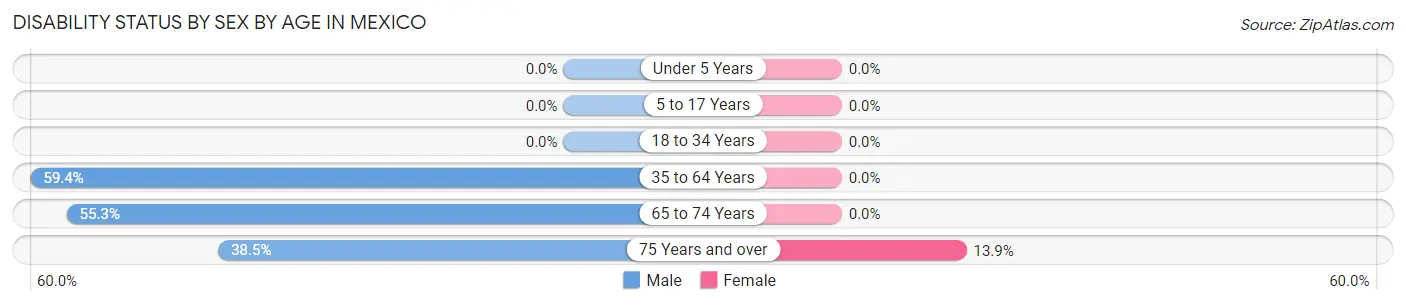
| Age Bracket | Male | Female |
| Under 5 Years | 0 (0.0%) | 0 (0.0%) |
| 5 to 17 Years | 0 (0.0%) | 0 (0.0%) |
| 18 to 34 Years | 0 (0.0%) | 0 (0.0%) |
| 35 to 64 Years | 165 (59.4%) | 0 (0.0%) |
| 65 to 74 Years | 26 (55.3%) | 0 (0.0%) |
| 75 Years and over | 10 (38.5%) | 15 (13.9%) |
Disability Class by Sex by Age in Mexico
Disability Class: Hearing Difficulty
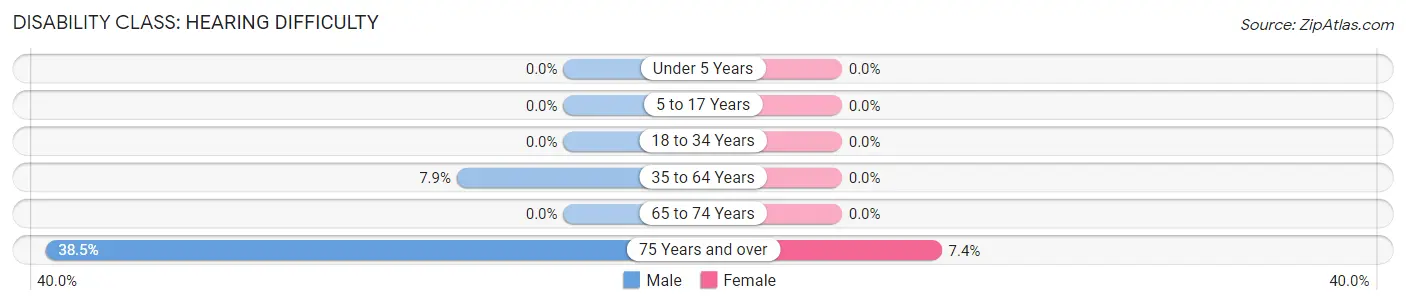
| Age Bracket | Male | Female |
| Under 5 Years | 0 (0.0%) | 0 (0.0%) |
| 5 to 17 Years | 0 (0.0%) | 0 (0.0%) |
| 18 to 34 Years | 0 (0.0%) | 0 (0.0%) |
| 35 to 64 Years | 22 (7.9%) | 0 (0.0%) |
| 65 to 74 Years | 0 (0.0%) | 0 (0.0%) |
| 75 Years and over | 10 (38.5%) | 8 (7.4%) |
Disability Class: Vision Difficulty
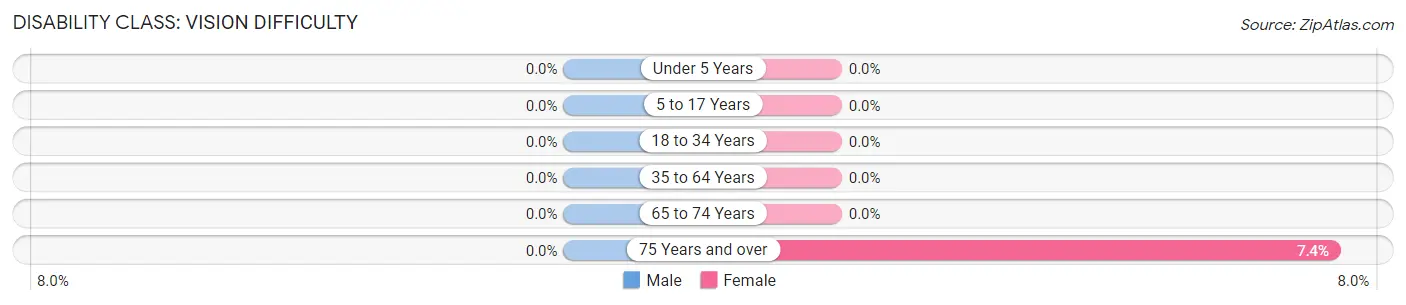
| Age Bracket | Male | Female |
| Under 5 Years | 0 (0.0%) | 0 (0.0%) |
| 5 to 17 Years | 0 (0.0%) | 0 (0.0%) |
| 18 to 34 Years | 0 (0.0%) | 0 (0.0%) |
| 35 to 64 Years | 0 (0.0%) | 0 (0.0%) |
| 65 to 74 Years | 0 (0.0%) | 0 (0.0%) |
| 75 Years and over | 0 (0.0%) | 8 (7.4%) |
Disability Class: Cognitive Difficulty
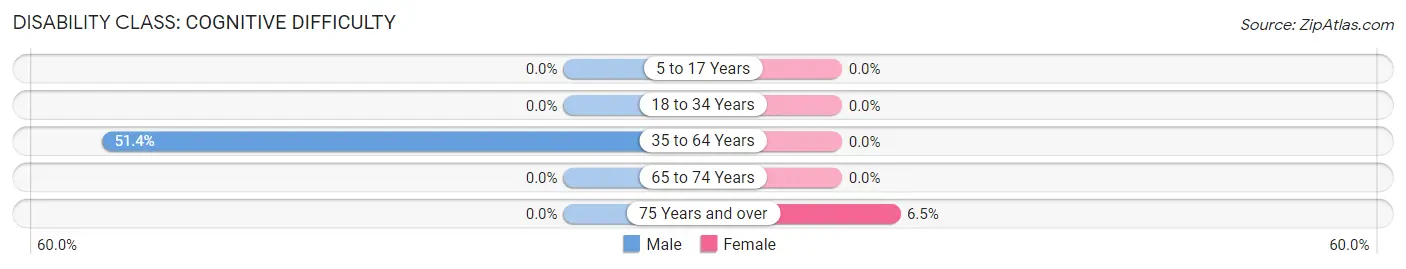
| Age Bracket | Male | Female |
| 5 to 17 Years | 0 (0.0%) | 0 (0.0%) |
| 18 to 34 Years | 0 (0.0%) | 0 (0.0%) |
| 35 to 64 Years | 143 (51.4%) | 0 (0.0%) |
| 65 to 74 Years | 0 (0.0%) | 0 (0.0%) |
| 75 Years and over | 0 (0.0%) | 7 (6.5%) |
Disability Class: Ambulatory Difficulty
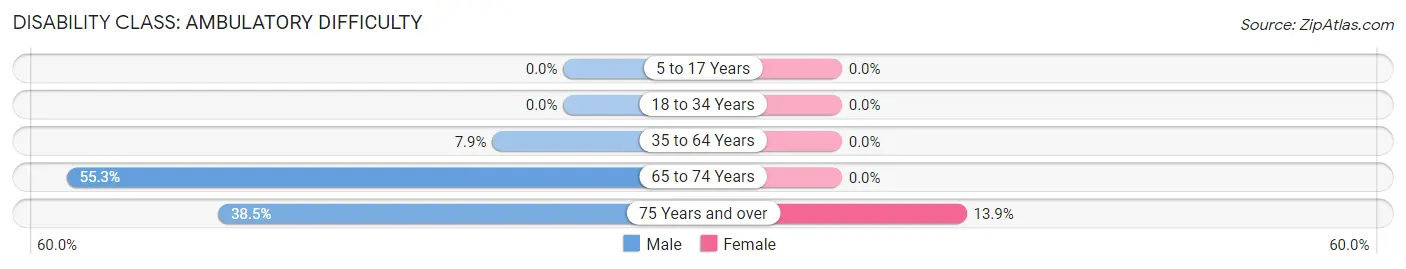
| Age Bracket | Male | Female |
| 5 to 17 Years | 0 (0.0%) | 0 (0.0%) |
| 18 to 34 Years | 0 (0.0%) | 0 (0.0%) |
| 35 to 64 Years | 22 (7.9%) | 0 (0.0%) |
| 65 to 74 Years | 26 (55.3%) | 0 (0.0%) |
| 75 Years and over | 10 (38.5%) | 15 (13.9%) |
Disability Class: Self-Care Difficulty
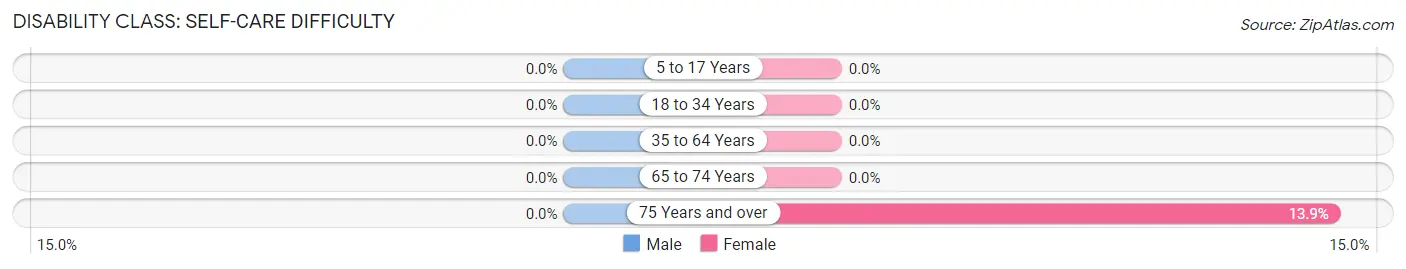
| Age Bracket | Male | Female |
| 5 to 17 Years | 0 (0.0%) | 0 (0.0%) |
| 18 to 34 Years | 0 (0.0%) | 0 (0.0%) |
| 35 to 64 Years | 0 (0.0%) | 0 (0.0%) |
| 65 to 74 Years | 0 (0.0%) | 0 (0.0%) |
| 75 Years and over | 0 (0.0%) | 15 (13.9%) |
Technology Access in Mexico
Computing Device Access in Mexico
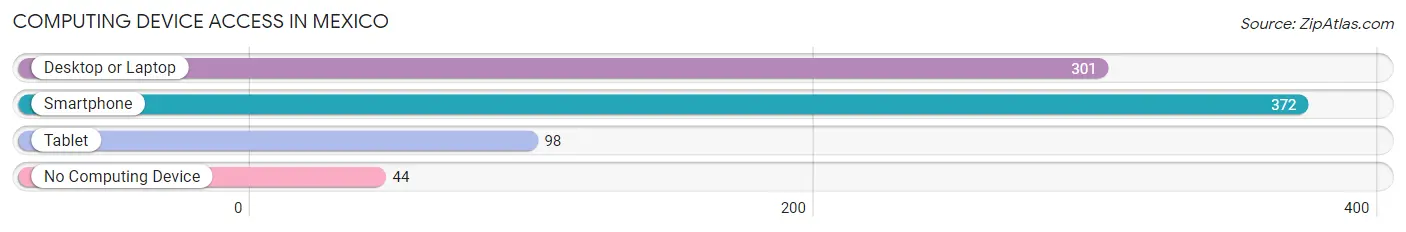
| Device Type | # Households | % Households |
| Desktop or Laptop | 301 | 67.5% |
| Smartphone | 372 | 83.4% |
| Tablet | 98 | 22.0% |
| No Computing Device | 44 | 9.9% |
| Total | 446 | 100.0% |
Internet Access in Mexico
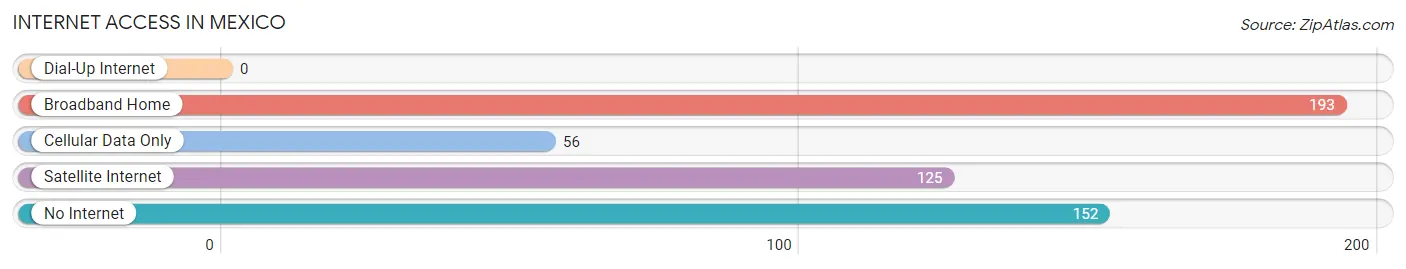
| Internet Type | # Households | % Households |
| Dial-Up Internet | 0 | 0.0% |
| Broadband Home | 193 | 43.3% |
| Cellular Data Only | 56 | 12.6% |
| Satellite Internet | 125 | 28.0% |
| No Internet | 152 | 34.1% |
| Total | 446 | 100.0% |
Mexico Summary
Mexico is a country located in North America, bordered by the United States to the north, Guatemala and Belize to the south, and the Pacific Ocean to the west. It is the fifth-largest country in the Americas by total area and the 13th-largest independent nation in the world. With an estimated population of over 120 million people, Mexico is the 11th most populous country and the most populous Spanish-speaking country in the world.
Geography
Mexico is a large country with a varied landscape. It is divided into 31 states and the Federal District, which is the capital city of Mexico City. The country is bordered by the United States to the north, Guatemala and Belize to the south, and the Pacific Ocean to the west. Mexico has a total area of 1,972,550 square kilometers (761,610 square miles). The terrain is mostly high plateaus and mountains with narrow coastal plains. The highest point in Mexico is the Pico de Orizaba, which is 5,636 meters (18,491 feet) above sea level.
Climate
Mexico has a tropical climate, with temperatures ranging from hot in the summer to cool in the winter. The country experiences two distinct seasons: a rainy season from June to October and a dry season from November to May. The average temperature in Mexico City is 18°C (64°F).
Economy
Mexico has a mixed economy, with a combination of private and public sectors. The country is a member of the Organization for Economic Co-operation and Development (OECD) and the G20. Mexico is the 15th largest economy in the world, with a GDP of $1.2 trillion in 2019. The country is a major exporter of oil, manufactured goods, and agricultural products. The main industries in Mexico are manufacturing, agriculture, and tourism.
Demographics
Mexico has a population of over 120 million people, making it the 11th most populous country in the world. The majority of the population is of mixed European and indigenous descent. The official language is Spanish, although there are many indigenous languages spoken in the country. The majority of the population is Roman Catholic, although there are also significant numbers of Protestants and other religious groups.
Mexico is a diverse and multicultural country. It is home to a variety of ethnic groups, including the Maya, Zapotec, Mixtec, and Huastec. The country also has a large immigrant population, with the majority coming from the United States and Central America.
Conclusion
Mexico is a large and diverse country with a rich history, geography, economy, and demographics. It is a major exporter of oil, manufactured goods, and agricultural products, and is home to a variety of ethnic groups. With a population of over 120 million people, Mexico is the 11th most populous country in the world. The country is a member of the Organization for Economic Co-operation and Development (OECD) and the G20, and is a major player in the global economy.
Common Questions
What is Per Capita Income in Mexico?
Per Capita income in Mexico is $31,786.
What is the Median Family Income in Mexico?
Median Family Income in Mexico is $82,250.
What is the Median Household income in Mexico?
Median Household Income in Mexico is $78,125.
What is Inequality or Gini Index in Mexico?
Inequality or Gini Index in Mexico is 0.27.
What is the Total Population of Mexico?
Total Population of Mexico is 1,128.
What is the Total Male Population of Mexico?
Total Male Population of Mexico is 678.
What is the Total Female Population of Mexico?
Total Female Population of Mexico is 450.
What is the Ratio of Males per 100 Females in Mexico?
There are 150.67 Males per 100 Females in Mexico.
What is the Ratio of Females per 100 Males in Mexico?
There are 66.37 Females per 100 Males in Mexico.
What is the Median Population Age in Mexico?
Median Population Age in Mexico is 44.7 Years.
What is the Average Family Size in Mexico
Average Family Size in Mexico is 3.2 People.
What is the Average Household Size in Mexico
Average Household Size in Mexico is 2.0 People.
How Large is the Labor Force in Mexico?
There are 390 People in the Labor Forcein in Mexico.
What is the Percentage of People in the Labor Force in Mexico?
38.1% of People are in the Labor Force in Mexico.
What is the Unemployment Rate in Mexico?
Unemployment Rate in Mexico is 1.0%.