Memphis, IN Map & Demographics
Memphis Map
Memphis Overview
$39,729
PER CAPITA INCOME
$110,074
AVG FAMILY INCOME
$86,875
AVG HOUSEHOLD INCOME
18.0%
WAGE / INCOME GAP [ % ]
82.0¢/ $1
WAGE / INCOME GAP [ $ ]
0.29
INEQUALITY / GINI INDEX
866
TOTAL POPULATION
412
MALE POPULATION
454
FEMALE POPULATION
90.75
MALES / 100 FEMALES
110.19
FEMALES / 100 MALES
34.1
MEDIAN AGE
2.6
AVG FAMILY SIZE
2.5
AVG HOUSEHOLD SIZE
575
LABOR FORCE [ PEOPLE ]
88.3%
PERCENT IN LABOR FORCE
Memphis Zip Codes
Memphis Area Codes
Income in Memphis
Income Overview in Memphis
Per Capita Income in Memphis is $39,729, while median incomes of families and households are $110,074 and $86,875 respectively.
| Characteristic | Number | Measure |
| Per Capita Income | 866 | $39,729 |
| Median Family Income | 323 | $110,074 |
| Mean Family Income | 323 | $108,483 |
| Median Household Income | 348 | $86,875 |
| Mean Household Income | 348 | $102,890 |
| Income Deficit | 323 | $0 |
| Wage / Income Gap (%) | 866 | 18.02% |
| Wage / Income Gap ($) | 866 | 81.98¢ per $1 |
| Gini / Inequality Index | 866 | 0.29 |
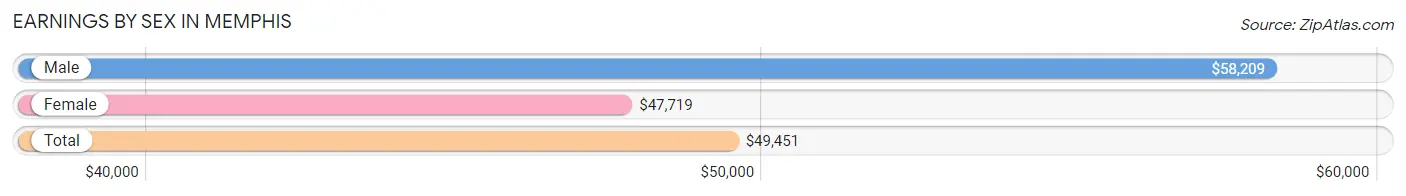
Earnings by Sex in Memphis
Average Earnings in Memphis are $49,451, $58,209 for men and $47,719 for women, a difference of 18.0%.
| Sex | Number | Average Earnings |
| Male | 301 (52.3%) | $58,209 |
| Female | 274 (47.6%) | $47,719 |
| Total | 575 (100.0%) | $49,451 |
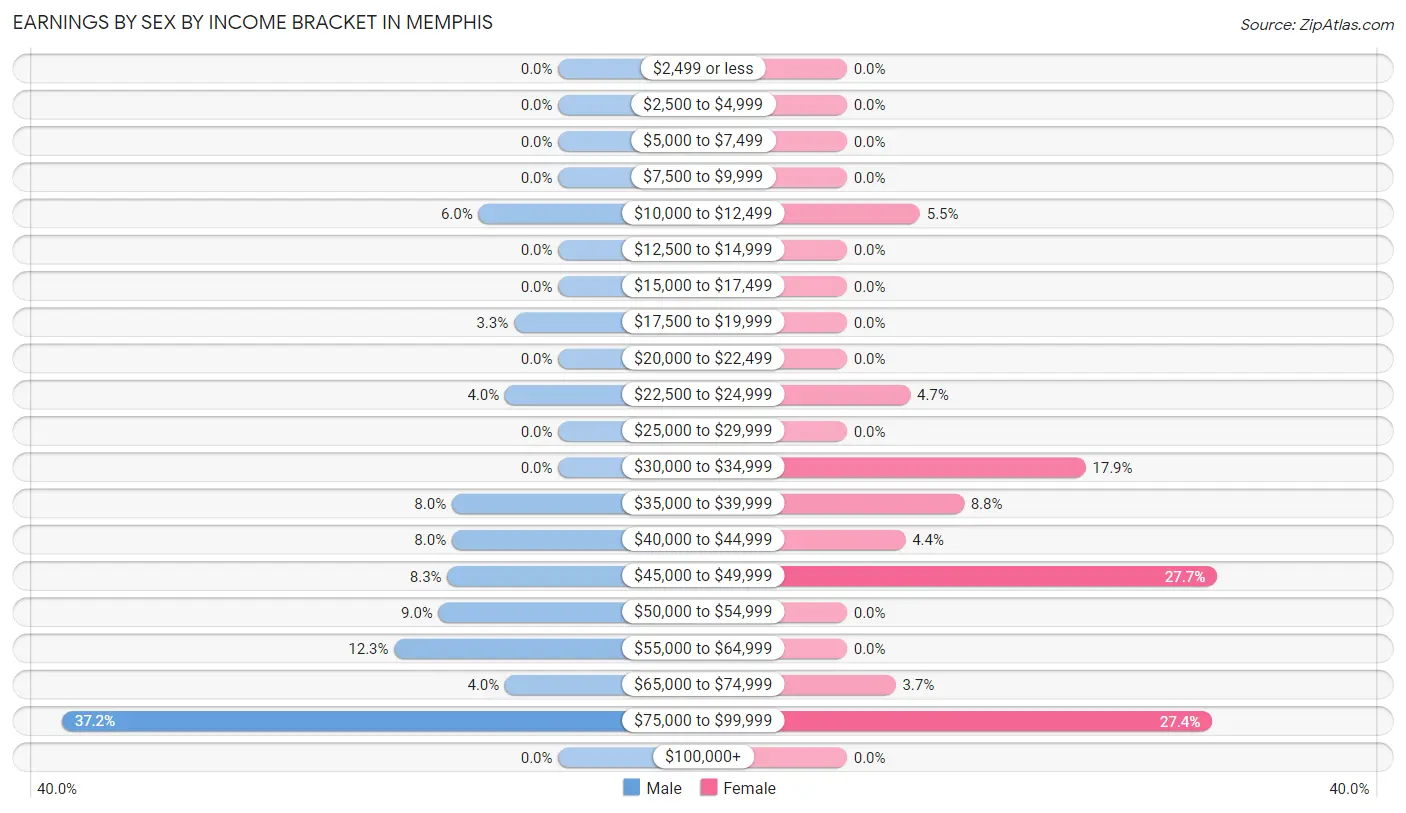
Earnings by Sex by Income Bracket in Memphis
The most common earnings brackets in Memphis are $75,000 to $99,999 for men (112 | 37.2%) and $45,000 to $49,999 for women (76 | 27.7%).
| Income | Male | Female |
| $2,499 or less | 0 (0.0%) | 0 (0.0%) |
| $2,500 to $4,999 | 0 (0.0%) | 0 (0.0%) |
| $5,000 to $7,499 | 0 (0.0%) | 0 (0.0%) |
| $7,500 to $9,999 | 0 (0.0%) | 0 (0.0%) |
| $10,000 to $12,499 | 18 (6.0%) | 15 (5.5%) |
| $12,500 to $14,999 | 0 (0.0%) | 0 (0.0%) |
| $15,000 to $17,499 | 0 (0.0%) | 0 (0.0%) |
| $17,500 to $19,999 | 10 (3.3%) | 0 (0.0%) |
| $20,000 to $22,499 | 0 (0.0%) | 0 (0.0%) |
| $22,500 to $24,999 | 12 (4.0%) | 13 (4.7%) |
| $25,000 to $29,999 | 0 (0.0%) | 0 (0.0%) |
| $30,000 to $34,999 | 0 (0.0%) | 49 (17.9%) |
| $35,000 to $39,999 | 24 (8.0%) | 24 (8.8%) |
| $40,000 to $44,999 | 24 (8.0%) | 12 (4.4%) |
| $45,000 to $49,999 | 25 (8.3%) | 76 (27.7%) |
| $50,000 to $54,999 | 27 (9.0%) | 0 (0.0%) |
| $55,000 to $64,999 | 37 (12.3%) | 0 (0.0%) |
| $65,000 to $74,999 | 12 (4.0%) | 10 (3.6%) |
| $75,000 to $99,999 | 112 (37.2%) | 75 (27.4%) |
| $100,000+ | 0 (0.0%) | 0 (0.0%) |
| Total | 301 (100.0%) | 274 (100.0%) |
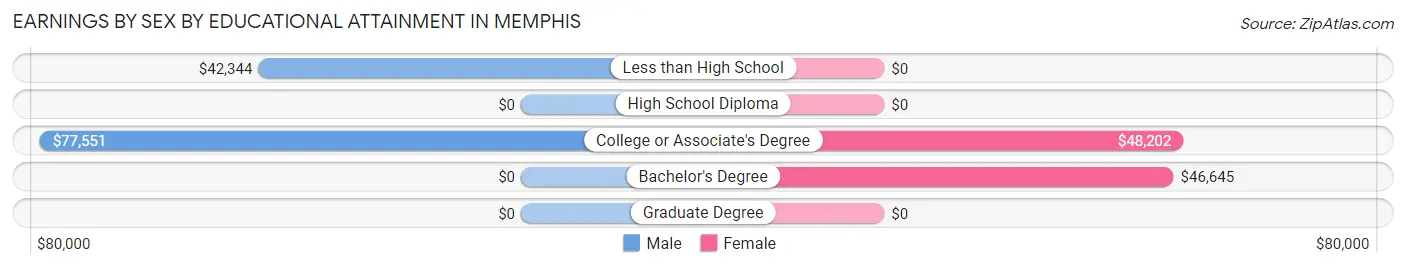
Earnings by Sex by Educational Attainment in Memphis
Average earnings in Memphis are $59,020 for men and $48,048 for women, a difference of 18.6%. Men with an educational attainment of college or associate's degree enjoy the highest average annual earnings of $77,551, while those with less than high school education earn the least with $42,344. Women with an educational attainment of college or associate's degree earn the most with the average annual earnings of $48,202, while those with bachelor's degree education have the smallest earnings of $46,645.
| Educational Attainment | Male Income | Female Income |
| Less than High School | $42,344 | $0 |
| High School Diploma | - | - |
| College or Associate's Degree | $77,551 | $48,202 |
| Bachelor's Degree | - | - |
| Graduate Degree | - | - |
| Total | $59,020 | $48,048 |
Family Income in Memphis
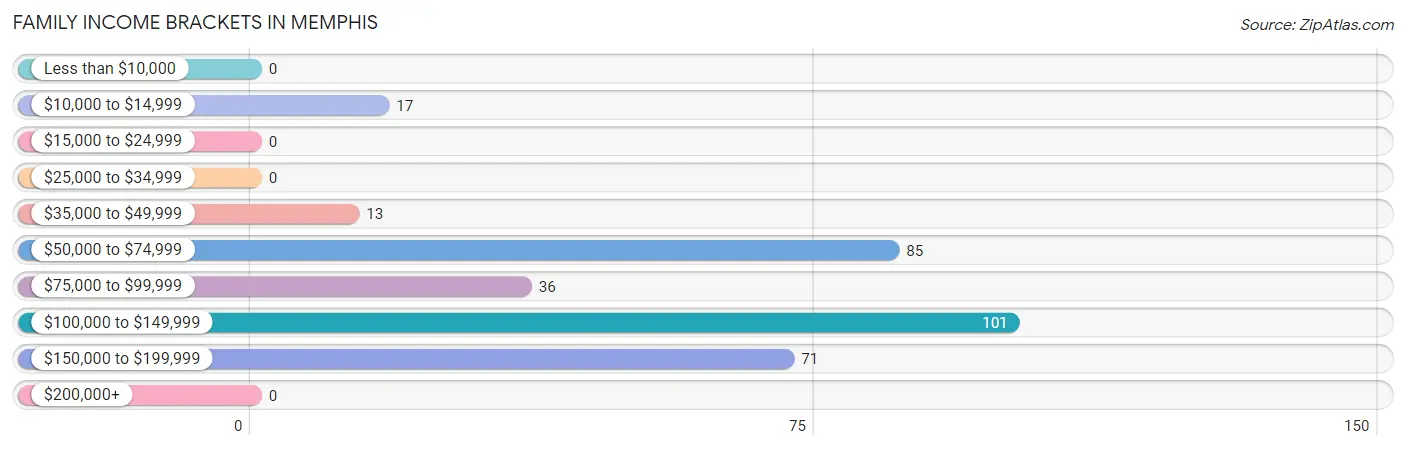
Family Income Brackets in Memphis
According to the Memphis family income data, there are 101 families falling into the $100,000 to $149,999 income range, which is the most common income bracket and makes up 31.3% of all families.
| Income Bracket | # Families | % Families |
| Less than $10,000 | 0 | 0.0% |
| $10,000 to $14,999 | 17 | 5.3% |
| $15,000 to $24,999 | 0 | 0.0% |
| $25,000 to $34,999 | 0 | 0.0% |
| $35,000 to $49,999 | 13 | 4.0% |
| $50,000 to $74,999 | 85 | 26.3% |
| $75,000 to $99,999 | 36 | 11.1% |
| $100,000 to $149,999 | 101 | 31.3% |
| $150,000 to $199,999 | 71 | 22.0% |
| $200,000+ | 0 | 0.0% |
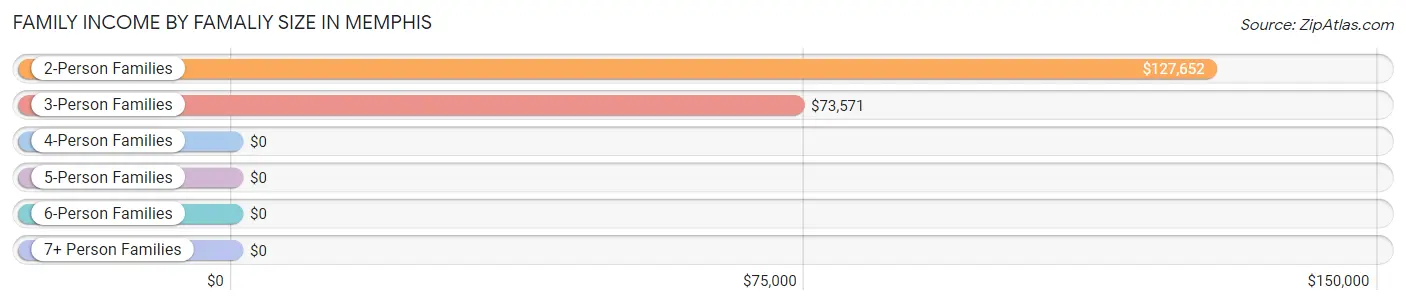
Family Income by Famaliy Size in Memphis
2-person families (163 | 50.5%) account for the highest median family income in Memphis with $127,652 per family, while 2-person families (163 | 50.5%) have the highest median income of $63,826 per family member.
| Income Bracket | # Families | Median Income |
| 2-Person Families | 163 (50.5%) | $127,652 |
| 3-Person Families | 80 (24.8%) | $73,571 |
| 4-Person Families | 62 (19.2%) | $0 |
| 5-Person Families | 8 (2.5%) | $0 |
| 6-Person Families | 10 (3.1%) | $0 |
| 7+ Person Families | 0 (0.0%) | $0 |
| Total | 323 (100.0%) | $110,074 |
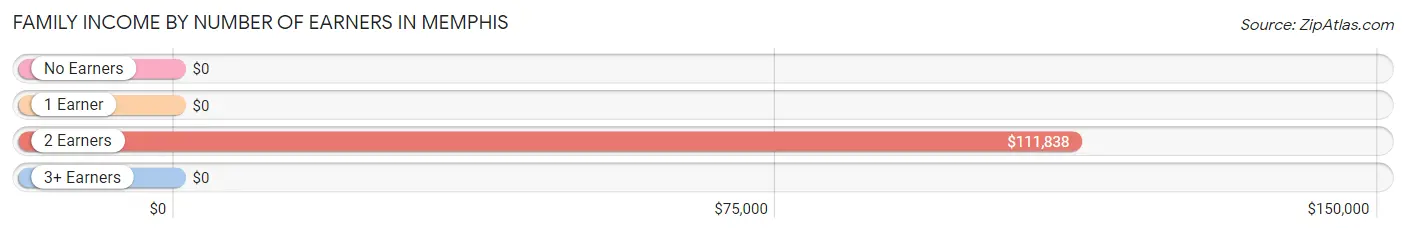
Family Income by Number of Earners in Memphis
| Number of Earners | # Families | Median Income |
| No Earners | 34 (10.5%) | $0 |
| 1 Earner | 0 (0.0%) | $0 |
| 2 Earners | 279 (86.4%) | $111,838 |
| 3+ Earners | 10 (3.1%) | $0 |
| Total | 323 (100.0%) | $110,074 |
Household Income in Memphis
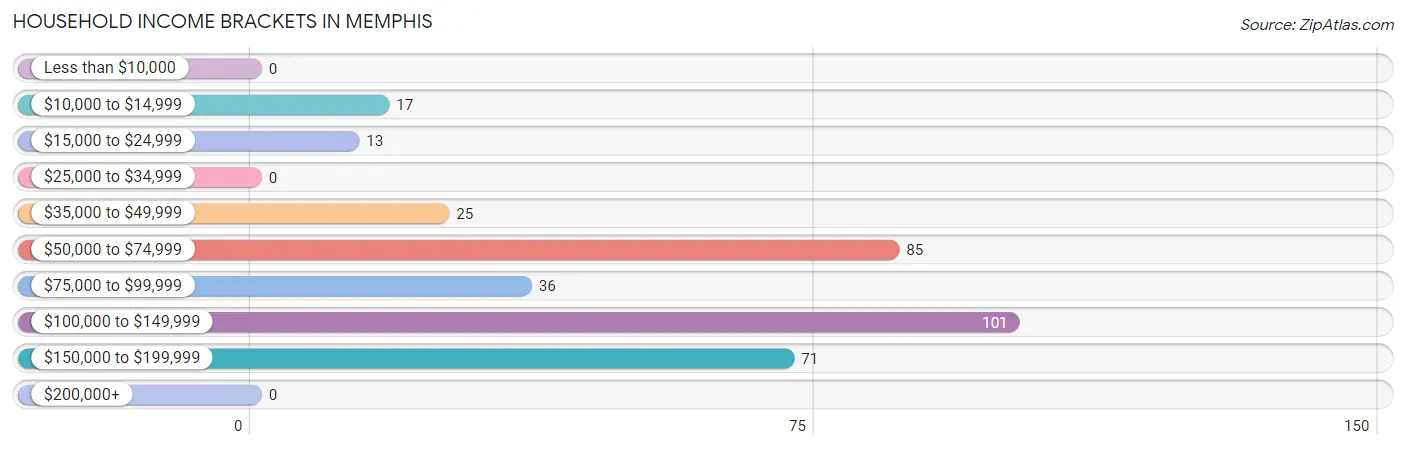
Household Income Brackets in Memphis
With 101 households falling in the category, the $100,000 to $149,999 income range is the most frequent in Memphis, accounting for 29.0% of all households.
| Income Bracket | # Households | % Households |
| Less than $10,000 | 0 | 0.0% |
| $10,000 to $14,999 | 17 | 4.9% |
| $15,000 to $24,999 | 13 | 3.7% |
| $25,000 to $34,999 | 0 | 0.0% |
| $35,000 to $49,999 | 25 | 7.2% |
| $50,000 to $74,999 | 85 | 24.4% |
| $75,000 to $99,999 | 36 | 10.3% |
| $100,000 to $149,999 | 101 | 29.0% |
| $150,000 to $199,999 | 71 | 20.4% |
| $200,000+ | 0 | 0.0% |
Household Income by Householder Age in Memphis
The median household income in Memphis is $86,875, with the highest median household income of $129,611 found in the 45 to 64 years age bracket for the primary householder. A total of 145 households (41.7%) fall into this category. Meanwhile, the 15 to 24 years age bracket for the primary householder has the lowest median household income of $0, with 12 households (3.5%) in this group.
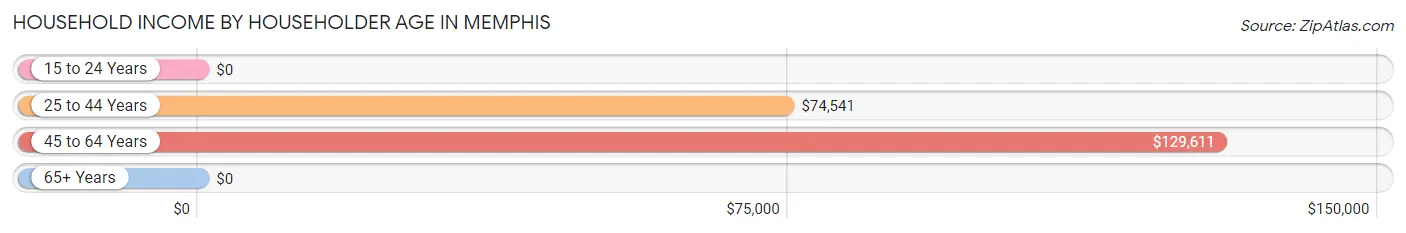
| Income Bracket | # Households | Median Income |
| 15 to 24 Years | 12 (3.5%) | $0 |
| 25 to 44 Years | 144 (41.4%) | $74,541 |
| 45 to 64 Years | 145 (41.7%) | $129,611 |
| 65+ Years | 47 (13.5%) | $0 |
| Total | 348 (100.0%) | $86,875 |
Poverty in Memphis
Income Below Poverty by Sex and Age in Memphis
With 3.2% poverty level for males and 3.7% for females among the residents of Memphis, 75 year old and over males and 75 year old and over females are the most vulnerable to poverty, with 13 males (50.0%) and 17 females (100.0%) in their respective age groups living below the poverty level.
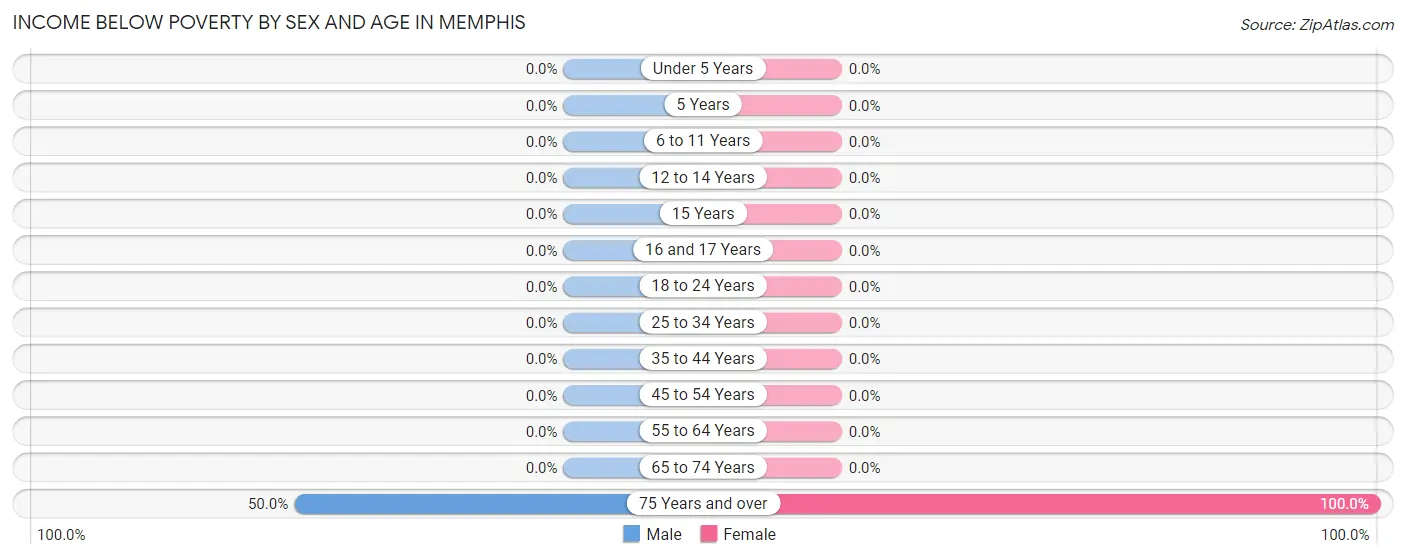
| Age Bracket | Male | Female |
| Under 5 Years | 0 (0.0%) | 0 (0.0%) |
| 5 Years | 0 (0.0%) | 0 (0.0%) |
| 6 to 11 Years | 0 (0.0%) | 0 (0.0%) |
| 12 to 14 Years | 0 (0.0%) | 0 (0.0%) |
| 15 Years | 0 (0.0%) | 0 (0.0%) |
| 16 and 17 Years | 0 (0.0%) | 0 (0.0%) |
| 18 to 24 Years | 0 (0.0%) | 0 (0.0%) |
| 25 to 34 Years | 0 (0.0%) | 0 (0.0%) |
| 35 to 44 Years | 0 (0.0%) | 0 (0.0%) |
| 45 to 54 Years | 0 (0.0%) | 0 (0.0%) |
| 55 to 64 Years | 0 (0.0%) | 0 (0.0%) |
| 65 to 74 Years | 0 (0.0%) | 0 (0.0%) |
| 75 Years and over | 13 (50.0%) | 17 (100.0%) |
| Total | 13 (3.2%) | 17 (3.7%) |
Income Above Poverty by Sex and Age in Memphis
According to the poverty statistics in Memphis, males aged under 5 years and females aged under 5 years are the age groups that are most secure financially, with 100.0% of males and 100.0% of females in these age groups living above the poverty line.
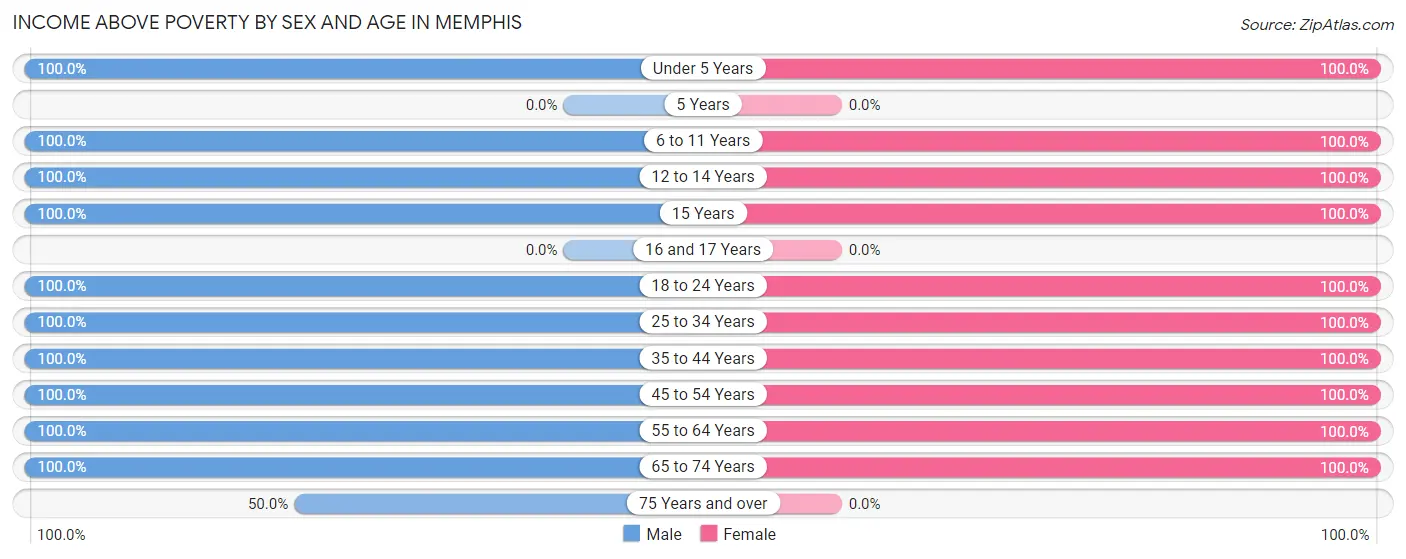
| Age Bracket | Male | Female |
| Under 5 Years | 40 (100.0%) | 16 (100.0%) |
| 5 Years | 0 (0.0%) | 0 (0.0%) |
| 6 to 11 Years | 11 (100.0%) | 46 (100.0%) |
| 12 to 14 Years | 11 (100.0%) | 76 (100.0%) |
| 15 Years | 6 (100.0%) | 9 (100.0%) |
| 16 and 17 Years | 0 (0.0%) | 0 (0.0%) |
| 18 to 24 Years | 24 (100.0%) | 15 (100.0%) |
| 25 to 34 Years | 89 (100.0%) | 109 (100.0%) |
| 35 to 44 Years | 54 (100.0%) | 34 (100.0%) |
| 45 to 54 Years | 50 (100.0%) | 106 (100.0%) |
| 55 to 64 Years | 84 (100.0%) | 10 (100.0%) |
| 65 to 74 Years | 17 (100.0%) | 16 (100.0%) |
| 75 Years and over | 13 (50.0%) | 0 (0.0%) |
| Total | 399 (96.8%) | 437 (96.3%) |
Income Below Poverty Among Married-Couple Families in Memphis
The poverty statistics for married-couple families in Memphis show that 5.6% or 17 of the total 306 families live below the poverty line. Families with no children have the highest poverty rate of 11.6%, comprising of 17 families. On the other hand, families with 1 or 2 children have the lowest poverty rate of 0.0%, which includes 0 families.
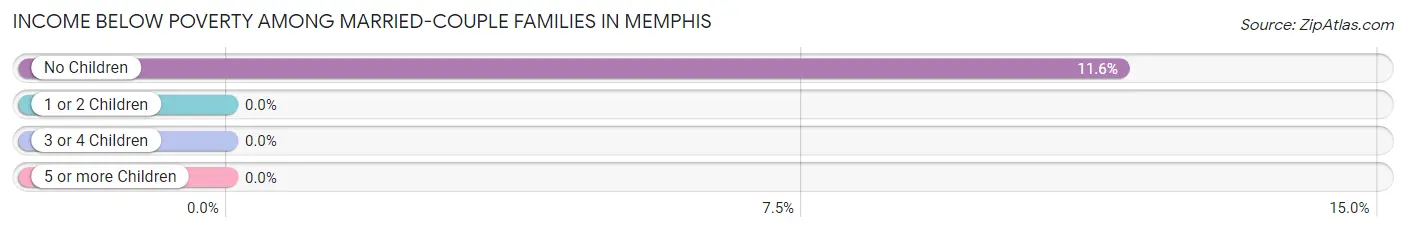
| Children | Above Poverty | Below Poverty |
| No Children | 129 (88.4%) | 17 (11.6%) |
| 1 or 2 Children | 142 (100.0%) | 0 (0.0%) |
| 3 or 4 Children | 18 (100.0%) | 0 (0.0%) |
| 5 or more Children | 0 (0.0%) | 0 (0.0%) |
| Total | 289 (94.4%) | 17 (5.6%) |
Income Below Poverty Among Single-Parent Households in Memphis
| Children | Single Father | Single Mother |
| No Children | 0 (0.0%) | 0 (0.0%) |
| 1 or 2 Children | 0 (0.0%) | 0 (0.0%) |
| 3 or 4 Children | 0 (0.0%) | 0 (0.0%) |
| 5 or more Children | 0 (0.0%) | 0 (0.0%) |
| Total | 0 (0.0%) | 0 (0.0%) |
Income Below Poverty Among Married-Couple vs Single-Parent Households in Memphis
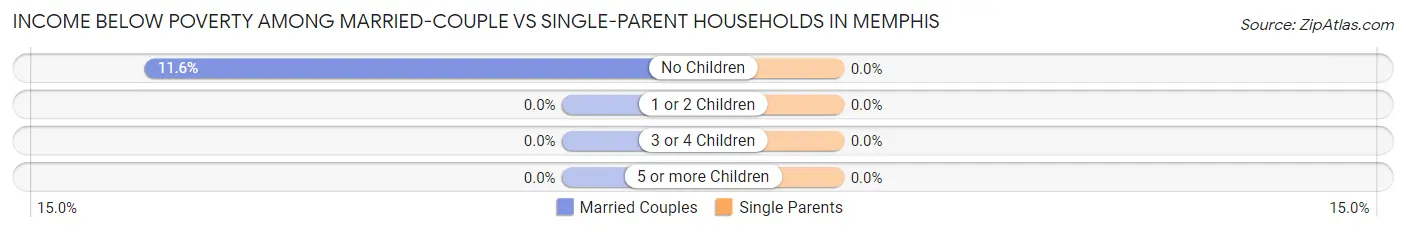
| Children | Married-Couple Families | Single-Parent Households |
| No Children | 17 (11.6%) | 0 (0.0%) |
| 1 or 2 Children | 0 (0.0%) | 0 (0.0%) |
| 3 or 4 Children | 0 (0.0%) | 0 (0.0%) |
| 5 or more Children | 0 (0.0%) | 0 (0.0%) |
| Total | 17 (5.6%) | 0 (0.0%) |
Race in Memphis
The most populous races in Memphis are White / Caucasian (816 | 94.2%), and Two or more Races (50 | 5.8%).
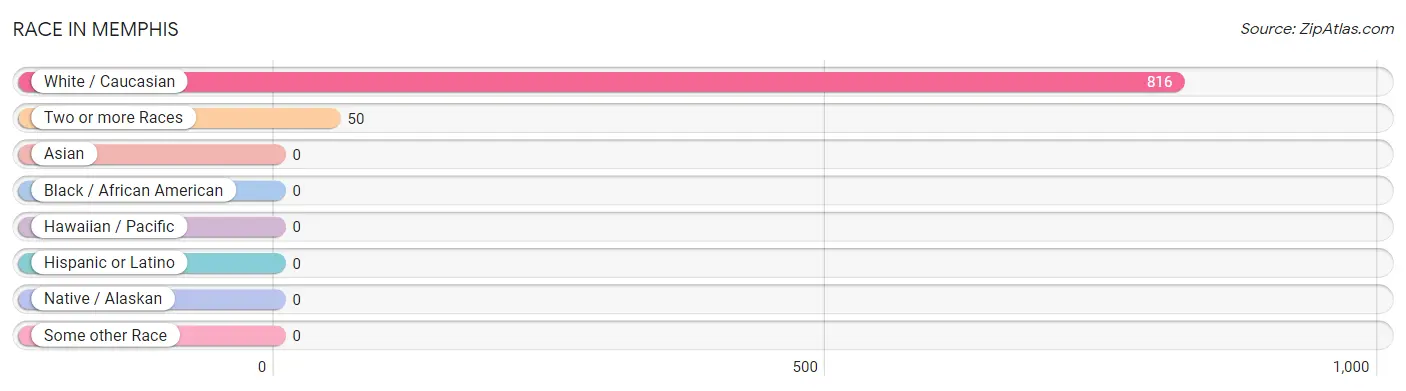
| Race | # Population | % Population |
| Asian | 0 | 0.0% |
| Black / African American | 0 | 0.0% |
| Hawaiian / Pacific | 0 | 0.0% |
| Hispanic or Latino | 0 | 0.0% |
| Native / Alaskan | 0 | 0.0% |
| White / Caucasian | 816 | 94.2% |
| Two or more Races | 50 | 5.8% |
| Some other Race | 0 | 0.0% |
| Total | 866 | 100.0% |
Ancestry in Memphis
The most populous ancestries reported in Memphis are German (239 | 27.6%), Irish (177 | 20.4%), English (115 | 13.3%), Italian (83 | 9.6%), and American (52 | 6.0%), together accounting for 76.9% of all Memphis residents.
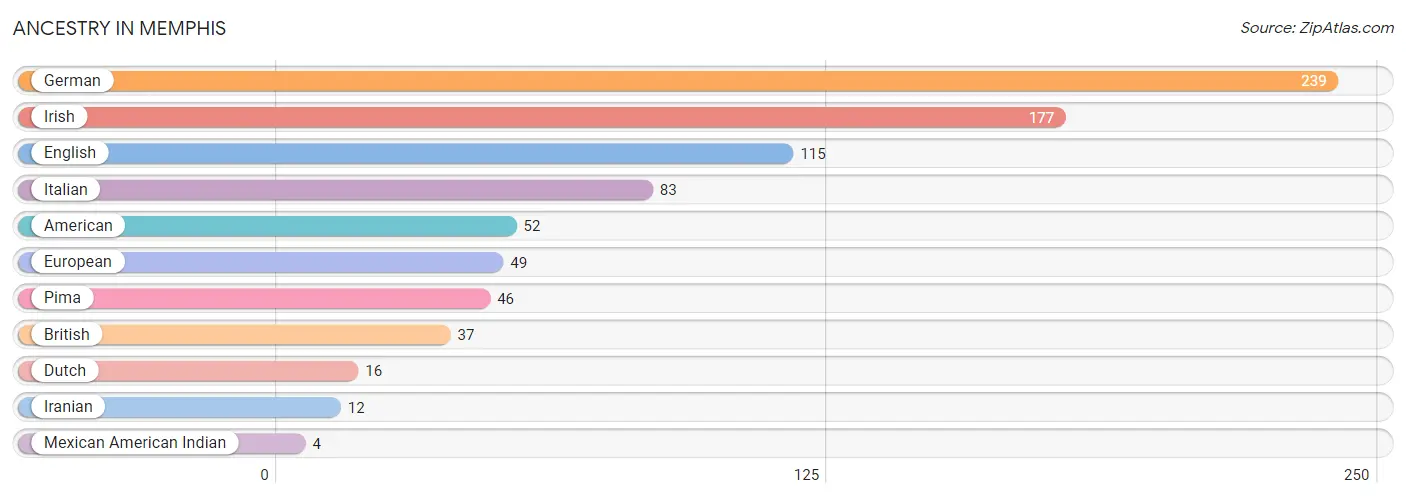
| Ancestry | # Population | % Population |
| American | 52 | 6.0% |
| British | 37 | 4.3% |
| Dutch | 16 | 1.8% |
| English | 115 | 13.3% |
| European | 49 | 5.7% |
| German | 239 | 27.6% |
| Iranian | 12 | 1.4% |
| Irish | 177 | 20.4% |
| Italian | 83 | 9.6% |
| Mexican American Indian | 4 | 0.5% |
| Pima | 46 | 5.3% | View All 11 Rows |
Immigrants in Memphis
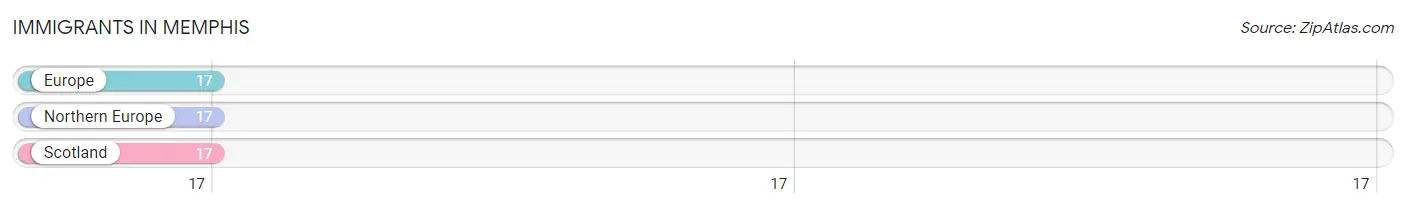
The most numerous immigrant groups reported in Memphis came from Europe (17 | 2.0%), Northern Europe (17 | 2.0%), and Scotland (17 | 2.0%), together accounting for 5.9% of all Memphis residents.
| Immigration Origin | # Population | % Population |
| Europe | 17 | 2.0% |
| Northern Europe | 17 | 2.0% |
| Scotland | 17 | 2.0% | View All 3 Rows |
Sex and Age in Memphis
Sex and Age in Memphis
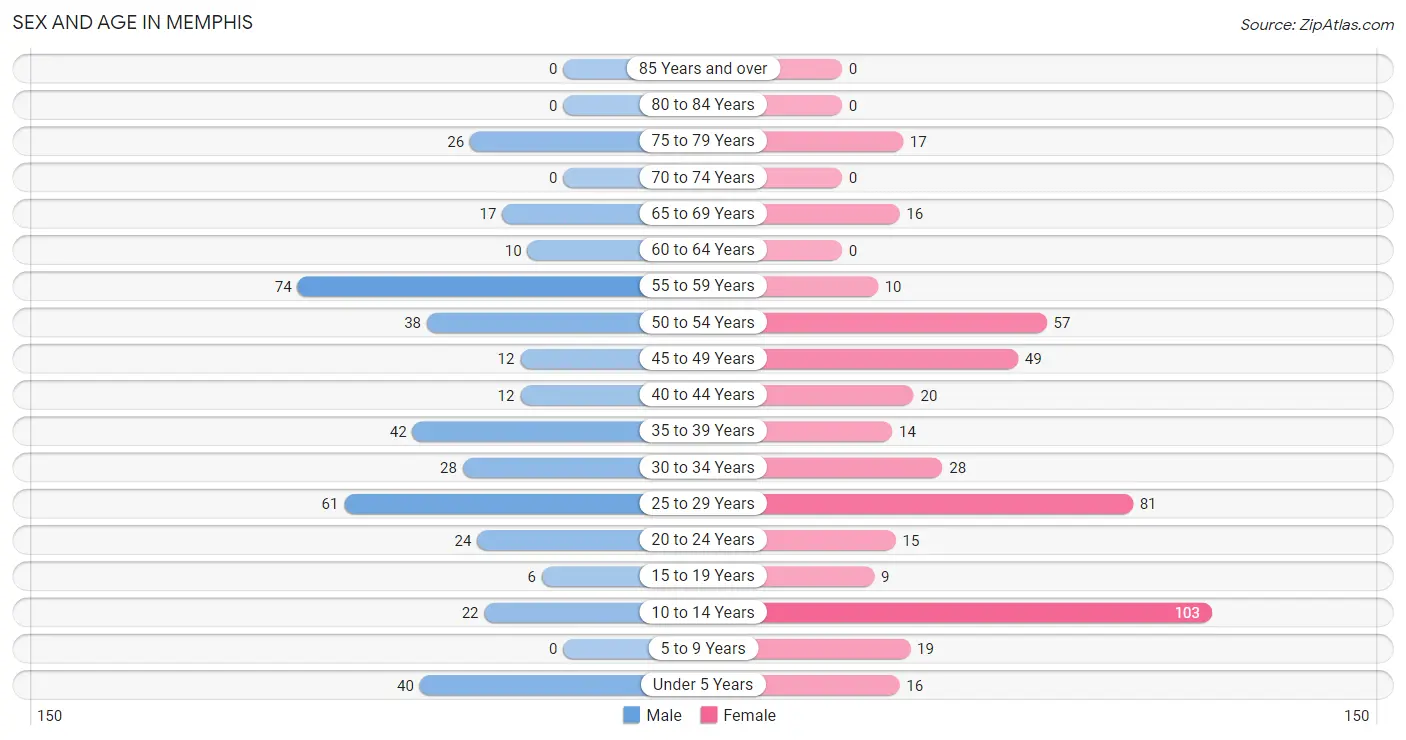
The most populous age groups in Memphis are 55 to 59 Years (74 | 18.0%) for men and 10 to 14 Years (103 | 22.7%) for women.
| Age Bracket | Male | Female |
| Under 5 Years | 40 (9.7%) | 16 (3.5%) |
| 5 to 9 Years | 0 (0.0%) | 19 (4.2%) |
| 10 to 14 Years | 22 (5.3%) | 103 (22.7%) |
| 15 to 19 Years | 6 (1.5%) | 9 (2.0%) |
| 20 to 24 Years | 24 (5.8%) | 15 (3.3%) |
| 25 to 29 Years | 61 (14.8%) | 81 (17.8%) |
| 30 to 34 Years | 28 (6.8%) | 28 (6.2%) |
| 35 to 39 Years | 42 (10.2%) | 14 (3.1%) |
| 40 to 44 Years | 12 (2.9%) | 20 (4.4%) |
| 45 to 49 Years | 12 (2.9%) | 49 (10.8%) |
| 50 to 54 Years | 38 (9.2%) | 57 (12.6%) |
| 55 to 59 Years | 74 (18.0%) | 10 (2.2%) |
| 60 to 64 Years | 10 (2.4%) | 0 (0.0%) |
| 65 to 69 Years | 17 (4.1%) | 16 (3.5%) |
| 70 to 74 Years | 0 (0.0%) | 0 (0.0%) |
| 75 to 79 Years | 26 (6.3%) | 17 (3.7%) |
| 80 to 84 Years | 0 (0.0%) | 0 (0.0%) |
| 85 Years and over | 0 (0.0%) | 0 (0.0%) |
| Total | 412 (100.0%) | 454 (100.0%) |
Families and Households in Memphis
Median Family Size in Memphis
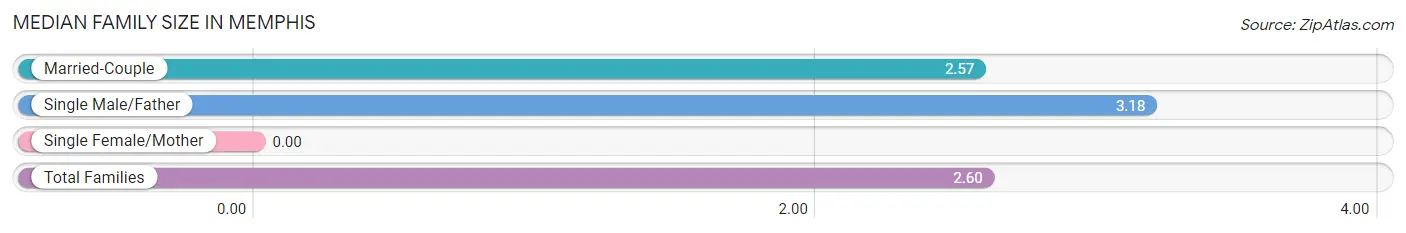
| Family Type | # Families | Family Size |
| Married-Couple | 306 (94.7%) | 2.57 |
| Single Male/Father | 17 (5.3%) | 3.18 |
| Single Female/Mother | 0 (0.0%) | - |
| Total Families | 323 (100.0%) | 2.60 |
Median Household Size in Memphis
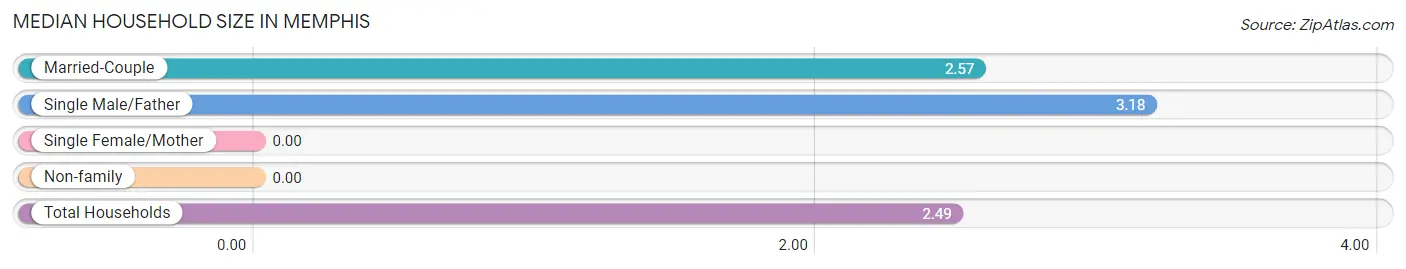
| Household Type | # Households | Household Size |
| Married-Couple | 306 (87.9%) | 2.57 |
| Single Male/Father | 17 (4.9%) | 3.18 |
| Single Female/Mother | 0 (0.0%) | - |
| Non-family | 25 (7.2%) | - |
| Total Households | 348 (100.0%) | 2.49 |
Household Size by Marriage Status in Memphis
Out of a total of 348 households in Memphis, 323 (92.8%) are family households, while 25 (7.2%) are nonfamily households. The most numerous type of family households are 2-person households, comprising 163, and the most common type of nonfamily households are 1-person households, comprising 25.
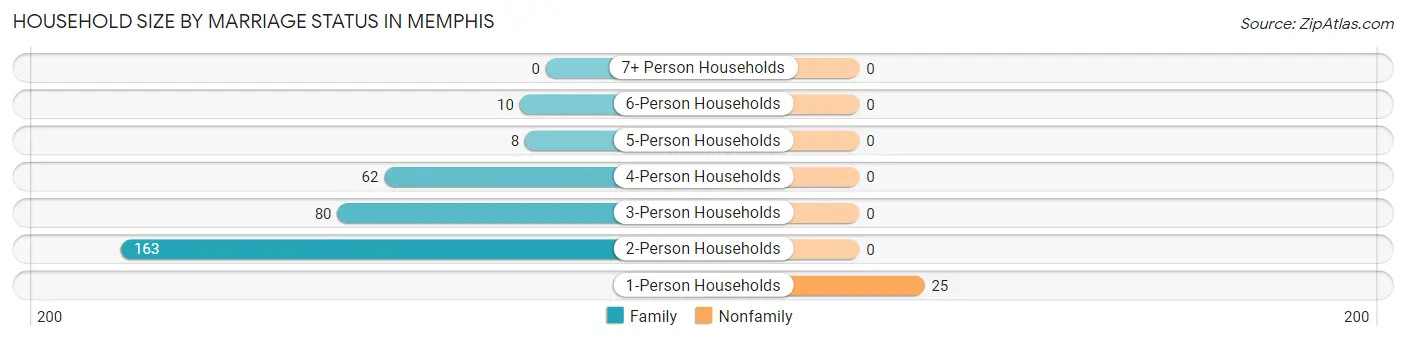
| Household Size | Family Households | Nonfamily Households |
| 1-Person Households | - | 25 (7.2%) |
| 2-Person Households | 163 (46.8%) | 0 (0.0%) |
| 3-Person Households | 80 (23.0%) | 0 (0.0%) |
| 4-Person Households | 62 (17.8%) | 0 (0.0%) |
| 5-Person Households | 8 (2.3%) | 0 (0.0%) |
| 6-Person Households | 10 (2.9%) | 0 (0.0%) |
| 7+ Person Households | 0 (0.0%) | 0 (0.0%) |
| Total | 323 (92.8%) | 25 (7.2%) |
Female Fertility in Memphis
Fertility by Age in Memphis
| Age Bracket | Women with Births | Births / 1,000 Women |
| 15 to 19 years | 0 (0.0%) | 0.0 |
| 20 to 34 years | 0 (0.0%) | 0.0 |
| 35 to 50 years | 0 (0.0%) | 0.0 |
| Total | 0 (0.0%) | 0.0 |
Fertility by Age by Marriage Status in Memphis
| Age Bracket | Married | Unmarried |
| 15 to 19 years | 0 (0.0%) | 0 (0.0%) |
| 20 to 34 years | 0 (0.0%) | 0 (0.0%) |
| 35 to 50 years | 0 (0.0%) | 0 (0.0%) |
| Total | 0 (0.0%) | 0 (0.0%) |
Fertility by Education in Memphis
| Educational Attainment | Women with Births | Births / 1,000 Women |
| Less than High School | 0 (0.0%) | 0.0 |
| High School Diploma | 0 (0.0%) | 0.0 |
| College or Associate's Degree | 0 (0.0%) | 0.0 |
| Bachelor's Degree | 0 (0.0%) | 0.0 |
| Graduate Degree | 0 (0.0%) | 0.0 |
| Total | 0 (0.0%) | 0.0 |
Fertility by Education by Marriage Status in Memphis
| Educational Attainment | Married | Unmarried |
| Less than High School | 0 (0.0%) | 0 (0.0%) |
| High School Diploma | 0 (0.0%) | 0 (0.0%) |
| College or Associate's Degree | 0 (0.0%) | 0 (0.0%) |
| Bachelor's Degree | 0 (0.0%) | 0 (0.0%) |
| Graduate Degree | 0 (0.0%) | 0 (0.0%) |
| Total | 0 (0.0%) | 0 (0.0%) |
Employment Characteristics in Memphis
Employment by Class of Employer in Memphis
Among the 575 employed individuals in Memphis, private company employees (415 | 72.2%), not-for-profit organizations (80 | 13.9%), and self-employed (incorporated) (52 | 9.0%) make up the most common classes of employment.
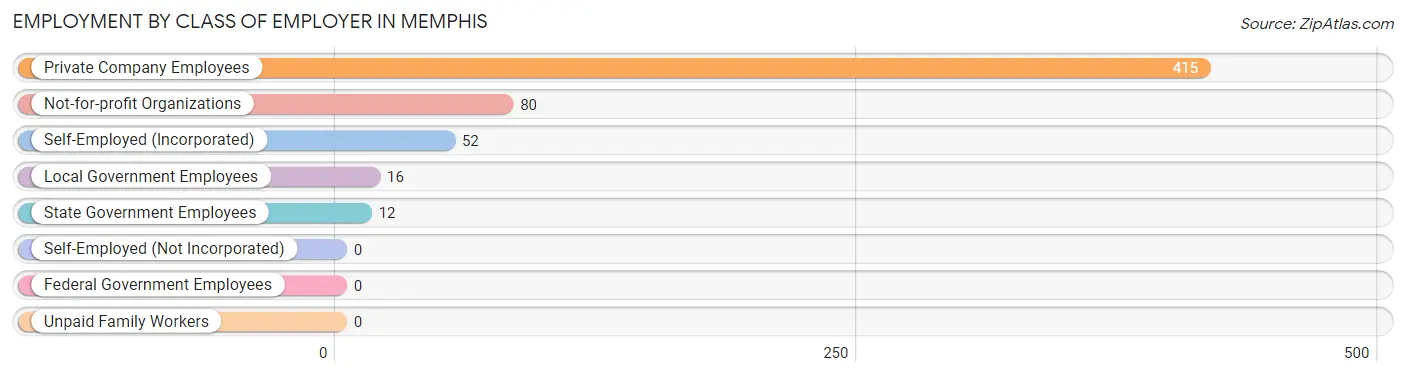
| Employer Class | # Employees | % Employees |
| Private Company Employees | 415 | 72.2% |
| Self-Employed (Incorporated) | 52 | 9.0% |
| Self-Employed (Not Incorporated) | 0 | 0.0% |
| Not-for-profit Organizations | 80 | 13.9% |
| Local Government Employees | 16 | 2.8% |
| State Government Employees | 12 | 2.1% |
| Federal Government Employees | 0 | 0.0% |
| Unpaid Family Workers | 0 | 0.0% |
| Total | 575 | 100.0% |
Employment Status by Age in Memphis
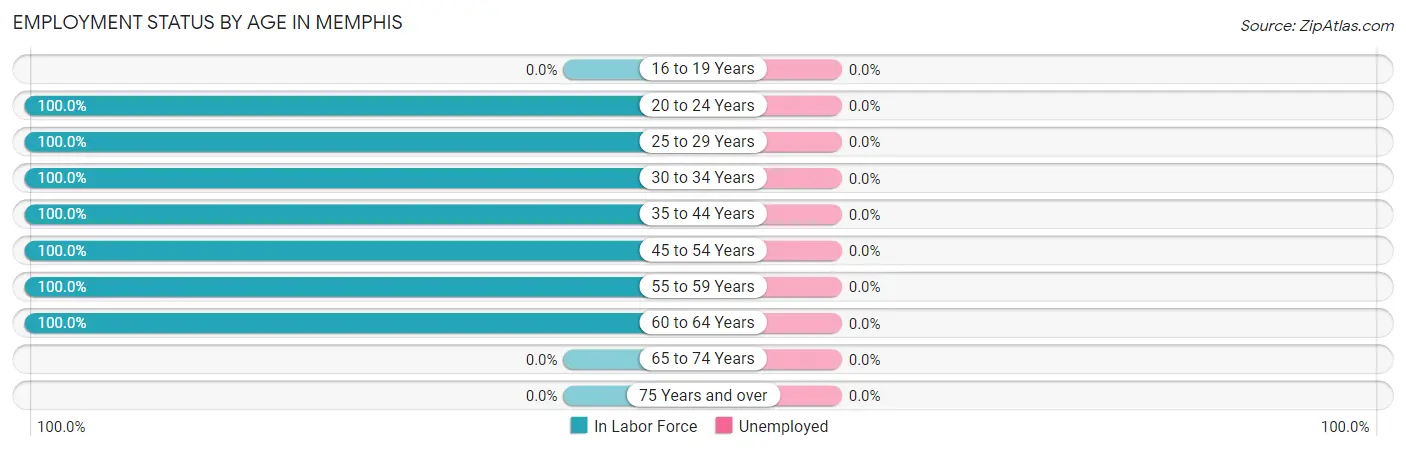
| Age Bracket | In Labor Force | Unemployed |
| 16 to 19 Years | 0 (0.0%) | 0 (0.0%) |
| 20 to 24 Years | 39 (100.0%) | 0 (0.0%) |
| 25 to 29 Years | 142 (100.0%) | 0 (0.0%) |
| 30 to 34 Years | 56 (100.0%) | 0 (0.0%) |
| 35 to 44 Years | 88 (100.0%) | 0 (0.0%) |
| 45 to 54 Years | 156 (100.0%) | 0 (0.0%) |
| 55 to 59 Years | 84 (100.0%) | 0 (0.0%) |
| 60 to 64 Years | 10 (100.0%) | 0 (0.0%) |
| 65 to 74 Years | 0 (0.0%) | 0 (0.0%) |
| 75 Years and over | 0 (0.0%) | 0 (0.0%) |
| Total | 575 (88.3%) | 0 (0.0%) |
Employment Status by Educational Attainment in Memphis
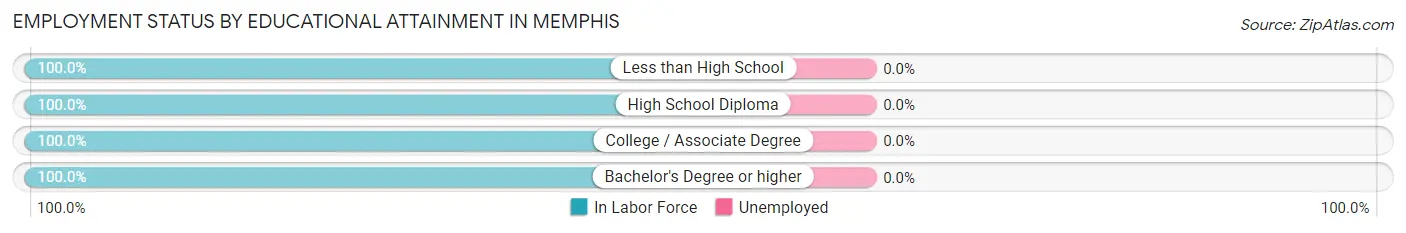
| Educational Attainment | In Labor Force | Unemployed |
| Less than High School | 45 (100.0%) | 0 (0.0%) |
| High School Diploma | 44 (100.0%) | 0 (0.0%) |
| College / Associate Degree | 325 (100.0%) | 0 (0.0%) |
| Bachelor's Degree or higher | 122 (100.0%) | 0 (0.0%) |
| Total | 536 (100.0%) | 0 (0.0%) |
Employment Occupations by Sex in Memphis
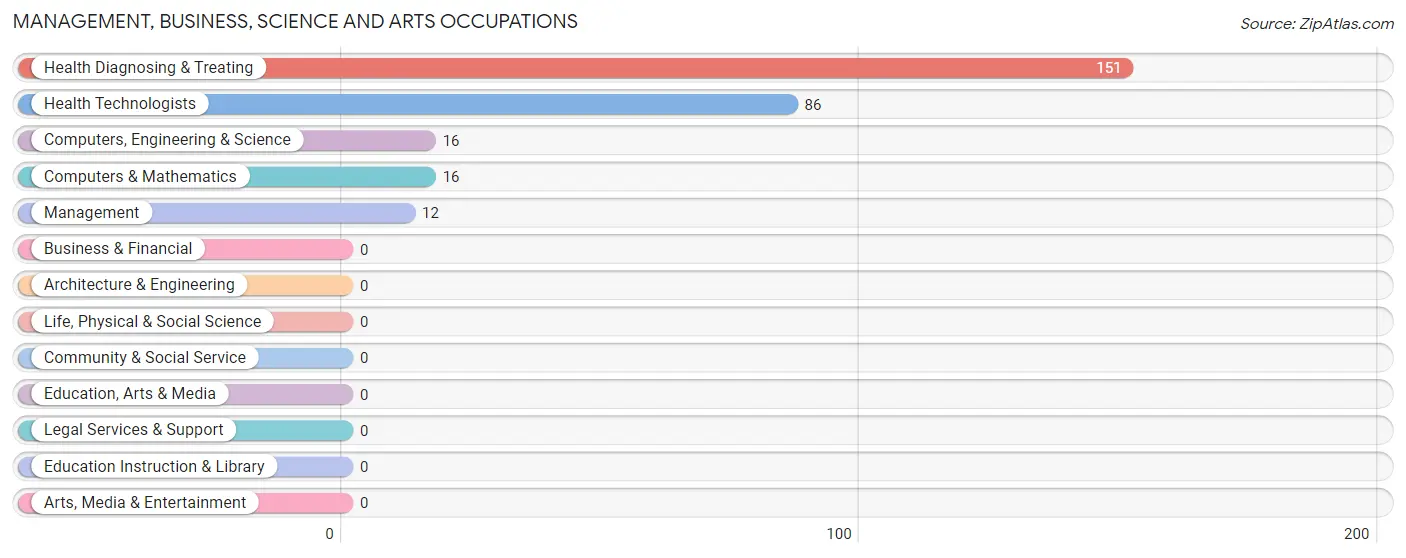
Management, Business, Science and Arts Occupations
The most common Management, Business, Science and Arts occupations in Memphis are Health Diagnosing & Treating (151 | 26.3%), Health Technologists (86 | 15.0%), Computers, Engineering & Science (16 | 2.8%), Computers & Mathematics (16 | 2.8%), and Management (12 | 2.1%).
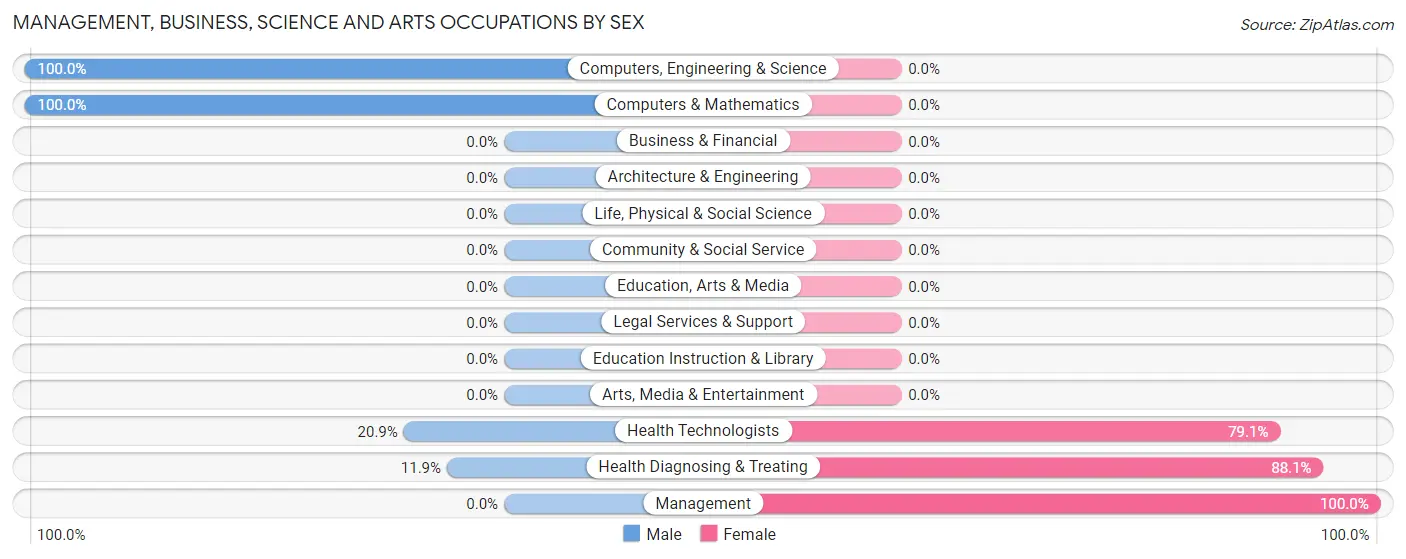
Management, Business, Science and Arts Occupations by Sex
Within the Management, Business, Science and Arts occupations in Memphis, the most male-oriented occupations are Computers, Engineering & Science (100.0%), Computers & Mathematics (100.0%), and Health Technologists (20.9%), while the most female-oriented occupations are Management (100.0%), Health Diagnosing & Treating (88.1%), and Health Technologists (79.1%).
| Occupation | Male | Female |
| Management | 0 (0.0%) | 12 (100.0%) |
| Business & Financial | 0 (0.0%) | 0 (0.0%) |
| Computers, Engineering & Science | 16 (100.0%) | 0 (0.0%) |
| Computers & Mathematics | 16 (100.0%) | 0 (0.0%) |
| Architecture & Engineering | 0 (0.0%) | 0 (0.0%) |
| Life, Physical & Social Science | 0 (0.0%) | 0 (0.0%) |
| Community & Social Service | 0 (0.0%) | 0 (0.0%) |
| Education, Arts & Media | 0 (0.0%) | 0 (0.0%) |
| Legal Services & Support | 0 (0.0%) | 0 (0.0%) |
| Education Instruction & Library | 0 (0.0%) | 0 (0.0%) |
| Arts, Media & Entertainment | 0 (0.0%) | 0 (0.0%) |
| Health Diagnosing & Treating | 18 (11.9%) | 133 (88.1%) |
| Health Technologists | 18 (20.9%) | 68 (79.1%) |
| Total (Category) | 34 (19.0%) | 145 (81.0%) |
| Total (Overall) | 301 (52.3%) | 274 (47.6%) |
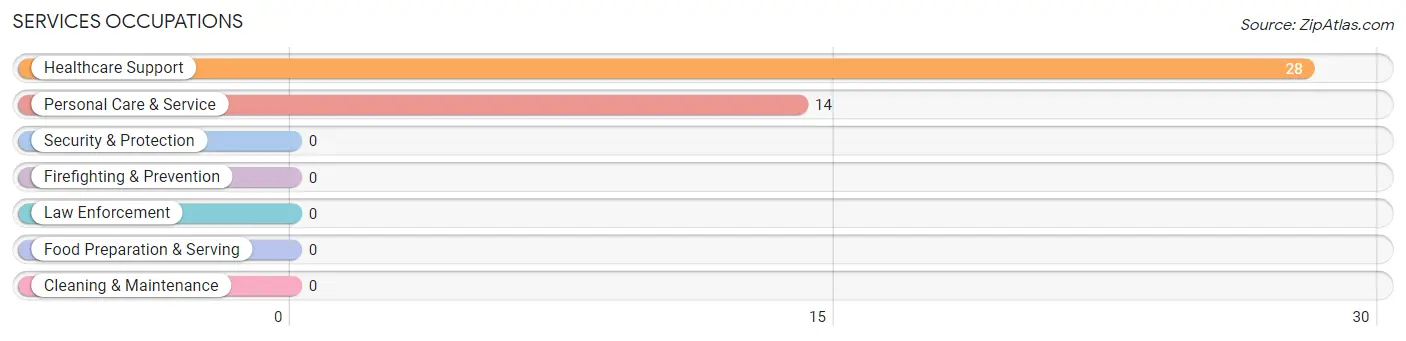
Services Occupations
The most common Services occupations in Memphis are Healthcare Support (28 | 4.9%), and Personal Care & Service (14 | 2.4%).
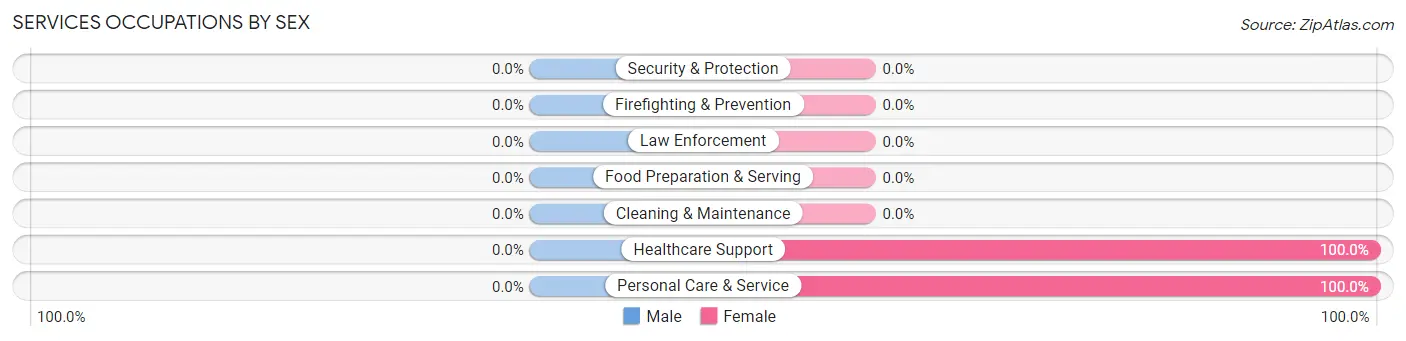
Services Occupations by Sex
| Occupation | Male | Female |
| Healthcare Support | 0 (0.0%) | 28 (100.0%) |
| Security & Protection | 0 (0.0%) | 0 (0.0%) |
| Firefighting & Prevention | 0 (0.0%) | 0 (0.0%) |
| Law Enforcement | 0 (0.0%) | 0 (0.0%) |
| Food Preparation & Serving | 0 (0.0%) | 0 (0.0%) |
| Cleaning & Maintenance | 0 (0.0%) | 0 (0.0%) |
| Personal Care & Service | 0 (0.0%) | 14 (100.0%) |
| Total (Category) | 0 (0.0%) | 42 (100.0%) |
| Total (Overall) | 301 (52.3%) | 274 (47.6%) |
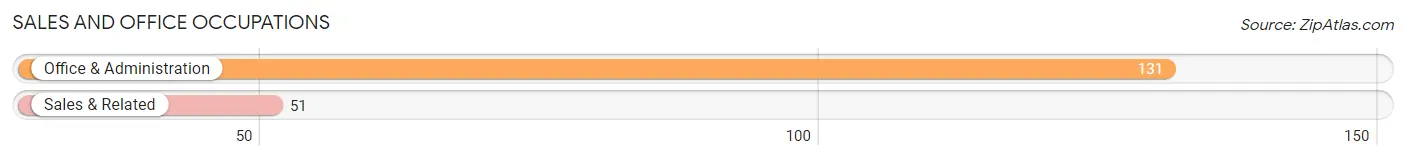
Sales and Office Occupations
The most common Sales and Office occupations in Memphis are Office & Administration (131 | 22.8%), and Sales & Related (51 | 8.9%).
Sales and Office Occupations by Sex
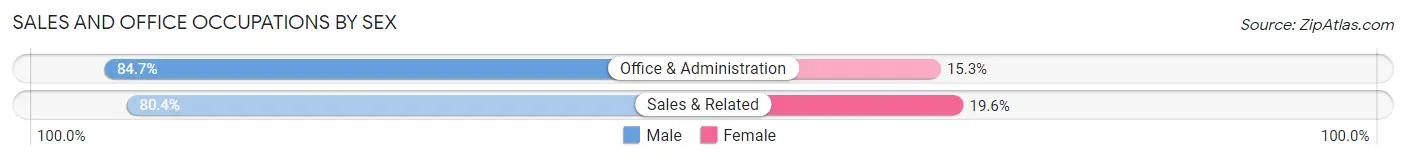
| Occupation | Male | Female |
| Sales & Related | 41 (80.4%) | 10 (19.6%) |
| Office & Administration | 111 (84.7%) | 20 (15.3%) |
| Total (Category) | 152 (83.5%) | 30 (16.5%) |
| Total (Overall) | 301 (52.3%) | 274 (47.6%) |
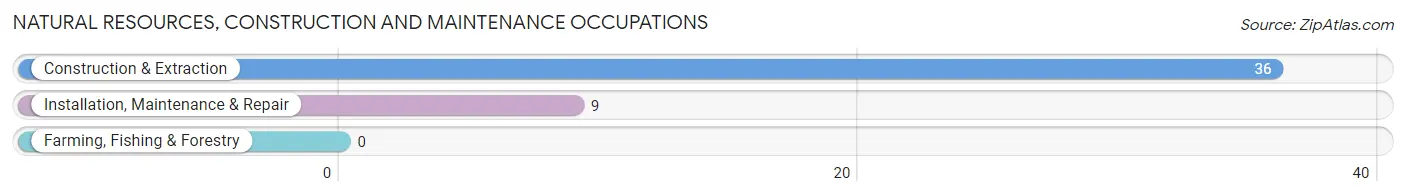
Natural Resources, Construction and Maintenance Occupations
The most common Natural Resources, Construction and Maintenance occupations in Memphis are Construction & Extraction (36 | 6.3%), and Installation, Maintenance & Repair (9 | 1.6%).
Natural Resources, Construction and Maintenance Occupations by Sex
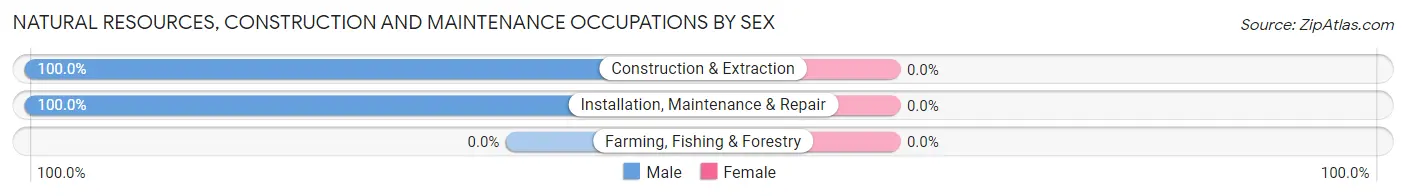
| Occupation | Male | Female |
| Farming, Fishing & Forestry | 0 (0.0%) | 0 (0.0%) |
| Construction & Extraction | 36 (100.0%) | 0 (0.0%) |
| Installation, Maintenance & Repair | 9 (100.0%) | 0 (0.0%) |
| Total (Category) | 45 (100.0%) | 0 (0.0%) |
| Total (Overall) | 301 (52.3%) | 274 (47.6%) |
Production, Transportation and Moving Occupations
The most common Production, Transportation and Moving occupations in Memphis are Transportation (60 | 10.4%), Production (57 | 9.9%), and Material Moving (10 | 1.7%).
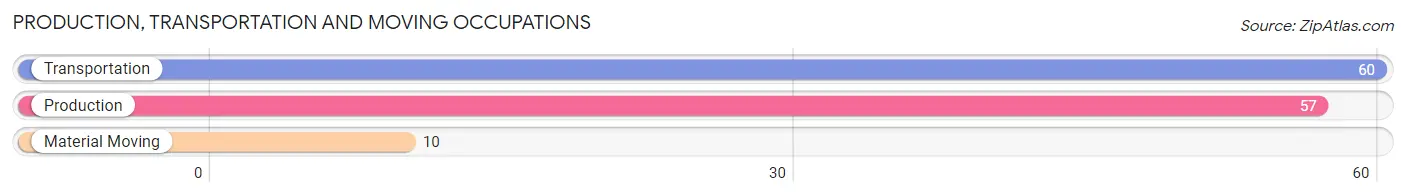
Production, Transportation and Moving Occupations by Sex
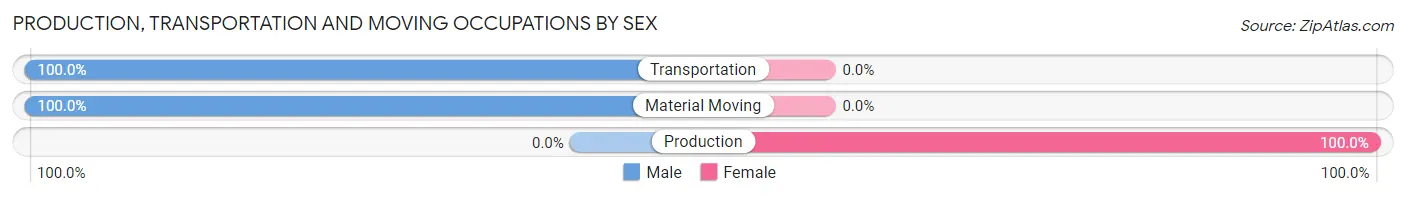
| Occupation | Male | Female |
| Production | 0 (0.0%) | 57 (100.0%) |
| Transportation | 60 (100.0%) | 0 (0.0%) |
| Material Moving | 10 (100.0%) | 0 (0.0%) |
| Total (Category) | 70 (55.1%) | 57 (44.9%) |
| Total (Overall) | 301 (52.3%) | 274 (47.6%) |
Employment Industries by Sex in Memphis
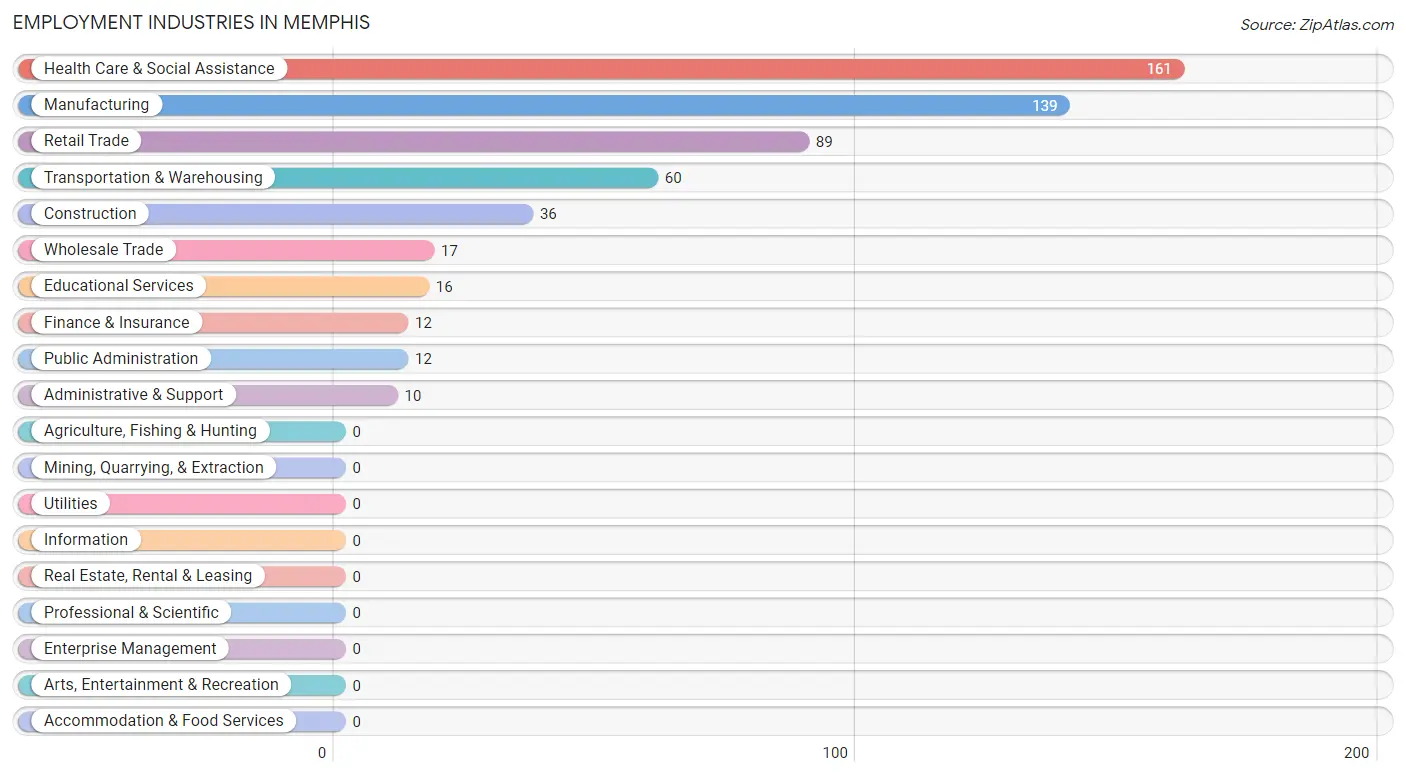
Employment Industries in Memphis
The major employment industries in Memphis include Health Care & Social Assistance (161 | 28.0%), Manufacturing (139 | 24.2%), Retail Trade (89 | 15.5%), Transportation & Warehousing (60 | 10.4%), and Construction (36 | 6.3%).
Employment Industries by Sex in Memphis
The Memphis industries that see more men than women are Construction (100.0%), Wholesale Trade (100.0%), and Retail Trade (100.0%), whereas the industries that tend to have a higher number of women are Finance & Insurance (100.0%), Administrative & Support (100.0%), and Health Care & Social Assistance (100.0%).
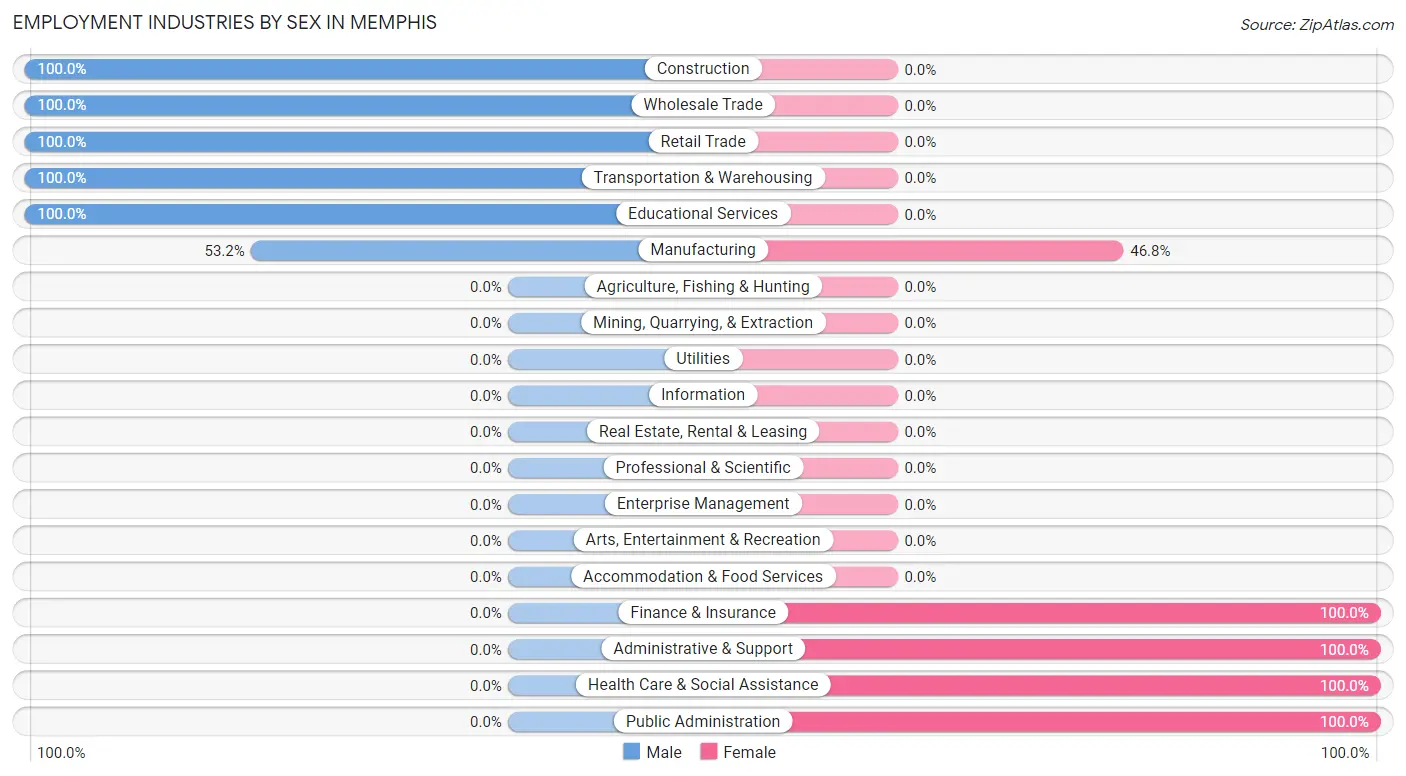
| Industry | Male | Female |
| Agriculture, Fishing & Hunting | 0 (0.0%) | 0 (0.0%) |
| Mining, Quarrying, & Extraction | 0 (0.0%) | 0 (0.0%) |
| Construction | 36 (100.0%) | 0 (0.0%) |
| Manufacturing | 74 (53.2%) | 65 (46.8%) |
| Wholesale Trade | 17 (100.0%) | 0 (0.0%) |
| Retail Trade | 89 (100.0%) | 0 (0.0%) |
| Transportation & Warehousing | 60 (100.0%) | 0 (0.0%) |
| Utilities | 0 (0.0%) | 0 (0.0%) |
| Information | 0 (0.0%) | 0 (0.0%) |
| Finance & Insurance | 0 (0.0%) | 12 (100.0%) |
| Real Estate, Rental & Leasing | 0 (0.0%) | 0 (0.0%) |
| Professional & Scientific | 0 (0.0%) | 0 (0.0%) |
| Enterprise Management | 0 (0.0%) | 0 (0.0%) |
| Administrative & Support | 0 (0.0%) | 10 (100.0%) |
| Educational Services | 16 (100.0%) | 0 (0.0%) |
| Health Care & Social Assistance | 0 (0.0%) | 161 (100.0%) |
| Arts, Entertainment & Recreation | 0 (0.0%) | 0 (0.0%) |
| Accommodation & Food Services | 0 (0.0%) | 0 (0.0%) |
| Public Administration | 0 (0.0%) | 12 (100.0%) |
| Total | 301 (52.3%) | 274 (47.6%) |
Education in Memphis
School Enrollment in Memphis
The most common levels of schooling among the 240 students in Memphis are middle school (114 | 47.5%), college / undergraduate (62 | 25.8%), and elementary school (30 | 12.5%).
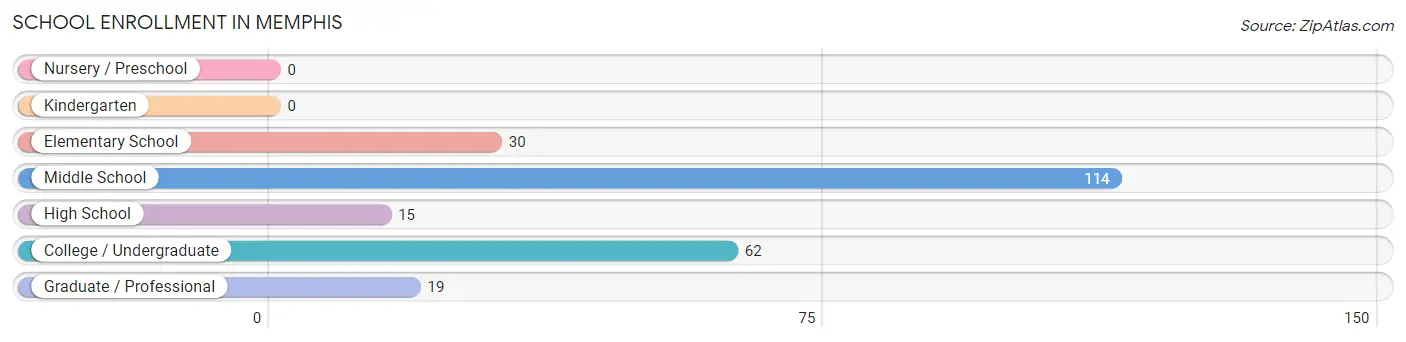
| School Level | # Students | % Students |
| Nursery / Preschool | 0 | 0.0% |
| Kindergarten | 0 | 0.0% |
| Elementary School | 30 | 12.5% |
| Middle School | 114 | 47.5% |
| High School | 15 | 6.2% |
| College / Undergraduate | 62 | 25.8% |
| Graduate / Professional | 19 | 7.9% |
| Total | 240 | 100.0% |
School Enrollment by Age by Funding Source in Memphis
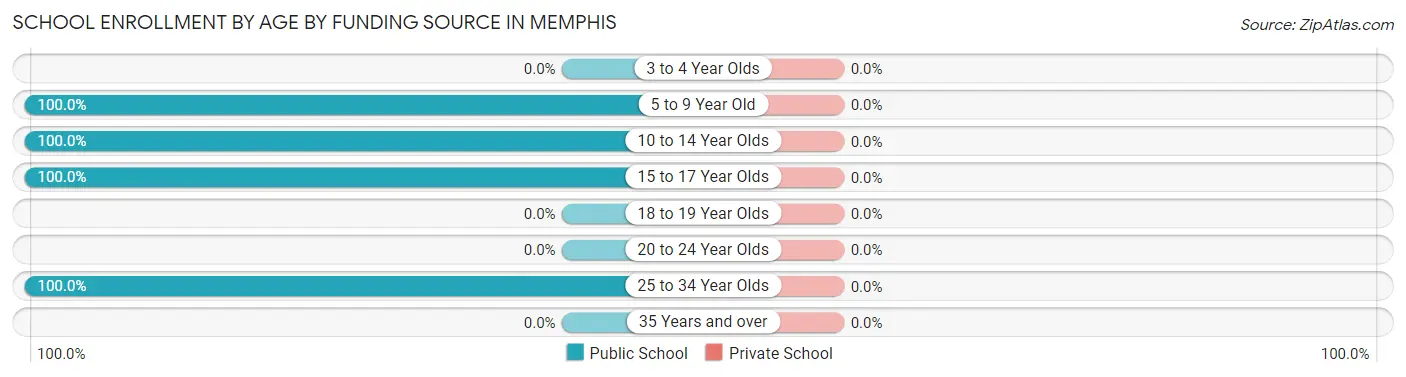
| Age Bracket | Public School | Private School |
| 3 to 4 Year Olds | 0 (0.0%) | 0 (0.0%) |
| 5 to 9 Year Old | 19 (100.0%) | 0 (0.0%) |
| 10 to 14 Year Olds | 125 (100.0%) | 0 (0.0%) |
| 15 to 17 Year Olds | 15 (100.0%) | 0 (0.0%) |
| 18 to 19 Year Olds | 0 (0.0%) | 0 (0.0%) |
| 20 to 24 Year Olds | 0 (0.0%) | 0 (0.0%) |
| 25 to 34 Year Olds | 81 (100.0%) | 0 (0.0%) |
| 35 Years and over | 0 (0.0%) | 0 (0.0%) |
| Total | 240 (100.0%) | 0 (0.0%) |
Educational Attainment by Field of Study in Memphis
Science & technology (53 | 43.4%), liberal arts & history (47 | 38.5%), engineering (12 | 9.8%), and business (10 | 8.2%) are the most common fields of study among 122 individuals in Memphis who have obtained a bachelor's degree or higher.
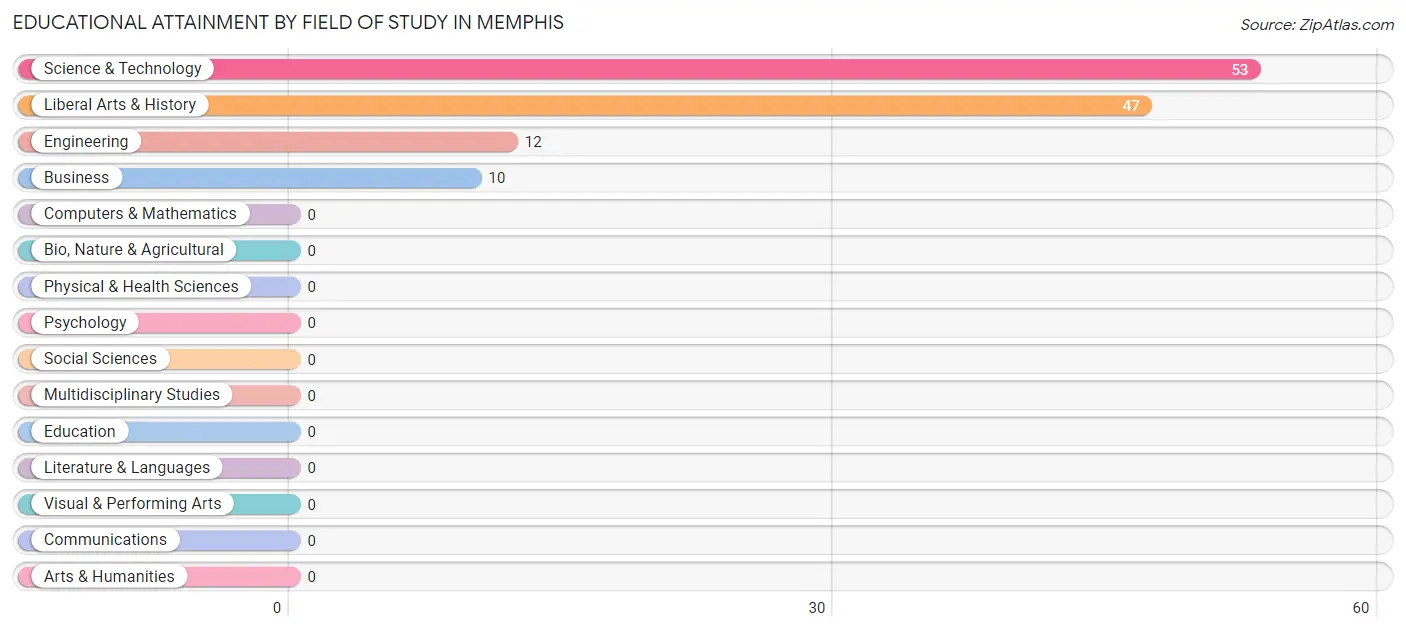
| Field of Study | # Graduates | % Graduates |
| Computers & Mathematics | 0 | 0.0% |
| Bio, Nature & Agricultural | 0 | 0.0% |
| Physical & Health Sciences | 0 | 0.0% |
| Psychology | 0 | 0.0% |
| Social Sciences | 0 | 0.0% |
| Engineering | 12 | 9.8% |
| Multidisciplinary Studies | 0 | 0.0% |
| Science & Technology | 53 | 43.4% |
| Business | 10 | 8.2% |
| Education | 0 | 0.0% |
| Literature & Languages | 0 | 0.0% |
| Liberal Arts & History | 47 | 38.5% |
| Visual & Performing Arts | 0 | 0.0% |
| Communications | 0 | 0.0% |
| Arts & Humanities | 0 | 0.0% |
| Total | 122 | 100.0% |
Transportation & Commute in Memphis
Vehicle Availability by Sex in Memphis
The most prevalent vehicle ownership categories in Memphis are males with 2 vehicles (188, accounting for 62.5%) and females with 2 vehicles (197, making up 68.6%).
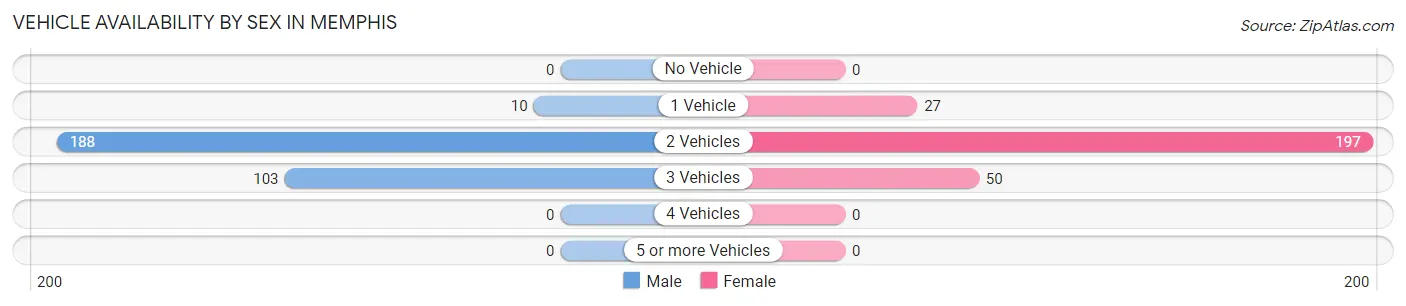
| Vehicles Available | Male | Female |
| No Vehicle | 0 (0.0%) | 0 (0.0%) |
| 1 Vehicle | 10 (3.3%) | 27 (9.9%) |
| 2 Vehicles | 188 (62.5%) | 197 (71.9%) |
| 3 Vehicles | 103 (34.2%) | 50 (18.2%) |
| 4 Vehicles | 0 (0.0%) | 0 (0.0%) |
| 5 or more Vehicles | 0 (0.0%) | 0 (0.0%) |
| Total | 301 (100.0%) | 274 (100.0%) |
Commute Time in Memphis
The most frequently occuring commute durations in Memphis are 20 to 24 minutes (138 commuters, 24.9%), 25 to 29 minutes (131 commuters, 23.6%), and 30 to 34 minutes (112 commuters, 20.2%).
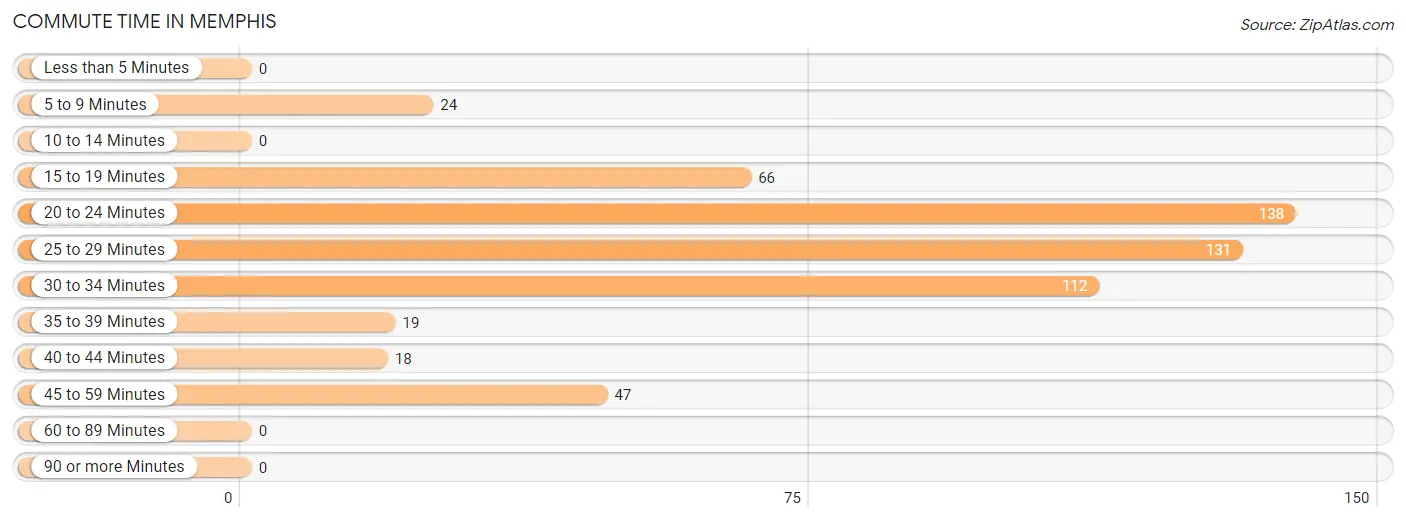
| Commute Time | # Commuters | % Commuters |
| Less than 5 Minutes | 0 | 0.0% |
| 5 to 9 Minutes | 24 | 4.3% |
| 10 to 14 Minutes | 0 | 0.0% |
| 15 to 19 Minutes | 66 | 11.9% |
| 20 to 24 Minutes | 138 | 24.9% |
| 25 to 29 Minutes | 131 | 23.6% |
| 30 to 34 Minutes | 112 | 20.2% |
| 35 to 39 Minutes | 19 | 3.4% |
| 40 to 44 Minutes | 18 | 3.2% |
| 45 to 59 Minutes | 47 | 8.5% |
| 60 to 89 Minutes | 0 | 0.0% |
| 90 or more Minutes | 0 | 0.0% |
Commute Time by Sex in Memphis
The most common commute times in Memphis are 25 to 29 minutes (74 commuters, 24.6%) for males and 20 to 24 minutes (110 commuters, 43.3%) for females.
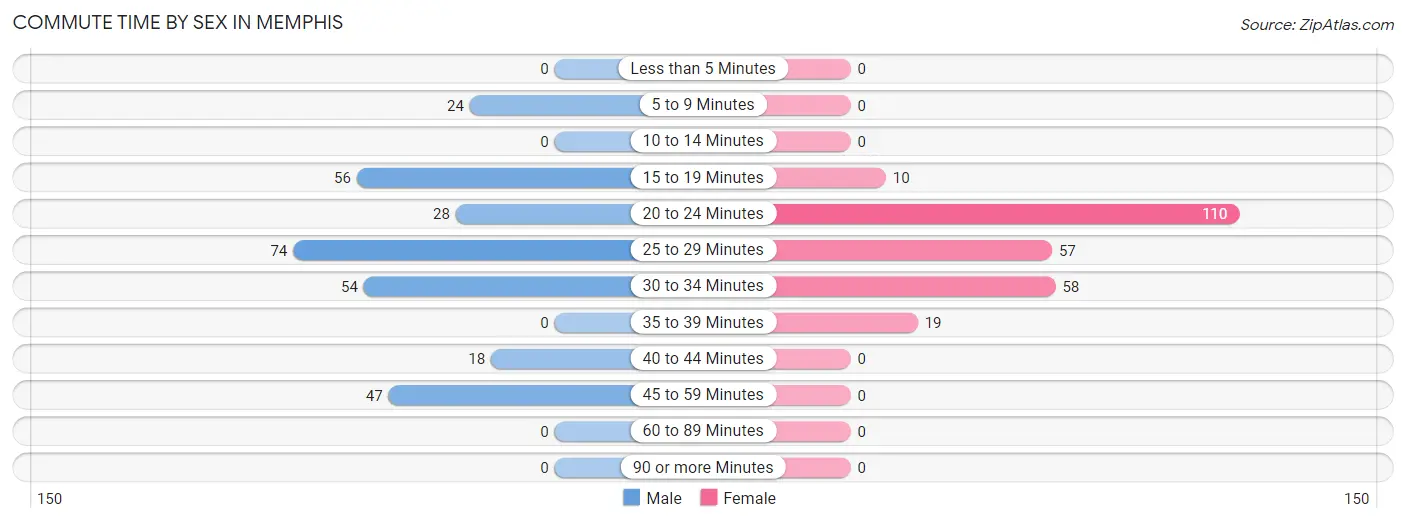
| Commute Time | Male | Female |
| Less than 5 Minutes | 0 (0.0%) | 0 (0.0%) |
| 5 to 9 Minutes | 24 (8.0%) | 0 (0.0%) |
| 10 to 14 Minutes | 0 (0.0%) | 0 (0.0%) |
| 15 to 19 Minutes | 56 (18.6%) | 10 (3.9%) |
| 20 to 24 Minutes | 28 (9.3%) | 110 (43.3%) |
| 25 to 29 Minutes | 74 (24.6%) | 57 (22.4%) |
| 30 to 34 Minutes | 54 (17.9%) | 58 (22.8%) |
| 35 to 39 Minutes | 0 (0.0%) | 19 (7.5%) |
| 40 to 44 Minutes | 18 (6.0%) | 0 (0.0%) |
| 45 to 59 Minutes | 47 (15.6%) | 0 (0.0%) |
| 60 to 89 Minutes | 0 (0.0%) | 0 (0.0%) |
| 90 or more Minutes | 0 (0.0%) | 0 (0.0%) |
Time of Departure to Work by Sex in Memphis
The most frequent times of departure to work in Memphis are 5:30 AM to 5:59 AM (86, 28.6%) for males and 7:00 AM to 7:29 AM (61, 24.0%) for females.
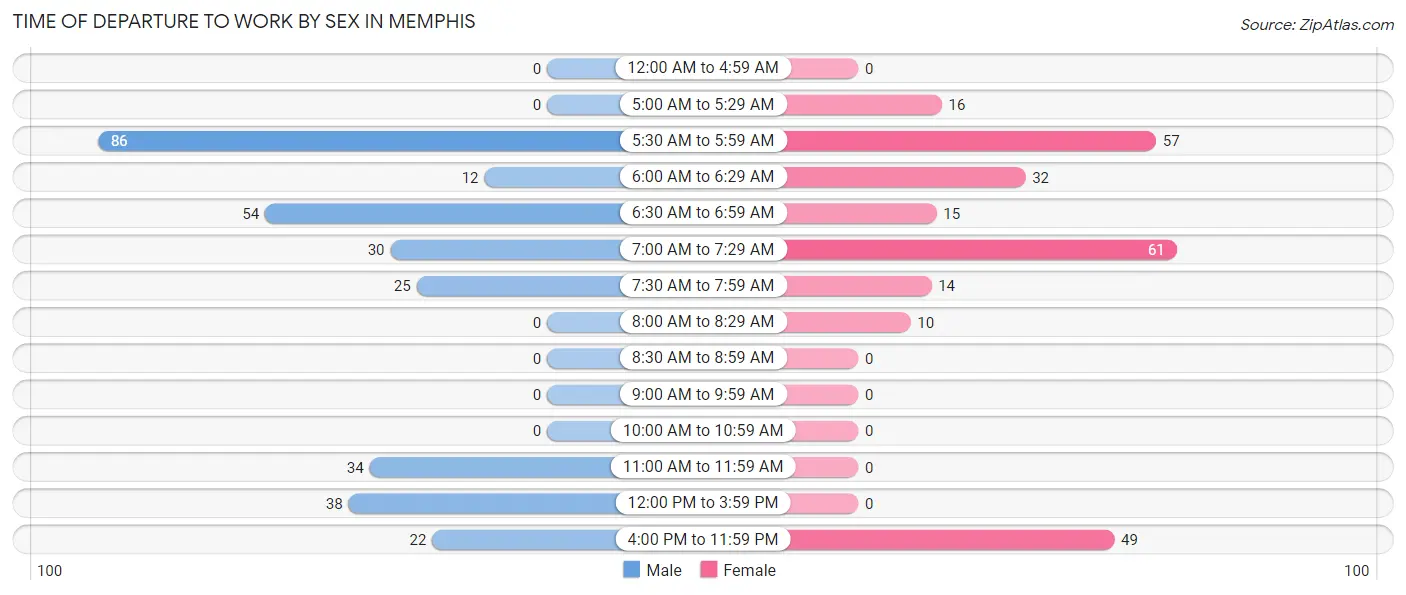
| Time of Departure | Male | Female |
| 12:00 AM to 4:59 AM | 0 (0.0%) | 0 (0.0%) |
| 5:00 AM to 5:29 AM | 0 (0.0%) | 16 (6.3%) |
| 5:30 AM to 5:59 AM | 86 (28.6%) | 57 (22.4%) |
| 6:00 AM to 6:29 AM | 12 (4.0%) | 32 (12.6%) |
| 6:30 AM to 6:59 AM | 54 (17.9%) | 15 (5.9%) |
| 7:00 AM to 7:29 AM | 30 (10.0%) | 61 (24.0%) |
| 7:30 AM to 7:59 AM | 25 (8.3%) | 14 (5.5%) |
| 8:00 AM to 8:29 AM | 0 (0.0%) | 10 (3.9%) |
| 8:30 AM to 8:59 AM | 0 (0.0%) | 0 (0.0%) |
| 9:00 AM to 9:59 AM | 0 (0.0%) | 0 (0.0%) |
| 10:00 AM to 10:59 AM | 0 (0.0%) | 0 (0.0%) |
| 11:00 AM to 11:59 AM | 34 (11.3%) | 0 (0.0%) |
| 12:00 PM to 3:59 PM | 38 (12.6%) | 0 (0.0%) |
| 4:00 PM to 11:59 PM | 22 (7.3%) | 49 (19.3%) |
| Total | 301 (100.0%) | 254 (100.0%) |
Housing Occupancy in Memphis
Occupancy by Ownership in Memphis
Of the total 348 dwellings in Memphis, owner-occupied units account for 323 (92.8%), while renter-occupied units make up 25 (7.2%).
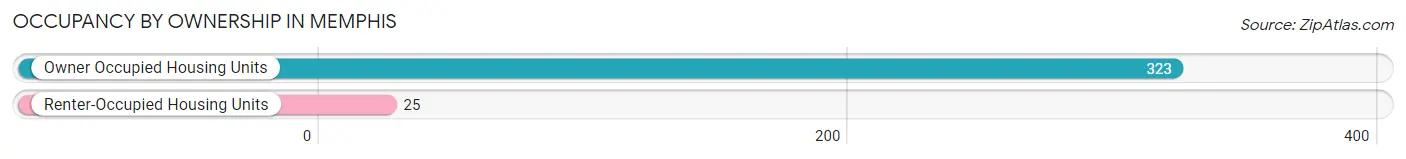
| Occupancy | # Housing Units | % Housing Units |
| Owner Occupied Housing Units | 323 | 92.8% |
| Renter-Occupied Housing Units | 25 | 7.2% |
| Total Occupied Housing Units | 348 | 100.0% |
Occupancy by Household Size in Memphis
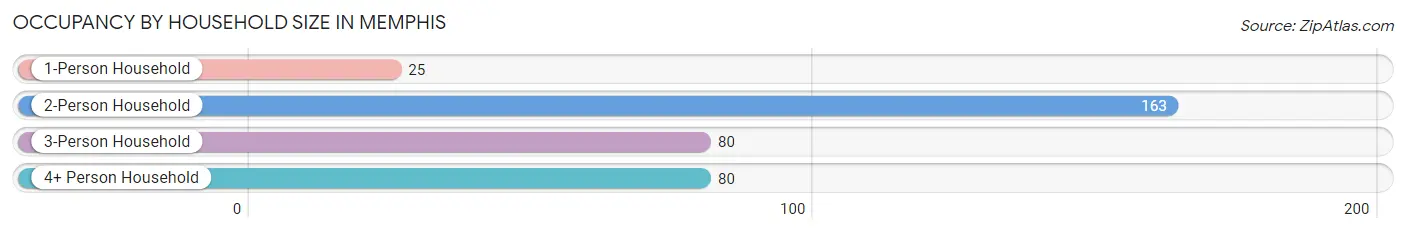
| Household Size | # Housing Units | % Housing Units |
| 1-Person Household | 25 | 7.2% |
| 2-Person Household | 163 | 46.8% |
| 3-Person Household | 80 | 23.0% |
| 4+ Person Household | 80 | 23.0% |
| Total Housing Units | 348 | 100.0% |
Occupancy by Ownership by Household Size in Memphis
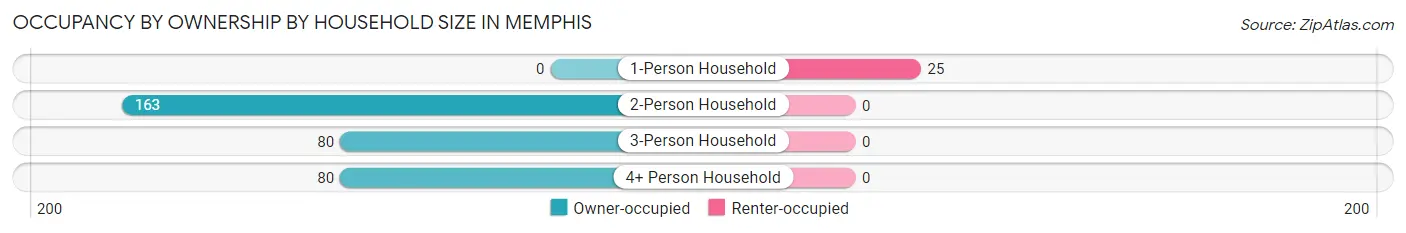
| Household Size | Owner-occupied | Renter-occupied |
| 1-Person Household | 0 (0.0%) | 25 (100.0%) |
| 2-Person Household | 163 (100.0%) | 0 (0.0%) |
| 3-Person Household | 80 (100.0%) | 0 (0.0%) |
| 4+ Person Household | 80 (100.0%) | 0 (0.0%) |
| Total Housing Units | 323 (92.8%) | 25 (7.2%) |
Occupancy by Educational Attainment in Memphis
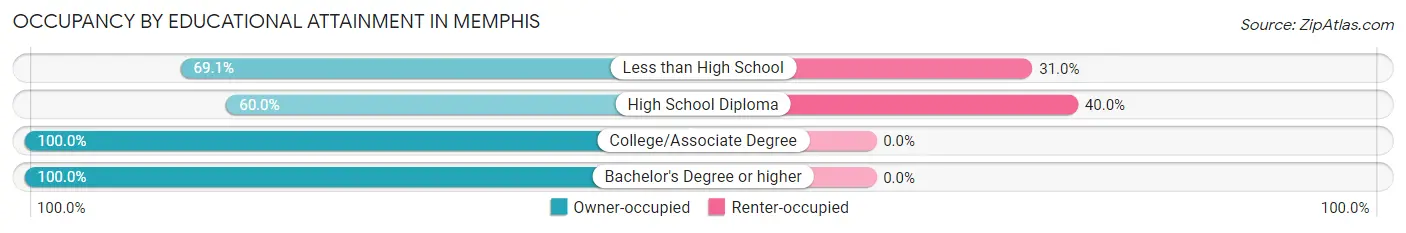
| Household Size | Owner-occupied | Renter-occupied |
| Less than High School | 29 (69.1%) | 13 (30.9%) |
| High School Diploma | 18 (60.0%) | 12 (40.0%) |
| College/Associate Degree | 247 (100.0%) | 0 (0.0%) |
| Bachelor's Degree or higher | 29 (100.0%) | 0 (0.0%) |
Occupancy by Age of Householder in Memphis
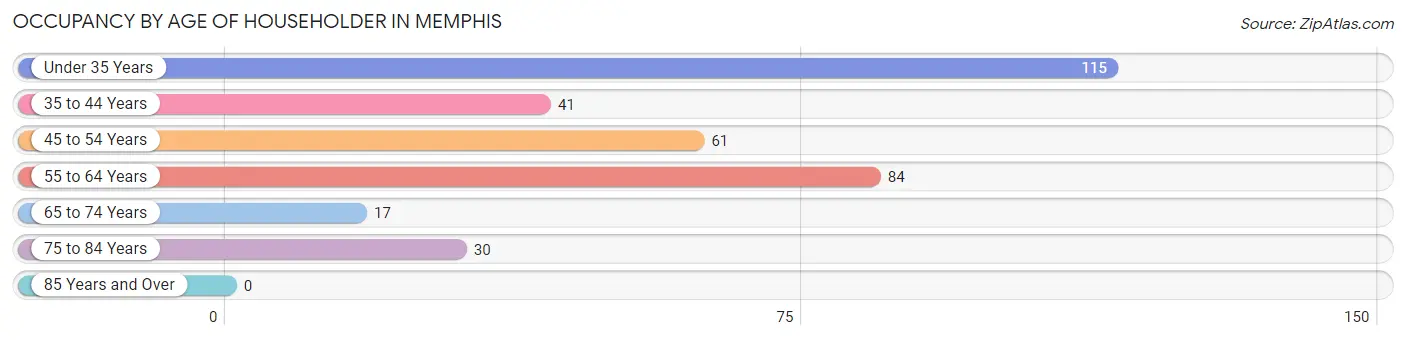
| Age Bracket | # Households | % Households |
| Under 35 Years | 115 | 33.1% |
| 35 to 44 Years | 41 | 11.8% |
| 45 to 54 Years | 61 | 17.5% |
| 55 to 64 Years | 84 | 24.1% |
| 65 to 74 Years | 17 | 4.9% |
| 75 to 84 Years | 30 | 8.6% |
| 85 Years and Over | 0 | 0.0% |
| Total | 348 | 100.0% |
Housing Finances in Memphis
Median Income by Occupancy in Memphis
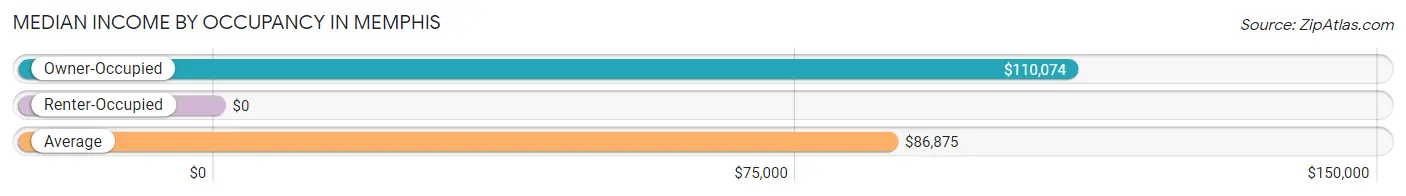
| Occupancy Type | # Households | Median Income |
| Owner-Occupied | 323 (92.8%) | $110,074 |
| Renter-Occupied | 25 (7.2%) | $0 |
| Average | 348 (100.0%) | $86,875 |
Occupancy by Householder Income Bracket in Memphis
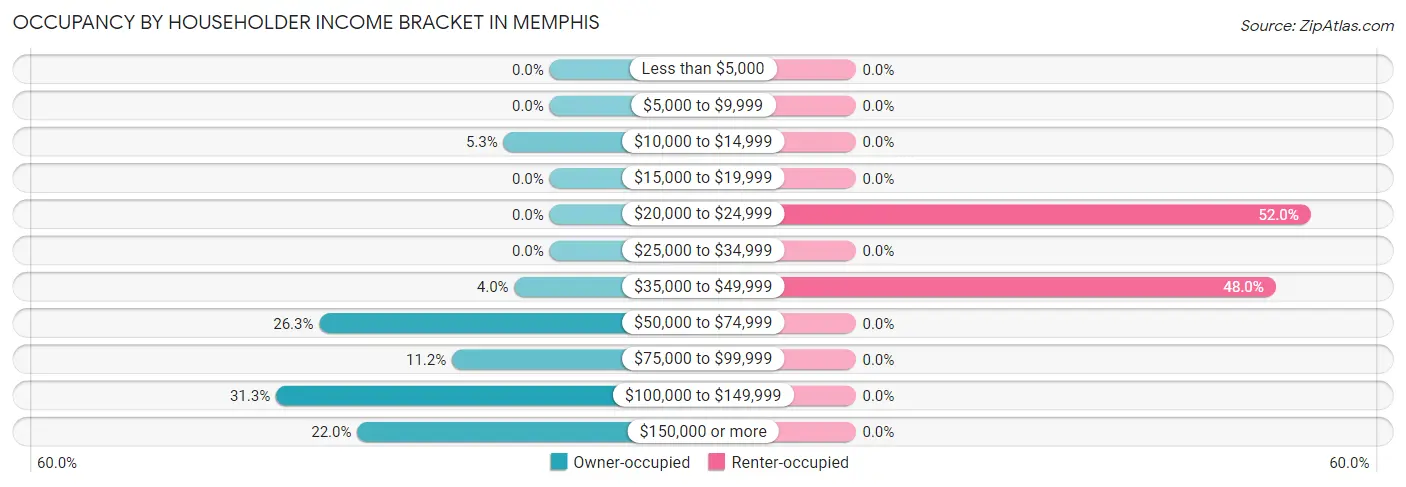
| Income Bracket | Owner-occupied | Renter-occupied |
| Less than $5,000 | 0 (0.0%) | 0 (0.0%) |
| $5,000 to $9,999 | 0 (0.0%) | 0 (0.0%) |
| $10,000 to $14,999 | 17 (5.3%) | 0 (0.0%) |
| $15,000 to $19,999 | 0 (0.0%) | 0 (0.0%) |
| $20,000 to $24,999 | 0 (0.0%) | 13 (52.0%) |
| $25,000 to $34,999 | 0 (0.0%) | 0 (0.0%) |
| $35,000 to $49,999 | 13 (4.0%) | 12 (48.0%) |
| $50,000 to $74,999 | 85 (26.3%) | 0 (0.0%) |
| $75,000 to $99,999 | 36 (11.2%) | 0 (0.0%) |
| $100,000 to $149,999 | 101 (31.3%) | 0 (0.0%) |
| $150,000 or more | 71 (22.0%) | 0 (0.0%) |
| Total | 323 (100.0%) | 25 (100.0%) |
Monthly Housing Cost Tiers in Memphis
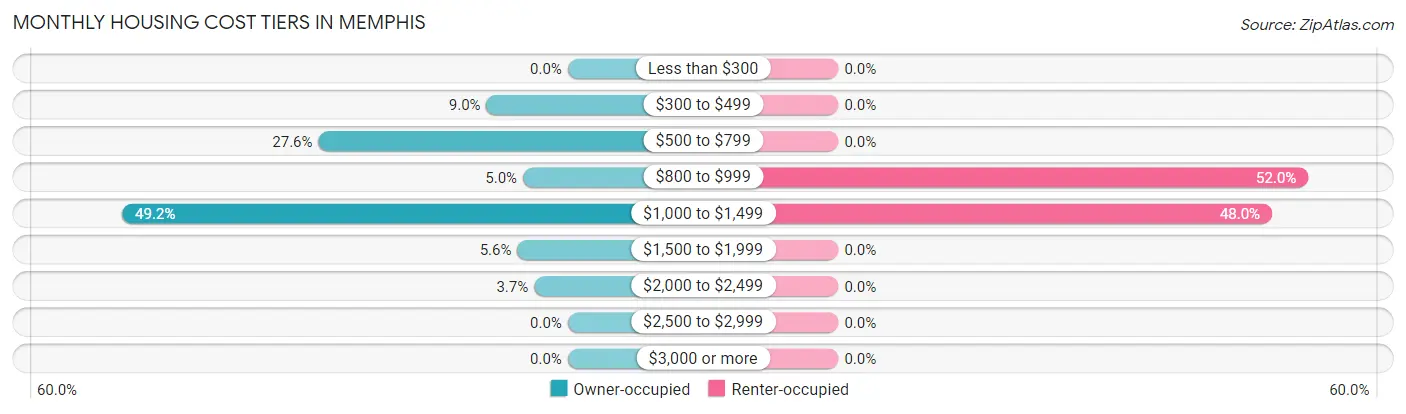
| Monthly Cost | Owner-occupied | Renter-occupied |
| Less than $300 | 0 (0.0%) | 0 (0.0%) |
| $300 to $499 | 29 (9.0%) | 0 (0.0%) |
| $500 to $799 | 89 (27.6%) | 0 (0.0%) |
| $800 to $999 | 16 (5.0%) | 13 (52.0%) |
| $1,000 to $1,499 | 159 (49.2%) | 12 (48.0%) |
| $1,500 to $1,999 | 18 (5.6%) | 0 (0.0%) |
| $2,000 to $2,499 | 12 (3.7%) | 0 (0.0%) |
| $2,500 to $2,999 | 0 (0.0%) | 0 (0.0%) |
| $3,000 or more | 0 (0.0%) | 0 (0.0%) |
| Total | 323 (100.0%) | 25 (100.0%) |
Physical Housing Characteristics in Memphis
Housing Structures in Memphis
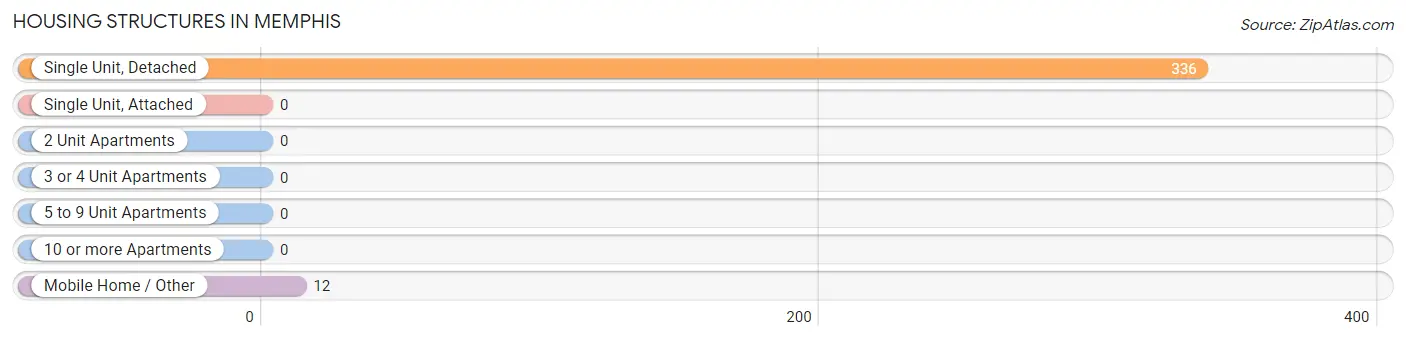
| Structure Type | # Housing Units | % Housing Units |
| Single Unit, Detached | 336 | 96.6% |
| Single Unit, Attached | 0 | 0.0% |
| 2 Unit Apartments | 0 | 0.0% |
| 3 or 4 Unit Apartments | 0 | 0.0% |
| 5 to 9 Unit Apartments | 0 | 0.0% |
| 10 or more Apartments | 0 | 0.0% |
| Mobile Home / Other | 12 | 3.5% |
| Total | 348 | 100.0% |
Housing Structures by Occupancy in Memphis
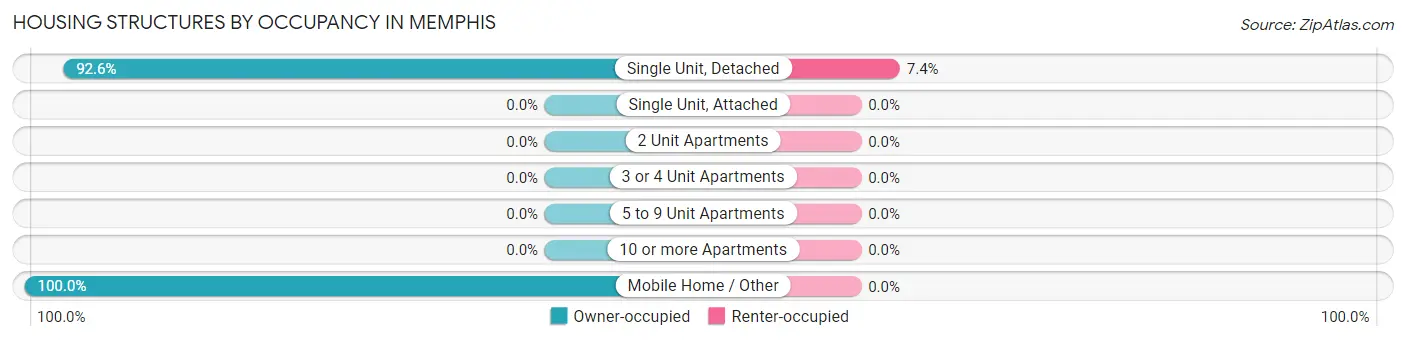
| Structure Type | Owner-occupied | Renter-occupied |
| Single Unit, Detached | 311 (92.6%) | 25 (7.4%) |
| Single Unit, Attached | 0 (0.0%) | 0 (0.0%) |
| 2 Unit Apartments | 0 (0.0%) | 0 (0.0%) |
| 3 or 4 Unit Apartments | 0 (0.0%) | 0 (0.0%) |
| 5 to 9 Unit Apartments | 0 (0.0%) | 0 (0.0%) |
| 10 or more Apartments | 0 (0.0%) | 0 (0.0%) |
| Mobile Home / Other | 12 (100.0%) | 0 (0.0%) |
| Total | 323 (92.8%) | 25 (7.2%) |
Housing Structures by Number of Rooms in Memphis
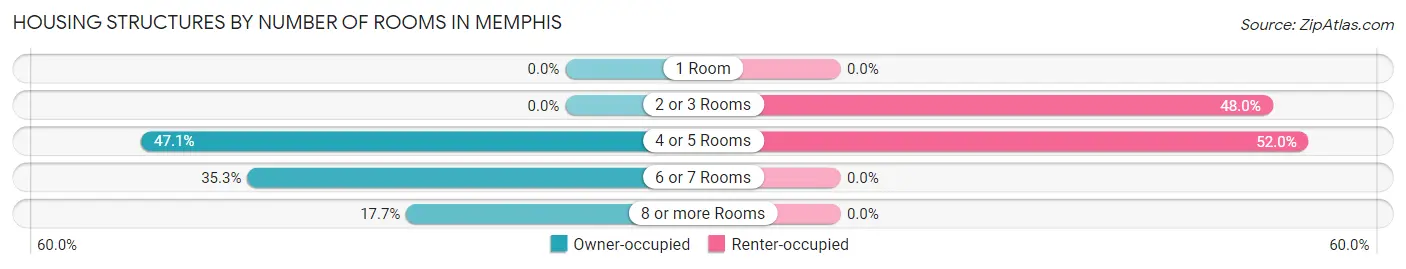
| Number of Rooms | Owner-occupied | Renter-occupied |
| 1 Room | 0 (0.0%) | 0 (0.0%) |
| 2 or 3 Rooms | 0 (0.0%) | 12 (48.0%) |
| 4 or 5 Rooms | 152 (47.1%) | 13 (52.0%) |
| 6 or 7 Rooms | 114 (35.3%) | 0 (0.0%) |
| 8 or more Rooms | 57 (17.6%) | 0 (0.0%) |
| Total | 323 (100.0%) | 25 (100.0%) |
Housing Structure by Heating Type in Memphis
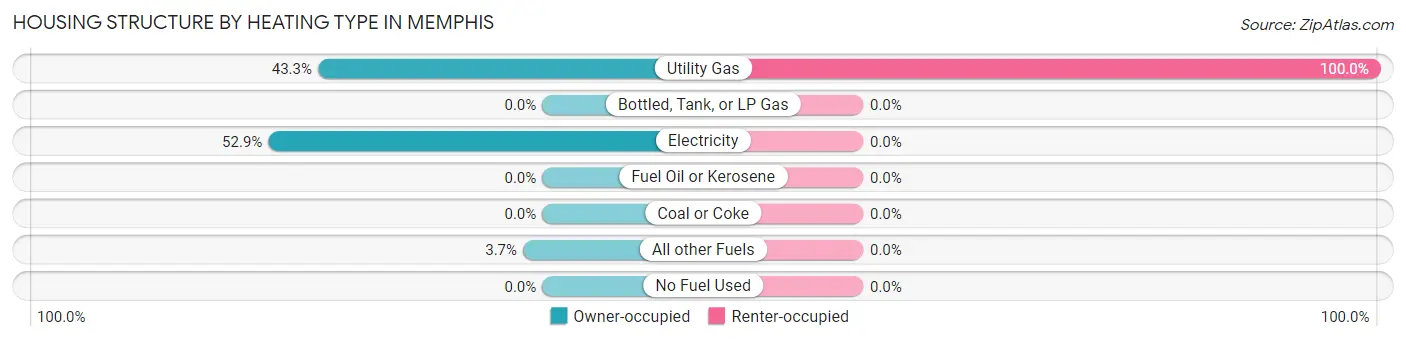
| Heating Type | Owner-occupied | Renter-occupied |
| Utility Gas | 140 (43.3%) | 25 (100.0%) |
| Bottled, Tank, or LP Gas | 0 (0.0%) | 0 (0.0%) |
| Electricity | 171 (52.9%) | 0 (0.0%) |
| Fuel Oil or Kerosene | 0 (0.0%) | 0 (0.0%) |
| Coal or Coke | 0 (0.0%) | 0 (0.0%) |
| All other Fuels | 12 (3.7%) | 0 (0.0%) |
| No Fuel Used | 0 (0.0%) | 0 (0.0%) |
| Total | 323 (100.0%) | 25 (100.0%) |
Household Vehicle Usage in Memphis
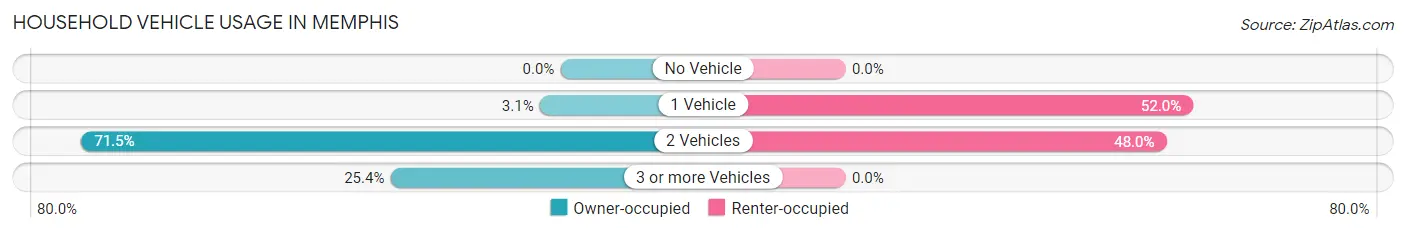
| Vehicles per Household | Owner-occupied | Renter-occupied |
| No Vehicle | 0 (0.0%) | 0 (0.0%) |
| 1 Vehicle | 10 (3.1%) | 13 (52.0%) |
| 2 Vehicles | 231 (71.5%) | 12 (48.0%) |
| 3 or more Vehicles | 82 (25.4%) | 0 (0.0%) |
| Total | 323 (100.0%) | 25 (100.0%) |
Real Estate & Mortgages in Memphis
Real Estate and Mortgage Overview in Memphis
| Characteristic | Without Mortgage | With Mortgage |
| Housing Units | 105 | 218 |
| Median Property Value | $311,000 | $218,300 |
| Median Household Income | - | - |
| Monthly Housing Costs | $540 | $0 |
| Real Estate Taxes | $815 | $0 |
Property Value by Mortgage Status in Memphis
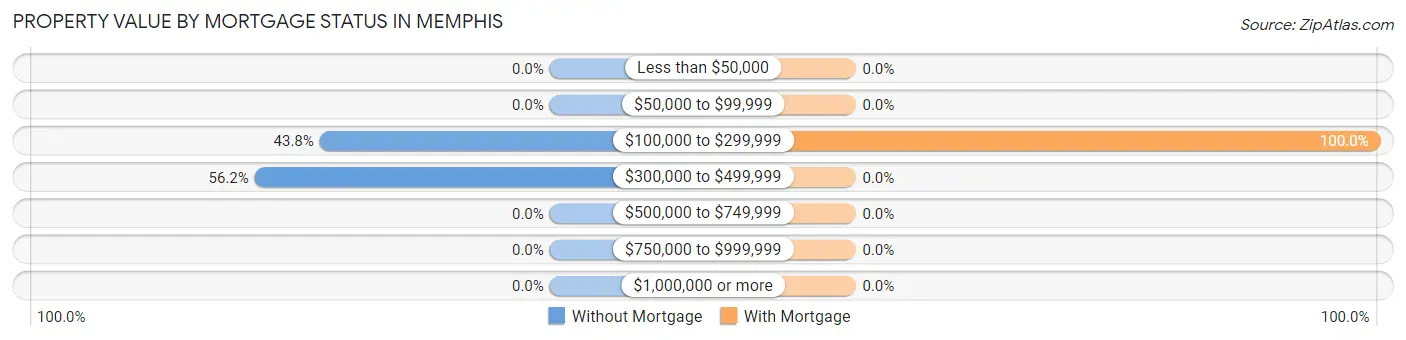
| Property Value | Without Mortgage | With Mortgage |
| Less than $50,000 | 0 (0.0%) | 0 (0.0%) |
| $50,000 to $99,999 | 0 (0.0%) | 0 (0.0%) |
| $100,000 to $299,999 | 46 (43.8%) | 218 (100.0%) |
| $300,000 to $499,999 | 59 (56.2%) | 0 (0.0%) |
| $500,000 to $749,999 | 0 (0.0%) | 0 (0.0%) |
| $750,000 to $999,999 | 0 (0.0%) | 0 (0.0%) |
| $1,000,000 or more | 0 (0.0%) | 0 (0.0%) |
| Total | 105 (100.0%) | 218 (100.0%) |
Household Income by Mortgage Status in Memphis
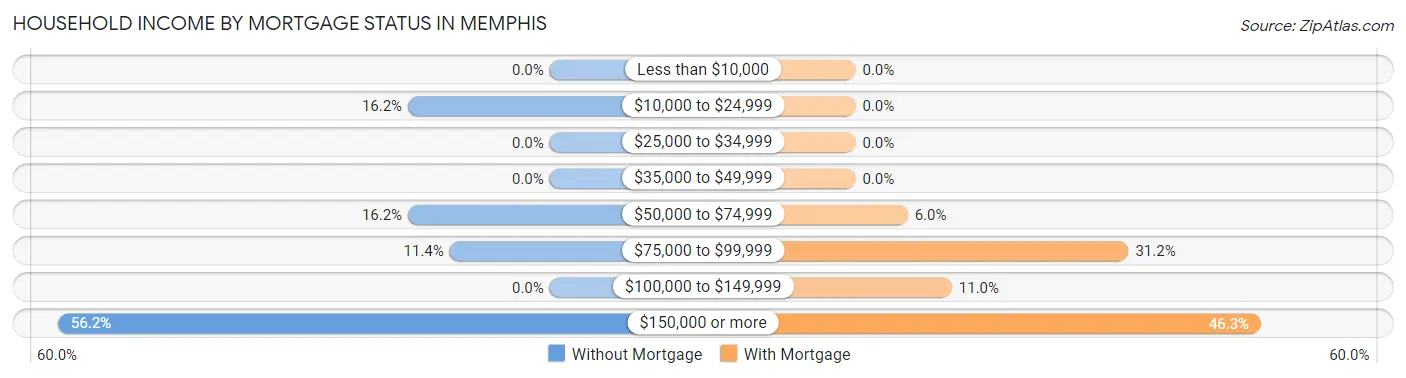
| Household Income | Without Mortgage | With Mortgage |
| Less than $10,000 | 0 (0.0%) | 0 (0.0%) |
| $10,000 to $24,999 | 17 (16.2%) | 0 (0.0%) |
| $25,000 to $34,999 | 0 (0.0%) | 0 (0.0%) |
| $35,000 to $49,999 | 0 (0.0%) | 0 (0.0%) |
| $50,000 to $74,999 | 17 (16.2%) | 13 (6.0%) |
| $75,000 to $99,999 | 12 (11.4%) | 68 (31.2%) |
| $100,000 to $149,999 | 0 (0.0%) | 24 (11.0%) |
| $150,000 or more | 59 (56.2%) | 101 (46.3%) |
| Total | 105 (100.0%) | 218 (100.0%) |
Property Value to Household Income Ratio in Memphis
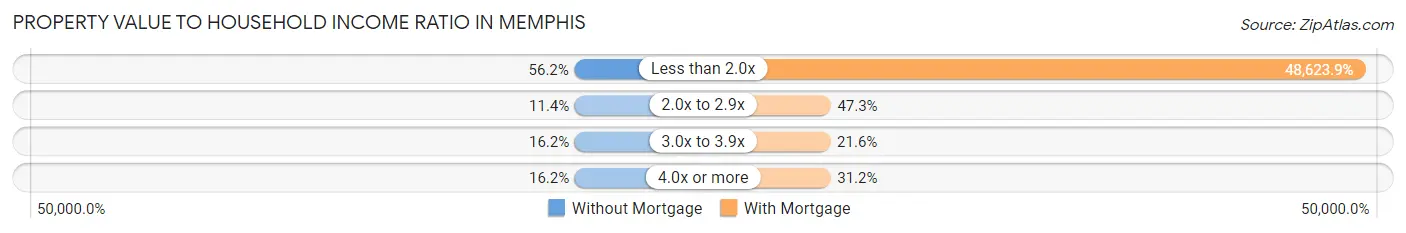
| Value-to-Income Ratio | Without Mortgage | With Mortgage |
| Less than 2.0x | 59 (56.2%) | 106,000 (48,623.8%) |
| 2.0x to 2.9x | 12 (11.4%) | 103 (47.2%) |
| 3.0x to 3.9x | 17 (16.2%) | 47 (21.6%) |
| 4.0x or more | 17 (16.2%) | 68 (31.2%) |
| Total | 105 (100.0%) | 218 (100.0%) |
Real Estate Taxes by Mortgage Status in Memphis
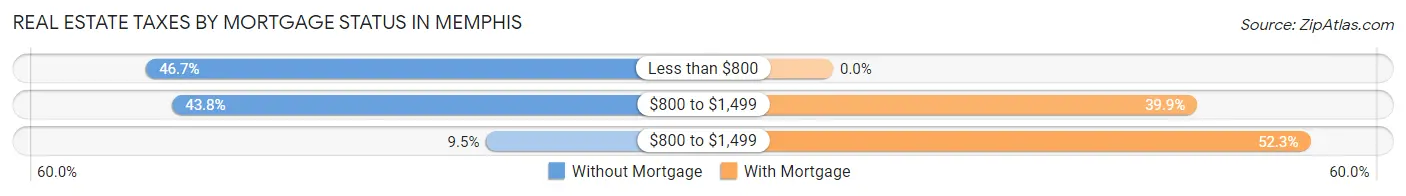
| Property Taxes | Without Mortgage | With Mortgage |
| Less than $800 | 49 (46.7%) | 0 (0.0%) |
| $800 to $1,499 | 46 (43.8%) | 87 (39.9%) |
| $800 to $1,499 | 10 (9.5%) | 114 (52.3%) |
| Total | 105 (100.0%) | 218 (100.0%) |
Health & Disability in Memphis
Health Insurance Coverage by Age in Memphis
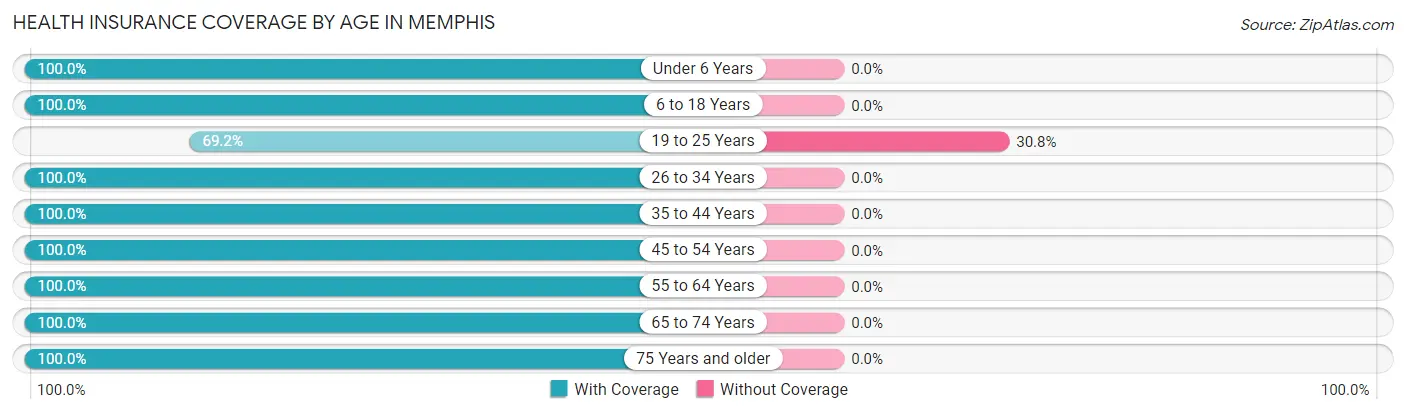
| Age Bracket | With Coverage | Without Coverage |
| Under 6 Years | 56 (100.0%) | 0 (0.0%) |
| 6 to 18 Years | 159 (100.0%) | 0 (0.0%) |
| 19 to 25 Years | 27 (69.2%) | 12 (30.8%) |
| 26 to 34 Years | 198 (100.0%) | 0 (0.0%) |
| 35 to 44 Years | 88 (100.0%) | 0 (0.0%) |
| 45 to 54 Years | 156 (100.0%) | 0 (0.0%) |
| 55 to 64 Years | 94 (100.0%) | 0 (0.0%) |
| 65 to 74 Years | 33 (100.0%) | 0 (0.0%) |
| 75 Years and older | 43 (100.0%) | 0 (0.0%) |
| Total | 854 (98.6%) | 12 (1.4%) |
Health Insurance Coverage by Citizenship Status in Memphis
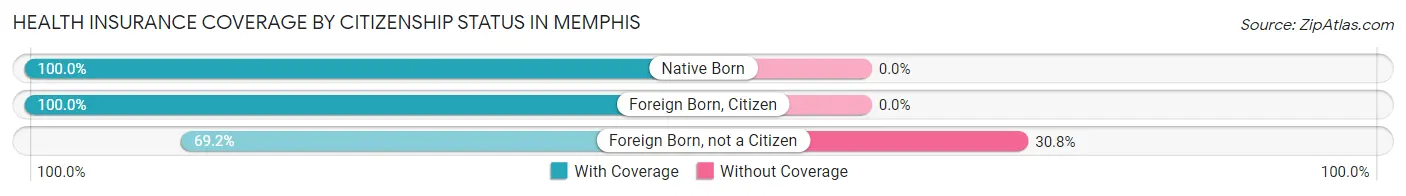
| Citizenship Status | With Coverage | Without Coverage |
| Native Born | 56 (100.0%) | 0 (0.0%) |
| Foreign Born, Citizen | 159 (100.0%) | 0 (0.0%) |
| Foreign Born, not a Citizen | 27 (69.2%) | 12 (30.8%) |
Health Insurance Coverage by Household Income in Memphis
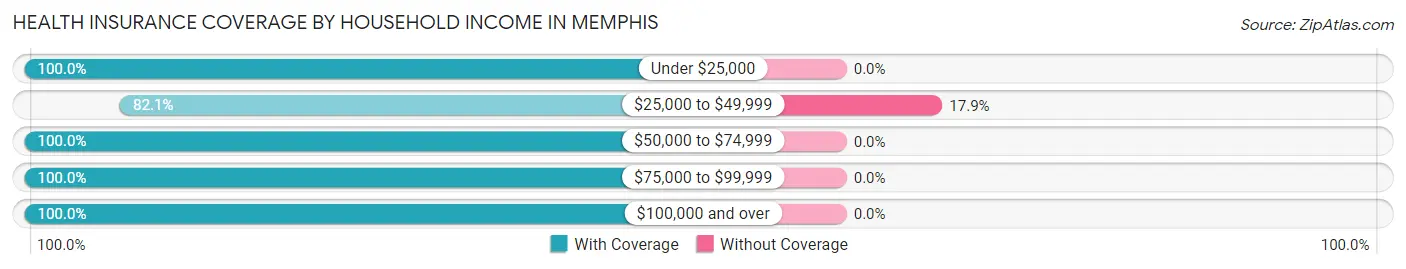
| Household Income | With Coverage | Without Coverage |
| Under $25,000 | 43 (100.0%) | 0 (0.0%) |
| $25,000 to $49,999 | 55 (82.1%) | 12 (17.9%) |
| $50,000 to $74,999 | 184 (100.0%) | 0 (0.0%) |
| $75,000 to $99,999 | 115 (100.0%) | 0 (0.0%) |
| $100,000 and over | 457 (100.0%) | 0 (0.0%) |
Public vs Private Health Insurance Coverage by Age in Memphis
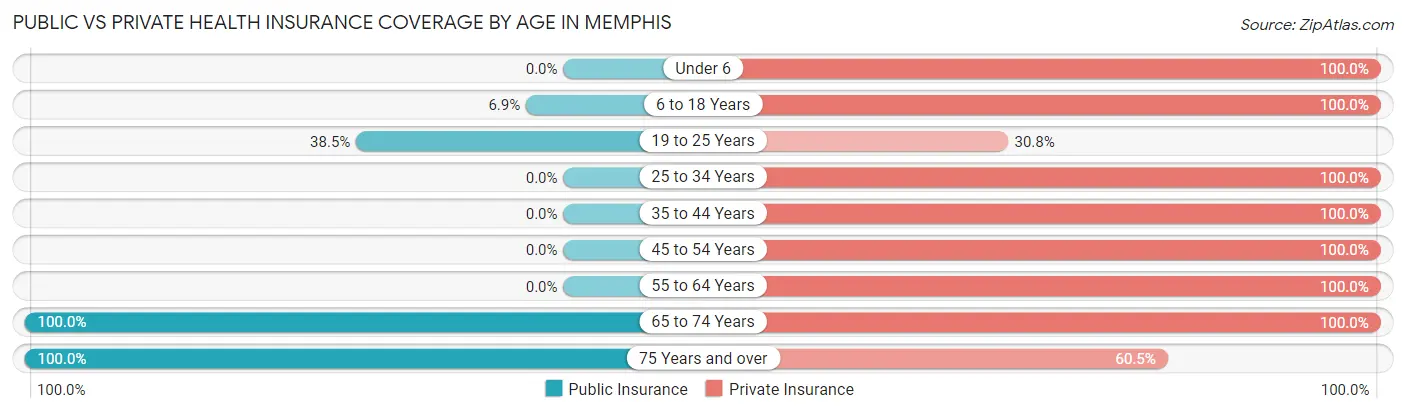
| Age Bracket | Public Insurance | Private Insurance |
| Under 6 | 0 (0.0%) | 56 (100.0%) |
| 6 to 18 Years | 11 (6.9%) | 159 (100.0%) |
| 19 to 25 Years | 15 (38.5%) | 12 (30.8%) |
| 25 to 34 Years | 0 (0.0%) | 198 (100.0%) |
| 35 to 44 Years | 0 (0.0%) | 88 (100.0%) |
| 45 to 54 Years | 0 (0.0%) | 156 (100.0%) |
| 55 to 64 Years | 0 (0.0%) | 94 (100.0%) |
| 65 to 74 Years | 33 (100.0%) | 33 (100.0%) |
| 75 Years and over | 43 (100.0%) | 26 (60.5%) |
| Total | 102 (11.8%) | 822 (94.9%) |
Disability Status by Sex by Age in Memphis
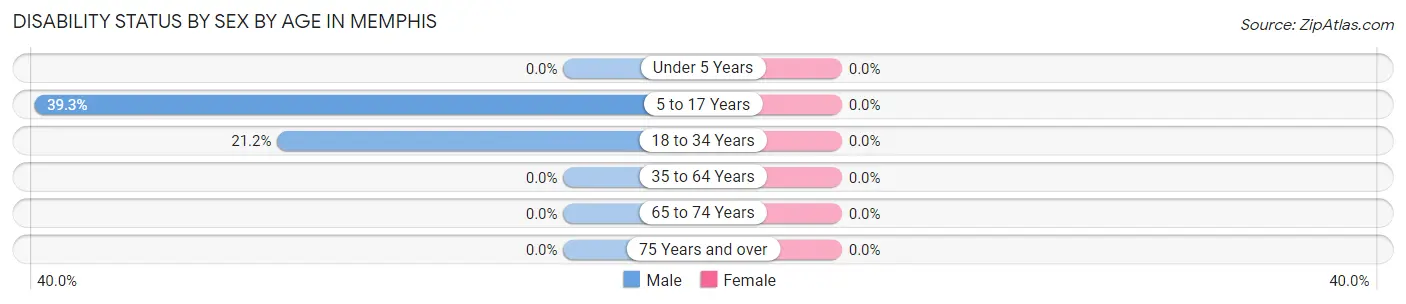
| Age Bracket | Male | Female |
| Under 5 Years | 0 (0.0%) | 0 (0.0%) |
| 5 to 17 Years | 11 (39.3%) | 0 (0.0%) |
| 18 to 34 Years | 24 (21.2%) | 0 (0.0%) |
| 35 to 64 Years | 0 (0.0%) | 0 (0.0%) |
| 65 to 74 Years | 0 (0.0%) | 0 (0.0%) |
| 75 Years and over | 0 (0.0%) | 0 (0.0%) |
Disability Class by Sex by Age in Memphis
Disability Class: Hearing Difficulty
| Age Bracket | Male | Female |
| Under 5 Years | 0 (0.0%) | 0 (0.0%) |
| 5 to 17 Years | 0 (0.0%) | 0 (0.0%) |
| 18 to 34 Years | 0 (0.0%) | 0 (0.0%) |
| 35 to 64 Years | 0 (0.0%) | 0 (0.0%) |
| 65 to 74 Years | 0 (0.0%) | 0 (0.0%) |
| 75 Years and over | 0 (0.0%) | 0 (0.0%) |
Disability Class: Vision Difficulty
| Age Bracket | Male | Female |
| Under 5 Years | 0 (0.0%) | 0 (0.0%) |
| 5 to 17 Years | 0 (0.0%) | 0 (0.0%) |
| 18 to 34 Years | 0 (0.0%) | 0 (0.0%) |
| 35 to 64 Years | 0 (0.0%) | 0 (0.0%) |
| 65 to 74 Years | 0 (0.0%) | 0 (0.0%) |
| 75 Years and over | 0 (0.0%) | 0 (0.0%) |
Disability Class: Cognitive Difficulty
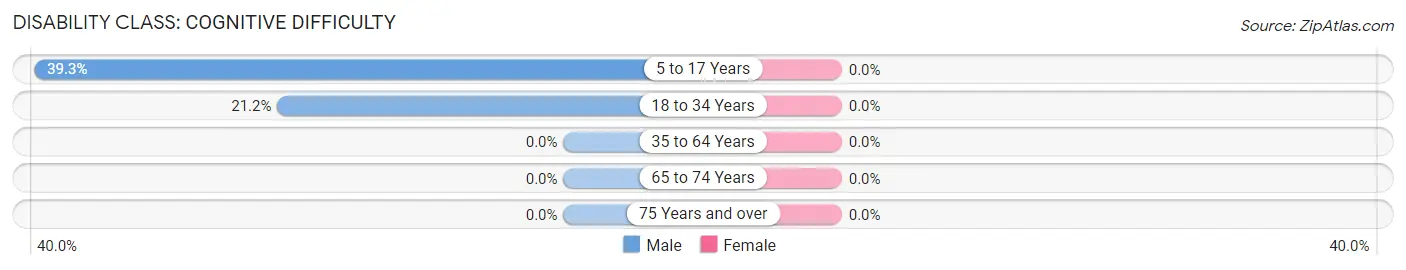
| Age Bracket | Male | Female |
| 5 to 17 Years | 11 (39.3%) | 0 (0.0%) |
| 18 to 34 Years | 24 (21.2%) | 0 (0.0%) |
| 35 to 64 Years | 0 (0.0%) | 0 (0.0%) |
| 65 to 74 Years | 0 (0.0%) | 0 (0.0%) |
| 75 Years and over | 0 (0.0%) | 0 (0.0%) |
Disability Class: Ambulatory Difficulty
| Age Bracket | Male | Female |
| 5 to 17 Years | 0 (0.0%) | 0 (0.0%) |
| 18 to 34 Years | 0 (0.0%) | 0 (0.0%) |
| 35 to 64 Years | 0 (0.0%) | 0 (0.0%) |
| 65 to 74 Years | 0 (0.0%) | 0 (0.0%) |
| 75 Years and over | 0 (0.0%) | 0 (0.0%) |
Disability Class: Self-Care Difficulty
| Age Bracket | Male | Female |
| 5 to 17 Years | 0 (0.0%) | 0 (0.0%) |
| 18 to 34 Years | 0 (0.0%) | 0 (0.0%) |
| 35 to 64 Years | 0 (0.0%) | 0 (0.0%) |
| 65 to 74 Years | 0 (0.0%) | 0 (0.0%) |
| 75 Years and over | 0 (0.0%) | 0 (0.0%) |
Technology Access in Memphis
Computing Device Access in Memphis
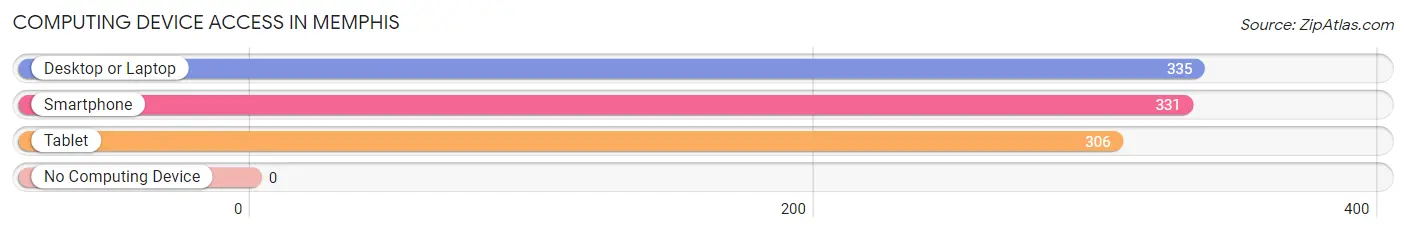
| Device Type | # Households | % Households |
| Desktop or Laptop | 335 | 96.3% |
| Smartphone | 331 | 95.1% |
| Tablet | 306 | 87.9% |
| No Computing Device | 0 | 0.0% |
| Total | 348 | 100.0% |
Internet Access in Memphis
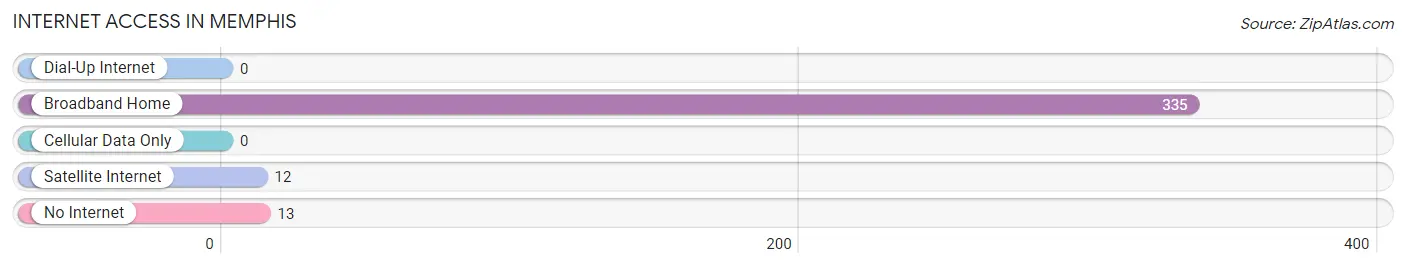
| Internet Type | # Households | % Households |
| Dial-Up Internet | 0 | 0.0% |
| Broadband Home | 335 | 96.3% |
| Cellular Data Only | 0 | 0.0% |
| Satellite Internet | 12 | 3.5% |
| No Internet | 13 | 3.7% |
| Total | 348 | 100.0% |
Memphis Summary
Memphis, Indiana is a small town located in Clark County, Indiana, United States. It is situated on the banks of the Ohio River, approximately 20 miles north of Louisville, Kentucky. The town was founded in 1817 and is the oldest town in Clark County. The population of Memphis was 1,845 at the 2010 census.
Geography
Memphis is located at 38°30'25" North, 85°45'45" West (38.506944, -85.762500). According to the United States Census Bureau, the town has a total area of 0.9 square miles (2.3 km2), all of it land.
History
Memphis was founded in 1817 by William and Mary Ann Miller, who had moved to the area from Pennsylvania. The town was named after the ancient Egyptian city of Memphis, which was located on the Nile River. The town was originally a trading post and ferry crossing on the Ohio River.
In 1820, the town was incorporated and the first post office was established. The town grew rapidly and by 1825, it had a population of over 500. The town was a major stop on the Underground Railroad, with many slaves escaping to freedom in the North.
In 1847, the Louisville, Cincinnati and Charleston Railroad was built through the town, connecting it to Louisville and Cincinnati. This allowed the town to become a major shipping center for the region.
In 1871, the town was devastated by a major flood, which destroyed many of the buildings and homes. The town was rebuilt and continued to grow.
In the late 19th century, the town was a major center for the production of tobacco. The town was also home to several distilleries and breweries.
Economy
The economy of Memphis is largely based on agriculture and manufacturing. The town is home to several large farms, which produce corn, soybeans, wheat, and other crops. The town is also home to several manufacturing companies, including a furniture factory, a plastics factory, and a metal fabrication plant.
Demographics
As of the 2010 census, there were 1,845 people, 745 households, and 486 families residing in the town. The population density was 2,037.2 people per square mile (788.2/km2). There were 817 housing units at an average density of 899.2 per square mile (347.2/km2). The racial makeup of the town was 97.2% White, 0.7% African American, 0.2% Native American, 0.2% Asian, 0.2% from other races, and 1.7% from two or more races. Hispanic or Latino of any race were 0.9% of the population.
There were 745 households, out of which 28.2% had children under the age of 18 living with them, 46.2% were married couples living together, 13.2% had a female householder with no husband present, and 36.2% were non-families. 32.2% of all households were made up of individuals, and 15.2% had someone living alone who was 65 years of age or older. The average household size was 2.37 and the average family size was 2.97.
In the town, the population was spread out, with 24.2% under the age of 18, 8.2% from 18 to 24, 27.2% from 25 to 44, 22.2% from 45 to 64, and 18.2% who were 65 years of age or older. The median age was 38 years. For every 100 females, there were 87.2 males. For every 100 females age 18 and over, there were 83.2 males.
The median income for a household in the town was $35,000, and the median income for a family was $41,250. Males had a median income of $31,250 versus $22,500 for females. The per capita income for the town was $17,845. About 8.2% of families and 11.2% of the population were below the poverty line, including 15.2% of those under age 18 and 8.2% of those age 65 or over.
Common Questions
What is Per Capita Income in Memphis?
Per Capita income in Memphis is $39,729.
What is the Median Family Income in Memphis?
Median Family Income in Memphis is $110,074.
What is the Median Household income in Memphis?
Median Household Income in Memphis is $86,875.
What is Income or Wage Gap in Memphis?
Income or Wage Gap in Memphis is 18.0%.
Women in Memphis earn 82.0 cents for every dollar earned by a man.
What is Inequality or Gini Index in Memphis?
Inequality or Gini Index in Memphis is 0.29.
What is the Total Population of Memphis?
Total Population of Memphis is 866.
What is the Total Male Population of Memphis?
Total Male Population of Memphis is 412.
What is the Total Female Population of Memphis?
Total Female Population of Memphis is 454.
What is the Ratio of Males per 100 Females in Memphis?
There are 90.75 Males per 100 Females in Memphis.
What is the Ratio of Females per 100 Males in Memphis?
There are 110.19 Females per 100 Males in Memphis.
What is the Median Population Age in Memphis?
Median Population Age in Memphis is 34.1 Years.
What is the Average Family Size in Memphis
Average Family Size in Memphis is 2.6 People.
What is the Average Household Size in Memphis
Average Household Size in Memphis is 2.5 People.
How Large is the Labor Force in Memphis?
There are 575 People in the Labor Forcein in Memphis.
What is the Percentage of People in the Labor Force in Memphis?
88.3% of People are in the Labor Force in Memphis.