Madison, IN Map & Demographics
Madison Map
Madison Overview
$30,381
PER CAPITA INCOME
$77,882
AVG FAMILY INCOME
$53,113
AVG HOUSEHOLD INCOME
36.4%
WAGE / INCOME GAP [ % ]
63.6¢/ $1
WAGE / INCOME GAP [ $ ]
$12,339
FAMILY INCOME DEFICIT
0.46
INEQUALITY / GINI INDEX
12,301
TOTAL POPULATION
5,362
MALE POPULATION
6,939
FEMALE POPULATION
77.27
MALES / 100 FEMALES
129.41
FEMALES / 100 MALES
43.7
MEDIAN AGE
3.0
AVG FAMILY SIZE
2.2
AVG HOUSEHOLD SIZE
5,833
LABOR FORCE [ PEOPLE ]
55.5%
PERCENT IN LABOR FORCE
3.3%
UNEMPLOYMENT RATE
Madison Zip Codes
Madison Area Codes
Income in Madison
Income Overview in Madison
Per Capita Income in Madison is $30,381, while median incomes of families and households are $77,882 and $53,113 respectively.
| Characteristic | Number | Measure |
| Per Capita Income | 12,301 | $30,381 |
| Median Family Income | 2,600 | $77,882 |
| Mean Family Income | 2,600 | $93,670 |
| Median Household Income | 5,101 | $53,113 |
| Mean Household Income | 5,101 | $68,920 |
| Income Deficit | 2,600 | $12,339 |
| Wage / Income Gap (%) | 12,301 | 36.40% |
| Wage / Income Gap ($) | 12,301 | 63.60¢ per $1 |
| Gini / Inequality Index | 12,301 | 0.46 |
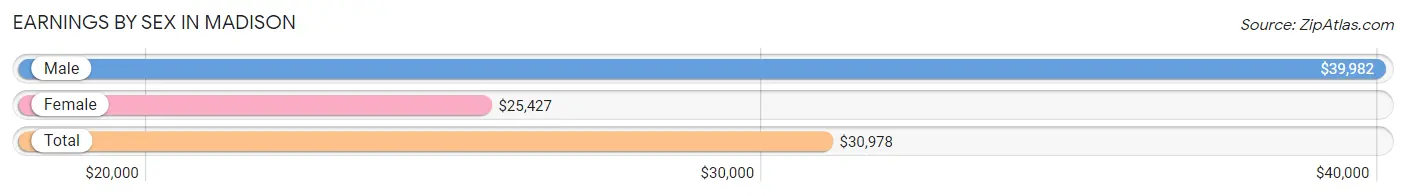
Earnings by Sex in Madison
Average Earnings in Madison are $30,978, $39,982 for men and $25,427 for women, a difference of 36.4%.
| Sex | Number | Average Earnings |
| Male | 3,313 (52.3%) | $39,982 |
| Female | 3,019 (47.7%) | $25,427 |
| Total | 6,332 (100.0%) | $30,978 |
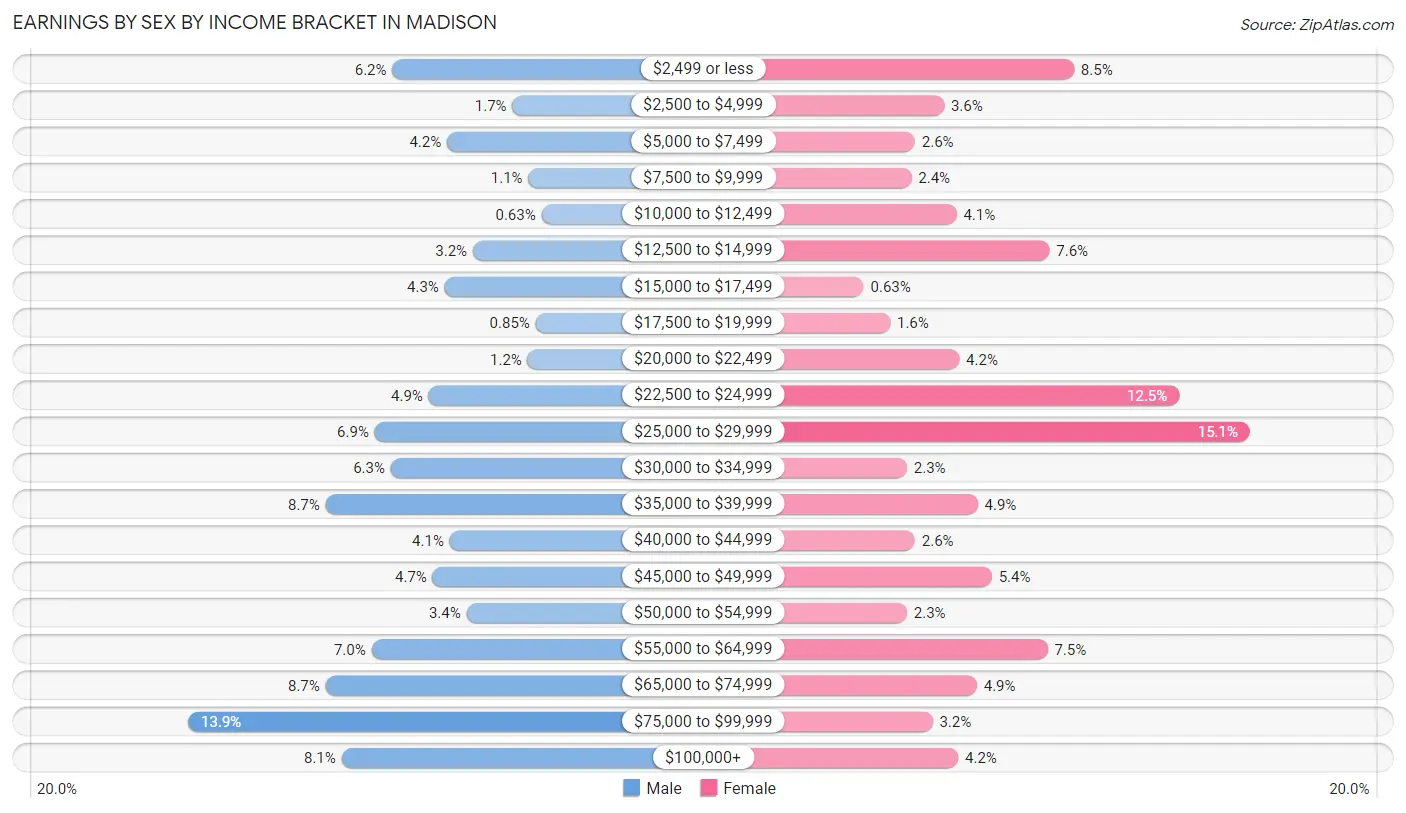
Earnings by Sex by Income Bracket in Madison
The most common earnings brackets in Madison are $75,000 to $99,999 for men (460 | 13.9%) and $25,000 to $29,999 for women (456 | 15.1%).
| Income | Male | Female |
| $2,499 or less | 206 (6.2%) | 257 (8.5%) |
| $2,500 to $4,999 | 57 (1.7%) | 110 (3.6%) |
| $5,000 to $7,499 | 138 (4.2%) | 77 (2.5%) |
| $7,500 to $9,999 | 37 (1.1%) | 73 (2.4%) |
| $10,000 to $12,499 | 21 (0.6%) | 124 (4.1%) |
| $12,500 to $14,999 | 106 (3.2%) | 229 (7.6%) |
| $15,000 to $17,499 | 141 (4.3%) | 19 (0.6%) |
| $17,500 to $19,999 | 28 (0.9%) | 49 (1.6%) |
| $20,000 to $22,499 | 38 (1.1%) | 127 (4.2%) |
| $22,500 to $24,999 | 161 (4.9%) | 376 (12.4%) |
| $25,000 to $29,999 | 228 (6.9%) | 456 (15.1%) |
| $30,000 to $34,999 | 208 (6.3%) | 68 (2.2%) |
| $35,000 to $39,999 | 289 (8.7%) | 148 (4.9%) |
| $40,000 to $44,999 | 135 (4.1%) | 77 (2.5%) |
| $45,000 to $49,999 | 156 (4.7%) | 164 (5.4%) |
| $50,000 to $54,999 | 114 (3.4%) | 68 (2.2%) |
| $55,000 to $64,999 | 232 (7.0%) | 227 (7.5%) |
| $65,000 to $74,999 | 289 (8.7%) | 147 (4.9%) |
| $75,000 to $99,999 | 460 (13.9%) | 97 (3.2%) |
| $100,000+ | 269 (8.1%) | 126 (4.2%) |
| Total | 3,313 (100.0%) | 3,019 (100.0%) |
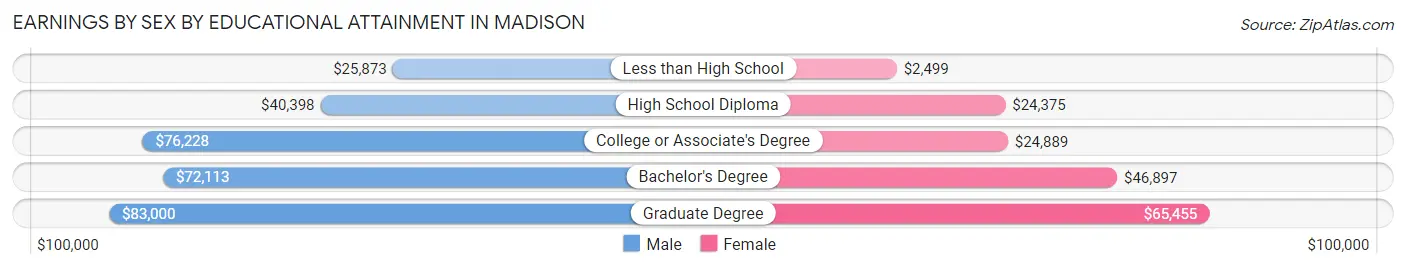
Earnings by Sex by Educational Attainment in Madison
Average earnings in Madison are $49,297 for men and $26,824 for women, a difference of 45.6%. Men with an educational attainment of graduate degree enjoy the highest average annual earnings of $83,000, while those with less than high school education earn the least with $25,873. Women with an educational attainment of graduate degree earn the most with the average annual earnings of $65,455, while those with less than high school education have the smallest earnings of $2,499.
| Educational Attainment | Male Income | Female Income |
| Less than High School | $25,873 | $2,499 |
| High School Diploma | $40,398 | $24,375 |
| College or Associate's Degree | $76,228 | $24,889 |
| Bachelor's Degree | $72,113 | $46,897 |
| Graduate Degree | $83,000 | $65,455 |
| Total | $49,297 | $26,824 |
Family Income in Madison
Family Income Brackets in Madison
According to the Madison family income data, there are 538 families falling into the $100,000 to $149,999 income range, which is the most common income bracket and makes up 20.7% of all families. Conversely, the $10,000 to $14,999 income bracket is the least frequent group with only 78 families (3.0%) belonging to this category.
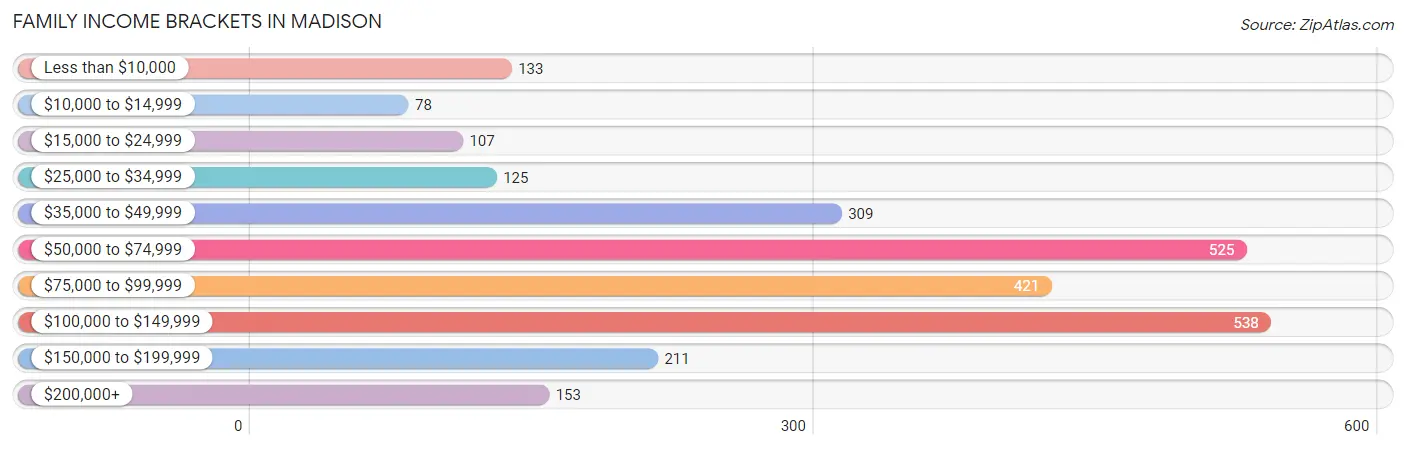
| Income Bracket | # Families | % Families |
| Less than $10,000 | 133 | 5.1% |
| $10,000 to $14,999 | 78 | 3.0% |
| $15,000 to $24,999 | 107 | 4.1% |
| $25,000 to $34,999 | 125 | 4.8% |
| $35,000 to $49,999 | 309 | 11.9% |
| $50,000 to $74,999 | 525 | 20.2% |
| $75,000 to $99,999 | 421 | 16.2% |
| $100,000 to $149,999 | 538 | 20.7% |
| $150,000 to $199,999 | 211 | 8.1% |
| $200,000+ | 153 | 5.9% |
Family Income by Famaliy Size in Madison
3-person families (914 | 35.1%) account for the highest median family income in Madison with $103,985 per family, while 3-person families (914 | 35.1%) have the highest median income of $34,662 per family member.
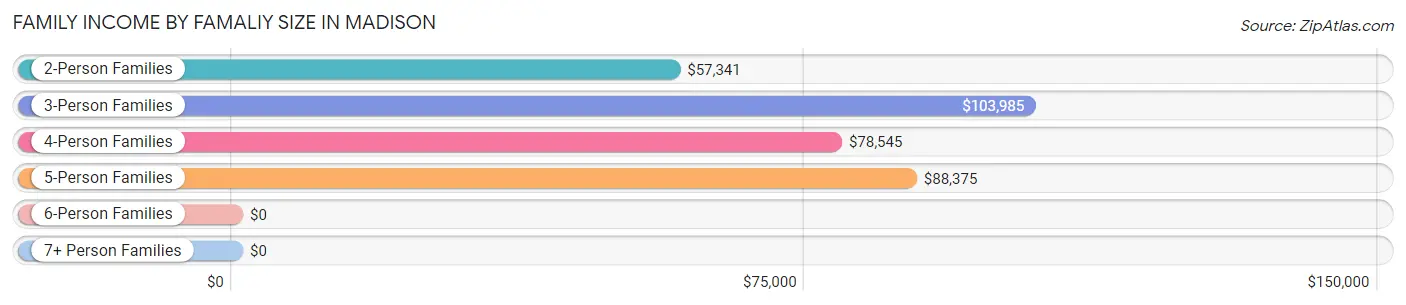
| Income Bracket | # Families | Median Income |
| 2-Person Families | 1,131 (43.5%) | $57,341 |
| 3-Person Families | 914 (35.1%) | $103,985 |
| 4-Person Families | 436 (16.8%) | $78,545 |
| 5-Person Families | 89 (3.4%) | $88,375 |
| 6-Person Families | 30 (1.1%) | $0 |
| 7+ Person Families | 0 (0.0%) | $0 |
| Total | 2,600 (100.0%) | $77,882 |
Family Income by Number of Earners in Madison
The median family income in Madison is $77,882, with families comprising 3+ earners (126) having the highest median family income of $147,283, while families with no earners (391) have the lowest median family income of $50,797, accounting for 4.9% and 15.0% of families, respectively.
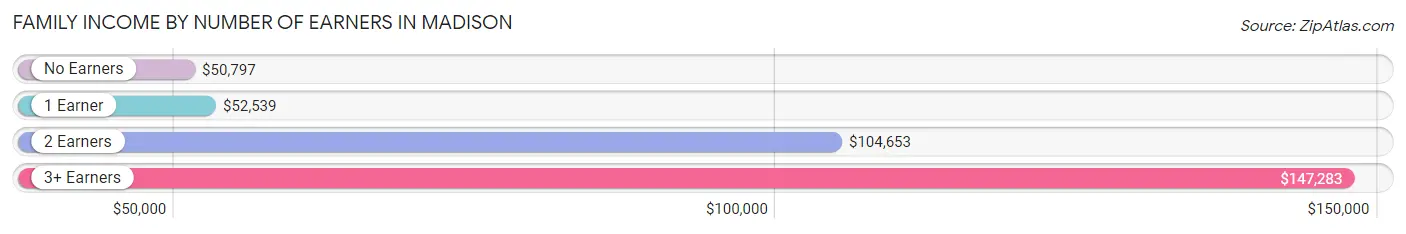
| Number of Earners | # Families | Median Income |
| No Earners | 391 (15.0%) | $50,797 |
| 1 Earner | 973 (37.4%) | $52,539 |
| 2 Earners | 1,110 (42.7%) | $104,653 |
| 3+ Earners | 126 (4.9%) | $147,283 |
| Total | 2,600 (100.0%) | $77,882 |
Household Income in Madison
Household Income Brackets in Madison
With 1,046 households falling in the category, the $50,000 to $74,999 income range is the most frequent in Madison, accounting for 20.5% of all households. In contrast, only 163 households (3.2%) fall into the $200,000+ income bracket, making it the least populous group.
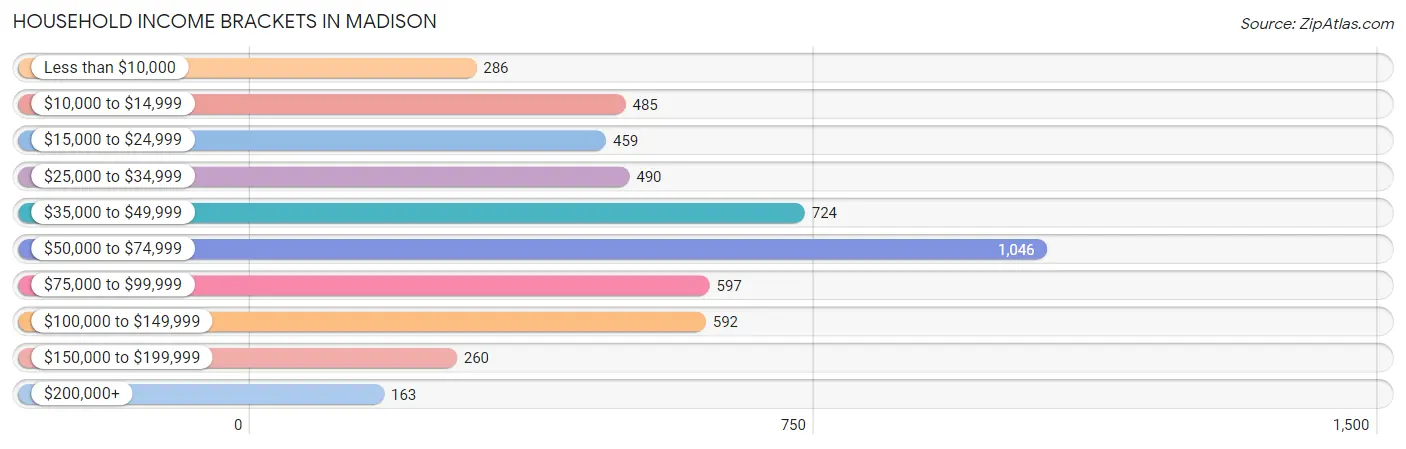
| Income Bracket | # Households | % Households |
| Less than $10,000 | 286 | 5.6% |
| $10,000 to $14,999 | 485 | 9.5% |
| $15,000 to $24,999 | 459 | 9.0% |
| $25,000 to $34,999 | 490 | 9.6% |
| $35,000 to $49,999 | 724 | 14.2% |
| $50,000 to $74,999 | 1,046 | 20.5% |
| $75,000 to $99,999 | 597 | 11.7% |
| $100,000 to $149,999 | 592 | 11.6% |
| $150,000 to $199,999 | 260 | 5.1% |
| $200,000+ | 163 | 3.2% |
Household Income by Householder Age in Madison
The median household income in Madison is $53,113, with the highest median household income of $62,354 found in the 45 to 64 years age bracket for the primary householder. A total of 1,935 households (37.9%) fall into this category. Meanwhile, the 15 to 24 years age bracket for the primary householder has the lowest median household income of $29,415, with 295 households (5.8%) in this group.
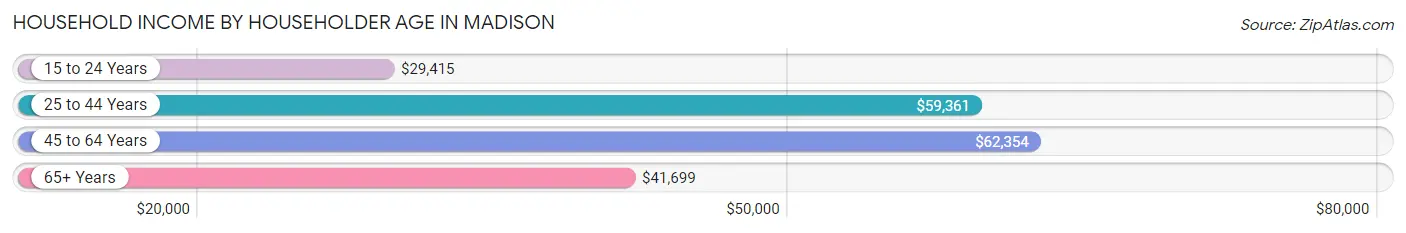
| Income Bracket | # Households | Median Income |
| 15 to 24 Years | 295 (5.8%) | $29,415 |
| 25 to 44 Years | 1,195 (23.4%) | $59,361 |
| 45 to 64 Years | 1,935 (37.9%) | $62,354 |
| 65+ Years | 1,676 (32.9%) | $41,699 |
| Total | 5,101 (100.0%) | $53,113 |
Poverty in Madison
Income Below Poverty by Sex and Age in Madison
With 12.2% poverty level for males and 23.3% for females among the residents of Madison, 5 year old males and 25 to 34 year old females are the most vulnerable to poverty, with 45 males (83.3%) and 236 females (46.5%) in their respective age groups living below the poverty level.
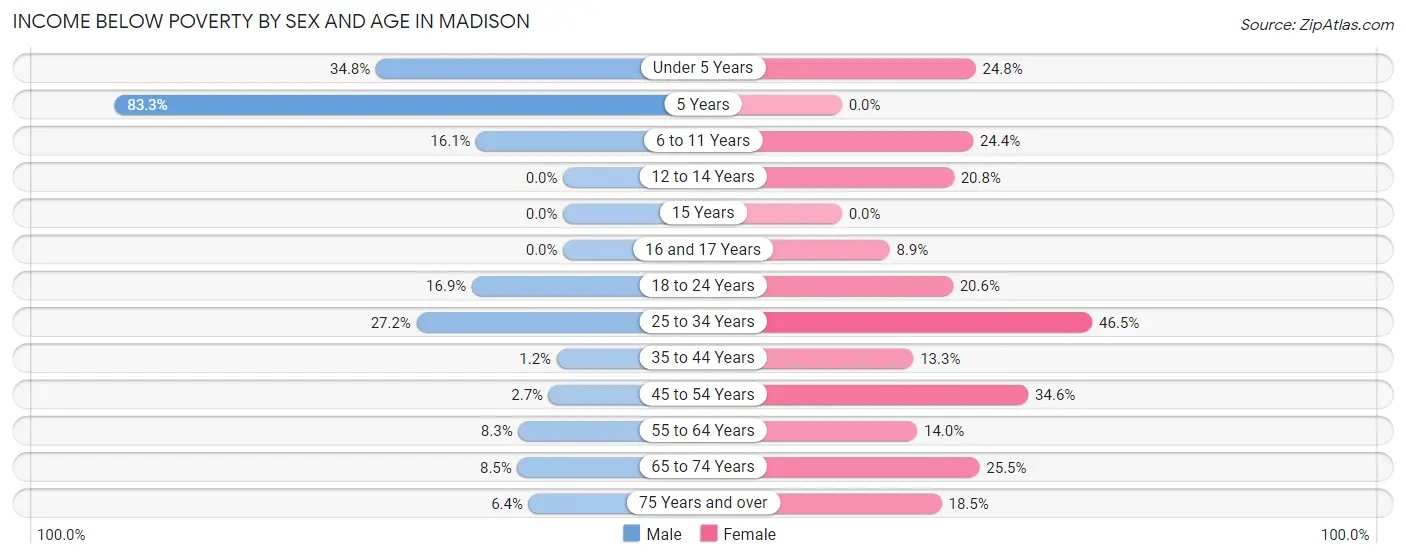
| Age Bracket | Male | Female |
| Under 5 Years | 106 (34.7%) | 72 (24.8%) |
| 5 Years | 45 (83.3%) | 0 (0.0%) |
| 6 to 11 Years | 46 (16.1%) | 103 (24.3%) |
| 12 to 14 Years | 0 (0.0%) | 32 (20.8%) |
| 15 Years | 0 (0.0%) | 0 (0.0%) |
| 16 and 17 Years | 0 (0.0%) | 14 (8.9%) |
| 18 to 24 Years | 107 (16.9%) | 112 (20.6%) |
| 25 to 34 Years | 175 (27.2%) | 236 (46.5%) |
| 35 to 44 Years | 8 (1.2%) | 96 (13.3%) |
| 45 to 54 Years | 20 (2.7%) | 330 (34.6%) |
| 55 to 64 Years | 54 (8.3%) | 127 (14.0%) |
| 65 to 74 Years | 46 (8.5%) | 201 (25.5%) |
| 75 Years and over | 21 (6.4%) | 123 (18.5%) |
| Total | 628 (12.2%) | 1,446 (23.3%) |
Income Above Poverty by Sex and Age in Madison
According to the poverty statistics in Madison, males aged 12 to 14 years and females aged 5 years are the age groups that are most secure financially, with 100.0% of males and 100.0% of females in these age groups living above the poverty line.
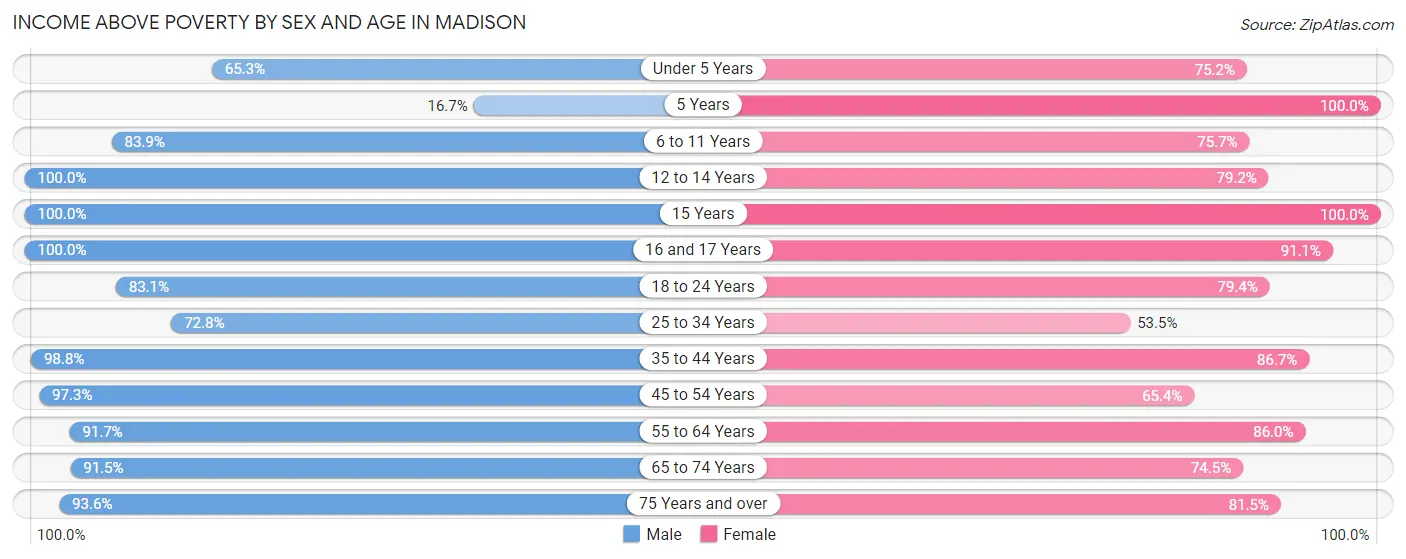
| Age Bracket | Male | Female |
| Under 5 Years | 199 (65.2%) | 218 (75.2%) |
| 5 Years | 9 (16.7%) | 22 (100.0%) |
| 6 to 11 Years | 239 (83.9%) | 320 (75.6%) |
| 12 to 14 Years | 110 (100.0%) | 122 (79.2%) |
| 15 Years | 59 (100.0%) | 69 (100.0%) |
| 16 and 17 Years | 139 (100.0%) | 144 (91.1%) |
| 18 to 24 Years | 525 (83.1%) | 432 (79.4%) |
| 25 to 34 Years | 468 (72.8%) | 272 (53.5%) |
| 35 to 44 Years | 664 (98.8%) | 628 (86.7%) |
| 45 to 54 Years | 725 (97.3%) | 624 (65.4%) |
| 55 to 64 Years | 594 (91.7%) | 782 (86.0%) |
| 65 to 74 Years | 496 (91.5%) | 586 (74.5%) |
| 75 Years and over | 306 (93.6%) | 541 (81.5%) |
| Total | 4,533 (87.8%) | 4,760 (76.7%) |
Income Below Poverty Among Married-Couple Families in Madison
The poverty statistics for married-couple families in Madison show that 5.9% or 103 of the total 1,736 families live below the poverty line. Families with 1 or 2 children have the highest poverty rate of 8.8%, comprising of 77 families. On the other hand, families with 3 or 4 children have the lowest poverty rate of 0.0%, which includes 0 families.
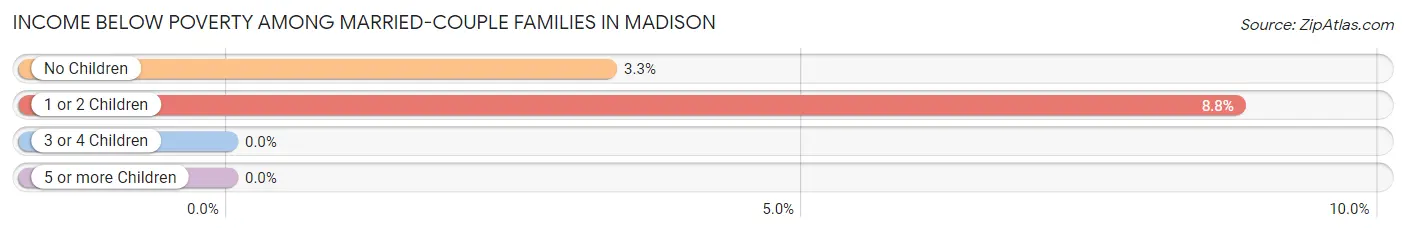
| Children | Above Poverty | Below Poverty |
| No Children | 763 (96.7%) | 26 (3.3%) |
| 1 or 2 Children | 801 (91.2%) | 77 (8.8%) |
| 3 or 4 Children | 69 (100.0%) | 0 (0.0%) |
| 5 or more Children | 0 (0.0%) | 0 (0.0%) |
| Total | 1,633 (94.1%) | 103 (5.9%) |
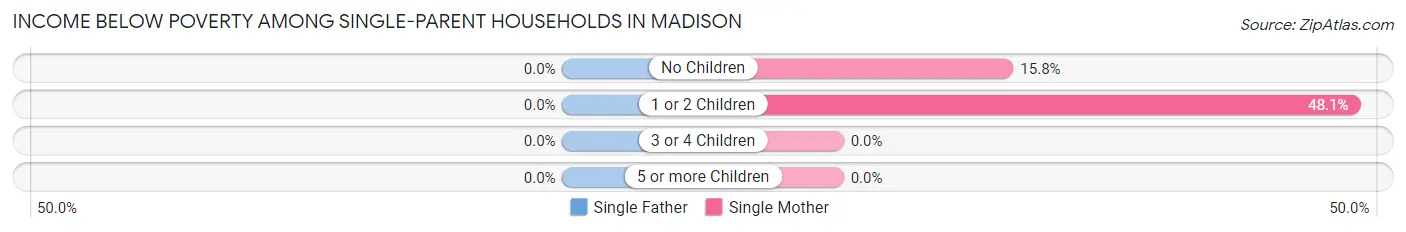
Income Below Poverty Among Single-Parent Households in Madison
| Children | Single Father | Single Mother |
| No Children | 0 (0.0%) | 34 (15.8%) |
| 1 or 2 Children | 0 (0.0%) | 179 (48.1%) |
| 3 or 4 Children | 0 (0.0%) | 0 (0.0%) |
| 5 or more Children | 0 (0.0%) | 0 (0.0%) |
| Total | 0 (0.0%) | 213 (35.0%) |
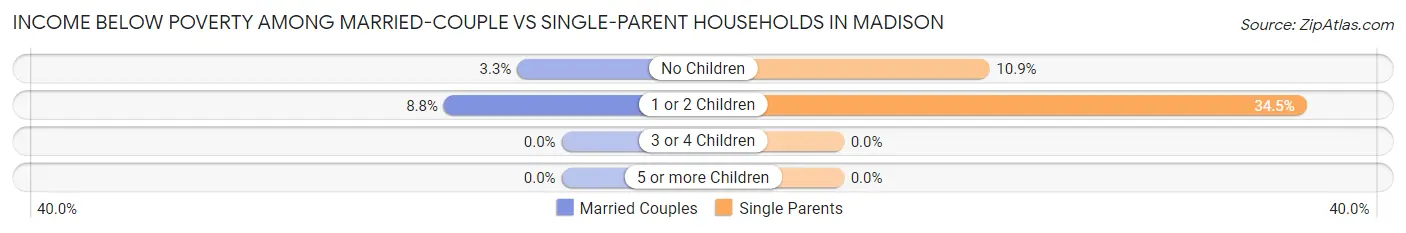
Income Below Poverty Among Married-Couple vs Single-Parent Households in Madison
The poverty data for Madison shows that 103 of the married-couple family households (5.9%) and 213 of the single-parent households (24.6%) are living below the poverty level. Within the married-couple family households, those with 1 or 2 children have the highest poverty rate, with 77 households (8.8%) falling below the poverty line. Among the single-parent households, those with 1 or 2 children have the highest poverty rate, with 179 household (34.5%) living below poverty.
| Children | Married-Couple Families | Single-Parent Households |
| No Children | 26 (3.3%) | 34 (10.9%) |
| 1 or 2 Children | 77 (8.8%) | 179 (34.5%) |
| 3 or 4 Children | 0 (0.0%) | 0 (0.0%) |
| 5 or more Children | 0 (0.0%) | 0 (0.0%) |
| Total | 103 (5.9%) | 213 (24.6%) |
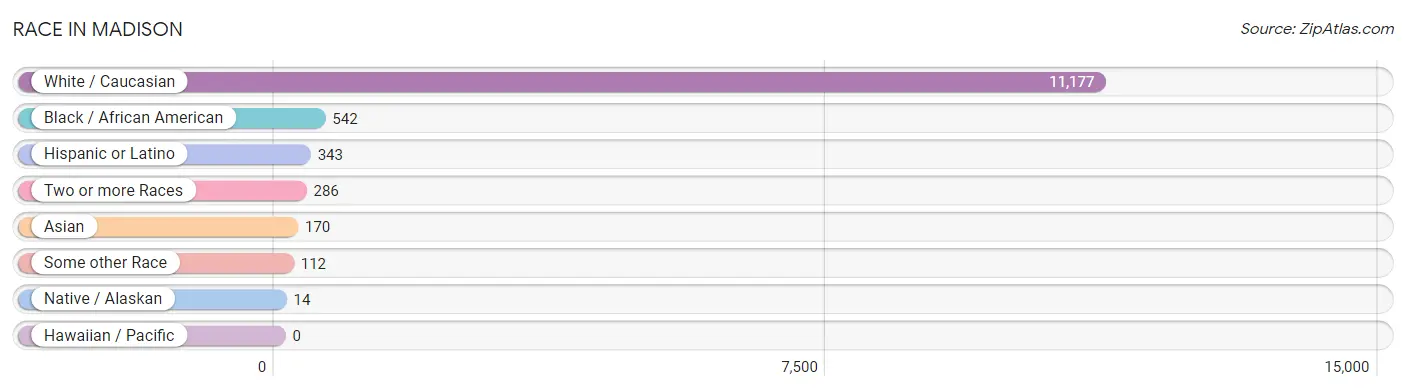
Race in Madison
The most populous races in Madison are White / Caucasian (11,177 | 90.9%), Black / African American (542 | 4.4%), and Hispanic or Latino (343 | 2.8%).
| Race | # Population | % Population |
| Asian | 170 | 1.4% |
| Black / African American | 542 | 4.4% |
| Hawaiian / Pacific | 0 | 0.0% |
| Hispanic or Latino | 343 | 2.8% |
| Native / Alaskan | 14 | 0.1% |
| White / Caucasian | 11,177 | 90.9% |
| Two or more Races | 286 | 2.3% |
| Some other Race | 112 | 0.9% |
| Total | 12,301 | 100.0% |
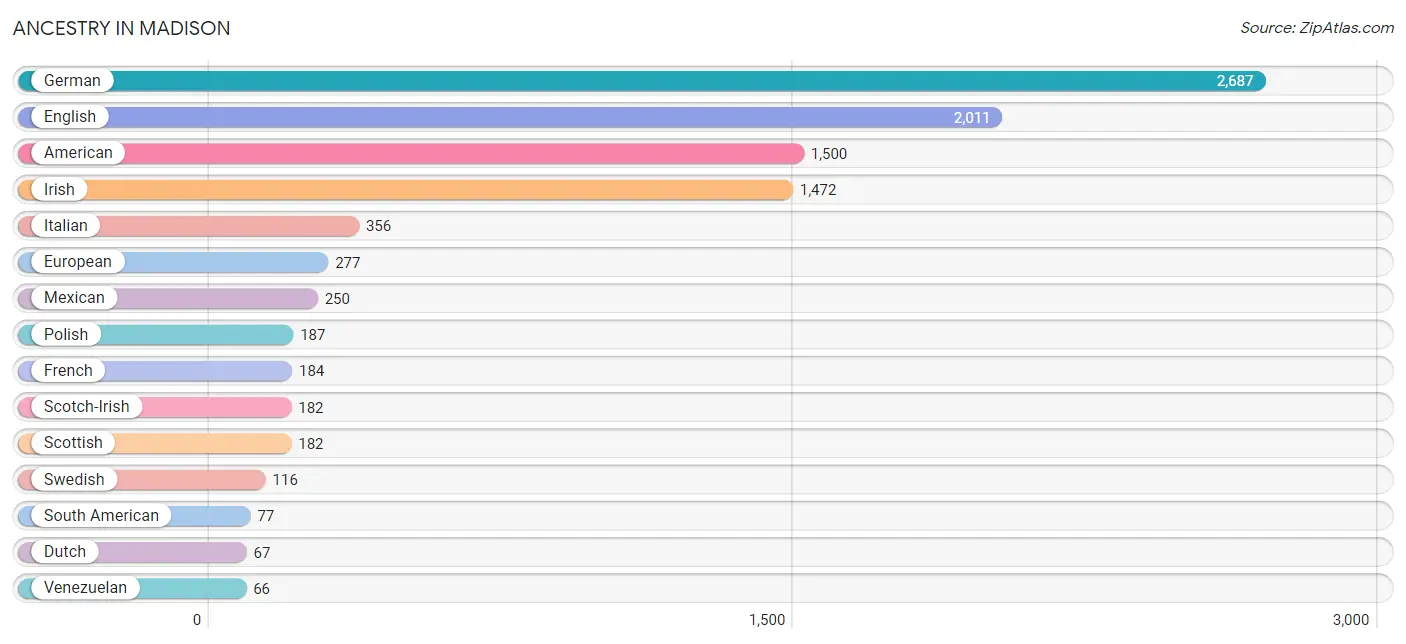
Ancestry in Madison
The most populous ancestries reported in Madison are German (2,687 | 21.8%), English (2,011 | 16.4%), American (1,500 | 12.2%), Irish (1,472 | 12.0%), and Italian (356 | 2.9%), together accounting for 65.2% of all Madison residents.
| Ancestry | # Population | % Population |
| African | 10 | 0.1% |
| American | 1,500 | 12.2% |
| Belgian | 5 | 0.0% |
| Bhutanese | 61 | 0.5% |
| Blackfeet | 24 | 0.2% |
| British | 46 | 0.4% |
| Burmese | 42 | 0.3% |
| Canadian | 40 | 0.3% |
| Central American | 8 | 0.1% |
| Cherokee | 9 | 0.1% |
| Colombian | 11 | 0.1% |
| Croatian | 54 | 0.4% |
| Danish | 25 | 0.2% |
| Dutch | 67 | 0.5% |
| Eastern European | 21 | 0.2% |
| English | 2,011 | 16.4% |
| European | 277 | 2.2% |
| French | 184 | 1.5% |
| French Canadian | 7 | 0.1% |
| German | 2,687 | 21.8% |
| Hungarian | 18 | 0.2% |
| Indian (Asian) | 49 | 0.4% |
| Irish | 1,472 | 12.0% |
| Italian | 356 | 2.9% |
| Korean | 32 | 0.3% |
| Mexican | 250 | 2.0% |
| Nicaraguan | 8 | 0.1% |
| Norwegian | 20 | 0.2% |
| Polish | 187 | 1.5% |
| Portuguese | 21 | 0.2% |
| Puerto Rican | 8 | 0.1% |
| Scotch-Irish | 182 | 1.5% |
| Scottish | 182 | 1.5% |
| Sioux | 20 | 0.2% |
| South American | 77 | 0.6% |
| Subsaharan African | 10 | 0.1% |
| Swedish | 116 | 0.9% |
| Swiss | 27 | 0.2% |
| Venezuelan | 66 | 0.5% |
| Welsh | 51 | 0.4% | View All 40 Rows |
Immigrants in Madison
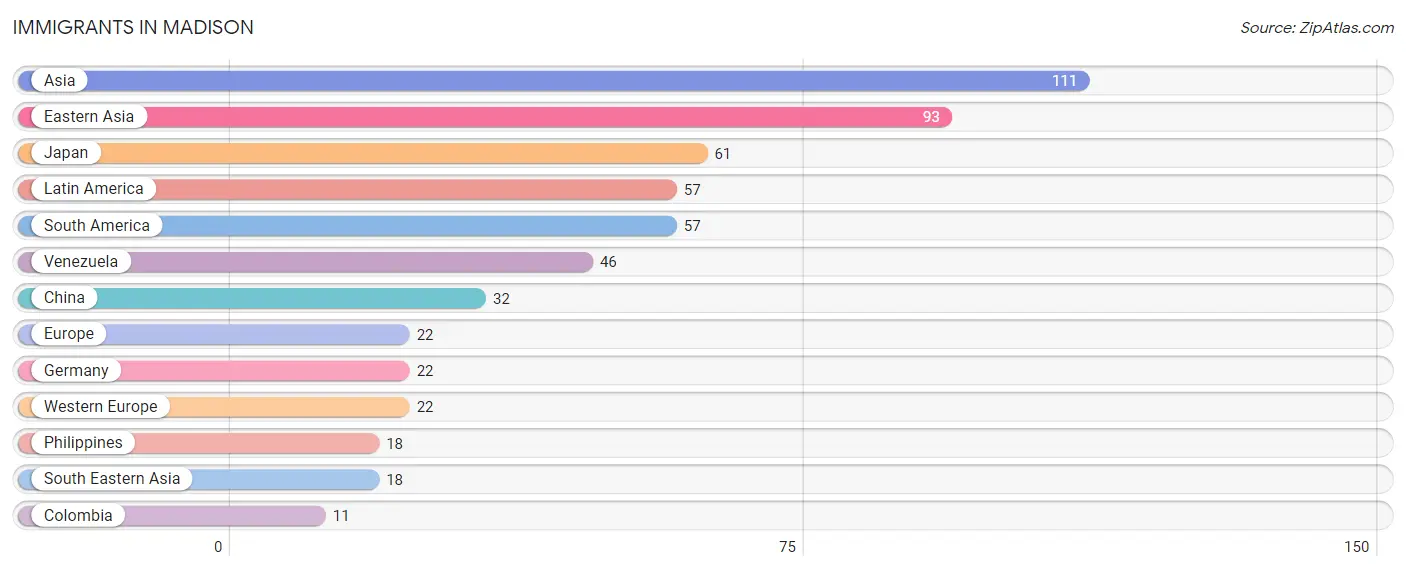
The most numerous immigrant groups reported in Madison came from Asia (111 | 0.9%), Eastern Asia (93 | 0.8%), Japan (61 | 0.5%), Latin America (57 | 0.5%), and South America (57 | 0.5%), together accounting for 3.1% of all Madison residents.
| Immigration Origin | # Population | % Population |
| Asia | 111 | 0.9% |
| China | 32 | 0.3% |
| Colombia | 11 | 0.1% |
| Eastern Asia | 93 | 0.8% |
| Europe | 22 | 0.2% |
| Germany | 22 | 0.2% |
| Japan | 61 | 0.5% |
| Latin America | 57 | 0.5% |
| Philippines | 18 | 0.2% |
| South America | 57 | 0.5% |
| South Eastern Asia | 18 | 0.2% |
| Venezuela | 46 | 0.4% |
| Western Europe | 22 | 0.2% | View All 13 Rows |
Sex and Age in Madison
Sex and Age in Madison
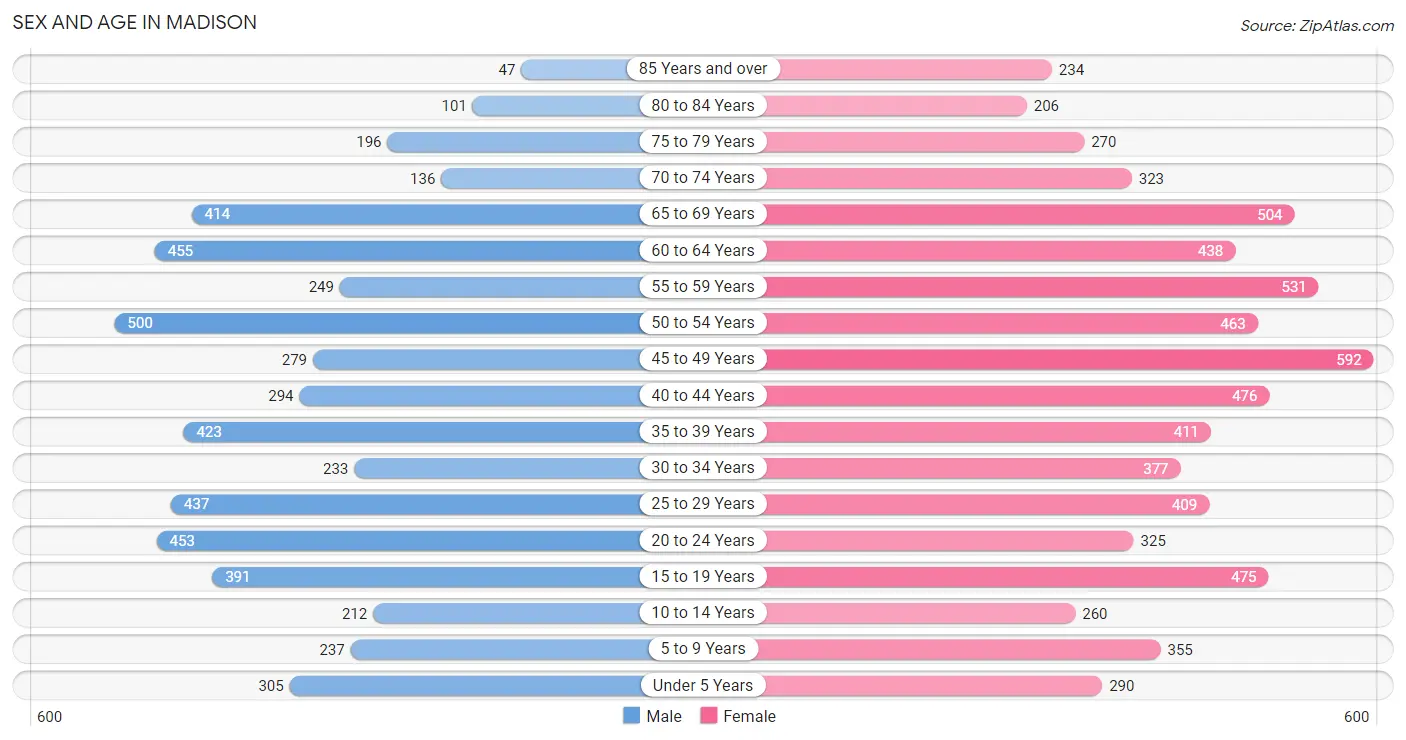
The most populous age groups in Madison are 50 to 54 Years (500 | 9.3%) for men and 45 to 49 Years (592 | 8.5%) for women.
| Age Bracket | Male | Female |
| Under 5 Years | 305 (5.7%) | 290 (4.2%) |
| 5 to 9 Years | 237 (4.4%) | 355 (5.1%) |
| 10 to 14 Years | 212 (4.0%) | 260 (3.7%) |
| 15 to 19 Years | 391 (7.3%) | 475 (6.9%) |
| 20 to 24 Years | 453 (8.5%) | 325 (4.7%) |
| 25 to 29 Years | 437 (8.2%) | 409 (5.9%) |
| 30 to 34 Years | 233 (4.3%) | 377 (5.4%) |
| 35 to 39 Years | 423 (7.9%) | 411 (5.9%) |
| 40 to 44 Years | 294 (5.5%) | 476 (6.9%) |
| 45 to 49 Years | 279 (5.2%) | 592 (8.5%) |
| 50 to 54 Years | 500 (9.3%) | 463 (6.7%) |
| 55 to 59 Years | 249 (4.6%) | 531 (7.6%) |
| 60 to 64 Years | 455 (8.5%) | 438 (6.3%) |
| 65 to 69 Years | 414 (7.7%) | 504 (7.3%) |
| 70 to 74 Years | 136 (2.5%) | 323 (4.6%) |
| 75 to 79 Years | 196 (3.7%) | 270 (3.9%) |
| 80 to 84 Years | 101 (1.9%) | 206 (3.0%) |
| 85 Years and over | 47 (0.9%) | 234 (3.4%) |
| Total | 5,362 (100.0%) | 6,939 (100.0%) |
Families and Households in Madison
Median Family Size in Madison
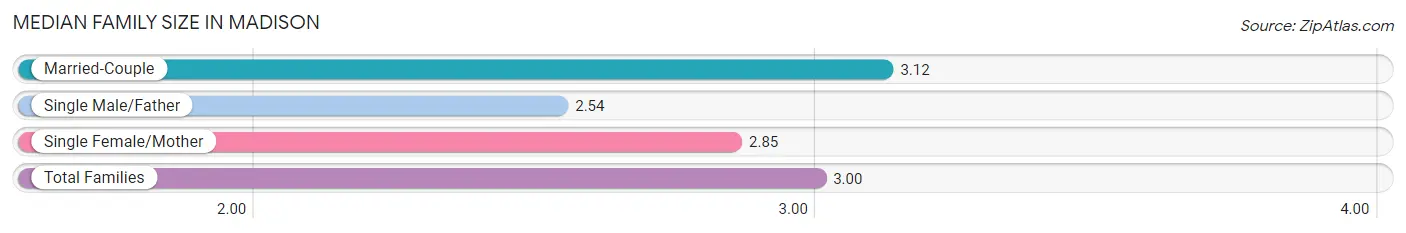
The median family size in Madison is 3.00 persons per family, with married-couple families (1,736 | 66.8%) accounting for the largest median family size of 3.12 persons per family. On the other hand, single male/father families (256 | 9.9%) represent the smallest median family size with 2.54 persons per family.
| Family Type | # Families | Family Size |
| Married-Couple | 1,736 (66.8%) | 3.12 |
| Single Male/Father | 256 (9.9%) | 2.54 |
| Single Female/Mother | 608 (23.4%) | 2.85 |
| Total Families | 2,600 (100.0%) | 3.00 |
Median Household Size in Madison
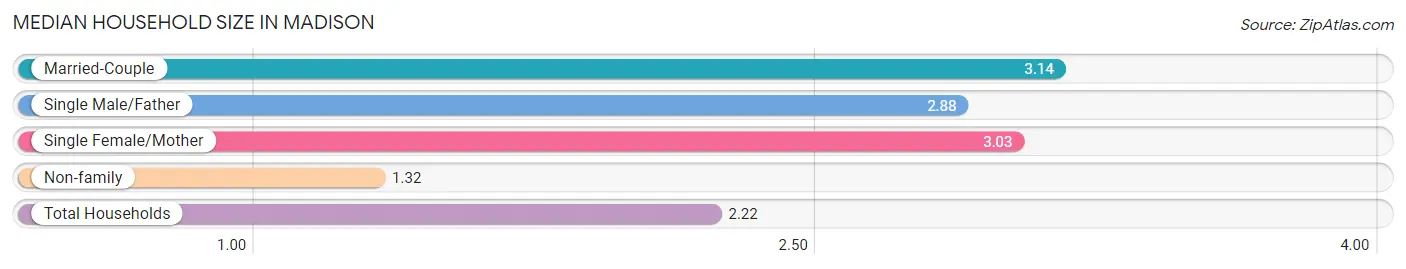
The median household size in Madison is 2.22 persons per household, with married-couple households (1,736 | 34.0%) accounting for the largest median household size of 3.14 persons per household. non-family households (2,501 | 49.0%) represent the smallest median household size with 1.32 persons per household.
| Household Type | # Households | Household Size |
| Married-Couple | 1,736 (34.0%) | 3.14 |
| Single Male/Father | 256 (5.0%) | 2.88 |
| Single Female/Mother | 608 (11.9%) | 3.03 |
| Non-family | 2,501 (49.0%) | 1.32 |
| Total Households | 5,101 (100.0%) | 2.22 |
Household Size by Marriage Status in Madison
Out of a total of 5,101 households in Madison, 2,600 (51.0%) are family households, while 2,501 (49.0%) are nonfamily households. The most numerous type of family households are 2-person households, comprising 1,042, and the most common type of nonfamily households are 1-person households, comprising 2,057.
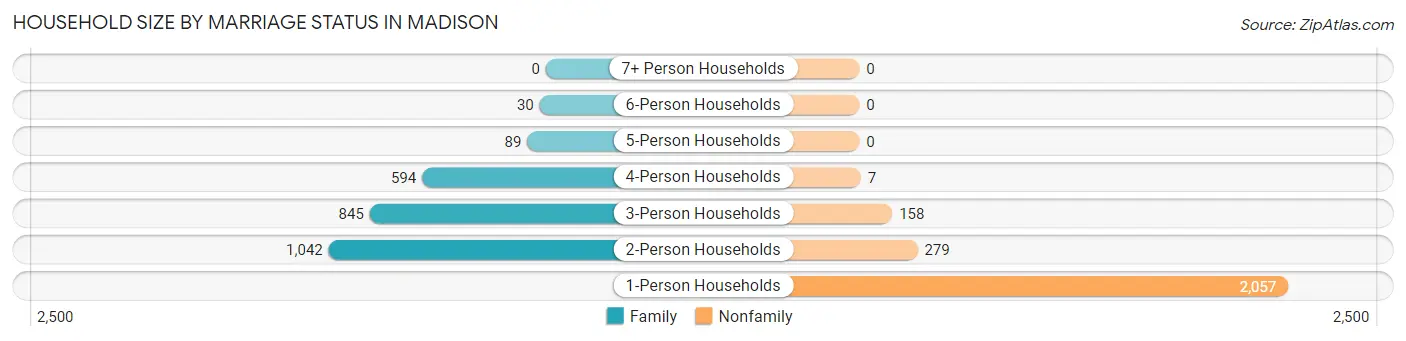
| Household Size | Family Households | Nonfamily Households |
| 1-Person Households | - | 2,057 (40.3%) |
| 2-Person Households | 1,042 (20.4%) | 279 (5.5%) |
| 3-Person Households | 845 (16.6%) | 158 (3.1%) |
| 4-Person Households | 594 (11.6%) | 7 (0.1%) |
| 5-Person Households | 89 (1.7%) | 0 (0.0%) |
| 6-Person Households | 30 (0.6%) | 0 (0.0%) |
| 7+ Person Households | 0 (0.0%) | 0 (0.0%) |
| Total | 2,600 (51.0%) | 2,501 (49.0%) |
Female Fertility in Madison
Fertility by Age in Madison
Average fertility rate in Madison is 63.0 births per 1,000 women. Women in the age bracket of 20 to 34 years have the highest fertility rate with 149.0 births per 1,000 women. Women in the age bracket of 20 to 34 years acount for 84.2% of all women with births.
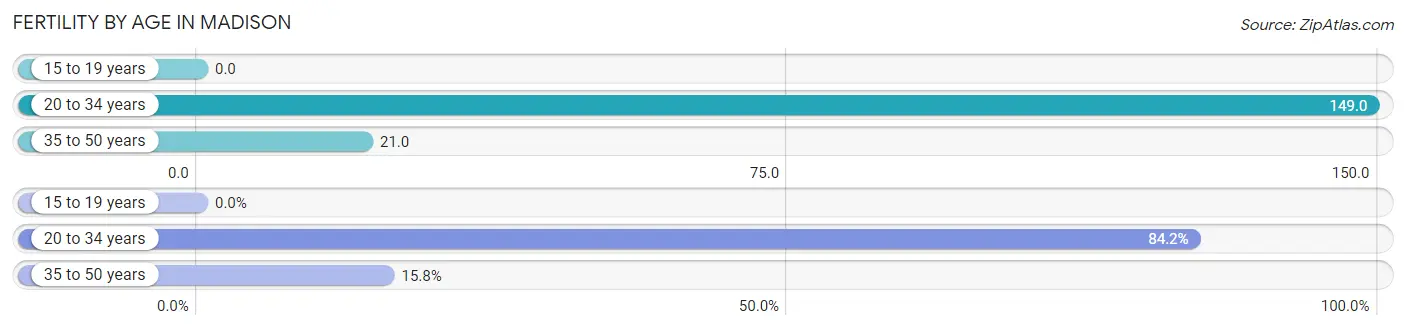
| Age Bracket | Women with Births | Births / 1,000 Women |
| 15 to 19 years | 0 (0.0%) | 0.0 |
| 20 to 34 years | 165 (84.2%) | 149.0 |
| 35 to 50 years | 31 (15.8%) | 21.0 |
| Total | 196 (100.0%) | 63.0 |
Fertility by Age by Marriage Status in Madison
67.9% of women with births (196) in Madison are married. The highest percentage of unmarried women with births falls into 35 to 50 years age bracket with 100.0% of them unmarried at the time of birth, while the lowest percentage of unmarried women with births belong to 20 to 34 years age bracket with 19.4% of them unmarried.
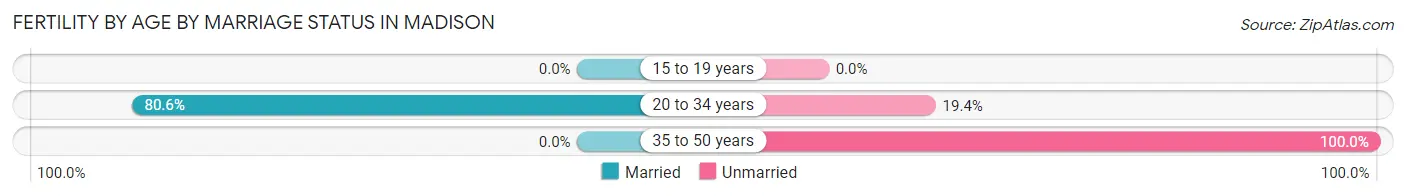
| Age Bracket | Married | Unmarried |
| 15 to 19 years | 0 (0.0%) | 0 (0.0%) |
| 20 to 34 years | 133 (80.6%) | 32 (19.4%) |
| 35 to 50 years | 0 (0.0%) | 31 (100.0%) |
| Total | 133 (67.9%) | 63 (32.1%) |
Fertility by Education in Madison
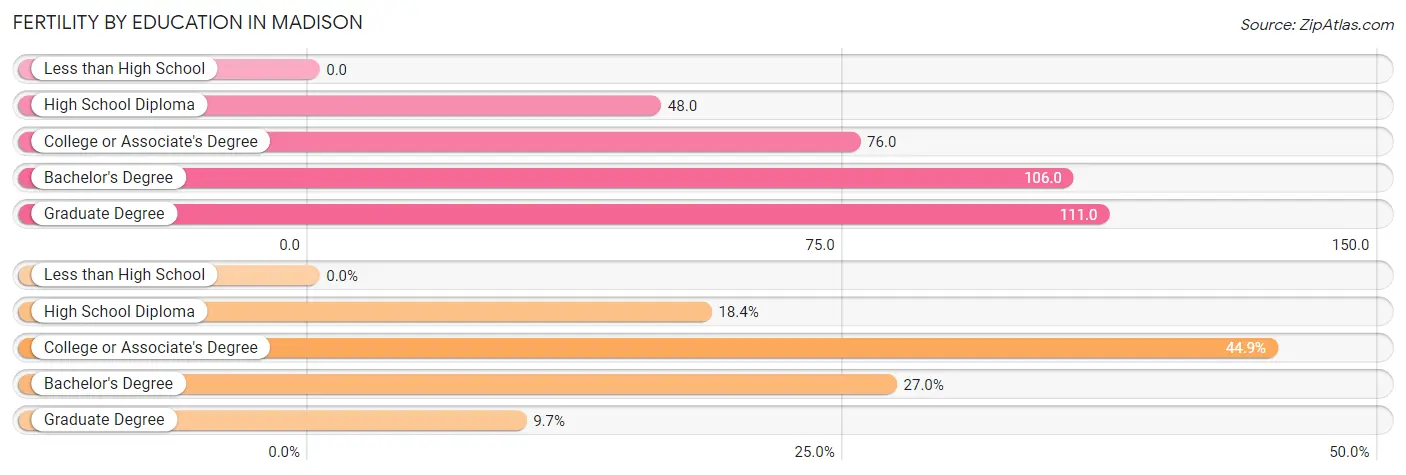
| Educational Attainment | Women with Births | Births / 1,000 Women |
| Less than High School | 0 (0.0%) | 0.0 |
| High School Diploma | 36 (18.4%) | 48.0 |
| College or Associate's Degree | 88 (44.9%) | 76.0 |
| Bachelor's Degree | 53 (27.0%) | 106.0 |
| Graduate Degree | 19 (9.7%) | 111.0 |
| Total | 196 (100.0%) | 63.0 |
Fertility by Education by Marriage Status in Madison
32.1% of women with births in Madison are unmarried. Women with the educational attainment of bachelor's degree are most likely to be married with 100.0% of them married at childbirth, while women with the educational attainment of high school diploma are least likely to be married with 52.8% of them unmarried at childbirth.
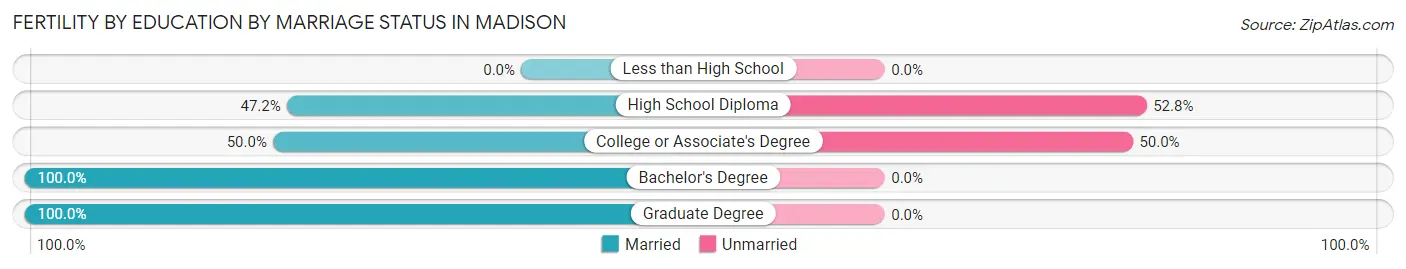
| Educational Attainment | Married | Unmarried |
| Less than High School | 0 (0.0%) | 0 (0.0%) |
| High School Diploma | 17 (47.2%) | 19 (52.8%) |
| College or Associate's Degree | 44 (50.0%) | 44 (50.0%) |
| Bachelor's Degree | 53 (100.0%) | 0 (0.0%) |
| Graduate Degree | 19 (100.0%) | 0 (0.0%) |
| Total | 133 (67.9%) | 63 (32.1%) |
Employment Characteristics in Madison
Employment by Class of Employer in Madison
Among the 5,572 employed individuals in Madison, private company employees (4,201 | 75.4%), not-for-profit organizations (428 | 7.7%), and local government employees (349 | 6.3%) make up the most common classes of employment.
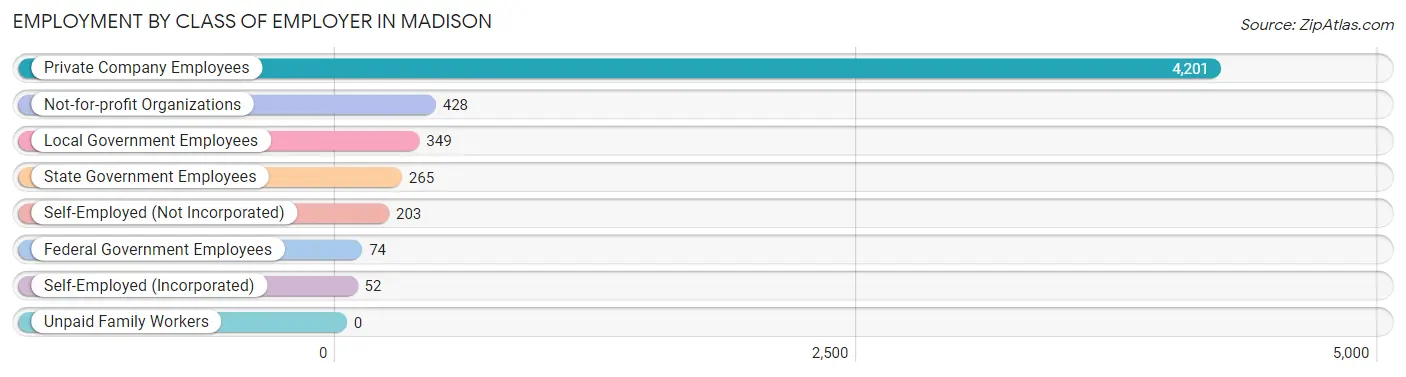
| Employer Class | # Employees | % Employees |
| Private Company Employees | 4,201 | 75.4% |
| Self-Employed (Incorporated) | 52 | 0.9% |
| Self-Employed (Not Incorporated) | 203 | 3.6% |
| Not-for-profit Organizations | 428 | 7.7% |
| Local Government Employees | 349 | 6.3% |
| State Government Employees | 265 | 4.8% |
| Federal Government Employees | 74 | 1.3% |
| Unpaid Family Workers | 0 | 0.0% |
| Total | 5,572 | 100.0% |
Employment Status by Age in Madison
According to the labor force statistics for Madison, out of the total population over 16 years of age (10,510), 55.5% or 5,833 individuals are in the labor force, with 3.3% or 192 of them unemployed. The age group with the highest labor force participation rate is 20 to 24 years, with 91.3% or 710 individuals in the labor force. Within the labor force, the 20 to 24 years age range has the highest percentage of unemployed individuals, with 12.1% or 86 of them being unemployed.
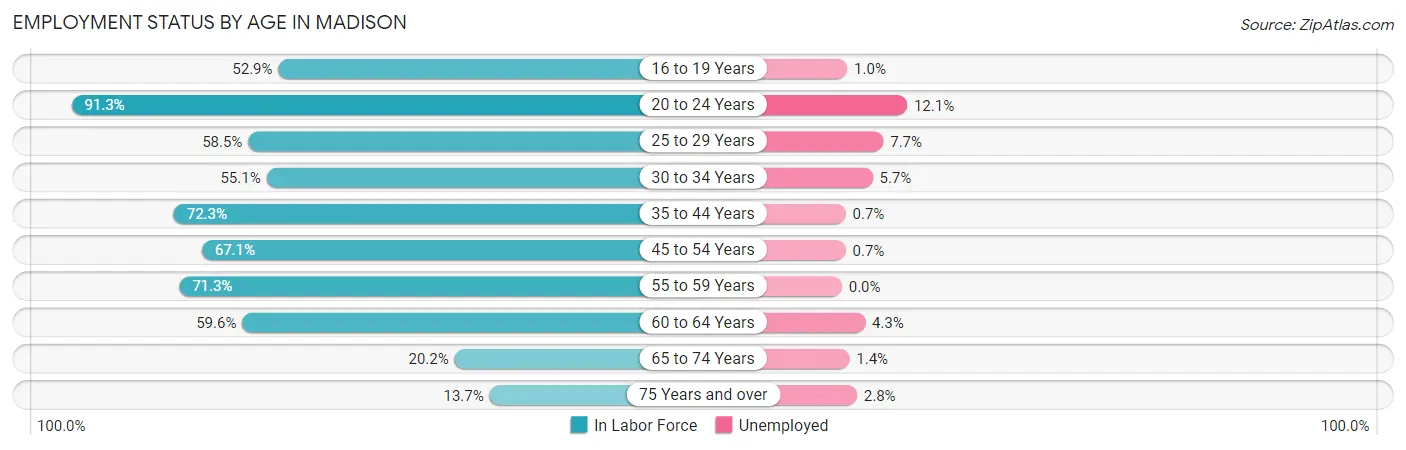
| Age Bracket | In Labor Force | Unemployed |
| 16 to 19 Years | 388 (52.9%) | 4 (1.0%) |
| 20 to 24 Years | 710 (91.3%) | 86 (12.1%) |
| 25 to 29 Years | 495 (58.5%) | 38 (7.7%) |
| 30 to 34 Years | 336 (55.1%) | 19 (5.7%) |
| 35 to 44 Years | 1,160 (72.3%) | 8 (0.7%) |
| 45 to 54 Years | 1,231 (67.1%) | 9 (0.7%) |
| 55 to 59 Years | 556 (71.3%) | 0 (0.0%) |
| 60 to 64 Years | 532 (59.6%) | 23 (4.3%) |
| 65 to 74 Years | 278 (20.2%) | 4 (1.4%) |
| 75 Years and over | 144 (13.7%) | 4 (2.8%) |
| Total | 5,833 (55.5%) | 192 (3.3%) |
Employment Status by Educational Attainment in Madison
According to labor force statistics for Madison, 65.6% of individuals (4,308) out of the total population between 25 and 64 years of age (6,567) are in the labor force, with 2.3% or 99 of them being unemployed. The group with the highest labor force participation rate are those with the educational attainment of bachelor's degree or higher, with 85.4% or 1,138 individuals in the labor force. Within the labor force, individuals with less than high school education have the highest percentage of unemployment, with 16.4% or 38 of them being unemployed.
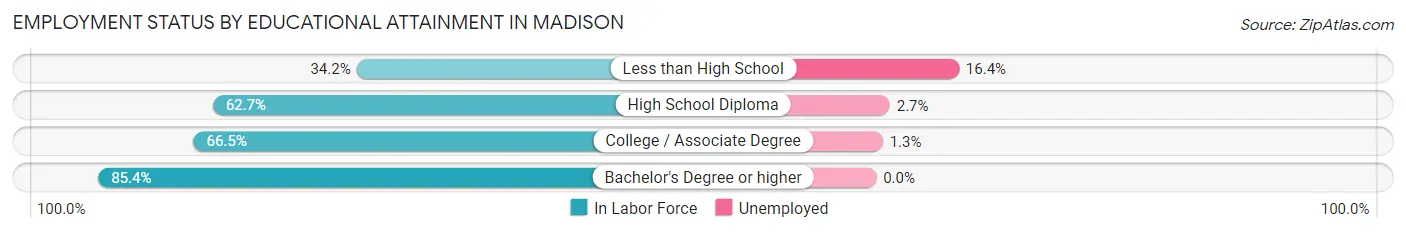
| Educational Attainment | In Labor Force | Unemployed |
| Less than High School | 232 (34.2%) | 111 (16.4%) |
| High School Diploma | 1,504 (62.7%) | 65 (2.7%) |
| College / Associate Degree | 1,434 (66.5%) | 28 (1.3%) |
| Bachelor's Degree or higher | 1,138 (85.4%) | 0 (0.0%) |
| Total | 4,308 (65.6%) | 151 (2.3%) |
Employment Occupations by Sex in Madison
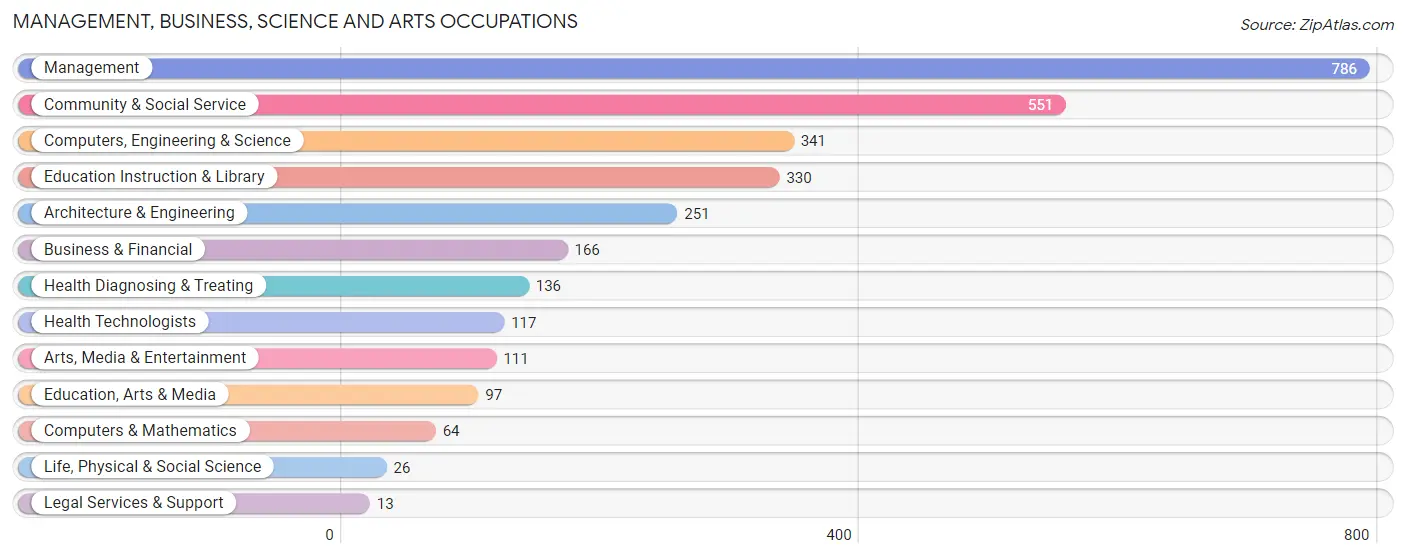
Management, Business, Science and Arts Occupations
The most common Management, Business, Science and Arts occupations in Madison are Management (786 | 14.0%), Community & Social Service (551 | 9.8%), Computers, Engineering & Science (341 | 6.0%), Education Instruction & Library (330 | 5.9%), and Architecture & Engineering (251 | 4.5%).
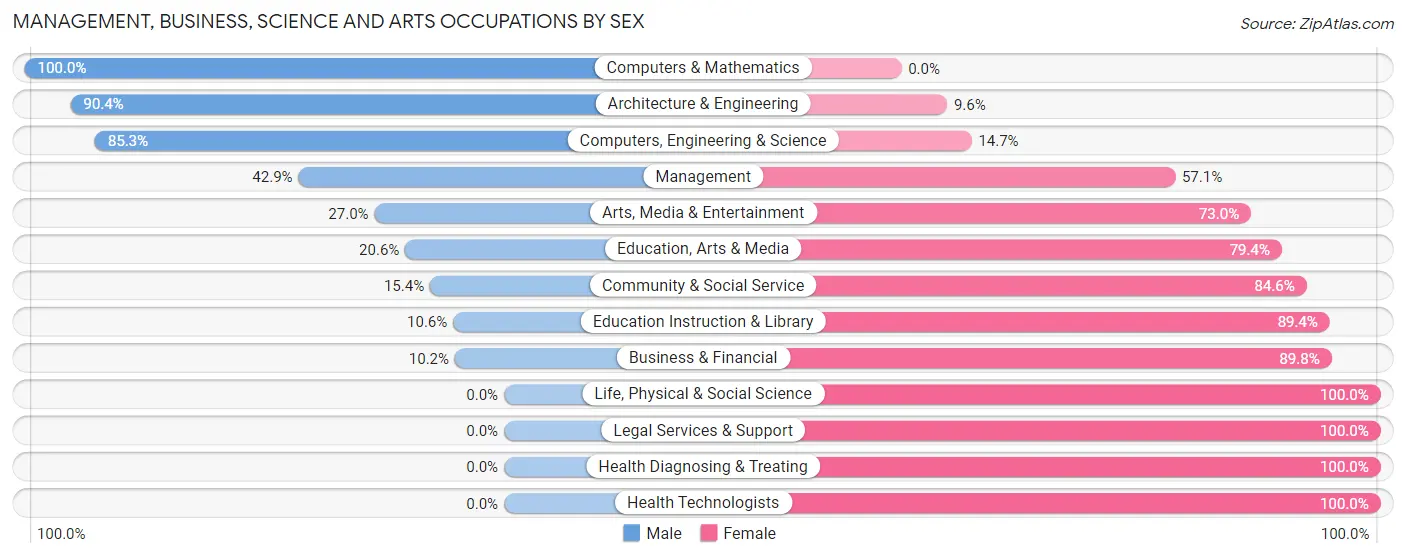
Management, Business, Science and Arts Occupations by Sex
Within the Management, Business, Science and Arts occupations in Madison, the most male-oriented occupations are Computers & Mathematics (100.0%), Architecture & Engineering (90.4%), and Computers, Engineering & Science (85.3%), while the most female-oriented occupations are Life, Physical & Social Science (100.0%), Legal Services & Support (100.0%), and Health Diagnosing & Treating (100.0%).
| Occupation | Male | Female |
| Management | 337 (42.9%) | 449 (57.1%) |
| Business & Financial | 17 (10.2%) | 149 (89.8%) |
| Computers, Engineering & Science | 291 (85.3%) | 50 (14.7%) |
| Computers & Mathematics | 64 (100.0%) | 0 (0.0%) |
| Architecture & Engineering | 227 (90.4%) | 24 (9.6%) |
| Life, Physical & Social Science | 0 (0.0%) | 26 (100.0%) |
| Community & Social Service | 85 (15.4%) | 466 (84.6%) |
| Education, Arts & Media | 20 (20.6%) | 77 (79.4%) |
| Legal Services & Support | 0 (0.0%) | 13 (100.0%) |
| Education Instruction & Library | 35 (10.6%) | 295 (89.4%) |
| Arts, Media & Entertainment | 30 (27.0%) | 81 (73.0%) |
| Health Diagnosing & Treating | 0 (0.0%) | 136 (100.0%) |
| Health Technologists | 0 (0.0%) | 117 (100.0%) |
| Total (Category) | 730 (36.9%) | 1,250 (63.1%) |
| Total (Overall) | 3,064 (54.4%) | 2,570 (45.6%) |
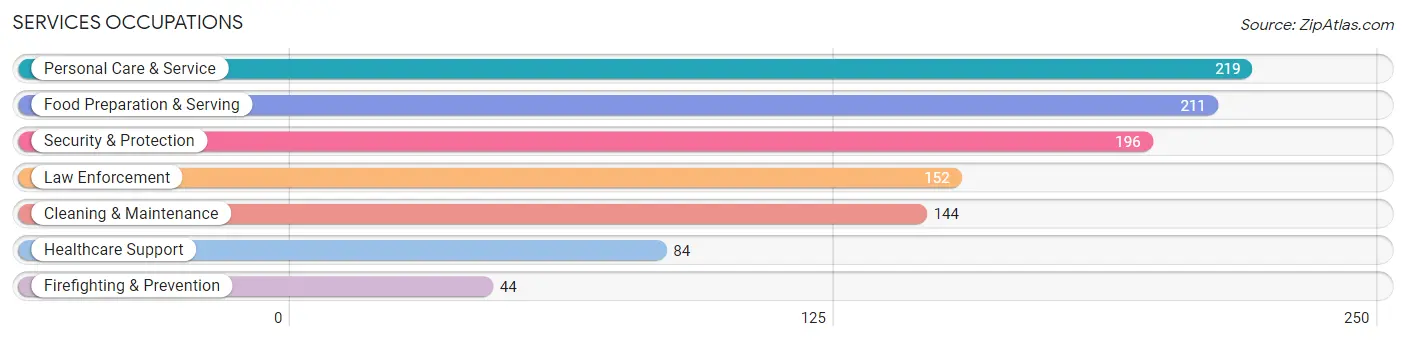
Services Occupations
The most common Services occupations in Madison are Personal Care & Service (219 | 3.9%), Food Preparation & Serving (211 | 3.7%), Security & Protection (196 | 3.5%), Law Enforcement (152 | 2.7%), and Cleaning & Maintenance (144 | 2.6%).
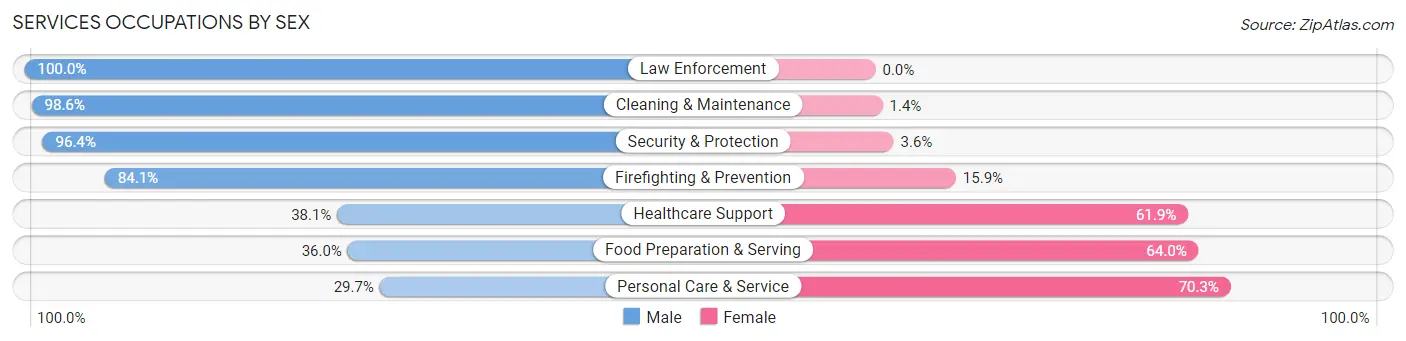
Services Occupations by Sex
Within the Services occupations in Madison, the most male-oriented occupations are Law Enforcement (100.0%), Cleaning & Maintenance (98.6%), and Security & Protection (96.4%), while the most female-oriented occupations are Personal Care & Service (70.3%), Food Preparation & Serving (64.0%), and Healthcare Support (61.9%).
| Occupation | Male | Female |
| Healthcare Support | 32 (38.1%) | 52 (61.9%) |
| Security & Protection | 189 (96.4%) | 7 (3.6%) |
| Firefighting & Prevention | 37 (84.1%) | 7 (15.9%) |
| Law Enforcement | 152 (100.0%) | 0 (0.0%) |
| Food Preparation & Serving | 76 (36.0%) | 135 (64.0%) |
| Cleaning & Maintenance | 142 (98.6%) | 2 (1.4%) |
| Personal Care & Service | 65 (29.7%) | 154 (70.3%) |
| Total (Category) | 504 (59.0%) | 350 (41.0%) |
| Total (Overall) | 3,064 (54.4%) | 2,570 (45.6%) |
Sales and Office Occupations
The most common Sales and Office occupations in Madison are Sales & Related (729 | 12.9%), and Office & Administration (351 | 6.2%).
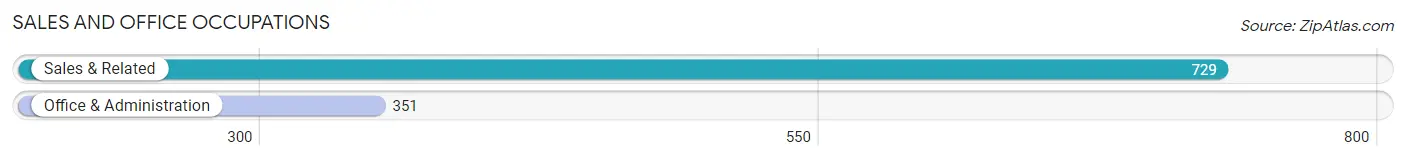
Sales and Office Occupations by Sex
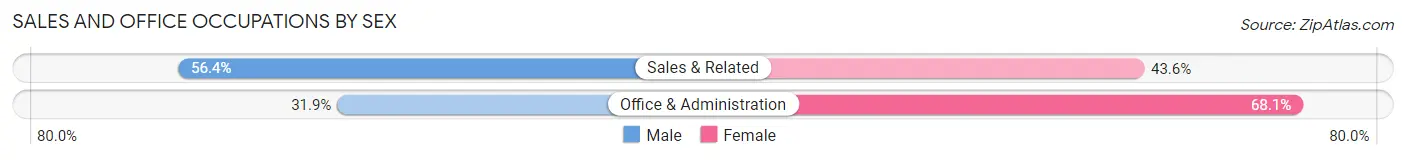
| Occupation | Male | Female |
| Sales & Related | 411 (56.4%) | 318 (43.6%) |
| Office & Administration | 112 (31.9%) | 239 (68.1%) |
| Total (Category) | 523 (48.4%) | 557 (51.6%) |
| Total (Overall) | 3,064 (54.4%) | 2,570 (45.6%) |
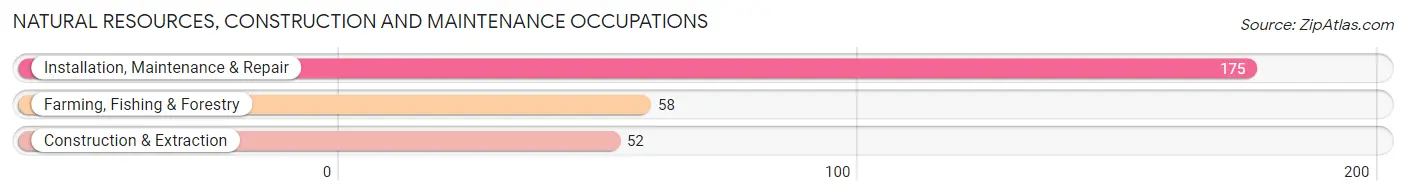
Natural Resources, Construction and Maintenance Occupations
The most common Natural Resources, Construction and Maintenance occupations in Madison are Installation, Maintenance & Repair (175 | 3.1%), Farming, Fishing & Forestry (58 | 1.0%), and Construction & Extraction (52 | 0.9%).
Natural Resources, Construction and Maintenance Occupations by Sex
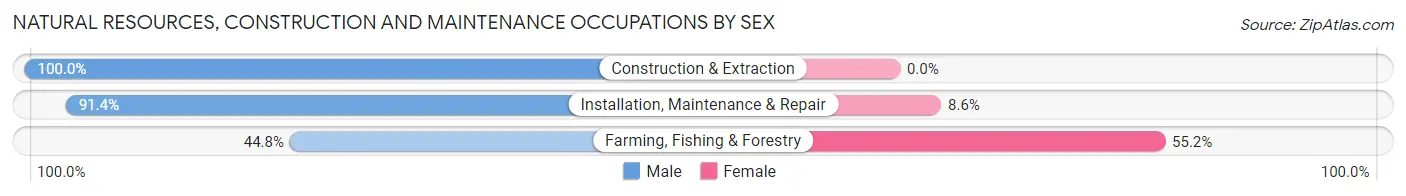
| Occupation | Male | Female |
| Farming, Fishing & Forestry | 26 (44.8%) | 32 (55.2%) |
| Construction & Extraction | 52 (100.0%) | 0 (0.0%) |
| Installation, Maintenance & Repair | 160 (91.4%) | 15 (8.6%) |
| Total (Category) | 238 (83.5%) | 47 (16.5%) |
| Total (Overall) | 3,064 (54.4%) | 2,570 (45.6%) |
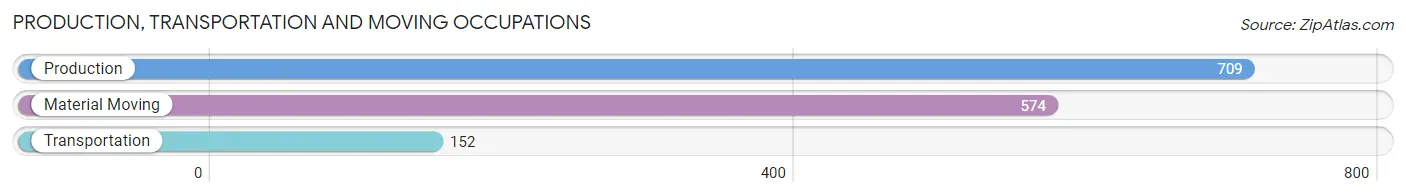
Production, Transportation and Moving Occupations
The most common Production, Transportation and Moving occupations in Madison are Production (709 | 12.6%), Material Moving (574 | 10.2%), and Transportation (152 | 2.7%).
Production, Transportation and Moving Occupations by Sex
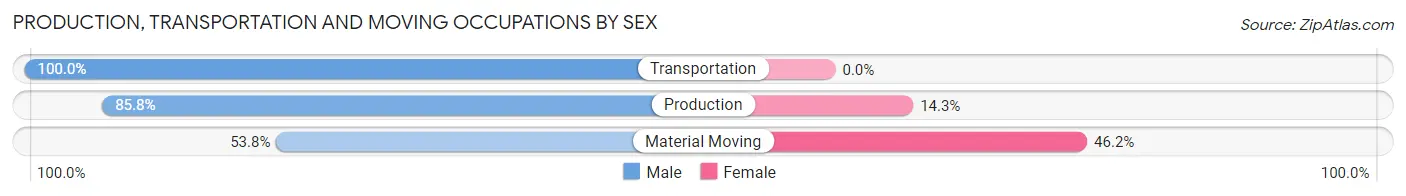
| Occupation | Male | Female |
| Production | 608 (85.8%) | 101 (14.2%) |
| Transportation | 152 (100.0%) | 0 (0.0%) |
| Material Moving | 309 (53.8%) | 265 (46.2%) |
| Total (Category) | 1,069 (74.5%) | 366 (25.5%) |
| Total (Overall) | 3,064 (54.4%) | 2,570 (45.6%) |
Employment Industries by Sex in Madison
Employment Industries in Madison
The major employment industries in Madison include Manufacturing (1,446 | 25.7%), Retail Trade (1,120 | 19.9%), Educational Services (513 | 9.1%), Health Care & Social Assistance (378 | 6.7%), and Real Estate, Rental & Leasing (310 | 5.5%).

Employment Industries by Sex in Madison
The Madison industries that see more men than women are Wholesale Trade (100.0%), Administrative & Support (100.0%), and Arts, Entertainment & Recreation (100.0%), whereas the industries that tend to have a higher number of women are Enterprise Management (100.0%), Real Estate, Rental & Leasing (83.2%), and Health Care & Social Assistance (82.3%).
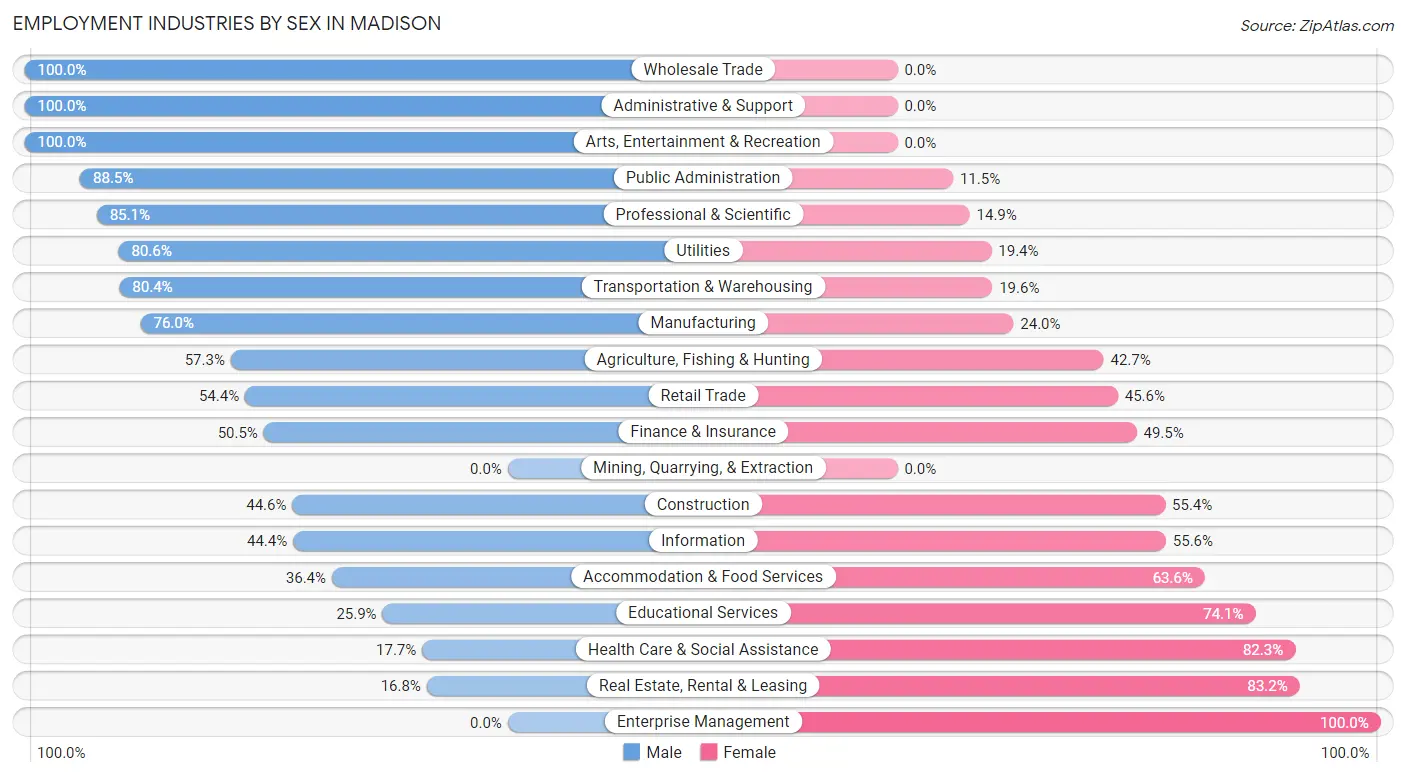
| Industry | Male | Female |
| Agriculture, Fishing & Hunting | 43 (57.3%) | 32 (42.7%) |
| Mining, Quarrying, & Extraction | 0 (0.0%) | 0 (0.0%) |
| Construction | 70 (44.6%) | 87 (55.4%) |
| Manufacturing | 1,099 (76.0%) | 347 (24.0%) |
| Wholesale Trade | 32 (100.0%) | 0 (0.0%) |
| Retail Trade | 609 (54.4%) | 511 (45.6%) |
| Transportation & Warehousing | 131 (80.4%) | 32 (19.6%) |
| Utilities | 145 (80.6%) | 35 (19.4%) |
| Information | 36 (44.4%) | 45 (55.6%) |
| Finance & Insurance | 50 (50.5%) | 49 (49.5%) |
| Real Estate, Rental & Leasing | 52 (16.8%) | 258 (83.2%) |
| Professional & Scientific | 74 (85.1%) | 13 (14.9%) |
| Enterprise Management | 0 (0.0%) | 7 (100.0%) |
| Administrative & Support | 32 (100.0%) | 0 (0.0%) |
| Educational Services | 133 (25.9%) | 380 (74.1%) |
| Health Care & Social Assistance | 67 (17.7%) | 311 (82.3%) |
| Arts, Entertainment & Recreation | 65 (100.0%) | 0 (0.0%) |
| Accommodation & Food Services | 99 (36.4%) | 173 (63.6%) |
| Public Administration | 200 (88.5%) | 26 (11.5%) |
| Total | 3,064 (54.4%) | 2,570 (45.6%) |
Education in Madison
School Enrollment in Madison
The most common levels of schooling among the 2,422 students in Madison are high school (628 | 25.9%), college / undergraduate (558 | 23.0%), and elementary school (498 | 20.6%).
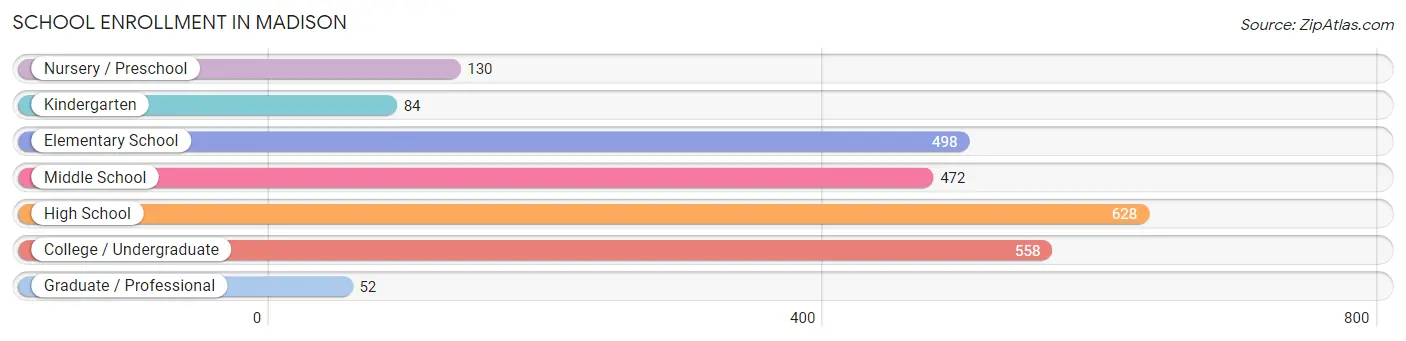
| School Level | # Students | % Students |
| Nursery / Preschool | 130 | 5.4% |
| Kindergarten | 84 | 3.5% |
| Elementary School | 498 | 20.6% |
| Middle School | 472 | 19.5% |
| High School | 628 | 25.9% |
| College / Undergraduate | 558 | 23.0% |
| Graduate / Professional | 52 | 2.1% |
| Total | 2,422 | 100.0% |
School Enrollment by Age by Funding Source in Madison
Out of a total of 2,422 students who are enrolled in schools in Madison, 458 (18.9%) attend a private institution, while the remaining 1,964 (81.1%) are enrolled in public schools. The age group of 15 to 17 year olds has the highest likelihood of being enrolled in private schools, with 129 (29.9% in the age bracket) enrolled. Conversely, the age group of 18 to 19 year olds has the lowest likelihood of being enrolled in a private school, with 258 (95.2% in the age bracket) attending a public institution.
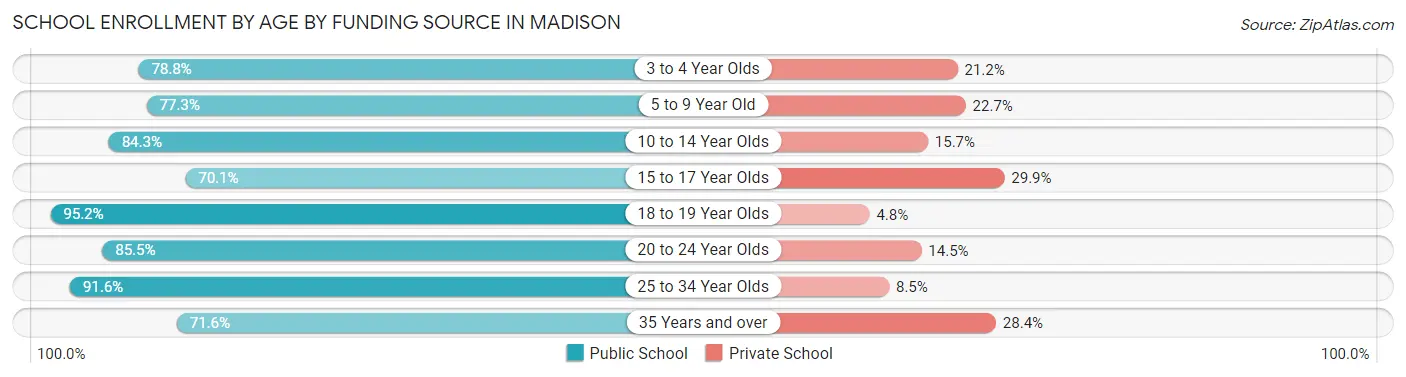
| Age Bracket | Public School | Private School |
| 3 to 4 Year Olds | 78 (78.8%) | 21 (21.2%) |
| 5 to 9 Year Old | 449 (77.3%) | 132 (22.7%) |
| 10 to 14 Year Olds | 398 (84.3%) | 74 (15.7%) |
| 15 to 17 Year Olds | 302 (70.1%) | 129 (29.9%) |
| 18 to 19 Year Olds | 258 (95.2%) | 13 (4.8%) |
| 20 to 24 Year Olds | 189 (85.5%) | 32 (14.5%) |
| 25 to 34 Year Olds | 195 (91.5%) | 18 (8.5%) |
| 35 Years and over | 96 (71.6%) | 38 (28.4%) |
| Total | 1,964 (81.1%) | 458 (18.9%) |
Educational Attainment by Field of Study in Madison
Business (445 | 19.7%), education (331 | 14.6%), engineering (208 | 9.2%), science & technology (199 | 8.8%), and social sciences (184 | 8.1%) are the most common fields of study among 2,260 individuals in Madison who have obtained a bachelor's degree or higher.
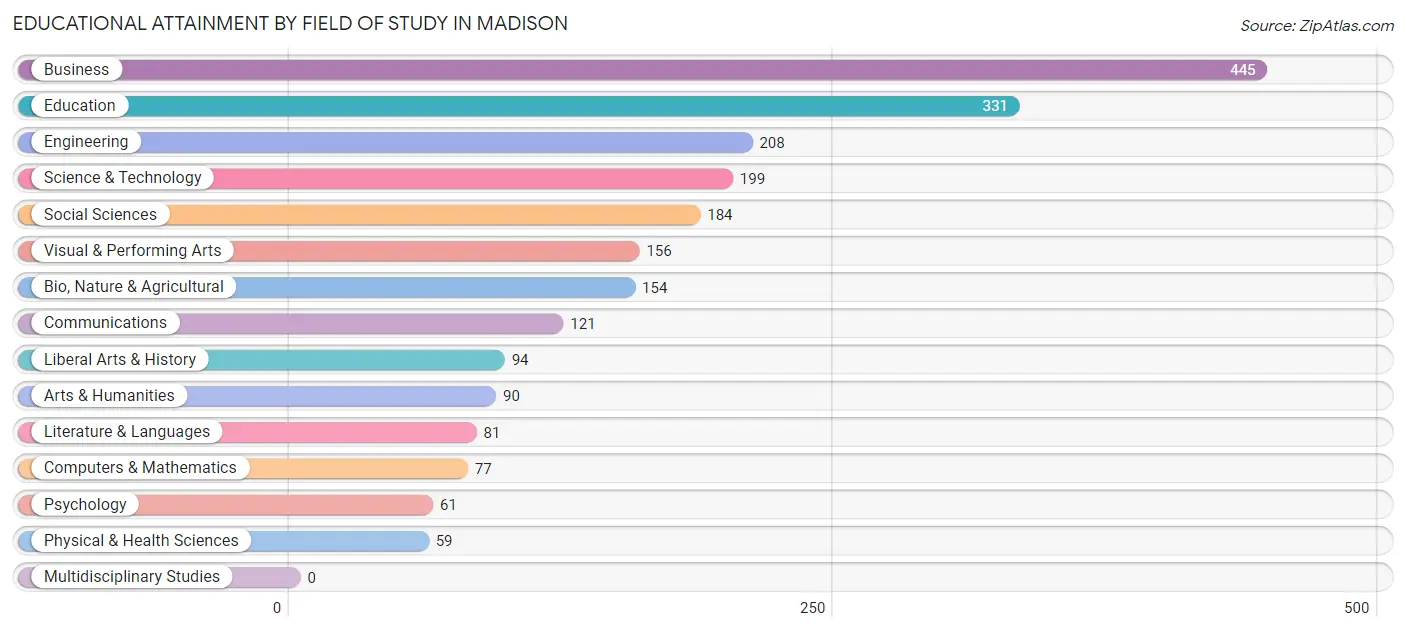
| Field of Study | # Graduates | % Graduates |
| Computers & Mathematics | 77 | 3.4% |
| Bio, Nature & Agricultural | 154 | 6.8% |
| Physical & Health Sciences | 59 | 2.6% |
| Psychology | 61 | 2.7% |
| Social Sciences | 184 | 8.1% |
| Engineering | 208 | 9.2% |
| Multidisciplinary Studies | 0 | 0.0% |
| Science & Technology | 199 | 8.8% |
| Business | 445 | 19.7% |
| Education | 331 | 14.6% |
| Literature & Languages | 81 | 3.6% |
| Liberal Arts & History | 94 | 4.2% |
| Visual & Performing Arts | 156 | 6.9% |
| Communications | 121 | 5.3% |
| Arts & Humanities | 90 | 4.0% |
| Total | 2,260 | 100.0% |
Transportation & Commute in Madison
Vehicle Availability by Sex in Madison
The most prevalent vehicle ownership categories in Madison are males with 2 vehicles (1,189, accounting for 38.8%) and females with 2 vehicles (897, making up 47.4%).
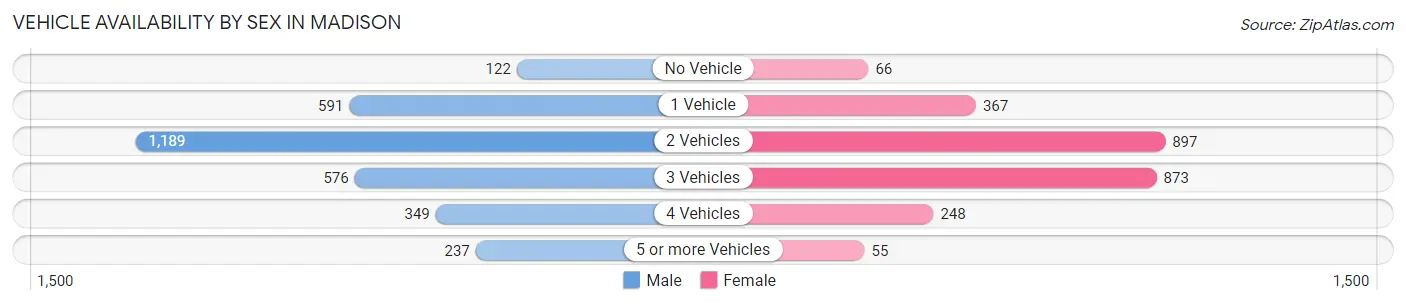
| Vehicles Available | Male | Female |
| No Vehicle | 122 (4.0%) | 66 (2.6%) |
| 1 Vehicle | 591 (19.3%) | 367 (14.6%) |
| 2 Vehicles | 1,189 (38.8%) | 897 (35.8%) |
| 3 Vehicles | 576 (18.8%) | 873 (34.8%) |
| 4 Vehicles | 349 (11.4%) | 248 (9.9%) |
| 5 or more Vehicles | 237 (7.7%) | 55 (2.2%) |
| Total | 3,064 (100.0%) | 2,506 (100.0%) |
Commute Time in Madison
The most frequently occuring commute durations in Madison are 5 to 9 minutes (1,647 commuters, 31.7%), 10 to 14 minutes (1,129 commuters, 21.7%), and 45 to 59 minutes (763 commuters, 14.7%).
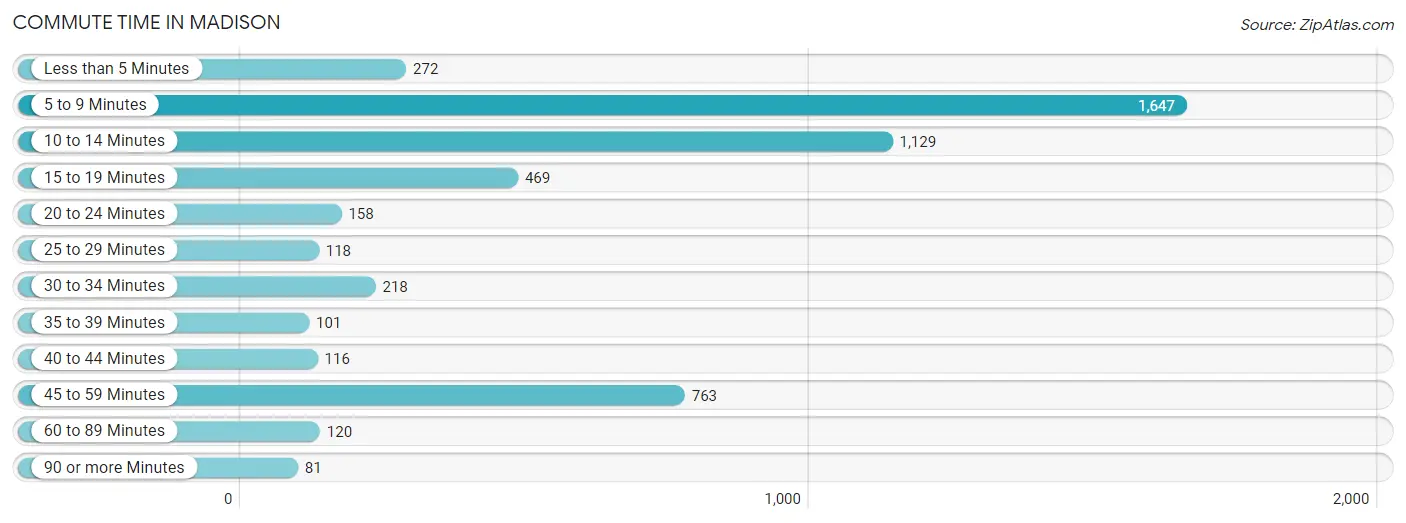
| Commute Time | # Commuters | % Commuters |
| Less than 5 Minutes | 272 | 5.2% |
| 5 to 9 Minutes | 1,647 | 31.7% |
| 10 to 14 Minutes | 1,129 | 21.7% |
| 15 to 19 Minutes | 469 | 9.0% |
| 20 to 24 Minutes | 158 | 3.0% |
| 25 to 29 Minutes | 118 | 2.3% |
| 30 to 34 Minutes | 218 | 4.2% |
| 35 to 39 Minutes | 101 | 1.9% |
| 40 to 44 Minutes | 116 | 2.2% |
| 45 to 59 Minutes | 763 | 14.7% |
| 60 to 89 Minutes | 120 | 2.3% |
| 90 or more Minutes | 81 | 1.6% |
Commute Time by Sex in Madison
The most common commute times in Madison are 5 to 9 minutes (923 commuters, 32.6%) for males and 5 to 9 minutes (724 commuters, 30.7%) for females.
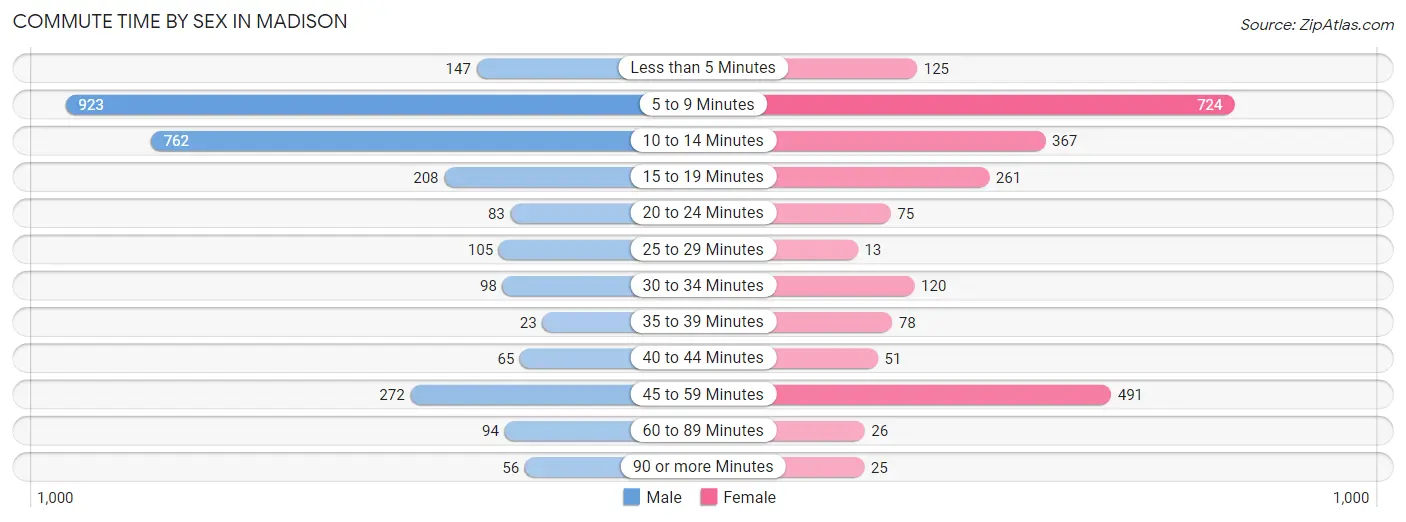
| Commute Time | Male | Female |
| Less than 5 Minutes | 147 (5.2%) | 125 (5.3%) |
| 5 to 9 Minutes | 923 (32.6%) | 724 (30.7%) |
| 10 to 14 Minutes | 762 (26.9%) | 367 (15.6%) |
| 15 to 19 Minutes | 208 (7.3%) | 261 (11.1%) |
| 20 to 24 Minutes | 83 (2.9%) | 75 (3.2%) |
| 25 to 29 Minutes | 105 (3.7%) | 13 (0.5%) |
| 30 to 34 Minutes | 98 (3.5%) | 120 (5.1%) |
| 35 to 39 Minutes | 23 (0.8%) | 78 (3.3%) |
| 40 to 44 Minutes | 65 (2.3%) | 51 (2.2%) |
| 45 to 59 Minutes | 272 (9.6%) | 491 (20.8%) |
| 60 to 89 Minutes | 94 (3.3%) | 26 (1.1%) |
| 90 or more Minutes | 56 (2.0%) | 25 (1.1%) |
Time of Departure to Work by Sex in Madison
The most frequent times of departure to work in Madison are 7:30 AM to 7:59 AM (478, 16.9%) for males and 6:00 AM to 6:29 AM (460, 19.5%) for females.
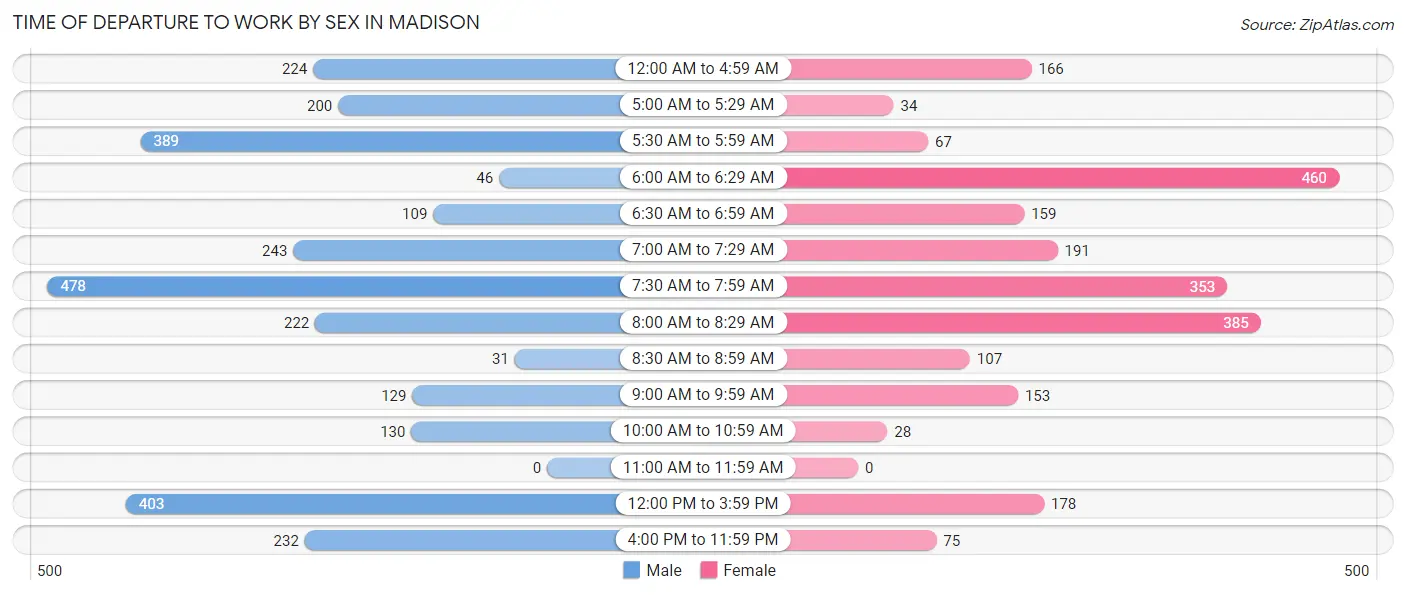
| Time of Departure | Male | Female |
| 12:00 AM to 4:59 AM | 224 (7.9%) | 166 (7.0%) |
| 5:00 AM to 5:29 AM | 200 (7.0%) | 34 (1.4%) |
| 5:30 AM to 5:59 AM | 389 (13.7%) | 67 (2.8%) |
| 6:00 AM to 6:29 AM | 46 (1.6%) | 460 (19.5%) |
| 6:30 AM to 6:59 AM | 109 (3.8%) | 159 (6.8%) |
| 7:00 AM to 7:29 AM | 243 (8.6%) | 191 (8.1%) |
| 7:30 AM to 7:59 AM | 478 (16.9%) | 353 (15.0%) |
| 8:00 AM to 8:29 AM | 222 (7.8%) | 385 (16.3%) |
| 8:30 AM to 8:59 AM | 31 (1.1%) | 107 (4.5%) |
| 9:00 AM to 9:59 AM | 129 (4.5%) | 153 (6.5%) |
| 10:00 AM to 10:59 AM | 130 (4.6%) | 28 (1.2%) |
| 11:00 AM to 11:59 AM | 0 (0.0%) | 0 (0.0%) |
| 12:00 PM to 3:59 PM | 403 (14.2%) | 178 (7.6%) |
| 4:00 PM to 11:59 PM | 232 (8.2%) | 75 (3.2%) |
| Total | 2,836 (100.0%) | 2,356 (100.0%) |
Housing Occupancy in Madison
Occupancy by Ownership in Madison
Of the total 5,101 dwellings in Madison, owner-occupied units account for 2,855 (56.0%), while renter-occupied units make up 2,246 (44.0%).
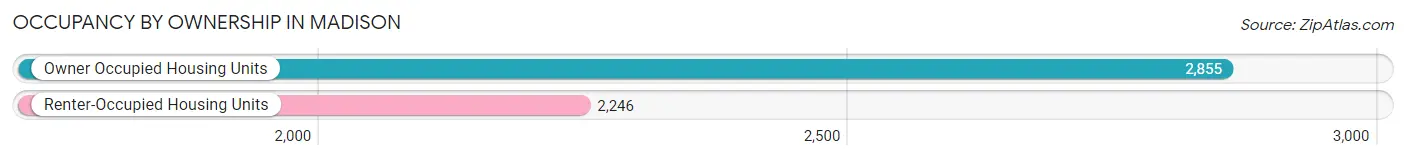
| Occupancy | # Housing Units | % Housing Units |
| Owner Occupied Housing Units | 2,855 | 56.0% |
| Renter-Occupied Housing Units | 2,246 | 44.0% |
| Total Occupied Housing Units | 5,101 | 100.0% |
Occupancy by Household Size in Madison
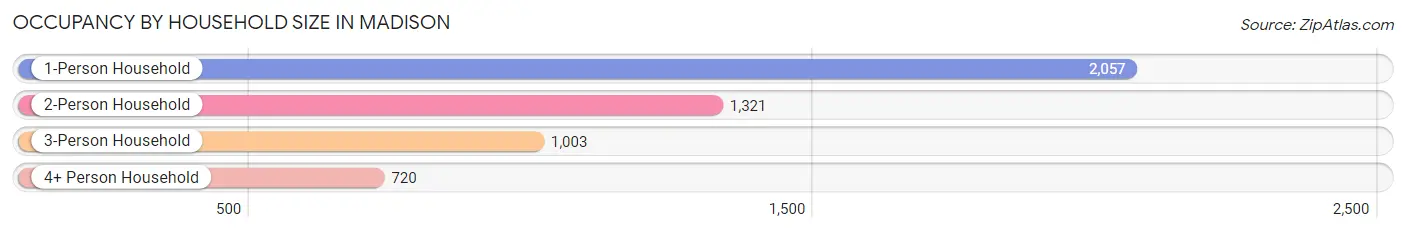
| Household Size | # Housing Units | % Housing Units |
| 1-Person Household | 2,057 | 40.3% |
| 2-Person Household | 1,321 | 25.9% |
| 3-Person Household | 1,003 | 19.7% |
| 4+ Person Household | 720 | 14.1% |
| Total Housing Units | 5,101 | 100.0% |
Occupancy by Ownership by Household Size in Madison
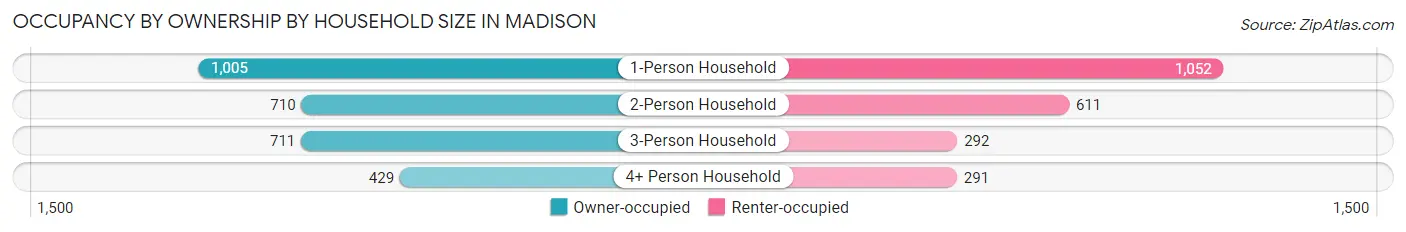
| Household Size | Owner-occupied | Renter-occupied |
| 1-Person Household | 1,005 (48.9%) | 1,052 (51.1%) |
| 2-Person Household | 710 (53.7%) | 611 (46.3%) |
| 3-Person Household | 711 (70.9%) | 292 (29.1%) |
| 4+ Person Household | 429 (59.6%) | 291 (40.4%) |
| Total Housing Units | 2,855 (56.0%) | 2,246 (44.0%) |
Occupancy by Educational Attainment in Madison
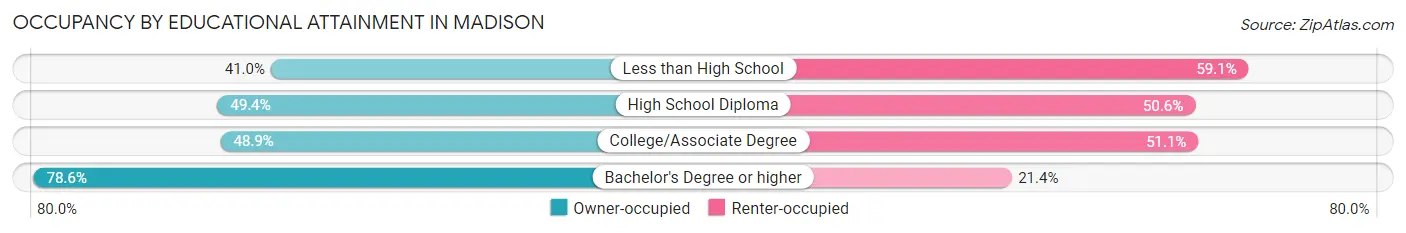
| Household Size | Owner-occupied | Renter-occupied |
| Less than High School | 251 (40.9%) | 362 (59.1%) |
| High School Diploma | 812 (49.4%) | 831 (50.6%) |
| College/Associate Degree | 732 (48.9%) | 764 (51.1%) |
| Bachelor's Degree or higher | 1,060 (78.6%) | 289 (21.4%) |
Occupancy by Age of Householder in Madison
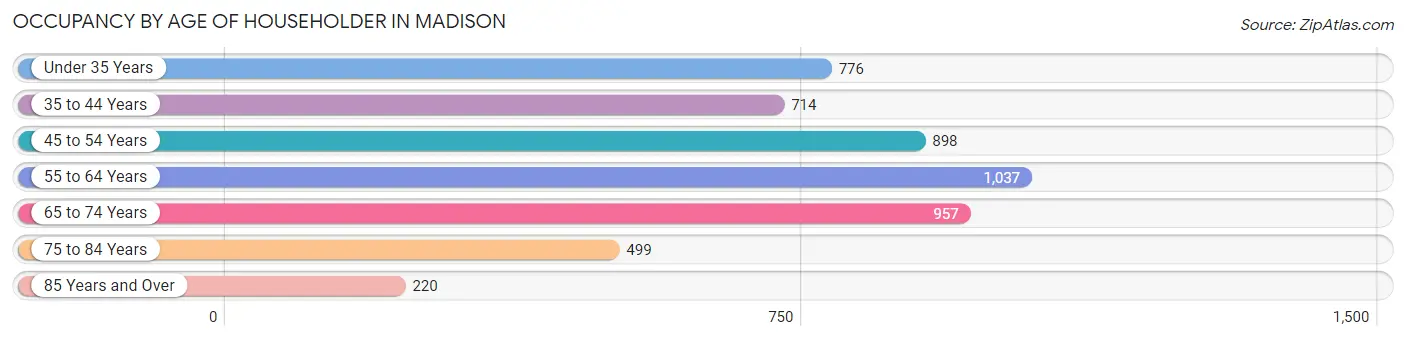
| Age Bracket | # Households | % Households |
| Under 35 Years | 776 | 15.2% |
| 35 to 44 Years | 714 | 14.0% |
| 45 to 54 Years | 898 | 17.6% |
| 55 to 64 Years | 1,037 | 20.3% |
| 65 to 74 Years | 957 | 18.8% |
| 75 to 84 Years | 499 | 9.8% |
| 85 Years and Over | 220 | 4.3% |
| Total | 5,101 | 100.0% |
Housing Finances in Madison
Median Income by Occupancy in Madison
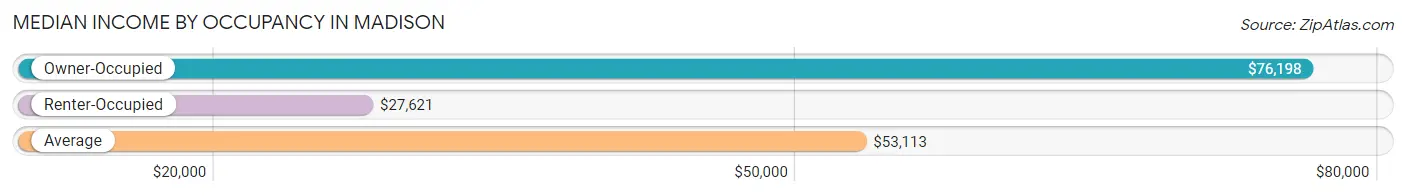
| Occupancy Type | # Households | Median Income |
| Owner-Occupied | 2,855 (56.0%) | $76,198 |
| Renter-Occupied | 2,246 (44.0%) | $27,621 |
| Average | 5,101 (100.0%) | $53,113 |
Occupancy by Householder Income Bracket in Madison
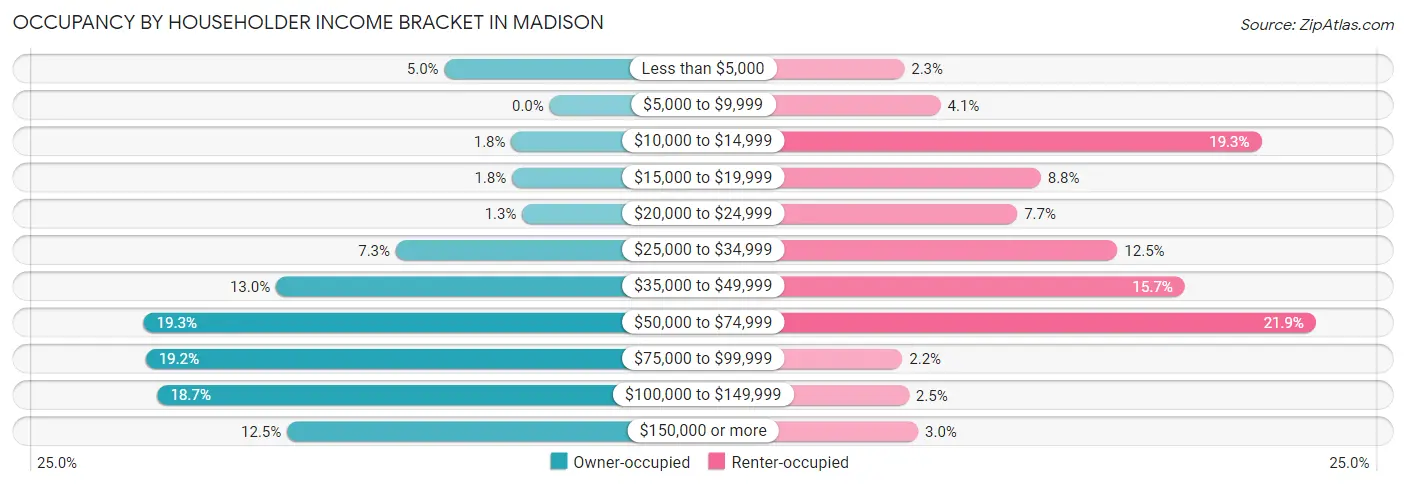
| Income Bracket | Owner-occupied | Renter-occupied |
| Less than $5,000 | 143 (5.0%) | 52 (2.3%) |
| $5,000 to $9,999 | 0 (0.0%) | 91 (4.1%) |
| $10,000 to $14,999 | 52 (1.8%) | 434 (19.3%) |
| $15,000 to $19,999 | 51 (1.8%) | 198 (8.8%) |
| $20,000 to $24,999 | 37 (1.3%) | 173 (7.7%) |
| $25,000 to $34,999 | 209 (7.3%) | 280 (12.5%) |
| $35,000 to $49,999 | 372 (13.0%) | 352 (15.7%) |
| $50,000 to $74,999 | 552 (19.3%) | 492 (21.9%) |
| $75,000 to $99,999 | 549 (19.2%) | 50 (2.2%) |
| $100,000 to $149,999 | 533 (18.7%) | 57 (2.5%) |
| $150,000 or more | 357 (12.5%) | 67 (3.0%) |
| Total | 2,855 (100.0%) | 2,246 (100.0%) |
Monthly Housing Cost Tiers in Madison
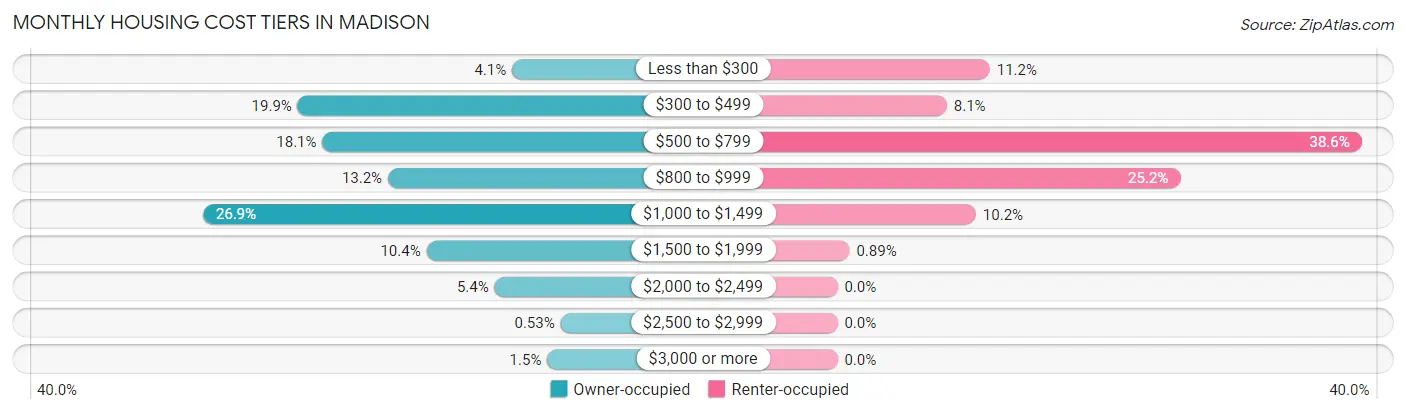
| Monthly Cost | Owner-occupied | Renter-occupied |
| Less than $300 | 117 (4.1%) | 252 (11.2%) |
| $300 to $499 | 568 (19.9%) | 181 (8.1%) |
| $500 to $799 | 516 (18.1%) | 867 (38.6%) |
| $800 to $999 | 378 (13.2%) | 567 (25.2%) |
| $1,000 to $1,499 | 767 (26.9%) | 229 (10.2%) |
| $1,500 to $1,999 | 297 (10.4%) | 20 (0.9%) |
| $2,000 to $2,499 | 154 (5.4%) | 0 (0.0%) |
| $2,500 to $2,999 | 15 (0.5%) | 0 (0.0%) |
| $3,000 or more | 43 (1.5%) | 0 (0.0%) |
| Total | 2,855 (100.0%) | 2,246 (100.0%) |
Physical Housing Characteristics in Madison
Housing Structures in Madison
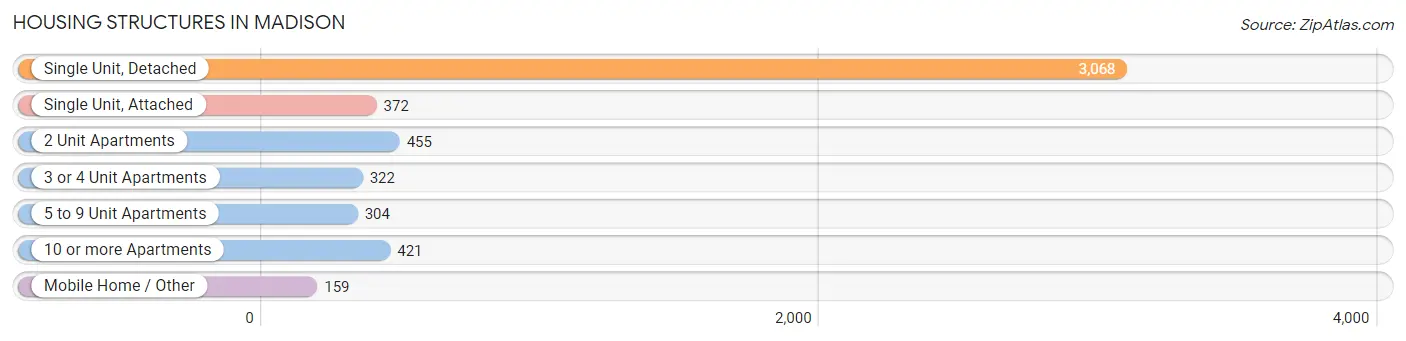
| Structure Type | # Housing Units | % Housing Units |
| Single Unit, Detached | 3,068 | 60.2% |
| Single Unit, Attached | 372 | 7.3% |
| 2 Unit Apartments | 455 | 8.9% |
| 3 or 4 Unit Apartments | 322 | 6.3% |
| 5 to 9 Unit Apartments | 304 | 6.0% |
| 10 or more Apartments | 421 | 8.3% |
| Mobile Home / Other | 159 | 3.1% |
| Total | 5,101 | 100.0% |
Housing Structures by Occupancy in Madison
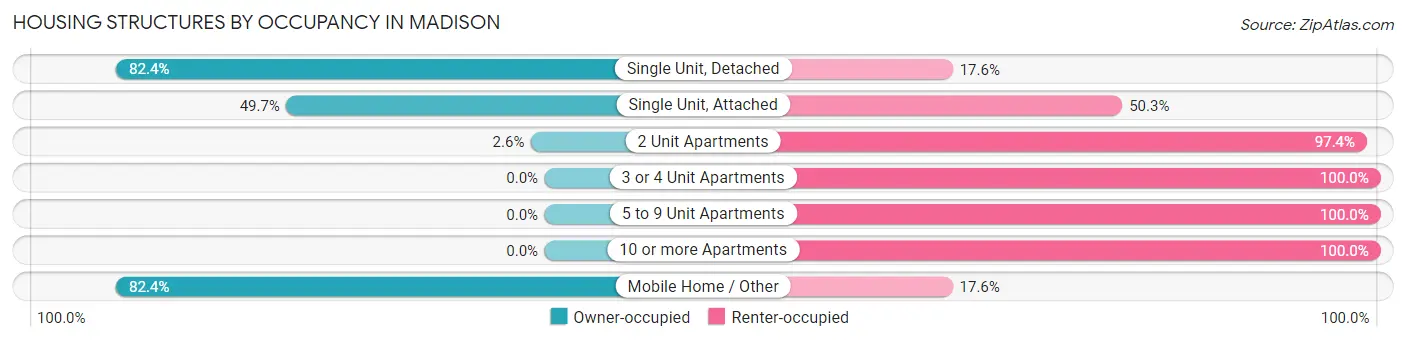
| Structure Type | Owner-occupied | Renter-occupied |
| Single Unit, Detached | 2,527 (82.4%) | 541 (17.6%) |
| Single Unit, Attached | 185 (49.7%) | 187 (50.3%) |
| 2 Unit Apartments | 12 (2.6%) | 443 (97.4%) |
| 3 or 4 Unit Apartments | 0 (0.0%) | 322 (100.0%) |
| 5 to 9 Unit Apartments | 0 (0.0%) | 304 (100.0%) |
| 10 or more Apartments | 0 (0.0%) | 421 (100.0%) |
| Mobile Home / Other | 131 (82.4%) | 28 (17.6%) |
| Total | 2,855 (56.0%) | 2,246 (44.0%) |
Housing Structures by Number of Rooms in Madison
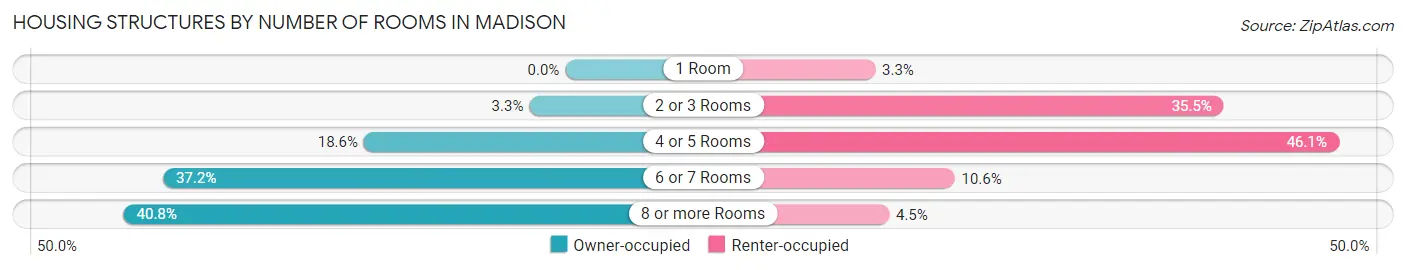
| Number of Rooms | Owner-occupied | Renter-occupied |
| 1 Room | 0 (0.0%) | 73 (3.3%) |
| 2 or 3 Rooms | 95 (3.3%) | 797 (35.5%) |
| 4 or 5 Rooms | 532 (18.6%) | 1,036 (46.1%) |
| 6 or 7 Rooms | 1,062 (37.2%) | 238 (10.6%) |
| 8 or more Rooms | 1,166 (40.8%) | 102 (4.5%) |
| Total | 2,855 (100.0%) | 2,246 (100.0%) |
Housing Structure by Heating Type in Madison
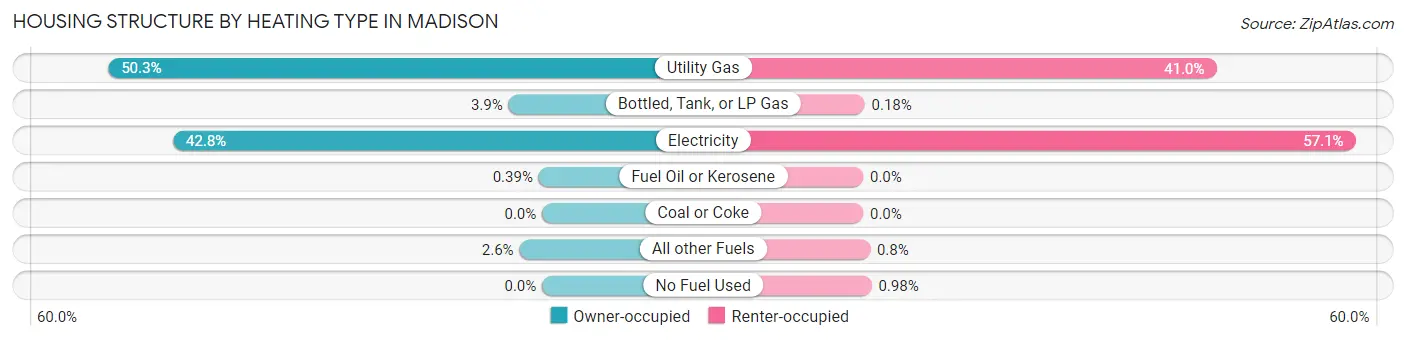
| Heating Type | Owner-occupied | Renter-occupied |
| Utility Gas | 1,436 (50.3%) | 920 (41.0%) |
| Bottled, Tank, or LP Gas | 111 (3.9%) | 4 (0.2%) |
| Electricity | 1,222 (42.8%) | 1,282 (57.1%) |
| Fuel Oil or Kerosene | 11 (0.4%) | 0 (0.0%) |
| Coal or Coke | 0 (0.0%) | 0 (0.0%) |
| All other Fuels | 75 (2.6%) | 18 (0.8%) |
| No Fuel Used | 0 (0.0%) | 22 (1.0%) |
| Total | 2,855 (100.0%) | 2,246 (100.0%) |
Household Vehicle Usage in Madison
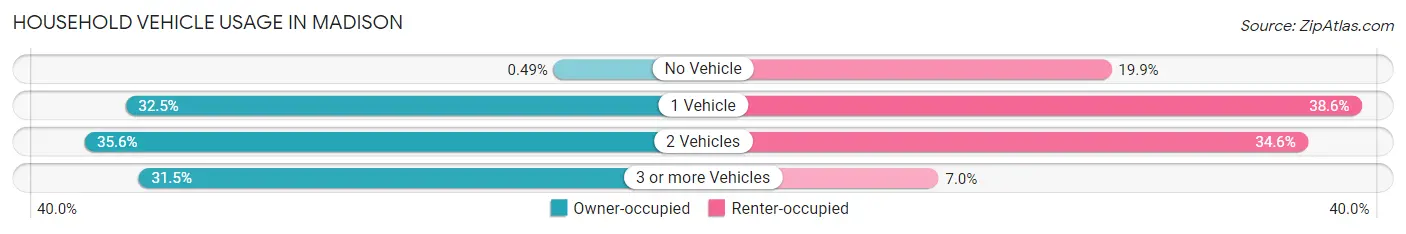
| Vehicles per Household | Owner-occupied | Renter-occupied |
| No Vehicle | 14 (0.5%) | 447 (19.9%) |
| 1 Vehicle | 927 (32.5%) | 866 (38.6%) |
| 2 Vehicles | 1,015 (35.5%) | 776 (34.5%) |
| 3 or more Vehicles | 899 (31.5%) | 157 (7.0%) |
| Total | 2,855 (100.0%) | 2,246 (100.0%) |
Real Estate & Mortgages in Madison
Real Estate and Mortgage Overview in Madison
| Characteristic | Without Mortgage | With Mortgage |
| Housing Units | 967 | 1,888 |
| Median Property Value | $142,200 | $180,600 |
| Median Household Income | $64,875 | $265 |
| Monthly Housing Costs | $418 | $43 |
| Real Estate Taxes | $1,017 | $16 |
Property Value by Mortgage Status in Madison
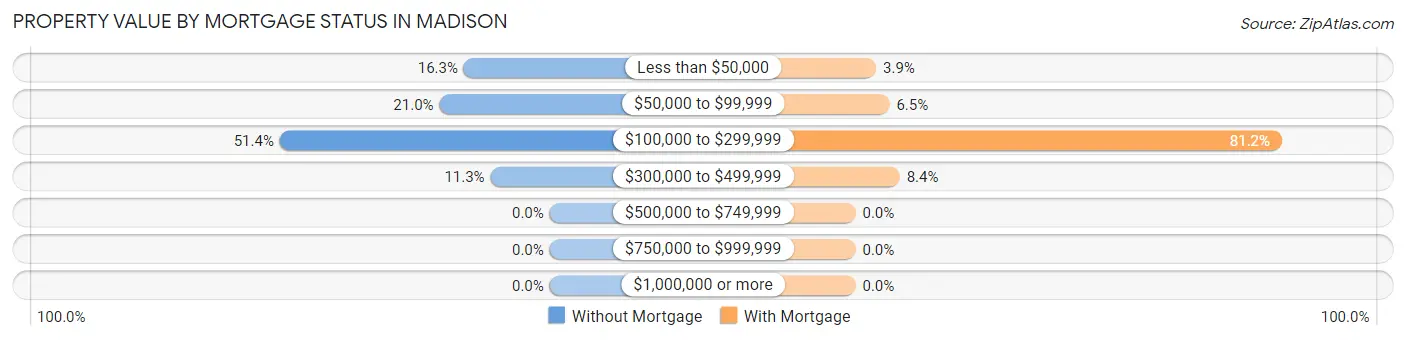
| Property Value | Without Mortgage | With Mortgage |
| Less than $50,000 | 158 (16.3%) | 74 (3.9%) |
| $50,000 to $99,999 | 203 (21.0%) | 122 (6.5%) |
| $100,000 to $299,999 | 497 (51.4%) | 1,533 (81.2%) |
| $300,000 to $499,999 | 109 (11.3%) | 159 (8.4%) |
| $500,000 to $749,999 | 0 (0.0%) | 0 (0.0%) |
| $750,000 to $999,999 | 0 (0.0%) | 0 (0.0%) |
| $1,000,000 or more | 0 (0.0%) | 0 (0.0%) |
| Total | 967 (100.0%) | 1,888 (100.0%) |
Household Income by Mortgage Status in Madison
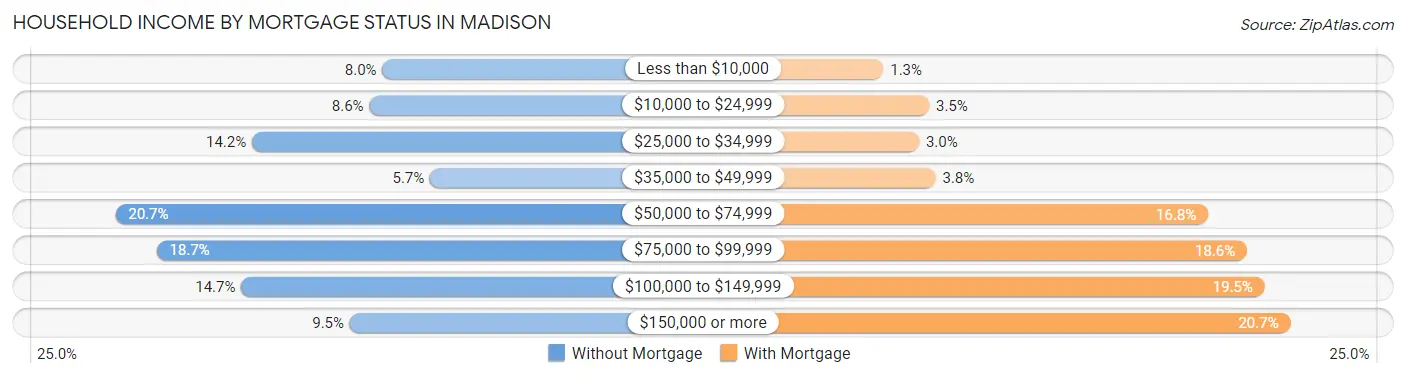
| Household Income | Without Mortgage | With Mortgage |
| Less than $10,000 | 77 (8.0%) | 25 (1.3%) |
| $10,000 to $24,999 | 83 (8.6%) | 66 (3.5%) |
| $25,000 to $34,999 | 137 (14.2%) | 57 (3.0%) |
| $35,000 to $49,999 | 55 (5.7%) | 72 (3.8%) |
| $50,000 to $74,999 | 200 (20.7%) | 317 (16.8%) |
| $75,000 to $99,999 | 181 (18.7%) | 352 (18.6%) |
| $100,000 to $149,999 | 142 (14.7%) | 368 (19.5%) |
| $150,000 or more | 92 (9.5%) | 391 (20.7%) |
| Total | 967 (100.0%) | 1,888 (100.0%) |
Property Value to Household Income Ratio in Madison
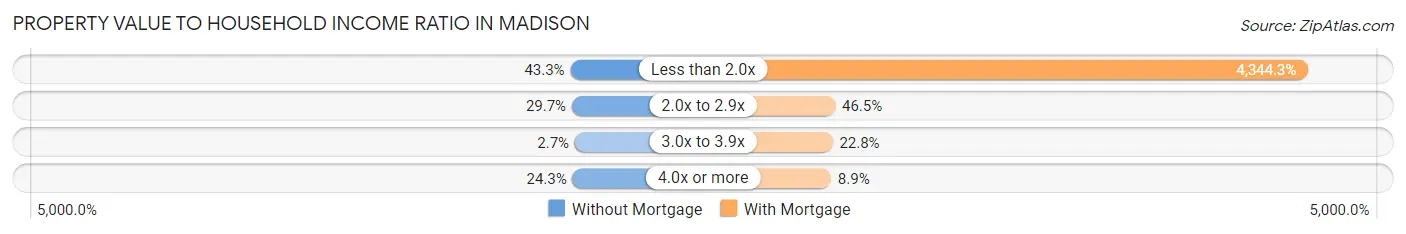
| Value-to-Income Ratio | Without Mortgage | With Mortgage |
| Less than 2.0x | 419 (43.3%) | 82,020 (4,344.3%) |
| 2.0x to 2.9x | 287 (29.7%) | 878 (46.5%) |
| 3.0x to 3.9x | 26 (2.7%) | 430 (22.8%) |
| 4.0x or more | 235 (24.3%) | 167 (8.8%) |
| Total | 967 (100.0%) | 1,888 (100.0%) |
Real Estate Taxes by Mortgage Status in Madison
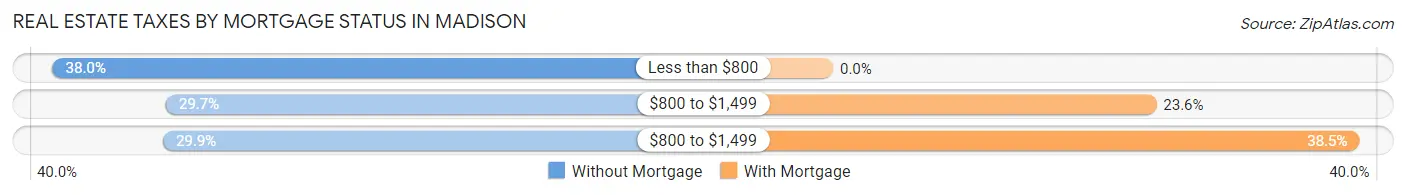
| Property Taxes | Without Mortgage | With Mortgage |
| Less than $800 | 367 (38.0%) | 0 (0.0%) |
| $800 to $1,499 | 287 (29.7%) | 446 (23.6%) |
| $800 to $1,499 | 289 (29.9%) | 726 (38.5%) |
| Total | 967 (100.0%) | 1,888 (100.0%) |
Health & Disability in Madison
Health Insurance Coverage by Age in Madison
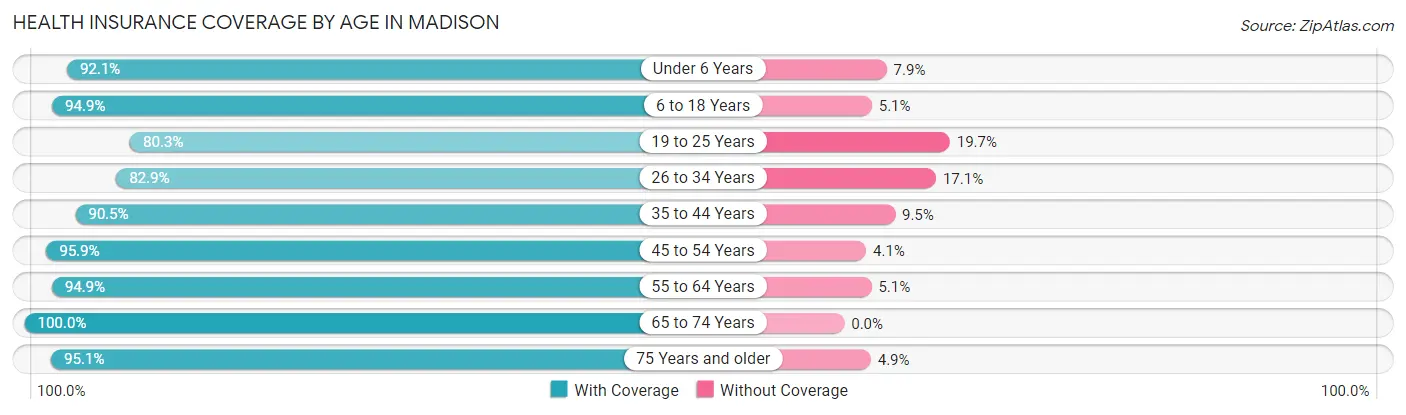
| Age Bracket | With Coverage | Without Coverage |
| Under 6 Years | 618 (92.1%) | 53 (7.9%) |
| 6 to 18 Years | 1,591 (94.9%) | 86 (5.1%) |
| 19 to 25 Years | 874 (80.3%) | 214 (19.7%) |
| 26 to 34 Years | 795 (82.9%) | 164 (17.1%) |
| 35 to 44 Years | 1,264 (90.5%) | 132 (9.5%) |
| 45 to 54 Years | 1,630 (95.9%) | 69 (4.1%) |
| 55 to 64 Years | 1,478 (94.9%) | 79 (5.1%) |
| 65 to 74 Years | 1,329 (100.0%) | 0 (0.0%) |
| 75 Years and older | 942 (95.1%) | 49 (4.9%) |
| Total | 10,521 (92.6%) | 846 (7.4%) |
Health Insurance Coverage by Citizenship Status in Madison
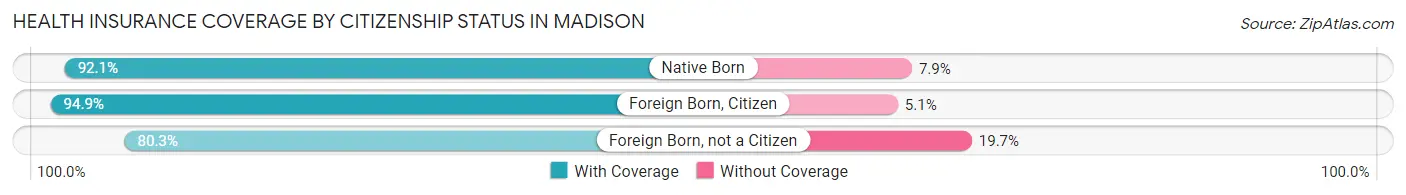
| Citizenship Status | With Coverage | Without Coverage |
| Native Born | 618 (92.1%) | 53 (7.9%) |
| Foreign Born, Citizen | 1,591 (94.9%) | 86 (5.1%) |
| Foreign Born, not a Citizen | 874 (80.3%) | 214 (19.7%) |
Health Insurance Coverage by Household Income in Madison
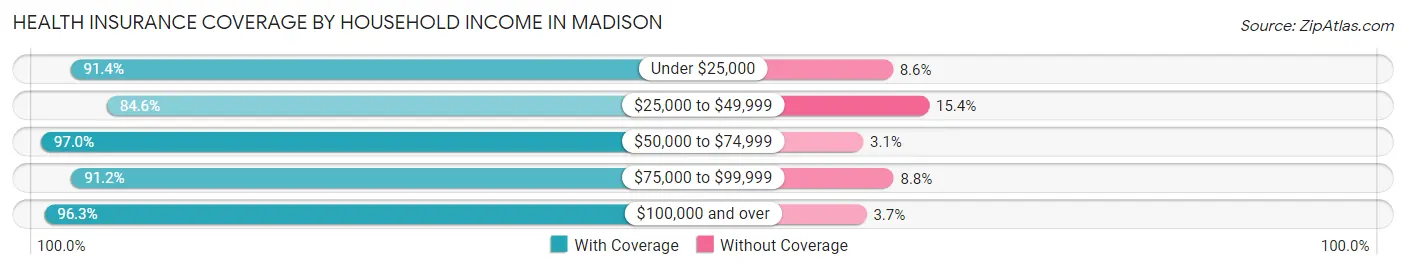
| Household Income | With Coverage | Without Coverage |
| Under $25,000 | 1,613 (91.4%) | 152 (8.6%) |
| $25,000 to $49,999 | 1,910 (84.6%) | 348 (15.4%) |
| $50,000 to $74,999 | 2,289 (97.0%) | 72 (3.0%) |
| $75,000 to $99,999 | 1,573 (91.2%) | 151 (8.8%) |
| $100,000 and over | 3,105 (96.3%) | 119 (3.7%) |
Public vs Private Health Insurance Coverage by Age in Madison
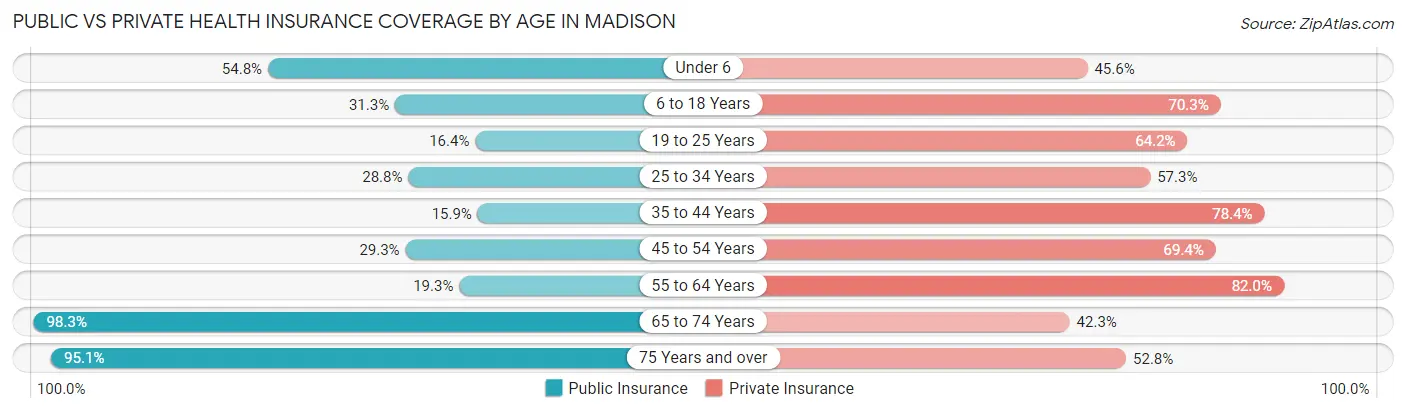
| Age Bracket | Public Insurance | Private Insurance |
| Under 6 | 368 (54.8%) | 306 (45.6%) |
| 6 to 18 Years | 524 (31.2%) | 1,179 (70.3%) |
| 19 to 25 Years | 178 (16.4%) | 698 (64.1%) |
| 25 to 34 Years | 276 (28.8%) | 549 (57.3%) |
| 35 to 44 Years | 222 (15.9%) | 1,095 (78.4%) |
| 45 to 54 Years | 498 (29.3%) | 1,179 (69.4%) |
| 55 to 64 Years | 301 (19.3%) | 1,277 (82.0%) |
| 65 to 74 Years | 1,307 (98.3%) | 562 (42.3%) |
| 75 Years and over | 942 (95.1%) | 523 (52.8%) |
| Total | 4,616 (40.6%) | 7,368 (64.8%) |
Disability Status by Sex by Age in Madison
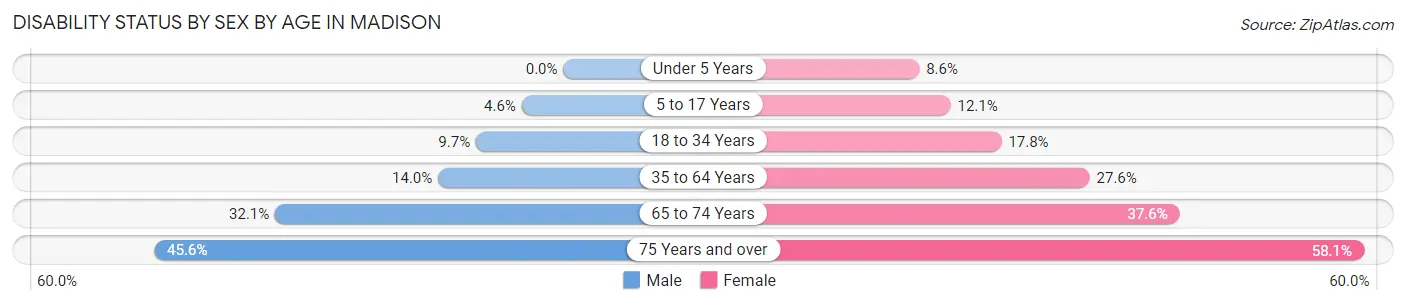
| Age Bracket | Male | Female |
| Under 5 Years | 0 (0.0%) | 25 (8.6%) |
| 5 to 17 Years | 30 (4.6%) | 100 (12.1%) |
| 18 to 34 Years | 124 (9.7%) | 187 (17.8%) |
| 35 to 64 Years | 288 (14.0%) | 714 (27.6%) |
| 65 to 74 Years | 174 (32.1%) | 296 (37.6%) |
| 75 Years and over | 149 (45.6%) | 386 (58.1%) |
Disability Class by Sex by Age in Madison
Disability Class: Hearing Difficulty
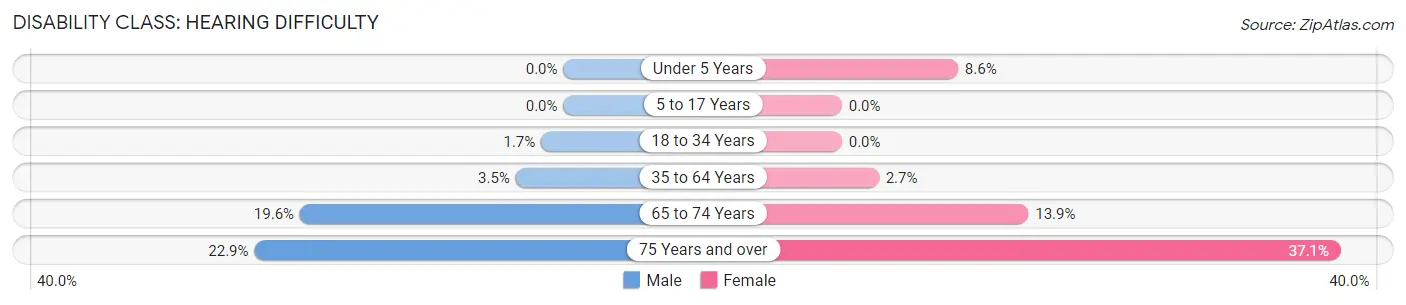
| Age Bracket | Male | Female |
| Under 5 Years | 0 (0.0%) | 25 (8.6%) |
| 5 to 17 Years | 0 (0.0%) | 0 (0.0%) |
| 18 to 34 Years | 21 (1.7%) | 0 (0.0%) |
| 35 to 64 Years | 73 (3.5%) | 71 (2.7%) |
| 65 to 74 Years | 106 (19.6%) | 109 (13.9%) |
| 75 Years and over | 75 (22.9%) | 246 (37.0%) |
Disability Class: Vision Difficulty
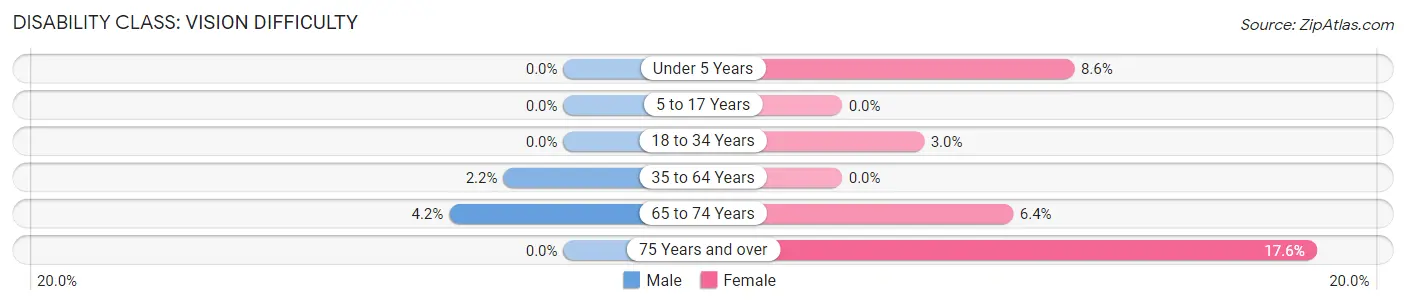
| Age Bracket | Male | Female |
| Under 5 Years | 0 (0.0%) | 25 (8.6%) |
| 5 to 17 Years | 0 (0.0%) | 0 (0.0%) |
| 18 to 34 Years | 0 (0.0%) | 32 (3.0%) |
| 35 to 64 Years | 46 (2.2%) | 0 (0.0%) |
| 65 to 74 Years | 23 (4.2%) | 50 (6.4%) |
| 75 Years and over | 0 (0.0%) | 117 (17.6%) |
Disability Class: Cognitive Difficulty
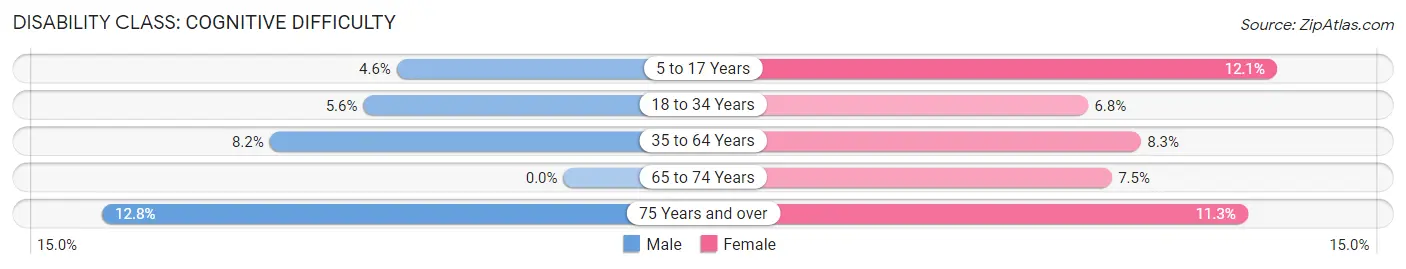
| Age Bracket | Male | Female |
| 5 to 17 Years | 30 (4.6%) | 100 (12.1%) |
| 18 to 34 Years | 71 (5.6%) | 72 (6.8%) |
| 35 to 64 Years | 169 (8.2%) | 215 (8.3%) |
| 65 to 74 Years | 0 (0.0%) | 59 (7.5%) |
| 75 Years and over | 42 (12.8%) | 75 (11.3%) |
Disability Class: Ambulatory Difficulty
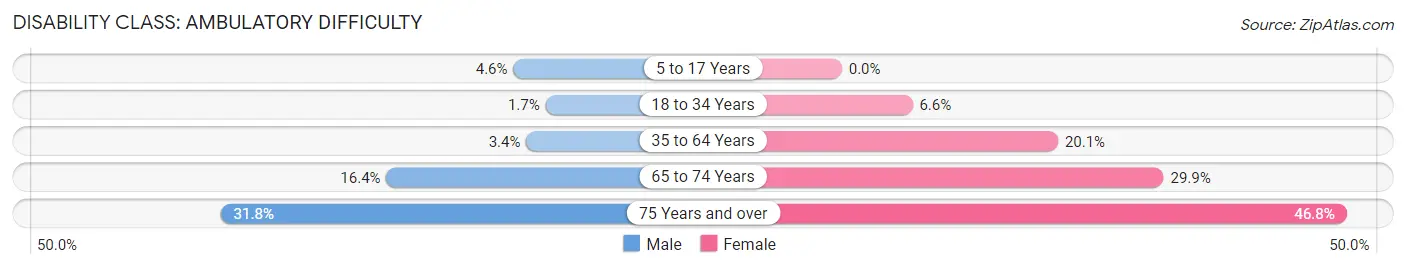
| Age Bracket | Male | Female |
| 5 to 17 Years | 30 (4.6%) | 0 (0.0%) |
| 18 to 34 Years | 21 (1.7%) | 69 (6.6%) |
| 35 to 64 Years | 71 (3.4%) | 519 (20.1%) |
| 65 to 74 Years | 89 (16.4%) | 235 (29.9%) |
| 75 Years and over | 104 (31.8%) | 311 (46.8%) |
Disability Class: Self-Care Difficulty
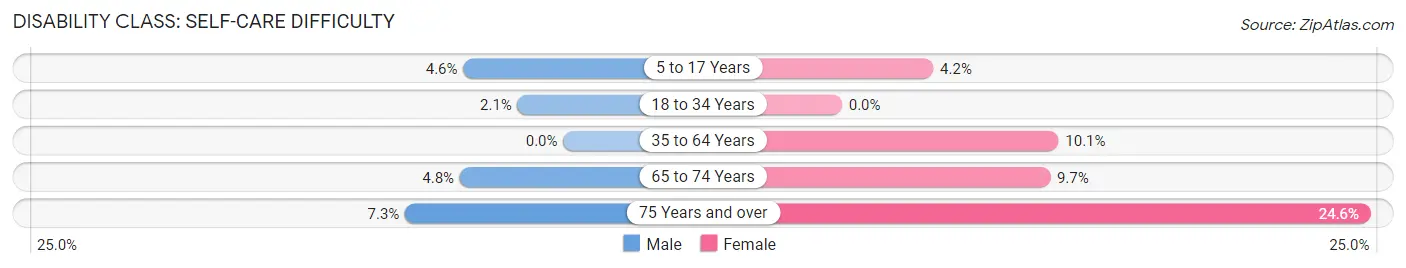
| Age Bracket | Male | Female |
| 5 to 17 Years | 30 (4.6%) | 35 (4.2%) |
| 18 to 34 Years | 27 (2.1%) | 0 (0.0%) |
| 35 to 64 Years | 0 (0.0%) | 260 (10.1%) |
| 65 to 74 Years | 26 (4.8%) | 76 (9.7%) |
| 75 Years and over | 24 (7.3%) | 163 (24.5%) |
Technology Access in Madison
Computing Device Access in Madison
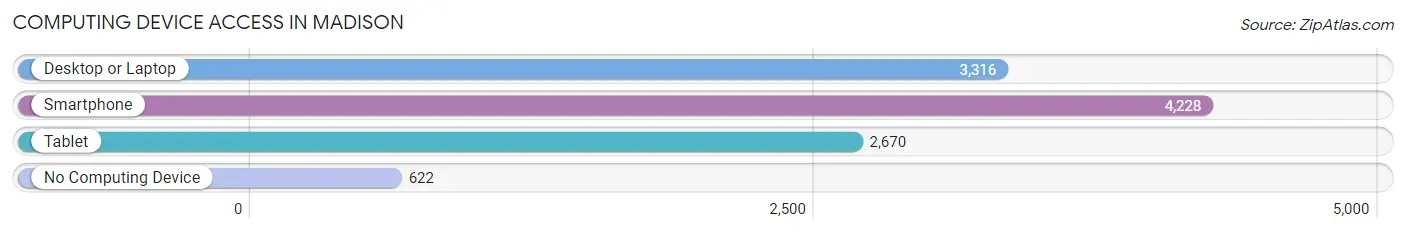
| Device Type | # Households | % Households |
| Desktop or Laptop | 3,316 | 65.0% |
| Smartphone | 4,228 | 82.9% |
| Tablet | 2,670 | 52.3% |
| No Computing Device | 622 | 12.2% |
| Total | 5,101 | 100.0% |
Internet Access in Madison
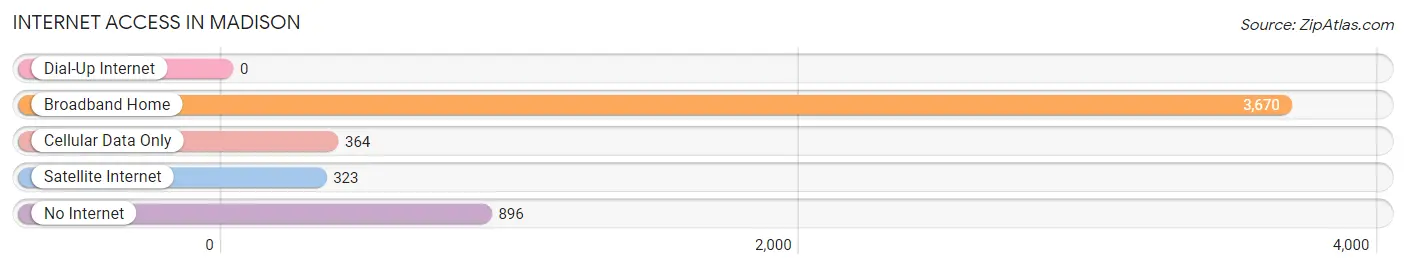
| Internet Type | # Households | % Households |
| Dial-Up Internet | 0 | 0.0% |
| Broadband Home | 3,670 | 72.0% |
| Cellular Data Only | 364 | 7.1% |
| Satellite Internet | 323 | 6.3% |
| No Internet | 896 | 17.6% |
| Total | 5,101 | 100.0% |
Madison Summary
Madison, Indiana is a city located in the state of Indiana in the United States. It is the county seat of Jefferson County and is located along the Ohio River. The city has a population of 12,004 as of the 2010 census.
History
Madison was founded in 1810 by John Paul, a Revolutionary War veteran. The city was named after President James Madison. The city was incorporated in 1817 and was the first city in Indiana to be incorporated.
In the early 19th century, Madison was a major port city and was the largest city in Indiana. It was a major center for the steamboat industry and was a major stop on the Underground Railroad.
Geography
Madison is located in the southeastern part of Indiana, along the Ohio River. It is about 40 miles northeast of Louisville, Kentucky and about 70 miles southwest of Cincinnati, Ohio. The city has a total area of 8.3 square miles, all of which is land.
The climate in Madison is humid continental, with hot summers and cold winters. The average temperature in the summer is around 80 degrees Fahrenheit and the average temperature in the winter is around 30 degrees Fahrenheit.
Economy
The economy of Madison is largely based on manufacturing and tourism. The city is home to several manufacturing companies, including Madison Precision Products, Madison Tool and Die, and Madison Plastics.
Tourism is also an important part of the economy. Madison is home to several historic sites, including the Lanier Mansion State Historic Site, the Thomas Family Winery, and the Madison Historic District.
Demographics
As of the 2010 census, the population of Madison was 12,004. The racial makeup of the city was 90.2% White, 5.3% African American, 0.4% Native American, 0.7% Asian, 0.1% Pacific Islander, 1.2% from other races, and 2.1% from two or more races. Hispanic or Latino of any race were 3.2% of the population.
The median income for a household in Madison was $37,945 and the median income for a family was $45,945. The per capita income for the city was $20,945. About 11.2% of families and 14.2% of the population were below the poverty line, including 19.2% of those under age 18 and 8.2% of those age 65 or over.
Madison is served by the Madison Consolidated Schools district. The district has four elementary schools, one middle school, and one high school. The city is also home to several private schools, including Madison Christian Academy and St. Michael's Catholic School.
Common Questions
What is Per Capita Income in Madison?
Per Capita income in Madison is $30,381.
What is the Median Family Income in Madison?
Median Family Income in Madison is $77,882.
What is the Median Household income in Madison?
Median Household Income in Madison is $53,113.
What is Income or Wage Gap in Madison?
Income or Wage Gap in Madison is 36.4%.
Women in Madison earn 63.6 cents for every dollar earned by a man.
What is Family Income Deficit in Madison?
Family Income Deficit in Madison is $12,339.
Families that are below poverty line in Madison earn $12,339 less on average than the poverty threshold level.
What is Inequality or Gini Index in Madison?
Inequality or Gini Index in Madison is 0.46.
What is the Total Population of Madison?
Total Population of Madison is 12,301.
What is the Total Male Population of Madison?
Total Male Population of Madison is 5,362.
What is the Total Female Population of Madison?
Total Female Population of Madison is 6,939.
What is the Ratio of Males per 100 Females in Madison?
There are 77.27 Males per 100 Females in Madison.
What is the Ratio of Females per 100 Males in Madison?
There are 129.41 Females per 100 Males in Madison.
What is the Median Population Age in Madison?
Median Population Age in Madison is 43.7 Years.
What is the Average Family Size in Madison
Average Family Size in Madison is 3.0 People.
What is the Average Household Size in Madison
Average Household Size in Madison is 2.2 People.
How Large is the Labor Force in Madison?
There are 5,833 People in the Labor Forcein in Madison.
What is the Percentage of People in the Labor Force in Madison?
55.5% of People are in the Labor Force in Madison.
What is the Unemployment Rate in Madison?
Unemployment Rate in Madison is 3.3%.