Logansport, IN Map & Demographics
Logansport Map
Logansport Overview
$22,692
PER CAPITA INCOME
$60,771
AVG FAMILY INCOME
$45,335
AVG HOUSEHOLD INCOME
27.7%
WAGE / INCOME GAP [ % ]
72.3¢/ $1
WAGE / INCOME GAP [ $ ]
$11,697
FAMILY INCOME DEFICIT
0.39
INEQUALITY / GINI INDEX
18,166
TOTAL POPULATION
9,069
MALE POPULATION
9,097
FEMALE POPULATION
99.69
MALES / 100 FEMALES
100.31
FEMALES / 100 MALES
37.3
MEDIAN AGE
3.2
AVG FAMILY SIZE
2.5
AVG HOUSEHOLD SIZE
8,567
LABOR FORCE [ PEOPLE ]
60.5%
PERCENT IN LABOR FORCE
3.2%
UNEMPLOYMENT RATE
Logansport Zip Codes
Logansport Area Codes
Income in Logansport
Income Overview in Logansport
Per Capita Income in Logansport is $22,692, while median incomes of families and households are $60,771 and $45,335 respectively.
| Characteristic | Number | Measure |
| Per Capita Income | 18,166 | $22,692 |
| Median Family Income | 4,145 | $60,771 |
| Mean Family Income | 4,145 | $66,277 |
| Median Household Income | 6,852 | $45,335 |
| Mean Household Income | 6,852 | $55,352 |
| Income Deficit | 4,145 | $11,697 |
| Wage / Income Gap (%) | 18,166 | 27.74% |
| Wage / Income Gap ($) | 18,166 | 72.26¢ per $1 |
| Gini / Inequality Index | 18,166 | 0.39 |
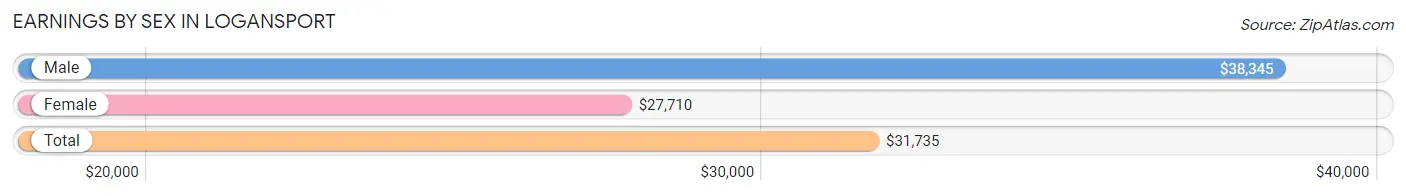
Earnings by Sex in Logansport
Average Earnings in Logansport are $31,735, $38,345 for men and $27,710 for women, a difference of 27.7%.
| Sex | Number | Average Earnings |
| Male | 4,701 (51.6%) | $38,345 |
| Female | 4,410 (48.4%) | $27,710 |
| Total | 9,111 (100.0%) | $31,735 |
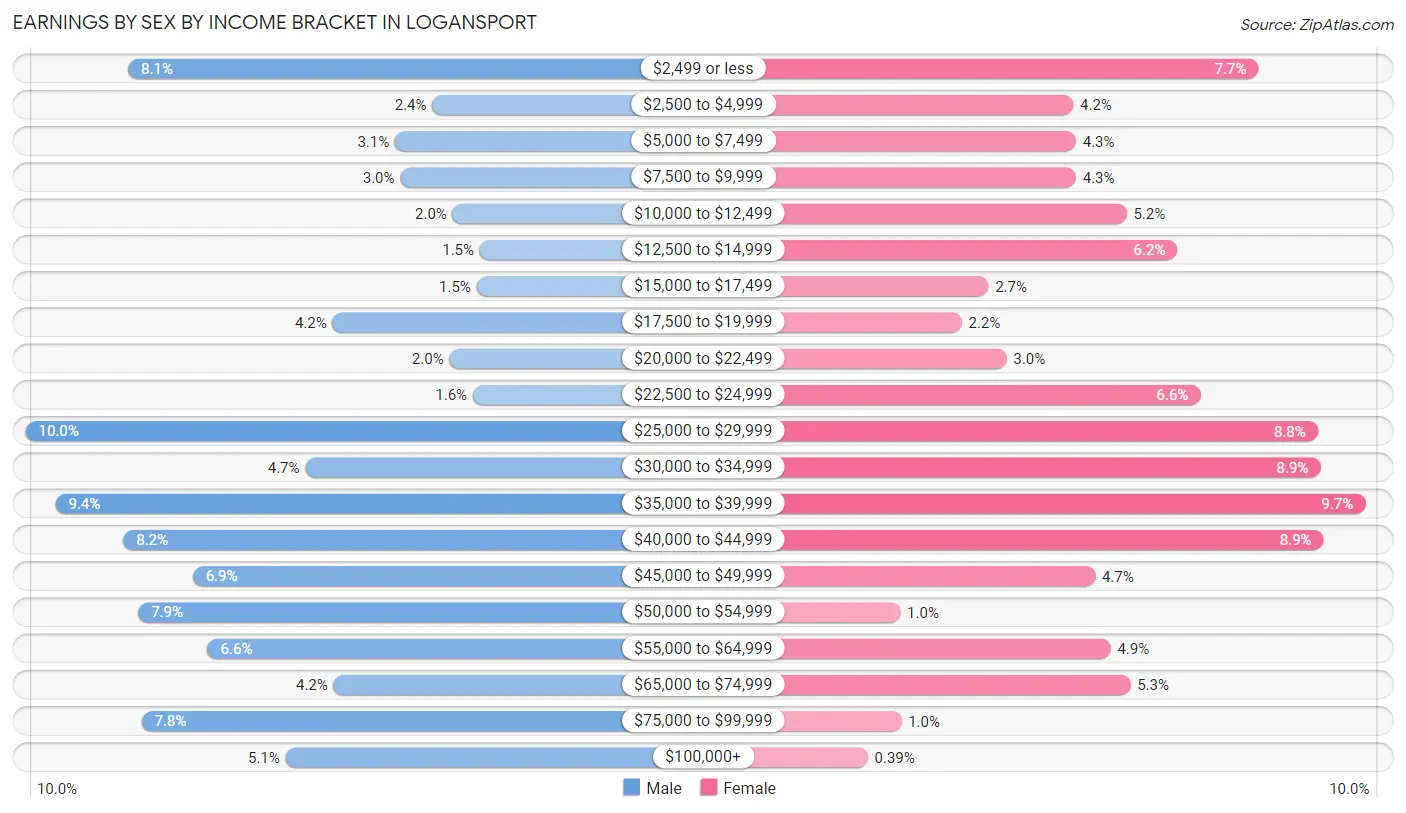
Earnings by Sex by Income Bracket in Logansport
The most common earnings brackets in Logansport are $25,000 to $29,999 for men (469 | 10.0%) and $35,000 to $39,999 for women (428 | 9.7%).
| Income | Male | Female |
| $2,499 or less | 379 (8.1%) | 340 (7.7%) |
| $2,500 to $4,999 | 111 (2.4%) | 187 (4.2%) |
| $5,000 to $7,499 | 144 (3.1%) | 189 (4.3%) |
| $7,500 to $9,999 | 139 (3.0%) | 189 (4.3%) |
| $10,000 to $12,499 | 93 (2.0%) | 231 (5.2%) |
| $12,500 to $14,999 | 69 (1.5%) | 273 (6.2%) |
| $15,000 to $17,499 | 72 (1.5%) | 117 (2.6%) |
| $17,500 to $19,999 | 199 (4.2%) | 95 (2.1%) |
| $20,000 to $22,499 | 96 (2.0%) | 132 (3.0%) |
| $22,500 to $24,999 | 75 (1.6%) | 292 (6.6%) |
| $25,000 to $29,999 | 469 (10.0%) | 389 (8.8%) |
| $30,000 to $34,999 | 223 (4.7%) | 391 (8.9%) |
| $35,000 to $39,999 | 443 (9.4%) | 428 (9.7%) |
| $40,000 to $44,999 | 383 (8.2%) | 394 (8.9%) |
| $45,000 to $49,999 | 322 (6.9%) | 205 (4.6%) |
| $50,000 to $54,999 | 370 (7.9%) | 44 (1.0%) |
| $55,000 to $64,999 | 309 (6.6%) | 218 (4.9%) |
| $65,000 to $74,999 | 198 (4.2%) | 234 (5.3%) |
| $75,000 to $99,999 | 367 (7.8%) | 45 (1.0%) |
| $100,000+ | 240 (5.1%) | 17 (0.4%) |
| Total | 4,701 (100.0%) | 4,410 (100.0%) |
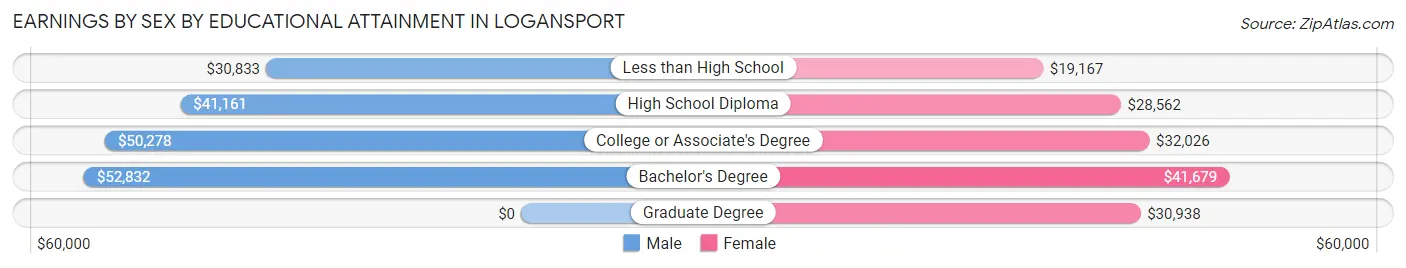
Earnings by Sex by Educational Attainment in Logansport
Average earnings in Logansport are $41,014 for men and $30,184 for women, a difference of 26.4%. Men with an educational attainment of bachelor's degree enjoy the highest average annual earnings of $52,832, while those with less than high school education earn the least with $30,833. Women with an educational attainment of bachelor's degree earn the most with the average annual earnings of $41,679, while those with less than high school education have the smallest earnings of $19,167.
| Educational Attainment | Male Income | Female Income |
| Less than High School | $30,833 | $19,167 |
| High School Diploma | $41,161 | $28,562 |
| College or Associate's Degree | $50,278 | $32,026 |
| Bachelor's Degree | $52,832 | $41,679 |
| Graduate Degree | - | - |
| Total | $41,014 | $30,184 |
Family Income in Logansport
Family Income Brackets in Logansport
According to the Logansport family income data, there are 891 families falling into the $50,000 to $74,999 income range, which is the most common income bracket and makes up 21.5% of all families. Conversely, the $200,000+ income bracket is the least frequent group with only 41 families (1.0%) belonging to this category.
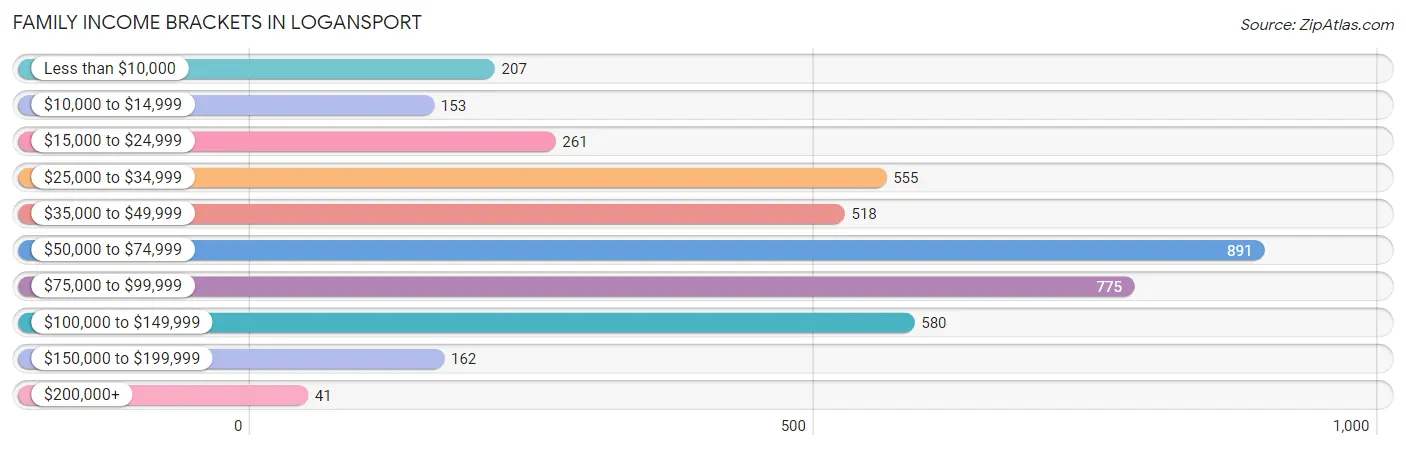
| Income Bracket | # Families | % Families |
| Less than $10,000 | 207 | 5.0% |
| $10,000 to $14,999 | 153 | 3.7% |
| $15,000 to $24,999 | 261 | 6.3% |
| $25,000 to $34,999 | 555 | 13.4% |
| $35,000 to $49,999 | 518 | 12.5% |
| $50,000 to $74,999 | 891 | 21.5% |
| $75,000 to $99,999 | 775 | 18.7% |
| $100,000 to $149,999 | 580 | 14.0% |
| $150,000 to $199,999 | 162 | 3.9% |
| $200,000+ | 41 | 1.0% |
Family Income by Famaliy Size in Logansport
4-person families (768 | 18.5%) account for the highest median family income in Logansport with $71,786 per family, while 2-person families (1,927 | 46.5%) have the highest median income of $31,784 per family member.
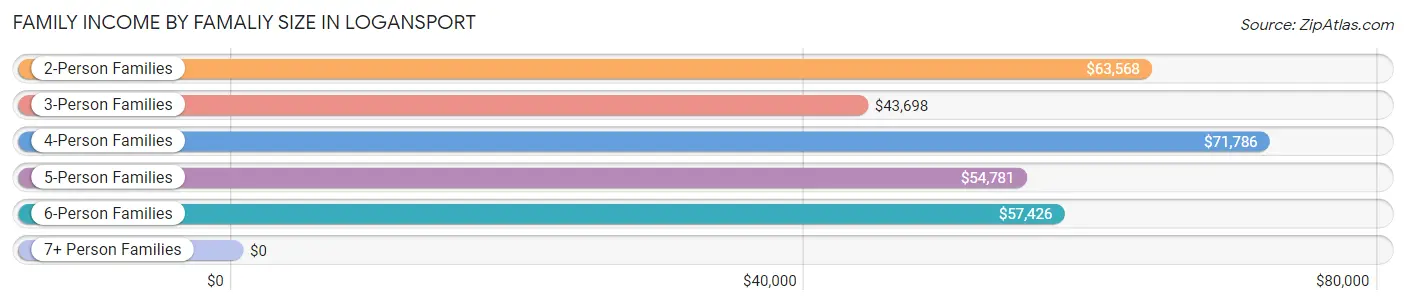
| Income Bracket | # Families | Median Income |
| 2-Person Families | 1,927 (46.5%) | $63,568 |
| 3-Person Families | 853 (20.6%) | $43,698 |
| 4-Person Families | 768 (18.5%) | $71,786 |
| 5-Person Families | 356 (8.6%) | $54,781 |
| 6-Person Families | 209 (5.0%) | $57,426 |
| 7+ Person Families | 32 (0.8%) | $0 |
| Total | 4,145 (100.0%) | $60,771 |
Family Income by Number of Earners in Logansport
The median family income in Logansport is $60,771, with families comprising 3+ earners (472) having the highest median family income of $108,750, while families with no earners (426) have the lowest median family income of $20,490, accounting for 11.4% and 10.3% of families, respectively.
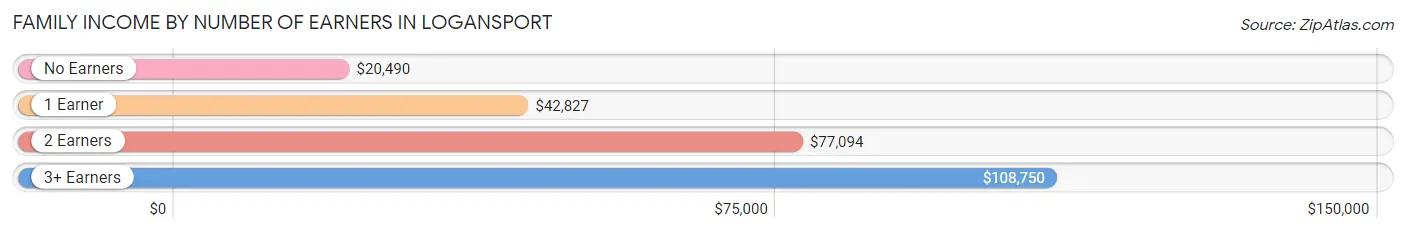
| Number of Earners | # Families | Median Income |
| No Earners | 426 (10.3%) | $20,490 |
| 1 Earner | 1,759 (42.4%) | $42,827 |
| 2 Earners | 1,488 (35.9%) | $77,094 |
| 3+ Earners | 472 (11.4%) | $108,750 |
| Total | 4,145 (100.0%) | $60,771 |
Household Income in Logansport
Household Income Brackets in Logansport
With 1,309 households falling in the category, the $50,000 to $74,999 income range is the most frequent in Logansport, accounting for 19.1% of all households. In contrast, only 41 households (0.6%) fall into the $200,000+ income bracket, making it the least populous group.
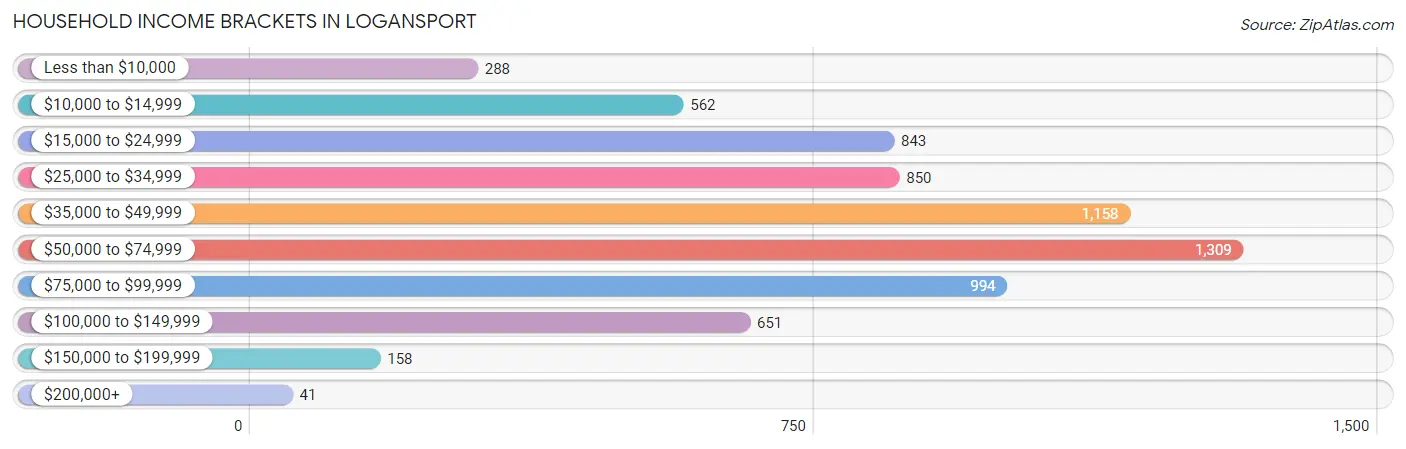
| Income Bracket | # Households | % Households |
| Less than $10,000 | 288 | 4.2% |
| $10,000 to $14,999 | 562 | 8.2% |
| $15,000 to $24,999 | 843 | 12.3% |
| $25,000 to $34,999 | 850 | 12.4% |
| $35,000 to $49,999 | 1,158 | 16.9% |
| $50,000 to $74,999 | 1,309 | 19.1% |
| $75,000 to $99,999 | 994 | 14.5% |
| $100,000 to $149,999 | 651 | 9.5% |
| $150,000 to $199,999 | 158 | 2.3% |
| $200,000+ | 41 | 0.6% |
Household Income by Householder Age in Logansport
The median household income in Logansport is $45,335, with the highest median household income of $56,267 found in the 25 to 44 years age bracket for the primary householder. A total of 2,288 households (33.4%) fall into this category. Meanwhile, the 65+ years age bracket for the primary householder has the lowest median household income of $32,824, with 1,757 households (25.6%) in this group.
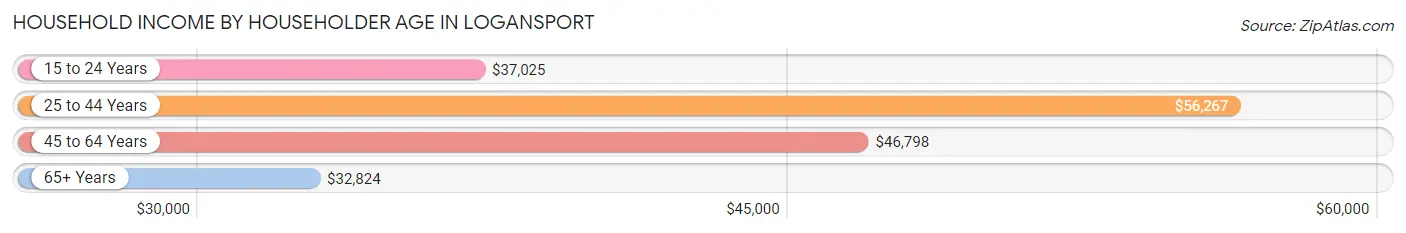
| Income Bracket | # Households | Median Income |
| 15 to 24 Years | 289 (4.2%) | $37,025 |
| 25 to 44 Years | 2,288 (33.4%) | $56,267 |
| 45 to 64 Years | 2,518 (36.7%) | $46,798 |
| 65+ Years | 1,757 (25.6%) | $32,824 |
| Total | 6,852 (100.0%) | $45,335 |
Poverty in Logansport
Income Below Poverty by Sex and Age in Logansport
With 17.7% poverty level for males and 19.3% for females among the residents of Logansport, 5 year old males and 5 year old females are the most vulnerable to poverty, with 154 males (50.0%) and 13 females (52.0%) in their respective age groups living below the poverty level.
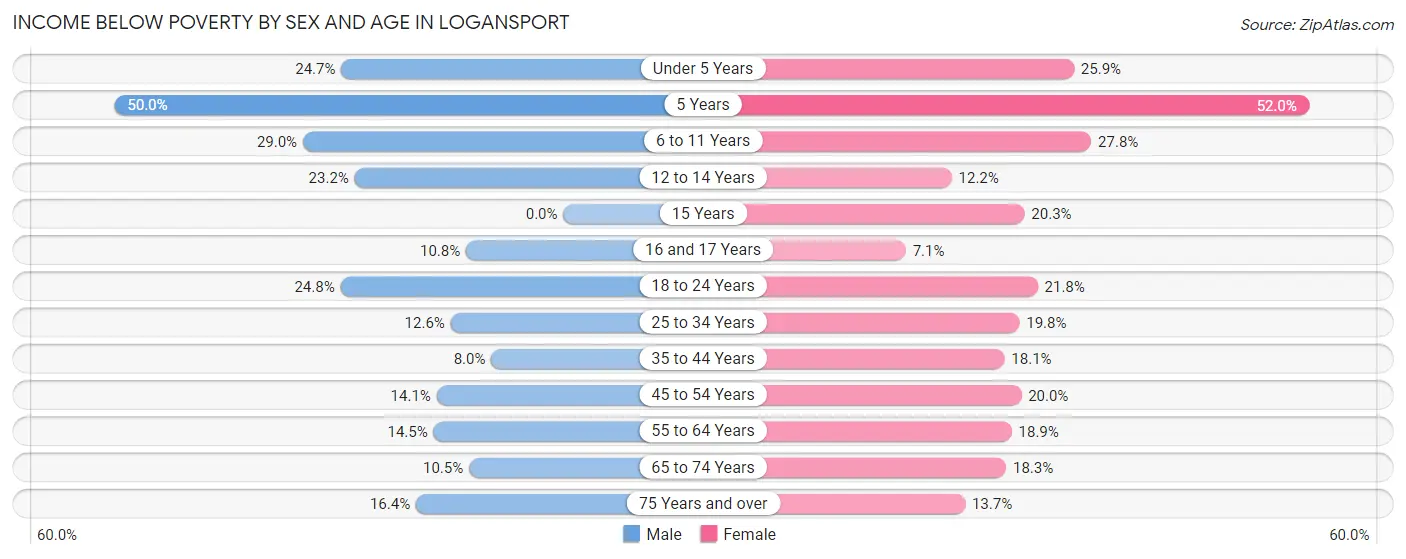
| Age Bracket | Male | Female |
| Under 5 Years | 161 (24.7%) | 159 (25.9%) |
| 5 Years | 154 (50.0%) | 13 (52.0%) |
| 6 to 11 Years | 205 (29.0%) | 183 (27.8%) |
| 12 to 14 Years | 86 (23.2%) | 40 (12.2%) |
| 15 Years | 0 (0.0%) | 24 (20.3%) |
| 16 and 17 Years | 18 (10.8%) | 27 (7.1%) |
| 18 to 24 Years | 243 (24.8%) | 186 (21.8%) |
| 25 to 34 Years | 134 (12.6%) | 206 (19.8%) |
| 35 to 44 Years | 91 (8.0%) | 195 (18.1%) |
| 45 to 54 Years | 123 (14.1%) | 194 (20.0%) |
| 55 to 64 Years | 202 (14.5%) | 216 (18.9%) |
| 65 to 74 Years | 61 (10.5%) | 139 (18.3%) |
| 75 Years and over | 54 (16.4%) | 107 (13.7%) |
| Total | 1,532 (17.7%) | 1,689 (19.3%) |
Income Above Poverty by Sex and Age in Logansport
According to the poverty statistics in Logansport, males aged 15 years and females aged 16 and 17 years are the age groups that are most secure financially, with 100.0% of males and 92.9% of females in these age groups living above the poverty line.
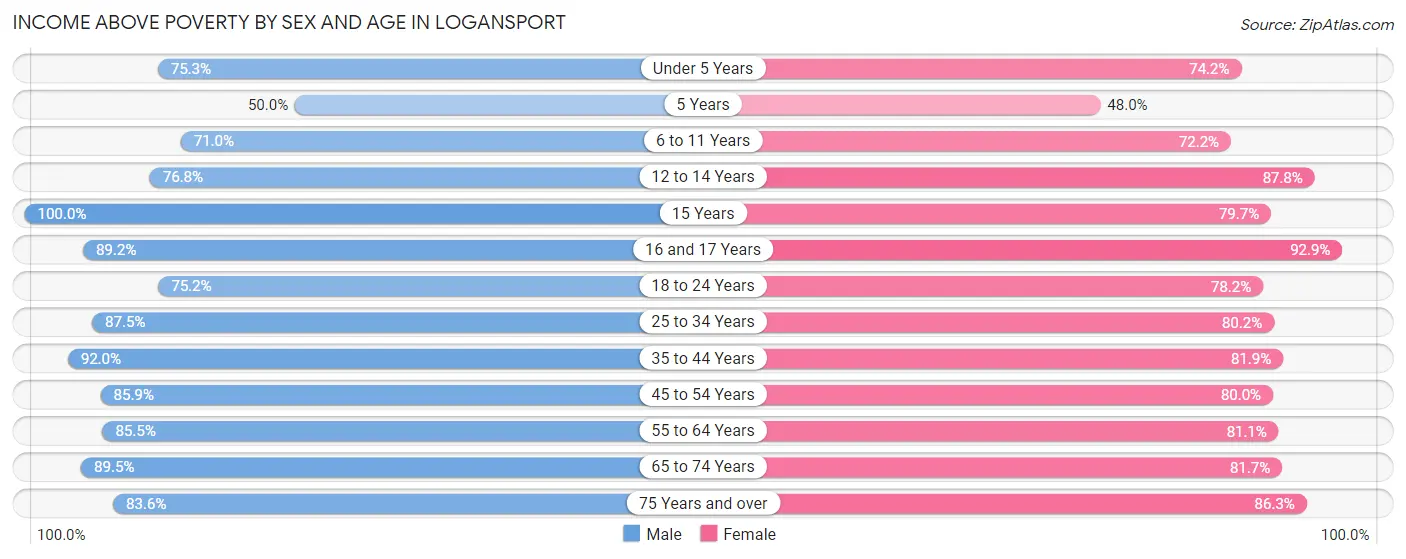
| Age Bracket | Male | Female |
| Under 5 Years | 490 (75.3%) | 456 (74.2%) |
| 5 Years | 154 (50.0%) | 12 (48.0%) |
| 6 to 11 Years | 502 (71.0%) | 476 (72.2%) |
| 12 to 14 Years | 284 (76.8%) | 287 (87.8%) |
| 15 Years | 79 (100.0%) | 94 (79.7%) |
| 16 and 17 Years | 148 (89.2%) | 352 (92.9%) |
| 18 to 24 Years | 736 (75.2%) | 667 (78.2%) |
| 25 to 34 Years | 934 (87.5%) | 836 (80.2%) |
| 35 to 44 Years | 1,043 (92.0%) | 882 (81.9%) |
| 45 to 54 Years | 749 (85.9%) | 777 (80.0%) |
| 55 to 64 Years | 1,195 (85.5%) | 926 (81.1%) |
| 65 to 74 Years | 520 (89.5%) | 621 (81.7%) |
| 75 Years and over | 275 (83.6%) | 673 (86.3%) |
| Total | 7,109 (82.3%) | 7,059 (80.7%) |
Income Below Poverty Among Married-Couple Families in Logansport
The poverty statistics for married-couple families in Logansport show that 8.3% or 218 of the total 2,625 families live below the poverty line. Families with 3 or 4 children have the highest poverty rate of 31.9%, comprising of 90 families. On the other hand, families with 5 or more children have the lowest poverty rate of 0.0%, which includes 0 families.
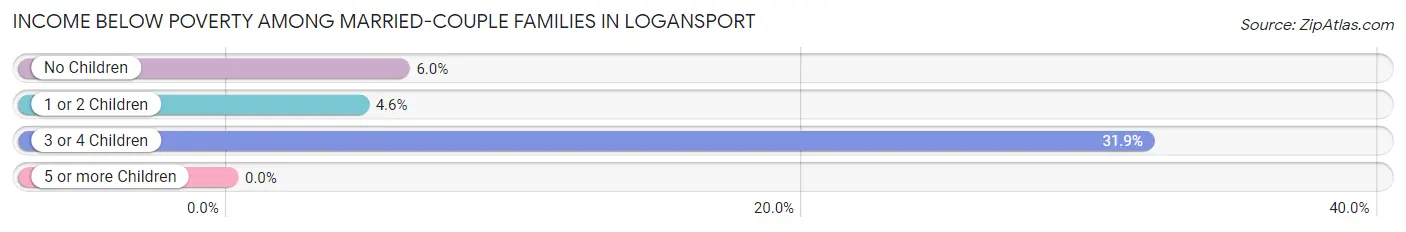
| Children | Above Poverty | Below Poverty |
| No Children | 1,480 (94.0%) | 94 (6.0%) |
| 1 or 2 Children | 714 (95.5%) | 34 (4.5%) |
| 3 or 4 Children | 192 (68.1%) | 90 (31.9%) |
| 5 or more Children | 21 (100.0%) | 0 (0.0%) |
| Total | 2,407 (91.7%) | 218 (8.3%) |
Income Below Poverty Among Single-Parent Households in Logansport
According to the poverty data in Logansport, 18.8% or 107 single-father households and 28.9% or 275 single-mother households are living below the poverty line. Among single-father households, those with 3 or 4 children have the highest poverty rate, with 36 households (69.2%) experiencing poverty. Likewise, among single-mother households, those with 1 or 2 children have the highest poverty rate, with 172 households (37.5%) falling below the poverty line.
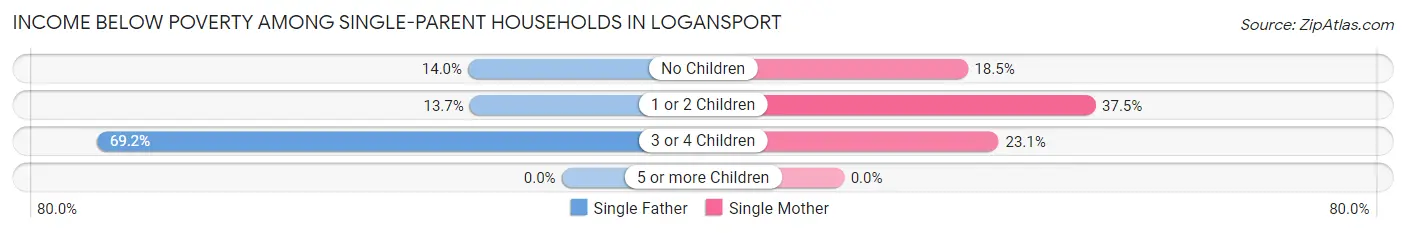
| Children | Single Father | Single Mother |
| No Children | 18 (14.0%) | 43 (18.4%) |
| 1 or 2 Children | 53 (13.7%) | 172 (37.5%) |
| 3 or 4 Children | 36 (69.2%) | 60 (23.1%) |
| 5 or more Children | 0 (0.0%) | 0 (0.0%) |
| Total | 107 (18.8%) | 275 (28.9%) |
Income Below Poverty Among Married-Couple vs Single-Parent Households in Logansport
The poverty data for Logansport shows that 218 of the married-couple family households (8.3%) and 382 of the single-parent households (25.1%) are living below the poverty level. Within the married-couple family households, those with 3 or 4 children have the highest poverty rate, with 90 households (31.9%) falling below the poverty line. Among the single-parent households, those with 3 or 4 children have the highest poverty rate, with 96 household (30.8%) living below poverty.
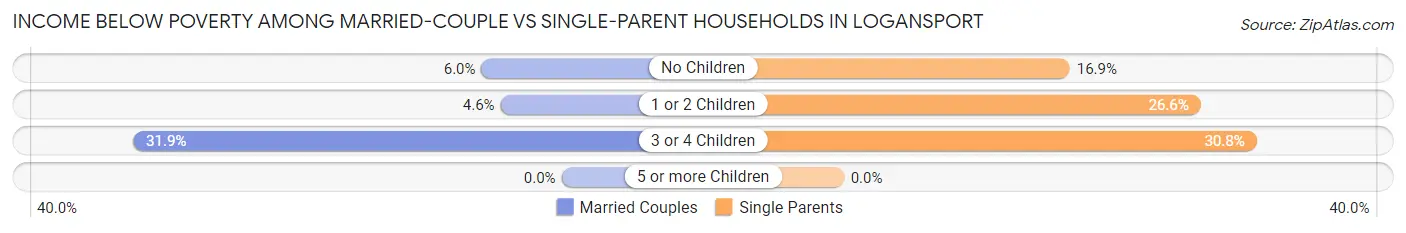
| Children | Married-Couple Families | Single-Parent Households |
| No Children | 94 (6.0%) | 61 (16.9%) |
| 1 or 2 Children | 34 (4.5%) | 225 (26.6%) |
| 3 or 4 Children | 90 (31.9%) | 96 (30.8%) |
| 5 or more Children | 0 (0.0%) | 0 (0.0%) |
| Total | 218 (8.3%) | 382 (25.1%) |
Race in Logansport
The most populous races in Logansport are White / Caucasian (12,731 | 70.1%), Hispanic or Latino (5,434 | 29.9%), and Some other Race (2,860 | 15.7%).
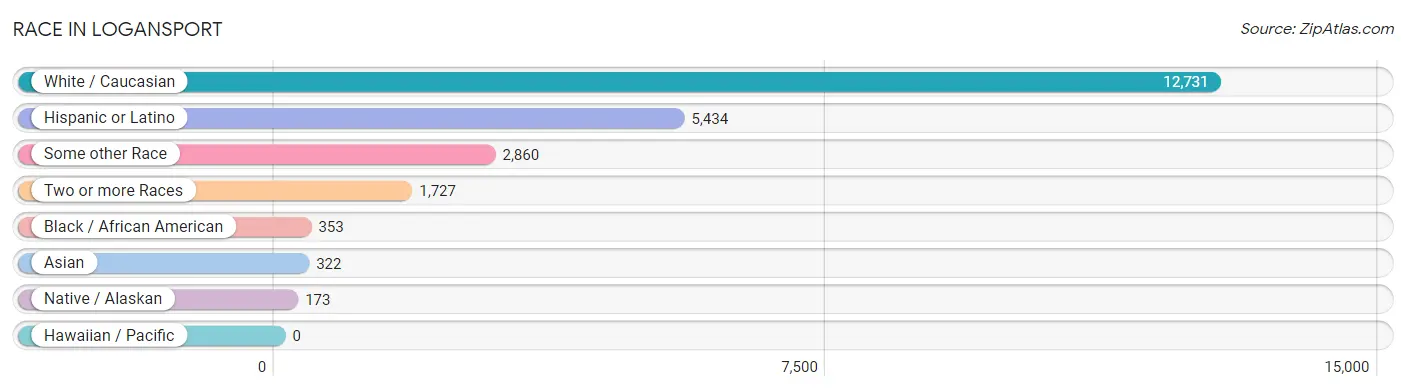
| Race | # Population | % Population |
| Asian | 322 | 1.8% |
| Black / African American | 353 | 1.9% |
| Hawaiian / Pacific | 0 | 0.0% |
| Hispanic or Latino | 5,434 | 29.9% |
| Native / Alaskan | 173 | 0.9% |
| White / Caucasian | 12,731 | 70.1% |
| Two or more Races | 1,727 | 9.5% |
| Some other Race | 2,860 | 15.7% |
| Total | 18,166 | 100.0% |
Ancestry in Logansport
The most populous ancestries reported in Logansport are Mexican (3,702 | 20.4%), German (3,087 | 17.0%), Irish (1,478 | 8.1%), American (998 | 5.5%), and English (953 | 5.2%), together accounting for 56.2% of all Logansport residents.
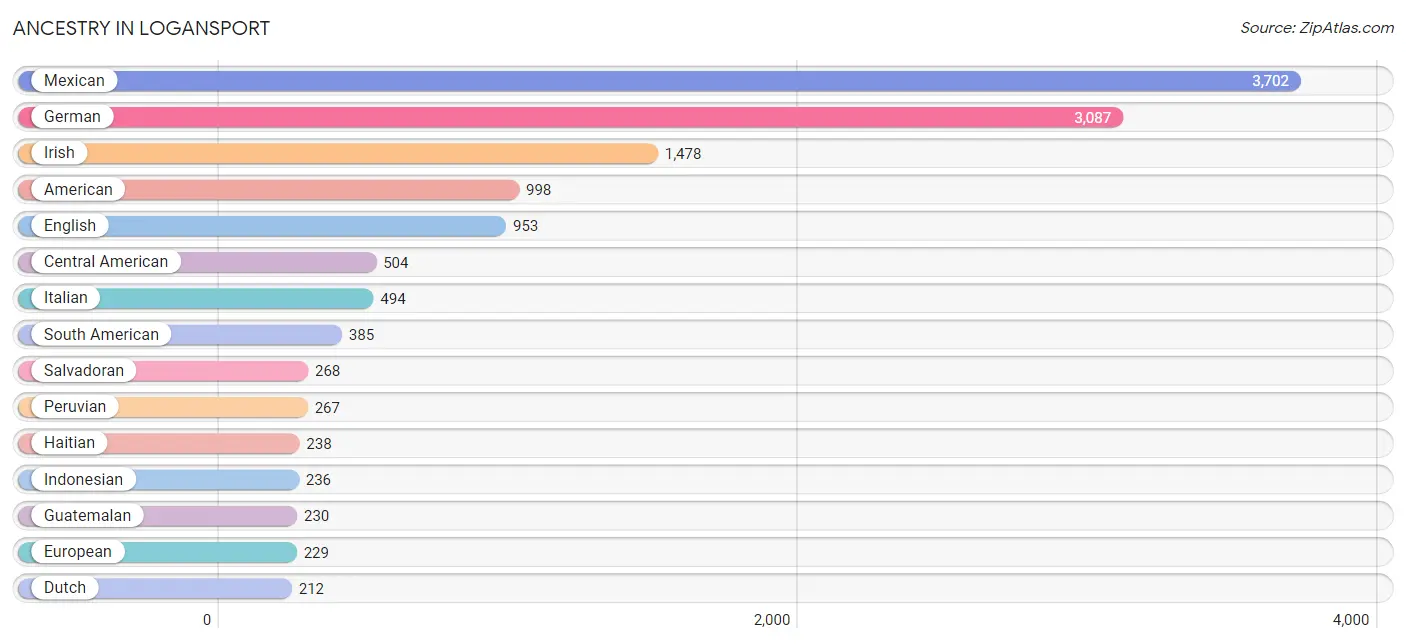
| Ancestry | # Population | % Population |
| American | 998 | 5.5% |
| Bhutanese | 106 | 0.6% |
| Blackfeet | 2 | 0.0% |
| British | 36 | 0.2% |
| Central American | 504 | 2.8% |
| Cherokee | 59 | 0.3% |
| Cheyenne | 13 | 0.1% |
| Choctaw | 4 | 0.0% |
| Cuban | 169 | 0.9% |
| Czech | 7 | 0.0% |
| Danish | 57 | 0.3% |
| Dominican | 90 | 0.5% |
| Dutch | 212 | 1.2% |
| Ecuadorian | 55 | 0.3% |
| English | 953 | 5.2% |
| European | 229 | 1.3% |
| Finnish | 12 | 0.1% |
| French | 155 | 0.9% |
| French Canadian | 8 | 0.0% |
| German | 3,087 | 17.0% |
| Greek | 9 | 0.1% |
| Guatemalan | 230 | 1.3% |
| Haitian | 238 | 1.3% |
| Honduran | 6 | 0.0% |
| Hungarian | 32 | 0.2% |
| Indian (Asian) | 87 | 0.5% |
| Indonesian | 236 | 1.3% |
| Irish | 1,478 | 8.1% |
| Italian | 494 | 2.7% |
| Kenyan | 69 | 0.4% |
| Korean | 123 | 0.7% |
| Laotian | 21 | 0.1% |
| Mexican | 3,702 | 20.4% |
| Mexican American Indian | 133 | 0.7% |
| Norwegian | 50 | 0.3% |
| Pennsylvania German | 49 | 0.3% |
| Peruvian | 267 | 1.5% |
| Polish | 65 | 0.4% |
| Puerto Rican | 182 | 1.0% |
| Romanian | 16 | 0.1% |
| Salvadoran | 268 | 1.5% |
| Scotch-Irish | 40 | 0.2% |
| Scottish | 186 | 1.0% |
| Sioux | 4 | 0.0% |
| Slovak | 10 | 0.1% |
| South American | 385 | 2.1% |
| Subsaharan African | 69 | 0.4% |
| Swedish | 11 | 0.1% |
| Swiss | 33 | 0.2% |
| Thai | 41 | 0.2% |
| Trinidadian and Tobagonian | 18 | 0.1% |
| Venezuelan | 63 | 0.4% |
| Welsh | 68 | 0.4% | View All 53 Rows |
Immigrants in Logansport
The most numerous immigrant groups reported in Logansport came from Latin America (2,604 | 14.3%), Central America (1,929 | 10.6%), Mexico (1,675 | 9.2%), Asia (504 | 2.8%), and Caribbean (440 | 2.4%), together accounting for 39.4% of all Logansport residents.
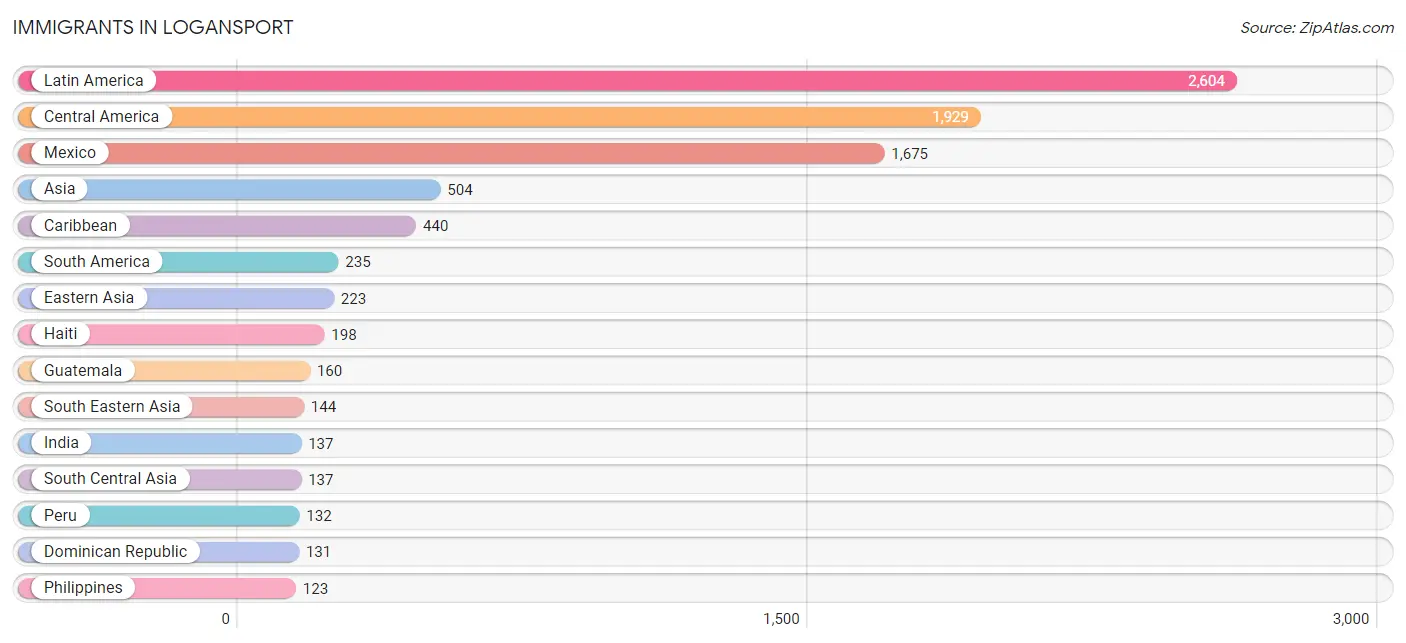
| Immigration Origin | # Population | % Population |
| Asia | 504 | 2.8% |
| Caribbean | 440 | 2.4% |
| Central America | 1,929 | 10.6% |
| China | 121 | 0.7% |
| Cuba | 93 | 0.5% |
| Dominican Republic | 131 | 0.7% |
| Eastern Asia | 223 | 1.2% |
| El Salvador | 88 | 0.5% |
| Europe | 47 | 0.3% |
| Germany | 47 | 0.3% |
| Guatemala | 160 | 0.9% |
| Haiti | 198 | 1.1% |
| Honduras | 6 | 0.0% |
| India | 137 | 0.7% |
| Indonesia | 21 | 0.1% |
| Japan | 52 | 0.3% |
| Korea | 50 | 0.3% |
| Latin America | 2,604 | 14.3% |
| Mexico | 1,675 | 9.2% |
| Peru | 132 | 0.7% |
| Philippines | 123 | 0.7% |
| South America | 235 | 1.3% |
| South Central Asia | 137 | 0.7% |
| South Eastern Asia | 144 | 0.8% |
| Taiwan | 72 | 0.4% |
| Trinidad and Tobago | 18 | 0.1% |
| Venezuela | 103 | 0.6% |
| Western Europe | 47 | 0.3% | View All 28 Rows |
Sex and Age in Logansport
Sex and Age in Logansport
The most populous age groups in Logansport are 55 to 59 Years (768 | 8.5%) for men and 20 to 24 Years (741 | 8.2%) for women.
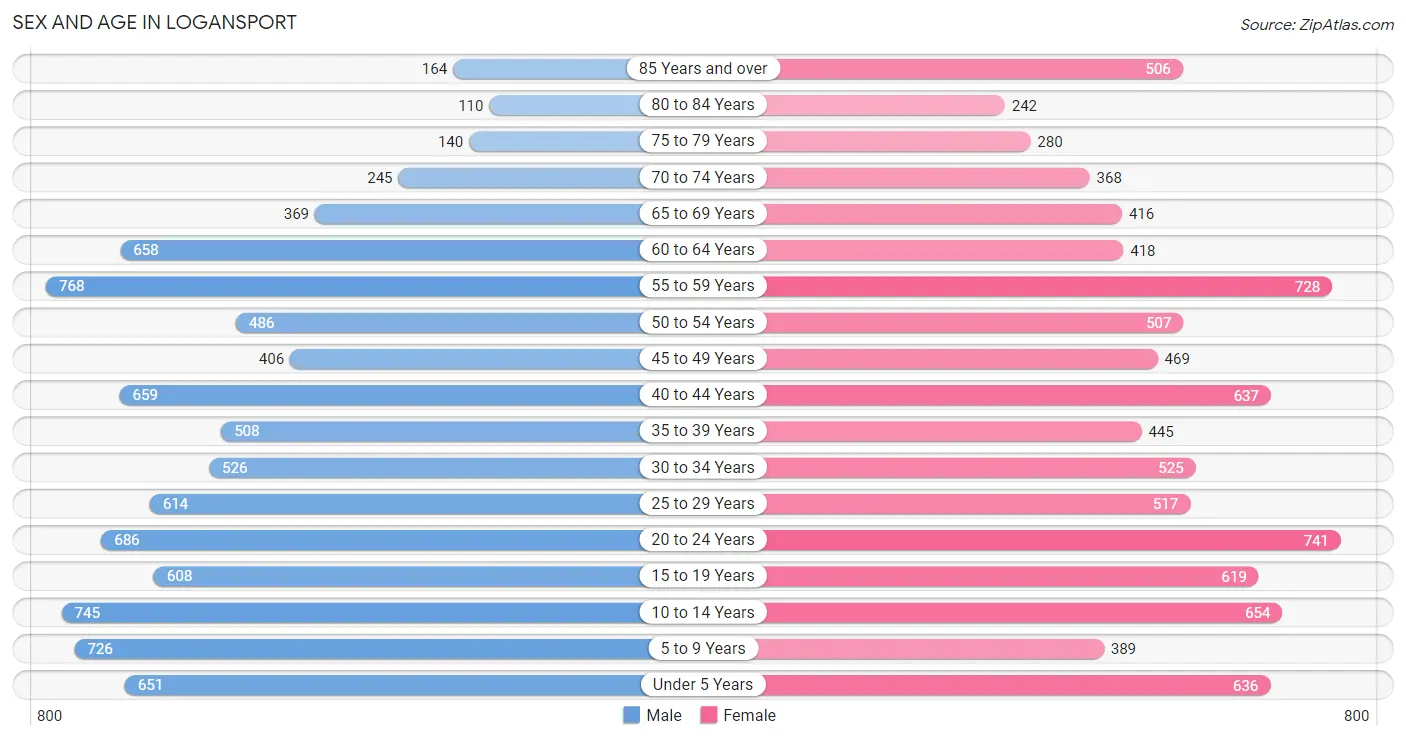
| Age Bracket | Male | Female |
| Under 5 Years | 651 (7.2%) | 636 (7.0%) |
| 5 to 9 Years | 726 (8.0%) | 389 (4.3%) |
| 10 to 14 Years | 745 (8.2%) | 654 (7.2%) |
| 15 to 19 Years | 608 (6.7%) | 619 (6.8%) |
| 20 to 24 Years | 686 (7.6%) | 741 (8.2%) |
| 25 to 29 Years | 614 (6.8%) | 517 (5.7%) |
| 30 to 34 Years | 526 (5.8%) | 525 (5.8%) |
| 35 to 39 Years | 508 (5.6%) | 445 (4.9%) |
| 40 to 44 Years | 659 (7.3%) | 637 (7.0%) |
| 45 to 49 Years | 406 (4.5%) | 469 (5.2%) |
| 50 to 54 Years | 486 (5.4%) | 507 (5.6%) |
| 55 to 59 Years | 768 (8.5%) | 728 (8.0%) |
| 60 to 64 Years | 658 (7.3%) | 418 (4.6%) |
| 65 to 69 Years | 369 (4.1%) | 416 (4.6%) |
| 70 to 74 Years | 245 (2.7%) | 368 (4.1%) |
| 75 to 79 Years | 140 (1.5%) | 280 (3.1%) |
| 80 to 84 Years | 110 (1.2%) | 242 (2.7%) |
| 85 Years and over | 164 (1.8%) | 506 (5.6%) |
| Total | 9,069 (100.0%) | 9,097 (100.0%) |
Families and Households in Logansport
Median Family Size in Logansport
The median family size in Logansport is 3.24 persons per family, with married-couple families (2,625 | 63.3%) accounting for the largest median family size of 3.37 persons per family. On the other hand, single male/father families (568 | 13.7%) represent the smallest median family size with 2.93 persons per family.
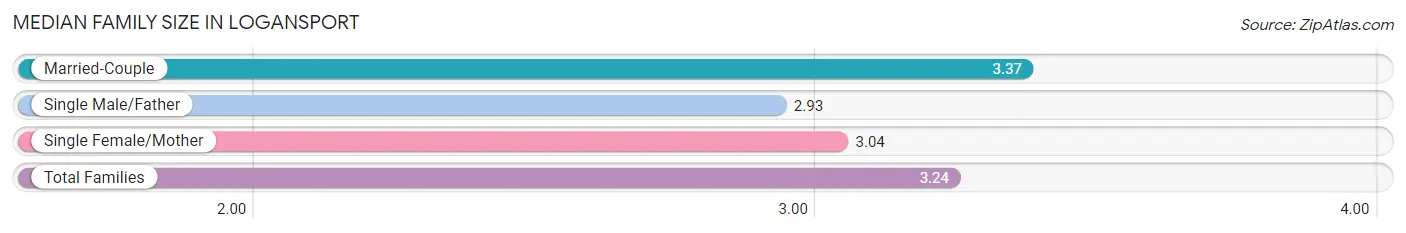
| Family Type | # Families | Family Size |
| Married-Couple | 2,625 (63.3%) | 3.37 |
| Single Male/Father | 568 (13.7%) | 2.93 |
| Single Female/Mother | 952 (23.0%) | 3.04 |
| Total Families | 4,145 (100.0%) | 3.24 |
Median Household Size in Logansport
The median household size in Logansport is 2.53 persons per household, with married-couple households (2,625 | 38.3%) accounting for the largest median household size of 3.43 persons per household. non-family households (2,707 | 39.5%) represent the smallest median household size with 1.23 persons per household.
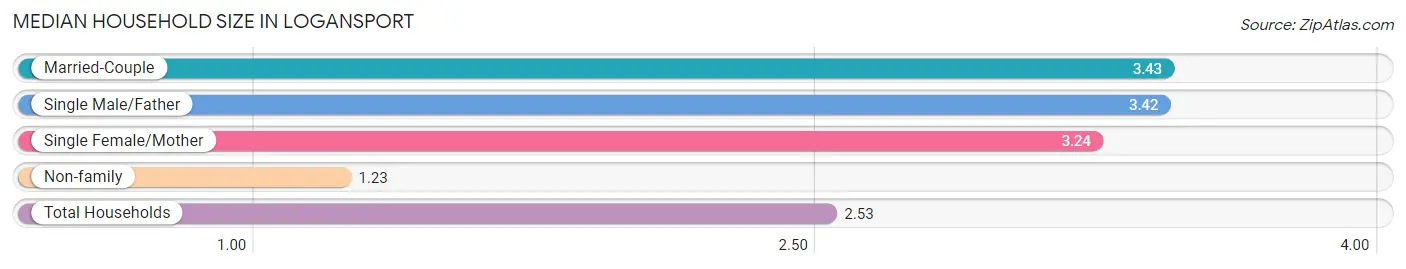
| Household Type | # Households | Household Size |
| Married-Couple | 2,625 (38.3%) | 3.43 |
| Single Male/Father | 568 (8.3%) | 3.42 |
| Single Female/Mother | 952 (13.9%) | 3.24 |
| Non-family | 2,707 (39.5%) | 1.23 |
| Total Households | 6,852 (100.0%) | 2.53 |
Household Size by Marriage Status in Logansport
Out of a total of 6,852 households in Logansport, 4,145 (60.5%) are family households, while 2,707 (39.5%) are nonfamily households. The most numerous type of family households are 2-person households, comprising 1,743, and the most common type of nonfamily households are 1-person households, comprising 2,323.
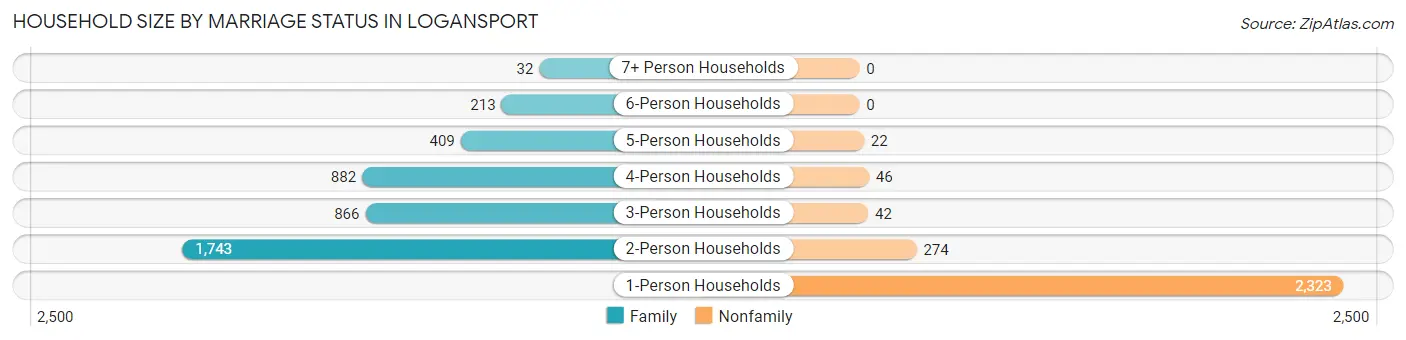
| Household Size | Family Households | Nonfamily Households |
| 1-Person Households | - | 2,323 (33.9%) |
| 2-Person Households | 1,743 (25.4%) | 274 (4.0%) |
| 3-Person Households | 866 (12.6%) | 42 (0.6%) |
| 4-Person Households | 882 (12.9%) | 46 (0.7%) |
| 5-Person Households | 409 (6.0%) | 22 (0.3%) |
| 6-Person Households | 213 (3.1%) | 0 (0.0%) |
| 7+ Person Households | 32 (0.5%) | 0 (0.0%) |
| Total | 4,145 (60.5%) | 2,707 (39.5%) |
Female Fertility in Logansport
Fertility by Age in Logansport
Average fertility rate in Logansport is 54.0 births per 1,000 women. Women in the age bracket of 20 to 34 years have the highest fertility rate with 94.0 births per 1,000 women. Women in the age bracket of 20 to 34 years acount for 76.0% of all women with births.
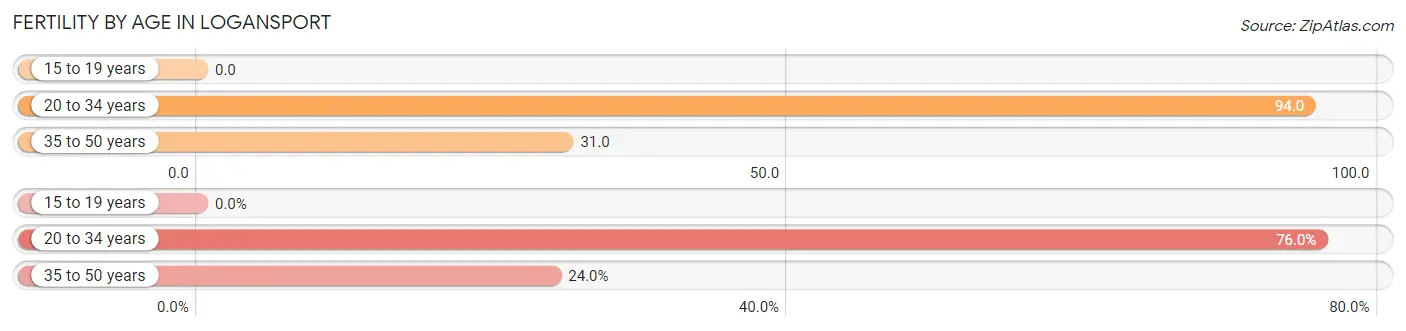
| Age Bracket | Women with Births | Births / 1,000 Women |
| 15 to 19 years | 0 (0.0%) | 0.0 |
| 20 to 34 years | 168 (76.0%) | 94.0 |
| 35 to 50 years | 53 (24.0%) | 31.0 |
| Total | 221 (100.0%) | 54.0 |
Fertility by Age by Marriage Status in Logansport
77.8% of women with births (221) in Logansport are married. The highest percentage of unmarried women with births falls into 20 to 34 years age bracket with 25.6% of them unmarried at the time of birth, while the lowest percentage of unmarried women with births belong to 35 to 50 years age bracket with 11.3% of them unmarried.
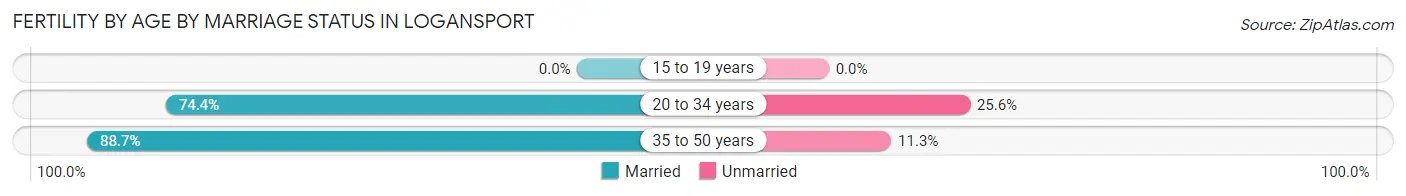
| Age Bracket | Married | Unmarried |
| 15 to 19 years | 0 (0.0%) | 0 (0.0%) |
| 20 to 34 years | 125 (74.4%) | 43 (25.6%) |
| 35 to 50 years | 47 (88.7%) | 6 (11.3%) |
| Total | 172 (77.8%) | 49 (22.2%) |
Fertility by Education in Logansport
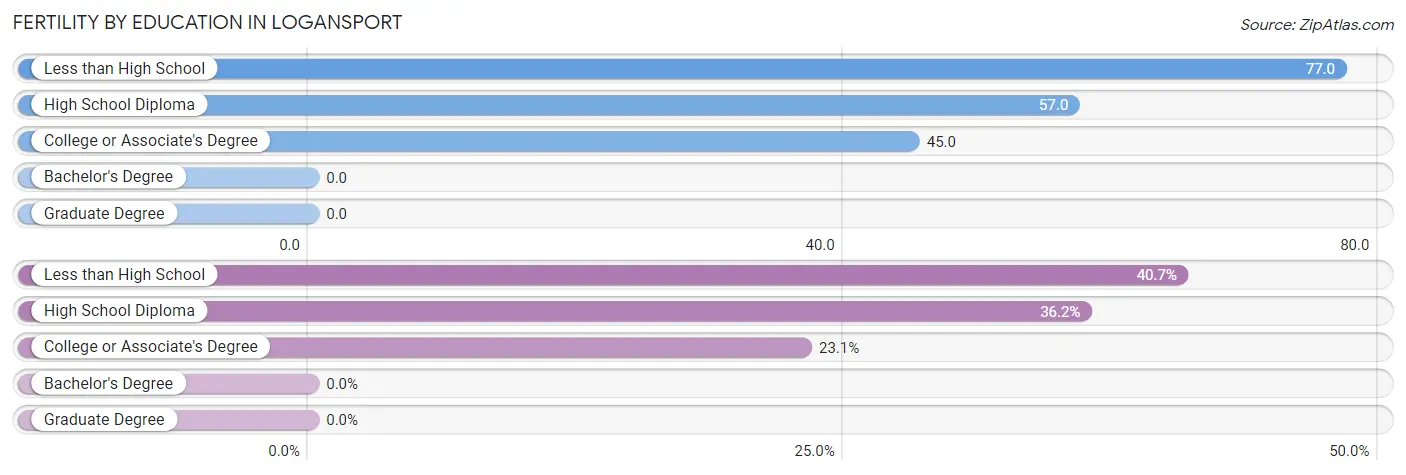
| Educational Attainment | Women with Births | Births / 1,000 Women |
| Less than High School | 90 (40.7%) | 77.0 |
| High School Diploma | 80 (36.2%) | 57.0 |
| College or Associate's Degree | 51 (23.1%) | 45.0 |
| Bachelor's Degree | 0 (0.0%) | 0.0 |
| Graduate Degree | 0 (0.0%) | 0.0 |
| Total | 221 (100.0%) | 54.0 |
Fertility by Education by Marriage Status in Logansport
22.2% of women with births in Logansport are unmarried. Women with the educational attainment of college or associate's degree are most likely to be married with 90.2% of them married at childbirth, while women with the educational attainment of high school diploma are least likely to be married with 40.0% of them unmarried at childbirth.
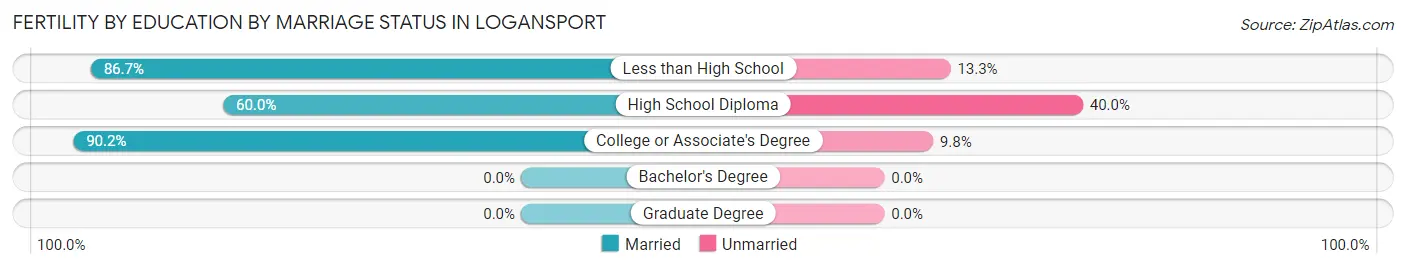
| Educational Attainment | Married | Unmarried |
| Less than High School | 78 (86.7%) | 12 (13.3%) |
| High School Diploma | 48 (60.0%) | 32 (40.0%) |
| College or Associate's Degree | 46 (90.2%) | 5 (9.8%) |
| Bachelor's Degree | 0 (0.0%) | 0 (0.0%) |
| Graduate Degree | 0 (0.0%) | 0 (0.0%) |
| Total | 172 (77.8%) | 49 (22.2%) |
Employment Characteristics in Logansport
Employment by Class of Employer in Logansport
Among the 8,144 employed individuals in Logansport, private company employees (6,345 | 77.9%), not-for-profit organizations (695 | 8.5%), and local government employees (448 | 5.5%) make up the most common classes of employment.
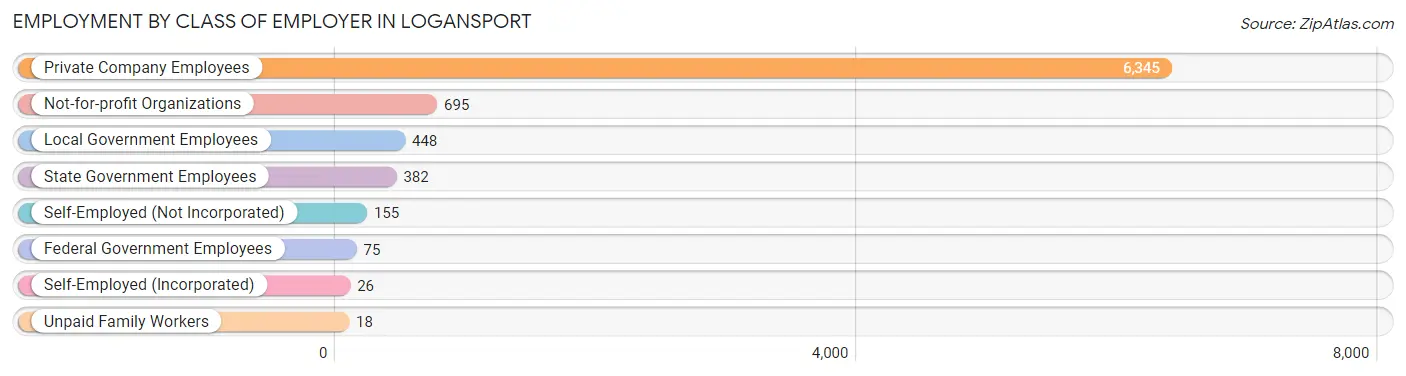
| Employer Class | # Employees | % Employees |
| Private Company Employees | 6,345 | 77.9% |
| Self-Employed (Incorporated) | 26 | 0.3% |
| Self-Employed (Not Incorporated) | 155 | 1.9% |
| Not-for-profit Organizations | 695 | 8.5% |
| Local Government Employees | 448 | 5.5% |
| State Government Employees | 382 | 4.7% |
| Federal Government Employees | 75 | 0.9% |
| Unpaid Family Workers | 18 | 0.2% |
| Total | 8,144 | 100.0% |
Employment Status by Age in Logansport
According to the labor force statistics for Logansport, out of the total population over 16 years of age (14,161), 60.5% or 8,567 individuals are in the labor force, with 3.2% or 274 of them unemployed. The age group with the highest labor force participation rate is 30 to 34 years, with 85.6% or 900 individuals in the labor force. Within the labor force, the 20 to 24 years age range has the highest percentage of unemployed individuals, with 11.2% or 124 of them being unemployed.
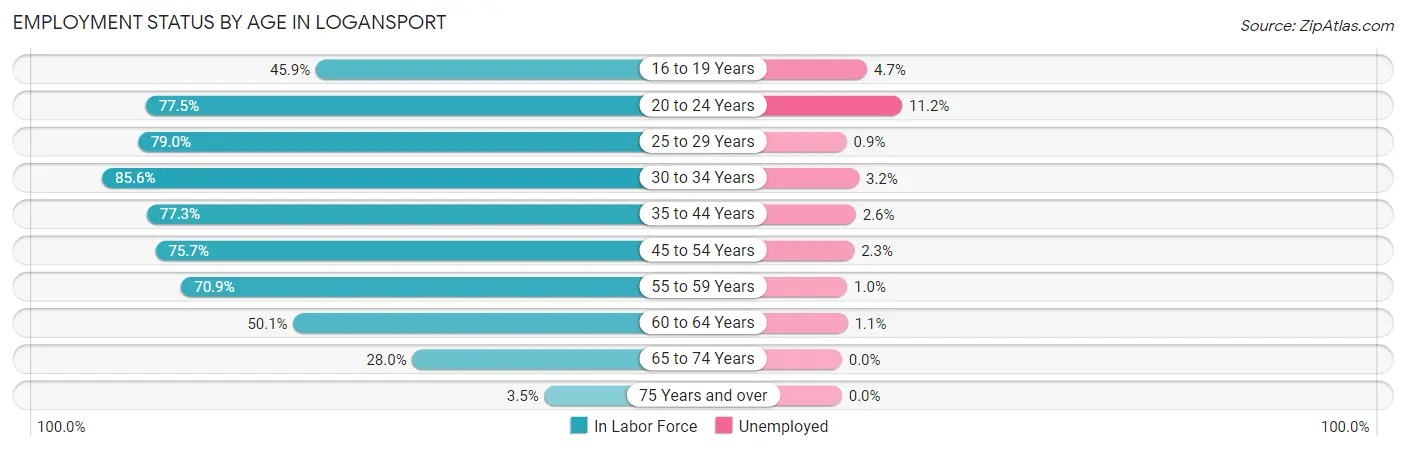
| Age Bracket | In Labor Force | Unemployed |
| 16 to 19 Years | 470 (45.9%) | 22 (4.7%) |
| 20 to 24 Years | 1,106 (77.5%) | 124 (11.2%) |
| 25 to 29 Years | 893 (79.0%) | 8 (0.9%) |
| 30 to 34 Years | 900 (85.6%) | 29 (3.2%) |
| 35 to 44 Years | 1,738 (77.3%) | 45 (2.6%) |
| 45 to 54 Years | 1,414 (75.7%) | 33 (2.3%) |
| 55 to 59 Years | 1,061 (70.9%) | 11 (1.0%) |
| 60 to 64 Years | 539 (50.1%) | 6 (1.1%) |
| 65 to 74 Years | 391 (28.0%) | 0 (0.0%) |
| 75 Years and over | 50 (3.5%) | 0 (0.0%) |
| Total | 8,567 (60.5%) | 274 (3.2%) |
Employment Status by Educational Attainment in Logansport
According to labor force statistics for Logansport, 73.8% of individuals (6,547) out of the total population between 25 and 64 years of age (8,871) are in the labor force, with 2.0% or 131 of them being unemployed. The group with the highest labor force participation rate are those with the educational attainment of bachelor's degree or higher, with 90.1% or 999 individuals in the labor force. Within the labor force, individuals with less than high school education have the highest percentage of unemployment, with 4.8% or 49 of them being unemployed.
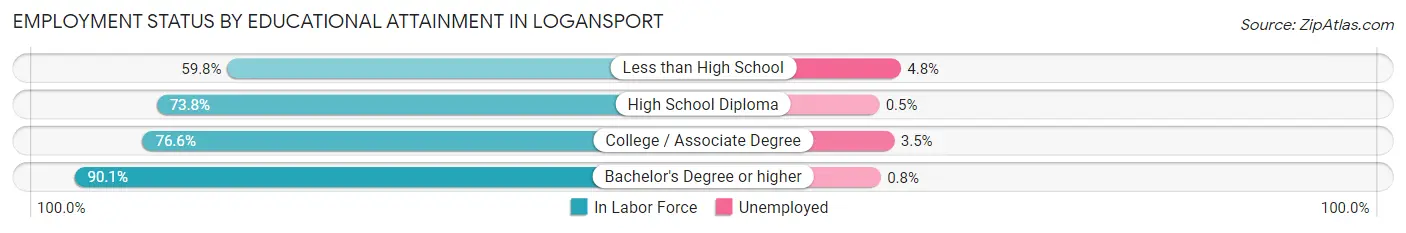
| Educational Attainment | In Labor Force | Unemployed |
| Less than High School | 1,030 (59.8%) | 83 (4.8%) |
| High School Diploma | 2,804 (73.8%) | 19 (0.5%) |
| College / Associate Degree | 1,715 (76.6%) | 78 (3.5%) |
| Bachelor's Degree or higher | 999 (90.1%) | 9 (0.8%) |
| Total | 6,547 (73.8%) | 177 (2.0%) |
Employment Occupations by Sex in Logansport
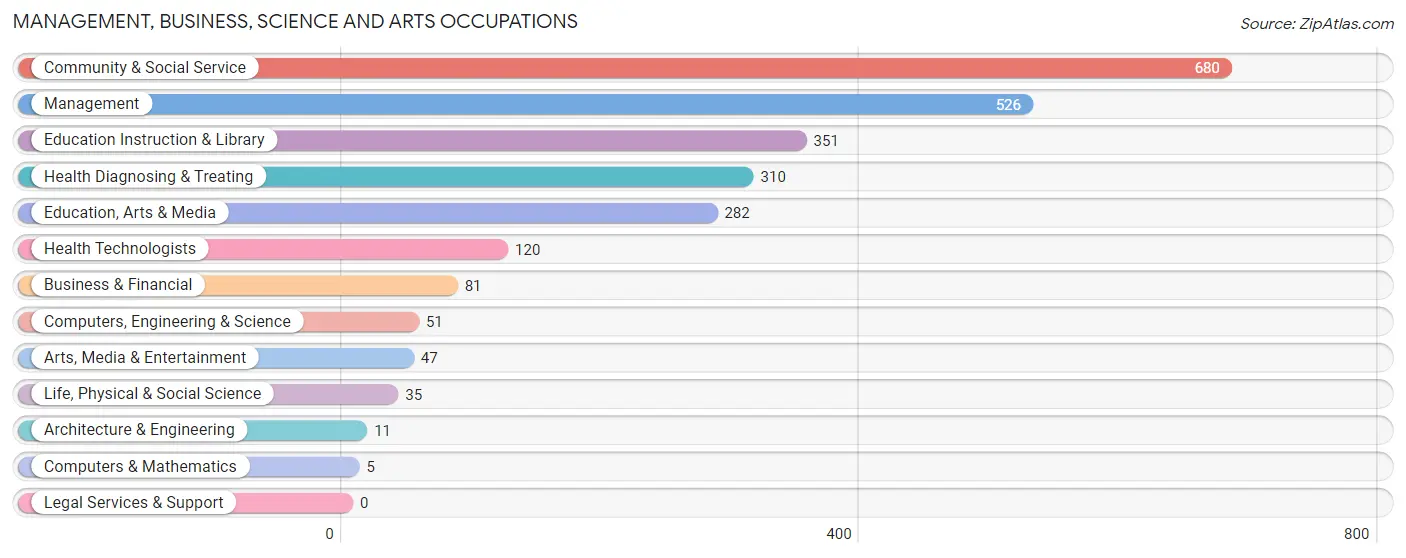
Management, Business, Science and Arts Occupations
The most common Management, Business, Science and Arts occupations in Logansport are Community & Social Service (680 | 8.2%), Management (526 | 6.4%), Education Instruction & Library (351 | 4.3%), Health Diagnosing & Treating (310 | 3.7%), and Education, Arts & Media (282 | 3.4%).
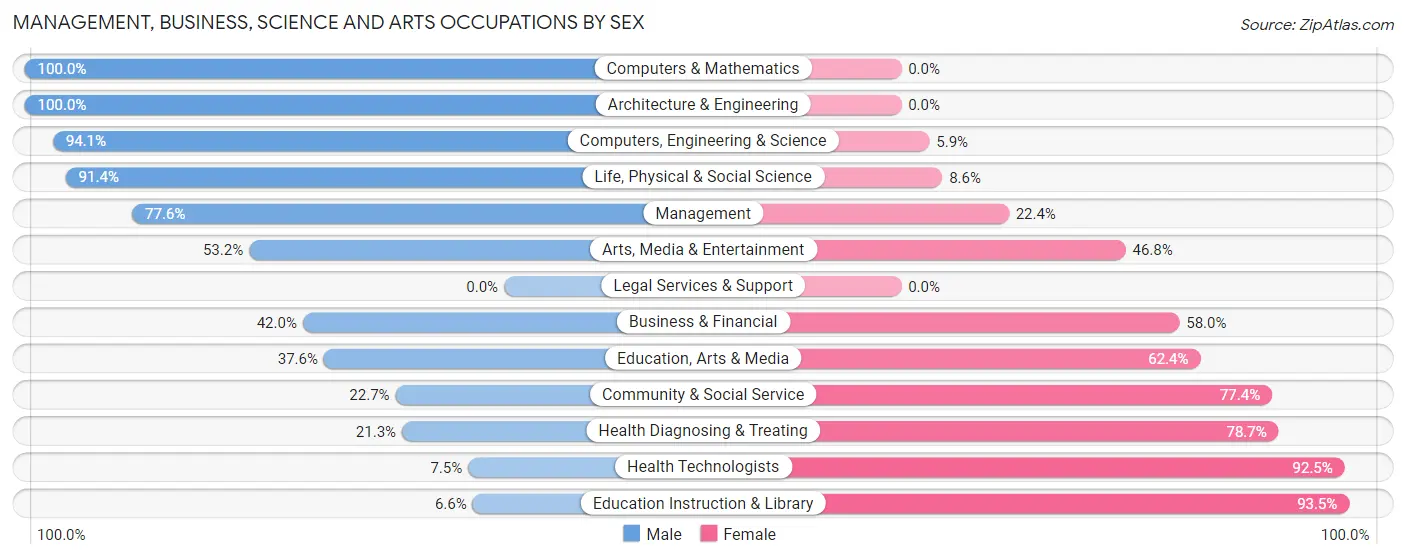
Management, Business, Science and Arts Occupations by Sex
Within the Management, Business, Science and Arts occupations in Logansport, the most male-oriented occupations are Computers & Mathematics (100.0%), Architecture & Engineering (100.0%), and Computers, Engineering & Science (94.1%), while the most female-oriented occupations are Education Instruction & Library (93.4%), Health Technologists (92.5%), and Health Diagnosing & Treating (78.7%).
| Occupation | Male | Female |
| Management | 408 (77.6%) | 118 (22.4%) |
| Business & Financial | 34 (42.0%) | 47 (58.0%) |
| Computers, Engineering & Science | 48 (94.1%) | 3 (5.9%) |
| Computers & Mathematics | 5 (100.0%) | 0 (0.0%) |
| Architecture & Engineering | 11 (100.0%) | 0 (0.0%) |
| Life, Physical & Social Science | 32 (91.4%) | 3 (8.6%) |
| Community & Social Service | 154 (22.7%) | 526 (77.3%) |
| Education, Arts & Media | 106 (37.6%) | 176 (62.4%) |
| Legal Services & Support | 0 (0.0%) | 0 (0.0%) |
| Education Instruction & Library | 23 (6.6%) | 328 (93.4%) |
| Arts, Media & Entertainment | 25 (53.2%) | 22 (46.8%) |
| Health Diagnosing & Treating | 66 (21.3%) | 244 (78.7%) |
| Health Technologists | 9 (7.5%) | 111 (92.5%) |
| Total (Category) | 710 (43.1%) | 938 (56.9%) |
| Total (Overall) | 4,249 (51.4%) | 4,016 (48.6%) |
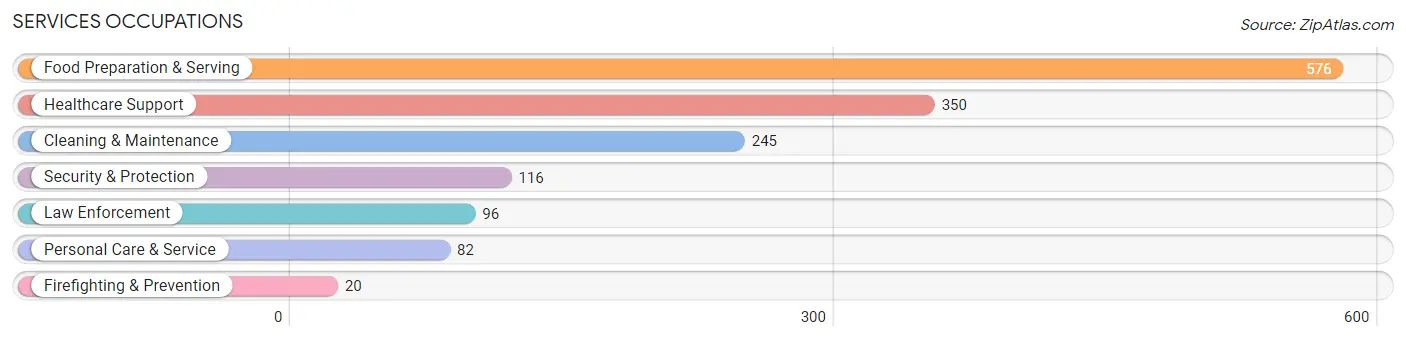
Services Occupations
The most common Services occupations in Logansport are Food Preparation & Serving (576 | 7.0%), Healthcare Support (350 | 4.2%), Cleaning & Maintenance (245 | 3.0%), Security & Protection (116 | 1.4%), and Law Enforcement (96 | 1.2%).
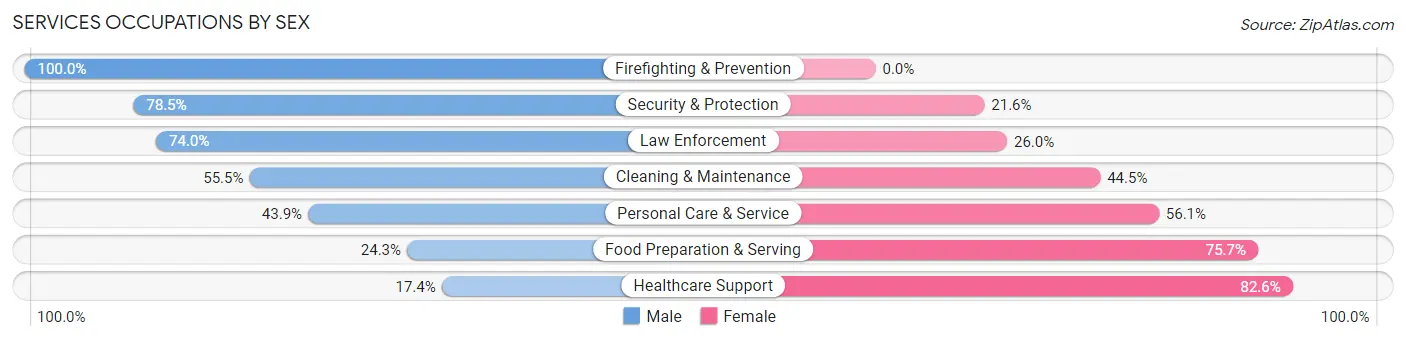
Services Occupations by Sex
Within the Services occupations in Logansport, the most male-oriented occupations are Firefighting & Prevention (100.0%), Security & Protection (78.4%), and Law Enforcement (74.0%), while the most female-oriented occupations are Healthcare Support (82.6%), Food Preparation & Serving (75.7%), and Personal Care & Service (56.1%).
| Occupation | Male | Female |
| Healthcare Support | 61 (17.4%) | 289 (82.6%) |
| Security & Protection | 91 (78.4%) | 25 (21.5%) |
| Firefighting & Prevention | 20 (100.0%) | 0 (0.0%) |
| Law Enforcement | 71 (74.0%) | 25 (26.0%) |
| Food Preparation & Serving | 140 (24.3%) | 436 (75.7%) |
| Cleaning & Maintenance | 136 (55.5%) | 109 (44.5%) |
| Personal Care & Service | 36 (43.9%) | 46 (56.1%) |
| Total (Category) | 464 (33.9%) | 905 (66.1%) |
| Total (Overall) | 4,249 (51.4%) | 4,016 (48.6%) |
Sales and Office Occupations
The most common Sales and Office occupations in Logansport are Sales & Related (744 | 9.0%), and Office & Administration (637 | 7.7%).
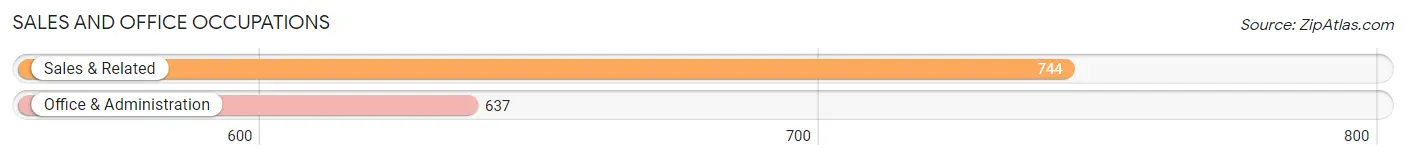
Sales and Office Occupations by Sex
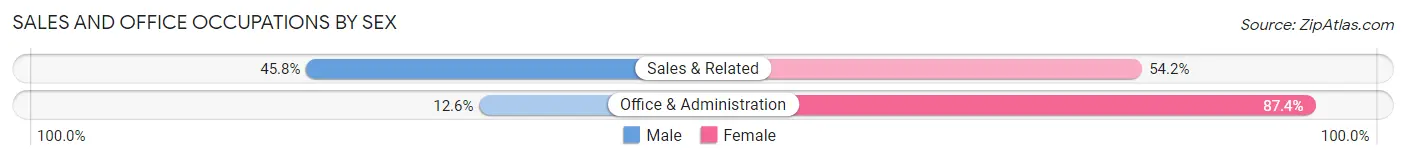
| Occupation | Male | Female |
| Sales & Related | 341 (45.8%) | 403 (54.2%) |
| Office & Administration | 80 (12.6%) | 557 (87.4%) |
| Total (Category) | 421 (30.5%) | 960 (69.5%) |
| Total (Overall) | 4,249 (51.4%) | 4,016 (48.6%) |
Natural Resources, Construction and Maintenance Occupations
The most common Natural Resources, Construction and Maintenance occupations in Logansport are Construction & Extraction (310 | 3.7%), Installation, Maintenance & Repair (268 | 3.2%), and Farming, Fishing & Forestry (66 | 0.8%).
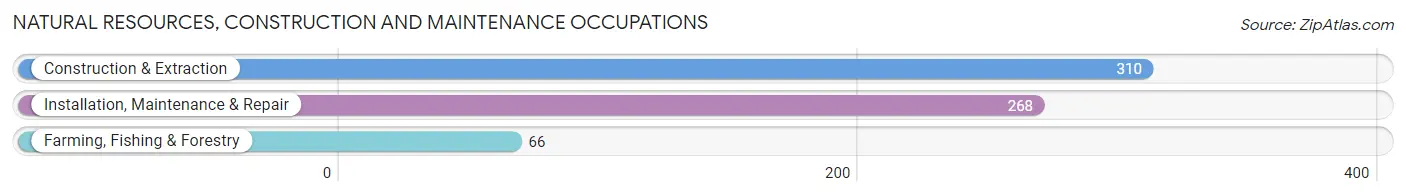
Natural Resources, Construction and Maintenance Occupations by Sex
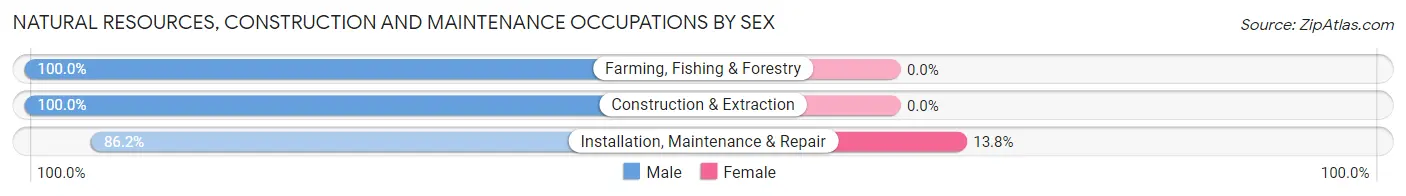
| Occupation | Male | Female |
| Farming, Fishing & Forestry | 66 (100.0%) | 0 (0.0%) |
| Construction & Extraction | 310 (100.0%) | 0 (0.0%) |
| Installation, Maintenance & Repair | 231 (86.2%) | 37 (13.8%) |
| Total (Category) | 607 (94.3%) | 37 (5.8%) |
| Total (Overall) | 4,249 (51.4%) | 4,016 (48.6%) |
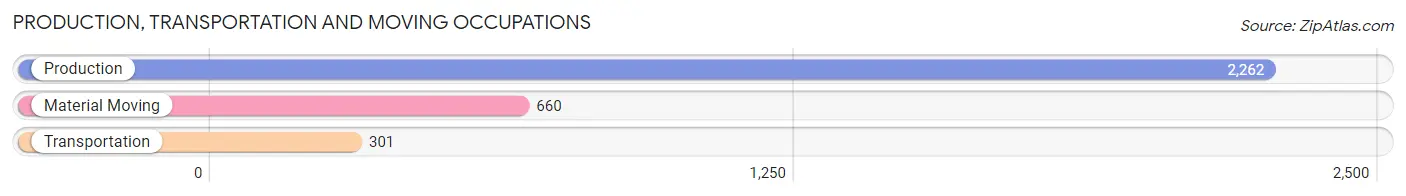
Production, Transportation and Moving Occupations
The most common Production, Transportation and Moving occupations in Logansport are Production (2,262 | 27.4%), Material Moving (660 | 8.0%), and Transportation (301 | 3.6%).
Production, Transportation and Moving Occupations by Sex
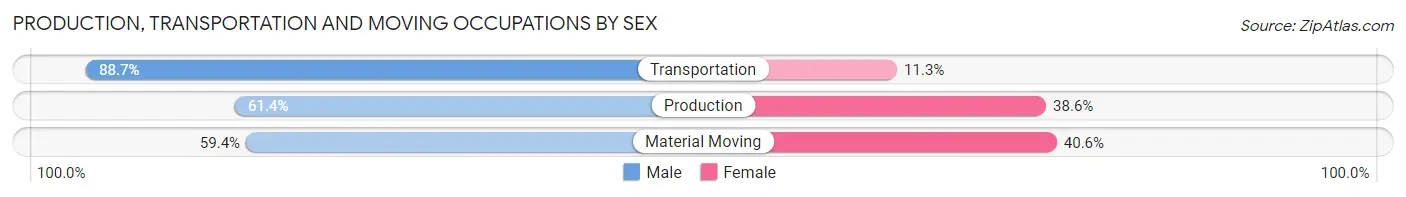
| Occupation | Male | Female |
| Production | 1,388 (61.4%) | 874 (38.6%) |
| Transportation | 267 (88.7%) | 34 (11.3%) |
| Material Moving | 392 (59.4%) | 268 (40.6%) |
| Total (Category) | 2,047 (63.5%) | 1,176 (36.5%) |
| Total (Overall) | 4,249 (51.4%) | 4,016 (48.6%) |
Employment Industries by Sex in Logansport
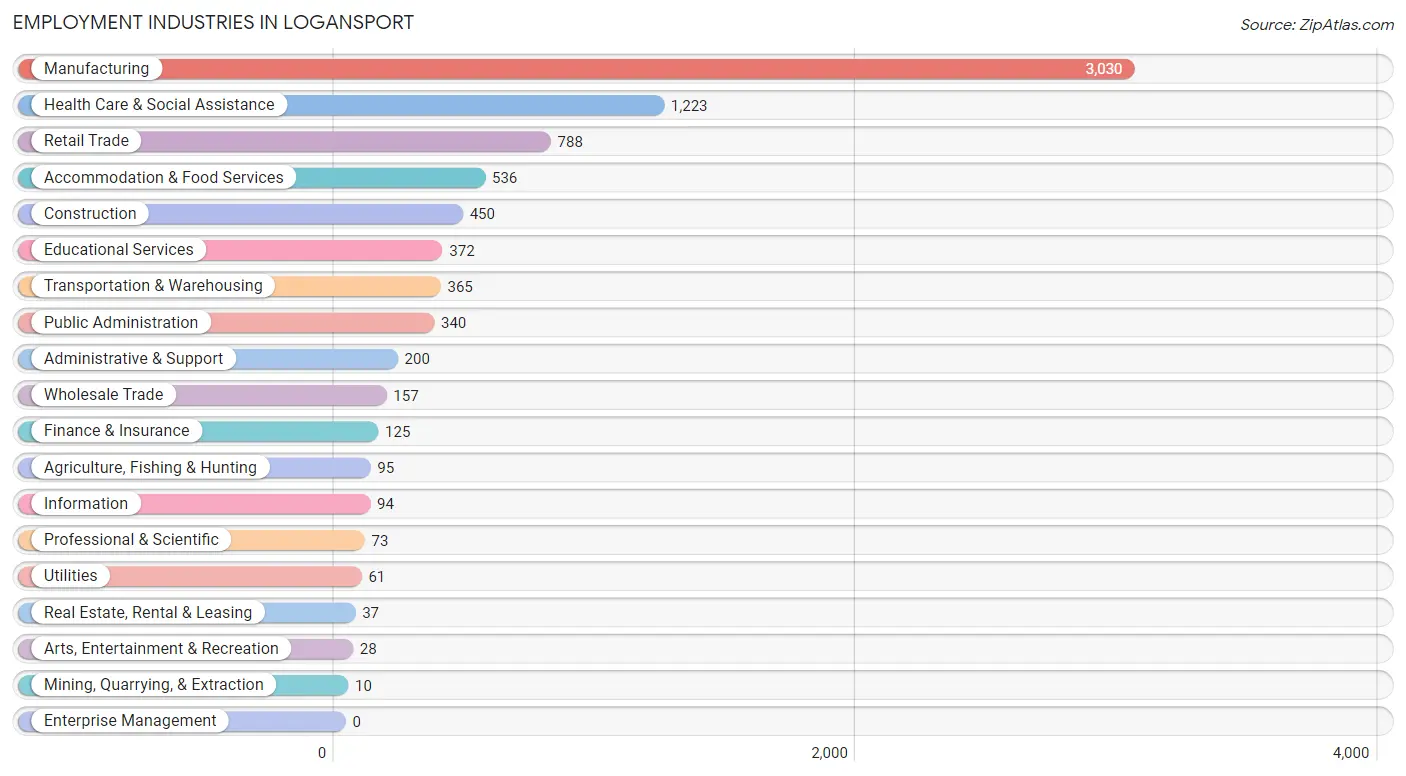
Employment Industries in Logansport
The major employment industries in Logansport include Manufacturing (3,030 | 36.7%), Health Care & Social Assistance (1,223 | 14.8%), Retail Trade (788 | 9.5%), Accommodation & Food Services (536 | 6.5%), and Construction (450 | 5.4%).
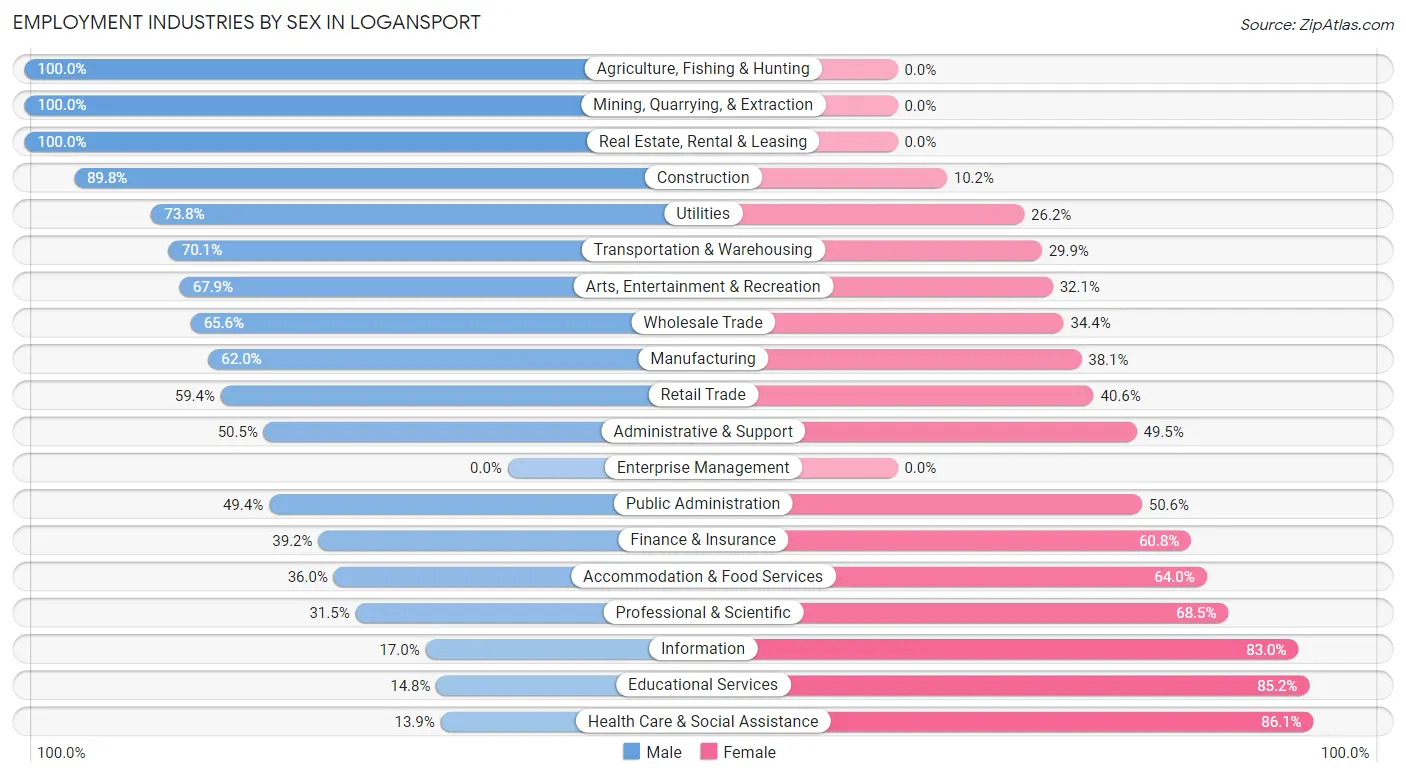
Employment Industries by Sex in Logansport
The Logansport industries that see more men than women are Agriculture, Fishing & Hunting (100.0%), Mining, Quarrying, & Extraction (100.0%), and Real Estate, Rental & Leasing (100.0%), whereas the industries that tend to have a higher number of women are Health Care & Social Assistance (86.1%), Educational Services (85.2%), and Information (83.0%).
| Industry | Male | Female |
| Agriculture, Fishing & Hunting | 95 (100.0%) | 0 (0.0%) |
| Mining, Quarrying, & Extraction | 10 (100.0%) | 0 (0.0%) |
| Construction | 404 (89.8%) | 46 (10.2%) |
| Manufacturing | 1,877 (62.0%) | 1,153 (38.1%) |
| Wholesale Trade | 103 (65.6%) | 54 (34.4%) |
| Retail Trade | 468 (59.4%) | 320 (40.6%) |
| Transportation & Warehousing | 256 (70.1%) | 109 (29.9%) |
| Utilities | 45 (73.8%) | 16 (26.2%) |
| Information | 16 (17.0%) | 78 (83.0%) |
| Finance & Insurance | 49 (39.2%) | 76 (60.8%) |
| Real Estate, Rental & Leasing | 37 (100.0%) | 0 (0.0%) |
| Professional & Scientific | 23 (31.5%) | 50 (68.5%) |
| Enterprise Management | 0 (0.0%) | 0 (0.0%) |
| Administrative & Support | 101 (50.5%) | 99 (49.5%) |
| Educational Services | 55 (14.8%) | 317 (85.2%) |
| Health Care & Social Assistance | 170 (13.9%) | 1,053 (86.1%) |
| Arts, Entertainment & Recreation | 19 (67.9%) | 9 (32.1%) |
| Accommodation & Food Services | 193 (36.0%) | 343 (64.0%) |
| Public Administration | 168 (49.4%) | 172 (50.6%) |
| Total | 4,249 (51.4%) | 4,016 (48.6%) |
Education in Logansport
School Enrollment in Logansport
The most common levels of schooling among the 4,217 students in Logansport are high school (1,187 | 28.1%), elementary school (930 | 22.1%), and middle school (841 | 19.9%).

| School Level | # Students | % Students |
| Nursery / Preschool | 219 | 5.2% |
| Kindergarten | 334 | 7.9% |
| Elementary School | 930 | 22.1% |
| Middle School | 841 | 19.9% |
| High School | 1,187 | 28.1% |
| College / Undergraduate | 658 | 15.6% |
| Graduate / Professional | 48 | 1.1% |
| Total | 4,217 | 100.0% |
School Enrollment by Age by Funding Source in Logansport
Out of a total of 4,217 students who are enrolled in schools in Logansport, 261 (6.2%) attend a private institution, while the remaining 3,956 (93.8%) are enrolled in public schools. The age group of 35 years and over has the highest likelihood of being enrolled in private schools, with 24 (22.0% in the age bracket) enrolled. Conversely, the age group of 18 to 19 year olds has the lowest likelihood of being enrolled in a private school, with 357 (99.7% in the age bracket) attending a public institution.
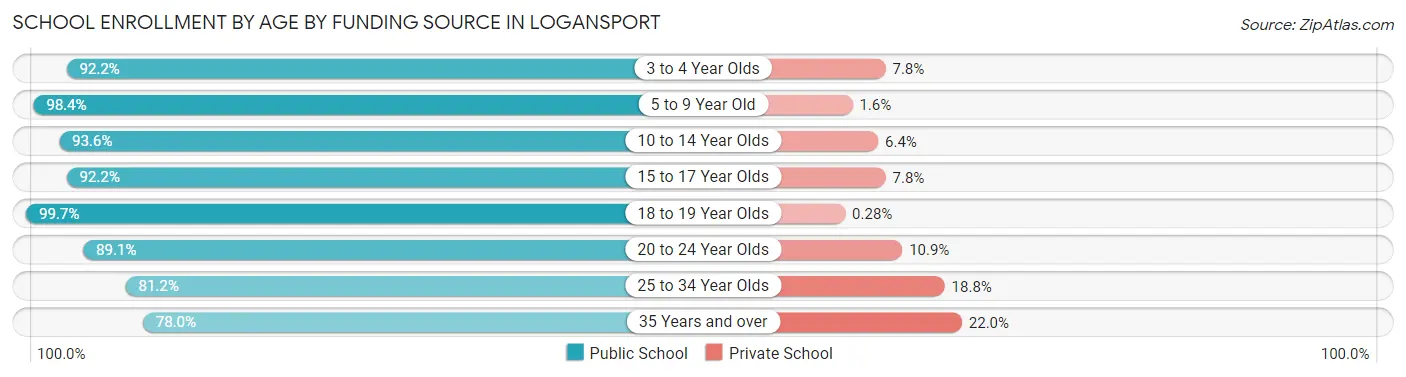
| Age Bracket | Public School | Private School |
| 3 to 4 Year Olds | 189 (92.2%) | 16 (7.8%) |
| 5 to 9 Year Old | 1,028 (98.4%) | 17 (1.6%) |
| 10 to 14 Year Olds | 1,152 (93.6%) | 79 (6.4%) |
| 15 to 17 Year Olds | 696 (92.2%) | 59 (7.8%) |
| 18 to 19 Year Olds | 357 (99.7%) | 1 (0.3%) |
| 20 to 24 Year Olds | 368 (89.1%) | 45 (10.9%) |
| 25 to 34 Year Olds | 82 (81.2%) | 19 (18.8%) |
| 35 Years and over | 85 (78.0%) | 24 (22.0%) |
| Total | 3,956 (93.8%) | 261 (6.2%) |
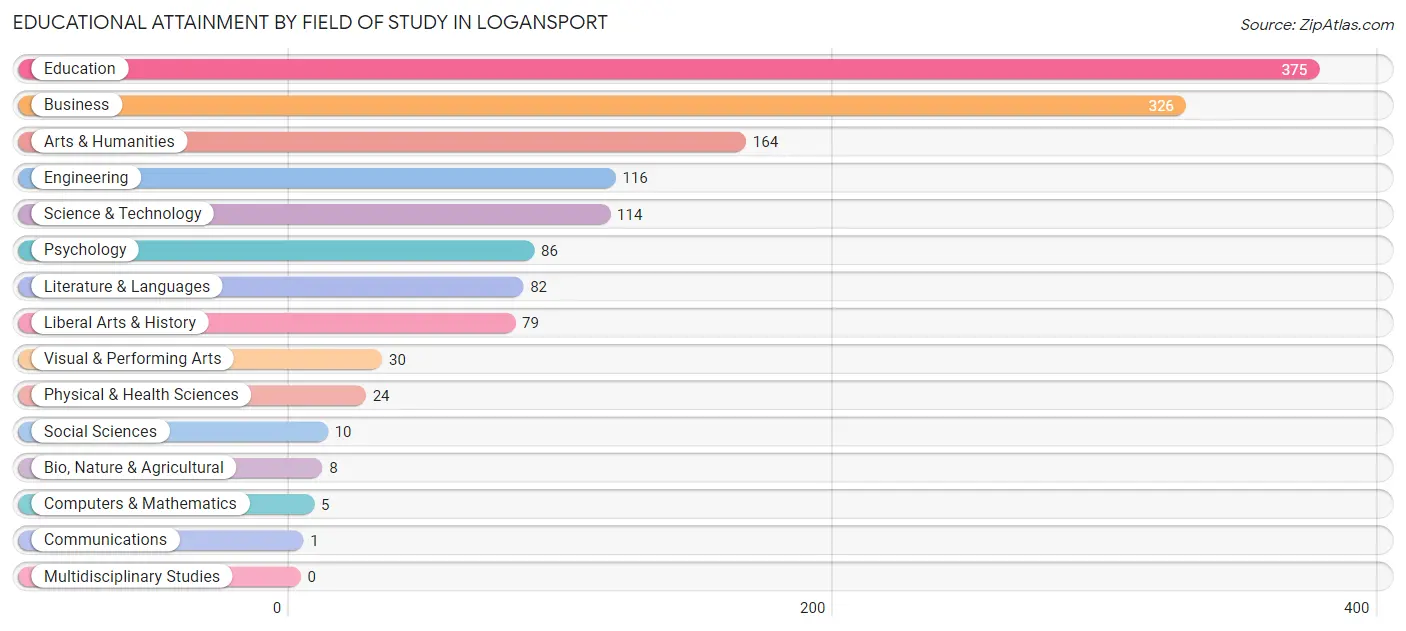
Educational Attainment by Field of Study in Logansport
Education (375 | 26.4%), business (326 | 23.0%), arts & humanities (164 | 11.6%), engineering (116 | 8.2%), and science & technology (114 | 8.0%) are the most common fields of study among 1,420 individuals in Logansport who have obtained a bachelor's degree or higher.
| Field of Study | # Graduates | % Graduates |
| Computers & Mathematics | 5 | 0.4% |
| Bio, Nature & Agricultural | 8 | 0.6% |
| Physical & Health Sciences | 24 | 1.7% |
| Psychology | 86 | 6.1% |
| Social Sciences | 10 | 0.7% |
| Engineering | 116 | 8.2% |
| Multidisciplinary Studies | 0 | 0.0% |
| Science & Technology | 114 | 8.0% |
| Business | 326 | 23.0% |
| Education | 375 | 26.4% |
| Literature & Languages | 82 | 5.8% |
| Liberal Arts & History | 79 | 5.6% |
| Visual & Performing Arts | 30 | 2.1% |
| Communications | 1 | 0.1% |
| Arts & Humanities | 164 | 11.6% |
| Total | 1,420 | 100.0% |
Transportation & Commute in Logansport
Vehicle Availability by Sex in Logansport
The most prevalent vehicle ownership categories in Logansport are males with 2 vehicles (1,980, accounting for 47.5%) and females with 2 vehicles (1,872, making up 49.9%).
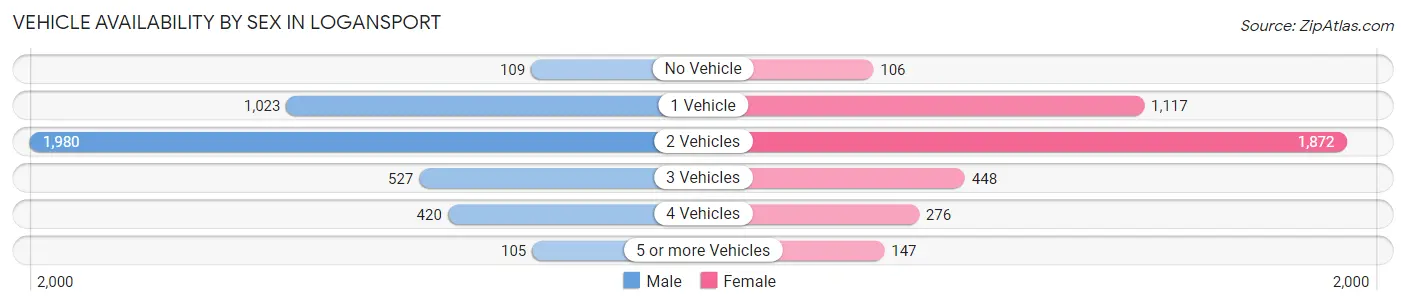
| Vehicles Available | Male | Female |
| No Vehicle | 109 (2.6%) | 106 (2.7%) |
| 1 Vehicle | 1,023 (24.6%) | 1,117 (28.2%) |
| 2 Vehicles | 1,980 (47.5%) | 1,872 (47.2%) |
| 3 Vehicles | 527 (12.7%) | 448 (11.3%) |
| 4 Vehicles | 420 (10.1%) | 276 (7.0%) |
| 5 or more Vehicles | 105 (2.5%) | 147 (3.7%) |
| Total | 4,164 (100.0%) | 3,966 (100.0%) |
Commute Time in Logansport
The most frequently occuring commute durations in Logansport are 10 to 14 minutes (2,066 commuters, 25.7%), 5 to 9 minutes (1,963 commuters, 24.4%), and 15 to 19 minutes (728 commuters, 9.1%).
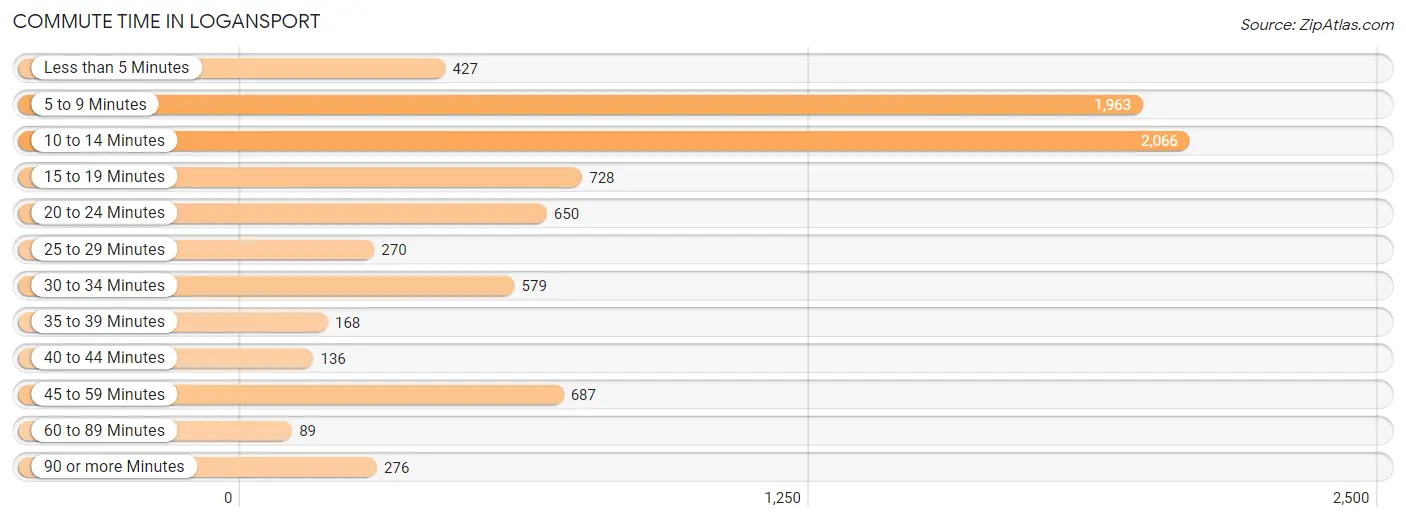
| Commute Time | # Commuters | % Commuters |
| Less than 5 Minutes | 427 | 5.3% |
| 5 to 9 Minutes | 1,963 | 24.4% |
| 10 to 14 Minutes | 2,066 | 25.7% |
| 15 to 19 Minutes | 728 | 9.1% |
| 20 to 24 Minutes | 650 | 8.1% |
| 25 to 29 Minutes | 270 | 3.4% |
| 30 to 34 Minutes | 579 | 7.2% |
| 35 to 39 Minutes | 168 | 2.1% |
| 40 to 44 Minutes | 136 | 1.7% |
| 45 to 59 Minutes | 687 | 8.6% |
| 60 to 89 Minutes | 89 | 1.1% |
| 90 or more Minutes | 276 | 3.4% |
Commute Time by Sex in Logansport
The most common commute times in Logansport are 10 to 14 minutes (1,084 commuters, 26.1%) for males and 5 to 9 minutes (1,063 commuters, 27.4%) for females.
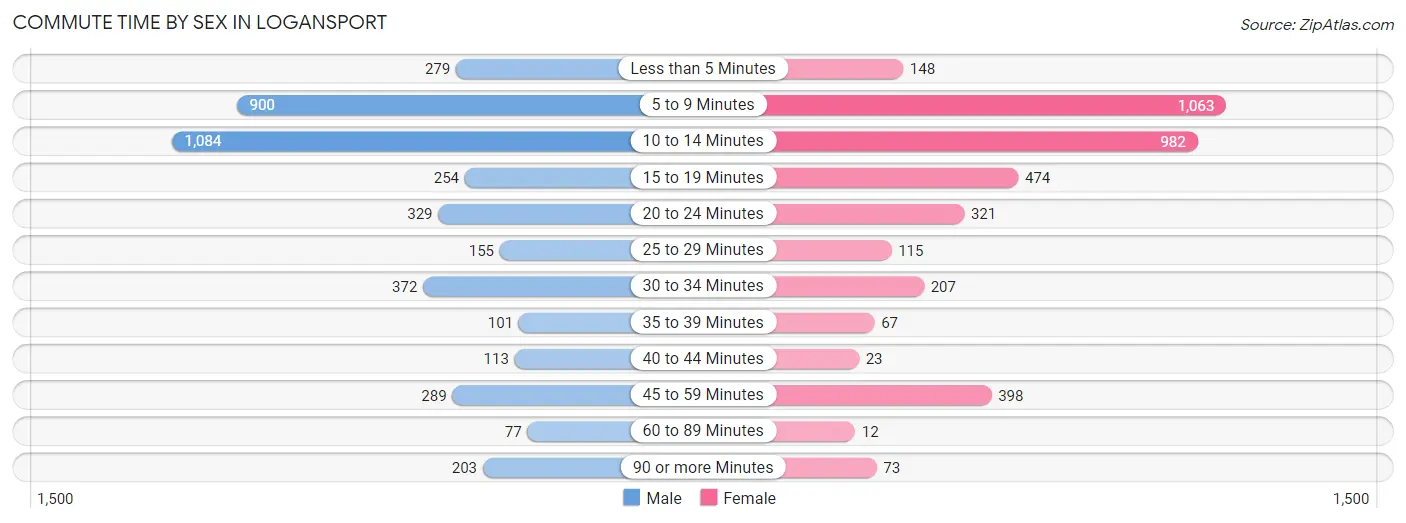
| Commute Time | Male | Female |
| Less than 5 Minutes | 279 (6.7%) | 148 (3.8%) |
| 5 to 9 Minutes | 900 (21.7%) | 1,063 (27.4%) |
| 10 to 14 Minutes | 1,084 (26.1%) | 982 (25.3%) |
| 15 to 19 Minutes | 254 (6.1%) | 474 (12.2%) |
| 20 to 24 Minutes | 329 (7.9%) | 321 (8.3%) |
| 25 to 29 Minutes | 155 (3.7%) | 115 (3.0%) |
| 30 to 34 Minutes | 372 (8.9%) | 207 (5.3%) |
| 35 to 39 Minutes | 101 (2.4%) | 67 (1.7%) |
| 40 to 44 Minutes | 113 (2.7%) | 23 (0.6%) |
| 45 to 59 Minutes | 289 (7.0%) | 398 (10.2%) |
| 60 to 89 Minutes | 77 (1.8%) | 12 (0.3%) |
| 90 or more Minutes | 203 (4.9%) | 73 (1.9%) |
Time of Departure to Work by Sex in Logansport
The most frequent times of departure to work in Logansport are 12:00 PM to 3:59 PM (756, 18.2%) for males and 12:00 PM to 3:59 PM (719, 18.5%) for females.
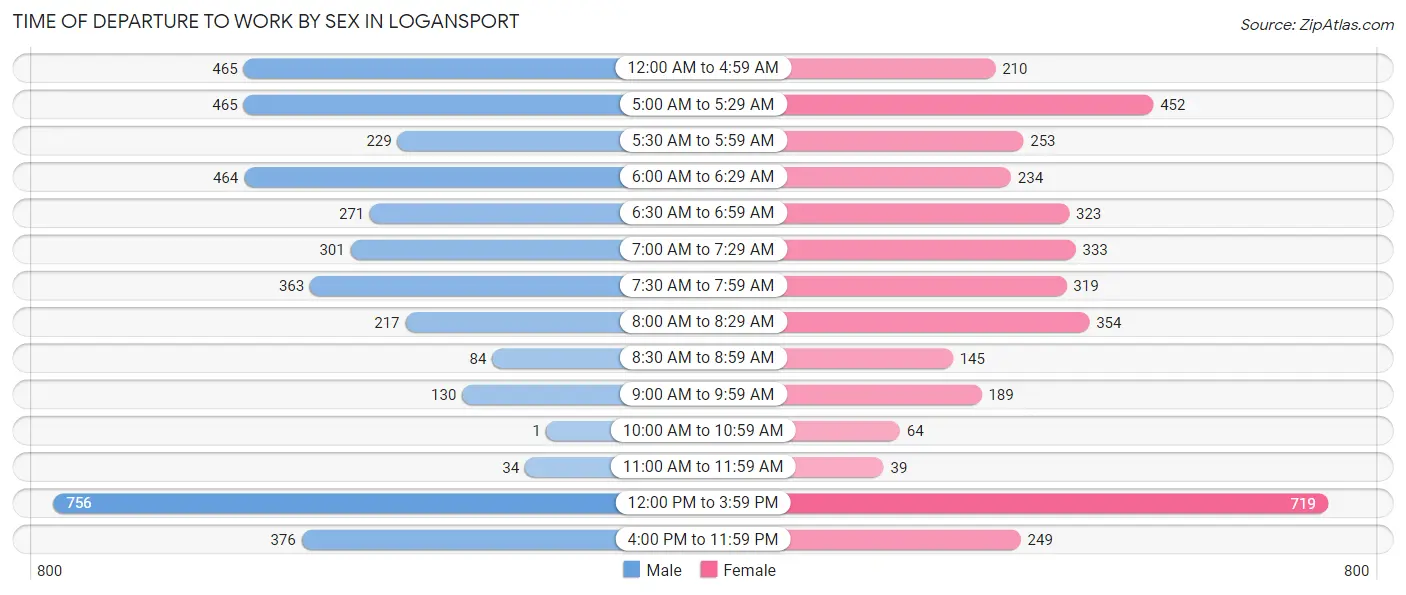
| Time of Departure | Male | Female |
| 12:00 AM to 4:59 AM | 465 (11.2%) | 210 (5.4%) |
| 5:00 AM to 5:29 AM | 465 (11.2%) | 452 (11.6%) |
| 5:30 AM to 5:59 AM | 229 (5.5%) | 253 (6.5%) |
| 6:00 AM to 6:29 AM | 464 (11.2%) | 234 (6.0%) |
| 6:30 AM to 6:59 AM | 271 (6.5%) | 323 (8.3%) |
| 7:00 AM to 7:29 AM | 301 (7.2%) | 333 (8.6%) |
| 7:30 AM to 7:59 AM | 363 (8.7%) | 319 (8.2%) |
| 8:00 AM to 8:29 AM | 217 (5.2%) | 354 (9.1%) |
| 8:30 AM to 8:59 AM | 84 (2.0%) | 145 (3.7%) |
| 9:00 AM to 9:59 AM | 130 (3.1%) | 189 (4.9%) |
| 10:00 AM to 10:59 AM | 1 (0.0%) | 64 (1.7%) |
| 11:00 AM to 11:59 AM | 34 (0.8%) | 39 (1.0%) |
| 12:00 PM to 3:59 PM | 756 (18.2%) | 719 (18.5%) |
| 4:00 PM to 11:59 PM | 376 (9.0%) | 249 (6.4%) |
| Total | 4,156 (100.0%) | 3,883 (100.0%) |
Housing Occupancy in Logansport
Occupancy by Ownership in Logansport
Of the total 6,852 dwellings in Logansport, owner-occupied units account for 4,216 (61.5%), while renter-occupied units make up 2,636 (38.5%).
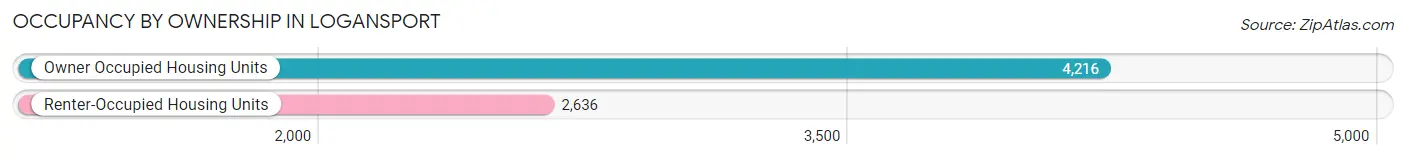
| Occupancy | # Housing Units | % Housing Units |
| Owner Occupied Housing Units | 4,216 | 61.5% |
| Renter-Occupied Housing Units | 2,636 | 38.5% |
| Total Occupied Housing Units | 6,852 | 100.0% |
Occupancy by Household Size in Logansport
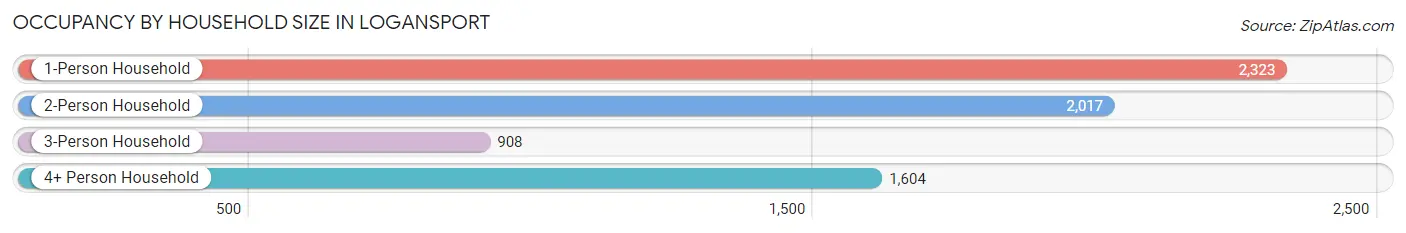
| Household Size | # Housing Units | % Housing Units |
| 1-Person Household | 2,323 | 33.9% |
| 2-Person Household | 2,017 | 29.4% |
| 3-Person Household | 908 | 13.3% |
| 4+ Person Household | 1,604 | 23.4% |
| Total Housing Units | 6,852 | 100.0% |
Occupancy by Ownership by Household Size in Logansport
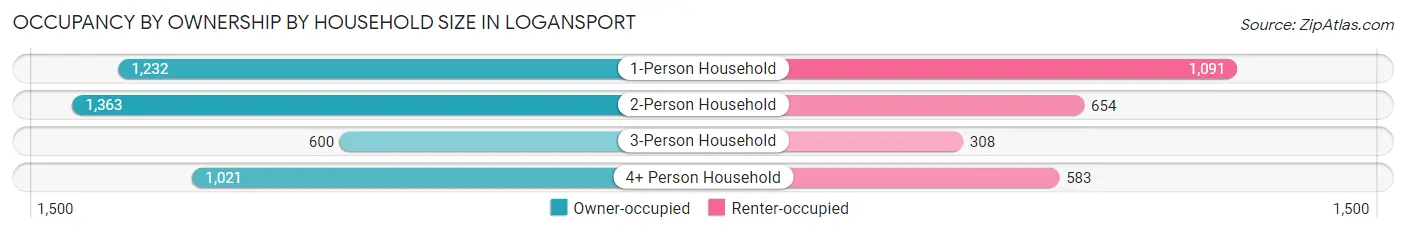
| Household Size | Owner-occupied | Renter-occupied |
| 1-Person Household | 1,232 (53.0%) | 1,091 (47.0%) |
| 2-Person Household | 1,363 (67.6%) | 654 (32.4%) |
| 3-Person Household | 600 (66.1%) | 308 (33.9%) |
| 4+ Person Household | 1,021 (63.6%) | 583 (36.3%) |
| Total Housing Units | 4,216 (61.5%) | 2,636 (38.5%) |
Occupancy by Educational Attainment in Logansport
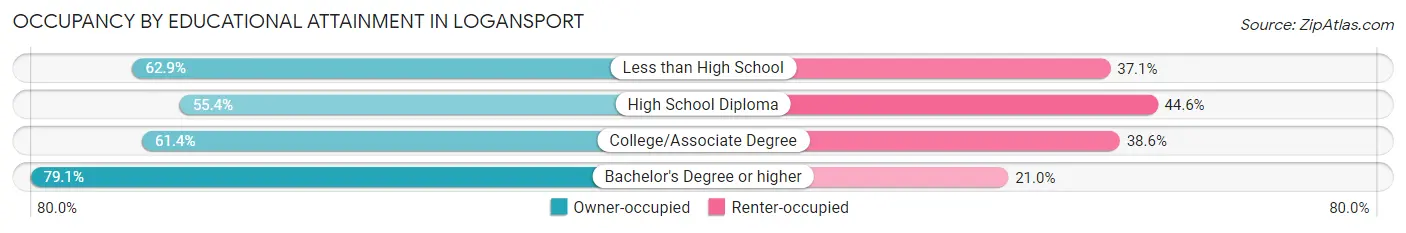
| Household Size | Owner-occupied | Renter-occupied |
| Less than High School | 816 (62.9%) | 482 (37.1%) |
| High School Diploma | 1,563 (55.4%) | 1,259 (44.6%) |
| College/Associate Degree | 1,120 (61.4%) | 705 (38.6%) |
| Bachelor's Degree or higher | 717 (79.0%) | 190 (20.9%) |
Occupancy by Age of Householder in Logansport
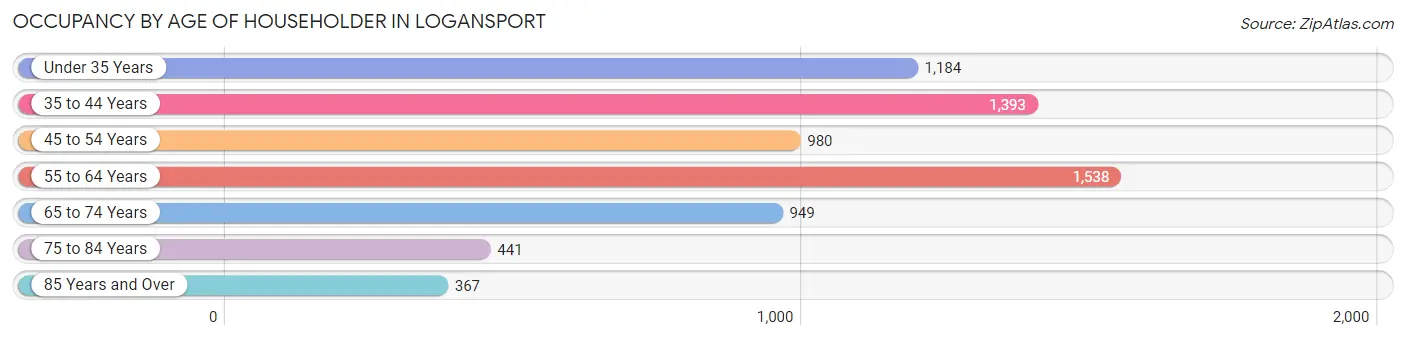
| Age Bracket | # Households | % Households |
| Under 35 Years | 1,184 | 17.3% |
| 35 to 44 Years | 1,393 | 20.3% |
| 45 to 54 Years | 980 | 14.3% |
| 55 to 64 Years | 1,538 | 22.5% |
| 65 to 74 Years | 949 | 13.9% |
| 75 to 84 Years | 441 | 6.4% |
| 85 Years and Over | 367 | 5.4% |
| Total | 6,852 | 100.0% |
Housing Finances in Logansport
Median Income by Occupancy in Logansport
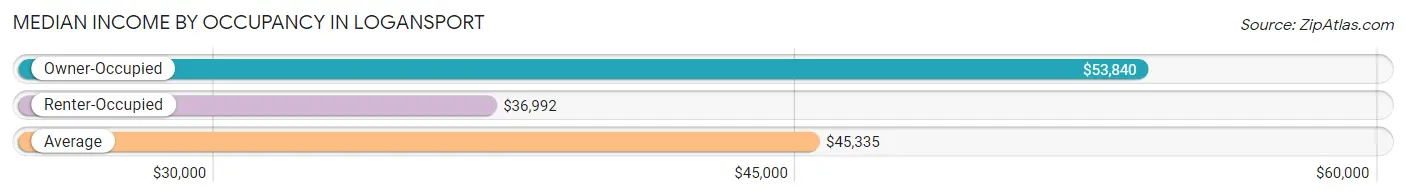
| Occupancy Type | # Households | Median Income |
| Owner-Occupied | 4,216 (61.5%) | $53,840 |
| Renter-Occupied | 2,636 (38.5%) | $36,992 |
| Average | 6,852 (100.0%) | $45,335 |
Occupancy by Householder Income Bracket in Logansport
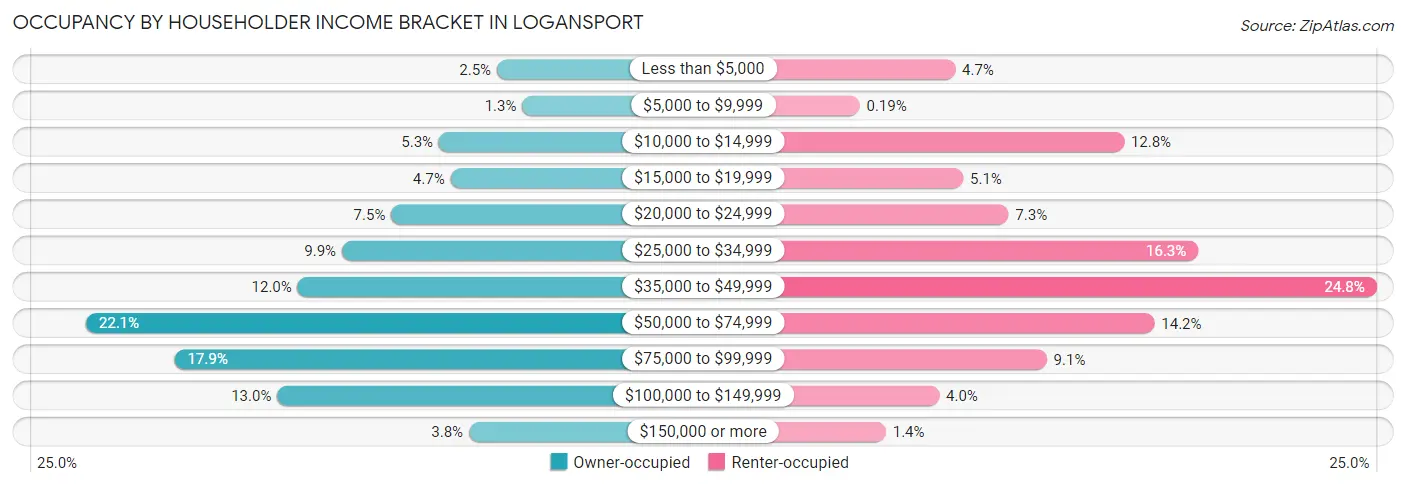
| Income Bracket | Owner-occupied | Renter-occupied |
| Less than $5,000 | 106 (2.5%) | 125 (4.7%) |
| $5,000 to $9,999 | 55 (1.3%) | 5 (0.2%) |
| $10,000 to $14,999 | 222 (5.3%) | 337 (12.8%) |
| $15,000 to $19,999 | 199 (4.7%) | 135 (5.1%) |
| $20,000 to $24,999 | 318 (7.5%) | 192 (7.3%) |
| $25,000 to $34,999 | 417 (9.9%) | 430 (16.3%) |
| $35,000 to $49,999 | 506 (12.0%) | 654 (24.8%) |
| $50,000 to $74,999 | 931 (22.1%) | 375 (14.2%) |
| $75,000 to $99,999 | 753 (17.9%) | 240 (9.1%) |
| $100,000 to $149,999 | 547 (13.0%) | 105 (4.0%) |
| $150,000 or more | 162 (3.8%) | 38 (1.4%) |
| Total | 4,216 (100.0%) | 2,636 (100.0%) |
Monthly Housing Cost Tiers in Logansport
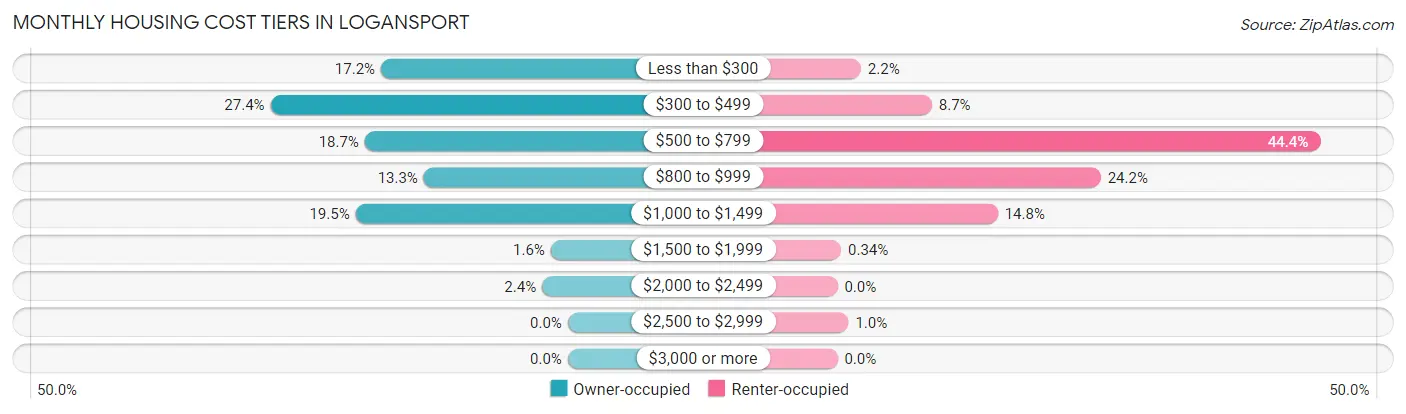
| Monthly Cost | Owner-occupied | Renter-occupied |
| Less than $300 | 725 (17.2%) | 57 (2.2%) |
| $300 to $499 | 1,154 (27.4%) | 229 (8.7%) |
| $500 to $799 | 788 (18.7%) | 1,171 (44.4%) |
| $800 to $999 | 559 (13.3%) | 639 (24.2%) |
| $1,000 to $1,499 | 824 (19.5%) | 389 (14.8%) |
| $1,500 to $1,999 | 66 (1.6%) | 9 (0.3%) |
| $2,000 to $2,499 | 100 (2.4%) | 0 (0.0%) |
| $2,500 to $2,999 | 0 (0.0%) | 27 (1.0%) |
| $3,000 or more | 0 (0.0%) | 0 (0.0%) |
| Total | 4,216 (100.0%) | 2,636 (100.0%) |
Physical Housing Characteristics in Logansport
Housing Structures in Logansport
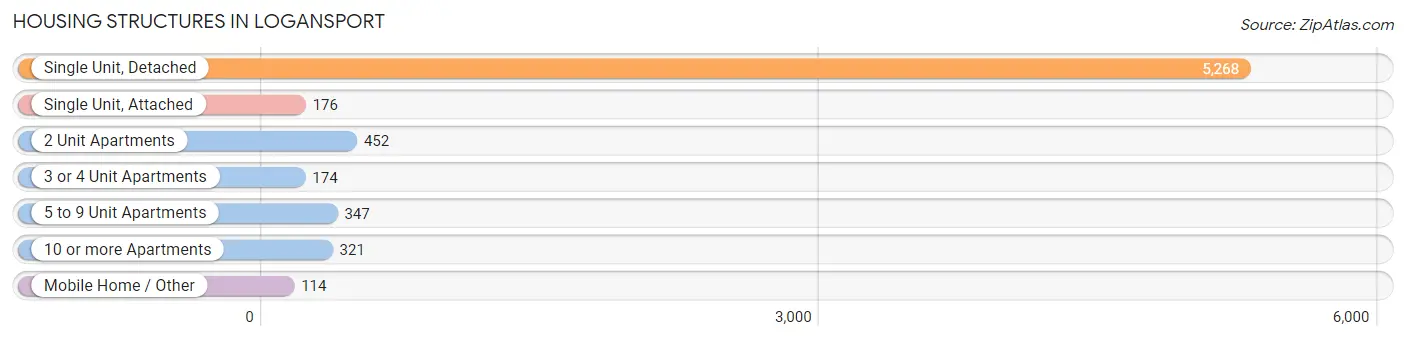
| Structure Type | # Housing Units | % Housing Units |
| Single Unit, Detached | 5,268 | 76.9% |
| Single Unit, Attached | 176 | 2.6% |
| 2 Unit Apartments | 452 | 6.6% |
| 3 or 4 Unit Apartments | 174 | 2.5% |
| 5 to 9 Unit Apartments | 347 | 5.1% |
| 10 or more Apartments | 321 | 4.7% |
| Mobile Home / Other | 114 | 1.7% |
| Total | 6,852 | 100.0% |
Housing Structures by Occupancy in Logansport
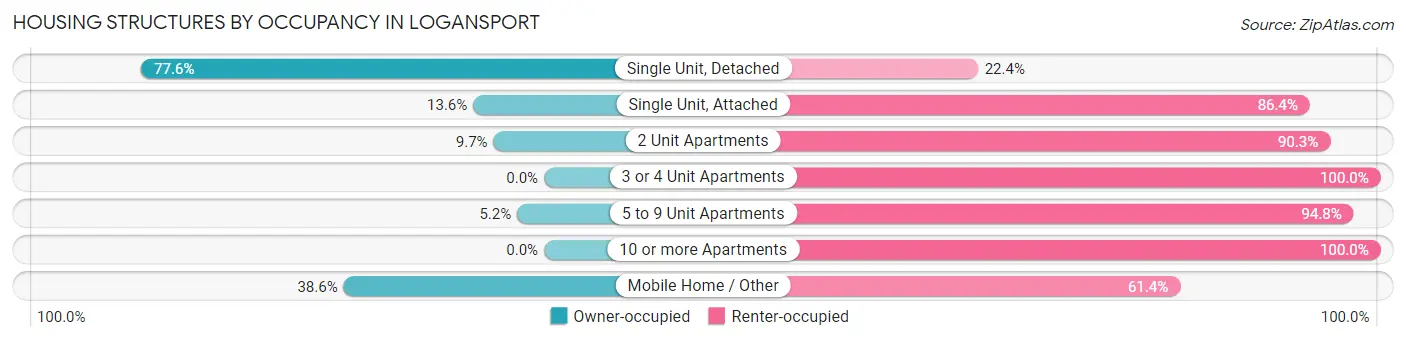
| Structure Type | Owner-occupied | Renter-occupied |
| Single Unit, Detached | 4,086 (77.6%) | 1,182 (22.4%) |
| Single Unit, Attached | 24 (13.6%) | 152 (86.4%) |
| 2 Unit Apartments | 44 (9.7%) | 408 (90.3%) |
| 3 or 4 Unit Apartments | 0 (0.0%) | 174 (100.0%) |
| 5 to 9 Unit Apartments | 18 (5.2%) | 329 (94.8%) |
| 10 or more Apartments | 0 (0.0%) | 321 (100.0%) |
| Mobile Home / Other | 44 (38.6%) | 70 (61.4%) |
| Total | 4,216 (61.5%) | 2,636 (38.5%) |
Housing Structures by Number of Rooms in Logansport
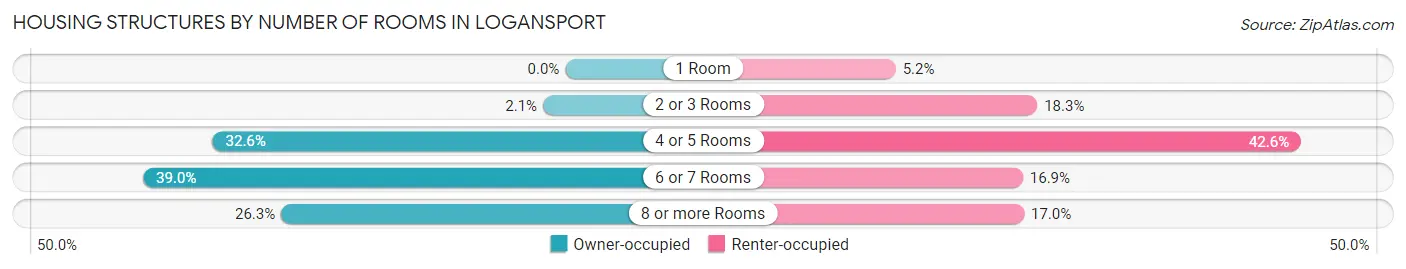
| Number of Rooms | Owner-occupied | Renter-occupied |
| 1 Room | 0 (0.0%) | 136 (5.2%) |
| 2 or 3 Rooms | 87 (2.1%) | 481 (18.2%) |
| 4 or 5 Rooms | 1,375 (32.6%) | 1,124 (42.6%) |
| 6 or 7 Rooms | 1,646 (39.0%) | 446 (16.9%) |
| 8 or more Rooms | 1,108 (26.3%) | 449 (17.0%) |
| Total | 4,216 (100.0%) | 2,636 (100.0%) |
Housing Structure by Heating Type in Logansport
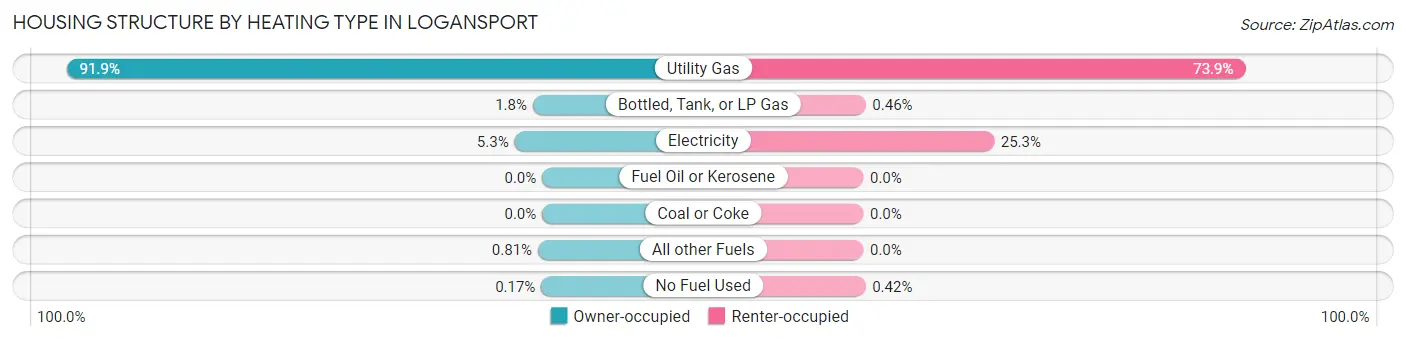
| Heating Type | Owner-occupied | Renter-occupied |
| Utility Gas | 3,874 (91.9%) | 1,947 (73.9%) |
| Bottled, Tank, or LP Gas | 76 (1.8%) | 12 (0.5%) |
| Electricity | 225 (5.3%) | 666 (25.3%) |
| Fuel Oil or Kerosene | 0 (0.0%) | 0 (0.0%) |
| Coal or Coke | 0 (0.0%) | 0 (0.0%) |
| All other Fuels | 34 (0.8%) | 0 (0.0%) |
| No Fuel Used | 7 (0.2%) | 11 (0.4%) |
| Total | 4,216 (100.0%) | 2,636 (100.0%) |
Household Vehicle Usage in Logansport
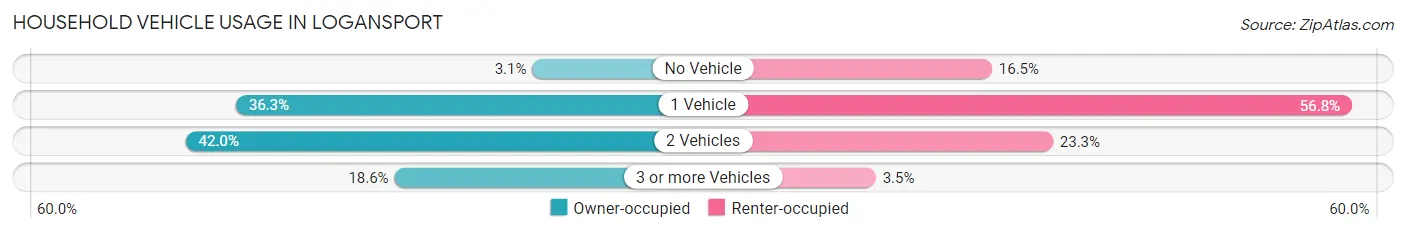
| Vehicles per Household | Owner-occupied | Renter-occupied |
| No Vehicle | 132 (3.1%) | 434 (16.5%) |
| 1 Vehicle | 1,532 (36.3%) | 1,497 (56.8%) |
| 2 Vehicles | 1,769 (42.0%) | 614 (23.3%) |
| 3 or more Vehicles | 783 (18.6%) | 91 (3.5%) |
| Total | 4,216 (100.0%) | 2,636 (100.0%) |
Real Estate & Mortgages in Logansport
Real Estate and Mortgage Overview in Logansport
| Characteristic | Without Mortgage | With Mortgage |
| Housing Units | 2,039 | 2,177 |
| Median Property Value | $66,300 | $94,900 |
| Median Household Income | $43,189 | $130 |
| Monthly Housing Costs | $352 | $0 |
| Real Estate Taxes | $676 | $86 |
Property Value by Mortgage Status in Logansport
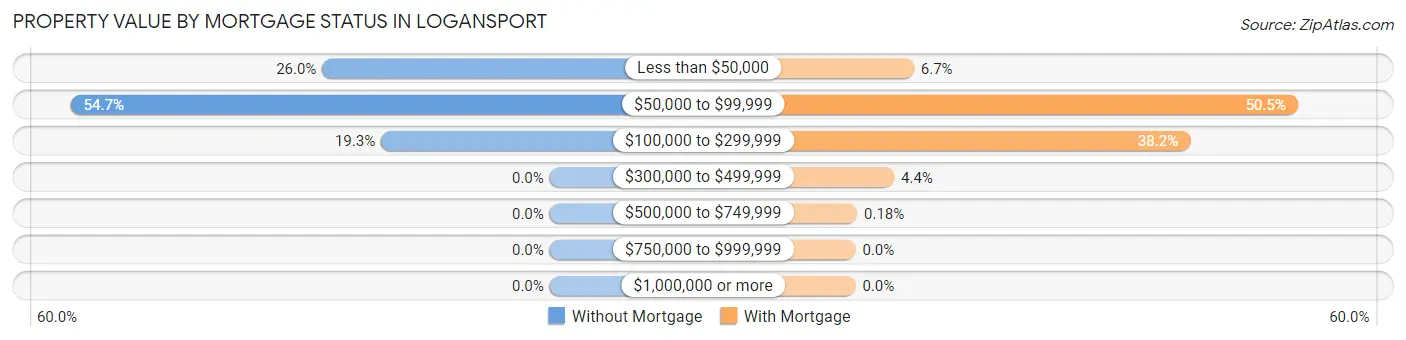
| Property Value | Without Mortgage | With Mortgage |
| Less than $50,000 | 530 (26.0%) | 145 (6.7%) |
| $50,000 to $99,999 | 1,116 (54.7%) | 1,100 (50.5%) |
| $100,000 to $299,999 | 393 (19.3%) | 832 (38.2%) |
| $300,000 to $499,999 | 0 (0.0%) | 96 (4.4%) |
| $500,000 to $749,999 | 0 (0.0%) | 4 (0.2%) |
| $750,000 to $999,999 | 0 (0.0%) | 0 (0.0%) |
| $1,000,000 or more | 0 (0.0%) | 0 (0.0%) |
| Total | 2,039 (100.0%) | 2,177 (100.0%) |
Household Income by Mortgage Status in Logansport
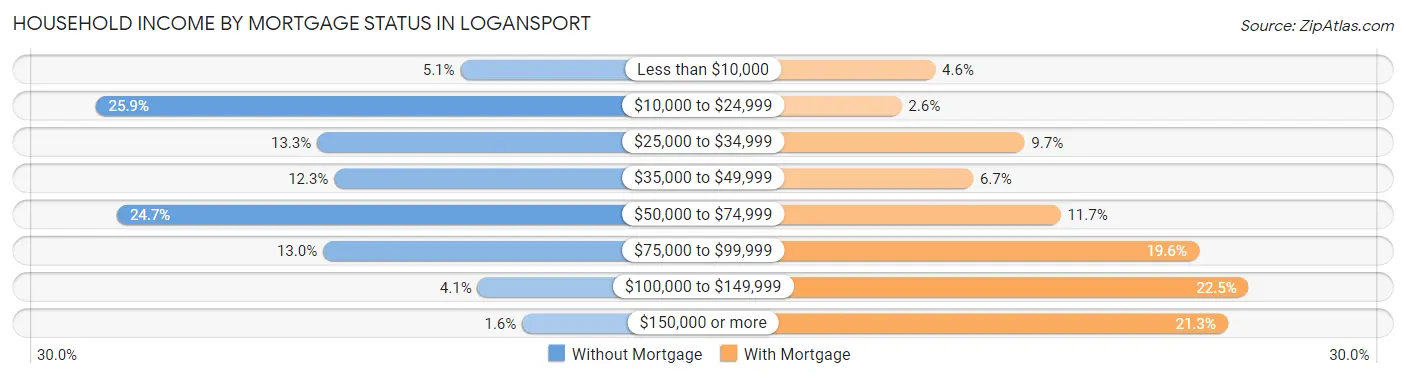
| Household Income | Without Mortgage | With Mortgage |
| Less than $10,000 | 104 (5.1%) | 99 (4.5%) |
| $10,000 to $24,999 | 529 (25.9%) | 57 (2.6%) |
| $25,000 to $34,999 | 271 (13.3%) | 210 (9.7%) |
| $35,000 to $49,999 | 251 (12.3%) | 146 (6.7%) |
| $50,000 to $74,999 | 504 (24.7%) | 255 (11.7%) |
| $75,000 to $99,999 | 264 (13.0%) | 427 (19.6%) |
| $100,000 to $149,999 | 84 (4.1%) | 489 (22.5%) |
| $150,000 or more | 32 (1.6%) | 463 (21.3%) |
| Total | 2,039 (100.0%) | 2,177 (100.0%) |
Property Value to Household Income Ratio in Logansport
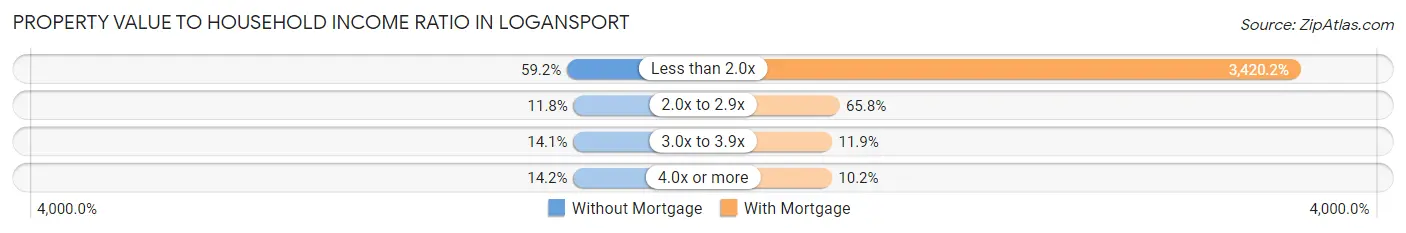
| Value-to-Income Ratio | Without Mortgage | With Mortgage |
| Less than 2.0x | 1,208 (59.2%) | 74,458 (3,420.2%) |
| 2.0x to 2.9x | 241 (11.8%) | 1,432 (65.8%) |
| 3.0x to 3.9x | 287 (14.1%) | 260 (11.9%) |
| 4.0x or more | 289 (14.2%) | 223 (10.2%) |
| Total | 2,039 (100.0%) | 2,177 (100.0%) |
Real Estate Taxes by Mortgage Status in Logansport
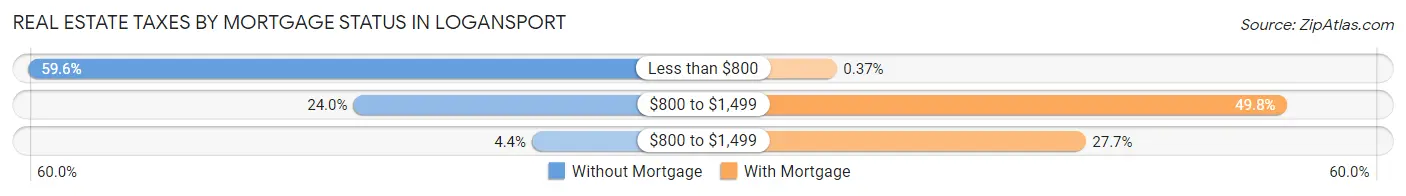
| Property Taxes | Without Mortgage | With Mortgage |
| Less than $800 | 1,215 (59.6%) | 8 (0.4%) |
| $800 to $1,499 | 489 (24.0%) | 1,084 (49.8%) |
| $800 to $1,499 | 90 (4.4%) | 602 (27.7%) |
| Total | 2,039 (100.0%) | 2,177 (100.0%) |
Health & Disability in Logansport
Health Insurance Coverage by Age in Logansport
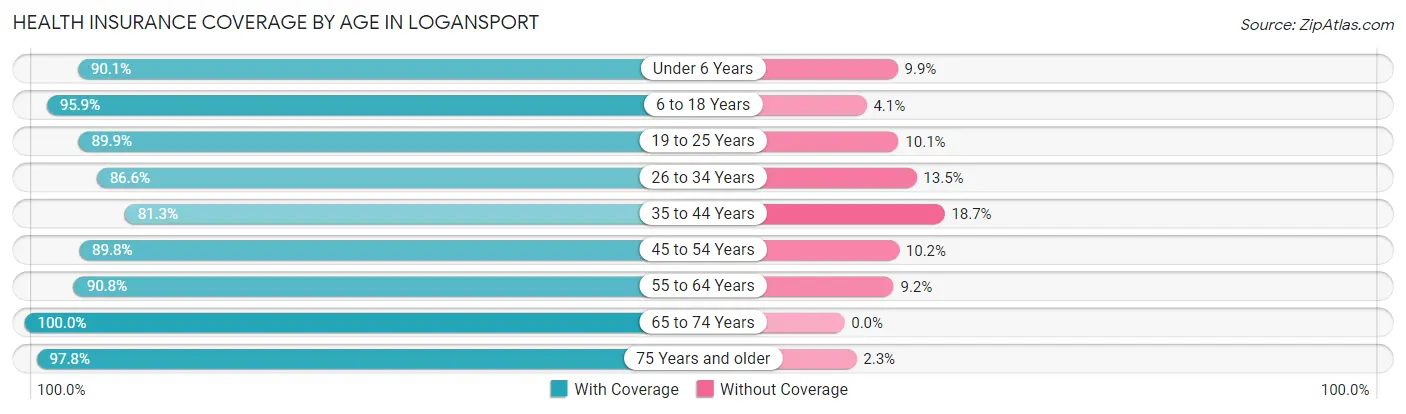
| Age Bracket | With Coverage | Without Coverage |
| Under 6 Years | 1,459 (90.1%) | 161 (9.9%) |
| 6 to 18 Years | 3,077 (95.9%) | 133 (4.1%) |
| 19 to 25 Years | 1,497 (89.9%) | 168 (10.1%) |
| 26 to 34 Years | 1,705 (86.6%) | 265 (13.5%) |
| 35 to 44 Years | 1,798 (81.3%) | 413 (18.7%) |
| 45 to 54 Years | 1,643 (89.8%) | 186 (10.2%) |
| 55 to 64 Years | 2,306 (90.8%) | 233 (9.2%) |
| 65 to 74 Years | 1,341 (100.0%) | 0 (0.0%) |
| 75 Years and older | 1,084 (97.8%) | 25 (2.2%) |
| Total | 15,910 (90.9%) | 1,584 (9.0%) |
Health Insurance Coverage by Citizenship Status in Logansport
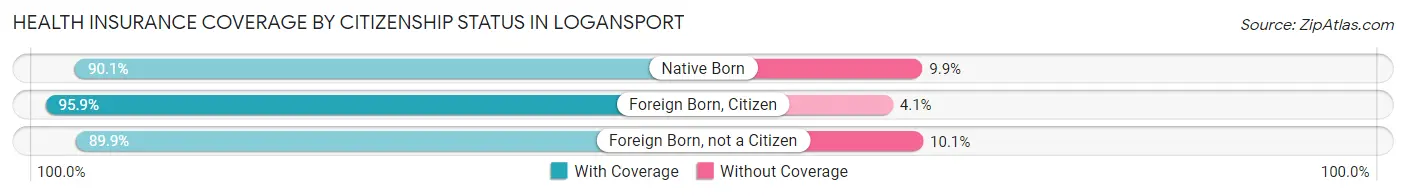
| Citizenship Status | With Coverage | Without Coverage |
| Native Born | 1,459 (90.1%) | 161 (9.9%) |
| Foreign Born, Citizen | 3,077 (95.9%) | 133 (4.1%) |
| Foreign Born, not a Citizen | 1,497 (89.9%) | 168 (10.1%) |
Health Insurance Coverage by Household Income in Logansport
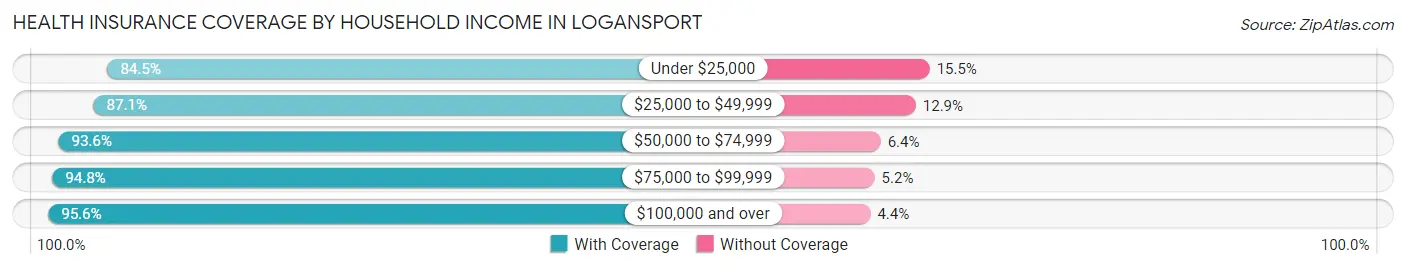
| Household Income | With Coverage | Without Coverage |
| Under $25,000 | 2,431 (84.5%) | 447 (15.5%) |
| $25,000 to $49,999 | 3,821 (87.1%) | 568 (12.9%) |
| $50,000 to $74,999 | 3,681 (93.6%) | 250 (6.4%) |
| $75,000 to $99,999 | 2,870 (94.8%) | 158 (5.2%) |
| $100,000 and over | 2,967 (95.6%) | 138 (4.4%) |
Public vs Private Health Insurance Coverage by Age in Logansport
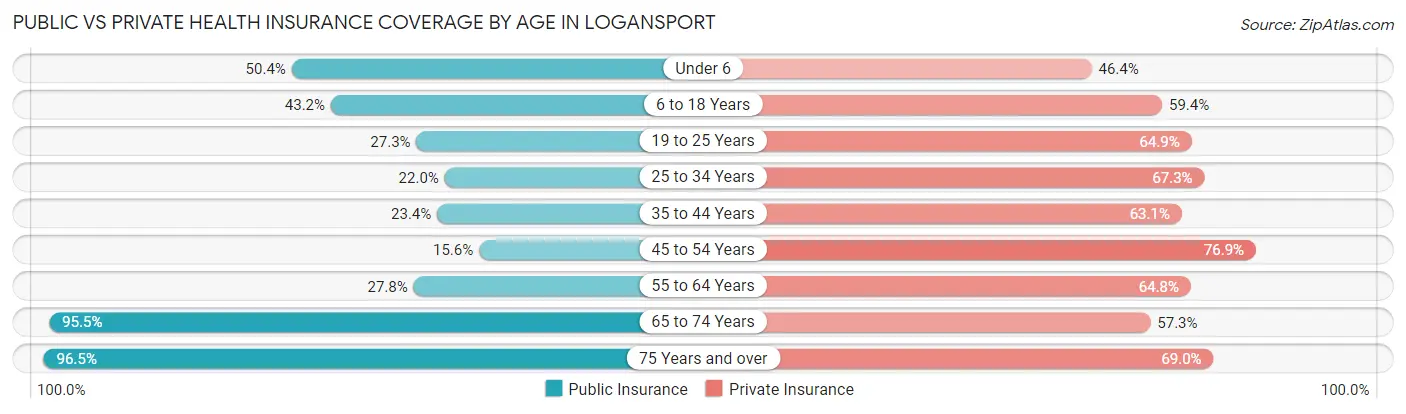
| Age Bracket | Public Insurance | Private Insurance |
| Under 6 | 817 (50.4%) | 751 (46.4%) |
| 6 to 18 Years | 1,385 (43.1%) | 1,908 (59.4%) |
| 19 to 25 Years | 454 (27.3%) | 1,081 (64.9%) |
| 25 to 34 Years | 434 (22.0%) | 1,326 (67.3%) |
| 35 to 44 Years | 518 (23.4%) | 1,395 (63.1%) |
| 45 to 54 Years | 286 (15.6%) | 1,406 (76.9%) |
| 55 to 64 Years | 706 (27.8%) | 1,645 (64.8%) |
| 65 to 74 Years | 1,280 (95.5%) | 768 (57.3%) |
| 75 Years and over | 1,070 (96.5%) | 765 (69.0%) |
| Total | 6,950 (39.7%) | 11,045 (63.1%) |
Disability Status by Sex by Age in Logansport
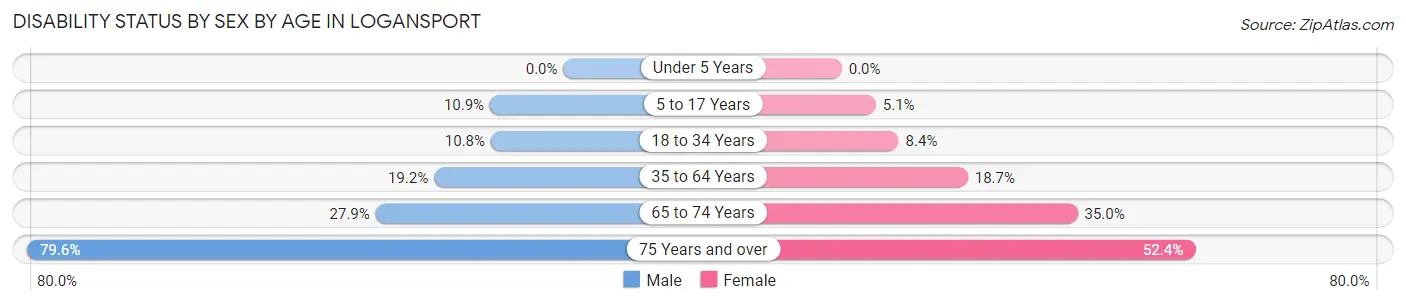
| Age Bracket | Male | Female |
| Under 5 Years | 0 (0.0%) | 0 (0.0%) |
| 5 to 17 Years | 186 (10.9%) | 78 (5.1%) |
| 18 to 34 Years | 219 (10.8%) | 160 (8.4%) |
| 35 to 64 Years | 651 (19.2%) | 597 (18.7%) |
| 65 to 74 Years | 162 (27.9%) | 266 (35.0%) |
| 75 Years and over | 262 (79.6%) | 409 (52.4%) |
Disability Class by Sex by Age in Logansport
Disability Class: Hearing Difficulty
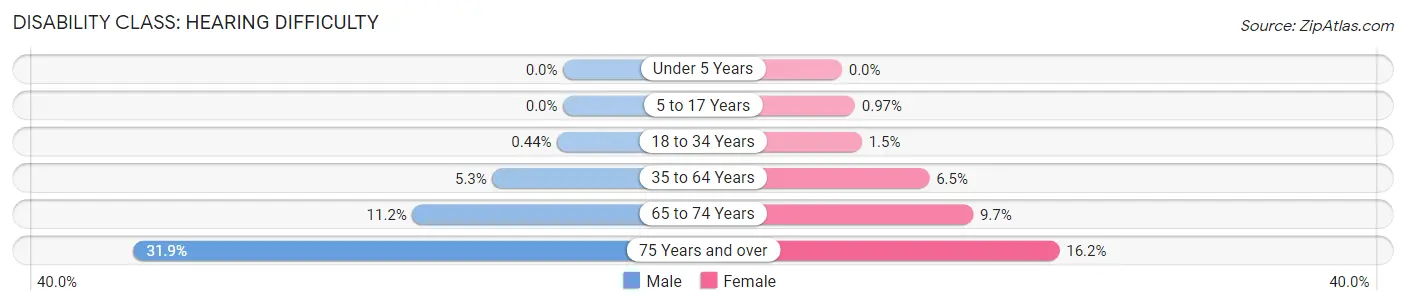
| Age Bracket | Male | Female |
| Under 5 Years | 0 (0.0%) | 0 (0.0%) |
| 5 to 17 Years | 0 (0.0%) | 15 (1.0%) |
| 18 to 34 Years | 9 (0.4%) | 28 (1.5%) |
| 35 to 64 Years | 178 (5.2%) | 207 (6.5%) |
| 65 to 74 Years | 65 (11.2%) | 74 (9.7%) |
| 75 Years and over | 105 (31.9%) | 126 (16.2%) |
Disability Class: Vision Difficulty
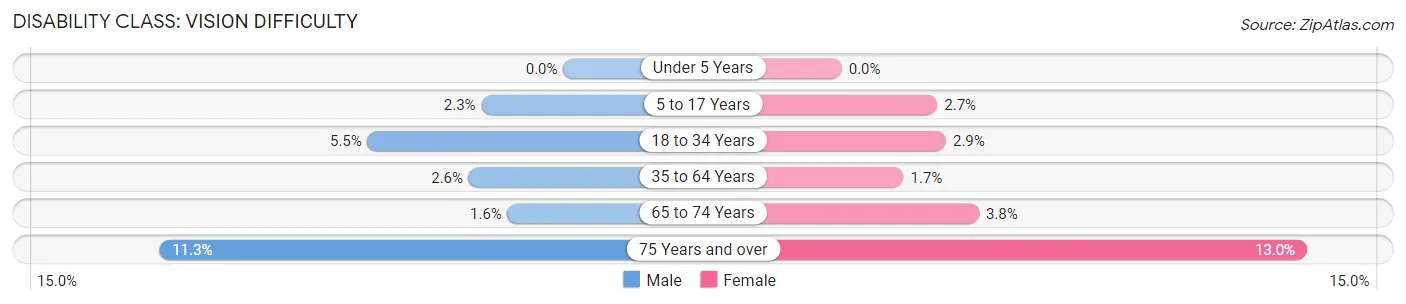
| Age Bracket | Male | Female |
| Under 5 Years | 0 (0.0%) | 0 (0.0%) |
| 5 to 17 Years | 39 (2.3%) | 41 (2.7%) |
| 18 to 34 Years | 111 (5.4%) | 55 (2.9%) |
| 35 to 64 Years | 89 (2.6%) | 55 (1.7%) |
| 65 to 74 Years | 9 (1.5%) | 29 (3.8%) |
| 75 Years and over | 37 (11.3%) | 101 (13.0%) |
Disability Class: Cognitive Difficulty
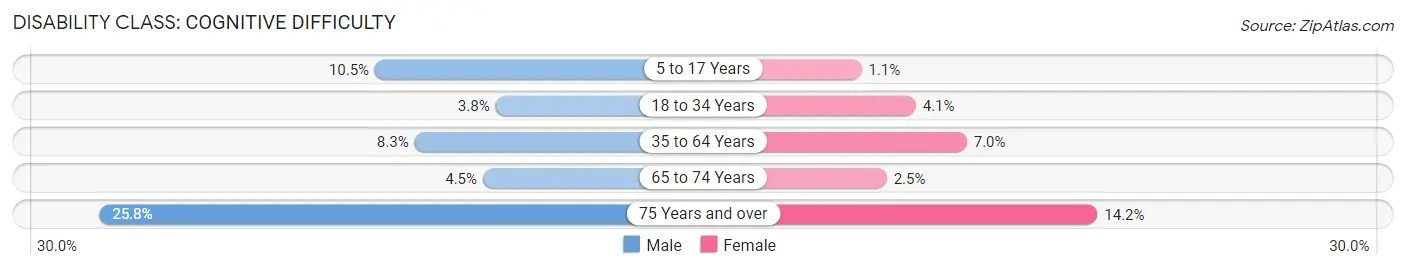
| Age Bracket | Male | Female |
| 5 to 17 Years | 179 (10.5%) | 17 (1.1%) |
| 18 to 34 Years | 77 (3.8%) | 78 (4.1%) |
| 35 to 64 Years | 281 (8.3%) | 222 (7.0%) |
| 65 to 74 Years | 26 (4.5%) | 19 (2.5%) |
| 75 Years and over | 85 (25.8%) | 111 (14.2%) |
Disability Class: Ambulatory Difficulty
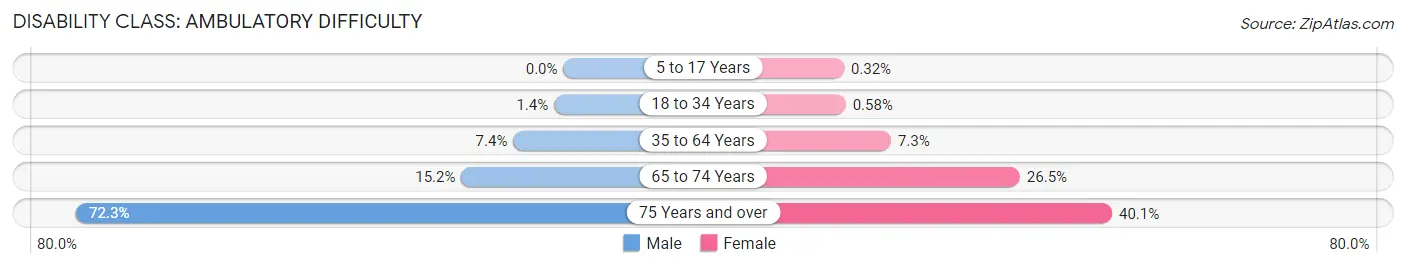
| Age Bracket | Male | Female |
| 5 to 17 Years | 0 (0.0%) | 5 (0.3%) |
| 18 to 34 Years | 28 (1.4%) | 11 (0.6%) |
| 35 to 64 Years | 252 (7.4%) | 233 (7.3%) |
| 65 to 74 Years | 88 (15.1%) | 201 (26.5%) |
| 75 Years and over | 238 (72.3%) | 313 (40.1%) |
Disability Class: Self-Care Difficulty
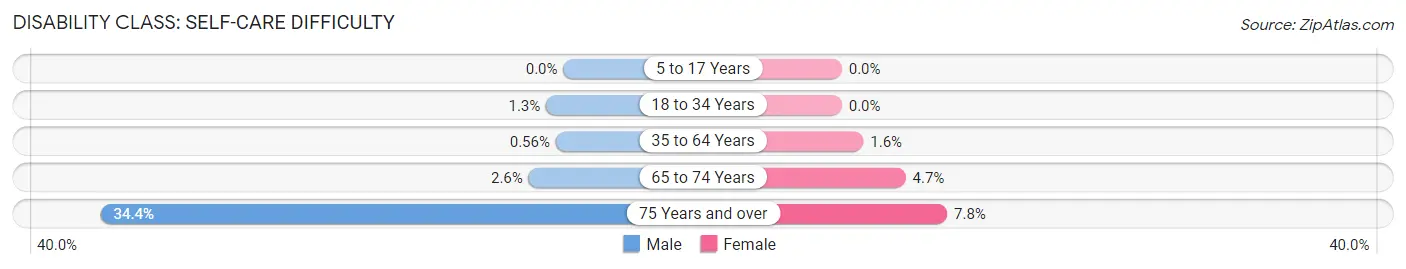
| Age Bracket | Male | Female |
| 5 to 17 Years | 0 (0.0%) | 0 (0.0%) |
| 18 to 34 Years | 26 (1.3%) | 0 (0.0%) |
| 35 to 64 Years | 19 (0.6%) | 51 (1.6%) |
| 65 to 74 Years | 15 (2.6%) | 36 (4.7%) |
| 75 Years and over | 113 (34.4%) | 61 (7.8%) |
Technology Access in Logansport
Computing Device Access in Logansport
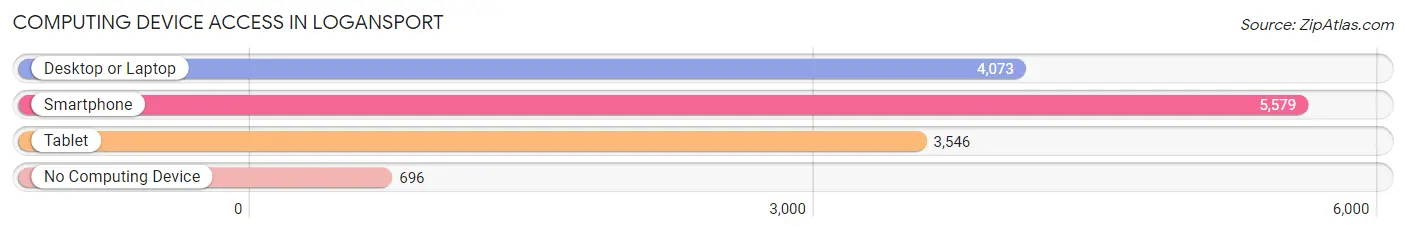
| Device Type | # Households | % Households |
| Desktop or Laptop | 4,073 | 59.4% |
| Smartphone | 5,579 | 81.4% |
| Tablet | 3,546 | 51.7% |
| No Computing Device | 696 | 10.2% |
| Total | 6,852 | 100.0% |
Internet Access in Logansport
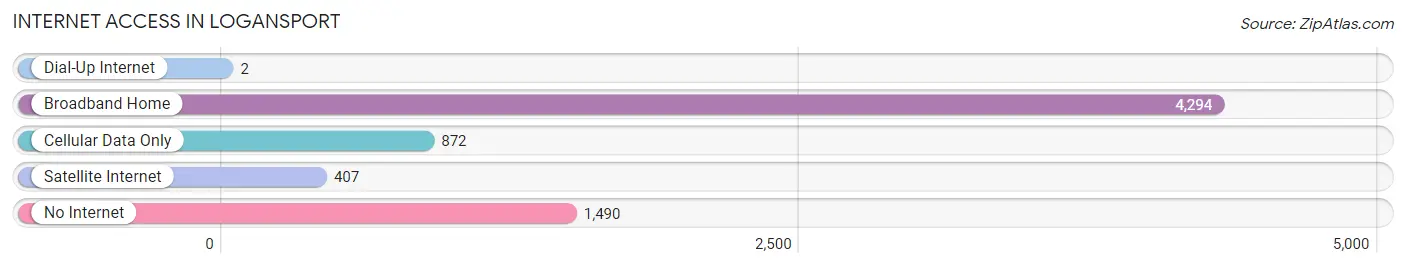
| Internet Type | # Households | % Households |
| Dial-Up Internet | 2 | 0.0% |
| Broadband Home | 4,294 | 62.7% |
| Cellular Data Only | 872 | 12.7% |
| Satellite Internet | 407 | 5.9% |
| No Internet | 1,490 | 21.7% |
| Total | 6,852 | 100.0% |
Logansport Summary
Logansport is a city located in Cass County, Indiana, United States. It is the county seat of Cass County. The population was 17,943 at the 2010 census. Logansport is located in northern Indiana at the junction of the Wabash and Eel rivers, northeast of Lafayette.
History
Logansport was founded in 1832 by Captain William Logan, a veteran of the War of 1812. The city was named after him. The first settlers arrived in the area in 1827, and the town was laid out in 1832. Logansport was incorporated as a city in 1854.
The city was an important stop on the Wabash and Erie Canal, which was completed in 1853. The canal brought economic growth to the area, and Logansport became a major trading center. The city was also a major railroad hub, with several railroads passing through the city.
The city experienced a period of growth and prosperity in the late 19th and early 20th centuries. Logansport was home to several manufacturing companies, including the Logansport Foundry and Machine Company, the Logansport Carriage Company, and the Logansport Brewing Company.
Geography
Logansport is located at 40°45'25" North, 86°20'17" West (40.756944, -86.338333). According to the 2010 census, the city has a total area of 8.9 square miles (23.1 km2), of which 8.8 square miles (22.8 km2) is land and 0.1 square mile (0.3 km2) is water.
The city is located at the junction of the Wabash and Eel rivers. The Wabash River forms the western boundary of the city, while the Eel River forms the eastern boundary. The city is located in the Tippecanoe River watershed.
Economy
Logansport is a regional center for commerce and industry. The city is home to several manufacturing companies, including Logansport Foundry and Machine Company, Logansport Carriage Company, and Logansport Brewing Company. The city is also home to several retail stores, restaurants, and other businesses.
The city is served by the Logansport Municipal Airport, which is located just outside the city limits. The airport is used for general aviation and corporate flights.
Demographics
As of the 2010 census, there were 17,943 people, 7,541 households, and 4,717 families residing in the city. The population density was 2,037.3 people per square mile (788.2/km2). There were 8,093 housing units at an average density of 917.3 per square mile (354.2/km2). The racial makeup of the city was 92.2% White, 4.2% African American, 0.3% Native American, 0.7% Asian, 0.1% Pacific Islander, 0.9% from other races, and 1.6% from two or more races. Hispanic or Latino of any race were 2.3% of the population.
There were 7,541 households, out of which 28.2% had children under the age of 18 living with them, 43.2% were married couples living together, 14.7% had a female householder with no husband present, and 37.2% were non-families. 32.2% of all households were made up of individuals, and 14.2% had someone living alone who was 65 years of age or older. The average household size was 2.35 and the average family size was 2.94.
In the city, the population was spread out, with 24.2% under the age of 18, 8.7% from 18 to 24, 27.2% from 25 to 44, 22.3% from 45 to 64, and 17.6% who were 65 years of age or older. The median age was 38 years. For every 100 females, there were 91.2 males. For every 100 females age 18 and over, there were 87.2 males.
The median income for a household in the city was $32,917, and the median income for a family was $41,945. Males had a median income of $31,945 versus $22,813 for females. The per capita income for the city was $17,945. About 10.2% of families and 13.2% of the population were below the poverty line, including 17.2% of those under age 18 and 8.2% of those age 65 or over.
Common Questions
What is Per Capita Income in Logansport?
Per Capita income in Logansport is $22,692.
What is the Median Family Income in Logansport?
Median Family Income in Logansport is $60,771.
What is the Median Household income in Logansport?
Median Household Income in Logansport is $45,335.
What is Income or Wage Gap in Logansport?
Income or Wage Gap in Logansport is 27.7%.
Women in Logansport earn 72.3 cents for every dollar earned by a man.
What is Family Income Deficit in Logansport?
Family Income Deficit in Logansport is $11,697.
Families that are below poverty line in Logansport earn $11,697 less on average than the poverty threshold level.
What is Inequality or Gini Index in Logansport?
Inequality or Gini Index in Logansport is 0.39.
What is the Total Population of Logansport?
Total Population of Logansport is 18,166.
What is the Total Male Population of Logansport?
Total Male Population of Logansport is 9,069.
What is the Total Female Population of Logansport?
Total Female Population of Logansport is 9,097.
What is the Ratio of Males per 100 Females in Logansport?
There are 99.69 Males per 100 Females in Logansport.
What is the Ratio of Females per 100 Males in Logansport?
There are 100.31 Females per 100 Males in Logansport.
What is the Median Population Age in Logansport?
Median Population Age in Logansport is 37.3 Years.
What is the Average Family Size in Logansport
Average Family Size in Logansport is 3.2 People.
What is the Average Household Size in Logansport
Average Household Size in Logansport is 2.5 People.
How Large is the Labor Force in Logansport?
There are 8,567 People in the Labor Forcein in Logansport.
What is the Percentage of People in the Labor Force in Logansport?
60.5% of People are in the Labor Force in Logansport.
What is the Unemployment Rate in Logansport?
Unemployment Rate in Logansport is 3.2%.