Holland, IN Map & Demographics
Holland Map
Holland Overview
$25,967
PER CAPITA INCOME
$64,063
AVG FAMILY INCOME
$61,667
AVG HOUSEHOLD INCOME
11.7%
WAGE / INCOME GAP [ % ]
88.3¢/ $1
WAGE / INCOME GAP [ $ ]
0.28
INEQUALITY / GINI INDEX
612
TOTAL POPULATION
269
MALE POPULATION
343
FEMALE POPULATION
78.43
MALES / 100 FEMALES
127.51
FEMALES / 100 MALES
36.0
MEDIAN AGE
2.9
AVG FAMILY SIZE
2.7
AVG HOUSEHOLD SIZE
346
LABOR FORCE [ PEOPLE ]
69.8%
PERCENT IN LABOR FORCE
0.6%
UNEMPLOYMENT RATE
Holland Zip Codes
Holland Area Codes
Income in Holland
Income Overview in Holland
Per Capita Income in Holland is $25,967, while median incomes of families and households are $64,063 and $61,667 respectively.
| Characteristic | Number | Measure |
| Per Capita Income | 612 | $25,967 |
| Median Family Income | 183 | $64,063 |
| Mean Family Income | 183 | $66,821 |
| Median Household Income | 228 | $61,667 |
| Mean Household Income | 228 | $62,989 |
| Income Deficit | 183 | $0 |
| Wage / Income Gap (%) | 612 | 11.69% |
| Wage / Income Gap ($) | 612 | 88.31¢ per $1 |
| Gini / Inequality Index | 612 | 0.28 |
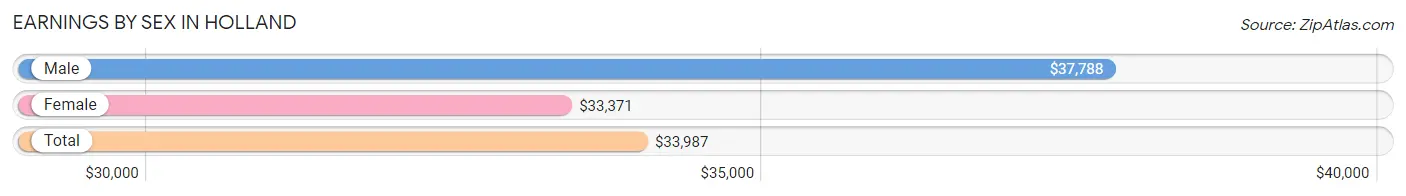
Earnings by Sex in Holland
Average Earnings in Holland are $33,987, $37,788 for men and $33,371 for women, a difference of 11.7%.
| Sex | Number | Average Earnings |
| Male | 168 (44.9%) | $37,788 |
| Female | 206 (55.1%) | $33,371 |
| Total | 374 (100.0%) | $33,987 |
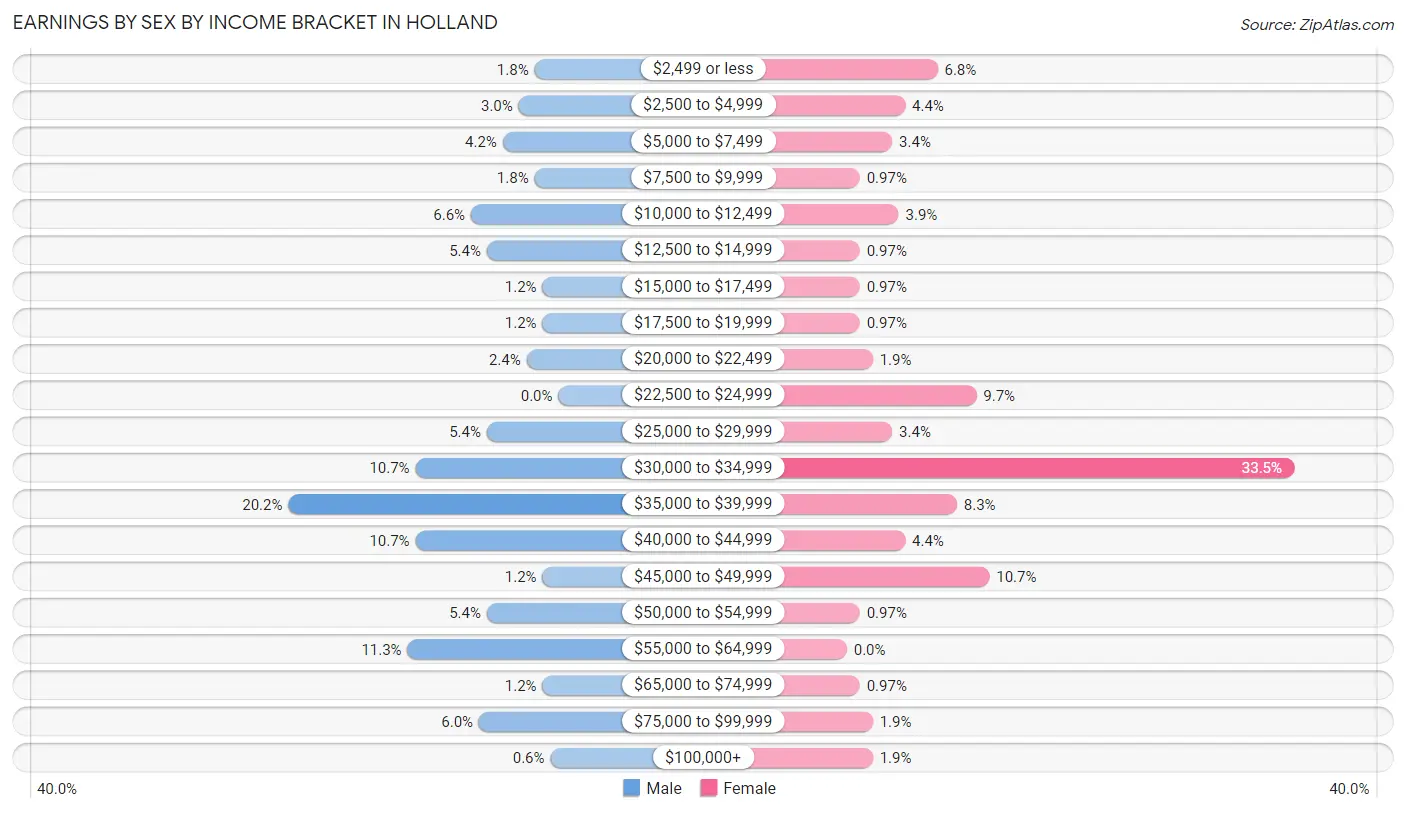
Earnings by Sex by Income Bracket in Holland
The most common earnings brackets in Holland are $35,000 to $39,999 for men (34 | 20.2%) and $30,000 to $34,999 for women (69 | 33.5%).
| Income | Male | Female |
| $2,499 or less | 3 (1.8%) | 14 (6.8%) |
| $2,500 to $4,999 | 5 (3.0%) | 9 (4.4%) |
| $5,000 to $7,499 | 7 (4.2%) | 7 (3.4%) |
| $7,500 to $9,999 | 3 (1.8%) | 2 (1.0%) |
| $10,000 to $12,499 | 11 (6.6%) | 8 (3.9%) |
| $12,500 to $14,999 | 9 (5.4%) | 2 (1.0%) |
| $15,000 to $17,499 | 2 (1.2%) | 2 (1.0%) |
| $17,500 to $19,999 | 2 (1.2%) | 2 (1.0%) |
| $20,000 to $22,499 | 4 (2.4%) | 4 (1.9%) |
| $22,500 to $24,999 | 0 (0.0%) | 20 (9.7%) |
| $25,000 to $29,999 | 9 (5.4%) | 7 (3.4%) |
| $30,000 to $34,999 | 18 (10.7%) | 69 (33.5%) |
| $35,000 to $39,999 | 34 (20.2%) | 17 (8.3%) |
| $40,000 to $44,999 | 18 (10.7%) | 9 (4.4%) |
| $45,000 to $49,999 | 2 (1.2%) | 22 (10.7%) |
| $50,000 to $54,999 | 9 (5.4%) | 2 (1.0%) |
| $55,000 to $64,999 | 19 (11.3%) | 0 (0.0%) |
| $65,000 to $74,999 | 2 (1.2%) | 2 (1.0%) |
| $75,000 to $99,999 | 10 (5.9%) | 4 (1.9%) |
| $100,000+ | 1 (0.6%) | 4 (1.9%) |
| Total | 168 (100.0%) | 206 (100.0%) |
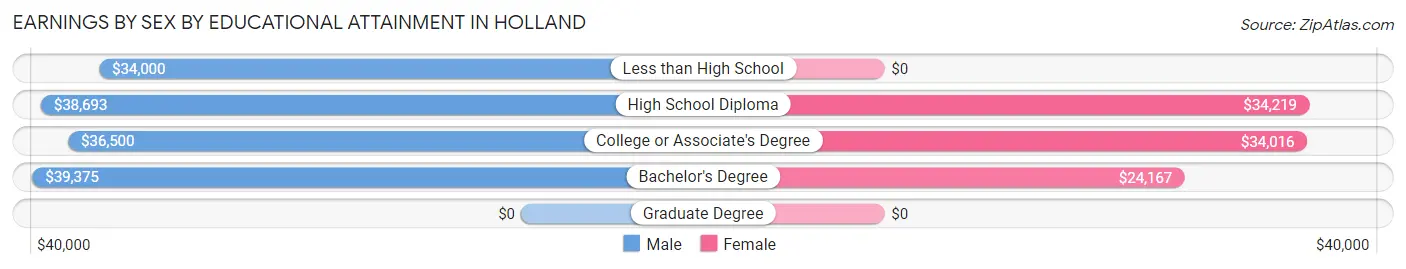
Earnings by Sex by Educational Attainment in Holland
Average earnings in Holland are $38,558 for men and $33,807 for women, a difference of 12.3%. Men with an educational attainment of bachelor's degree enjoy the highest average annual earnings of $39,375, while those with less than high school education earn the least with $34,000. Women with an educational attainment of high school diploma earn the most with the average annual earnings of $34,219, while those with bachelor's degree education have the smallest earnings of $24,167.
| Educational Attainment | Male Income | Female Income |
| Less than High School | $34,000 | $0 |
| High School Diploma | $38,693 | $34,219 |
| College or Associate's Degree | $36,500 | $34,016 |
| Bachelor's Degree | $39,375 | $24,167 |
| Graduate Degree | - | - |
| Total | $38,558 | $33,807 |
Family Income in Holland
Family Income Brackets in Holland
According to the Holland family income data, there are 66 families falling into the $50,000 to $74,999 income range, which is the most common income bracket and makes up 36.1% of all families.
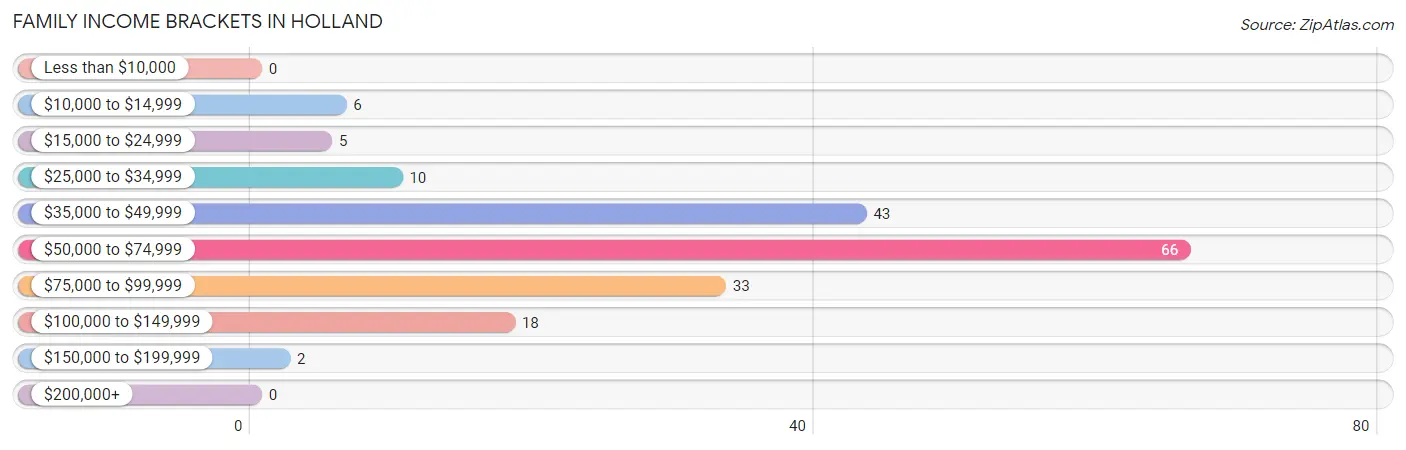
| Income Bracket | # Families | % Families |
| Less than $10,000 | 0 | 0.0% |
| $10,000 to $14,999 | 6 | 3.3% |
| $15,000 to $24,999 | 5 | 2.7% |
| $25,000 to $34,999 | 10 | 5.5% |
| $35,000 to $49,999 | 43 | 23.5% |
| $50,000 to $74,999 | 66 | 36.1% |
| $75,000 to $99,999 | 33 | 18.0% |
| $100,000 to $149,999 | 18 | 9.8% |
| $150,000 to $199,999 | 2 | 1.1% |
| $200,000+ | 0 | 0.0% |
Family Income by Famaliy Size in Holland
5-person families (5 | 2.7%) account for the highest median family income in Holland with $93,125 per family, while 2-person families (119 | 65.0%) have the highest median income of $31,771 per family member.
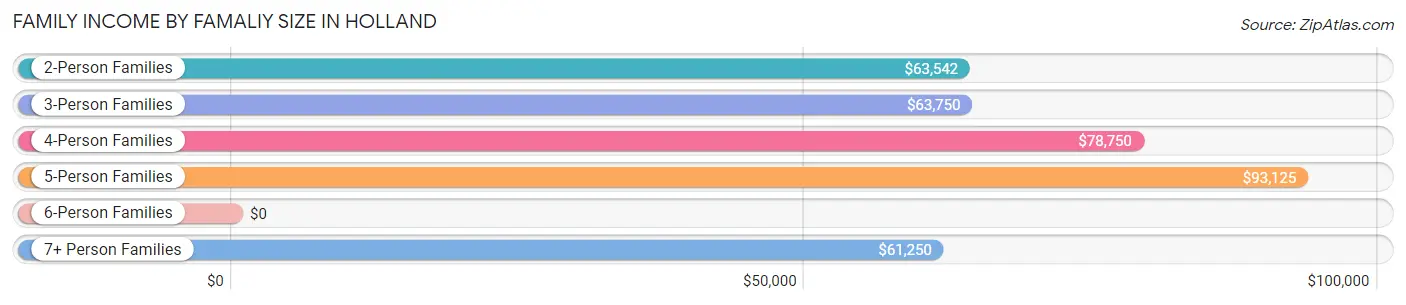
| Income Bracket | # Families | Median Income |
| 2-Person Families | 119 (65.0%) | $63,542 |
| 3-Person Families | 36 (19.7%) | $63,750 |
| 4-Person Families | 16 (8.7%) | $78,750 |
| 5-Person Families | 5 (2.7%) | $93,125 |
| 6-Person Families | 0 (0.0%) | $0 |
| 7+ Person Families | 7 (3.8%) | $61,250 |
| Total | 183 (100.0%) | $64,063 |
Family Income by Number of Earners in Holland
The median family income in Holland is $64,063, with families comprising 3+ earners (22) having the highest median family income of $83,750, while families with no earners (34) have the lowest median family income of $48,300, accounting for 12.0% and 18.6% of families, respectively.
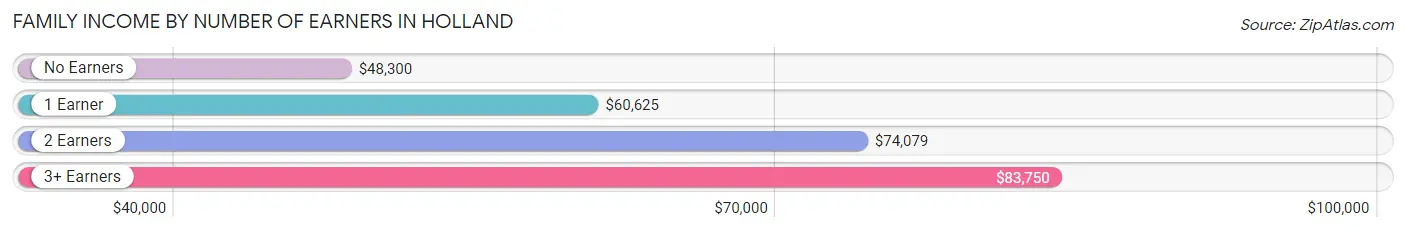
| Number of Earners | # Families | Median Income |
| No Earners | 34 (18.6%) | $48,300 |
| 1 Earner | 47 (25.7%) | $60,625 |
| 2 Earners | 80 (43.7%) | $74,079 |
| 3+ Earners | 22 (12.0%) | $83,750 |
| Total | 183 (100.0%) | $64,063 |
Household Income in Holland
Household Income Brackets in Holland
With 66 households falling in the category, the $50,000 to $74,999 income range is the most frequent in Holland, accounting for 28.9% of all households. In contrast, only 1 households (0.4%) fall into the $200,000+ income bracket, making it the least populous group.
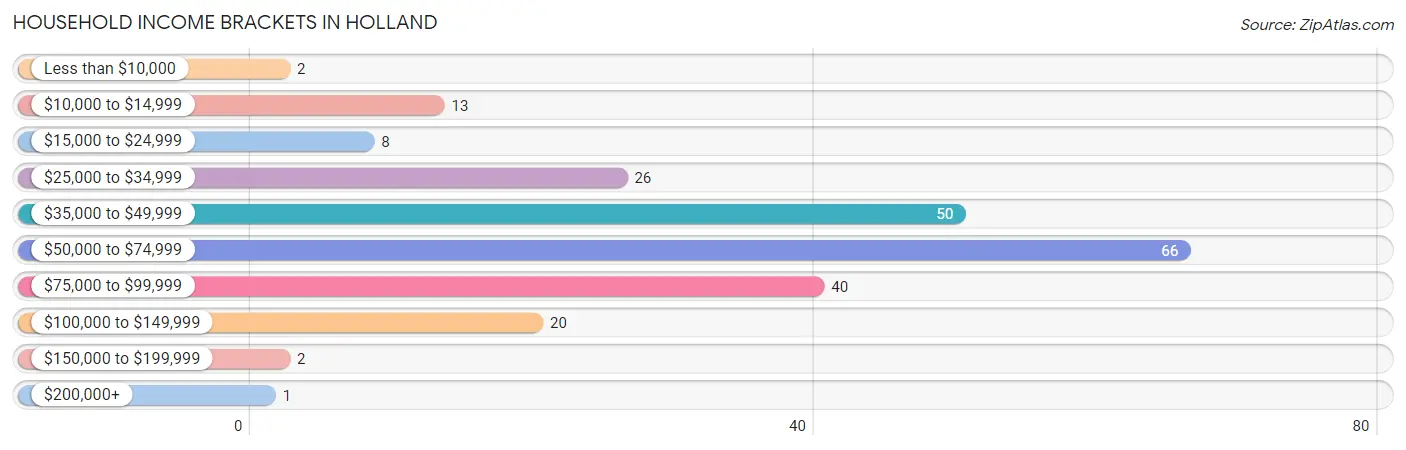
| Income Bracket | # Households | % Households |
| Less than $10,000 | 2 | 0.9% |
| $10,000 to $14,999 | 13 | 5.7% |
| $15,000 to $24,999 | 8 | 3.5% |
| $25,000 to $34,999 | 26 | 11.4% |
| $35,000 to $49,999 | 50 | 21.9% |
| $50,000 to $74,999 | 66 | 28.9% |
| $75,000 to $99,999 | 40 | 17.5% |
| $100,000 to $149,999 | 20 | 8.8% |
| $150,000 to $199,999 | 2 | 0.9% |
| $200,000+ | 1 | 0.4% |
Household Income by Householder Age in Holland
The median household income in Holland is $61,667, with the highest median household income of $72,566 found in the 25 to 44 years age bracket for the primary householder. A total of 87 households (38.2%) fall into this category.
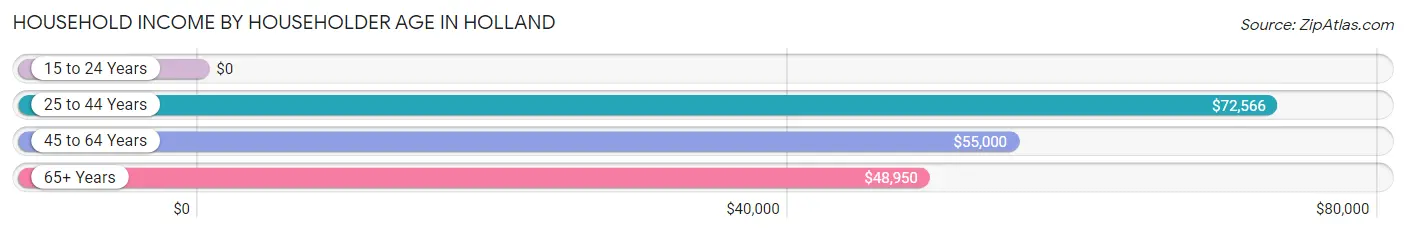
| Income Bracket | # Households | Median Income |
| 15 to 24 Years | 0 (0.0%) | $0 |
| 25 to 44 Years | 87 (38.2%) | $72,566 |
| 45 to 64 Years | 84 (36.8%) | $55,000 |
| 65+ Years | 57 (25.0%) | $48,950 |
| Total | 228 (100.0%) | $61,667 |
Poverty in Holland
Income Below Poverty by Sex and Age in Holland
With 5.6% poverty level for males and 9.3% for females among the residents of Holland, 16 and 17 year old males and 15 year old females are the most vulnerable to poverty, with 2 males (50.0%) and 3 females (100.0%) in their respective age groups living below the poverty level.
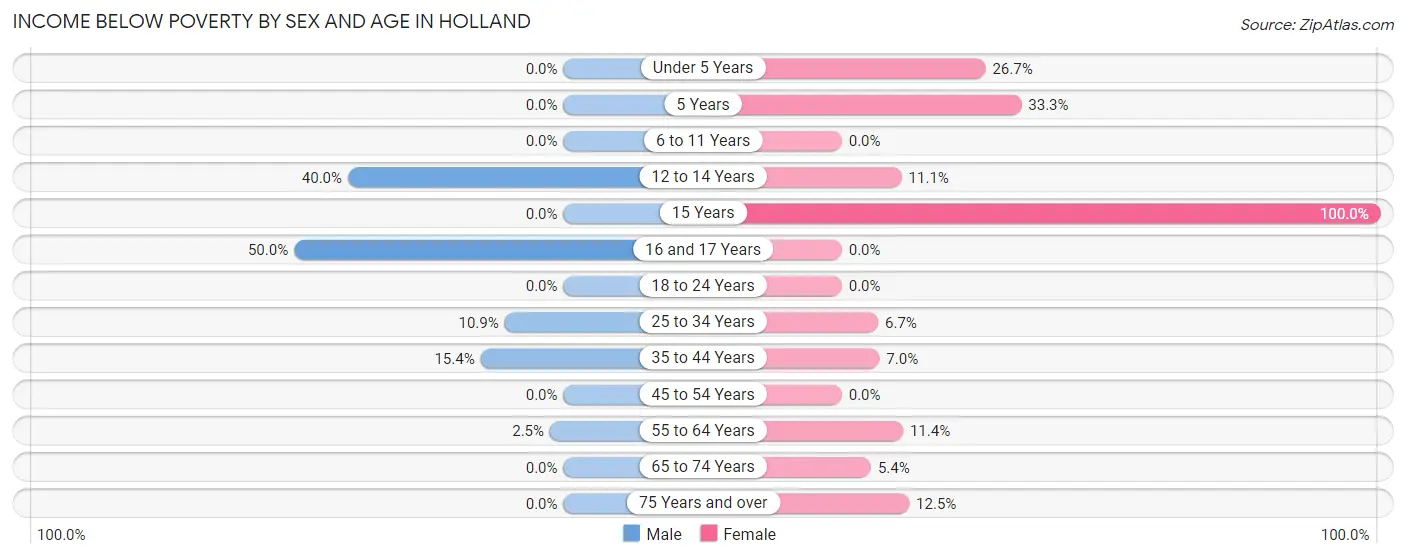
| Age Bracket | Male | Female |
| Under 5 Years | 0 (0.0%) | 8 (26.7%) |
| 5 Years | 0 (0.0%) | 2 (33.3%) |
| 6 to 11 Years | 0 (0.0%) | 0 (0.0%) |
| 12 to 14 Years | 2 (40.0%) | 1 (11.1%) |
| 15 Years | 0 (0.0%) | 3 (100.0%) |
| 16 and 17 Years | 2 (50.0%) | 0 (0.0%) |
| 18 to 24 Years | 0 (0.0%) | 0 (0.0%) |
| 25 to 34 Years | 6 (10.9%) | 6 (6.7%) |
| 35 to 44 Years | 4 (15.4%) | 3 (7.0%) |
| 45 to 54 Years | 0 (0.0%) | 0 (0.0%) |
| 55 to 64 Years | 1 (2.5%) | 5 (11.4%) |
| 65 to 74 Years | 0 (0.0%) | 2 (5.4%) |
| 75 Years and over | 0 (0.0%) | 2 (12.5%) |
| Total | 15 (5.6%) | 32 (9.3%) |
Income Above Poverty by Sex and Age in Holland
According to the poverty statistics in Holland, males aged under 5 years and females aged 6 to 11 years are the age groups that are most secure financially, with 100.0% of males and 100.0% of females in these age groups living above the poverty line.
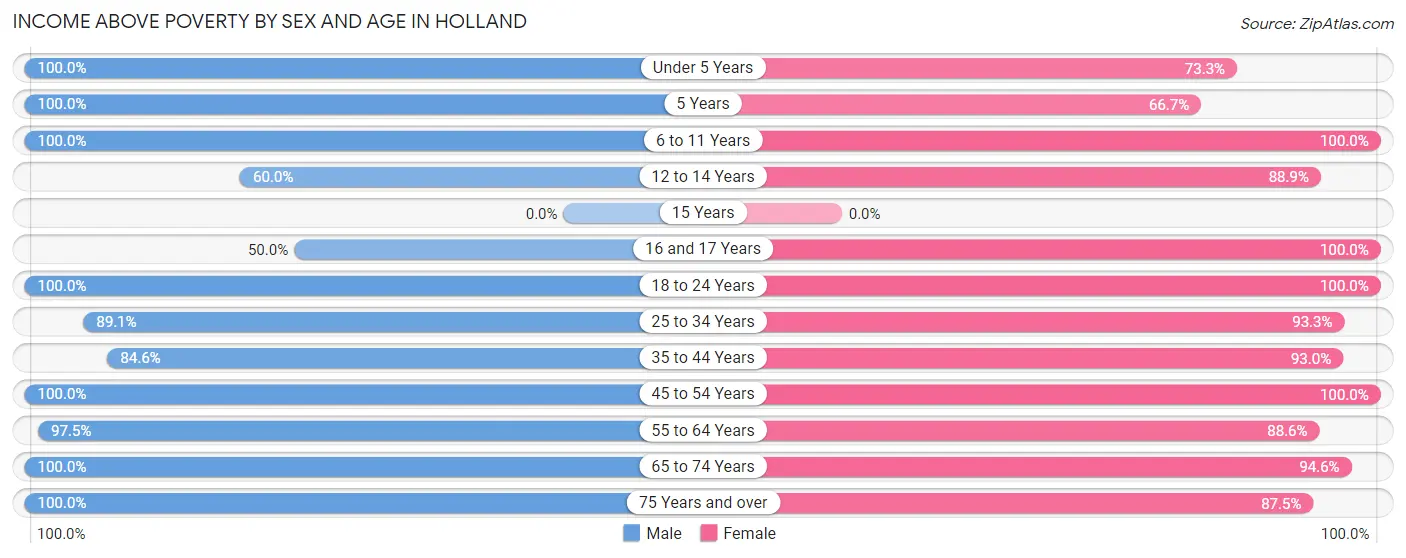
| Age Bracket | Male | Female |
| Under 5 Years | 16 (100.0%) | 22 (73.3%) |
| 5 Years | 12 (100.0%) | 4 (66.7%) |
| 6 to 11 Years | 16 (100.0%) | 19 (100.0%) |
| 12 to 14 Years | 3 (60.0%) | 8 (88.9%) |
| 15 Years | 0 (0.0%) | 0 (0.0%) |
| 16 and 17 Years | 2 (50.0%) | 19 (100.0%) |
| 18 to 24 Years | 16 (100.0%) | 6 (100.0%) |
| 25 to 34 Years | 49 (89.1%) | 83 (93.3%) |
| 35 to 44 Years | 22 (84.6%) | 40 (93.0%) |
| 45 to 54 Years | 27 (100.0%) | 22 (100.0%) |
| 55 to 64 Years | 39 (97.5%) | 39 (88.6%) |
| 65 to 74 Years | 45 (100.0%) | 35 (94.6%) |
| 75 Years and over | 7 (100.0%) | 14 (87.5%) |
| Total | 254 (94.4%) | 311 (90.7%) |
Income Below Poverty Among Married-Couple Families in Holland
The poverty statistics for married-couple families in Holland show that 5.4% or 8 of the total 149 families live below the poverty line. Families with 5 or more children have the highest poverty rate of 40.0%, comprising of 2 families. On the other hand, families with no children have the lowest poverty rate of 0.0%, which includes 0 families.
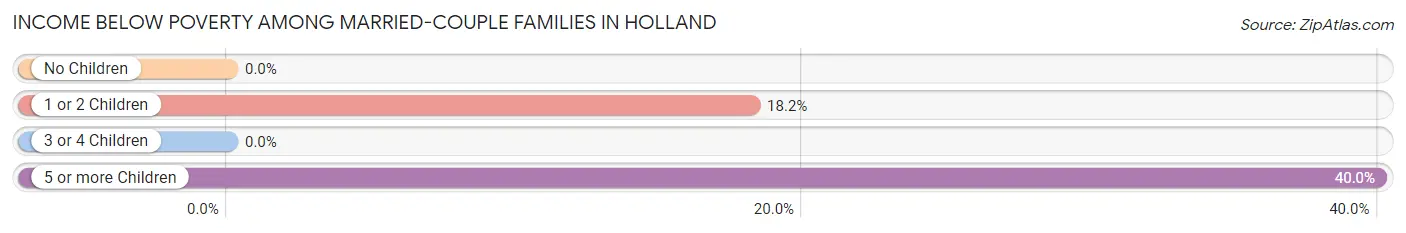
| Children | Above Poverty | Below Poverty |
| No Children | 106 (100.0%) | 0 (0.0%) |
| 1 or 2 Children | 27 (81.8%) | 6 (18.2%) |
| 3 or 4 Children | 5 (100.0%) | 0 (0.0%) |
| 5 or more Children | 3 (60.0%) | 2 (40.0%) |
| Total | 141 (94.6%) | 8 (5.4%) |
Income Below Poverty Among Single-Parent Households in Holland
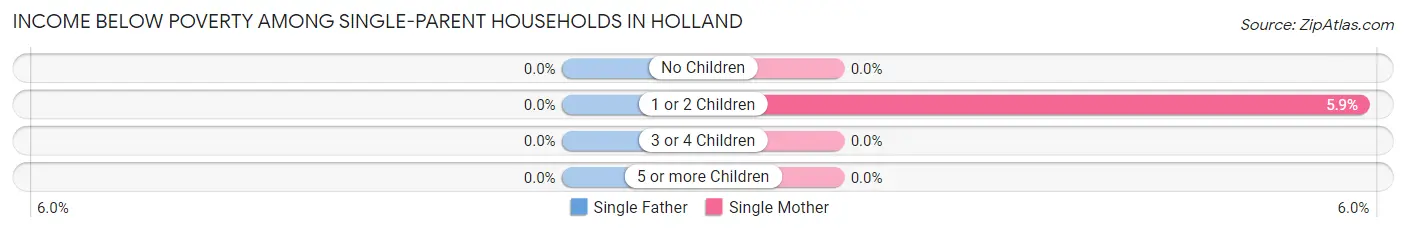
| Children | Single Father | Single Mother |
| No Children | 0 (0.0%) | 0 (0.0%) |
| 1 or 2 Children | 0 (0.0%) | 1 (5.9%) |
| 3 or 4 Children | 0 (0.0%) | 0 (0.0%) |
| 5 or more Children | 0 (0.0%) | 0 (0.0%) |
| Total | 0 (0.0%) | 1 (3.5%) |
Income Below Poverty Among Married-Couple vs Single-Parent Households in Holland
The poverty data for Holland shows that 8 of the married-couple family households (5.4%) and 1 of the single-parent households (2.9%) are living below the poverty level. Within the married-couple family households, those with 5 or more children have the highest poverty rate, with 2 households (40.0%) falling below the poverty line. Among the single-parent households, those with 1 or 2 children have the highest poverty rate, with 1 household (5.9%) living below poverty.
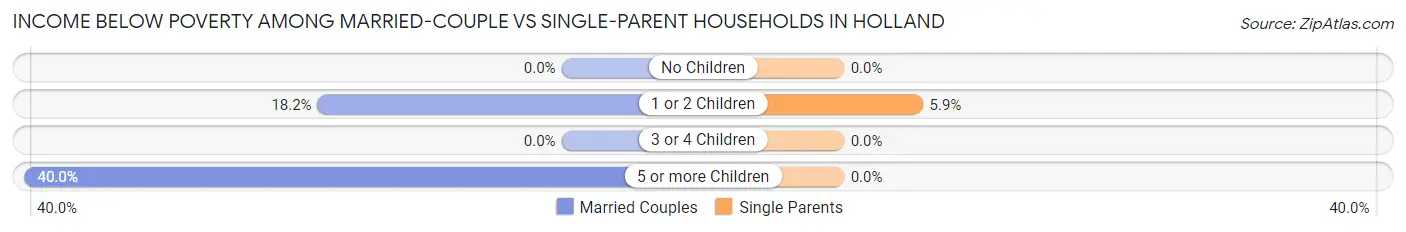
| Children | Married-Couple Families | Single-Parent Households |
| No Children | 0 (0.0%) | 0 (0.0%) |
| 1 or 2 Children | 6 (18.2%) | 1 (5.9%) |
| 3 or 4 Children | 0 (0.0%) | 0 (0.0%) |
| 5 or more Children | 2 (40.0%) | 0 (0.0%) |
| Total | 8 (5.4%) | 1 (2.9%) |
Race in Holland
The most populous races in Holland are White / Caucasian (533 | 87.1%), Hispanic or Latino (73 | 11.9%), and Some other Race (40 | 6.5%).
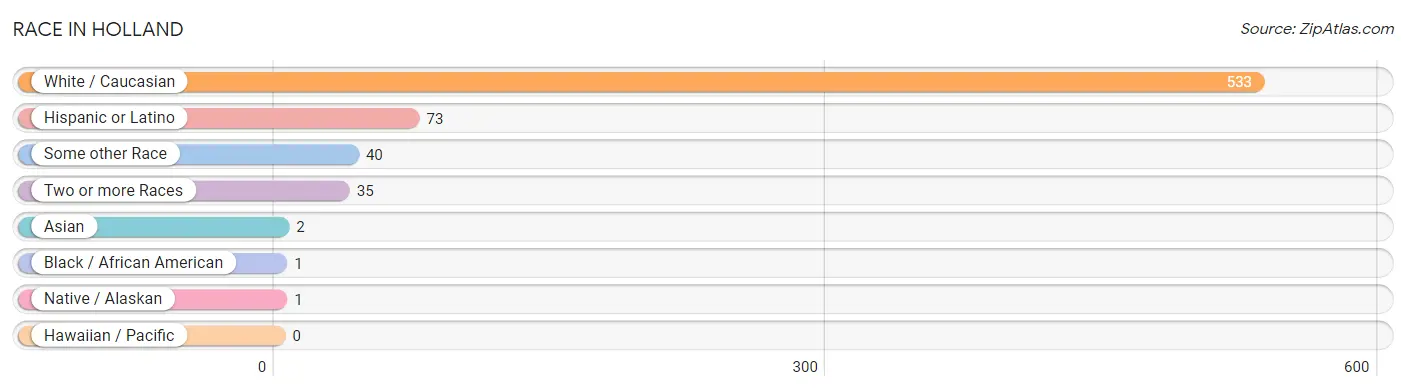
| Race | # Population | % Population |
| Asian | 2 | 0.3% |
| Black / African American | 1 | 0.2% |
| Hawaiian / Pacific | 0 | 0.0% |
| Hispanic or Latino | 73 | 11.9% |
| Native / Alaskan | 1 | 0.2% |
| White / Caucasian | 533 | 87.1% |
| Two or more Races | 35 | 5.7% |
| Some other Race | 40 | 6.5% |
| Total | 612 | 100.0% |
Ancestry in Holland
The most populous ancestries reported in Holland are German (250 | 40.8%), English (89 | 14.5%), Irish (58 | 9.5%), Mexican (49 | 8.0%), and American (33 | 5.4%), together accounting for 78.3% of all Holland residents.
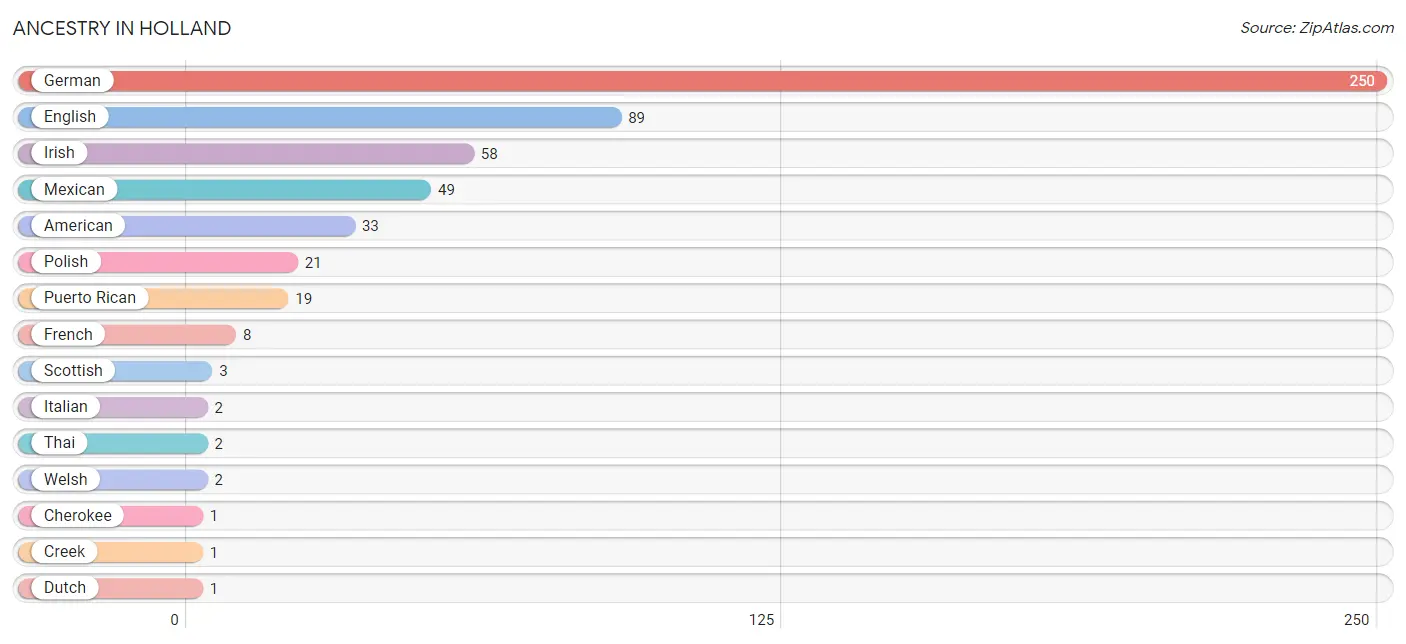
| Ancestry | # Population | % Population |
| American | 33 | 5.4% |
| Cherokee | 1 | 0.2% |
| Creek | 1 | 0.2% |
| Dutch | 1 | 0.2% |
| English | 89 | 14.5% |
| French | 8 | 1.3% |
| German | 250 | 40.8% |
| Irish | 58 | 9.5% |
| Italian | 2 | 0.3% |
| Mexican | 49 | 8.0% |
| Polish | 21 | 3.4% |
| Puerto Rican | 19 | 3.1% |
| Scottish | 3 | 0.5% |
| Thai | 2 | 0.3% |
| Welsh | 2 | 0.3% | View All 15 Rows |
Immigrants in Holland
The most numerous immigrant groups reported in Holland came from Central America (49 | 8.0%), Latin America (49 | 8.0%), Mexico (49 | 8.0%), Asia (2 | 0.3%), and Europe (2 | 0.3%), together accounting for 24.7% of all Holland residents.
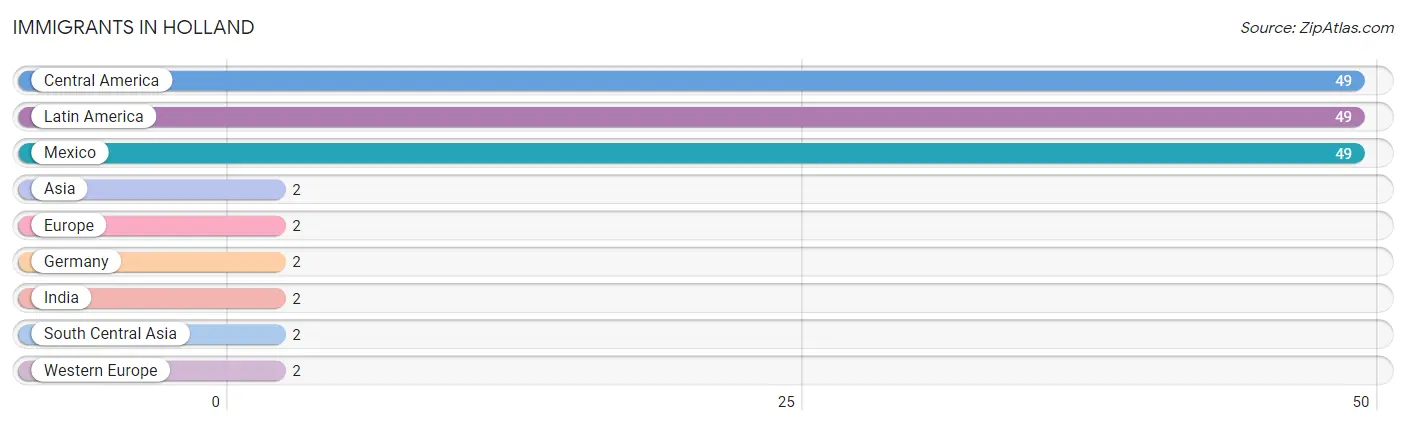
| Immigration Origin | # Population | % Population |
| Asia | 2 | 0.3% |
| Central America | 49 | 8.0% |
| Europe | 2 | 0.3% |
| Germany | 2 | 0.3% |
| India | 2 | 0.3% |
| Latin America | 49 | 8.0% |
| Mexico | 49 | 8.0% |
| South Central Asia | 2 | 0.3% |
| Western Europe | 2 | 0.3% | View All 9 Rows |
Sex and Age in Holland
Sex and Age in Holland
The most populous age groups in Holland are 30 to 34 Years (34 | 12.6%) for men and 25 to 29 Years (76 | 22.2%) for women.
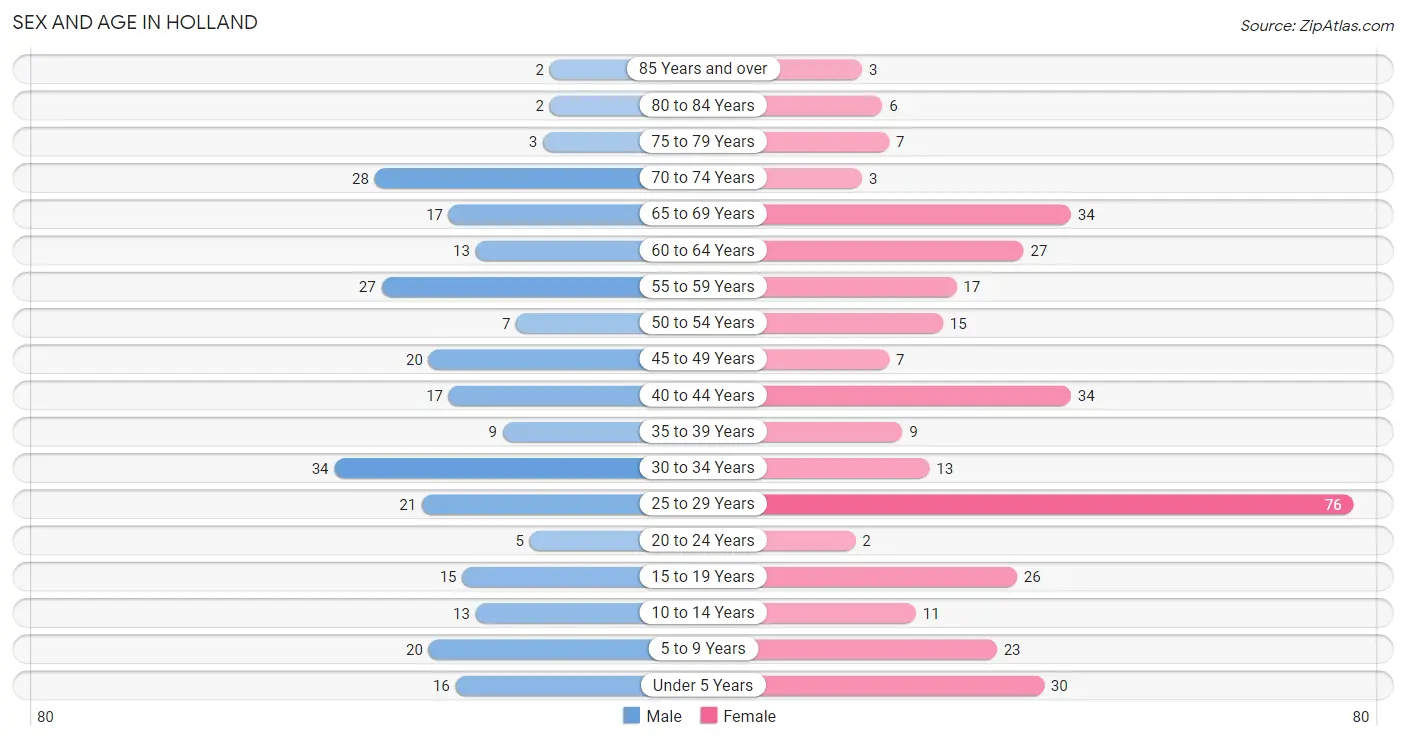
| Age Bracket | Male | Female |
| Under 5 Years | 16 (5.9%) | 30 (8.7%) |
| 5 to 9 Years | 20 (7.4%) | 23 (6.7%) |
| 10 to 14 Years | 13 (4.8%) | 11 (3.2%) |
| 15 to 19 Years | 15 (5.6%) | 26 (7.6%) |
| 20 to 24 Years | 5 (1.9%) | 2 (0.6%) |
| 25 to 29 Years | 21 (7.8%) | 76 (22.2%) |
| 30 to 34 Years | 34 (12.6%) | 13 (3.8%) |
| 35 to 39 Years | 9 (3.4%) | 9 (2.6%) |
| 40 to 44 Years | 17 (6.3%) | 34 (9.9%) |
| 45 to 49 Years | 20 (7.4%) | 7 (2.0%) |
| 50 to 54 Years | 7 (2.6%) | 15 (4.4%) |
| 55 to 59 Years | 27 (10.0%) | 17 (5.0%) |
| 60 to 64 Years | 13 (4.8%) | 27 (7.9%) |
| 65 to 69 Years | 17 (6.3%) | 34 (9.9%) |
| 70 to 74 Years | 28 (10.4%) | 3 (0.9%) |
| 75 to 79 Years | 3 (1.1%) | 7 (2.0%) |
| 80 to 84 Years | 2 (0.7%) | 6 (1.8%) |
| 85 Years and over | 2 (0.7%) | 3 (0.9%) |
| Total | 269 (100.0%) | 343 (100.0%) |
Families and Households in Holland
Median Family Size in Holland
The median family size in Holland is 2.92 persons per family, with single female/mother families (29 | 15.9%) accounting for the largest median family size of 3.14 persons per family. On the other hand, single male/father families (5 | 2.7%) represent the smallest median family size with 2.20 persons per family.
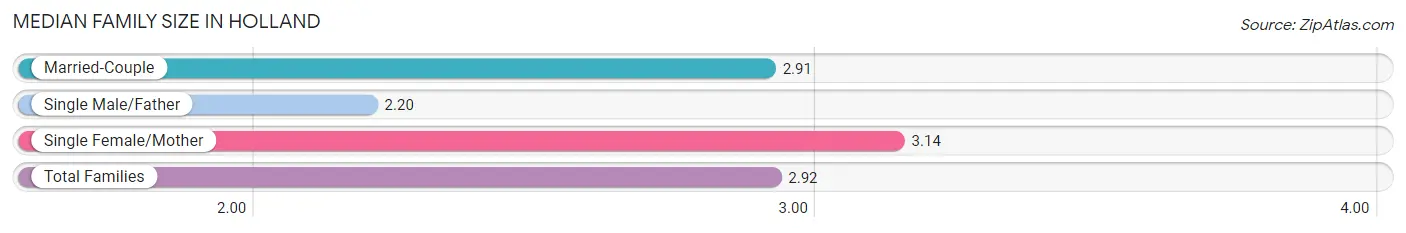
| Family Type | # Families | Family Size |
| Married-Couple | 149 (81.4%) | 2.91 |
| Single Male/Father | 5 (2.7%) | 2.20 |
| Single Female/Mother | 29 (15.9%) | 3.14 |
| Total Families | 183 (100.0%) | 2.92 |
Median Household Size in Holland
The median household size in Holland is 2.68 persons per household, with single female/mother households (29 | 12.7%) accounting for the largest median household size of 3.55 persons per household. non-family households (45 | 19.7%) represent the smallest median household size with 1.44 persons per household.
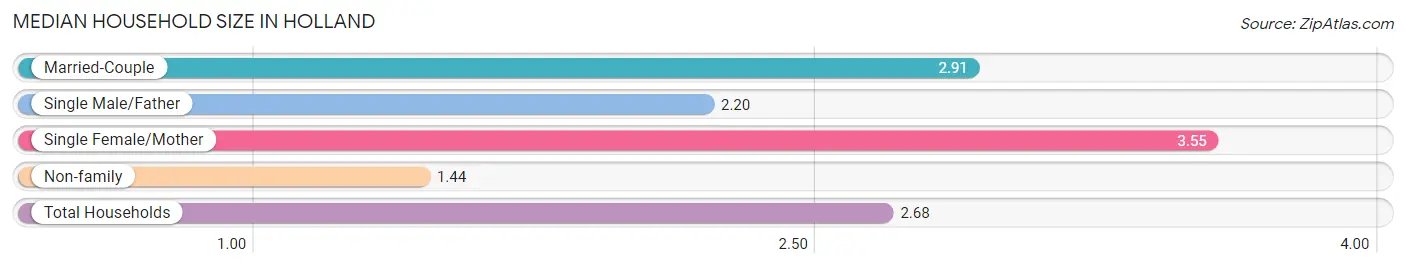
| Household Type | # Households | Household Size |
| Married-Couple | 149 (65.3%) | 2.91 |
| Single Male/Father | 5 (2.2%) | 2.20 |
| Single Female/Mother | 29 (12.7%) | 3.55 |
| Non-family | 45 (19.7%) | 1.44 |
| Total Households | 228 (100.0%) | 2.68 |
Household Size by Marriage Status in Holland
Out of a total of 228 households in Holland, 183 (80.3%) are family households, while 45 (19.7%) are nonfamily households. The most numerous type of family households are 2-person households, comprising 115, and the most common type of nonfamily households are 1-person households, comprising 40.
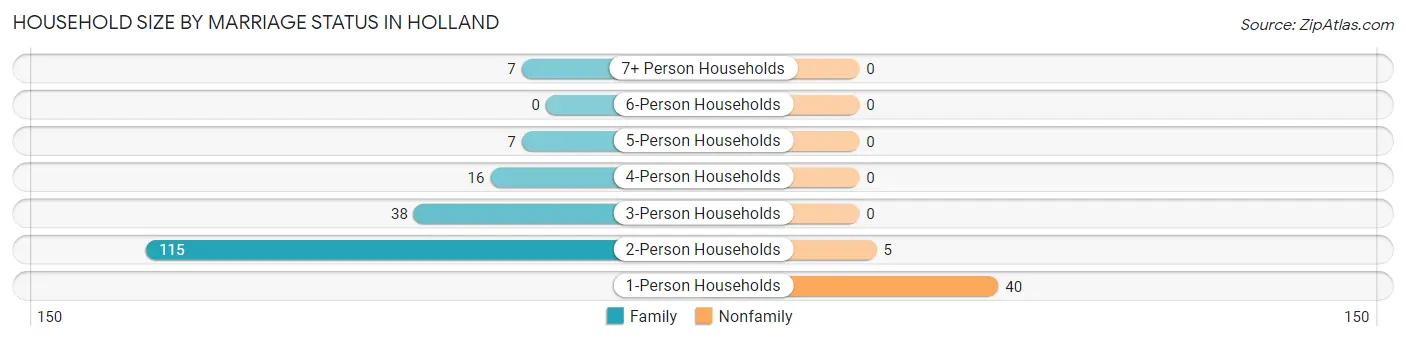
| Household Size | Family Households | Nonfamily Households |
| 1-Person Households | - | 40 (17.5%) |
| 2-Person Households | 115 (50.4%) | 5 (2.2%) |
| 3-Person Households | 38 (16.7%) | 0 (0.0%) |
| 4-Person Households | 16 (7.0%) | 0 (0.0%) |
| 5-Person Households | 7 (3.1%) | 0 (0.0%) |
| 6-Person Households | 0 (0.0%) | 0 (0.0%) |
| 7+ Person Households | 7 (3.1%) | 0 (0.0%) |
| Total | 183 (80.3%) | 45 (19.7%) |
Female Fertility in Holland
Fertility by Age in Holland
Average fertility rate in Holland is 60.0 births per 1,000 women. Women in the age bracket of 20 to 34 years have the highest fertility rate with 88.0 births per 1,000 women. Women in the age bracket of 20 to 34 years acount for 80.0% of all women with births.
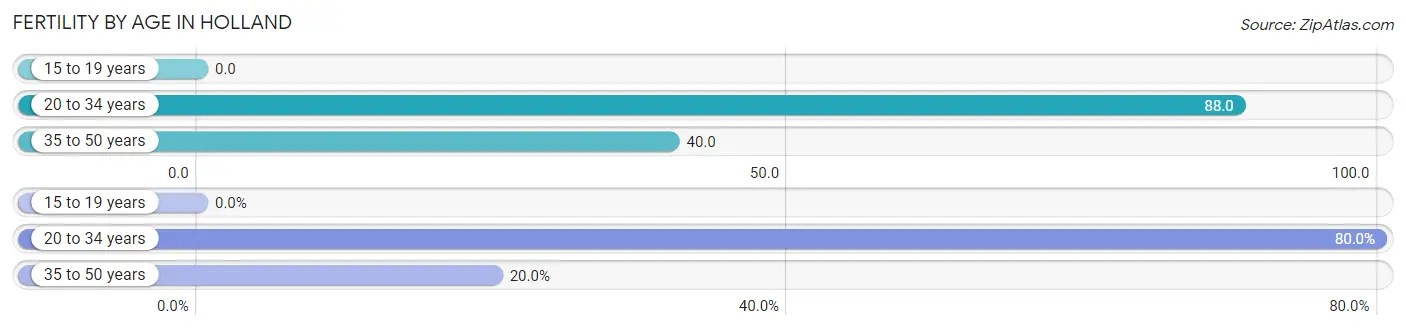
| Age Bracket | Women with Births | Births / 1,000 Women |
| 15 to 19 years | 0 (0.0%) | 0.0 |
| 20 to 34 years | 8 (80.0%) | 88.0 |
| 35 to 50 years | 2 (20.0%) | 40.0 |
| Total | 10 (100.0%) | 60.0 |
Fertility by Age by Marriage Status in Holland
80.0% of women with births (10) in Holland are married. The highest percentage of unmarried women with births falls into 35 to 50 years age bracket with 100.0% of them unmarried at the time of birth, while the lowest percentage of unmarried women with births belong to 20 to 34 years age bracket with 0.0% of them unmarried.
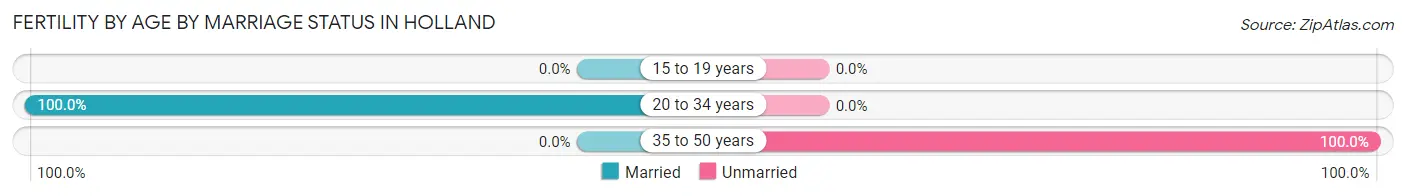
| Age Bracket | Married | Unmarried |
| 15 to 19 years | 0 (0.0%) | 0 (0.0%) |
| 20 to 34 years | 8 (100.0%) | 0 (0.0%) |
| 35 to 50 years | 0 (0.0%) | 2 (100.0%) |
| Total | 8 (80.0%) | 2 (20.0%) |
Fertility by Education in Holland
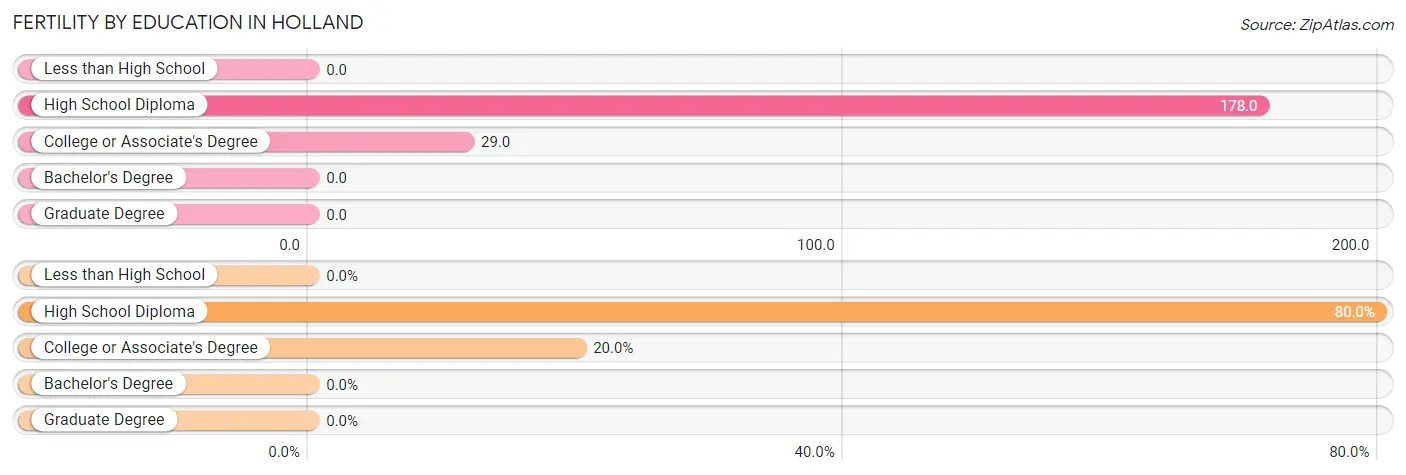
| Educational Attainment | Women with Births | Births / 1,000 Women |
| Less than High School | 0 (0.0%) | 0.0 |
| High School Diploma | 8 (80.0%) | 178.0 |
| College or Associate's Degree | 2 (20.0%) | 29.0 |
| Bachelor's Degree | 0 (0.0%) | 0.0 |
| Graduate Degree | 0 (0.0%) | 0.0 |
| Total | 10 (100.0%) | 60.0 |
Fertility by Education by Marriage Status in Holland
20.0% of women with births in Holland are unmarried. Women with the educational attainment of high school diploma are most likely to be married with 100.0% of them married at childbirth, while women with the educational attainment of college or associate's degree are least likely to be married with 100.0% of them unmarried at childbirth.
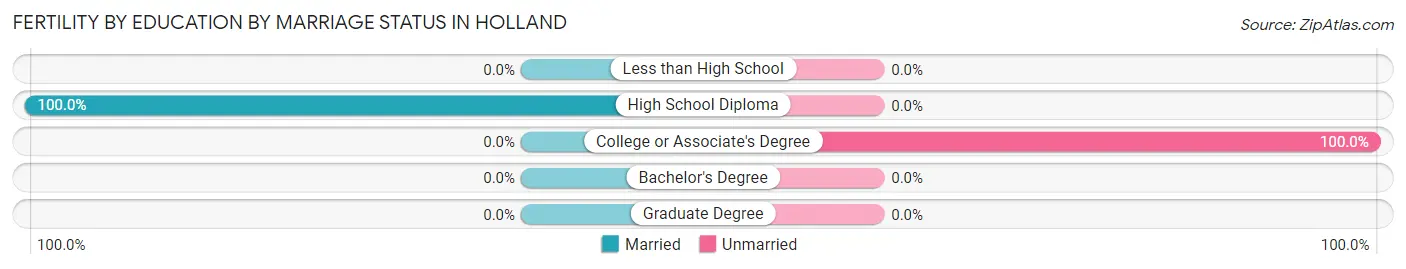
| Educational Attainment | Married | Unmarried |
| Less than High School | 0 (0.0%) | 0 (0.0%) |
| High School Diploma | 8 (100.0%) | 0 (0.0%) |
| College or Associate's Degree | 0 (0.0%) | 2 (100.0%) |
| Bachelor's Degree | 0 (0.0%) | 0 (0.0%) |
| Graduate Degree | 0 (0.0%) | 0 (0.0%) |
| Total | 8 (80.0%) | 2 (20.0%) |
Employment Characteristics in Holland
Employment by Class of Employer in Holland
Among the 339 employed individuals in Holland, private company employees (268 | 79.1%), self-employed (incorporated) (26 | 7.7%), and not-for-profit organizations (25 | 7.4%) make up the most common classes of employment.
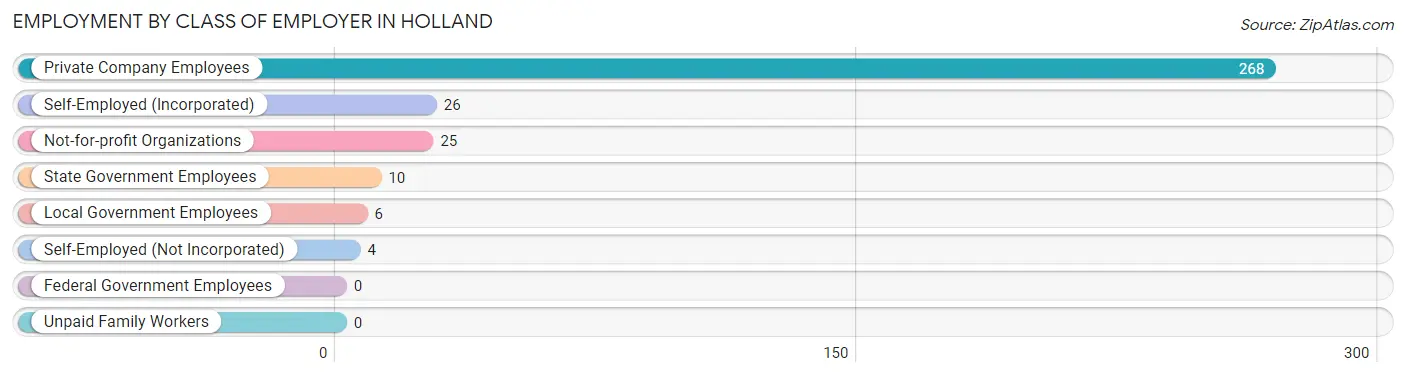
| Employer Class | # Employees | % Employees |
| Private Company Employees | 268 | 79.1% |
| Self-Employed (Incorporated) | 26 | 7.7% |
| Self-Employed (Not Incorporated) | 4 | 1.2% |
| Not-for-profit Organizations | 25 | 7.4% |
| Local Government Employees | 6 | 1.8% |
| State Government Employees | 10 | 2.9% |
| Federal Government Employees | 0 | 0.0% |
| Unpaid Family Workers | 0 | 0.0% |
| Total | 339 | 100.0% |
Employment Status by Age in Holland
According to the labor force statistics for Holland, out of the total population over 16 years of age (496), 69.8% or 346 individuals are in the labor force, with 0.6% or 2 of them unemployed. The age group with the highest labor force participation rate is 30 to 34 years, with 95.7% or 45 individuals in the labor force. Within the labor force, the 60 to 64 years age range has the highest percentage of unemployed individuals, with 8.7% or 2 of them being unemployed.
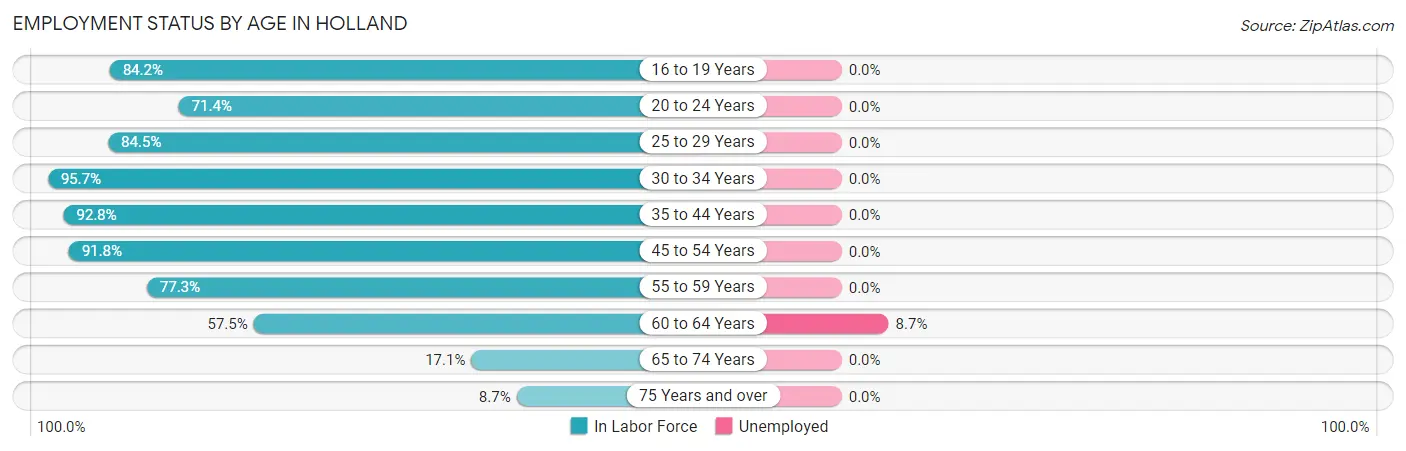
| Age Bracket | In Labor Force | Unemployed |
| 16 to 19 Years | 32 (84.2%) | 0 (0.0%) |
| 20 to 24 Years | 5 (71.4%) | 0 (0.0%) |
| 25 to 29 Years | 82 (84.5%) | 0 (0.0%) |
| 30 to 34 Years | 45 (95.7%) | 0 (0.0%) |
| 35 to 44 Years | 64 (92.8%) | 0 (0.0%) |
| 45 to 54 Years | 45 (91.8%) | 0 (0.0%) |
| 55 to 59 Years | 34 (77.3%) | 0 (0.0%) |
| 60 to 64 Years | 23 (57.5%) | 2 (8.7%) |
| 65 to 74 Years | 14 (17.1%) | 0 (0.0%) |
| 75 Years and over | 2 (8.7%) | 0 (0.0%) |
| Total | 346 (69.8%) | 2 (0.6%) |
Employment Status by Educational Attainment in Holland
According to labor force statistics for Holland, 84.7% of individuals (293) out of the total population between 25 and 64 years of age (346) are in the labor force, with 0.7% or 2 of them being unemployed. The group with the highest labor force participation rate are those with the educational attainment of college / associate degree, with 87.9% or 109 individuals in the labor force. Within the labor force, individuals with high school diploma education have the highest percentage of unemployment, with 1.6% or 2 of them being unemployed.
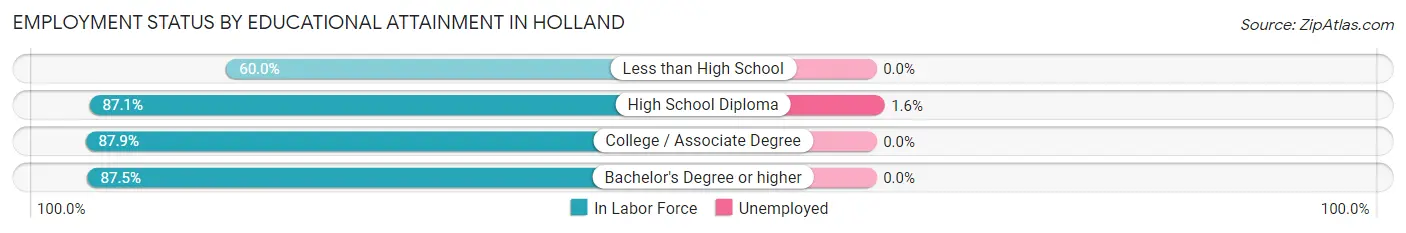
| Educational Attainment | In Labor Force | Unemployed |
| Less than High School | 21 (60.0%) | 0 (0.0%) |
| High School Diploma | 128 (87.1%) | 2 (1.6%) |
| College / Associate Degree | 109 (87.9%) | 0 (0.0%) |
| Bachelor's Degree or higher | 35 (87.5%) | 0 (0.0%) |
| Total | 293 (84.7%) | 2 (0.7%) |
Employment Occupations by Sex in Holland
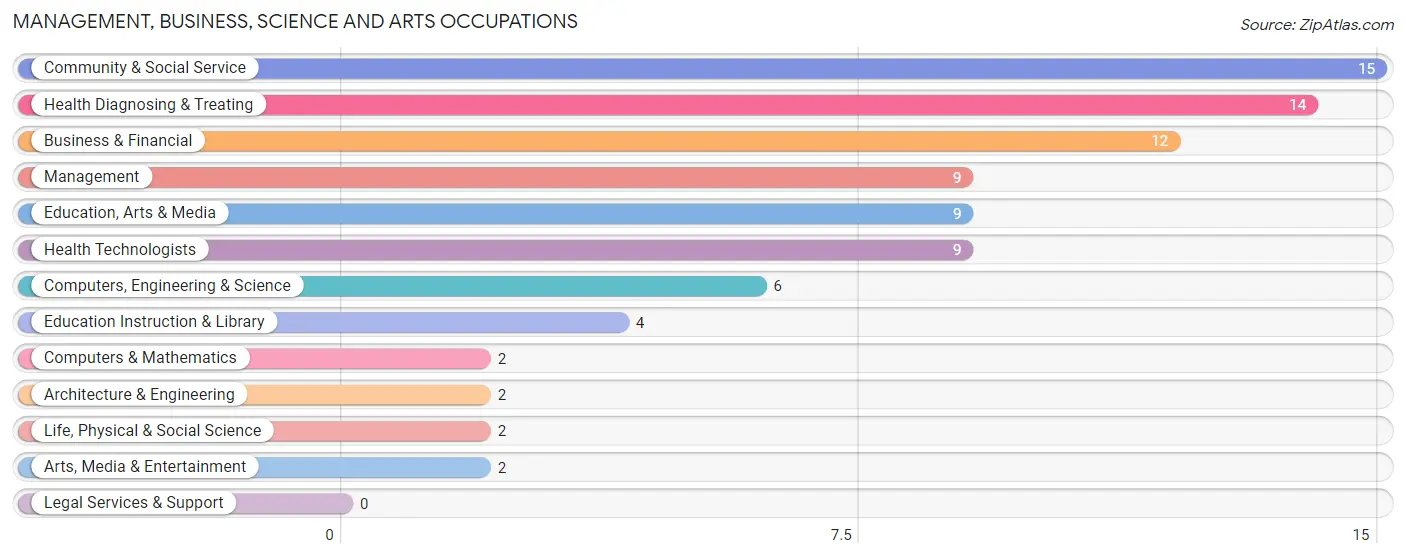
Management, Business, Science and Arts Occupations
The most common Management, Business, Science and Arts occupations in Holland are Community & Social Service (15 | 4.4%), Health Diagnosing & Treating (14 | 4.1%), Business & Financial (12 | 3.5%), Management (9 | 2.6%), and Education, Arts & Media (9 | 2.6%).
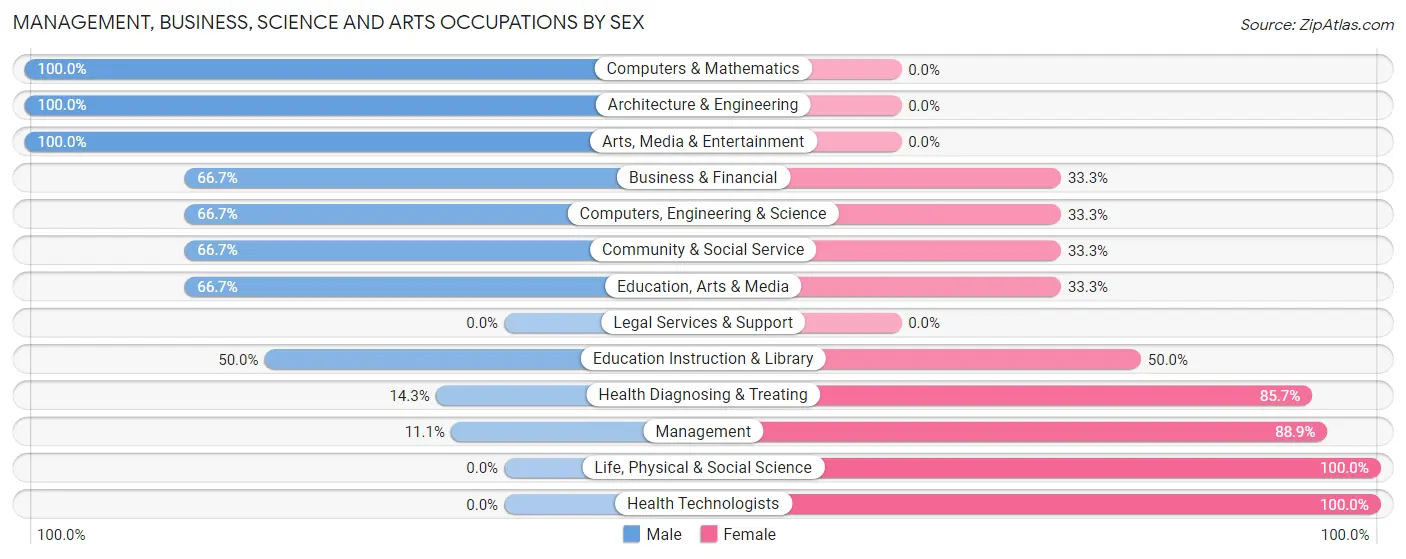
Management, Business, Science and Arts Occupations by Sex
Within the Management, Business, Science and Arts occupations in Holland, the most male-oriented occupations are Computers & Mathematics (100.0%), Architecture & Engineering (100.0%), and Arts, Media & Entertainment (100.0%), while the most female-oriented occupations are Life, Physical & Social Science (100.0%), Health Technologists (100.0%), and Management (88.9%).
| Occupation | Male | Female |
| Management | 1 (11.1%) | 8 (88.9%) |
| Business & Financial | 8 (66.7%) | 4 (33.3%) |
| Computers, Engineering & Science | 4 (66.7%) | 2 (33.3%) |
| Computers & Mathematics | 2 (100.0%) | 0 (0.0%) |
| Architecture & Engineering | 2 (100.0%) | 0 (0.0%) |
| Life, Physical & Social Science | 0 (0.0%) | 2 (100.0%) |
| Community & Social Service | 10 (66.7%) | 5 (33.3%) |
| Education, Arts & Media | 6 (66.7%) | 3 (33.3%) |
| Legal Services & Support | 0 (0.0%) | 0 (0.0%) |
| Education Instruction & Library | 2 (50.0%) | 2 (50.0%) |
| Arts, Media & Entertainment | 2 (100.0%) | 0 (0.0%) |
| Health Diagnosing & Treating | 2 (14.3%) | 12 (85.7%) |
| Health Technologists | 0 (0.0%) | 9 (100.0%) |
| Total (Category) | 25 (44.6%) | 31 (55.4%) |
| Total (Overall) | 156 (45.4%) | 188 (54.6%) |
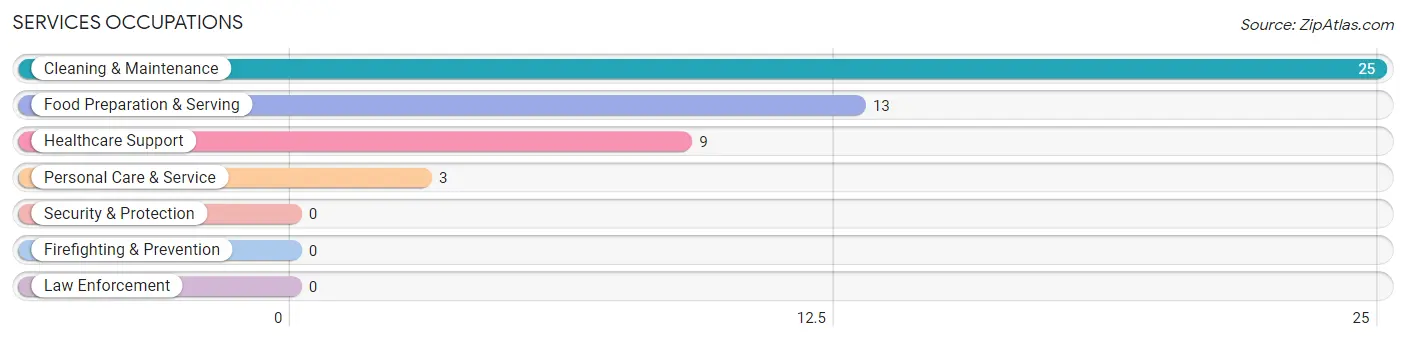
Services Occupations
The most common Services occupations in Holland are Cleaning & Maintenance (25 | 7.3%), Food Preparation & Serving (13 | 3.8%), Healthcare Support (9 | 2.6%), and Personal Care & Service (3 | 0.9%).
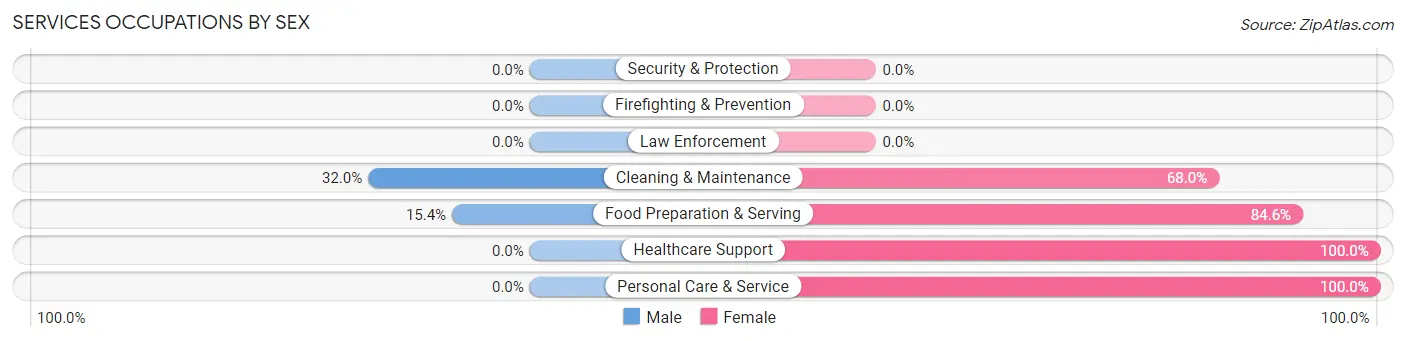
Services Occupations by Sex
Within the Services occupations in Holland, the most male-oriented occupations are Cleaning & Maintenance (32.0%), and Food Preparation & Serving (15.4%), while the most female-oriented occupations are Healthcare Support (100.0%), Personal Care & Service (100.0%), and Food Preparation & Serving (84.6%).
| Occupation | Male | Female |
| Healthcare Support | 0 (0.0%) | 9 (100.0%) |
| Security & Protection | 0 (0.0%) | 0 (0.0%) |
| Firefighting & Prevention | 0 (0.0%) | 0 (0.0%) |
| Law Enforcement | 0 (0.0%) | 0 (0.0%) |
| Food Preparation & Serving | 2 (15.4%) | 11 (84.6%) |
| Cleaning & Maintenance | 8 (32.0%) | 17 (68.0%) |
| Personal Care & Service | 0 (0.0%) | 3 (100.0%) |
| Total (Category) | 10 (20.0%) | 40 (80.0%) |
| Total (Overall) | 156 (45.4%) | 188 (54.6%) |
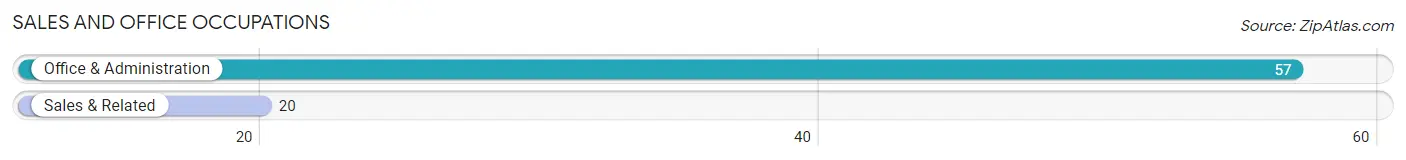
Sales and Office Occupations
The most common Sales and Office occupations in Holland are Office & Administration (57 | 16.6%), and Sales & Related (20 | 5.8%).
Sales and Office Occupations by Sex
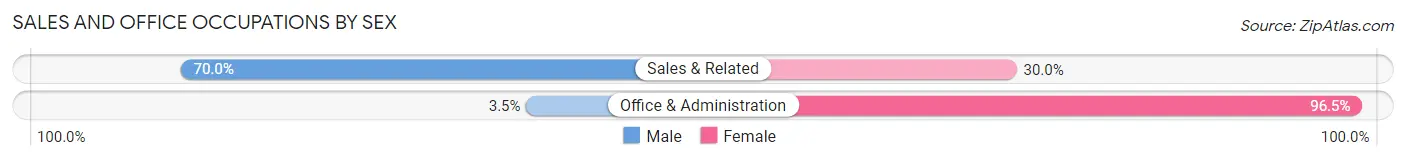
| Occupation | Male | Female |
| Sales & Related | 14 (70.0%) | 6 (30.0%) |
| Office & Administration | 2 (3.5%) | 55 (96.5%) |
| Total (Category) | 16 (20.8%) | 61 (79.2%) |
| Total (Overall) | 156 (45.4%) | 188 (54.6%) |
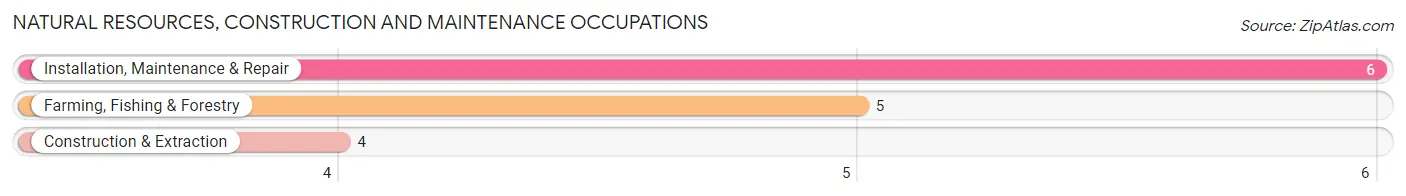
Natural Resources, Construction and Maintenance Occupations
The most common Natural Resources, Construction and Maintenance occupations in Holland are Installation, Maintenance & Repair (6 | 1.7%), Farming, Fishing & Forestry (5 | 1.5%), and Construction & Extraction (4 | 1.2%).
Natural Resources, Construction and Maintenance Occupations by Sex
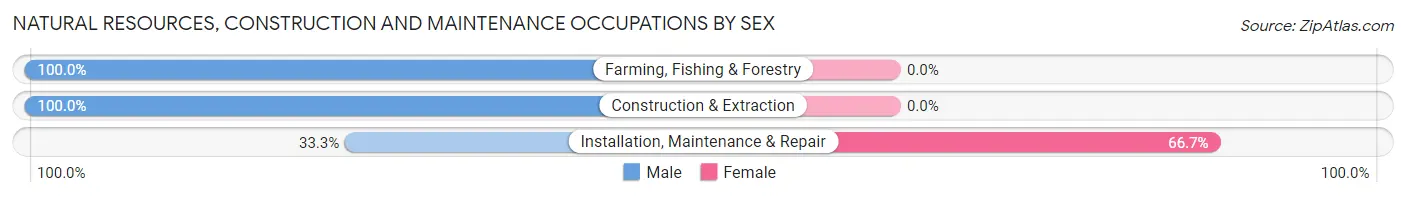
| Occupation | Male | Female |
| Farming, Fishing & Forestry | 5 (100.0%) | 0 (0.0%) |
| Construction & Extraction | 4 (100.0%) | 0 (0.0%) |
| Installation, Maintenance & Repair | 2 (33.3%) | 4 (66.7%) |
| Total (Category) | 11 (73.3%) | 4 (26.7%) |
| Total (Overall) | 156 (45.4%) | 188 (54.6%) |
Production, Transportation and Moving Occupations
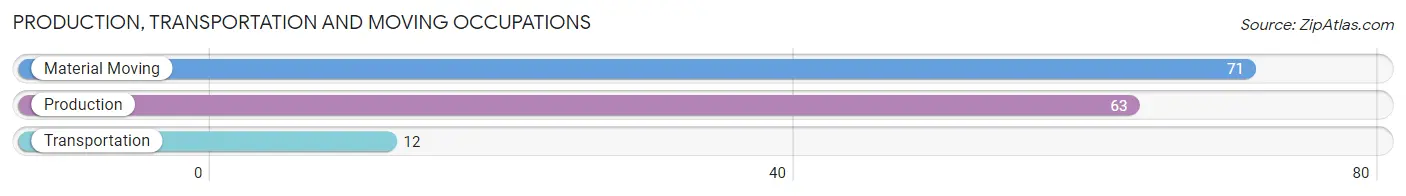
The most common Production, Transportation and Moving occupations in Holland are Material Moving (71 | 20.6%), Production (63 | 18.3%), and Transportation (12 | 3.5%).
Production, Transportation and Moving Occupations by Sex
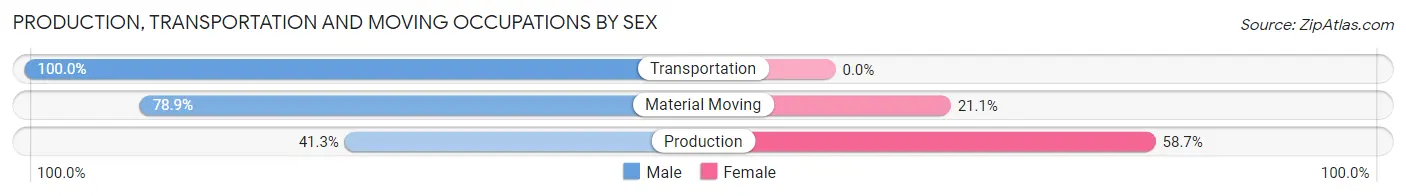
| Occupation | Male | Female |
| Production | 26 (41.3%) | 37 (58.7%) |
| Transportation | 12 (100.0%) | 0 (0.0%) |
| Material Moving | 56 (78.9%) | 15 (21.1%) |
| Total (Category) | 94 (64.4%) | 52 (35.6%) |
| Total (Overall) | 156 (45.4%) | 188 (54.6%) |
Employment Industries by Sex in Holland
Employment Industries in Holland
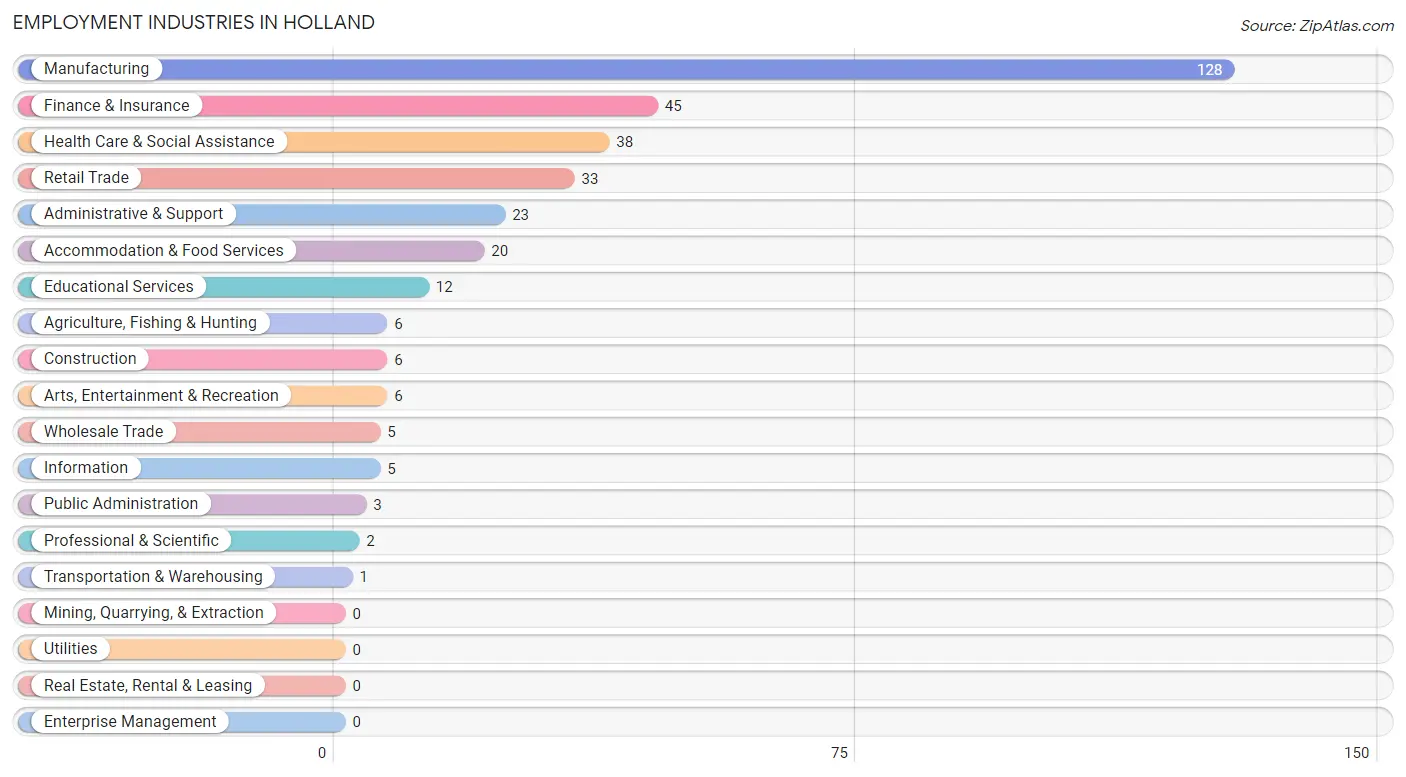
The major employment industries in Holland include Manufacturing (128 | 37.2%), Finance & Insurance (45 | 13.1%), Health Care & Social Assistance (38 | 11.1%), Retail Trade (33 | 9.6%), and Administrative & Support (23 | 6.7%).
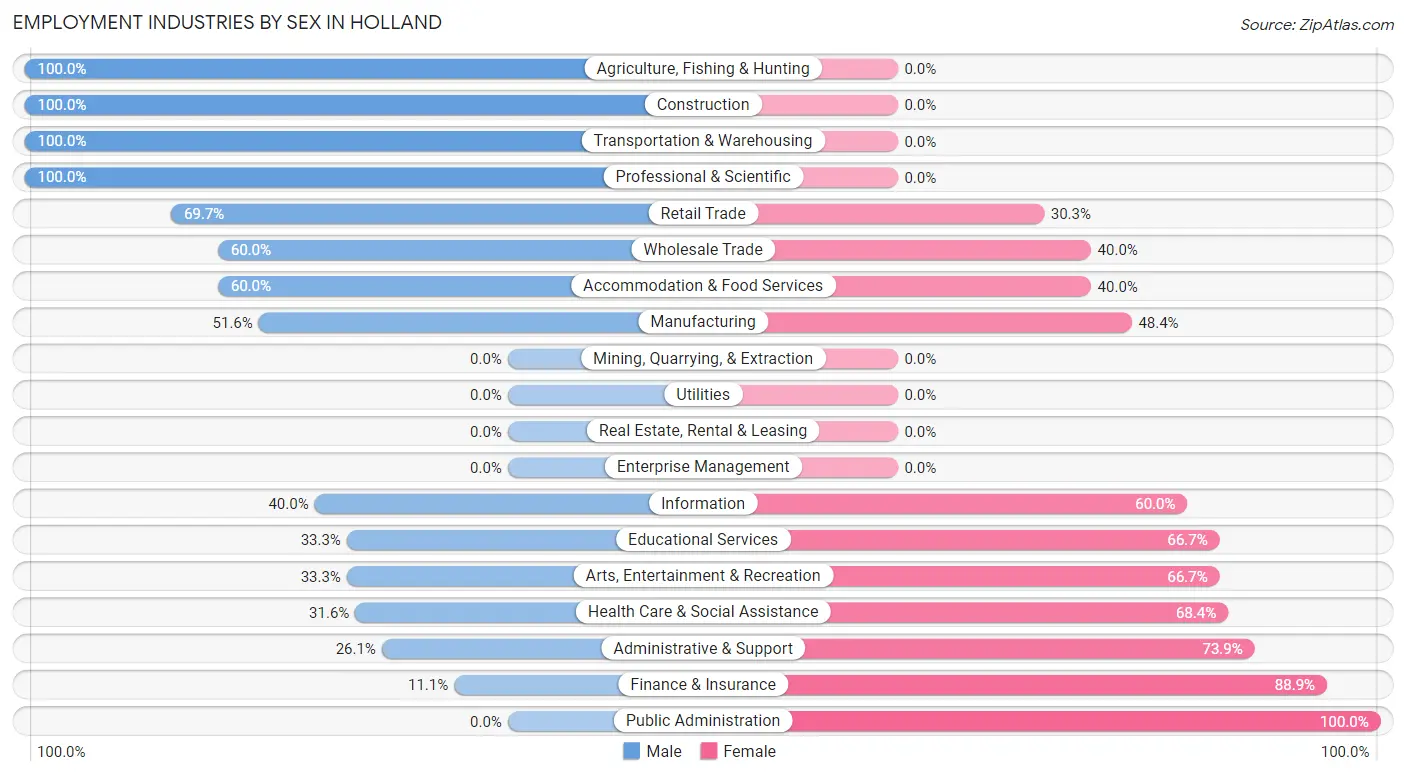
Employment Industries by Sex in Holland
The Holland industries that see more men than women are Agriculture, Fishing & Hunting (100.0%), Construction (100.0%), and Transportation & Warehousing (100.0%), whereas the industries that tend to have a higher number of women are Public Administration (100.0%), Finance & Insurance (88.9%), and Administrative & Support (73.9%).
| Industry | Male | Female |
| Agriculture, Fishing & Hunting | 6 (100.0%) | 0 (0.0%) |
| Mining, Quarrying, & Extraction | 0 (0.0%) | 0 (0.0%) |
| Construction | 6 (100.0%) | 0 (0.0%) |
| Manufacturing | 66 (51.6%) | 62 (48.4%) |
| Wholesale Trade | 3 (60.0%) | 2 (40.0%) |
| Retail Trade | 23 (69.7%) | 10 (30.3%) |
| Transportation & Warehousing | 1 (100.0%) | 0 (0.0%) |
| Utilities | 0 (0.0%) | 0 (0.0%) |
| Information | 2 (40.0%) | 3 (60.0%) |
| Finance & Insurance | 5 (11.1%) | 40 (88.9%) |
| Real Estate, Rental & Leasing | 0 (0.0%) | 0 (0.0%) |
| Professional & Scientific | 2 (100.0%) | 0 (0.0%) |
| Enterprise Management | 0 (0.0%) | 0 (0.0%) |
| Administrative & Support | 6 (26.1%) | 17 (73.9%) |
| Educational Services | 4 (33.3%) | 8 (66.7%) |
| Health Care & Social Assistance | 12 (31.6%) | 26 (68.4%) |
| Arts, Entertainment & Recreation | 2 (33.3%) | 4 (66.7%) |
| Accommodation & Food Services | 12 (60.0%) | 8 (40.0%) |
| Public Administration | 0 (0.0%) | 3 (100.0%) |
| Total | 156 (45.4%) | 188 (54.6%) |
Education in Holland
School Enrollment in Holland
The most common levels of schooling among the 110 students in Holland are high school (31 | 28.2%), elementary school (27 | 24.5%), and middle school (18 | 16.4%).
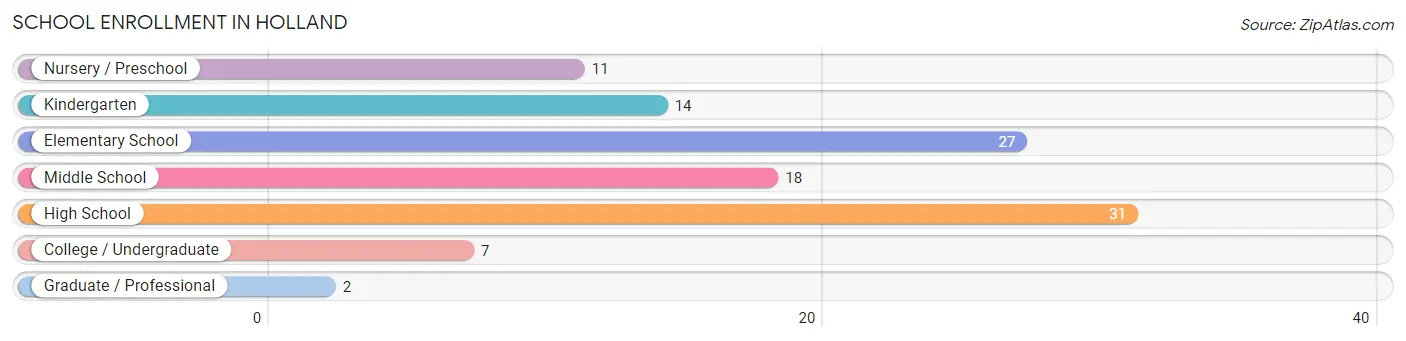
| School Level | # Students | % Students |
| Nursery / Preschool | 11 | 10.0% |
| Kindergarten | 14 | 12.7% |
| Elementary School | 27 | 24.5% |
| Middle School | 18 | 16.4% |
| High School | 31 | 28.2% |
| College / Undergraduate | 7 | 6.4% |
| Graduate / Professional | 2 | 1.8% |
| Total | 110 | 100.0% |
School Enrollment by Age by Funding Source in Holland
Out of a total of 110 students who are enrolled in schools in Holland, 4 (3.6%) attend a private institution, while the remaining 106 (96.4%) are enrolled in public schools. The age group of 25 to 34 year olds has the highest likelihood of being enrolled in private schools, with 2 (100.0% in the age bracket) enrolled. Conversely, the age group of 5 to 9 year old has the lowest likelihood of being enrolled in a private school, with 43 (100.0% in the age bracket) attending a public institution.
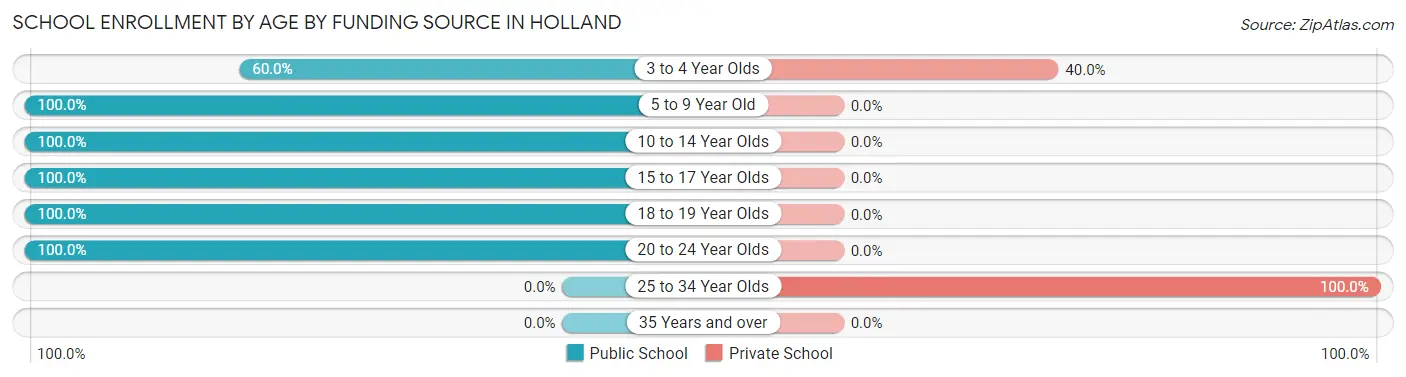
| Age Bracket | Public School | Private School |
| 3 to 4 Year Olds | 3 (60.0%) | 2 (40.0%) |
| 5 to 9 Year Old | 43 (100.0%) | 0 (0.0%) |
| 10 to 14 Year Olds | 22 (100.0%) | 0 (0.0%) |
| 15 to 17 Year Olds | 26 (100.0%) | 0 (0.0%) |
| 18 to 19 Year Olds | 7 (100.0%) | 0 (0.0%) |
| 20 to 24 Year Olds | 5 (100.0%) | 0 (0.0%) |
| 25 to 34 Year Olds | 0 (0.0%) | 2 (100.0%) |
| 35 Years and over | 0 (0.0%) | 0 (0.0%) |
| Total | 106 (96.4%) | 4 (3.6%) |
Educational Attainment by Field of Study in Holland
Science & technology (13 | 23.2%), education (11 | 19.6%), business (10 | 17.9%), liberal arts & history (7 | 12.5%), and arts & humanities (4 | 7.1%) are the most common fields of study among 56 individuals in Holland who have obtained a bachelor's degree or higher.
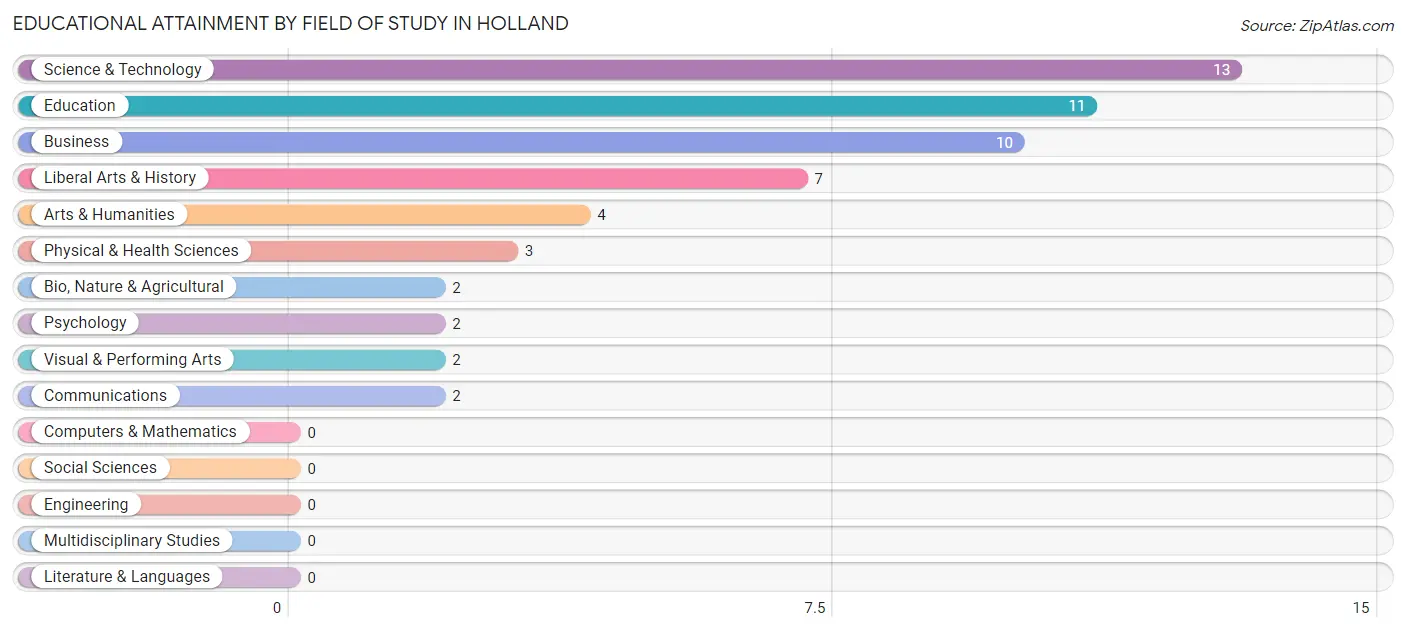
| Field of Study | # Graduates | % Graduates |
| Computers & Mathematics | 0 | 0.0% |
| Bio, Nature & Agricultural | 2 | 3.6% |
| Physical & Health Sciences | 3 | 5.4% |
| Psychology | 2 | 3.6% |
| Social Sciences | 0 | 0.0% |
| Engineering | 0 | 0.0% |
| Multidisciplinary Studies | 0 | 0.0% |
| Science & Technology | 13 | 23.2% |
| Business | 10 | 17.9% |
| Education | 11 | 19.6% |
| Literature & Languages | 0 | 0.0% |
| Liberal Arts & History | 7 | 12.5% |
| Visual & Performing Arts | 2 | 3.6% |
| Communications | 2 | 3.6% |
| Arts & Humanities | 4 | 7.1% |
| Total | 56 | 100.0% |
Transportation & Commute in Holland
Vehicle Availability by Sex in Holland
The most prevalent vehicle ownership categories in Holland are males with 2 vehicles (57, accounting for 37.8%) and females with 2 vehicles (95, making up 30.3%).
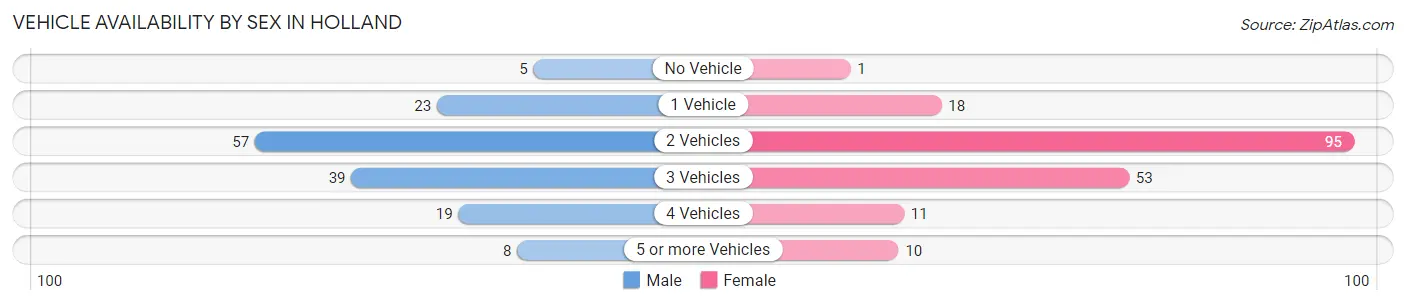
| Vehicles Available | Male | Female |
| No Vehicle | 5 (3.3%) | 1 (0.5%) |
| 1 Vehicle | 23 (15.2%) | 18 (9.6%) |
| 2 Vehicles | 57 (37.8%) | 95 (50.5%) |
| 3 Vehicles | 39 (25.8%) | 53 (28.2%) |
| 4 Vehicles | 19 (12.6%) | 11 (5.9%) |
| 5 or more Vehicles | 8 (5.3%) | 10 (5.3%) |
| Total | 151 (100.0%) | 188 (100.0%) |
Commute Time in Holland
The most frequently occuring commute durations in Holland are 15 to 19 minutes (77 commuters, 24.9%), 30 to 34 minutes (55 commuters, 17.8%), and 10 to 14 minutes (54 commuters, 17.5%).
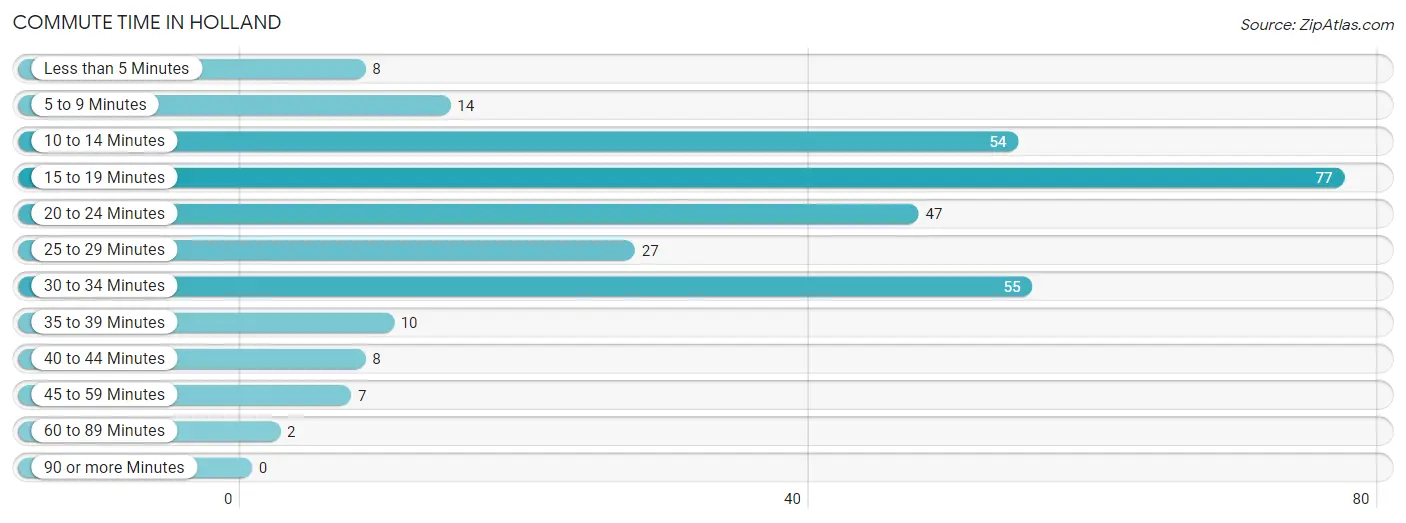
| Commute Time | # Commuters | % Commuters |
| Less than 5 Minutes | 8 | 2.6% |
| 5 to 9 Minutes | 14 | 4.5% |
| 10 to 14 Minutes | 54 | 17.5% |
| 15 to 19 Minutes | 77 | 24.9% |
| 20 to 24 Minutes | 47 | 15.2% |
| 25 to 29 Minutes | 27 | 8.7% |
| 30 to 34 Minutes | 55 | 17.8% |
| 35 to 39 Minutes | 10 | 3.2% |
| 40 to 44 Minutes | 8 | 2.6% |
| 45 to 59 Minutes | 7 | 2.3% |
| 60 to 89 Minutes | 2 | 0.6% |
| 90 or more Minutes | 0 | 0.0% |
Commute Time by Sex in Holland
The most common commute times in Holland are 10 to 14 minutes (50 commuters, 36.0%) for males and 15 to 19 minutes (56 commuters, 32.9%) for females.
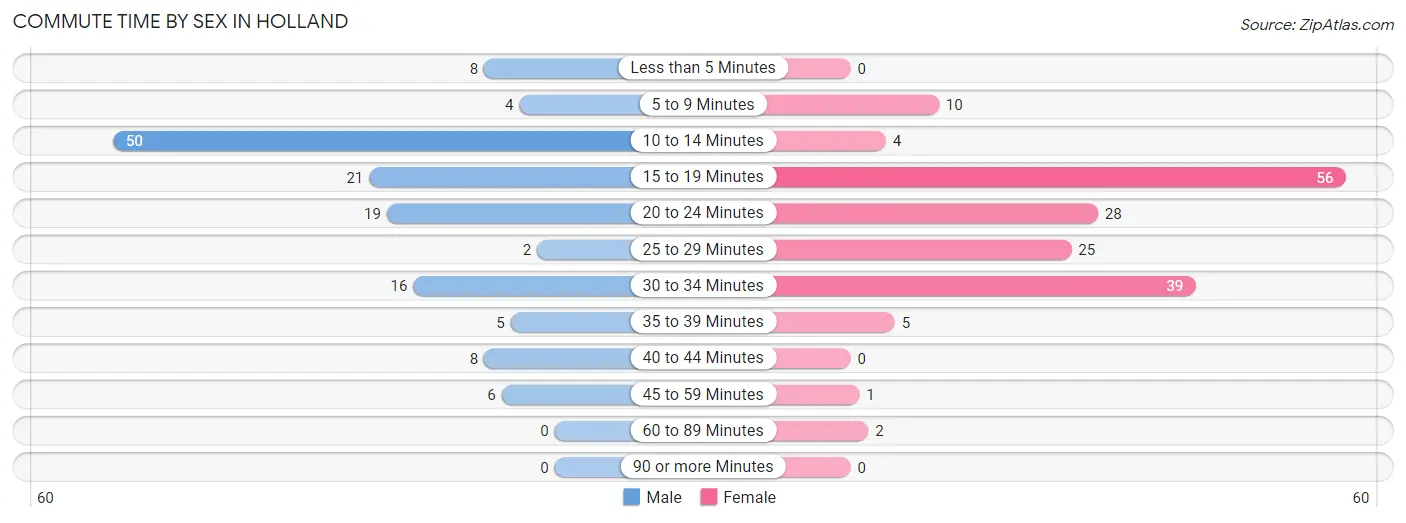
| Commute Time | Male | Female |
| Less than 5 Minutes | 8 (5.8%) | 0 (0.0%) |
| 5 to 9 Minutes | 4 (2.9%) | 10 (5.9%) |
| 10 to 14 Minutes | 50 (36.0%) | 4 (2.4%) |
| 15 to 19 Minutes | 21 (15.1%) | 56 (32.9%) |
| 20 to 24 Minutes | 19 (13.7%) | 28 (16.5%) |
| 25 to 29 Minutes | 2 (1.4%) | 25 (14.7%) |
| 30 to 34 Minutes | 16 (11.5%) | 39 (22.9%) |
| 35 to 39 Minutes | 5 (3.6%) | 5 (2.9%) |
| 40 to 44 Minutes | 8 (5.8%) | 0 (0.0%) |
| 45 to 59 Minutes | 6 (4.3%) | 1 (0.6%) |
| 60 to 89 Minutes | 0 (0.0%) | 2 (1.2%) |
| 90 or more Minutes | 0 (0.0%) | 0 (0.0%) |
Time of Departure to Work by Sex in Holland
The most frequent times of departure to work in Holland are 4:00 PM to 11:59 PM (37, 26.6%) for males and 4:00 PM to 11:59 PM (46, 27.1%) for females.
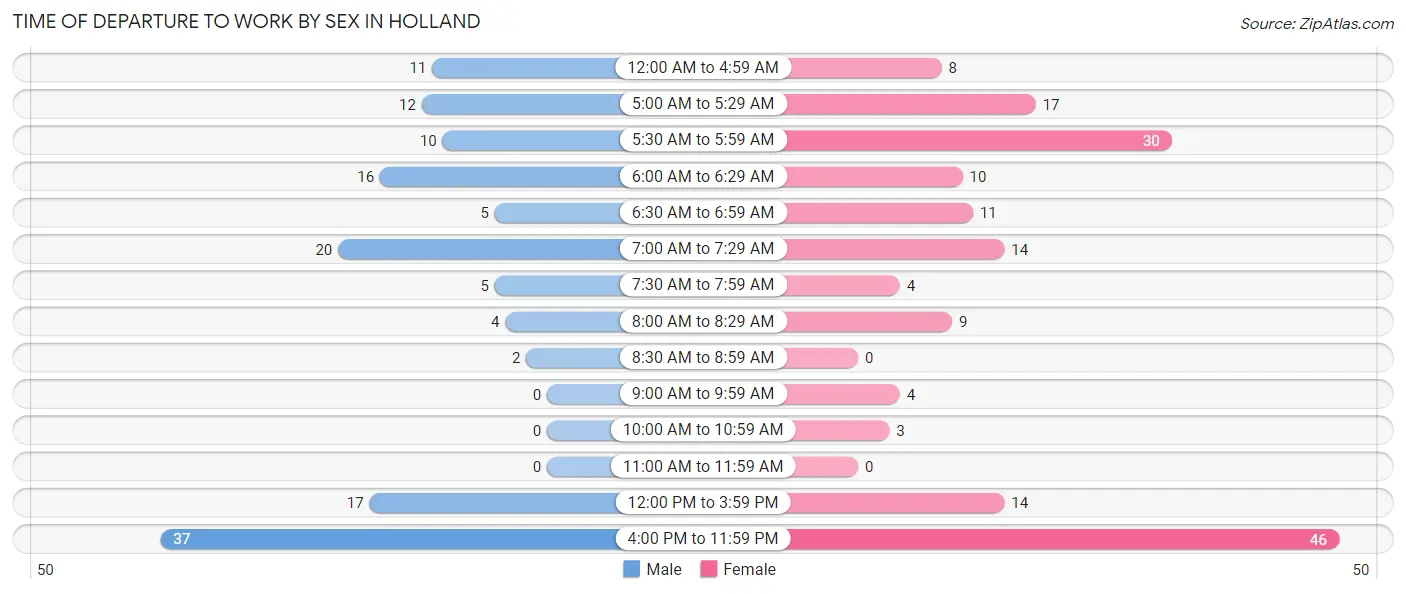
| Time of Departure | Male | Female |
| 12:00 AM to 4:59 AM | 11 (7.9%) | 8 (4.7%) |
| 5:00 AM to 5:29 AM | 12 (8.6%) | 17 (10.0%) |
| 5:30 AM to 5:59 AM | 10 (7.2%) | 30 (17.6%) |
| 6:00 AM to 6:29 AM | 16 (11.5%) | 10 (5.9%) |
| 6:30 AM to 6:59 AM | 5 (3.6%) | 11 (6.5%) |
| 7:00 AM to 7:29 AM | 20 (14.4%) | 14 (8.2%) |
| 7:30 AM to 7:59 AM | 5 (3.6%) | 4 (2.4%) |
| 8:00 AM to 8:29 AM | 4 (2.9%) | 9 (5.3%) |
| 8:30 AM to 8:59 AM | 2 (1.4%) | 0 (0.0%) |
| 9:00 AM to 9:59 AM | 0 (0.0%) | 4 (2.4%) |
| 10:00 AM to 10:59 AM | 0 (0.0%) | 3 (1.8%) |
| 11:00 AM to 11:59 AM | 0 (0.0%) | 0 (0.0%) |
| 12:00 PM to 3:59 PM | 17 (12.2%) | 14 (8.2%) |
| 4:00 PM to 11:59 PM | 37 (26.6%) | 46 (27.1%) |
| Total | 139 (100.0%) | 170 (100.0%) |
Housing Occupancy in Holland
Occupancy by Ownership in Holland
Of the total 228 dwellings in Holland, owner-occupied units account for 175 (76.7%), while renter-occupied units make up 53 (23.3%).
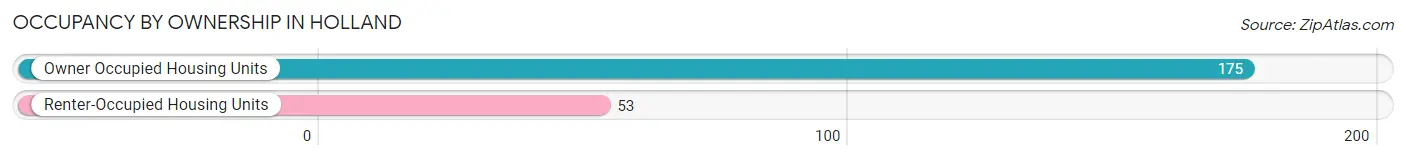
| Occupancy | # Housing Units | % Housing Units |
| Owner Occupied Housing Units | 175 | 76.7% |
| Renter-Occupied Housing Units | 53 | 23.3% |
| Total Occupied Housing Units | 228 | 100.0% |
Occupancy by Household Size in Holland
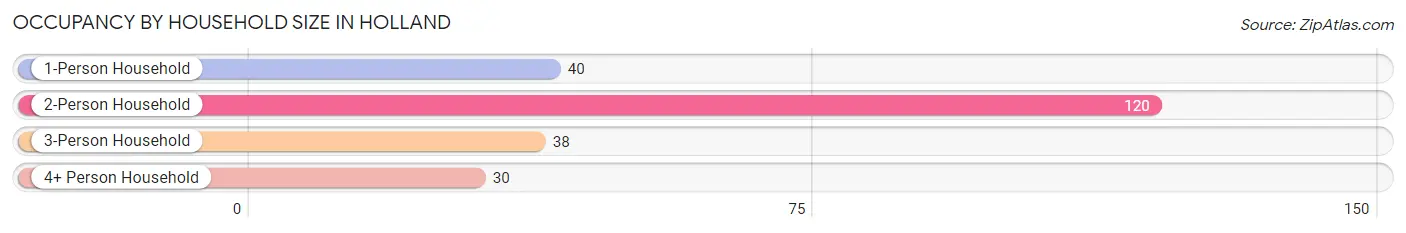
| Household Size | # Housing Units | % Housing Units |
| 1-Person Household | 40 | 17.5% |
| 2-Person Household | 120 | 52.6% |
| 3-Person Household | 38 | 16.7% |
| 4+ Person Household | 30 | 13.2% |
| Total Housing Units | 228 | 100.0% |
Occupancy by Ownership by Household Size in Holland
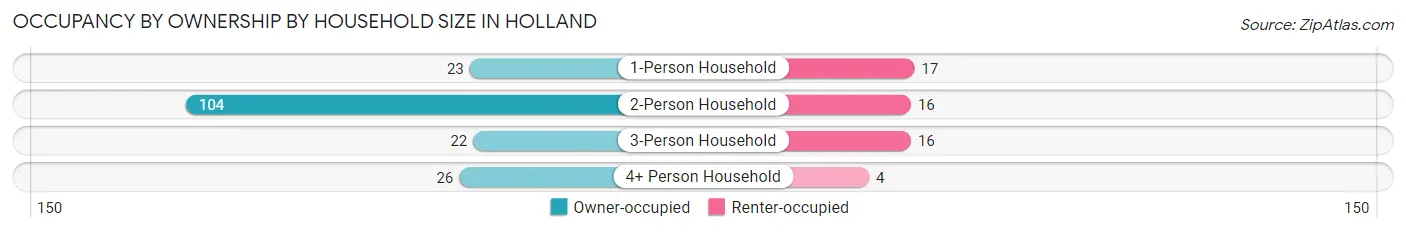
| Household Size | Owner-occupied | Renter-occupied |
| 1-Person Household | 23 (57.5%) | 17 (42.5%) |
| 2-Person Household | 104 (86.7%) | 16 (13.3%) |
| 3-Person Household | 22 (57.9%) | 16 (42.1%) |
| 4+ Person Household | 26 (86.7%) | 4 (13.3%) |
| Total Housing Units | 175 (76.7%) | 53 (23.3%) |
Occupancy by Educational Attainment in Holland
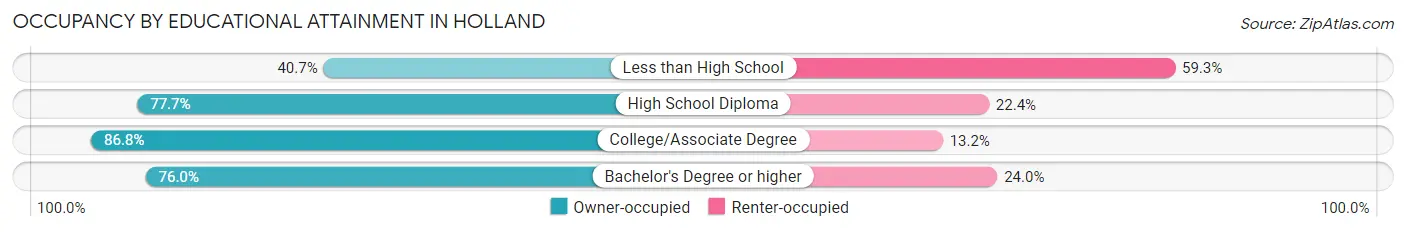
| Household Size | Owner-occupied | Renter-occupied |
| Less than High School | 11 (40.7%) | 16 (59.3%) |
| High School Diploma | 66 (77.6%) | 19 (22.4%) |
| College/Associate Degree | 79 (86.8%) | 12 (13.2%) |
| Bachelor's Degree or higher | 19 (76.0%) | 6 (24.0%) |
Occupancy by Age of Householder in Holland
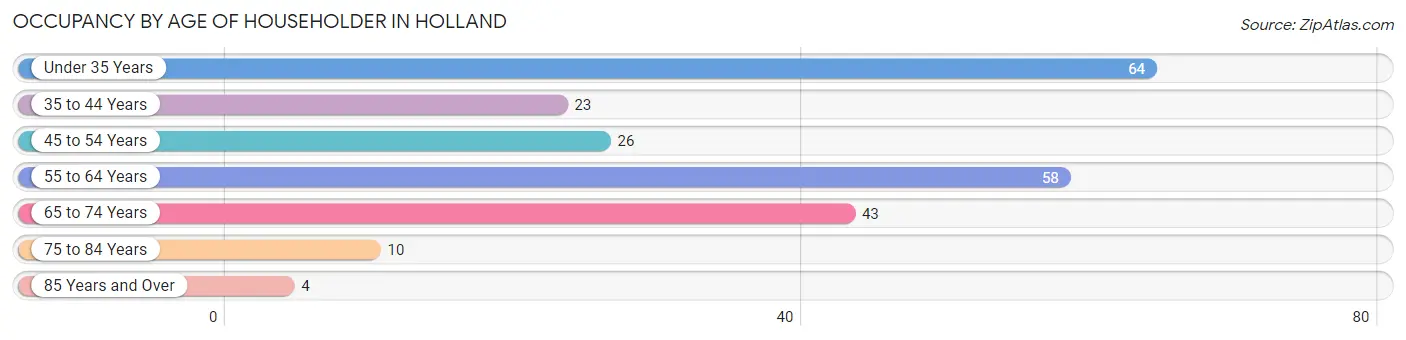
| Age Bracket | # Households | % Households |
| Under 35 Years | 64 | 28.1% |
| 35 to 44 Years | 23 | 10.1% |
| 45 to 54 Years | 26 | 11.4% |
| 55 to 64 Years | 58 | 25.4% |
| 65 to 74 Years | 43 | 18.9% |
| 75 to 84 Years | 10 | 4.4% |
| 85 Years and Over | 4 | 1.8% |
| Total | 228 | 100.0% |
Housing Finances in Holland
Median Income by Occupancy in Holland
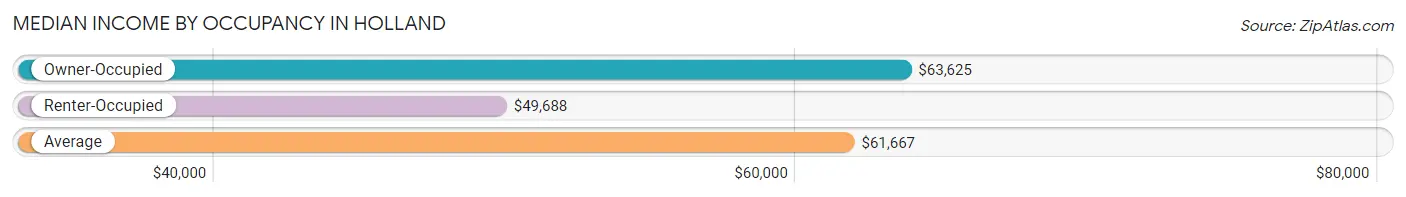
| Occupancy Type | # Households | Median Income |
| Owner-Occupied | 175 (76.7%) | $63,625 |
| Renter-Occupied | 53 (23.3%) | $49,688 |
| Average | 228 (100.0%) | $61,667 |
Occupancy by Householder Income Bracket in Holland
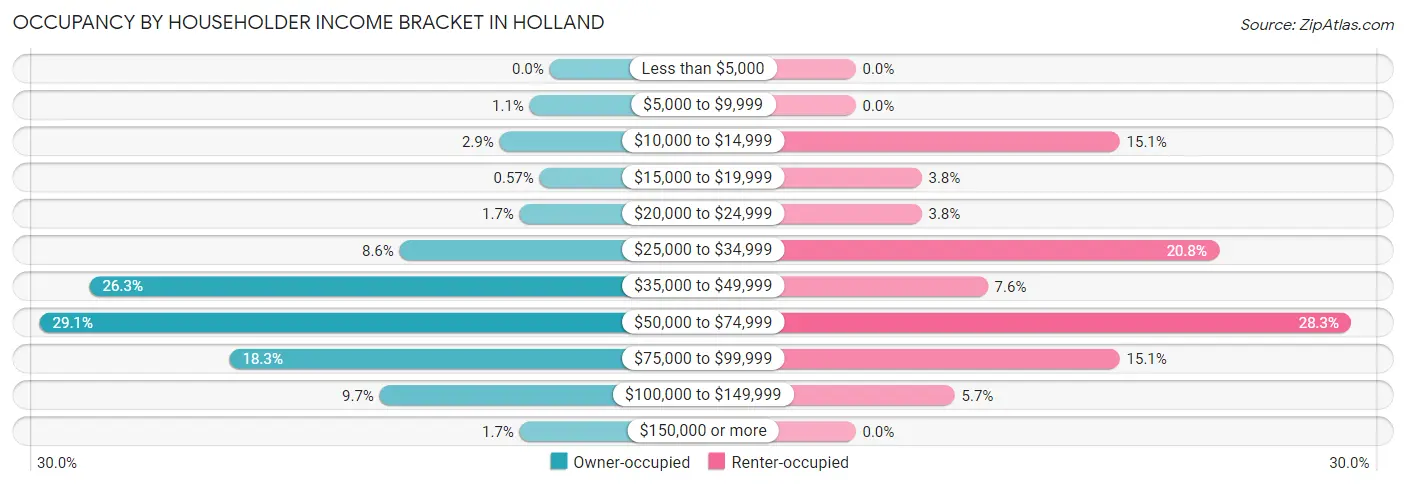
| Income Bracket | Owner-occupied | Renter-occupied |
| Less than $5,000 | 0 (0.0%) | 0 (0.0%) |
| $5,000 to $9,999 | 2 (1.1%) | 0 (0.0%) |
| $10,000 to $14,999 | 5 (2.9%) | 8 (15.1%) |
| $15,000 to $19,999 | 1 (0.6%) | 2 (3.8%) |
| $20,000 to $24,999 | 3 (1.7%) | 2 (3.8%) |
| $25,000 to $34,999 | 15 (8.6%) | 11 (20.7%) |
| $35,000 to $49,999 | 46 (26.3%) | 4 (7.5%) |
| $50,000 to $74,999 | 51 (29.1%) | 15 (28.3%) |
| $75,000 to $99,999 | 32 (18.3%) | 8 (15.1%) |
| $100,000 to $149,999 | 17 (9.7%) | 3 (5.7%) |
| $150,000 or more | 3 (1.7%) | 0 (0.0%) |
| Total | 175 (100.0%) | 53 (100.0%) |
Monthly Housing Cost Tiers in Holland
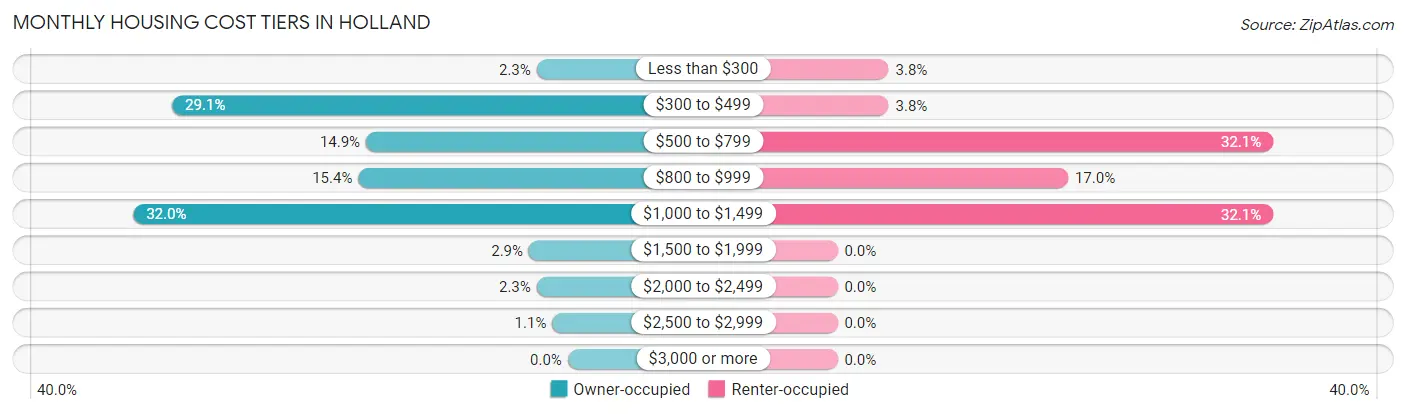
| Monthly Cost | Owner-occupied | Renter-occupied |
| Less than $300 | 4 (2.3%) | 2 (3.8%) |
| $300 to $499 | 51 (29.1%) | 2 (3.8%) |
| $500 to $799 | 26 (14.9%) | 17 (32.1%) |
| $800 to $999 | 27 (15.4%) | 9 (17.0%) |
| $1,000 to $1,499 | 56 (32.0%) | 17 (32.1%) |
| $1,500 to $1,999 | 5 (2.9%) | 0 (0.0%) |
| $2,000 to $2,499 | 4 (2.3%) | 0 (0.0%) |
| $2,500 to $2,999 | 2 (1.1%) | 0 (0.0%) |
| $3,000 or more | 0 (0.0%) | 0 (0.0%) |
| Total | 175 (100.0%) | 53 (100.0%) |
Physical Housing Characteristics in Holland
Housing Structures in Holland
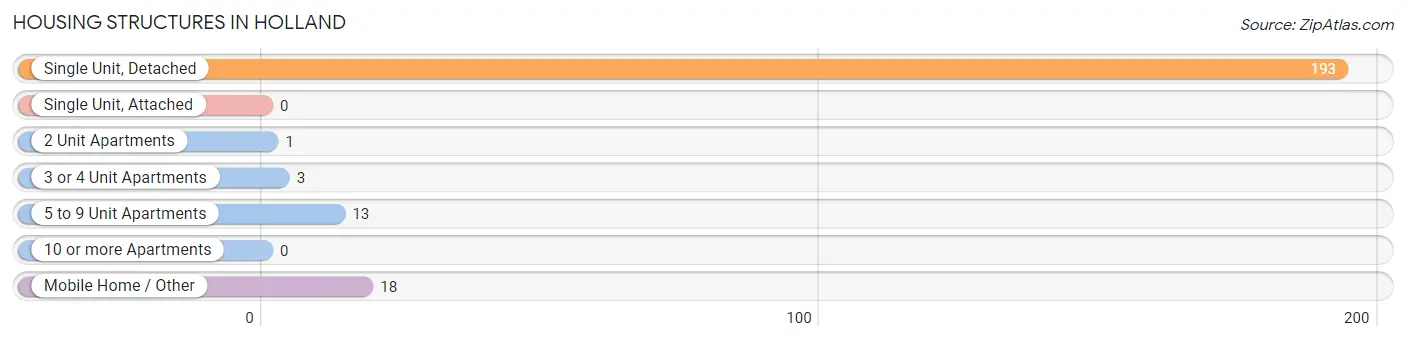
| Structure Type | # Housing Units | % Housing Units |
| Single Unit, Detached | 193 | 84.7% |
| Single Unit, Attached | 0 | 0.0% |
| 2 Unit Apartments | 1 | 0.4% |
| 3 or 4 Unit Apartments | 3 | 1.3% |
| 5 to 9 Unit Apartments | 13 | 5.7% |
| 10 or more Apartments | 0 | 0.0% |
| Mobile Home / Other | 18 | 7.9% |
| Total | 228 | 100.0% |
Housing Structures by Occupancy in Holland
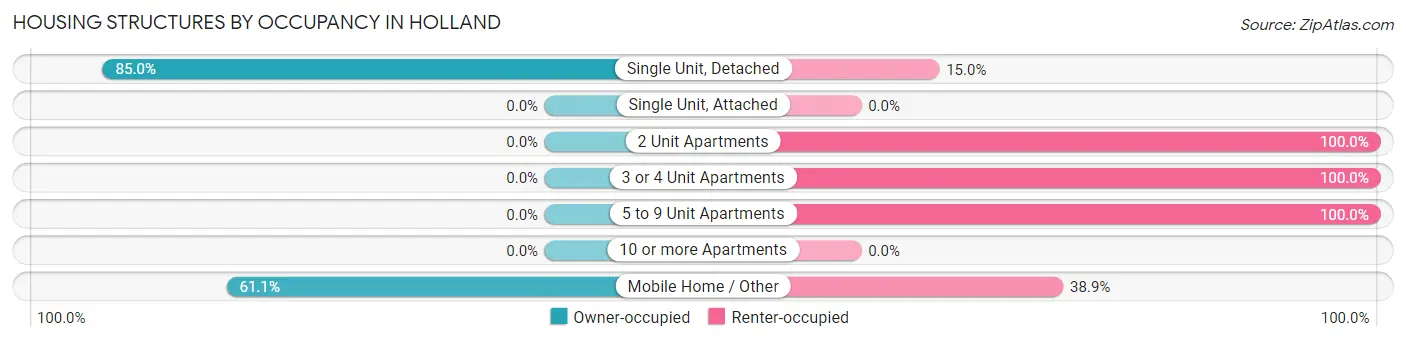
| Structure Type | Owner-occupied | Renter-occupied |
| Single Unit, Detached | 164 (85.0%) | 29 (15.0%) |
| Single Unit, Attached | 0 (0.0%) | 0 (0.0%) |
| 2 Unit Apartments | 0 (0.0%) | 1 (100.0%) |
| 3 or 4 Unit Apartments | 0 (0.0%) | 3 (100.0%) |
| 5 to 9 Unit Apartments | 0 (0.0%) | 13 (100.0%) |
| 10 or more Apartments | 0 (0.0%) | 0 (0.0%) |
| Mobile Home / Other | 11 (61.1%) | 7 (38.9%) |
| Total | 175 (76.7%) | 53 (23.3%) |
Housing Structures by Number of Rooms in Holland
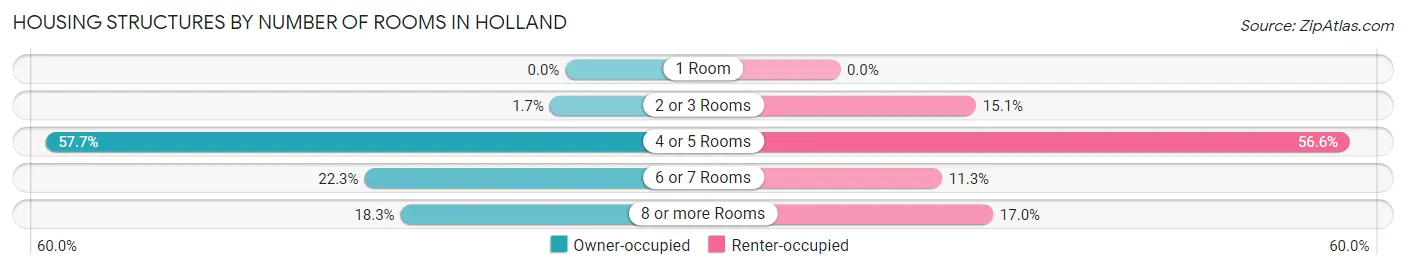
| Number of Rooms | Owner-occupied | Renter-occupied |
| 1 Room | 0 (0.0%) | 0 (0.0%) |
| 2 or 3 Rooms | 3 (1.7%) | 8 (15.1%) |
| 4 or 5 Rooms | 101 (57.7%) | 30 (56.6%) |
| 6 or 7 Rooms | 39 (22.3%) | 6 (11.3%) |
| 8 or more Rooms | 32 (18.3%) | 9 (17.0%) |
| Total | 175 (100.0%) | 53 (100.0%) |
Housing Structure by Heating Type in Holland
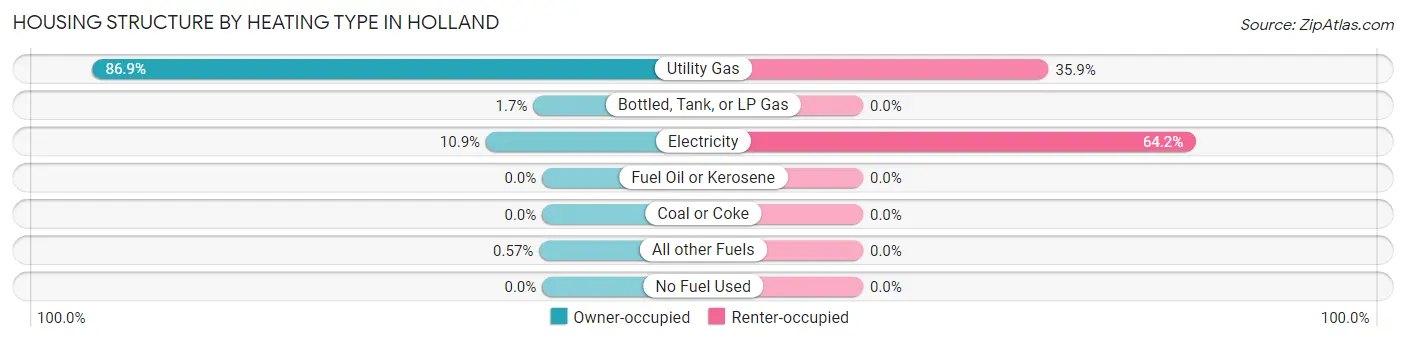
| Heating Type | Owner-occupied | Renter-occupied |
| Utility Gas | 152 (86.9%) | 19 (35.8%) |
| Bottled, Tank, or LP Gas | 3 (1.7%) | 0 (0.0%) |
| Electricity | 19 (10.9%) | 34 (64.1%) |
| Fuel Oil or Kerosene | 0 (0.0%) | 0 (0.0%) |
| Coal or Coke | 0 (0.0%) | 0 (0.0%) |
| All other Fuels | 1 (0.6%) | 0 (0.0%) |
| No Fuel Used | 0 (0.0%) | 0 (0.0%) |
| Total | 175 (100.0%) | 53 (100.0%) |
Household Vehicle Usage in Holland
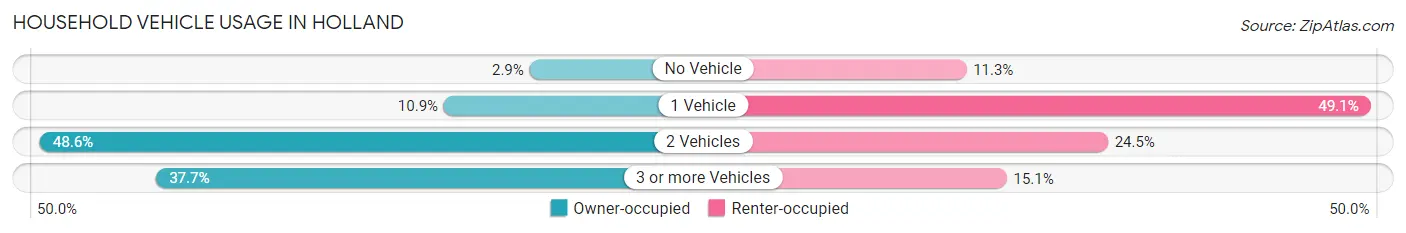
| Vehicles per Household | Owner-occupied | Renter-occupied |
| No Vehicle | 5 (2.9%) | 6 (11.3%) |
| 1 Vehicle | 19 (10.9%) | 26 (49.1%) |
| 2 Vehicles | 85 (48.6%) | 13 (24.5%) |
| 3 or more Vehicles | 66 (37.7%) | 8 (15.1%) |
| Total | 175 (100.0%) | 53 (100.0%) |
Real Estate & Mortgages in Holland
Real Estate and Mortgage Overview in Holland
| Characteristic | Without Mortgage | With Mortgage |
| Housing Units | 65 | 110 |
| Median Property Value | $104,400 | $109,600 |
| Median Household Income | $48,750 | $3 |
| Monthly Housing Costs | $358 | $0 |
| Real Estate Taxes | $563 | $2 |
Property Value by Mortgage Status in Holland
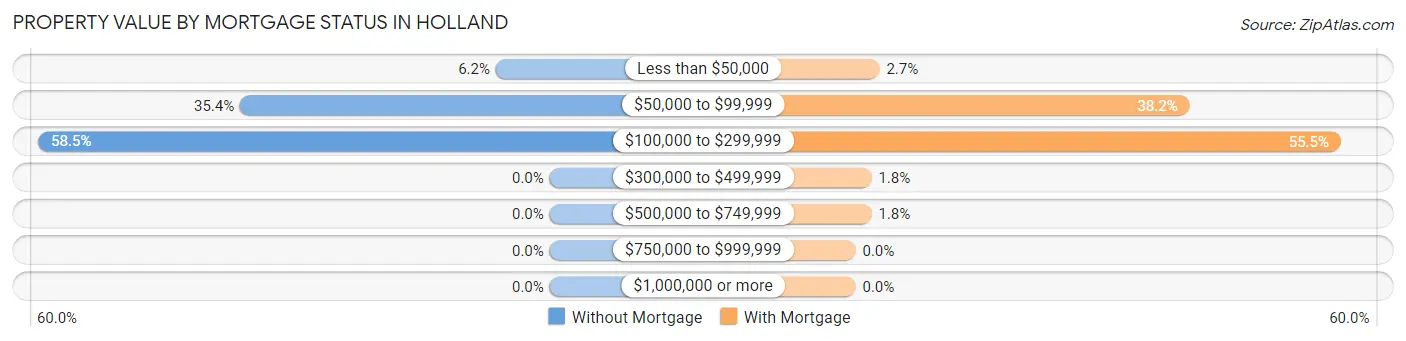
| Property Value | Without Mortgage | With Mortgage |
| Less than $50,000 | 4 (6.1%) | 3 (2.7%) |
| $50,000 to $99,999 | 23 (35.4%) | 42 (38.2%) |
| $100,000 to $299,999 | 38 (58.5%) | 61 (55.4%) |
| $300,000 to $499,999 | 0 (0.0%) | 2 (1.8%) |
| $500,000 to $749,999 | 0 (0.0%) | 2 (1.8%) |
| $750,000 to $999,999 | 0 (0.0%) | 0 (0.0%) |
| $1,000,000 or more | 0 (0.0%) | 0 (0.0%) |
| Total | 65 (100.0%) | 110 (100.0%) |
Household Income by Mortgage Status in Holland
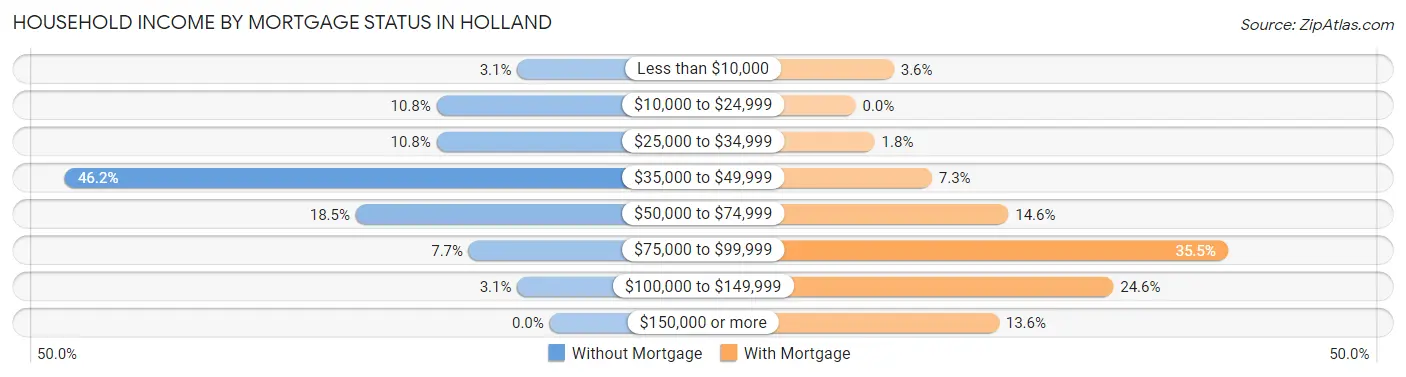
| Household Income | Without Mortgage | With Mortgage |
| Less than $10,000 | 2 (3.1%) | 4 (3.6%) |
| $10,000 to $24,999 | 7 (10.8%) | 0 (0.0%) |
| $25,000 to $34,999 | 7 (10.8%) | 2 (1.8%) |
| $35,000 to $49,999 | 30 (46.2%) | 8 (7.3%) |
| $50,000 to $74,999 | 12 (18.5%) | 16 (14.5%) |
| $75,000 to $99,999 | 5 (7.7%) | 39 (35.4%) |
| $100,000 to $149,999 | 2 (3.1%) | 27 (24.5%) |
| $150,000 or more | 0 (0.0%) | 15 (13.6%) |
| Total | 65 (100.0%) | 110 (100.0%) |
Property Value to Household Income Ratio in Holland
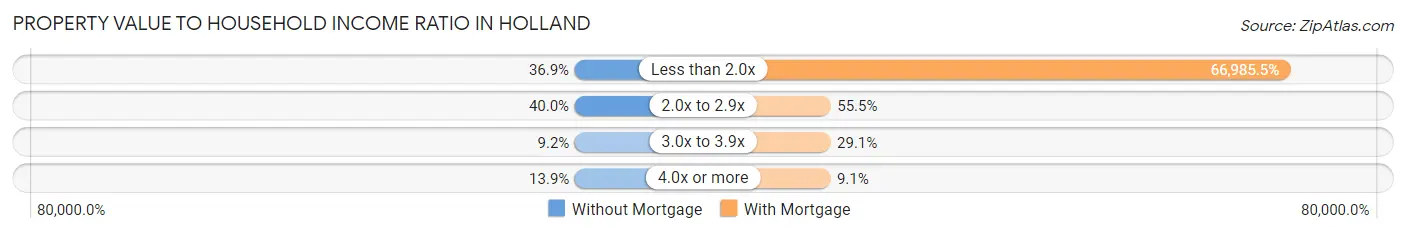
| Value-to-Income Ratio | Without Mortgage | With Mortgage |
| Less than 2.0x | 24 (36.9%) | 73,684 (66,985.5%) |
| 2.0x to 2.9x | 26 (40.0%) | 61 (55.4%) |
| 3.0x to 3.9x | 6 (9.2%) | 32 (29.1%) |
| 4.0x or more | 9 (13.9%) | 10 (9.1%) |
| Total | 65 (100.0%) | 110 (100.0%) |
Real Estate Taxes by Mortgage Status in Holland
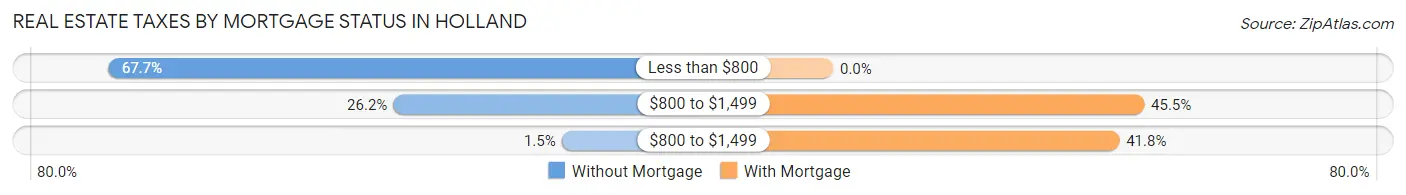
| Property Taxes | Without Mortgage | With Mortgage |
| Less than $800 | 44 (67.7%) | 0 (0.0%) |
| $800 to $1,499 | 17 (26.2%) | 50 (45.5%) |
| $800 to $1,499 | 1 (1.5%) | 46 (41.8%) |
| Total | 65 (100.0%) | 110 (100.0%) |
Health & Disability in Holland
Health Insurance Coverage by Age in Holland
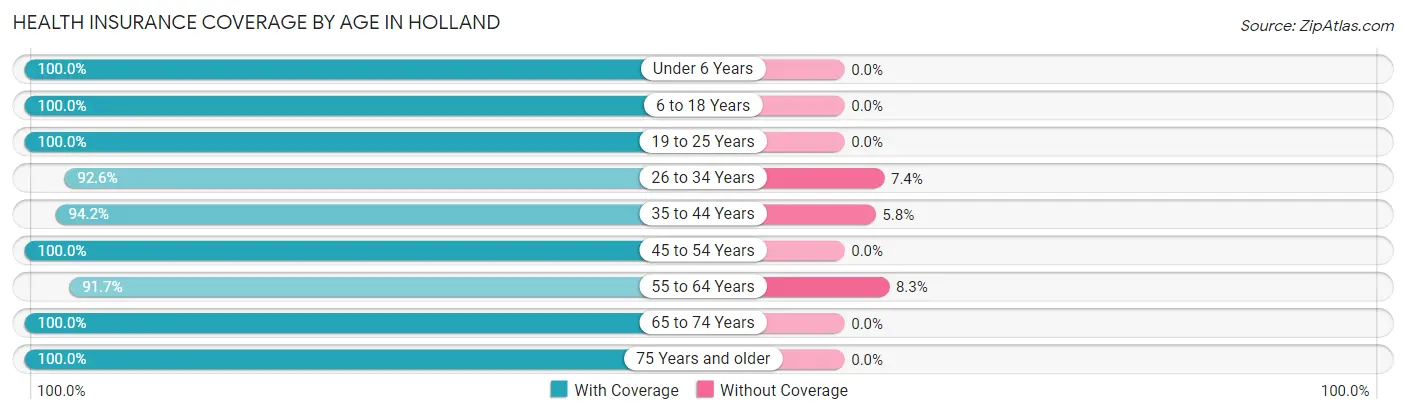
| Age Bracket | With Coverage | Without Coverage |
| Under 6 Years | 64 (100.0%) | 0 (0.0%) |
| 6 to 18 Years | 77 (100.0%) | 0 (0.0%) |
| 19 to 25 Years | 29 (100.0%) | 0 (0.0%) |
| 26 to 34 Years | 125 (92.6%) | 10 (7.4%) |
| 35 to 44 Years | 65 (94.2%) | 4 (5.8%) |
| 45 to 54 Years | 49 (100.0%) | 0 (0.0%) |
| 55 to 64 Years | 77 (91.7%) | 7 (8.3%) |
| 65 to 74 Years | 82 (100.0%) | 0 (0.0%) |
| 75 Years and older | 23 (100.0%) | 0 (0.0%) |
| Total | 591 (96.6%) | 21 (3.4%) |
Health Insurance Coverage by Citizenship Status in Holland
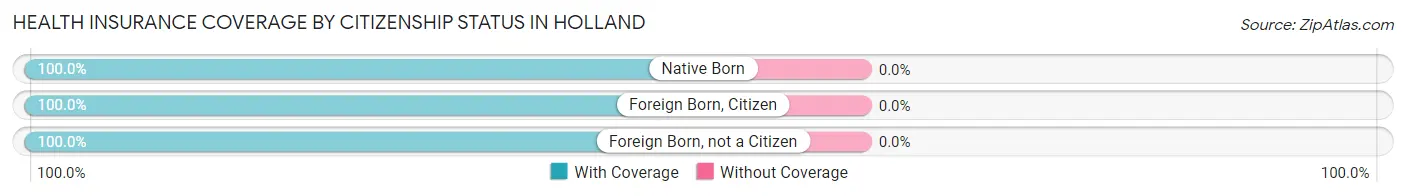
| Citizenship Status | With Coverage | Without Coverage |
| Native Born | 64 (100.0%) | 0 (0.0%) |
| Foreign Born, Citizen | 77 (100.0%) | 0 (0.0%) |
| Foreign Born, not a Citizen | 29 (100.0%) | 0 (0.0%) |
Health Insurance Coverage by Household Income in Holland
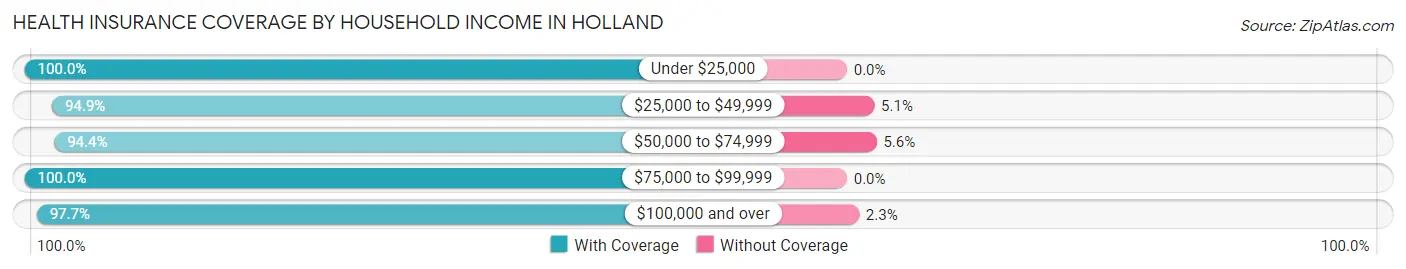
| Household Income | With Coverage | Without Coverage |
| Under $25,000 | 41 (100.0%) | 0 (0.0%) |
| $25,000 to $49,999 | 148 (94.9%) | 8 (5.1%) |
| $50,000 to $74,999 | 187 (94.4%) | 11 (5.6%) |
| $75,000 to $99,999 | 129 (100.0%) | 0 (0.0%) |
| $100,000 and over | 86 (97.7%) | 2 (2.3%) |
Public vs Private Health Insurance Coverage by Age in Holland
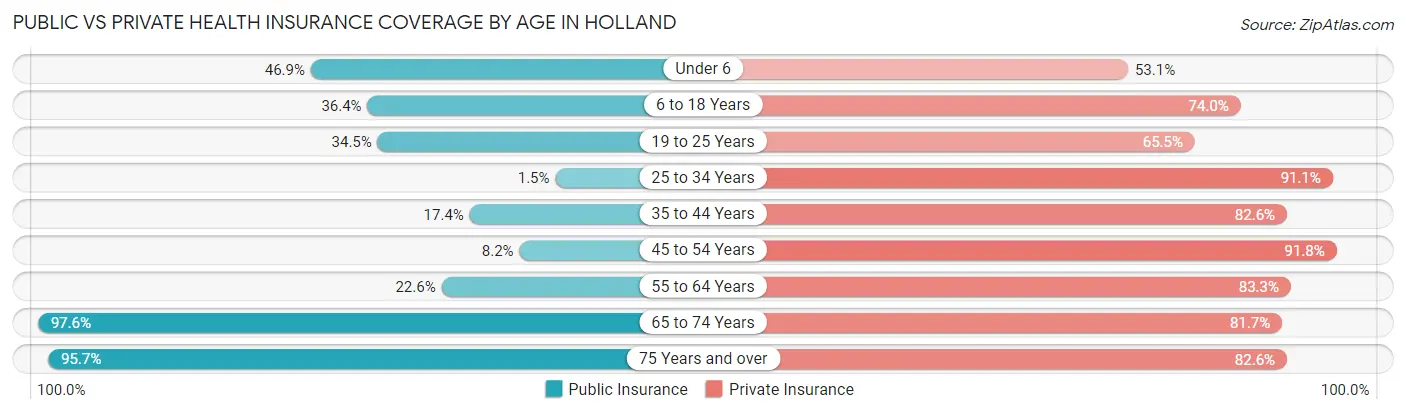
| Age Bracket | Public Insurance | Private Insurance |
| Under 6 | 30 (46.9%) | 34 (53.1%) |
| 6 to 18 Years | 28 (36.4%) | 57 (74.0%) |
| 19 to 25 Years | 10 (34.5%) | 19 (65.5%) |
| 25 to 34 Years | 2 (1.5%) | 123 (91.1%) |
| 35 to 44 Years | 12 (17.4%) | 57 (82.6%) |
| 45 to 54 Years | 4 (8.2%) | 45 (91.8%) |
| 55 to 64 Years | 19 (22.6%) | 70 (83.3%) |
| 65 to 74 Years | 80 (97.6%) | 67 (81.7%) |
| 75 Years and over | 22 (95.7%) | 19 (82.6%) |
| Total | 207 (33.8%) | 491 (80.2%) |
Disability Status by Sex by Age in Holland
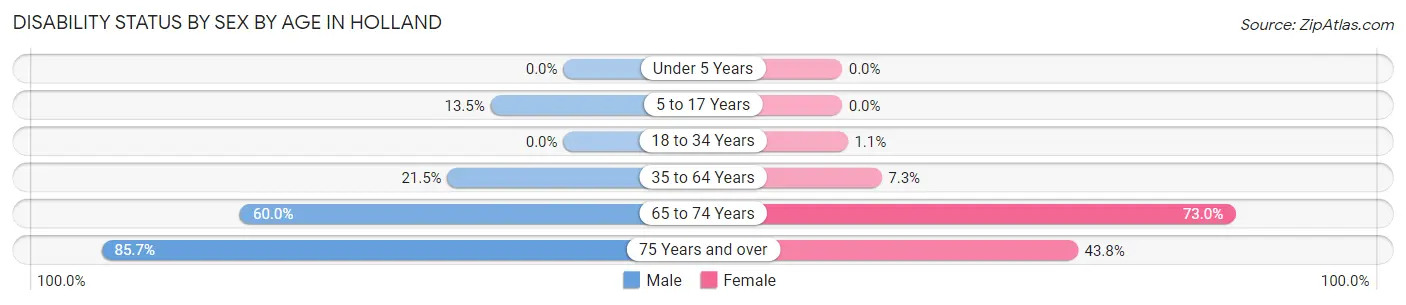
| Age Bracket | Male | Female |
| Under 5 Years | 0 (0.0%) | 0 (0.0%) |
| 5 to 17 Years | 5 (13.5%) | 0 (0.0%) |
| 18 to 34 Years | 0 (0.0%) | 1 (1.1%) |
| 35 to 64 Years | 20 (21.5%) | 8 (7.3%) |
| 65 to 74 Years | 27 (60.0%) | 27 (73.0%) |
| 75 Years and over | 6 (85.7%) | 7 (43.8%) |
Disability Class by Sex by Age in Holland
Disability Class: Hearing Difficulty
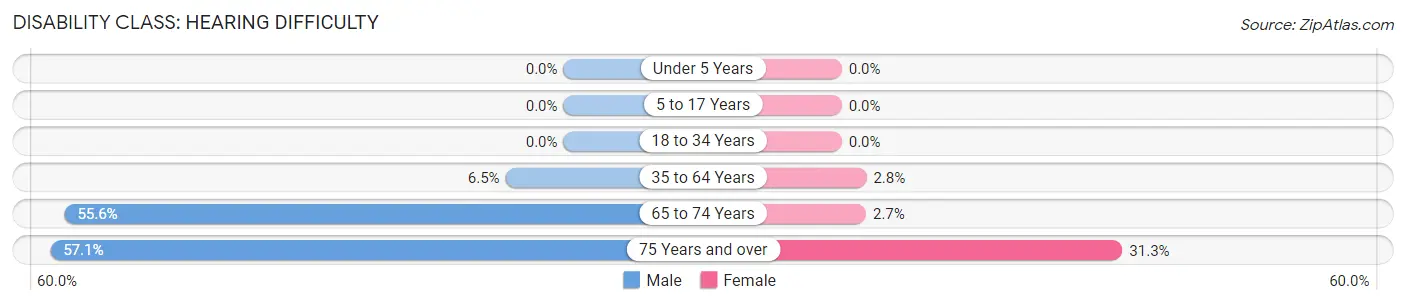
| Age Bracket | Male | Female |
| Under 5 Years | 0 (0.0%) | 0 (0.0%) |
| 5 to 17 Years | 0 (0.0%) | 0 (0.0%) |
| 18 to 34 Years | 0 (0.0%) | 0 (0.0%) |
| 35 to 64 Years | 6 (6.5%) | 3 (2.8%) |
| 65 to 74 Years | 25 (55.6%) | 1 (2.7%) |
| 75 Years and over | 4 (57.1%) | 5 (31.2%) |
Disability Class: Vision Difficulty
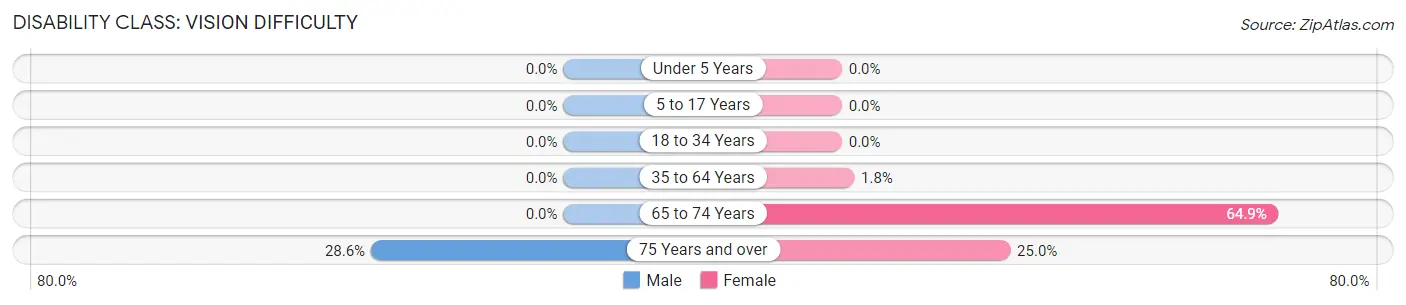
| Age Bracket | Male | Female |
| Under 5 Years | 0 (0.0%) | 0 (0.0%) |
| 5 to 17 Years | 0 (0.0%) | 0 (0.0%) |
| 18 to 34 Years | 0 (0.0%) | 0 (0.0%) |
| 35 to 64 Years | 0 (0.0%) | 2 (1.8%) |
| 65 to 74 Years | 0 (0.0%) | 24 (64.9%) |
| 75 Years and over | 2 (28.6%) | 4 (25.0%) |
Disability Class: Cognitive Difficulty
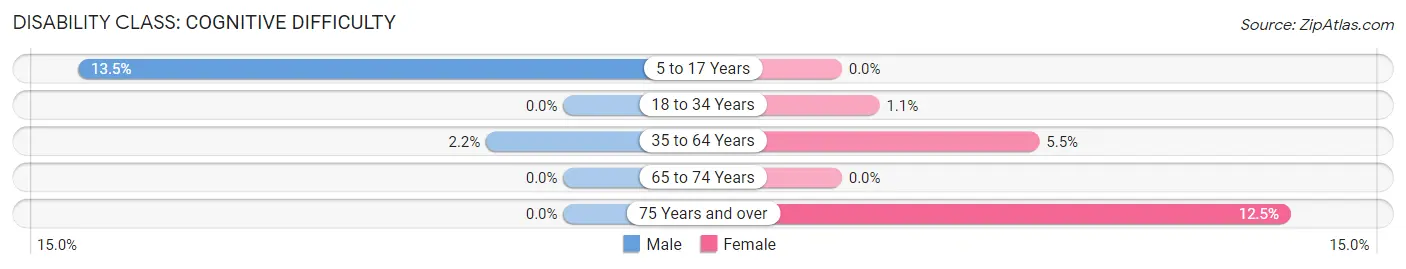
| Age Bracket | Male | Female |
| 5 to 17 Years | 5 (13.5%) | 0 (0.0%) |
| 18 to 34 Years | 0 (0.0%) | 1 (1.1%) |
| 35 to 64 Years | 2 (2.1%) | 6 (5.5%) |
| 65 to 74 Years | 0 (0.0%) | 0 (0.0%) |
| 75 Years and over | 0 (0.0%) | 2 (12.5%) |
Disability Class: Ambulatory Difficulty
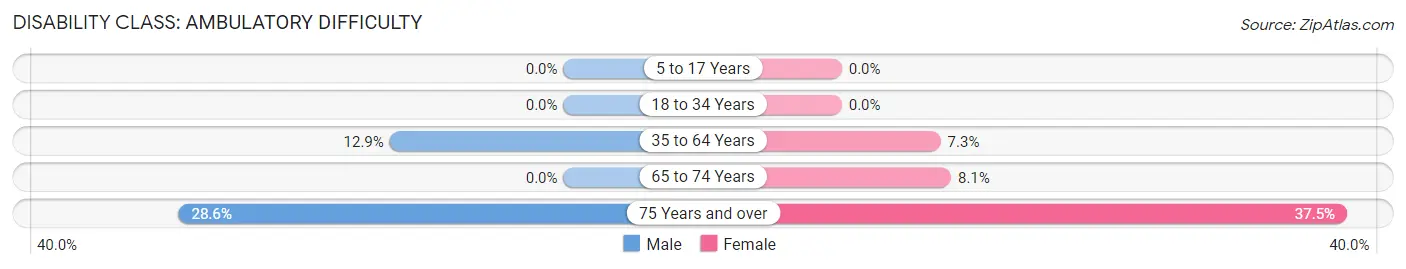
| Age Bracket | Male | Female |
| 5 to 17 Years | 0 (0.0%) | 0 (0.0%) |
| 18 to 34 Years | 0 (0.0%) | 0 (0.0%) |
| 35 to 64 Years | 12 (12.9%) | 8 (7.3%) |
| 65 to 74 Years | 0 (0.0%) | 3 (8.1%) |
| 75 Years and over | 2 (28.6%) | 6 (37.5%) |
Disability Class: Self-Care Difficulty
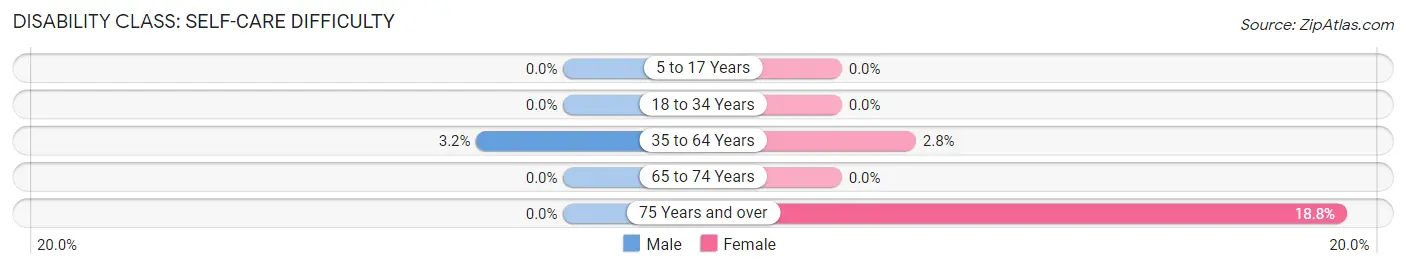
| Age Bracket | Male | Female |
| 5 to 17 Years | 0 (0.0%) | 0 (0.0%) |
| 18 to 34 Years | 0 (0.0%) | 0 (0.0%) |
| 35 to 64 Years | 3 (3.2%) | 3 (2.8%) |
| 65 to 74 Years | 0 (0.0%) | 0 (0.0%) |
| 75 Years and over | 0 (0.0%) | 3 (18.8%) |
Technology Access in Holland
Computing Device Access in Holland
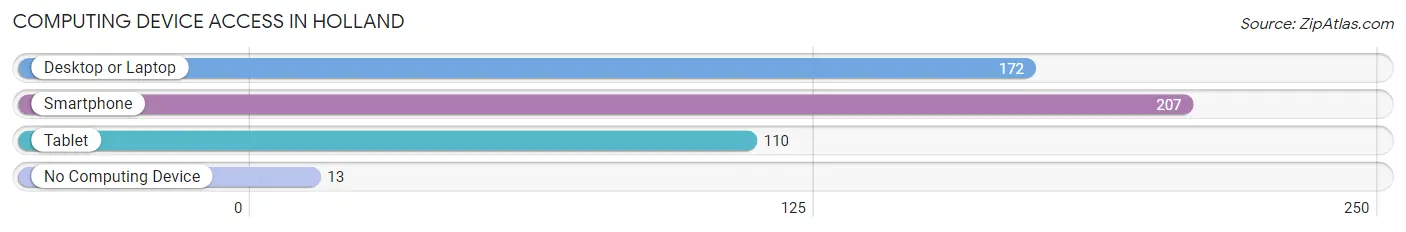
| Device Type | # Households | % Households |
| Desktop or Laptop | 172 | 75.4% |
| Smartphone | 207 | 90.8% |
| Tablet | 110 | 48.2% |
| No Computing Device | 13 | 5.7% |
| Total | 228 | 100.0% |
Internet Access in Holland
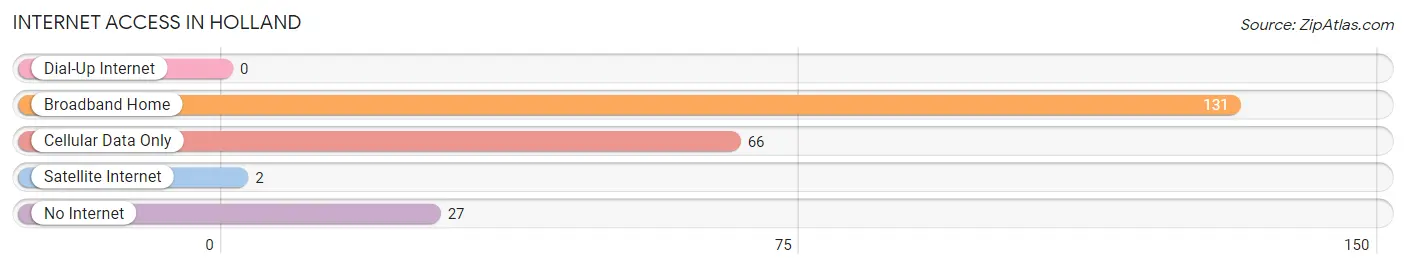
| Internet Type | # Households | % Households |
| Dial-Up Internet | 0 | 0.0% |
| Broadband Home | 131 | 57.5% |
| Cellular Data Only | 66 | 28.9% |
| Satellite Internet | 2 | 0.9% |
| No Internet | 27 | 11.8% |
| Total | 228 | 100.0% |
Holland Summary
Holland, Indiana is a small town located in the northern part of the state, in DeKalb County. It is situated on the banks of the Little River, and is surrounded by rolling hills and farmland. The town was founded in 1851 by Dutch immigrants, and has a population of approximately 1,500 people.
Geography
Holland is located in the northern part of Indiana, in DeKalb County. It is situated on the banks of the Little River, and is surrounded by rolling hills and farmland. The town is located approximately 30 miles east of Fort Wayne, and is about an hour and a half drive from Chicago. The town is situated on a flat plain, and is surrounded by a number of small lakes and ponds.
Economy
Holland’s economy is largely based on agriculture and manufacturing. The town is home to a number of small businesses, including a feed mill, a sawmill, and a furniture factory. The town also has a number of small retail stores, including a grocery store, a hardware store, and a few restaurants. The town is also home to a number of small farms, which produce a variety of crops, including corn, soybeans, and wheat.
Demographics
Holland is a predominantly white town, with a population of approximately 1,500 people. The town has a median household income of $45,000, and the median age is 37. The town is home to a number of churches, including the First United Methodist Church, the First Presbyterian Church, and the First Baptist Church.
History
Holland was founded in 1851 by Dutch immigrants, who were seeking a new home in the United States. The town was named after the Dutch city of Holland, and the town’s original settlers were mostly of Dutch descent. The town was incorporated in 1867, and the first mayor was John Van Dyke. The town grew slowly over the years, and by the early 1900s, it had a population of around 500 people.
In the early 1900s, the town was home to a number of small businesses, including a feed mill, a sawmill, and a furniture factory. The town also had a number of small retail stores, including a grocery store, a hardware store, and a few restaurants. The town was also home to a number of small farms, which produced a variety of crops, including corn, soybeans, and wheat.
In the late 20th century, the town began to experience a decline in population, as many of its residents moved away in search of better job opportunities. However, in recent years, the town has seen a resurgence in population, as more people have moved to the area in search of a quiet, rural lifestyle. Today, the town is home to a number of small businesses, and is a popular destination for tourists looking to explore the area’s natural beauty.
Common Questions
What is Per Capita Income in Holland?
Per Capita income in Holland is $25,967.
What is the Median Family Income in Holland?
Median Family Income in Holland is $64,063.
What is the Median Household income in Holland?
Median Household Income in Holland is $61,667.
What is Income or Wage Gap in Holland?
Income or Wage Gap in Holland is 11.7%.
Women in Holland earn 88.3 cents for every dollar earned by a man.
What is Inequality or Gini Index in Holland?
Inequality or Gini Index in Holland is 0.28.
What is the Total Population of Holland?
Total Population of Holland is 612.
What is the Total Male Population of Holland?
Total Male Population of Holland is 269.
What is the Total Female Population of Holland?
Total Female Population of Holland is 343.
What is the Ratio of Males per 100 Females in Holland?
There are 78.43 Males per 100 Females in Holland.
What is the Ratio of Females per 100 Males in Holland?
There are 127.51 Females per 100 Males in Holland.
What is the Median Population Age in Holland?
Median Population Age in Holland is 36.0 Years.
What is the Average Family Size in Holland
Average Family Size in Holland is 2.9 People.
What is the Average Household Size in Holland
Average Household Size in Holland is 2.7 People.
How Large is the Labor Force in Holland?
There are 346 People in the Labor Forcein in Holland.
What is the Percentage of People in the Labor Force in Holland?
69.8% of People are in the Labor Force in Holland.
What is the Unemployment Rate in Holland?
Unemployment Rate in Holland is 0.6%.