Hanover, IN Map & Demographics
Hanover Map
Hanover Overview
$21,545
PER CAPITA INCOME
$65,865
AVG FAMILY INCOME
$55,313
AVG HOUSEHOLD INCOME
30.6%
WAGE / INCOME GAP [ % ]
69.4¢/ $1
WAGE / INCOME GAP [ $ ]
0.42
INEQUALITY / GINI INDEX
3,665
TOTAL POPULATION
1,814
MALE POPULATION
1,851
FEMALE POPULATION
98.00
MALES / 100 FEMALES
102.04
FEMALES / 100 MALES
29.0
MEDIAN AGE
3.2
AVG FAMILY SIZE
2.8
AVG HOUSEHOLD SIZE
1,659
LABOR FORCE [ PEOPLE ]
54.7%
PERCENT IN LABOR FORCE
3.4%
UNEMPLOYMENT RATE
Hanover Zip Codes
Hanover Area Codes
Income in Hanover
Income Overview in Hanover
Per Capita Income in Hanover is $21,545, while median incomes of families and households are $65,865 and $55,313 respectively.
| Characteristic | Number | Measure |
| Per Capita Income | 3,665 | $21,545 |
| Median Family Income | 701 | $65,865 |
| Mean Family Income | 701 | $72,444 |
| Median Household Income | 971 | $55,313 |
| Mean Household Income | 971 | $72,916 |
| Income Deficit | 701 | $0 |
| Wage / Income Gap (%) | 3,665 | 30.60% |
| Wage / Income Gap ($) | 3,665 | 69.40¢ per $1 |
| Gini / Inequality Index | 3,665 | 0.42 |
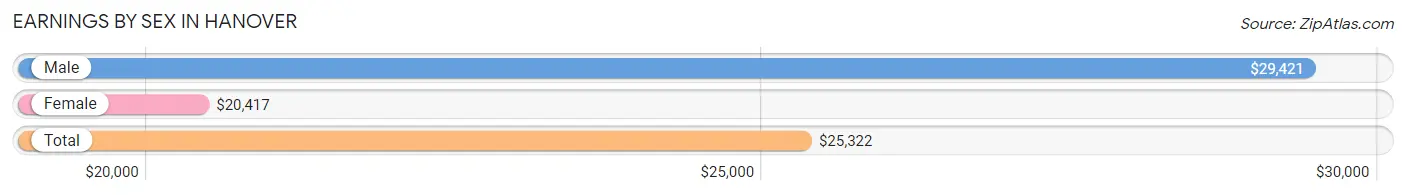
Earnings by Sex in Hanover
Average Earnings in Hanover are $25,322, $29,421 for men and $20,417 for women, a difference of 30.6%.
| Sex | Number | Average Earnings |
| Male | 873 (46.8%) | $29,421 |
| Female | 992 (53.2%) | $20,417 |
| Total | 1,865 (100.0%) | $25,322 |
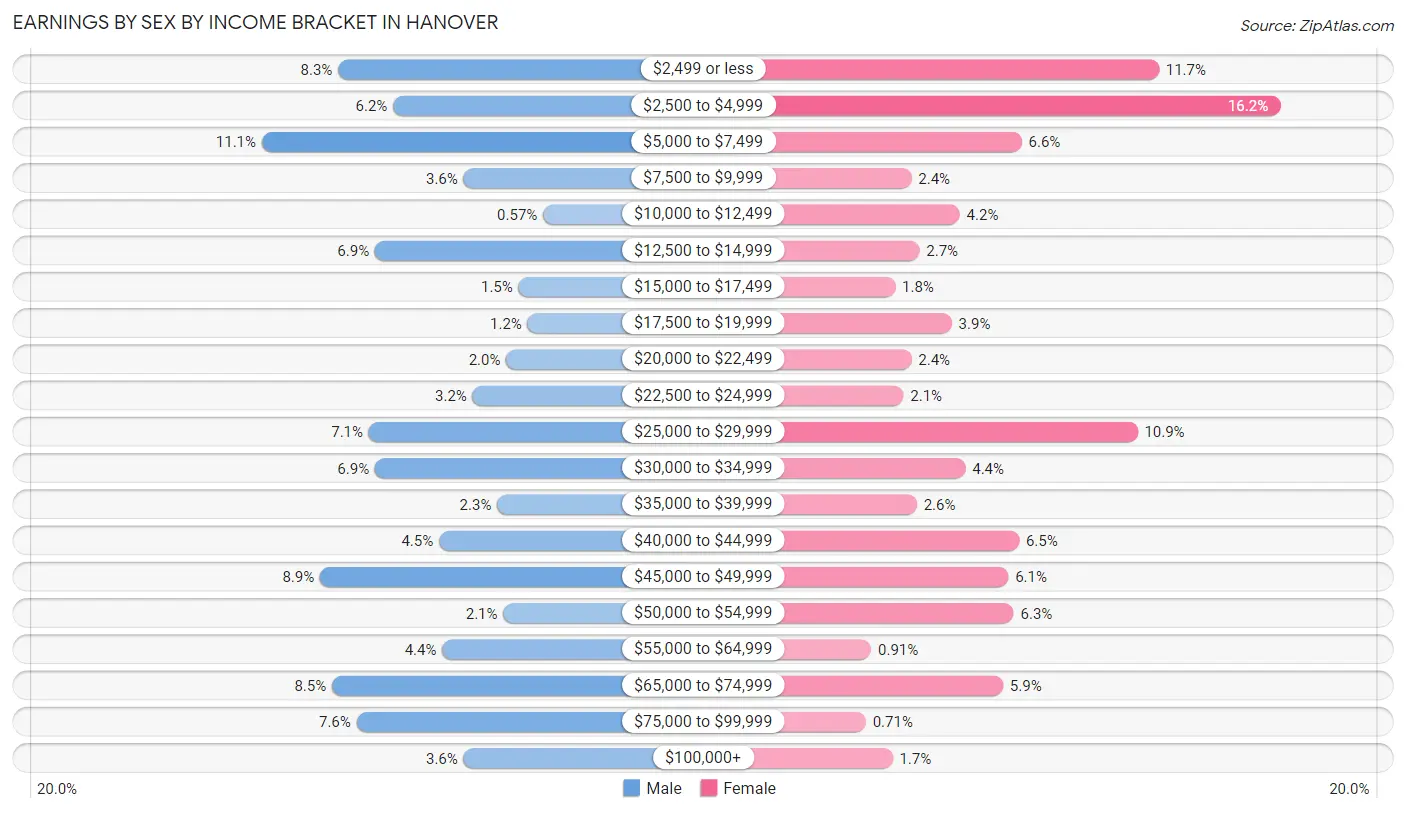
Earnings by Sex by Income Bracket in Hanover
The most common earnings brackets in Hanover are $5,000 to $7,499 for men (97 | 11.1%) and $2,500 to $4,999 for women (161 | 16.2%).
| Income | Male | Female |
| $2,499 or less | 72 (8.3%) | 116 (11.7%) |
| $2,500 to $4,999 | 54 (6.2%) | 161 (16.2%) |
| $5,000 to $7,499 | 97 (11.1%) | 65 (6.6%) |
| $7,500 to $9,999 | 31 (3.5%) | 24 (2.4%) |
| $10,000 to $12,499 | 5 (0.6%) | 42 (4.2%) |
| $12,500 to $14,999 | 60 (6.9%) | 27 (2.7%) |
| $15,000 to $17,499 | 13 (1.5%) | 18 (1.8%) |
| $17,500 to $19,999 | 10 (1.1%) | 39 (3.9%) |
| $20,000 to $22,499 | 17 (1.9%) | 24 (2.4%) |
| $22,500 to $24,999 | 28 (3.2%) | 21 (2.1%) |
| $25,000 to $29,999 | 62 (7.1%) | 108 (10.9%) |
| $30,000 to $34,999 | 60 (6.9%) | 44 (4.4%) |
| $35,000 to $39,999 | 20 (2.3%) | 26 (2.6%) |
| $40,000 to $44,999 | 39 (4.5%) | 64 (6.5%) |
| $45,000 to $49,999 | 78 (8.9%) | 60 (6.0%) |
| $50,000 to $54,999 | 18 (2.1%) | 62 (6.2%) |
| $55,000 to $64,999 | 38 (4.3%) | 9 (0.9%) |
| $65,000 to $74,999 | 74 (8.5%) | 58 (5.9%) |
| $75,000 to $99,999 | 66 (7.6%) | 7 (0.7%) |
| $100,000+ | 31 (3.5%) | 17 (1.7%) |
| Total | 873 (100.0%) | 992 (100.0%) |
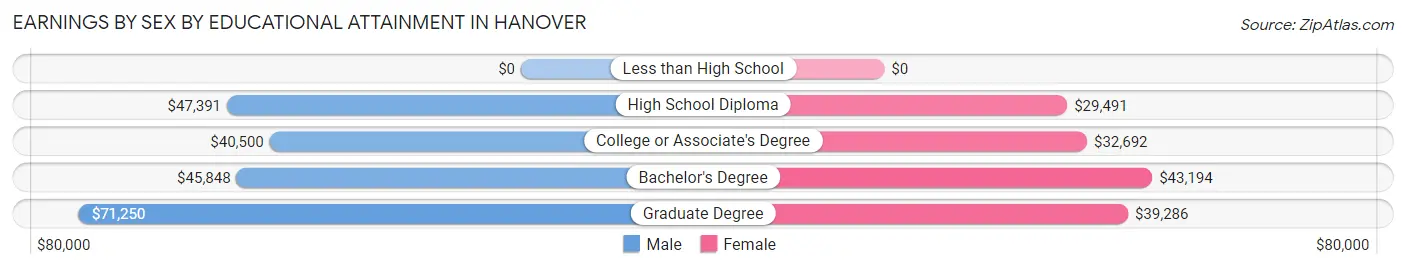
Earnings by Sex by Educational Attainment in Hanover
Average earnings in Hanover are $45,877 for men and $34,643 for women, a difference of 24.5%. Men with an educational attainment of graduate degree enjoy the highest average annual earnings of $71,250, while those with college or associate's degree education earn the least with $40,500. Women with an educational attainment of bachelor's degree earn the most with the average annual earnings of $43,194, while those with high school diploma education have the smallest earnings of $29,491.
| Educational Attainment | Male Income | Female Income |
| Less than High School | - | - |
| High School Diploma | $47,391 | $29,491 |
| College or Associate's Degree | $40,500 | $32,692 |
| Bachelor's Degree | $45,848 | $43,194 |
| Graduate Degree | $71,250 | $39,286 |
| Total | $45,877 | $34,643 |
Family Income in Hanover
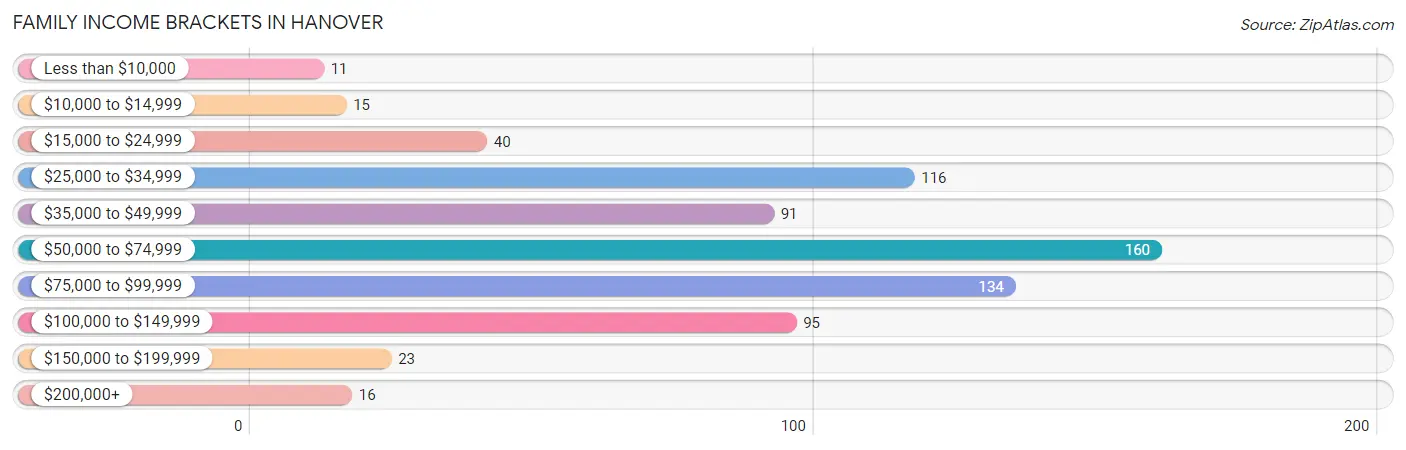
Family Income Brackets in Hanover
According to the Hanover family income data, there are 160 families falling into the $50,000 to $74,999 income range, which is the most common income bracket and makes up 22.8% of all families. Conversely, the less than $10,000 income bracket is the least frequent group with only 11 families (1.6%) belonging to this category.
| Income Bracket | # Families | % Families |
| Less than $10,000 | 11 | 1.6% |
| $10,000 to $14,999 | 15 | 2.1% |
| $15,000 to $24,999 | 40 | 5.7% |
| $25,000 to $34,999 | 116 | 16.5% |
| $35,000 to $49,999 | 91 | 13.0% |
| $50,000 to $74,999 | 160 | 22.8% |
| $75,000 to $99,999 | 134 | 19.1% |
| $100,000 to $149,999 | 95 | 13.6% |
| $150,000 to $199,999 | 23 | 3.3% |
| $200,000+ | 16 | 2.3% |
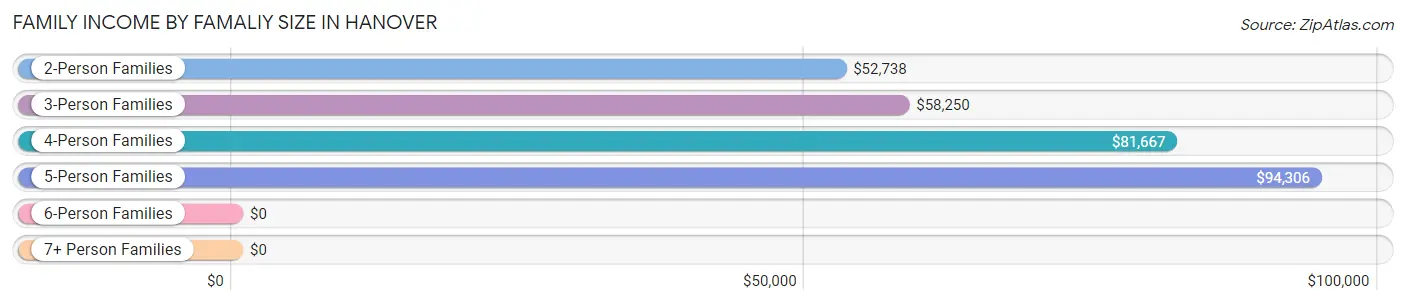
Family Income by Famaliy Size in Hanover
5-person families (50 | 7.1%) account for the highest median family income in Hanover with $94,306 per family, while 2-person families (292 | 41.6%) have the highest median income of $26,369 per family member.
| Income Bracket | # Families | Median Income |
| 2-Person Families | 292 (41.6%) | $52,738 |
| 3-Person Families | 247 (35.2%) | $58,250 |
| 4-Person Families | 90 (12.8%) | $81,667 |
| 5-Person Families | 50 (7.1%) | $94,306 |
| 6-Person Families | 17 (2.4%) | $0 |
| 7+ Person Families | 5 (0.7%) | $0 |
| Total | 701 (100.0%) | $65,865 |
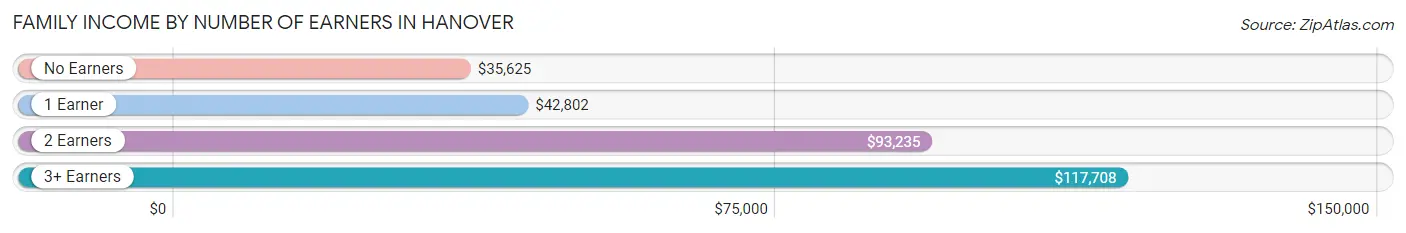
Family Income by Number of Earners in Hanover
The median family income in Hanover is $65,865, with families comprising 3+ earners (43) having the highest median family income of $117,708, while families with no earners (81) have the lowest median family income of $35,625, accounting for 6.1% and 11.6% of families, respectively.
| Number of Earners | # Families | Median Income |
| No Earners | 81 (11.6%) | $35,625 |
| 1 Earner | 301 (42.9%) | $42,802 |
| 2 Earners | 276 (39.4%) | $93,235 |
| 3+ Earners | 43 (6.1%) | $117,708 |
| Total | 701 (100.0%) | $65,865 |
Household Income in Hanover
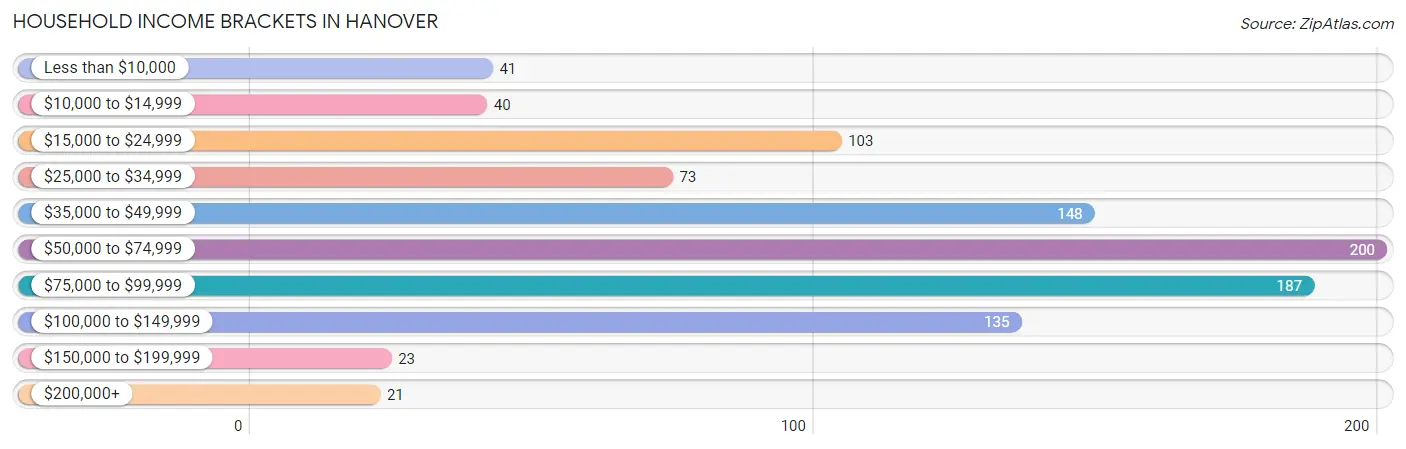
Household Income Brackets in Hanover
With 200 households falling in the category, the $50,000 to $74,999 income range is the most frequent in Hanover, accounting for 20.6% of all households. In contrast, only 21 households (2.2%) fall into the $200,000+ income bracket, making it the least populous group.
| Income Bracket | # Households | % Households |
| Less than $10,000 | 41 | 4.2% |
| $10,000 to $14,999 | 40 | 4.1% |
| $15,000 to $24,999 | 103 | 10.6% |
| $25,000 to $34,999 | 73 | 7.5% |
| $35,000 to $49,999 | 148 | 15.2% |
| $50,000 to $74,999 | 200 | 20.6% |
| $75,000 to $99,999 | 187 | 19.3% |
| $100,000 to $149,999 | 135 | 13.9% |
| $150,000 to $199,999 | 23 | 2.4% |
| $200,000+ | 21 | 2.2% |
Household Income by Householder Age in Hanover
The median household income in Hanover is $55,313, with the highest median household income of $75,284 found in the 45 to 64 years age bracket for the primary householder. A total of 311 households (32.0%) fall into this category. Meanwhile, the 15 to 24 years age bracket for the primary householder has the lowest median household income of $31,250, with 42 households (4.3%) in this group.
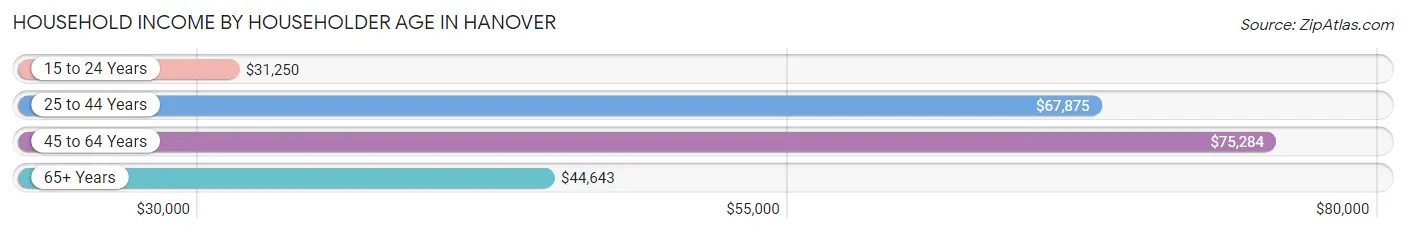
| Income Bracket | # Households | Median Income |
| 15 to 24 Years | 42 (4.3%) | $31,250 |
| 25 to 44 Years | 400 (41.2%) | $67,875 |
| 45 to 64 Years | 311 (32.0%) | $75,284 |
| 65+ Years | 218 (22.5%) | $44,643 |
| Total | 971 (100.0%) | $55,313 |
Poverty in Hanover
Income Below Poverty by Sex and Age in Hanover
With 10.8% poverty level for males and 13.2% for females among the residents of Hanover, under 5 year old males and 5 year old females are the most vulnerable to poverty, with 41 males (32.0%) and 27 females (100.0%) in their respective age groups living below the poverty level.
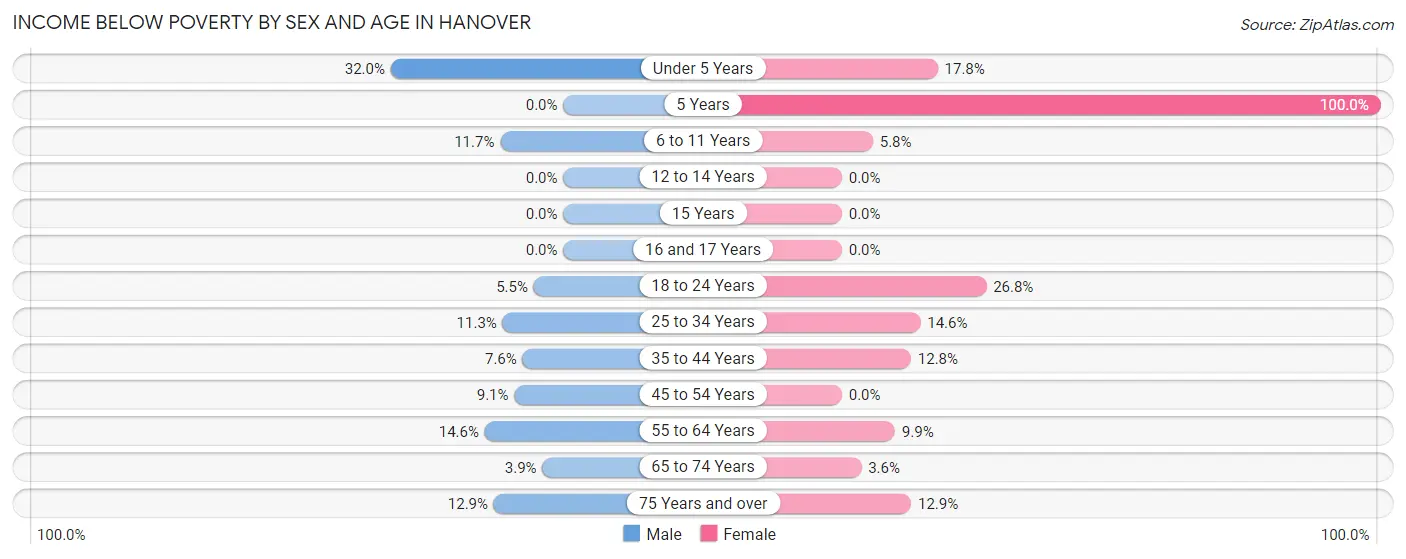
| Age Bracket | Male | Female |
| Under 5 Years | 41 (32.0%) | 16 (17.8%) |
| 5 Years | 0 (0.0%) | 27 (100.0%) |
| 6 to 11 Years | 17 (11.7%) | 5 (5.8%) |
| 12 to 14 Years | 0 (0.0%) | 0 (0.0%) |
| 15 Years | 0 (0.0%) | 0 (0.0%) |
| 16 and 17 Years | 0 (0.0%) | 0 (0.0%) |
| 18 to 24 Years | 5 (5.5%) | 26 (26.8%) |
| 25 to 34 Years | 23 (11.3%) | 37 (14.6%) |
| 35 to 44 Years | 13 (7.6%) | 25 (12.8%) |
| 45 to 54 Years | 22 (9.1%) | 0 (0.0%) |
| 55 to 64 Years | 21 (14.6%) | 21 (9.9%) |
| 65 to 74 Years | 4 (3.9%) | 4 (3.6%) |
| 75 Years and over | 4 (12.9%) | 9 (12.9%) |
| Total | 150 (10.8%) | 170 (13.2%) |
Income Above Poverty by Sex and Age in Hanover
According to the poverty statistics in Hanover, males aged 5 years and females aged 12 to 14 years are the age groups that are most secure financially, with 100.0% of males and 100.0% of females in these age groups living above the poverty line.
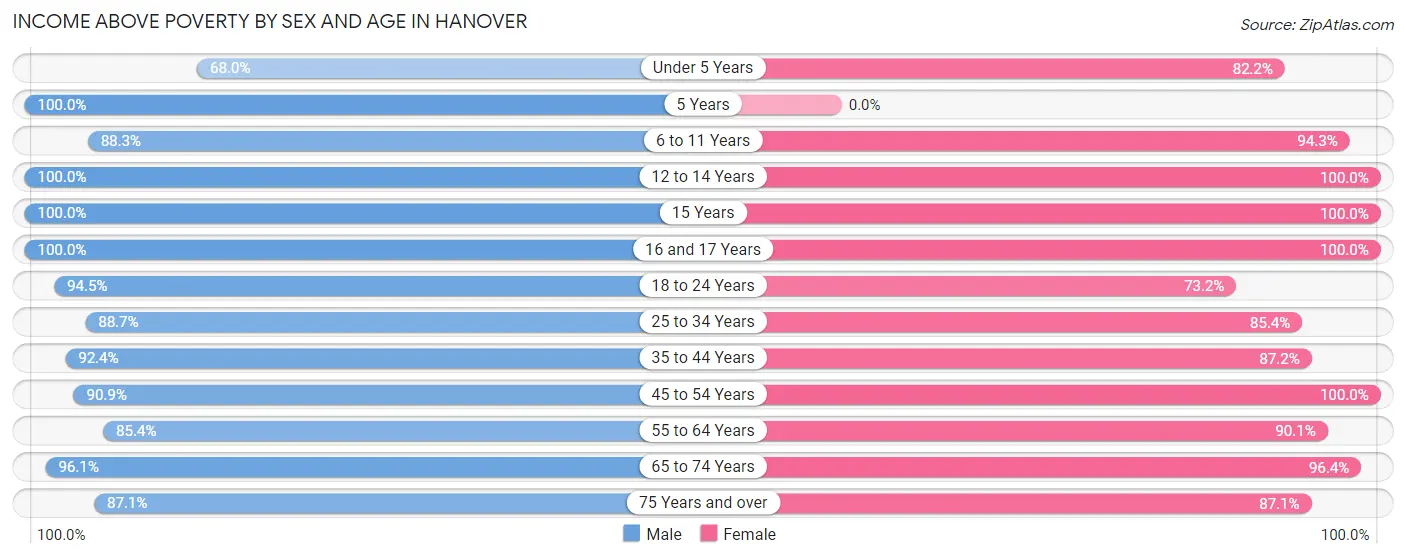
| Age Bracket | Male | Female |
| Under 5 Years | 87 (68.0%) | 74 (82.2%) |
| 5 Years | 41 (100.0%) | 0 (0.0%) |
| 6 to 11 Years | 128 (88.3%) | 82 (94.3%) |
| 12 to 14 Years | 56 (100.0%) | 24 (100.0%) |
| 15 Years | 3 (100.0%) | 19 (100.0%) |
| 16 and 17 Years | 34 (100.0%) | 8 (100.0%) |
| 18 to 24 Years | 86 (94.5%) | 71 (73.2%) |
| 25 to 34 Years | 181 (88.7%) | 217 (85.4%) |
| 35 to 44 Years | 159 (92.4%) | 170 (87.2%) |
| 45 to 54 Years | 220 (90.9%) | 95 (100.0%) |
| 55 to 64 Years | 123 (85.4%) | 192 (90.1%) |
| 65 to 74 Years | 99 (96.1%) | 107 (96.4%) |
| 75 Years and over | 27 (87.1%) | 61 (87.1%) |
| Total | 1,244 (89.2%) | 1,120 (86.8%) |
Income Below Poverty Among Married-Couple Families in Hanover
The poverty statistics for married-couple families in Hanover show that 4.3% or 17 of the total 399 families live below the poverty line. Families with 1 or 2 children have the highest poverty rate of 9.4%, comprising of 12 families. On the other hand, families with 3 or 4 children have the lowest poverty rate of 0.0%, which includes 0 families.
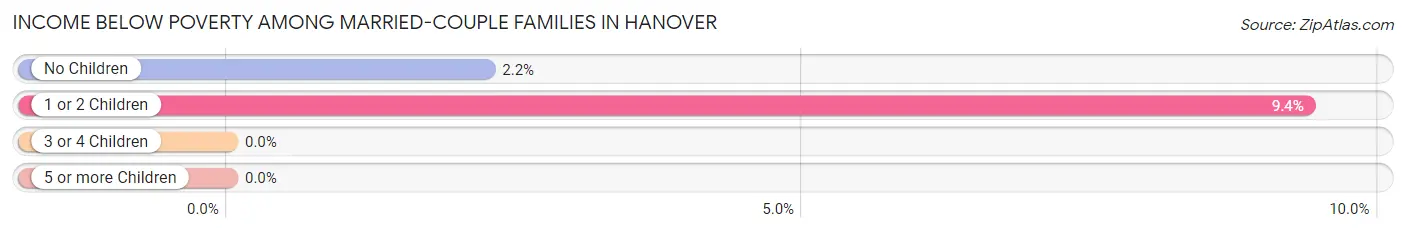
| Children | Above Poverty | Below Poverty |
| No Children | 218 (97.8%) | 5 (2.2%) |
| 1 or 2 Children | 116 (90.6%) | 12 (9.4%) |
| 3 or 4 Children | 43 (100.0%) | 0 (0.0%) |
| 5 or more Children | 5 (100.0%) | 0 (0.0%) |
| Total | 382 (95.7%) | 17 (4.3%) |
Income Below Poverty Among Single-Parent Households in Hanover
According to the poverty data in Hanover, 12.6% or 24 single-father households and 18.9% or 21 single-mother households are living below the poverty line. Among single-father households, those with 1 or 2 children have the highest poverty rate, with 24 households (14.3%) experiencing poverty. Likewise, among single-mother households, those with 1 or 2 children have the highest poverty rate, with 21 households (28.4%) falling below the poverty line.
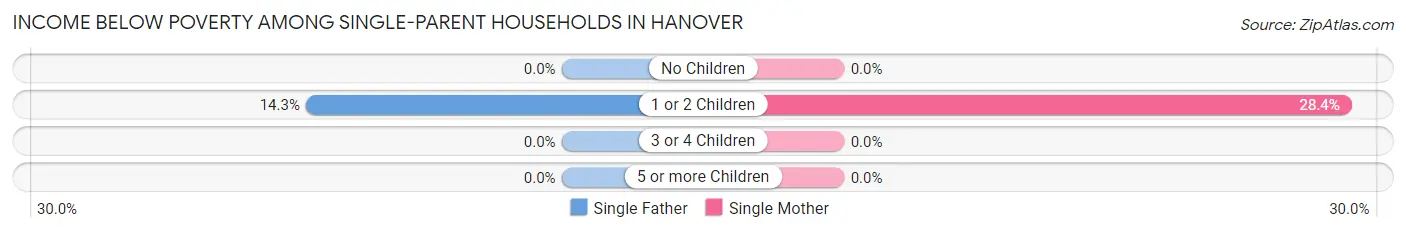
| Children | Single Father | Single Mother |
| No Children | 0 (0.0%) | 0 (0.0%) |
| 1 or 2 Children | 24 (14.3%) | 21 (28.4%) |
| 3 or 4 Children | 0 (0.0%) | 0 (0.0%) |
| 5 or more Children | 0 (0.0%) | 0 (0.0%) |
| Total | 24 (12.6%) | 21 (18.9%) |
Income Below Poverty Among Married-Couple vs Single-Parent Households in Hanover
The poverty data for Hanover shows that 17 of the married-couple family households (4.3%) and 45 of the single-parent households (14.9%) are living below the poverty level. Within the married-couple family households, those with 1 or 2 children have the highest poverty rate, with 12 households (9.4%) falling below the poverty line. Among the single-parent households, those with 1 or 2 children have the highest poverty rate, with 45 household (18.6%) living below poverty.
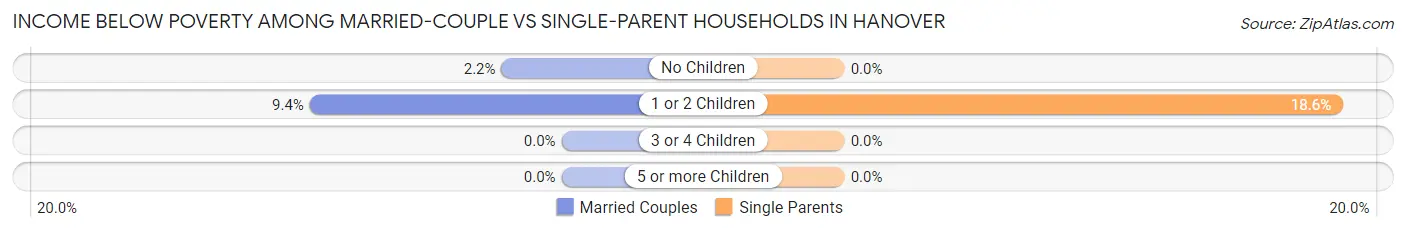
| Children | Married-Couple Families | Single-Parent Households |
| No Children | 5 (2.2%) | 0 (0.0%) |
| 1 or 2 Children | 12 (9.4%) | 45 (18.6%) |
| 3 or 4 Children | 0 (0.0%) | 0 (0.0%) |
| 5 or more Children | 0 (0.0%) | 0 (0.0%) |
| Total | 17 (4.3%) | 45 (14.9%) |
Race in Hanover
The most populous races in Hanover are White / Caucasian (3,546 | 96.8%), Hispanic or Latino (39 | 1.1%), and Two or more Races (39 | 1.1%).
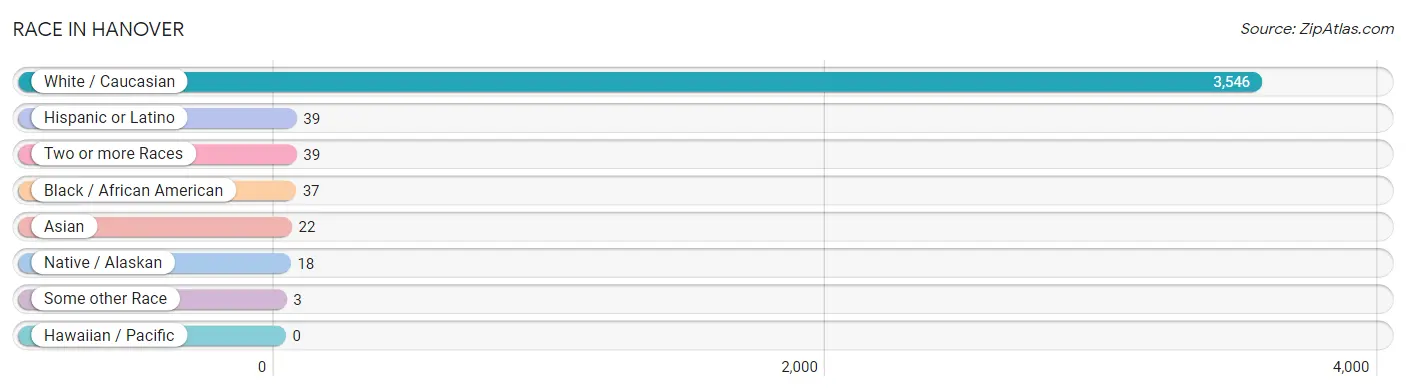
| Race | # Population | % Population |
| Asian | 22 | 0.6% |
| Black / African American | 37 | 1.0% |
| Hawaiian / Pacific | 0 | 0.0% |
| Hispanic or Latino | 39 | 1.1% |
| Native / Alaskan | 18 | 0.5% |
| White / Caucasian | 3,546 | 96.8% |
| Two or more Races | 39 | 1.1% |
| Some other Race | 3 | 0.1% |
| Total | 3,665 | 100.0% |
Ancestry in Hanover
The most populous ancestries reported in Hanover are German (786 | 21.4%), English (580 | 15.8%), Irish (446 | 12.2%), American (233 | 6.4%), and Scottish (200 | 5.5%), together accounting for 61.3% of all Hanover residents.
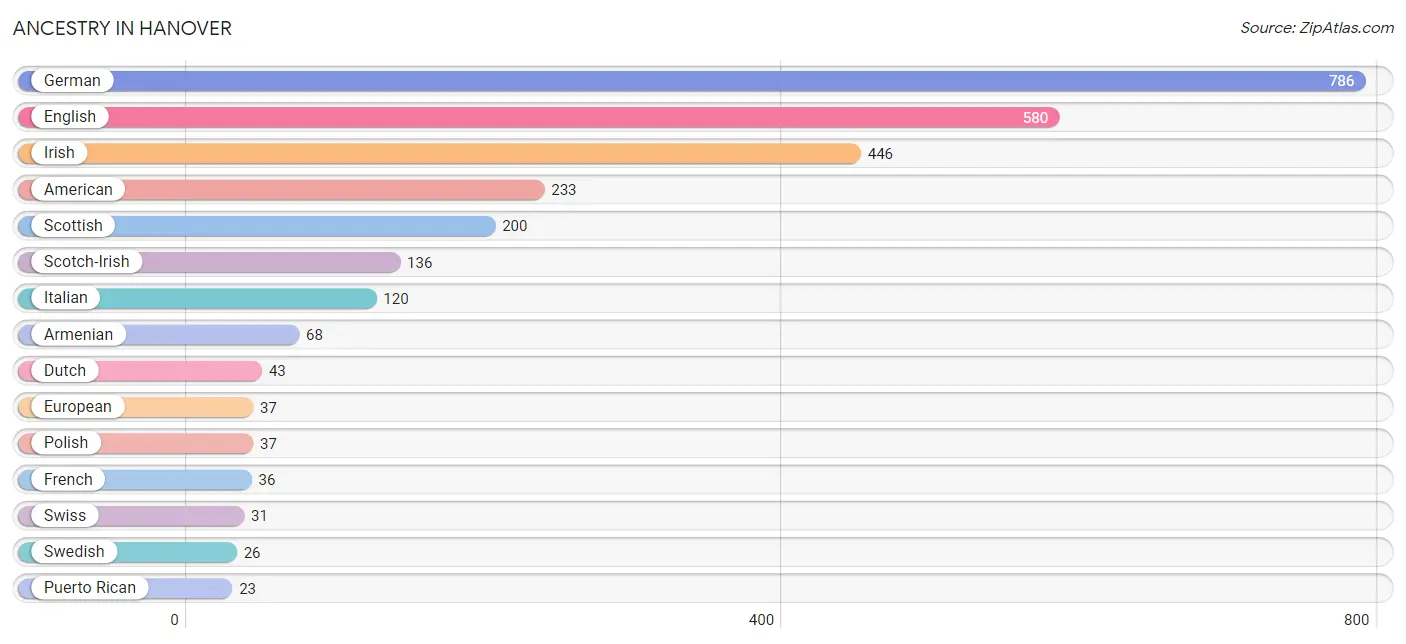
| Ancestry | # Population | % Population |
| American | 233 | 6.4% |
| Armenian | 68 | 1.9% |
| Austrian | 12 | 0.3% |
| Bhutanese | 2 | 0.1% |
| Burmese | 10 | 0.3% |
| Central American | 5 | 0.1% |
| Central American Indian | 4 | 0.1% |
| Cherokee | 9 | 0.3% |
| Chippewa | 9 | 0.3% |
| Czech | 3 | 0.1% |
| Dutch | 43 | 1.2% |
| English | 580 | 15.8% |
| European | 37 | 1.0% |
| French | 36 | 1.0% |
| French Canadian | 3 | 0.1% |
| German | 786 | 21.4% |
| Guamanian / Chamorro | 13 | 0.4% |
| Guatemalan | 5 | 0.1% |
| Hungarian | 9 | 0.3% |
| Iranian | 18 | 0.5% |
| Irish | 446 | 12.2% |
| Italian | 120 | 3.3% |
| Korean | 1 | 0.0% |
| Mexican | 8 | 0.2% |
| Norwegian | 3 | 0.1% |
| Pakistani | 9 | 0.3% |
| Peruvian | 3 | 0.1% |
| Polish | 37 | 1.0% |
| Puerto Rican | 23 | 0.6% |
| Russian | 12 | 0.3% |
| Scotch-Irish | 136 | 3.7% |
| Scottish | 200 | 5.5% |
| South American | 3 | 0.1% |
| Swedish | 26 | 0.7% |
| Swiss | 31 | 0.9% | View All 35 Rows |
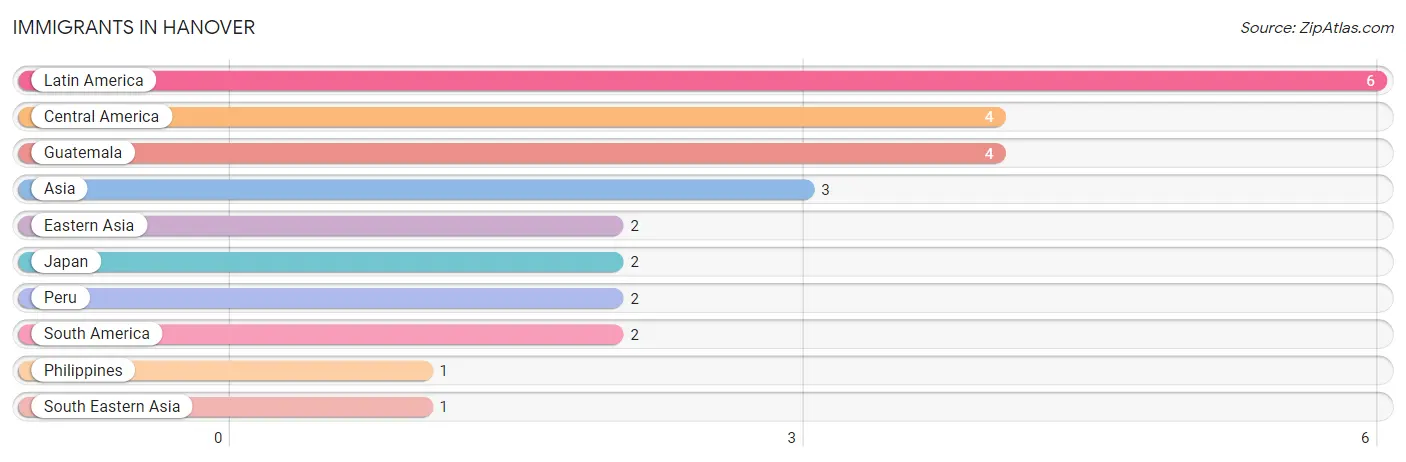
Immigrants in Hanover
The most numerous immigrant groups reported in Hanover came from Latin America (6 | 0.2%), Central America (4 | 0.1%), Guatemala (4 | 0.1%), Asia (3 | 0.1%), and Eastern Asia (2 | 0.1%), together accounting for 0.5% of all Hanover residents.
| Immigration Origin | # Population | % Population |
| Asia | 3 | 0.1% |
| Central America | 4 | 0.1% |
| Eastern Asia | 2 | 0.1% |
| Guatemala | 4 | 0.1% |
| Japan | 2 | 0.1% |
| Latin America | 6 | 0.2% |
| Peru | 2 | 0.1% |
| Philippines | 1 | 0.0% |
| South America | 2 | 0.1% |
| South Eastern Asia | 1 | 0.0% | View All 10 Rows |
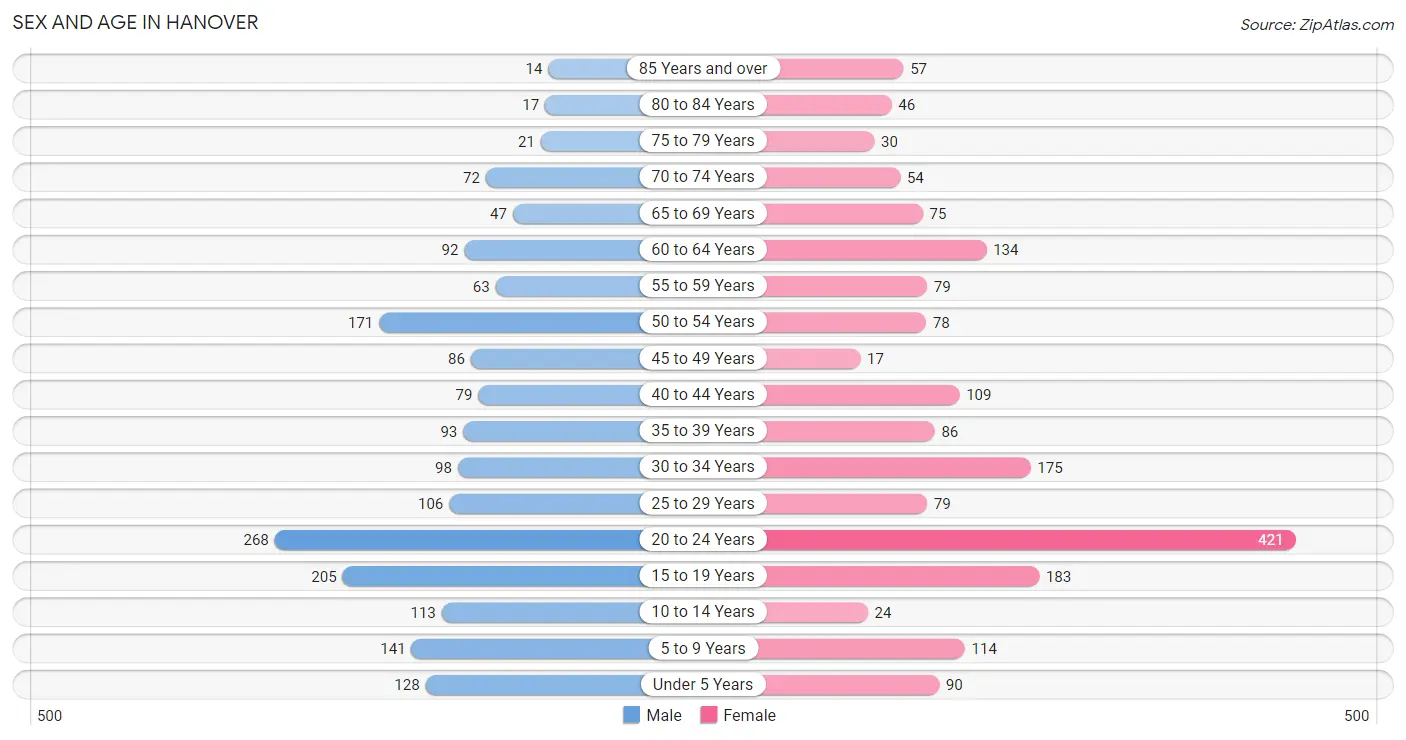
Sex and Age in Hanover
Sex and Age in Hanover
The most populous age groups in Hanover are 20 to 24 Years (268 | 14.8%) for men and 20 to 24 Years (421 | 22.7%) for women.
| Age Bracket | Male | Female |
| Under 5 Years | 128 (7.1%) | 90 (4.9%) |
| 5 to 9 Years | 141 (7.8%) | 114 (6.2%) |
| 10 to 14 Years | 113 (6.2%) | 24 (1.3%) |
| 15 to 19 Years | 205 (11.3%) | 183 (9.9%) |
| 20 to 24 Years | 268 (14.8%) | 421 (22.7%) |
| 25 to 29 Years | 106 (5.8%) | 79 (4.3%) |
| 30 to 34 Years | 98 (5.4%) | 175 (9.5%) |
| 35 to 39 Years | 93 (5.1%) | 86 (4.6%) |
| 40 to 44 Years | 79 (4.4%) | 109 (5.9%) |
| 45 to 49 Years | 86 (4.7%) | 17 (0.9%) |
| 50 to 54 Years | 171 (9.4%) | 78 (4.2%) |
| 55 to 59 Years | 63 (3.5%) | 79 (4.3%) |
| 60 to 64 Years | 92 (5.1%) | 134 (7.2%) |
| 65 to 69 Years | 47 (2.6%) | 75 (4.1%) |
| 70 to 74 Years | 72 (4.0%) | 54 (2.9%) |
| 75 to 79 Years | 21 (1.2%) | 30 (1.6%) |
| 80 to 84 Years | 17 (0.9%) | 46 (2.5%) |
| 85 Years and over | 14 (0.8%) | 57 (3.1%) |
| Total | 1,814 (100.0%) | 1,851 (100.0%) |
Families and Households in Hanover
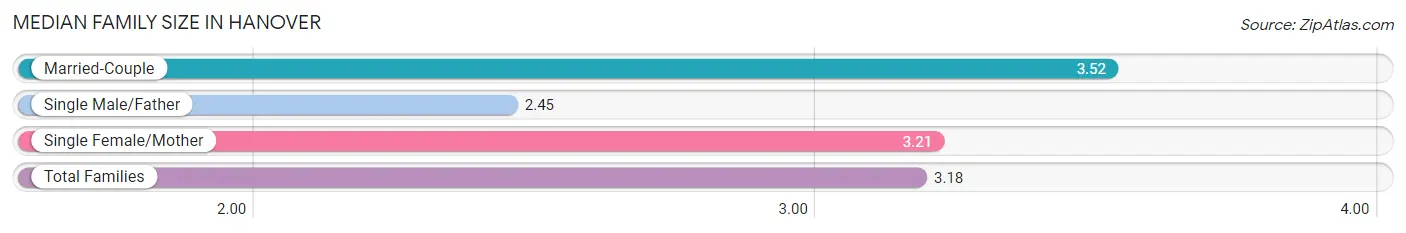
Median Family Size in Hanover
The median family size in Hanover is 3.18 persons per family, with married-couple families (399 | 56.9%) accounting for the largest median family size of 3.52 persons per family. On the other hand, single male/father families (191 | 27.3%) represent the smallest median family size with 2.45 persons per family.
| Family Type | # Families | Family Size |
| Married-Couple | 399 (56.9%) | 3.52 |
| Single Male/Father | 191 (27.3%) | 2.45 |
| Single Female/Mother | 111 (15.8%) | 3.21 |
| Total Families | 701 (100.0%) | 3.18 |
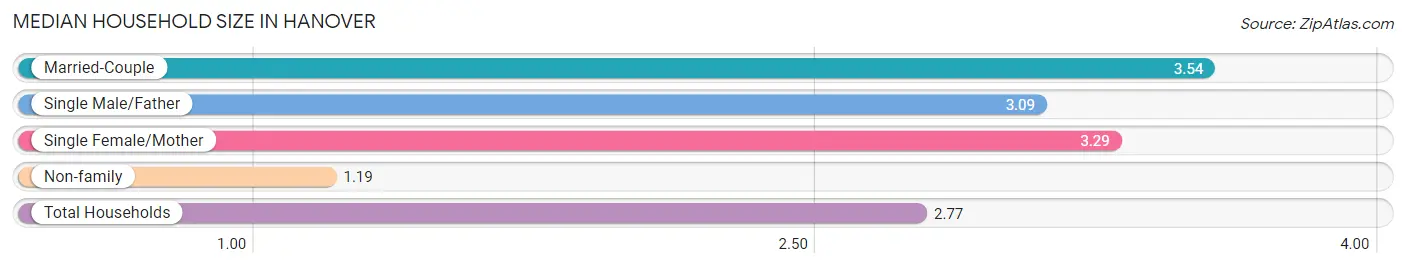
Median Household Size in Hanover
The median household size in Hanover is 2.77 persons per household, with married-couple households (399 | 41.1%) accounting for the largest median household size of 3.54 persons per household. non-family households (270 | 27.8%) represent the smallest median household size with 1.19 persons per household.
| Household Type | # Households | Household Size |
| Married-Couple | 399 (41.1%) | 3.54 |
| Single Male/Father | 191 (19.7%) | 3.09 |
| Single Female/Mother | 111 (11.4%) | 3.29 |
| Non-family | 270 (27.8%) | 1.19 |
| Total Households | 971 (100.0%) | 2.77 |
Household Size by Marriage Status in Hanover
Out of a total of 971 households in Hanover, 701 (72.2%) are family households, while 270 (27.8%) are nonfamily households. The most numerous type of family households are 3-person households, comprising 252, and the most common type of nonfamily households are 1-person households, comprising 234.
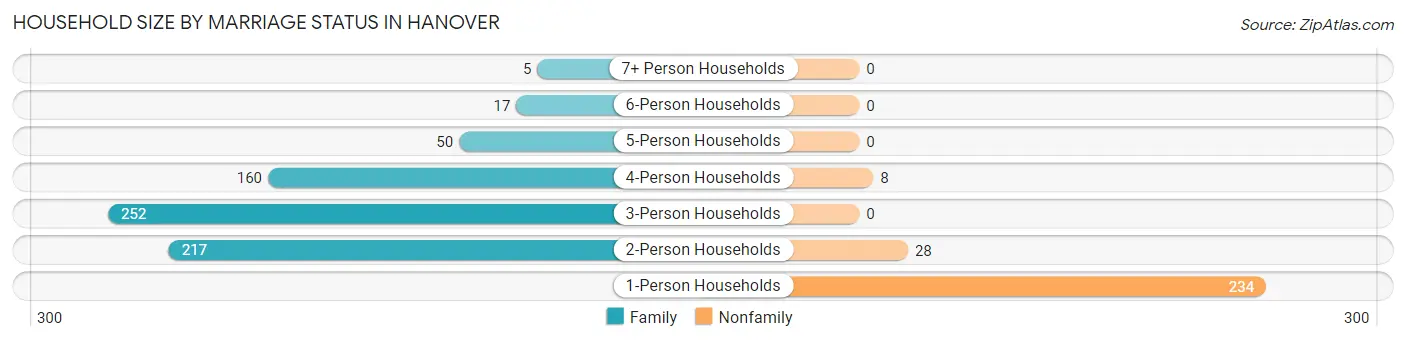
| Household Size | Family Households | Nonfamily Households |
| 1-Person Households | - | 234 (24.1%) |
| 2-Person Households | 217 (22.4%) | 28 (2.9%) |
| 3-Person Households | 252 (26.0%) | 0 (0.0%) |
| 4-Person Households | 160 (16.5%) | 8 (0.8%) |
| 5-Person Households | 50 (5.1%) | 0 (0.0%) |
| 6-Person Households | 17 (1.8%) | 0 (0.0%) |
| 7+ Person Households | 5 (0.5%) | 0 (0.0%) |
| Total | 701 (72.2%) | 270 (27.8%) |
Female Fertility in Hanover
Fertility by Age in Hanover
Average fertility rate in Hanover is 37.0 births per 1,000 women. Women in the age bracket of 35 to 50 years have the highest fertility rate with 107.0 births per 1,000 women. Women in the age bracket of 35 to 50 years acount for 62.5% of all women with births.
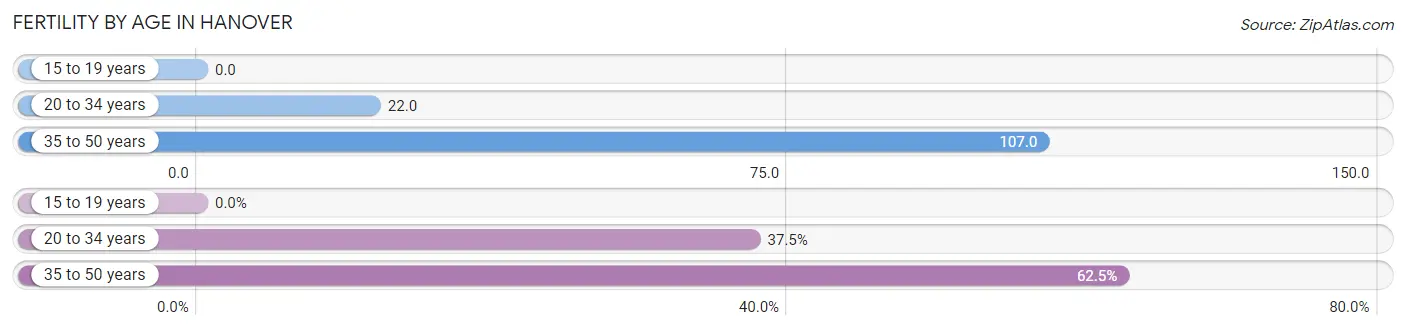
| Age Bracket | Women with Births | Births / 1,000 Women |
| 15 to 19 years | 0 (0.0%) | 0.0 |
| 20 to 34 years | 15 (37.5%) | 22.0 |
| 35 to 50 years | 25 (62.5%) | 107.0 |
| Total | 40 (100.0%) | 37.0 |
Fertility by Age by Marriage Status in Hanover
37.5% of women with births (40) in Hanover are married. The highest percentage of unmarried women with births falls into 35 to 50 years age bracket with 100.0% of them unmarried at the time of birth, while the lowest percentage of unmarried women with births belong to 20 to 34 years age bracket with 0.0% of them unmarried.
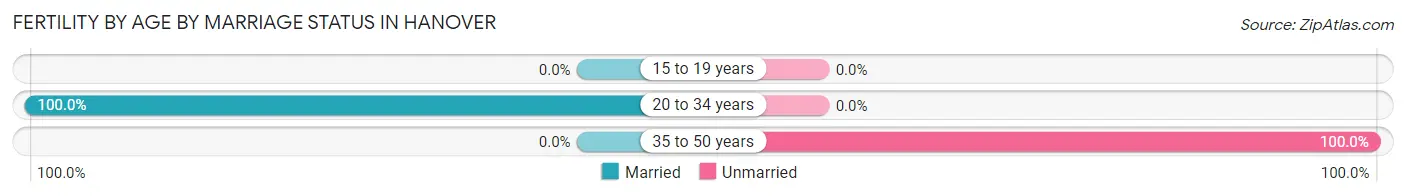
| Age Bracket | Married | Unmarried |
| 15 to 19 years | 0 (0.0%) | 0 (0.0%) |
| 20 to 34 years | 15 (100.0%) | 0 (0.0%) |
| 35 to 50 years | 0 (0.0%) | 25 (100.0%) |
| Total | 15 (37.5%) | 25 (62.5%) |
Fertility by Education in Hanover
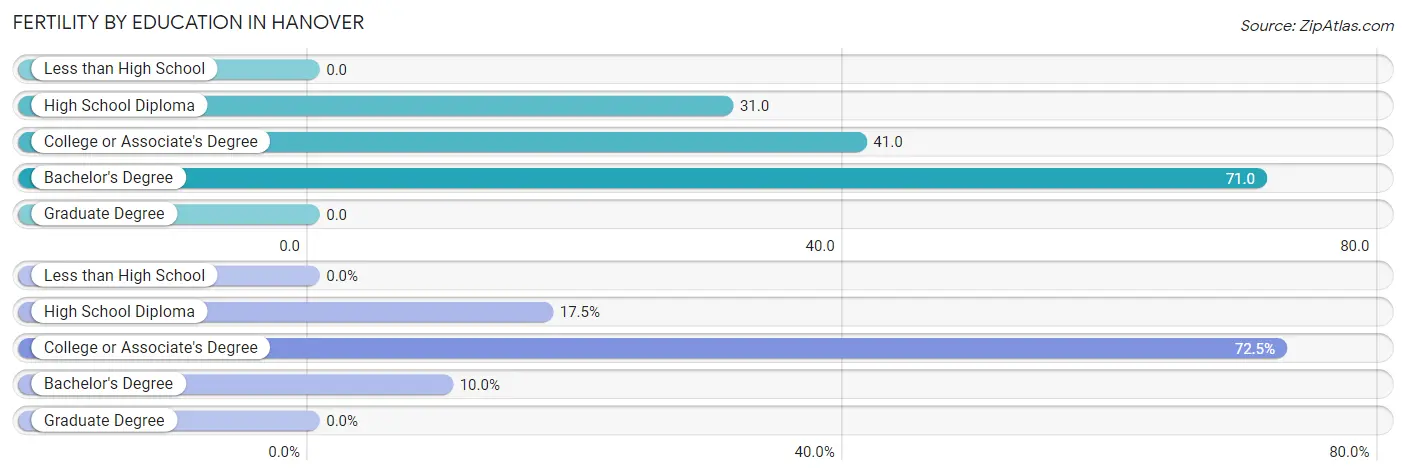
| Educational Attainment | Women with Births | Births / 1,000 Women |
| Less than High School | 0 (0.0%) | 0.0 |
| High School Diploma | 7 (17.5%) | 31.0 |
| College or Associate's Degree | 29 (72.5%) | 41.0 |
| Bachelor's Degree | 4 (10.0%) | 71.0 |
| Graduate Degree | 0 (0.0%) | 0.0 |
| Total | 40 (100.0%) | 37.0 |
Fertility by Education by Marriage Status in Hanover
62.5% of women with births in Hanover are unmarried. Women with the educational attainment of high school diploma are most likely to be married with 100.0% of them married at childbirth, while women with the educational attainment of college or associate's degree are least likely to be married with 86.2% of them unmarried at childbirth.
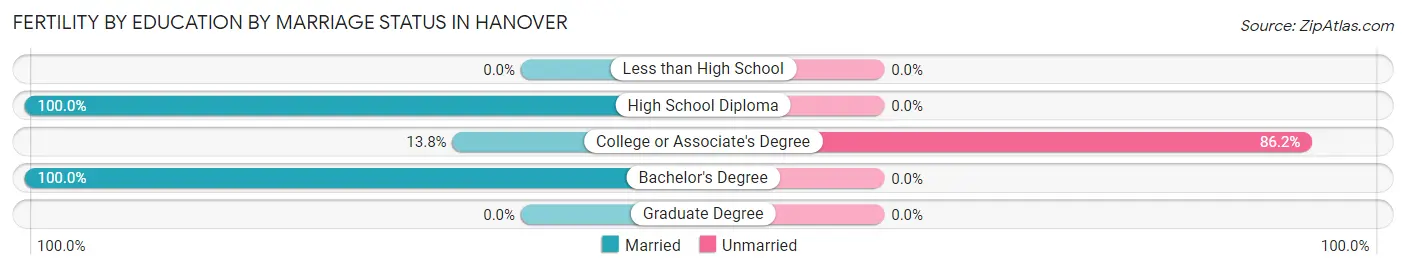
| Educational Attainment | Married | Unmarried |
| Less than High School | 0 (0.0%) | 0 (0.0%) |
| High School Diploma | 7 (100.0%) | 0 (0.0%) |
| College or Associate's Degree | 4 (13.8%) | 25 (86.2%) |
| Bachelor's Degree | 4 (100.0%) | 0 (0.0%) |
| Graduate Degree | 0 (0.0%) | 0 (0.0%) |
| Total | 15 (37.5%) | 25 (62.5%) |
Employment Characteristics in Hanover
Employment by Class of Employer in Hanover
Among the 1,587 employed individuals in Hanover, private company employees (1,123 | 70.8%), not-for-profit organizations (184 | 11.6%), and local government employees (121 | 7.6%) make up the most common classes of employment.
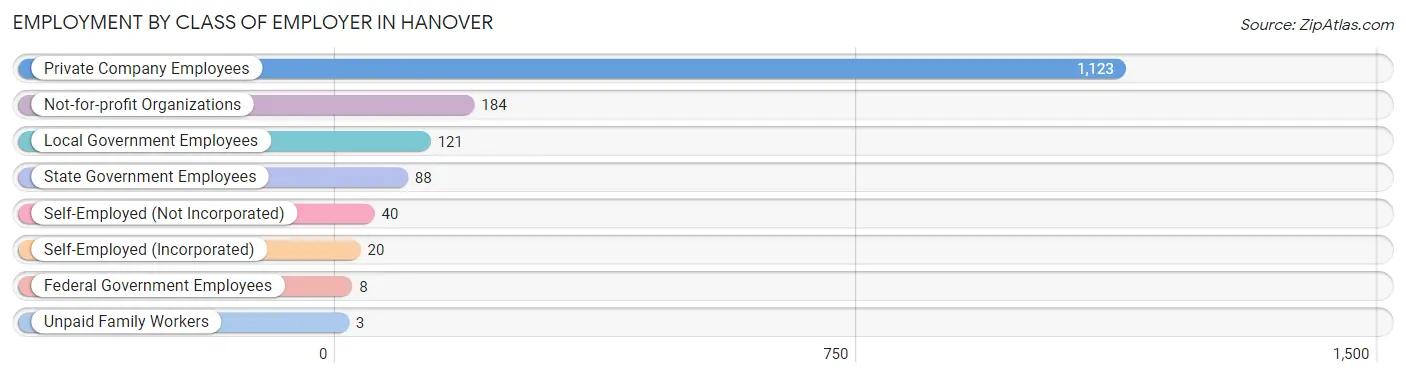
| Employer Class | # Employees | % Employees |
| Private Company Employees | 1,123 | 70.8% |
| Self-Employed (Incorporated) | 20 | 1.3% |
| Self-Employed (Not Incorporated) | 40 | 2.5% |
| Not-for-profit Organizations | 184 | 11.6% |
| Local Government Employees | 121 | 7.6% |
| State Government Employees | 88 | 5.6% |
| Federal Government Employees | 8 | 0.5% |
| Unpaid Family Workers | 3 | 0.2% |
| Total | 1,587 | 100.0% |
Employment Status by Age in Hanover
According to the labor force statistics for Hanover, out of the total population over 16 years of age (3,033), 54.7% or 1,659 individuals are in the labor force, with 3.4% or 56 of them unemployed. The age group with the highest labor force participation rate is 25 to 29 years, with 97.8% or 181 individuals in the labor force. Within the labor force, the 16 to 19 years age range has the highest percentage of unemployed individuals, with 21.7% or 35 of them being unemployed.
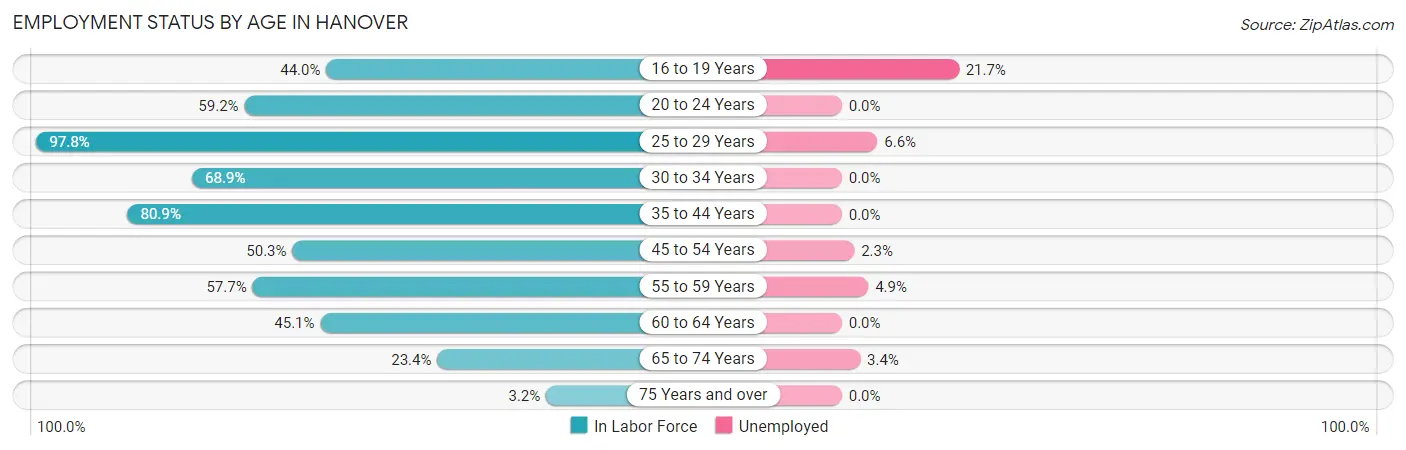
| Age Bracket | In Labor Force | Unemployed |
| 16 to 19 Years | 161 (44.0%) | 35 (21.7%) |
| 20 to 24 Years | 408 (59.2%) | 0 (0.0%) |
| 25 to 29 Years | 181 (97.8%) | 12 (6.6%) |
| 30 to 34 Years | 188 (68.9%) | 0 (0.0%) |
| 35 to 44 Years | 297 (80.9%) | 0 (0.0%) |
| 45 to 54 Years | 177 (50.3%) | 4 (2.3%) |
| 55 to 59 Years | 82 (57.7%) | 4 (4.9%) |
| 60 to 64 Years | 102 (45.1%) | 0 (0.0%) |
| 65 to 74 Years | 58 (23.4%) | 2 (3.4%) |
| 75 Years and over | 6 (3.2%) | 0 (0.0%) |
| Total | 1,659 (54.7%) | 56 (3.4%) |
Employment Status by Educational Attainment in Hanover
According to labor force statistics for Hanover, 66.5% of individuals (1,027) out of the total population between 25 and 64 years of age (1,545) are in the labor force, with 1.9% or 20 of them being unemployed. The group with the highest labor force participation rate are those with the educational attainment of bachelor's degree or higher, with 98.4% or 183 individuals in the labor force. Within the labor force, individuals with high school diploma education have the highest percentage of unemployment, with 6.1% or 20 of them being unemployed.
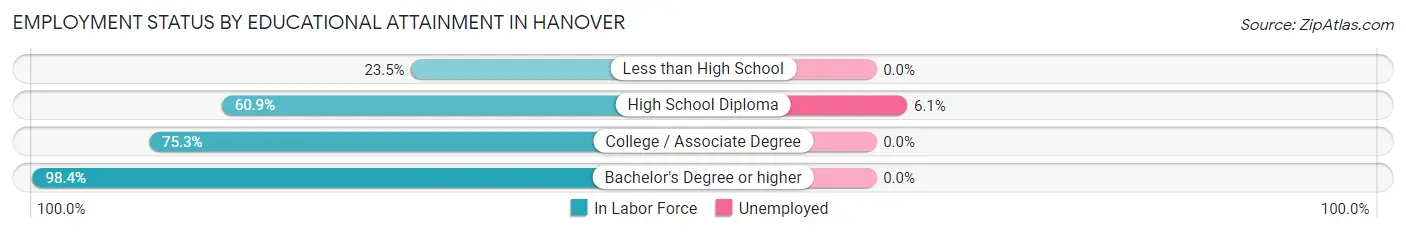
| Educational Attainment | In Labor Force | Unemployed |
| Less than High School | 46 (23.5%) | 0 (0.0%) |
| High School Diploma | 329 (60.9%) | 33 (6.1%) |
| College / Associate Degree | 469 (75.3%) | 0 (0.0%) |
| Bachelor's Degree or higher | 183 (98.4%) | 0 (0.0%) |
| Total | 1,027 (66.5%) | 29 (1.9%) |
Employment Occupations by Sex in Hanover
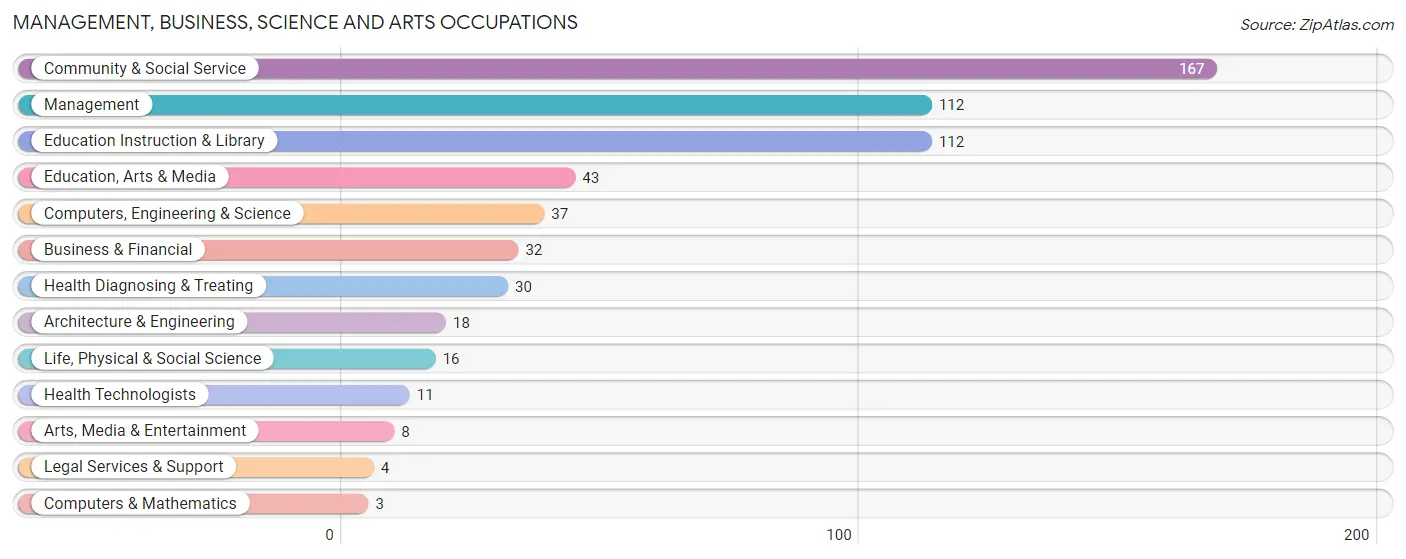
Management, Business, Science and Arts Occupations
The most common Management, Business, Science and Arts occupations in Hanover are Community & Social Service (167 | 10.4%), Management (112 | 7.0%), Education Instruction & Library (112 | 7.0%), Education, Arts & Media (43 | 2.7%), and Computers, Engineering & Science (37 | 2.3%).
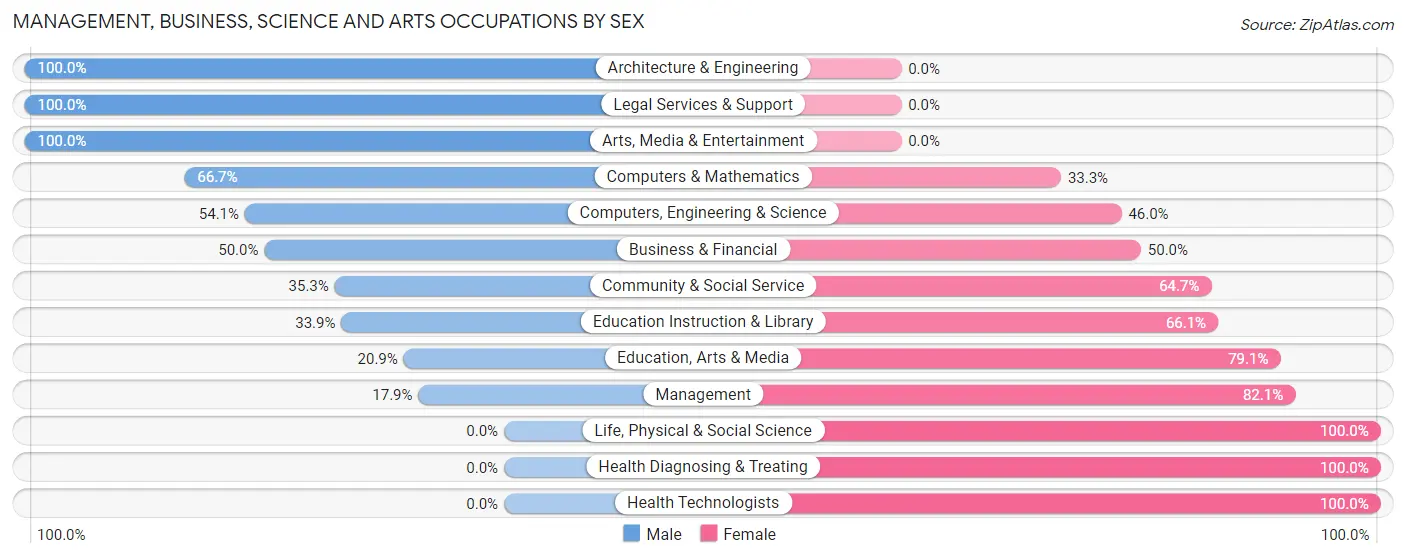
Management, Business, Science and Arts Occupations by Sex
Within the Management, Business, Science and Arts occupations in Hanover, the most male-oriented occupations are Architecture & Engineering (100.0%), Legal Services & Support (100.0%), and Arts, Media & Entertainment (100.0%), while the most female-oriented occupations are Life, Physical & Social Science (100.0%), Health Diagnosing & Treating (100.0%), and Health Technologists (100.0%).
| Occupation | Male | Female |
| Management | 20 (17.9%) | 92 (82.1%) |
| Business & Financial | 16 (50.0%) | 16 (50.0%) |
| Computers, Engineering & Science | 20 (54.0%) | 17 (46.0%) |
| Computers & Mathematics | 2 (66.7%) | 1 (33.3%) |
| Architecture & Engineering | 18 (100.0%) | 0 (0.0%) |
| Life, Physical & Social Science | 0 (0.0%) | 16 (100.0%) |
| Community & Social Service | 59 (35.3%) | 108 (64.7%) |
| Education, Arts & Media | 9 (20.9%) | 34 (79.1%) |
| Legal Services & Support | 4 (100.0%) | 0 (0.0%) |
| Education Instruction & Library | 38 (33.9%) | 74 (66.1%) |
| Arts, Media & Entertainment | 8 (100.0%) | 0 (0.0%) |
| Health Diagnosing & Treating | 0 (0.0%) | 30 (100.0%) |
| Health Technologists | 0 (0.0%) | 11 (100.0%) |
| Total (Category) | 115 (30.4%) | 263 (69.6%) |
| Total (Overall) | 721 (45.0%) | 882 (55.0%) |
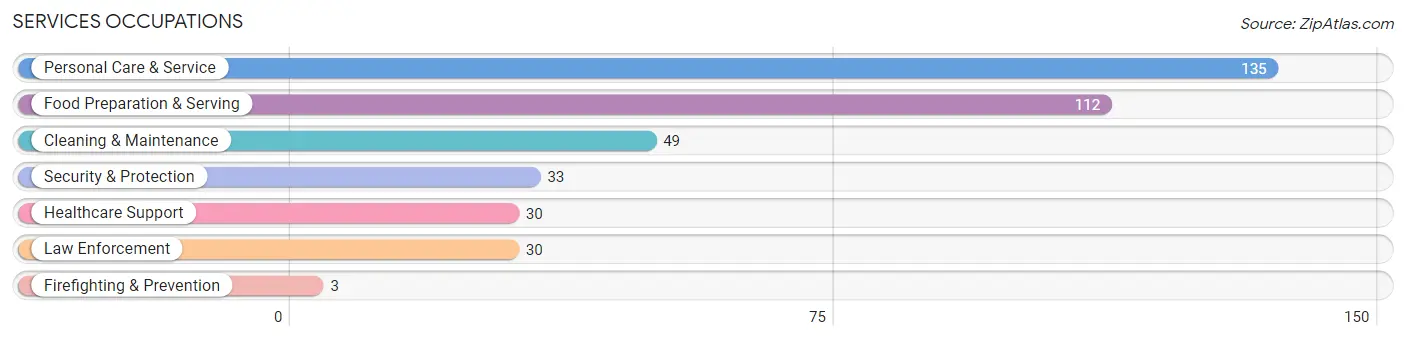
Services Occupations
The most common Services occupations in Hanover are Personal Care & Service (135 | 8.4%), Food Preparation & Serving (112 | 7.0%), Cleaning & Maintenance (49 | 3.1%), Security & Protection (33 | 2.1%), and Healthcare Support (30 | 1.9%).
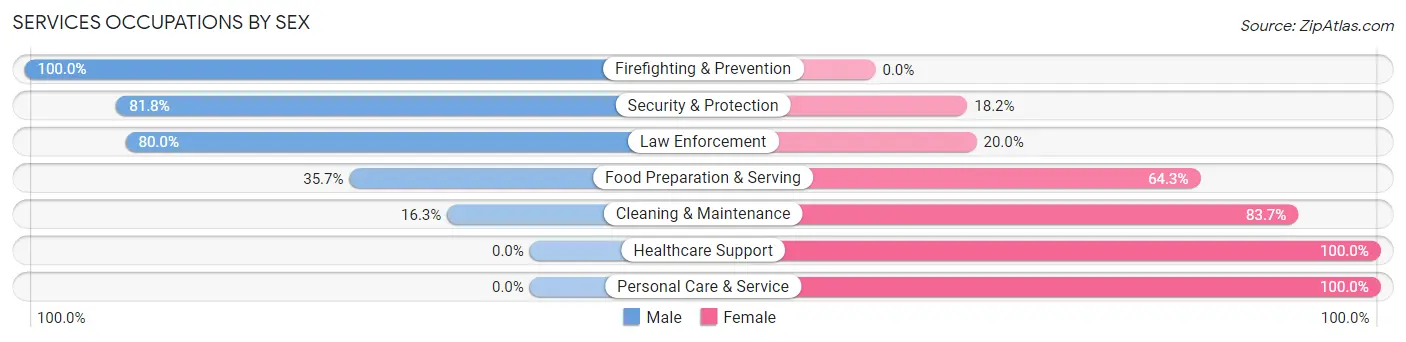
Services Occupations by Sex
Within the Services occupations in Hanover, the most male-oriented occupations are Firefighting & Prevention (100.0%), Security & Protection (81.8%), and Law Enforcement (80.0%), while the most female-oriented occupations are Healthcare Support (100.0%), Personal Care & Service (100.0%), and Cleaning & Maintenance (83.7%).
| Occupation | Male | Female |
| Healthcare Support | 0 (0.0%) | 30 (100.0%) |
| Security & Protection | 27 (81.8%) | 6 (18.2%) |
| Firefighting & Prevention | 3 (100.0%) | 0 (0.0%) |
| Law Enforcement | 24 (80.0%) | 6 (20.0%) |
| Food Preparation & Serving | 40 (35.7%) | 72 (64.3%) |
| Cleaning & Maintenance | 8 (16.3%) | 41 (83.7%) |
| Personal Care & Service | 0 (0.0%) | 135 (100.0%) |
| Total (Category) | 75 (20.9%) | 284 (79.1%) |
| Total (Overall) | 721 (45.0%) | 882 (55.0%) |
Sales and Office Occupations
The most common Sales and Office occupations in Hanover are Sales & Related (240 | 15.0%), and Office & Administration (195 | 12.2%).
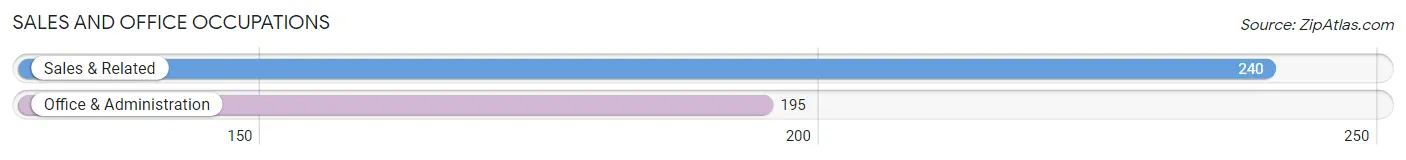
Sales and Office Occupations by Sex
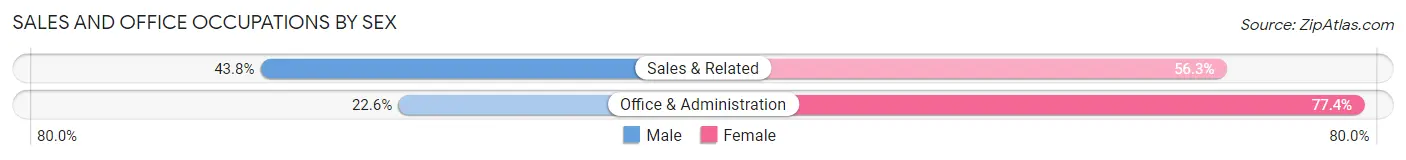
| Occupation | Male | Female |
| Sales & Related | 105 (43.8%) | 135 (56.2%) |
| Office & Administration | 44 (22.6%) | 151 (77.4%) |
| Total (Category) | 149 (34.3%) | 286 (65.7%) |
| Total (Overall) | 721 (45.0%) | 882 (55.0%) |
Natural Resources, Construction and Maintenance Occupations
The most common Natural Resources, Construction and Maintenance occupations in Hanover are Installation, Maintenance & Repair (69 | 4.3%), and Construction & Extraction (63 | 3.9%).
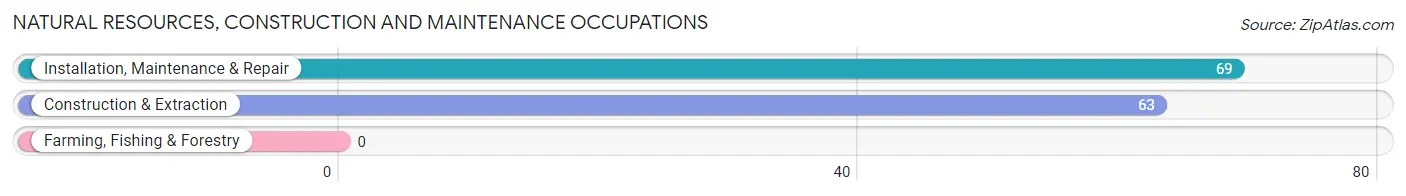
Natural Resources, Construction and Maintenance Occupations by Sex
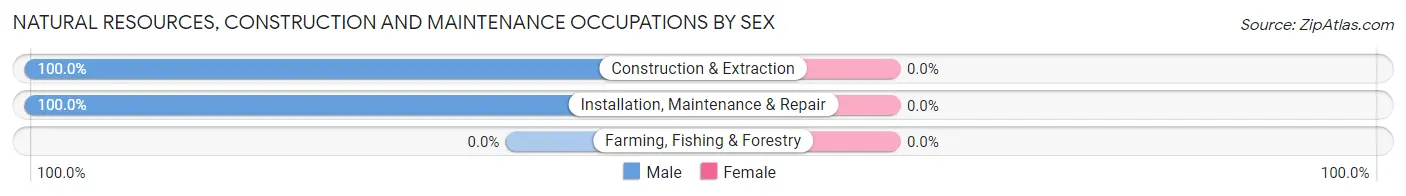
| Occupation | Male | Female |
| Farming, Fishing & Forestry | 0 (0.0%) | 0 (0.0%) |
| Construction & Extraction | 63 (100.0%) | 0 (0.0%) |
| Installation, Maintenance & Repair | 69 (100.0%) | 0 (0.0%) |
| Total (Category) | 132 (100.0%) | 0 (0.0%) |
| Total (Overall) | 721 (45.0%) | 882 (55.0%) |
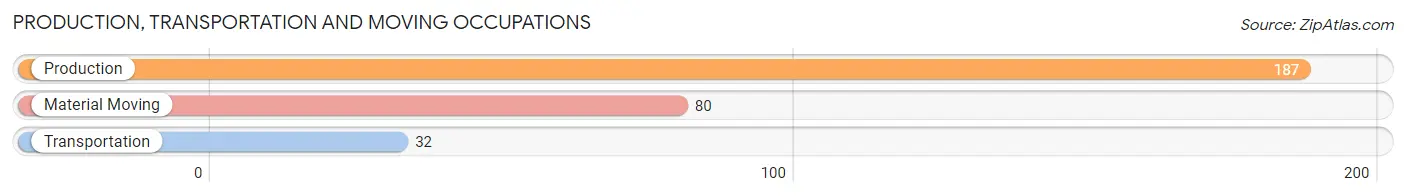
Production, Transportation and Moving Occupations
The most common Production, Transportation and Moving occupations in Hanover are Production (187 | 11.7%), Material Moving (80 | 5.0%), and Transportation (32 | 2.0%).
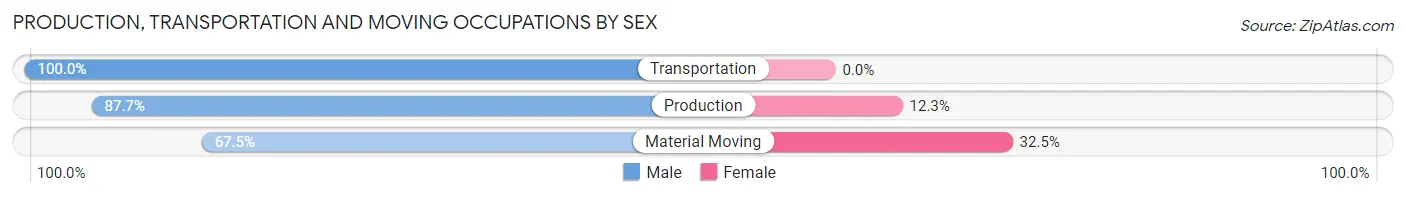
Production, Transportation and Moving Occupations by Sex
| Occupation | Male | Female |
| Production | 164 (87.7%) | 23 (12.3%) |
| Transportation | 32 (100.0%) | 0 (0.0%) |
| Material Moving | 54 (67.5%) | 26 (32.5%) |
| Total (Category) | 250 (83.6%) | 49 (16.4%) |
| Total (Overall) | 721 (45.0%) | 882 (55.0%) |
Employment Industries by Sex in Hanover
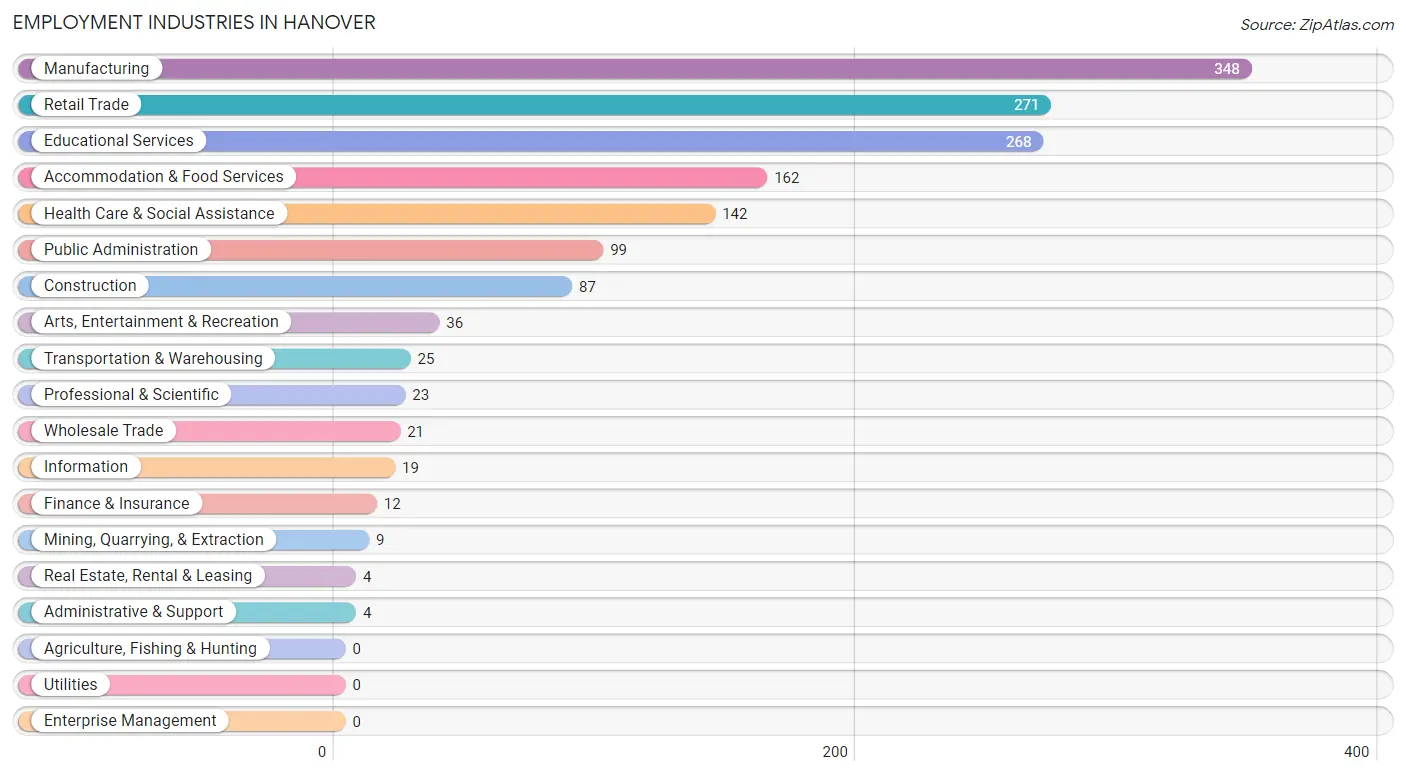
Employment Industries in Hanover
The major employment industries in Hanover include Manufacturing (348 | 21.7%), Retail Trade (271 | 16.9%), Educational Services (268 | 16.7%), Accommodation & Food Services (162 | 10.1%), and Health Care & Social Assistance (142 | 8.9%).
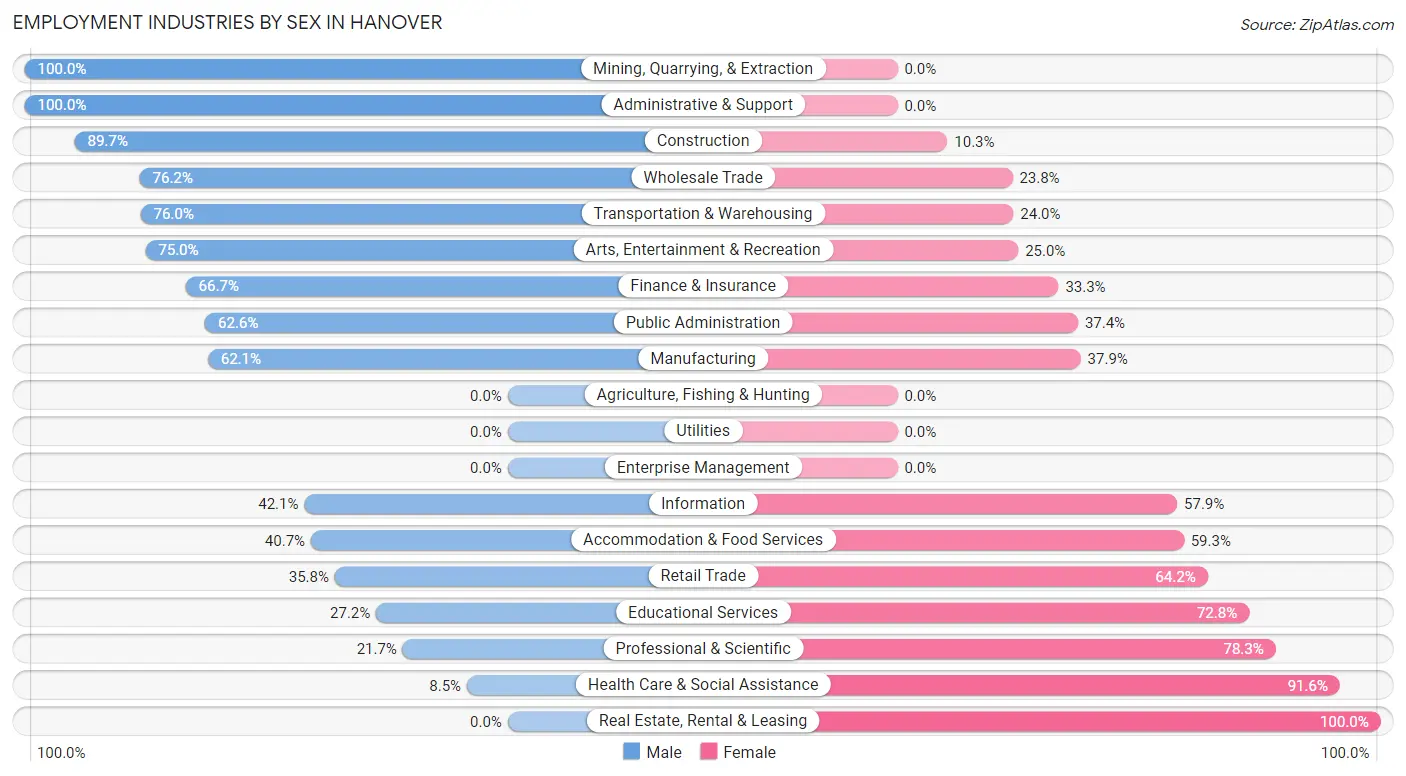
Employment Industries by Sex in Hanover
The Hanover industries that see more men than women are Mining, Quarrying, & Extraction (100.0%), Administrative & Support (100.0%), and Construction (89.7%), whereas the industries that tend to have a higher number of women are Real Estate, Rental & Leasing (100.0%), Health Care & Social Assistance (91.5%), and Professional & Scientific (78.3%).
| Industry | Male | Female |
| Agriculture, Fishing & Hunting | 0 (0.0%) | 0 (0.0%) |
| Mining, Quarrying, & Extraction | 9 (100.0%) | 0 (0.0%) |
| Construction | 78 (89.7%) | 9 (10.3%) |
| Manufacturing | 216 (62.1%) | 132 (37.9%) |
| Wholesale Trade | 16 (76.2%) | 5 (23.8%) |
| Retail Trade | 97 (35.8%) | 174 (64.2%) |
| Transportation & Warehousing | 19 (76.0%) | 6 (24.0%) |
| Utilities | 0 (0.0%) | 0 (0.0%) |
| Information | 8 (42.1%) | 11 (57.9%) |
| Finance & Insurance | 8 (66.7%) | 4 (33.3%) |
| Real Estate, Rental & Leasing | 0 (0.0%) | 4 (100.0%) |
| Professional & Scientific | 5 (21.7%) | 18 (78.3%) |
| Enterprise Management | 0 (0.0%) | 0 (0.0%) |
| Administrative & Support | 4 (100.0%) | 0 (0.0%) |
| Educational Services | 73 (27.2%) | 195 (72.8%) |
| Health Care & Social Assistance | 12 (8.5%) | 130 (91.5%) |
| Arts, Entertainment & Recreation | 27 (75.0%) | 9 (25.0%) |
| Accommodation & Food Services | 66 (40.7%) | 96 (59.3%) |
| Public Administration | 62 (62.6%) | 37 (37.4%) |
| Total | 721 (45.0%) | 882 (55.0%) |
Education in Hanover
School Enrollment in Hanover
The most common levels of schooling among the 1,454 students in Hanover are college / undergraduate (953 | 65.5%), elementary school (188 | 12.9%), and middle school (94 | 6.5%).
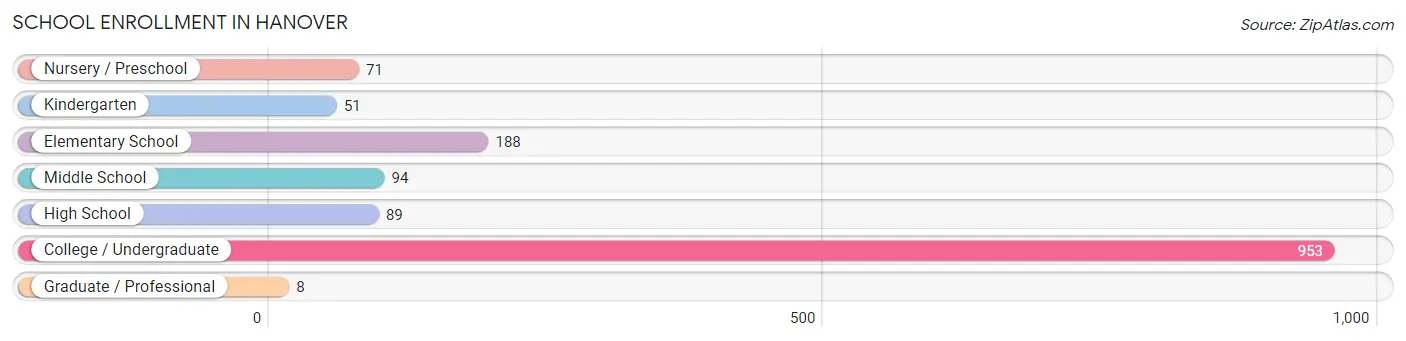
| School Level | # Students | % Students |
| Nursery / Preschool | 71 | 4.9% |
| Kindergarten | 51 | 3.5% |
| Elementary School | 188 | 12.9% |
| Middle School | 94 | 6.5% |
| High School | 89 | 6.1% |
| College / Undergraduate | 953 | 65.5% |
| Graduate / Professional | 8 | 0.5% |
| Total | 1,454 | 100.0% |
School Enrollment by Age by Funding Source in Hanover
Out of a total of 1,454 students who are enrolled in schools in Hanover, 856 (58.9%) attend a private institution, while the remaining 598 (41.1%) are enrolled in public schools. The age group of 20 to 24 year olds has the highest likelihood of being enrolled in private schools, with 570 (95.5% in the age bracket) enrolled. Conversely, the age group of 3 to 4 year olds has the lowest likelihood of being enrolled in a private school, with 42 (100.0% in the age bracket) attending a public institution.
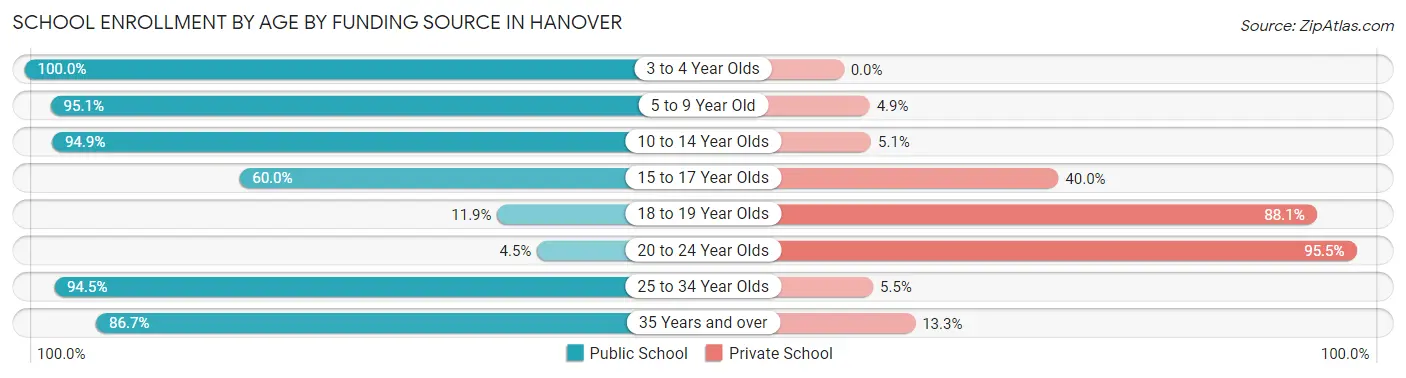
| Age Bracket | Public School | Private School |
| 3 to 4 Year Olds | 42 (100.0%) | 0 (0.0%) |
| 5 to 9 Year Old | 235 (95.1%) | 12 (4.9%) |
| 10 to 14 Year Olds | 130 (94.9%) | 7 (5.1%) |
| 15 to 17 Year Olds | 36 (60.0%) | 24 (40.0%) |
| 18 to 19 Year Olds | 32 (11.9%) | 236 (88.1%) |
| 20 to 24 Year Olds | 27 (4.5%) | 570 (95.5%) |
| 25 to 34 Year Olds | 69 (94.5%) | 4 (5.5%) |
| 35 Years and over | 26 (86.7%) | 4 (13.3%) |
| Total | 598 (41.1%) | 856 (58.9%) |
Educational Attainment by Field of Study in Hanover
Science & technology (49 | 17.7%), social sciences (36 | 13.0%), education (26 | 9.4%), bio, nature & agricultural (25 | 9.1%), and literature & languages (23 | 8.3%) are the most common fields of study among 276 individuals in Hanover who have obtained a bachelor's degree or higher.
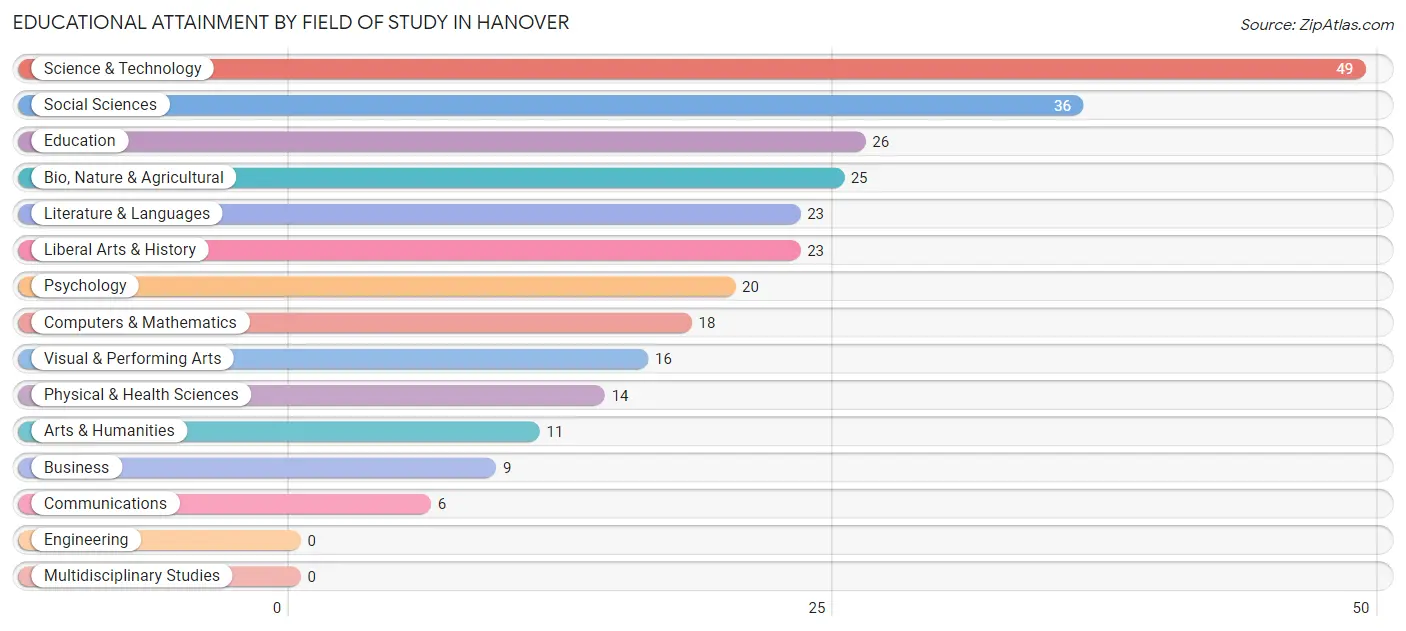
| Field of Study | # Graduates | % Graduates |
| Computers & Mathematics | 18 | 6.5% |
| Bio, Nature & Agricultural | 25 | 9.1% |
| Physical & Health Sciences | 14 | 5.1% |
| Psychology | 20 | 7.2% |
| Social Sciences | 36 | 13.0% |
| Engineering | 0 | 0.0% |
| Multidisciplinary Studies | 0 | 0.0% |
| Science & Technology | 49 | 17.7% |
| Business | 9 | 3.3% |
| Education | 26 | 9.4% |
| Literature & Languages | 23 | 8.3% |
| Liberal Arts & History | 23 | 8.3% |
| Visual & Performing Arts | 16 | 5.8% |
| Communications | 6 | 2.2% |
| Arts & Humanities | 11 | 4.0% |
| Total | 276 | 100.0% |
Transportation & Commute in Hanover
Vehicle Availability by Sex in Hanover
The most prevalent vehicle ownership categories in Hanover are males with 2 vehicles (286, accounting for 47.8%) and females with 2 vehicles (332, making up 46.2%).
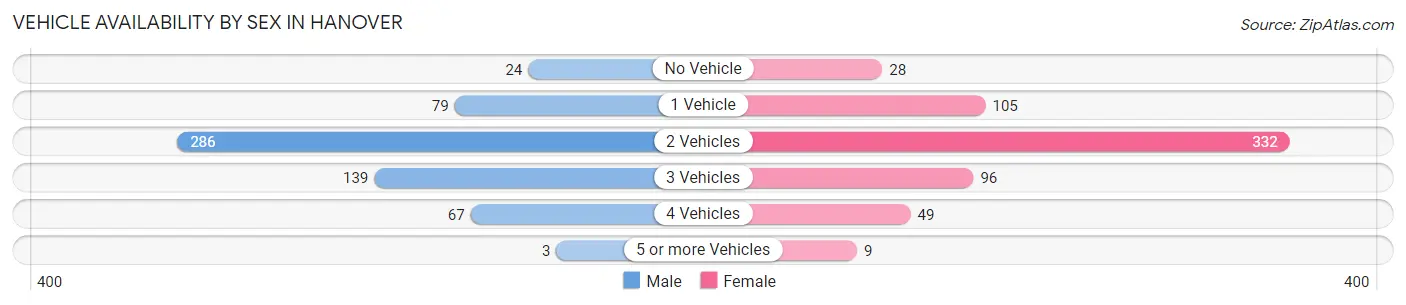
| Vehicles Available | Male | Female |
| No Vehicle | 24 (4.0%) | 28 (4.5%) |
| 1 Vehicle | 79 (13.2%) | 105 (17.0%) |
| 2 Vehicles | 286 (47.8%) | 332 (53.6%) |
| 3 Vehicles | 139 (23.2%) | 96 (15.5%) |
| 4 Vehicles | 67 (11.2%) | 49 (7.9%) |
| 5 or more Vehicles | 3 (0.5%) | 9 (1.5%) |
| Total | 598 (100.0%) | 619 (100.0%) |
Commute Time in Hanover
The most frequently occuring commute durations in Hanover are 15 to 19 minutes (392 commuters, 25.8%), 5 to 9 minutes (323 commuters, 21.2%), and 10 to 14 minutes (296 commuters, 19.5%).
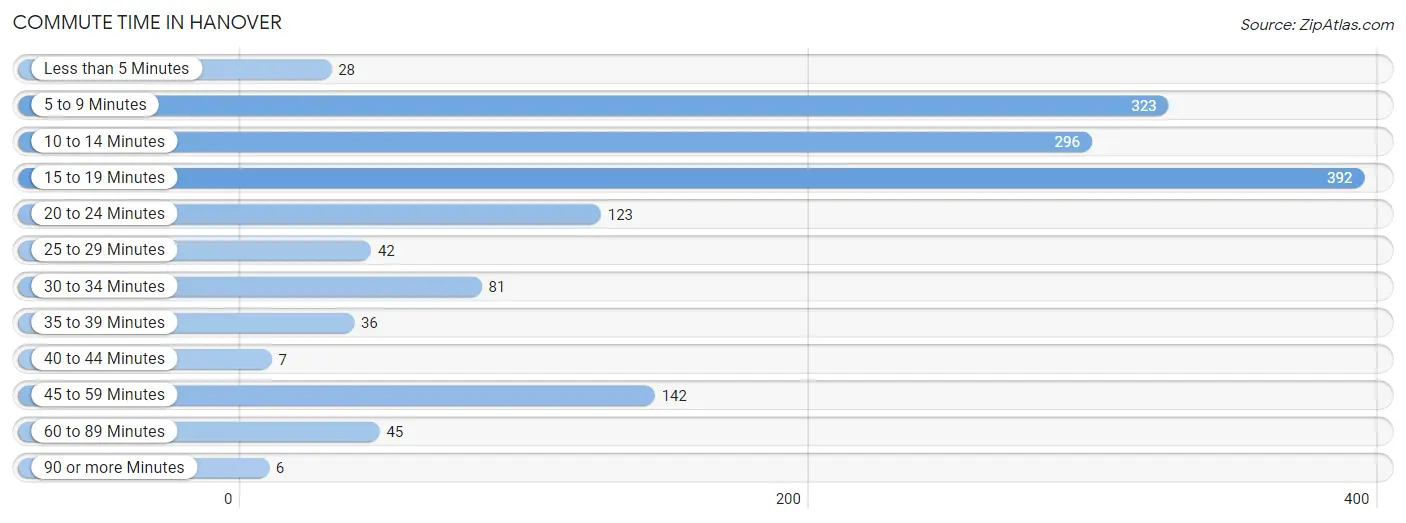
| Commute Time | # Commuters | % Commuters |
| Less than 5 Minutes | 28 | 1.8% |
| 5 to 9 Minutes | 323 | 21.2% |
| 10 to 14 Minutes | 296 | 19.5% |
| 15 to 19 Minutes | 392 | 25.8% |
| 20 to 24 Minutes | 123 | 8.1% |
| 25 to 29 Minutes | 42 | 2.8% |
| 30 to 34 Minutes | 81 | 5.3% |
| 35 to 39 Minutes | 36 | 2.4% |
| 40 to 44 Minutes | 7 | 0.5% |
| 45 to 59 Minutes | 142 | 9.3% |
| 60 to 89 Minutes | 45 | 3.0% |
| 90 or more Minutes | 6 | 0.4% |
Commute Time by Sex in Hanover
The most common commute times in Hanover are 10 to 14 minutes (143 commuters, 20.5%) for males and 15 to 19 minutes (287 commuters, 34.8%) for females.
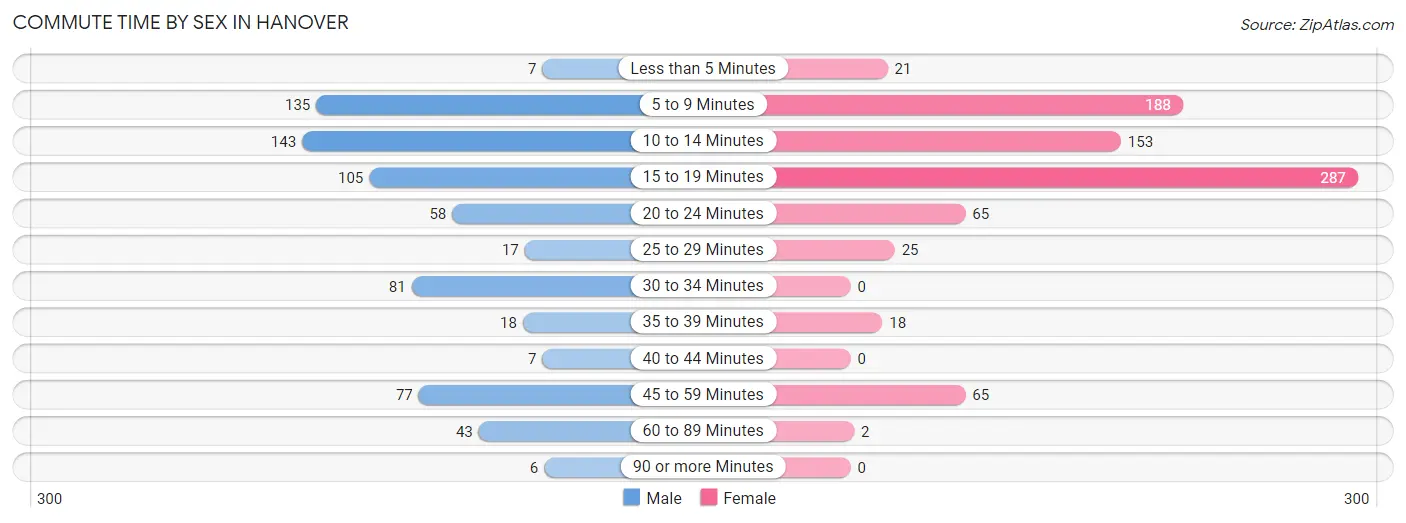
| Commute Time | Male | Female |
| Less than 5 Minutes | 7 (1.0%) | 21 (2.5%) |
| 5 to 9 Minutes | 135 (19.4%) | 188 (22.8%) |
| 10 to 14 Minutes | 143 (20.5%) | 153 (18.6%) |
| 15 to 19 Minutes | 105 (15.1%) | 287 (34.8%) |
| 20 to 24 Minutes | 58 (8.3%) | 65 (7.9%) |
| 25 to 29 Minutes | 17 (2.4%) | 25 (3.0%) |
| 30 to 34 Minutes | 81 (11.6%) | 0 (0.0%) |
| 35 to 39 Minutes | 18 (2.6%) | 18 (2.2%) |
| 40 to 44 Minutes | 7 (1.0%) | 0 (0.0%) |
| 45 to 59 Minutes | 77 (11.1%) | 65 (7.9%) |
| 60 to 89 Minutes | 43 (6.2%) | 2 (0.2%) |
| 90 or more Minutes | 6 (0.9%) | 0 (0.0%) |
Time of Departure to Work by Sex in Hanover
The most frequent times of departure to work in Hanover are 4:00 PM to 11:59 PM (93, 13.3%) for males and 4:00 PM to 11:59 PM (267, 32.4%) for females.
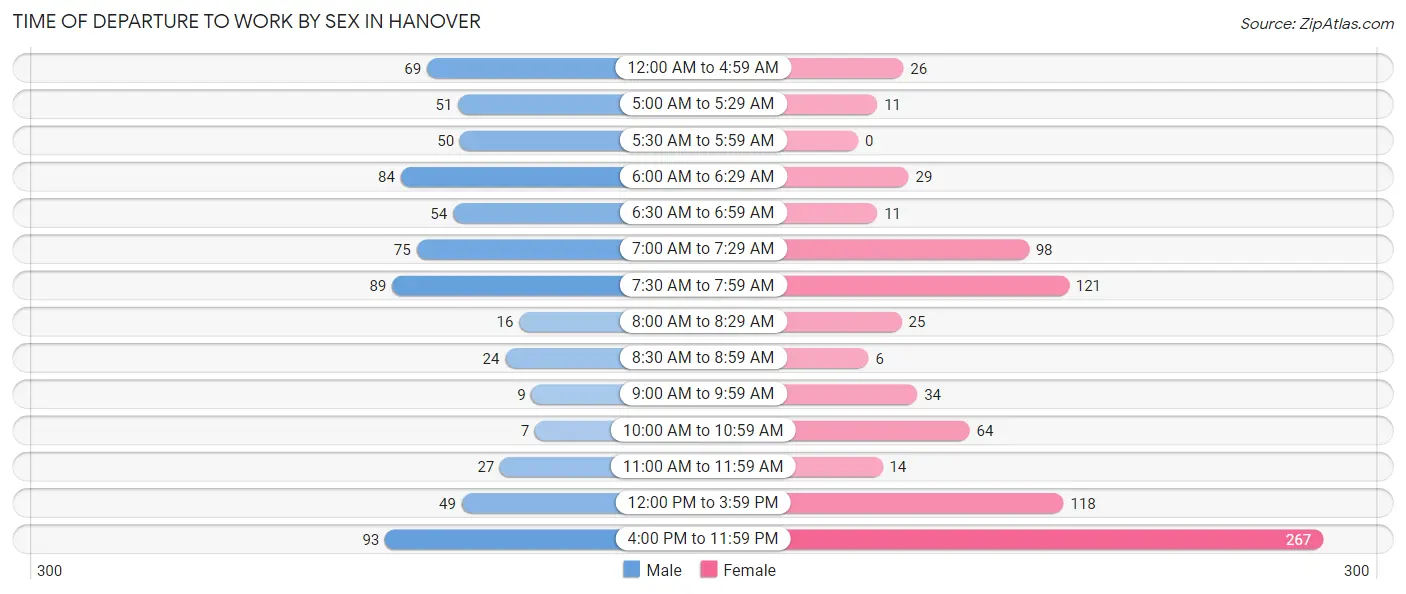
| Time of Departure | Male | Female |
| 12:00 AM to 4:59 AM | 69 (9.9%) | 26 (3.2%) |
| 5:00 AM to 5:29 AM | 51 (7.3%) | 11 (1.3%) |
| 5:30 AM to 5:59 AM | 50 (7.2%) | 0 (0.0%) |
| 6:00 AM to 6:29 AM | 84 (12.0%) | 29 (3.5%) |
| 6:30 AM to 6:59 AM | 54 (7.7%) | 11 (1.3%) |
| 7:00 AM to 7:29 AM | 75 (10.8%) | 98 (11.9%) |
| 7:30 AM to 7:59 AM | 89 (12.8%) | 121 (14.7%) |
| 8:00 AM to 8:29 AM | 16 (2.3%) | 25 (3.0%) |
| 8:30 AM to 8:59 AM | 24 (3.4%) | 6 (0.7%) |
| 9:00 AM to 9:59 AM | 9 (1.3%) | 34 (4.1%) |
| 10:00 AM to 10:59 AM | 7 (1.0%) | 64 (7.8%) |
| 11:00 AM to 11:59 AM | 27 (3.9%) | 14 (1.7%) |
| 12:00 PM to 3:59 PM | 49 (7.0%) | 118 (14.3%) |
| 4:00 PM to 11:59 PM | 93 (13.3%) | 267 (32.4%) |
| Total | 697 (100.0%) | 824 (100.0%) |
Housing Occupancy in Hanover
Occupancy by Ownership in Hanover
Of the total 971 dwellings in Hanover, owner-occupied units account for 654 (67.3%), while renter-occupied units make up 317 (32.7%).
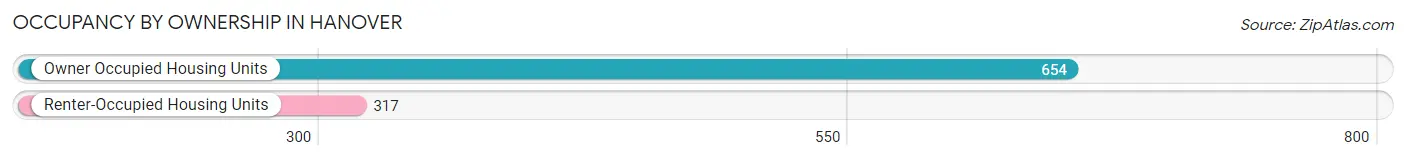
| Occupancy | # Housing Units | % Housing Units |
| Owner Occupied Housing Units | 654 | 67.3% |
| Renter-Occupied Housing Units | 317 | 32.7% |
| Total Occupied Housing Units | 971 | 100.0% |
Occupancy by Household Size in Hanover
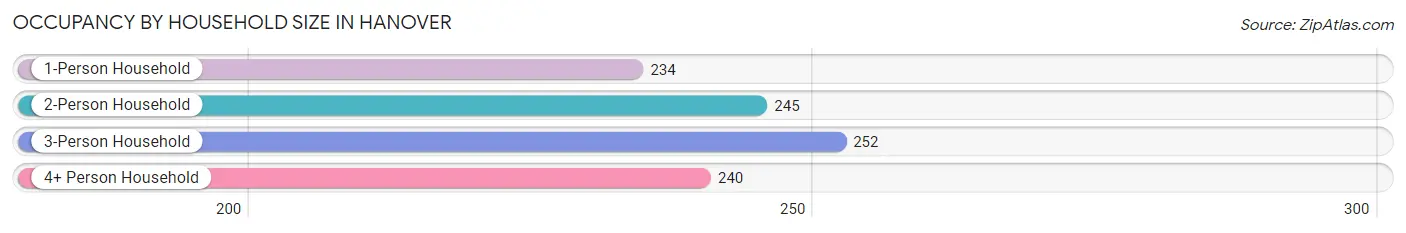
| Household Size | # Housing Units | % Housing Units |
| 1-Person Household | 234 | 24.1% |
| 2-Person Household | 245 | 25.2% |
| 3-Person Household | 252 | 26.0% |
| 4+ Person Household | 240 | 24.7% |
| Total Housing Units | 971 | 100.0% |
Occupancy by Ownership by Household Size in Hanover
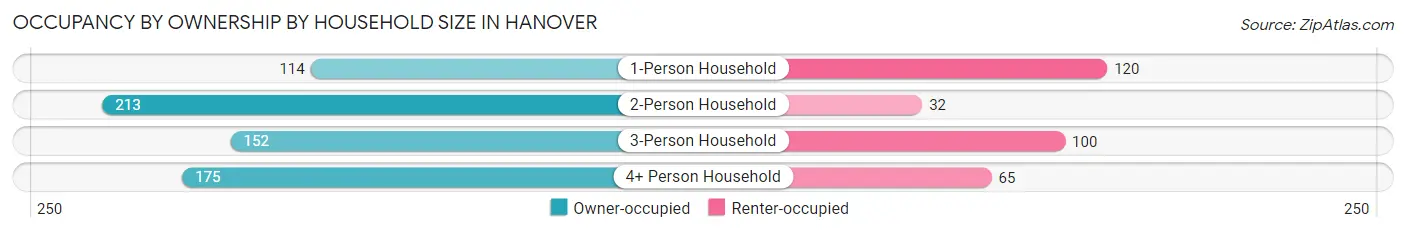
| Household Size | Owner-occupied | Renter-occupied |
| 1-Person Household | 114 (48.7%) | 120 (51.3%) |
| 2-Person Household | 213 (86.9%) | 32 (13.1%) |
| 3-Person Household | 152 (60.3%) | 100 (39.7%) |
| 4+ Person Household | 175 (72.9%) | 65 (27.1%) |
| Total Housing Units | 654 (67.3%) | 317 (32.7%) |
Occupancy by Educational Attainment in Hanover
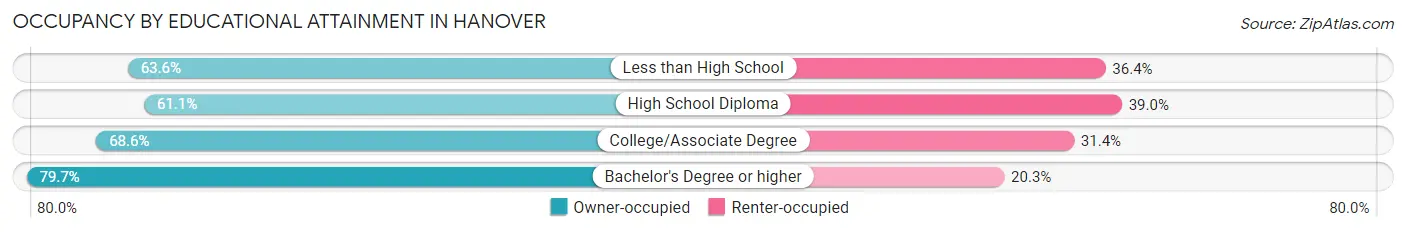
| Household Size | Owner-occupied | Renter-occupied |
| Less than High School | 14 (63.6%) | 8 (36.4%) |
| High School Diploma | 210 (61.1%) | 134 (39.0%) |
| College/Associate Degree | 324 (68.6%) | 148 (31.4%) |
| Bachelor's Degree or higher | 106 (79.7%) | 27 (20.3%) |
Occupancy by Age of Householder in Hanover
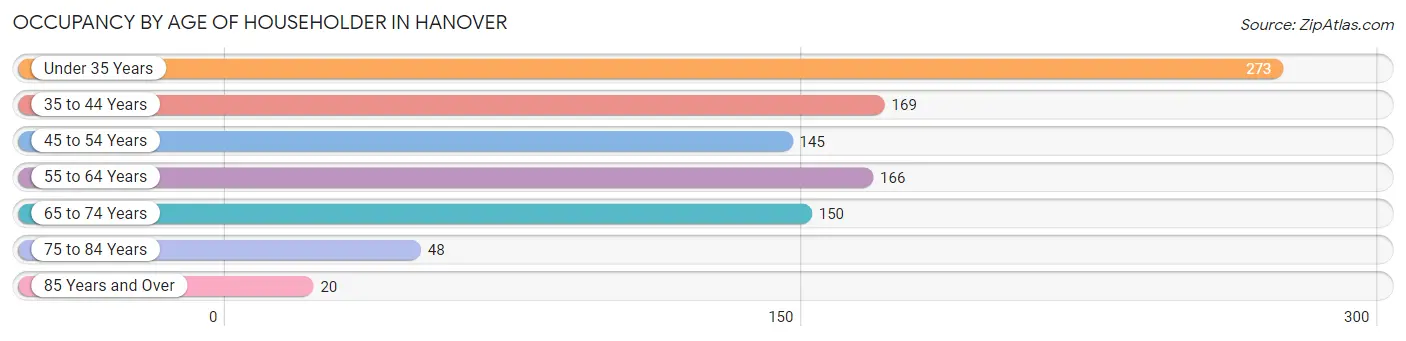
| Age Bracket | # Households | % Households |
| Under 35 Years | 273 | 28.1% |
| 35 to 44 Years | 169 | 17.4% |
| 45 to 54 Years | 145 | 14.9% |
| 55 to 64 Years | 166 | 17.1% |
| 65 to 74 Years | 150 | 15.4% |
| 75 to 84 Years | 48 | 4.9% |
| 85 Years and Over | 20 | 2.1% |
| Total | 971 | 100.0% |
Housing Finances in Hanover
Median Income by Occupancy in Hanover
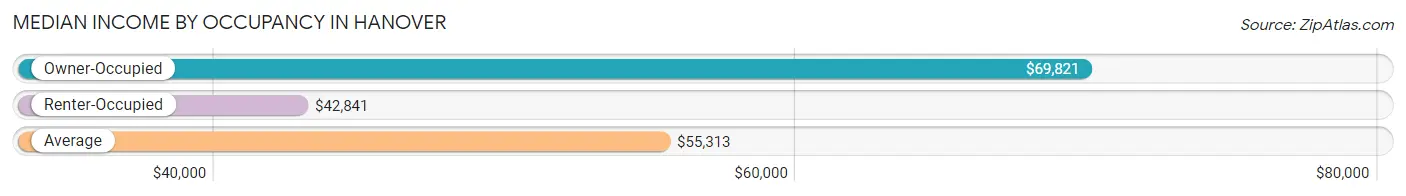
| Occupancy Type | # Households | Median Income |
| Owner-Occupied | 654 (67.3%) | $69,821 |
| Renter-Occupied | 317 (32.7%) | $42,841 |
| Average | 971 (100.0%) | $55,313 |
Occupancy by Householder Income Bracket in Hanover
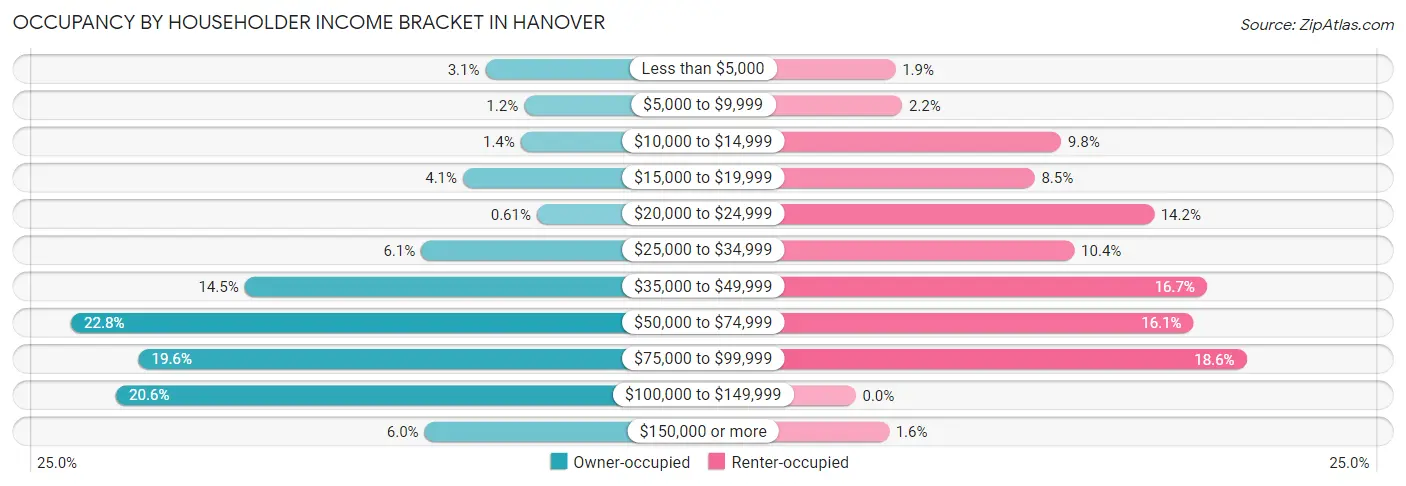
| Income Bracket | Owner-occupied | Renter-occupied |
| Less than $5,000 | 20 (3.1%) | 6 (1.9%) |
| $5,000 to $9,999 | 8 (1.2%) | 7 (2.2%) |
| $10,000 to $14,999 | 9 (1.4%) | 31 (9.8%) |
| $15,000 to $19,999 | 27 (4.1%) | 27 (8.5%) |
| $20,000 to $24,999 | 4 (0.6%) | 45 (14.2%) |
| $25,000 to $34,999 | 40 (6.1%) | 33 (10.4%) |
| $35,000 to $49,999 | 95 (14.5%) | 53 (16.7%) |
| $50,000 to $74,999 | 149 (22.8%) | 51 (16.1%) |
| $75,000 to $99,999 | 128 (19.6%) | 59 (18.6%) |
| $100,000 to $149,999 | 135 (20.6%) | 0 (0.0%) |
| $150,000 or more | 39 (6.0%) | 5 (1.6%) |
| Total | 654 (100.0%) | 317 (100.0%) |
Monthly Housing Cost Tiers in Hanover
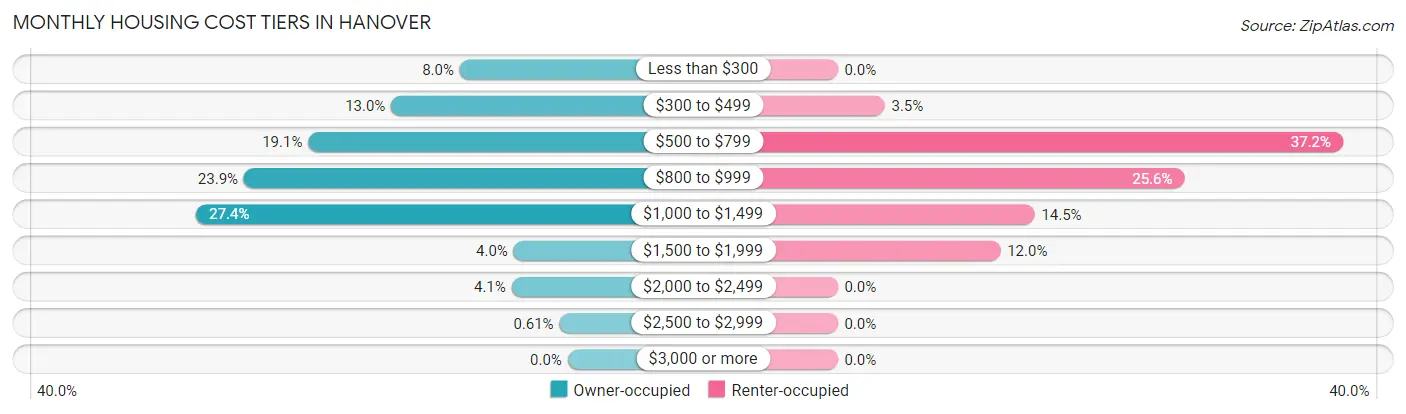
| Monthly Cost | Owner-occupied | Renter-occupied |
| Less than $300 | 52 (8.0%) | 0 (0.0%) |
| $300 to $499 | 85 (13.0%) | 11 (3.5%) |
| $500 to $799 | 125 (19.1%) | 118 (37.2%) |
| $800 to $999 | 156 (23.8%) | 81 (25.6%) |
| $1,000 to $1,499 | 179 (27.4%) | 46 (14.5%) |
| $1,500 to $1,999 | 26 (4.0%) | 38 (12.0%) |
| $2,000 to $2,499 | 27 (4.1%) | 0 (0.0%) |
| $2,500 to $2,999 | 4 (0.6%) | 0 (0.0%) |
| $3,000 or more | 0 (0.0%) | 0 (0.0%) |
| Total | 654 (100.0%) | 317 (100.0%) |
Physical Housing Characteristics in Hanover
Housing Structures in Hanover
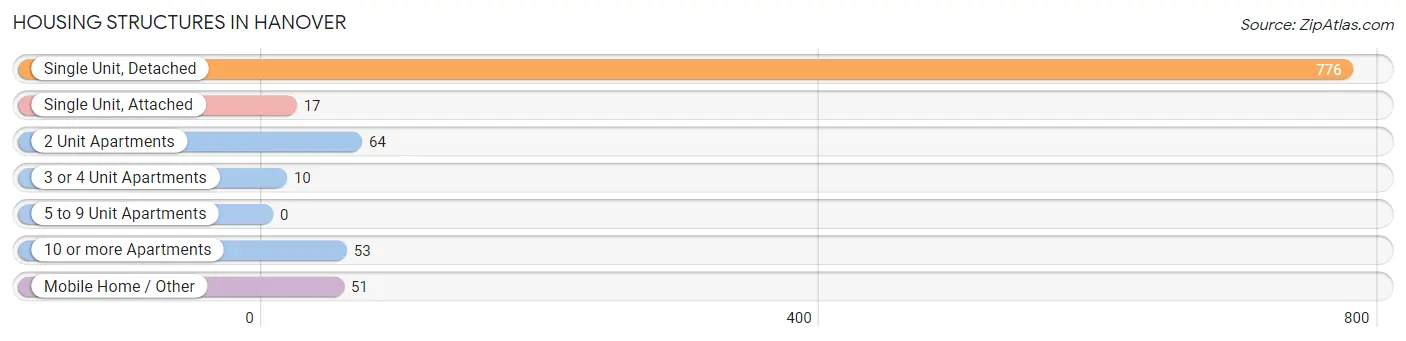
| Structure Type | # Housing Units | % Housing Units |
| Single Unit, Detached | 776 | 79.9% |
| Single Unit, Attached | 17 | 1.8% |
| 2 Unit Apartments | 64 | 6.6% |
| 3 or 4 Unit Apartments | 10 | 1.0% |
| 5 to 9 Unit Apartments | 0 | 0.0% |
| 10 or more Apartments | 53 | 5.5% |
| Mobile Home / Other | 51 | 5.2% |
| Total | 971 | 100.0% |
Housing Structures by Occupancy in Hanover
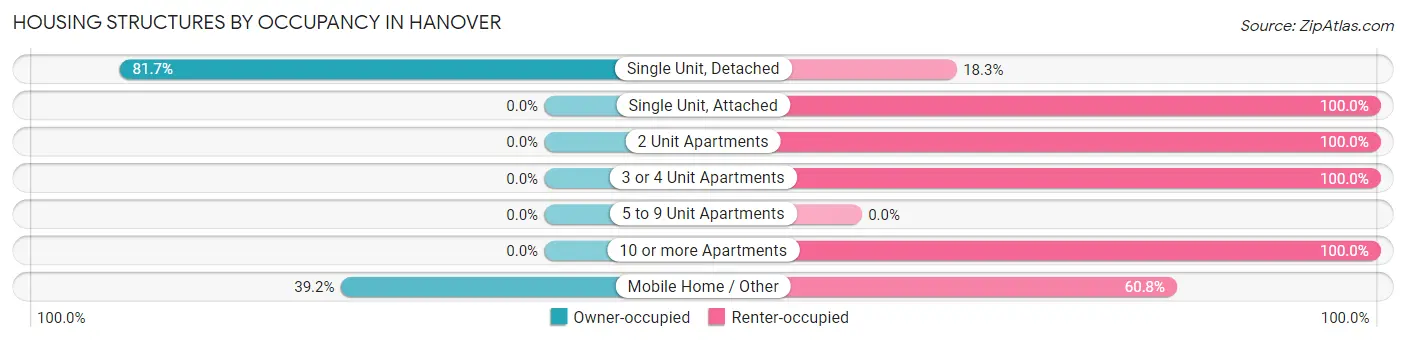
| Structure Type | Owner-occupied | Renter-occupied |
| Single Unit, Detached | 634 (81.7%) | 142 (18.3%) |
| Single Unit, Attached | 0 (0.0%) | 17 (100.0%) |
| 2 Unit Apartments | 0 (0.0%) | 64 (100.0%) |
| 3 or 4 Unit Apartments | 0 (0.0%) | 10 (100.0%) |
| 5 to 9 Unit Apartments | 0 (0.0%) | 0 (0.0%) |
| 10 or more Apartments | 0 (0.0%) | 53 (100.0%) |
| Mobile Home / Other | 20 (39.2%) | 31 (60.8%) |
| Total | 654 (67.3%) | 317 (32.7%) |
Housing Structures by Number of Rooms in Hanover
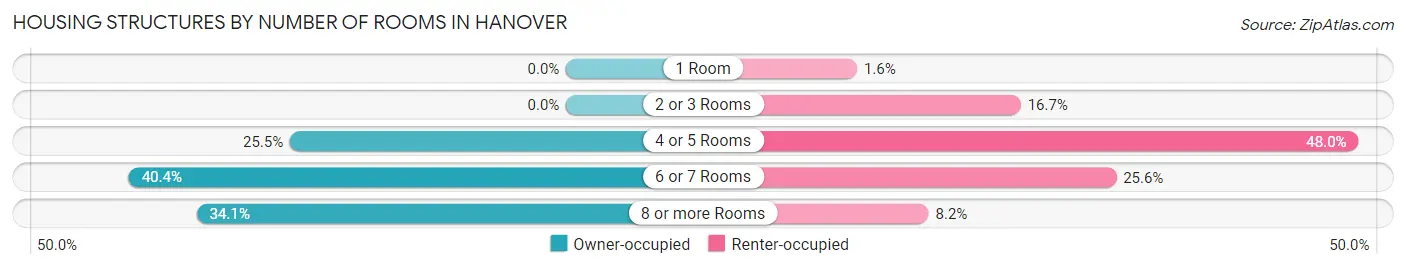
| Number of Rooms | Owner-occupied | Renter-occupied |
| 1 Room | 0 (0.0%) | 5 (1.6%) |
| 2 or 3 Rooms | 0 (0.0%) | 53 (16.7%) |
| 4 or 5 Rooms | 167 (25.5%) | 152 (47.9%) |
| 6 or 7 Rooms | 264 (40.4%) | 81 (25.6%) |
| 8 or more Rooms | 223 (34.1%) | 26 (8.2%) |
| Total | 654 (100.0%) | 317 (100.0%) |
Housing Structure by Heating Type in Hanover
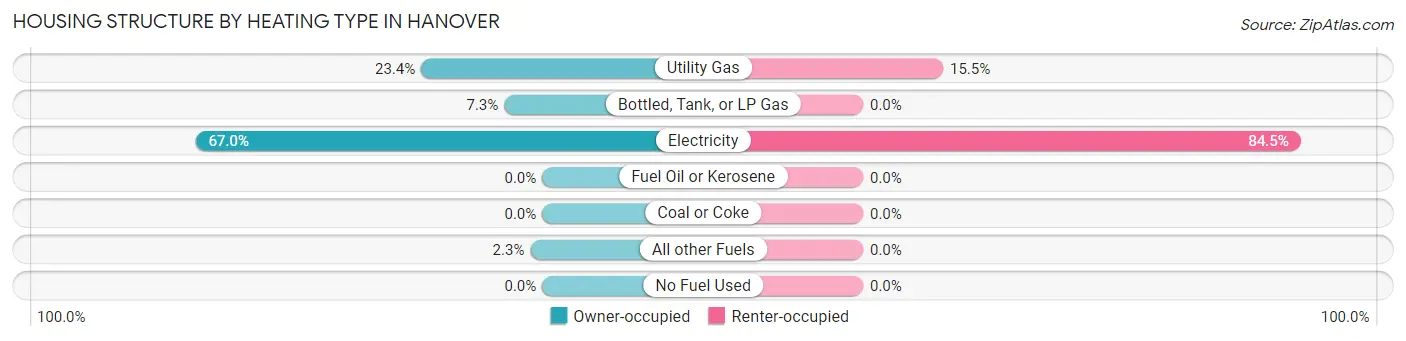
| Heating Type | Owner-occupied | Renter-occupied |
| Utility Gas | 153 (23.4%) | 49 (15.5%) |
| Bottled, Tank, or LP Gas | 48 (7.3%) | 0 (0.0%) |
| Electricity | 438 (67.0%) | 268 (84.5%) |
| Fuel Oil or Kerosene | 0 (0.0%) | 0 (0.0%) |
| Coal or Coke | 0 (0.0%) | 0 (0.0%) |
| All other Fuels | 15 (2.3%) | 0 (0.0%) |
| No Fuel Used | 0 (0.0%) | 0 (0.0%) |
| Total | 654 (100.0%) | 317 (100.0%) |
Household Vehicle Usage in Hanover
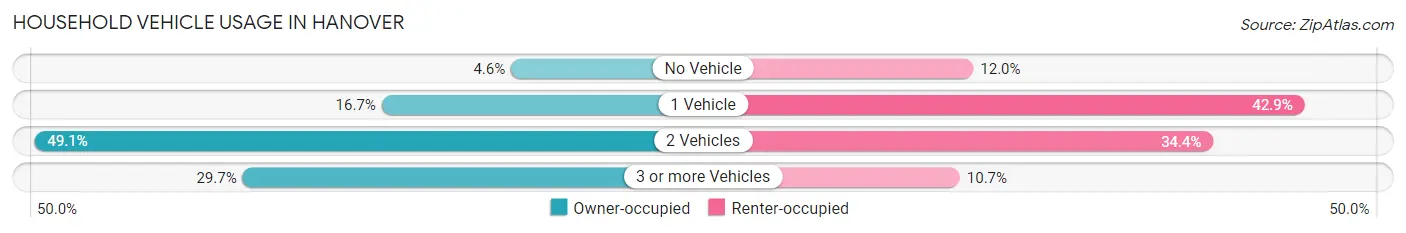
| Vehicles per Household | Owner-occupied | Renter-occupied |
| No Vehicle | 30 (4.6%) | 38 (12.0%) |
| 1 Vehicle | 109 (16.7%) | 136 (42.9%) |
| 2 Vehicles | 321 (49.1%) | 109 (34.4%) |
| 3 or more Vehicles | 194 (29.7%) | 34 (10.7%) |
| Total | 654 (100.0%) | 317 (100.0%) |
Real Estate & Mortgages in Hanover
Real Estate and Mortgage Overview in Hanover
| Characteristic | Without Mortgage | With Mortgage |
| Housing Units | 235 | 419 |
| Median Property Value | $135,200 | $124,700 |
| Median Household Income | $54,688 | $24 |
| Monthly Housing Costs | $395 | $0 |
| Real Estate Taxes | $1,231 | $16 |
Property Value by Mortgage Status in Hanover
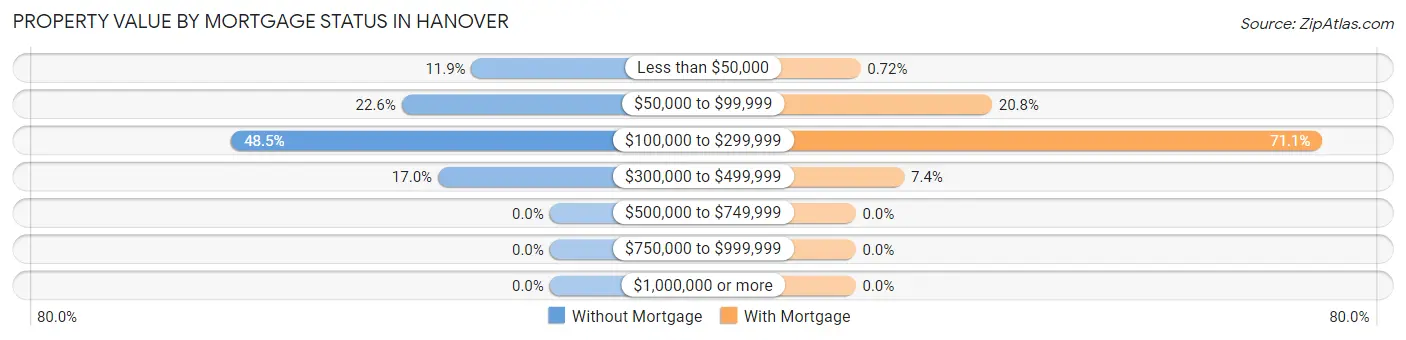
| Property Value | Without Mortgage | With Mortgage |
| Less than $50,000 | 28 (11.9%) | 3 (0.7%) |
| $50,000 to $99,999 | 53 (22.6%) | 87 (20.8%) |
| $100,000 to $299,999 | 114 (48.5%) | 298 (71.1%) |
| $300,000 to $499,999 | 40 (17.0%) | 31 (7.4%) |
| $500,000 to $749,999 | 0 (0.0%) | 0 (0.0%) |
| $750,000 to $999,999 | 0 (0.0%) | 0 (0.0%) |
| $1,000,000 or more | 0 (0.0%) | 0 (0.0%) |
| Total | 235 (100.0%) | 419 (100.0%) |
Household Income by Mortgage Status in Hanover
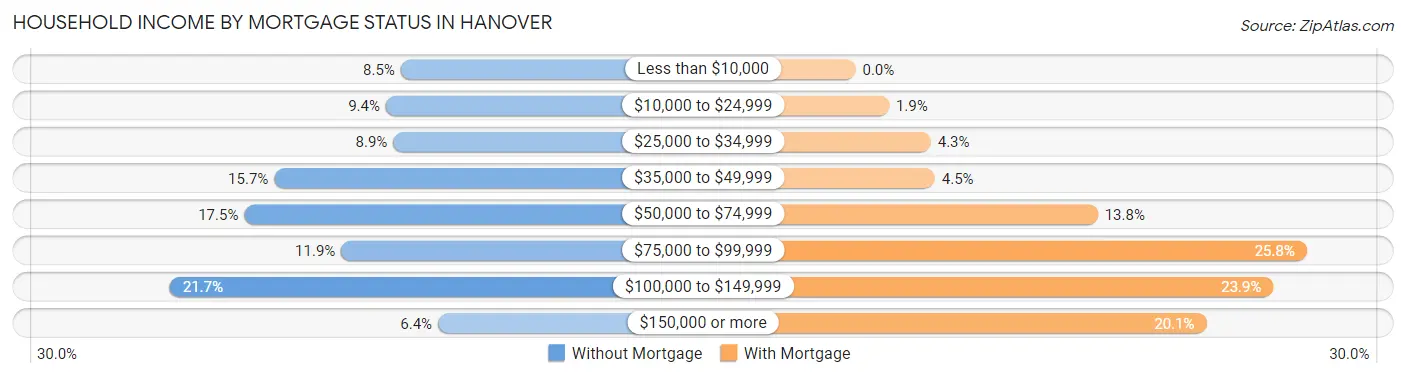
| Household Income | Without Mortgage | With Mortgage |
| Less than $10,000 | 20 (8.5%) | 0 (0.0%) |
| $10,000 to $24,999 | 22 (9.4%) | 8 (1.9%) |
| $25,000 to $34,999 | 21 (8.9%) | 18 (4.3%) |
| $35,000 to $49,999 | 37 (15.7%) | 19 (4.5%) |
| $50,000 to $74,999 | 41 (17.4%) | 58 (13.8%) |
| $75,000 to $99,999 | 28 (11.9%) | 108 (25.8%) |
| $100,000 to $149,999 | 51 (21.7%) | 100 (23.9%) |
| $150,000 or more | 15 (6.4%) | 84 (20.1%) |
| Total | 235 (100.0%) | 419 (100.0%) |
Property Value to Household Income Ratio in Hanover
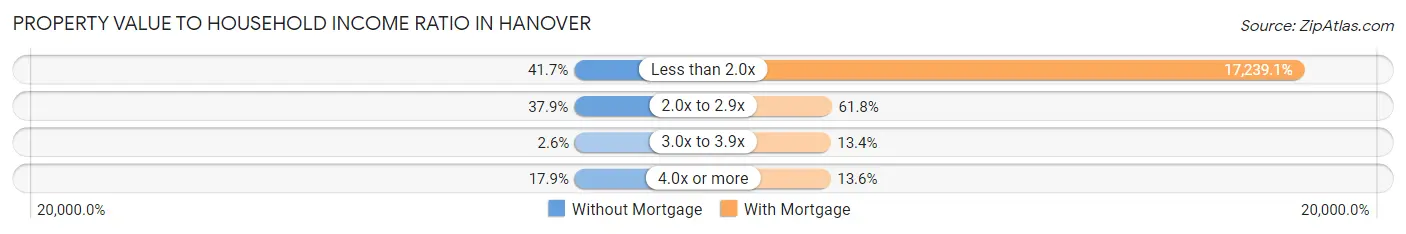
| Value-to-Income Ratio | Without Mortgage | With Mortgage |
| Less than 2.0x | 98 (41.7%) | 72,232 (17,239.1%) |
| 2.0x to 2.9x | 89 (37.9%) | 259 (61.8%) |
| 3.0x to 3.9x | 6 (2.5%) | 56 (13.4%) |
| 4.0x or more | 42 (17.9%) | 57 (13.6%) |
| Total | 235 (100.0%) | 419 (100.0%) |
Real Estate Taxes by Mortgage Status in Hanover
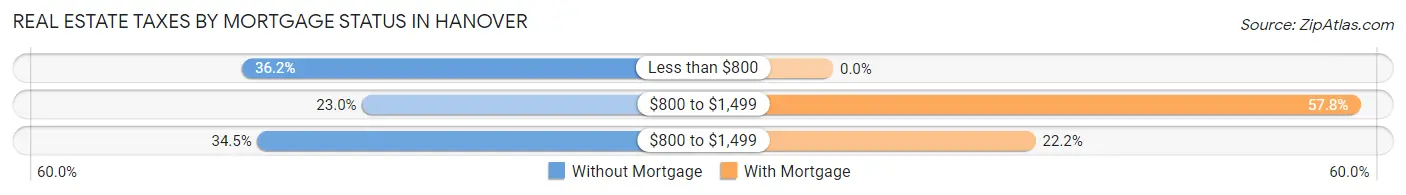
| Property Taxes | Without Mortgage | With Mortgage |
| Less than $800 | 85 (36.2%) | 0 (0.0%) |
| $800 to $1,499 | 54 (23.0%) | 242 (57.8%) |
| $800 to $1,499 | 81 (34.5%) | 93 (22.2%) |
| Total | 235 (100.0%) | 419 (100.0%) |
Health & Disability in Hanover
Health Insurance Coverage by Age in Hanover
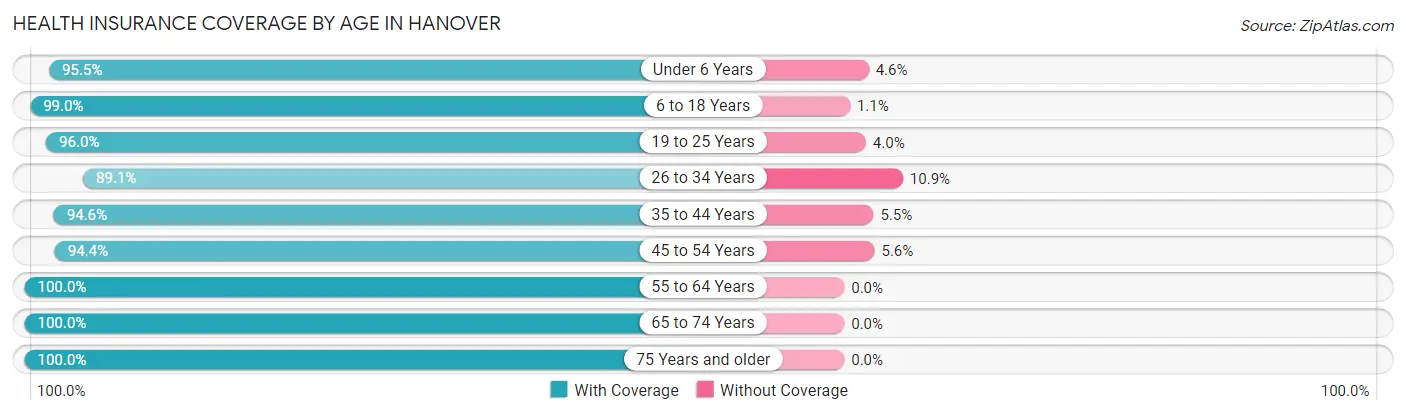
| Age Bracket | With Coverage | Without Coverage |
| Under 6 Years | 273 (95.5%) | 13 (4.5%) |
| 6 to 18 Years | 473 (99.0%) | 5 (1.1%) |
| 19 to 25 Years | 904 (96.0%) | 38 (4.0%) |
| 26 to 34 Years | 391 (89.1%) | 48 (10.9%) |
| 35 to 44 Years | 347 (94.6%) | 20 (5.4%) |
| 45 to 54 Years | 318 (94.4%) | 19 (5.6%) |
| 55 to 64 Years | 357 (100.0%) | 0 (0.0%) |
| 65 to 74 Years | 214 (100.0%) | 0 (0.0%) |
| 75 Years and older | 101 (100.0%) | 0 (0.0%) |
| Total | 3,378 (95.9%) | 143 (4.1%) |
Health Insurance Coverage by Citizenship Status in Hanover
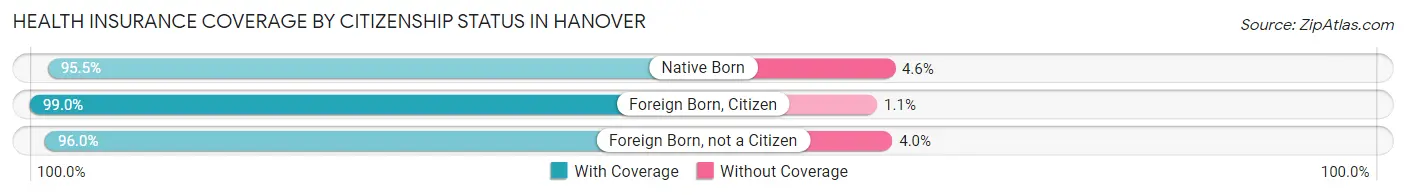
| Citizenship Status | With Coverage | Without Coverage |
| Native Born | 273 (95.5%) | 13 (4.5%) |
| Foreign Born, Citizen | 473 (99.0%) | 5 (1.1%) |
| Foreign Born, not a Citizen | 904 (96.0%) | 38 (4.0%) |
Health Insurance Coverage by Household Income in Hanover
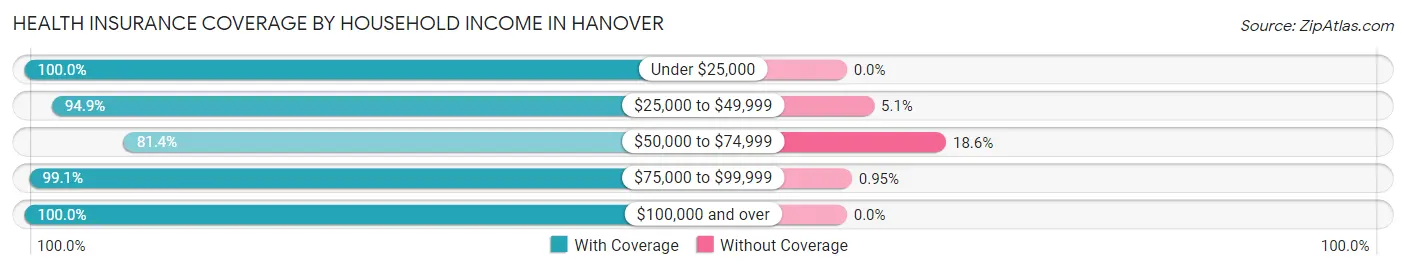
| Household Income | With Coverage | Without Coverage |
| Under $25,000 | 294 (100.0%) | 0 (0.0%) |
| $25,000 to $49,999 | 482 (94.9%) | 26 (5.1%) |
| $50,000 to $74,999 | 442 (81.4%) | 101 (18.6%) |
| $75,000 to $99,999 | 628 (99.1%) | 6 (0.9%) |
| $100,000 and over | 710 (100.0%) | 0 (0.0%) |
Public vs Private Health Insurance Coverage by Age in Hanover
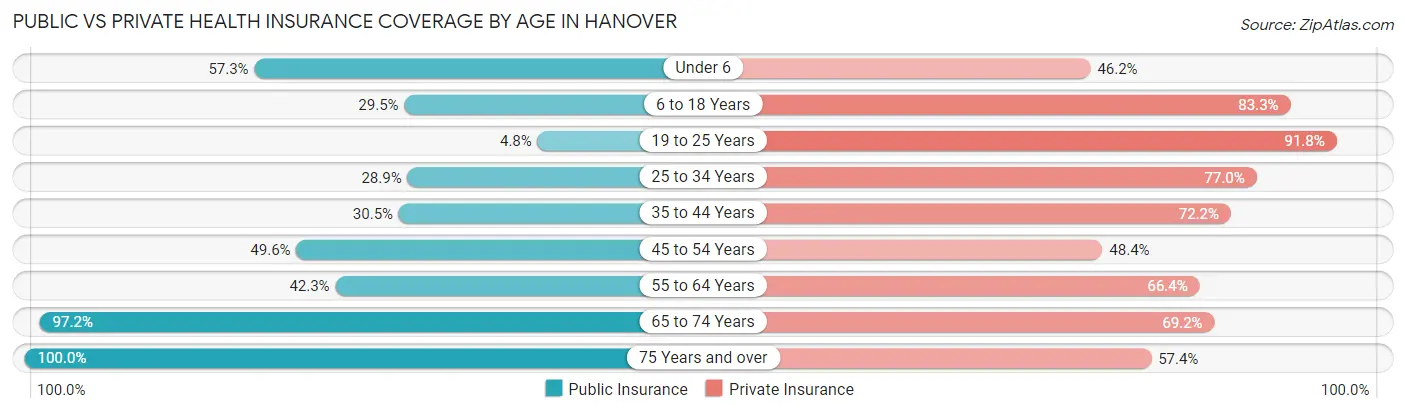
| Age Bracket | Public Insurance | Private Insurance |
| Under 6 | 164 (57.3%) | 132 (46.2%) |
| 6 to 18 Years | 141 (29.5%) | 398 (83.3%) |
| 19 to 25 Years | 45 (4.8%) | 865 (91.8%) |
| 25 to 34 Years | 127 (28.9%) | 338 (77.0%) |
| 35 to 44 Years | 112 (30.5%) | 265 (72.2%) |
| 45 to 54 Years | 167 (49.5%) | 163 (48.4%) |
| 55 to 64 Years | 151 (42.3%) | 237 (66.4%) |
| 65 to 74 Years | 208 (97.2%) | 148 (69.2%) |
| 75 Years and over | 101 (100.0%) | 58 (57.4%) |
| Total | 1,216 (34.5%) | 2,604 (74.0%) |
Disability Status by Sex by Age in Hanover
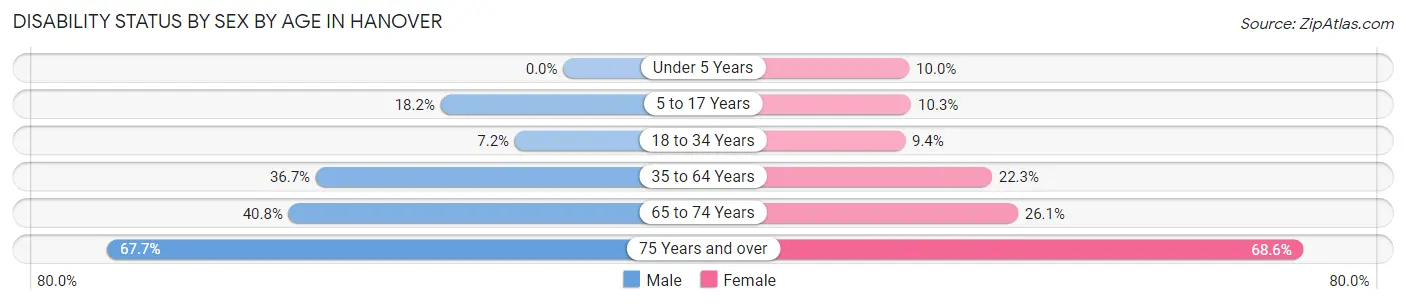
| Age Bracket | Male | Female |
| Under 5 Years | 0 (0.0%) | 9 (10.0%) |
| 5 to 17 Years | 53 (18.2%) | 17 (10.3%) |
| 18 to 34 Years | 46 (7.2%) | 78 (9.4%) |
| 35 to 64 Years | 205 (36.7%) | 112 (22.3%) |
| 65 to 74 Years | 42 (40.8%) | 29 (26.1%) |
| 75 Years and over | 21 (67.7%) | 48 (68.6%) |
Disability Class by Sex by Age in Hanover
Disability Class: Hearing Difficulty
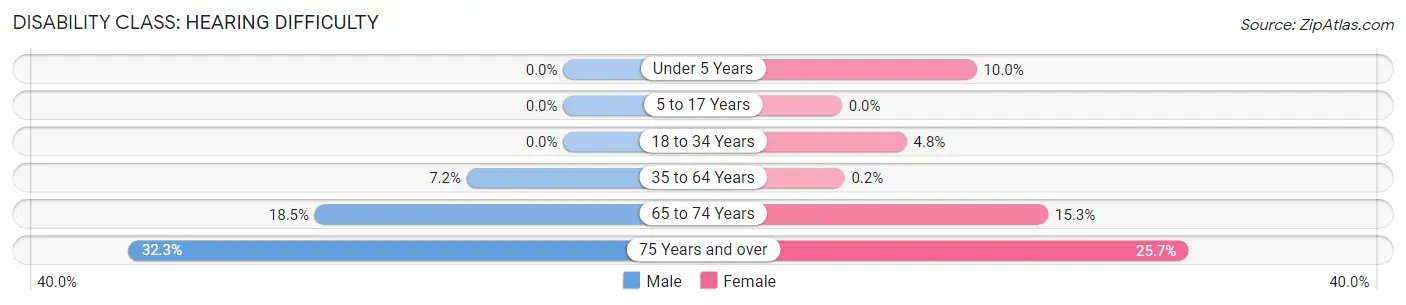
| Age Bracket | Male | Female |
| Under 5 Years | 0 (0.0%) | 9 (10.0%) |
| 5 to 17 Years | 0 (0.0%) | 0 (0.0%) |
| 18 to 34 Years | 0 (0.0%) | 40 (4.8%) |
| 35 to 64 Years | 40 (7.2%) | 1 (0.2%) |
| 65 to 74 Years | 19 (18.4%) | 17 (15.3%) |
| 75 Years and over | 10 (32.3%) | 18 (25.7%) |
Disability Class: Vision Difficulty
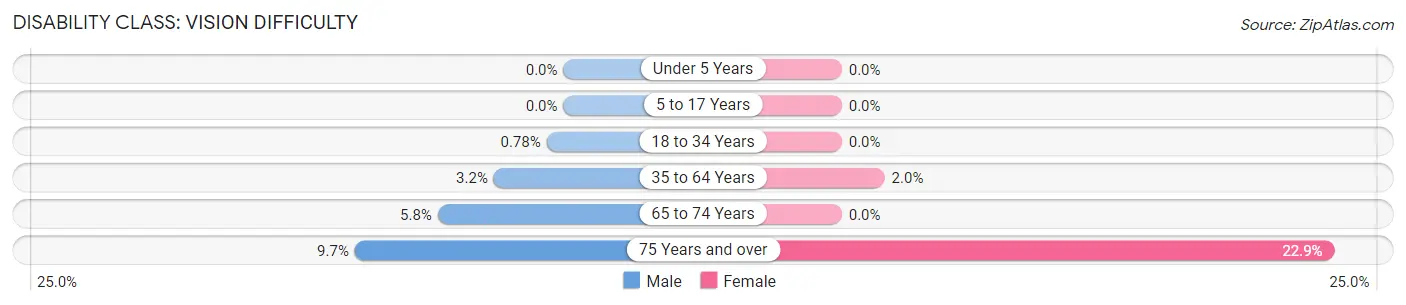
| Age Bracket | Male | Female |
| Under 5 Years | 0 (0.0%) | 0 (0.0%) |
| 5 to 17 Years | 0 (0.0%) | 0 (0.0%) |
| 18 to 34 Years | 5 (0.8%) | 0 (0.0%) |
| 35 to 64 Years | 18 (3.2%) | 10 (2.0%) |
| 65 to 74 Years | 6 (5.8%) | 0 (0.0%) |
| 75 Years and over | 3 (9.7%) | 16 (22.9%) |
Disability Class: Cognitive Difficulty
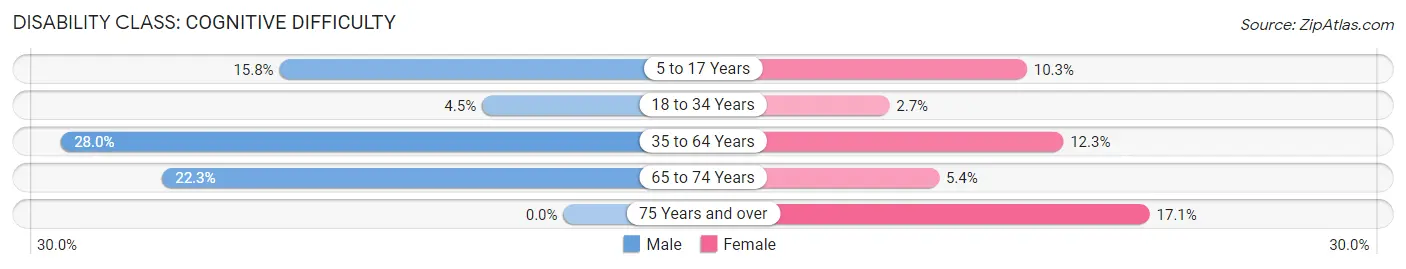
| Age Bracket | Male | Female |
| 5 to 17 Years | 46 (15.8%) | 17 (10.3%) |
| 18 to 34 Years | 29 (4.5%) | 22 (2.6%) |
| 35 to 64 Years | 156 (28.0%) | 62 (12.3%) |
| 65 to 74 Years | 23 (22.3%) | 6 (5.4%) |
| 75 Years and over | 0 (0.0%) | 12 (17.1%) |
Disability Class: Ambulatory Difficulty
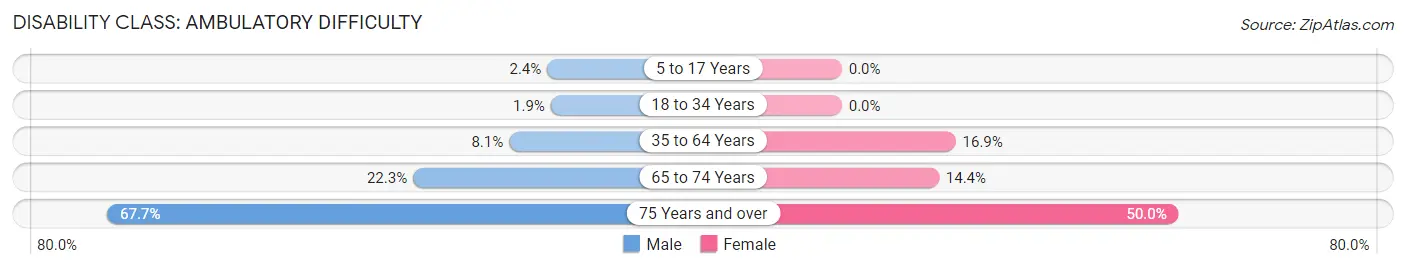
| Age Bracket | Male | Female |
| 5 to 17 Years | 7 (2.4%) | 0 (0.0%) |
| 18 to 34 Years | 12 (1.9%) | 0 (0.0%) |
| 35 to 64 Years | 45 (8.1%) | 85 (16.9%) |
| 65 to 74 Years | 23 (22.3%) | 16 (14.4%) |
| 75 Years and over | 21 (67.7%) | 35 (50.0%) |
Disability Class: Self-Care Difficulty
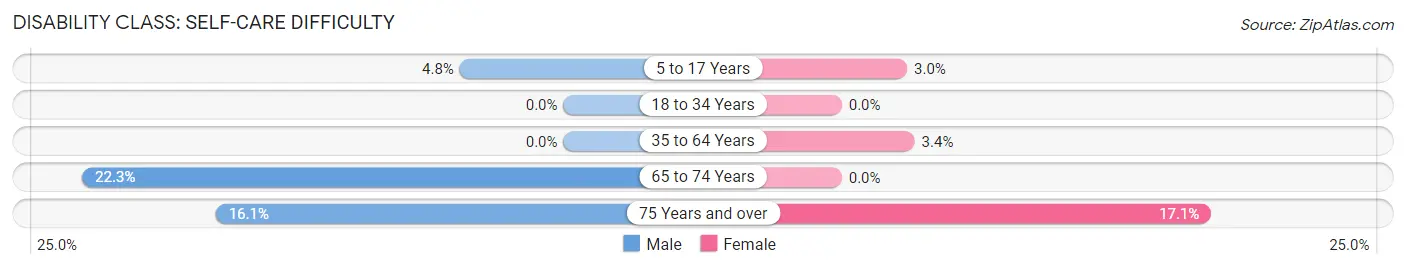
| Age Bracket | Male | Female |
| 5 to 17 Years | 14 (4.8%) | 5 (3.0%) |
| 18 to 34 Years | 0 (0.0%) | 0 (0.0%) |
| 35 to 64 Years | 0 (0.0%) | 17 (3.4%) |
| 65 to 74 Years | 23 (22.3%) | 0 (0.0%) |
| 75 Years and over | 5 (16.1%) | 12 (17.1%) |
Technology Access in Hanover
Computing Device Access in Hanover
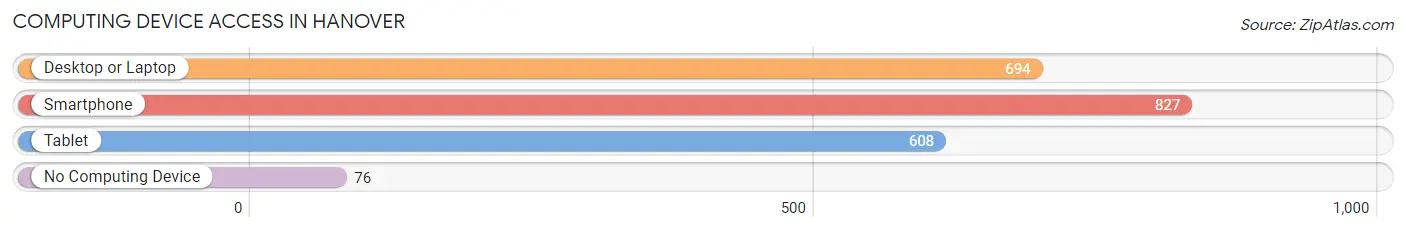
| Device Type | # Households | % Households |
| Desktop or Laptop | 694 | 71.5% |
| Smartphone | 827 | 85.2% |
| Tablet | 608 | 62.6% |
| No Computing Device | 76 | 7.8% |
| Total | 971 | 100.0% |
Internet Access in Hanover
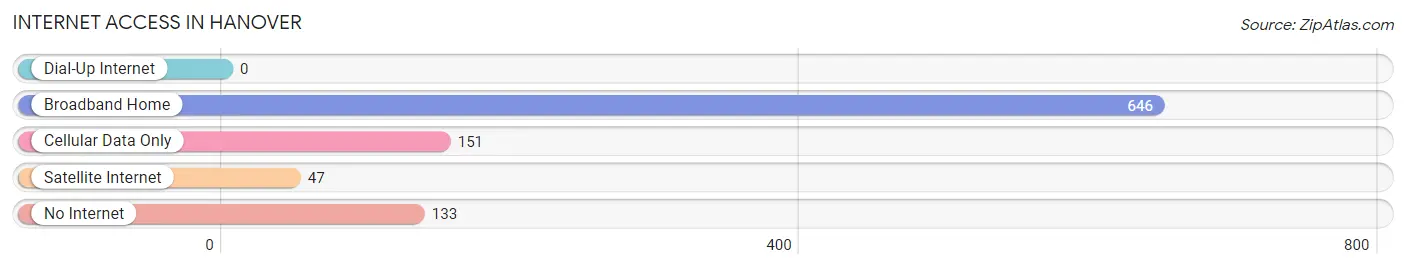
| Internet Type | # Households | % Households |
| Dial-Up Internet | 0 | 0.0% |
| Broadband Home | 646 | 66.5% |
| Cellular Data Only | 151 | 15.5% |
| Satellite Internet | 47 | 4.8% |
| No Internet | 133 | 13.7% |
| Total | 971 | 100.0% |
Hanover Summary
Hanover, Indiana is a small town located in the southeastern corner of the state, in Jefferson County. It is situated on the banks of the Ohio River, and is part of the Louisville metropolitan area. The town has a population of approximately 4,000 people, and is known for its historic downtown area and its proximity to the Ohio River.
History
Hanover was founded in 1817 by a group of settlers from Pennsylvania. The town was named after the city of Hanover in Germany, and was originally intended to be a trading post for the local Native American tribes. The town quickly grew, and by 1820 it had become a thriving river port. The town was also home to a number of industries, including a sawmill, a gristmill, and a distillery.
In the mid-1800s, the town was a major stop on the Underground Railroad, and many escaped slaves found refuge in Hanover. The town was also home to a number of abolitionists, including the prominent Quaker, Levi Coffin.
In the late 1800s, the town began to decline as the river trade shifted to larger cities. The town was also hit hard by the Great Depression, and many of its industries closed. However, the town was able to survive, and in the 1950s it began to experience a resurgence.
Geography
Hanover is located in the southeastern corner of Indiana, in Jefferson County. It is situated on the banks of the Ohio River, and is part of the Louisville metropolitan area. The town is located approximately 30 miles from Louisville, and is accessible via Interstate 65.
The town is situated on a flat plain, and is surrounded by rolling hills and forests. The climate is humid and temperate, with hot summers and cold winters.
Economy
The economy of Hanover is largely based on agriculture and tourism. The town is home to a number of farms, and is known for its production of corn, soybeans, and wheat. The town is also home to a number of small businesses, including restaurants, shops, and galleries.
Tourism is an important part of the local economy, and the town is home to a number of historic sites, including the Levi Coffin House and the Hanover College Historic District. The town is also home to a number of festivals and events, including the Hanover Tomato Festival and the Hanover Fall Festival.
Demographics
As of the 2010 census, the population of Hanover was 4,039. The racial makeup of the town was 95.3% White, 1.2% African American, 0.3% Native American, 0.7% Asian, 0.1% Pacific Islander, and 2.4% from other races. The median household income was $41,944, and the median family income was $50,917. The per capita income was $20,945.
Hanover is a small town with a rich history and a vibrant economy. It is home to a number of historic sites, and is known for its agricultural production and its festivals and events. The town is also home to a diverse population, and is a great place to live and work.
Common Questions
What is Per Capita Income in Hanover?
Per Capita income in Hanover is $21,545.
What is the Median Family Income in Hanover?
Median Family Income in Hanover is $65,865.
What is the Median Household income in Hanover?
Median Household Income in Hanover is $55,313.
What is Income or Wage Gap in Hanover?
Income or Wage Gap in Hanover is 30.6%.
Women in Hanover earn 69.4 cents for every dollar earned by a man.
What is Inequality or Gini Index in Hanover?
Inequality or Gini Index in Hanover is 0.42.
What is the Total Population of Hanover?
Total Population of Hanover is 3,665.
What is the Total Male Population of Hanover?
Total Male Population of Hanover is 1,814.
What is the Total Female Population of Hanover?
Total Female Population of Hanover is 1,851.
What is the Ratio of Males per 100 Females in Hanover?
There are 98.00 Males per 100 Females in Hanover.
What is the Ratio of Females per 100 Males in Hanover?
There are 102.04 Females per 100 Males in Hanover.
What is the Median Population Age in Hanover?
Median Population Age in Hanover is 29.0 Years.
What is the Average Family Size in Hanover
Average Family Size in Hanover is 3.2 People.
What is the Average Household Size in Hanover
Average Household Size in Hanover is 2.8 People.
How Large is the Labor Force in Hanover?
There are 1,659 People in the Labor Forcein in Hanover.
What is the Percentage of People in the Labor Force in Hanover?
54.7% of People are in the Labor Force in Hanover.
What is the Unemployment Rate in Hanover?
Unemployment Rate in Hanover is 3.4%.