Zip Codes with the Highest Percentage of Population Employed in Professional & Scientific Services in Hammond, IN
RELATED REPORTS & OPTIONS
Professional & Scientific Services
Hammond
Compare Zip Codes
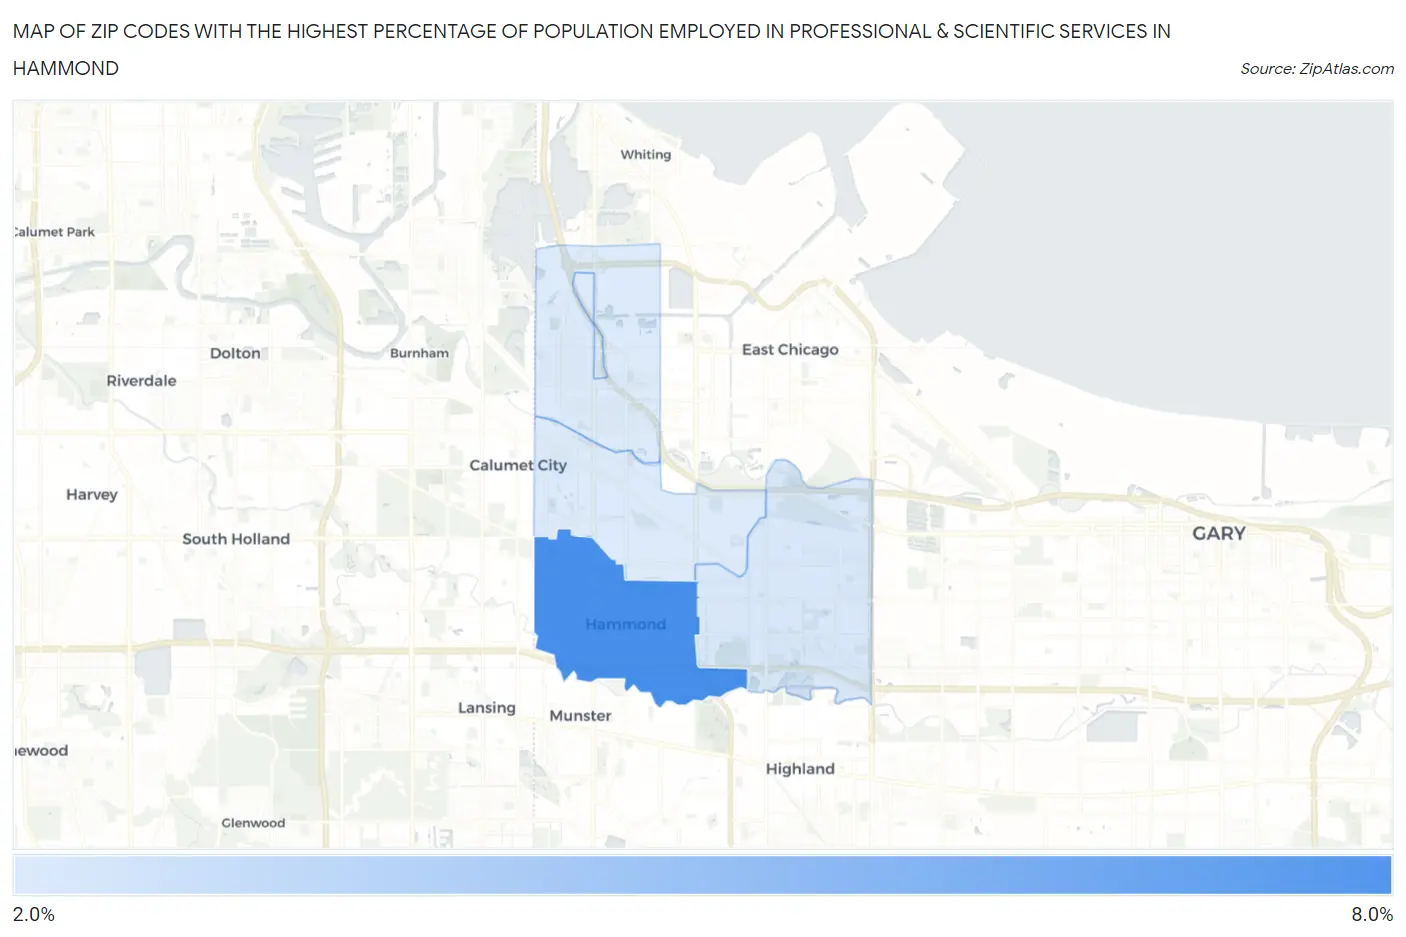
Map of Zip Codes with the Highest Percentage of Population Employed in Professional & Scientific Services in Hammond
0.0%
8.0%
Zip Codes with the Highest Percentage of Population Employed in Professional & Scientific Services in Hammond, IN
| Zip Code | % Employed | vs State | vs National | |
| 1. | 46324 | 7.9% | 5.1%(+2.78)#62 | 7.8%(+0.084)#6,753 |
| 2. | 46323 | 2.9% | 5.1%(-2.28)#388 | 7.8%(-4.98)#18,924 |
| 3. | 46327 | 2.8% | 5.1%(-2.39)#401 | 7.8%(-5.09)#19,292 |
| 4. | 46320 | 2.7% | 5.1%(-2.42)#409 | 7.8%(-5.12)#19,415 |
1
Common Questions
What are the Top 3 Zip Codes with the Highest Percentage of Population Employed in Professional & Scientific Services in Hammond, IN?
Top 3 Zip Codes with the Highest Percentage of Population Employed in Professional & Scientific Services in Hammond, IN are:
What zip code has the Highest Percentage of Population Employed in Professional & Scientific Services in Hammond, IN?
46324 has the Highest Percentage of Population Employed in Professional & Scientific Services in Hammond, IN with 7.9%.
What is the Percentage of Population Employed in Professional & Scientific Services in Hammond, IN?
Percentage of Population Employed in Professional & Scientific Services in Hammond is 4.8%.
What is the Percentage of Population Employed in Professional & Scientific Services in Indiana?
Percentage of Population Employed in Professional & Scientific Services in Indiana is 5.1%.
What is the Percentage of Population Employed in Professional & Scientific Services in the United States?
Percentage of Population Employed in Professional & Scientific Services in the United States is 7.8%.