Zip Codes with the Highest Percentage of Population Employed in Manufacturing in Hammond, IN
RELATED REPORTS & OPTIONS
Manufacturing
Hammond
Compare Zip Codes
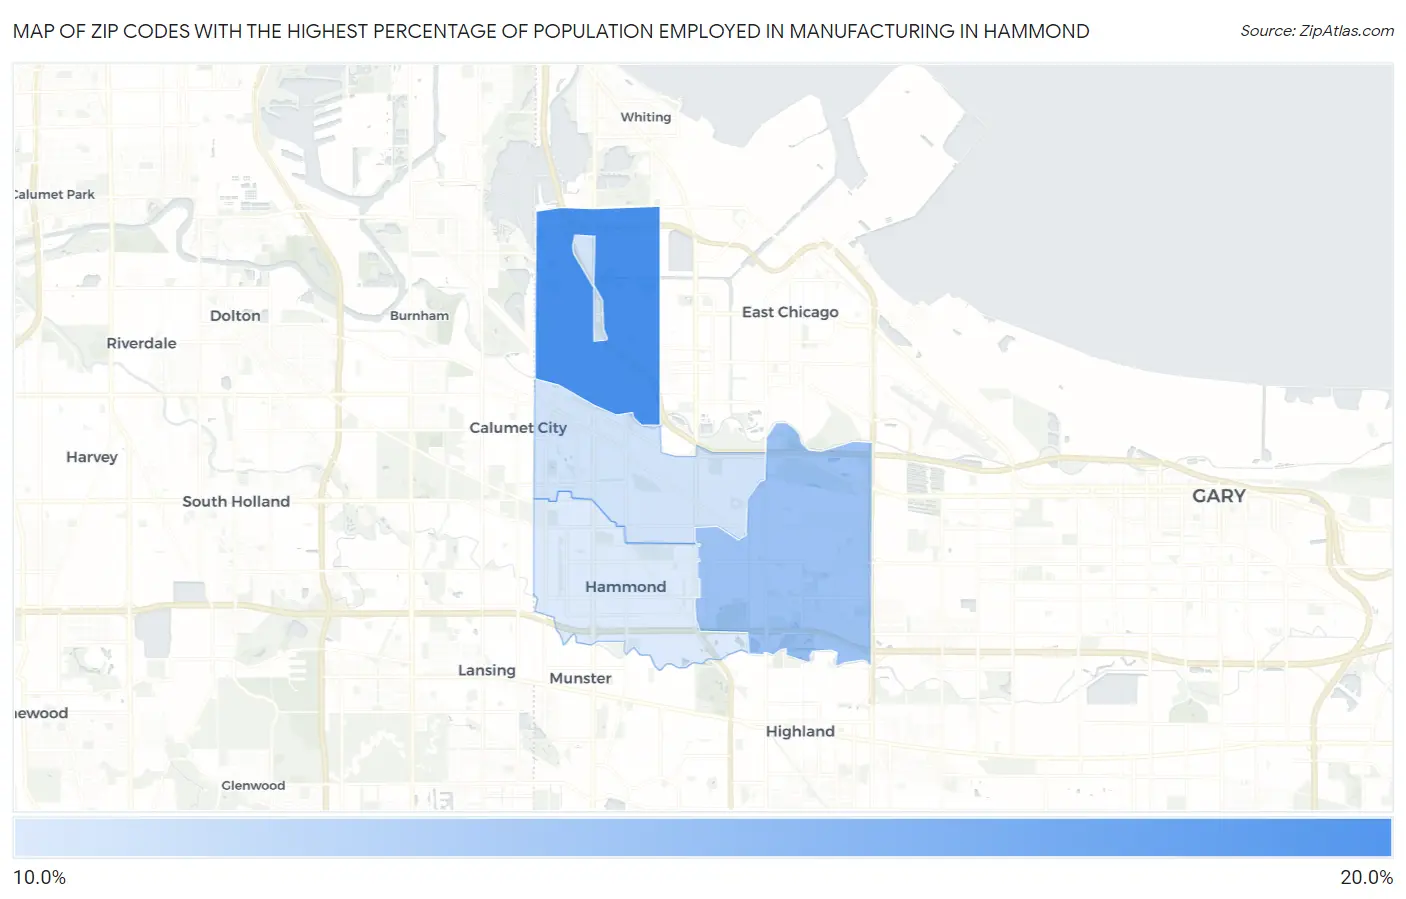
Map of Zip Codes with the Highest Percentage of Population Employed in Manufacturing in Hammond
0.0%
20.0%
Zip Codes with the Highest Percentage of Population Employed in Manufacturing in Hammond, IN
| Zip Code | % Employed | vs State | vs National | |
| 1. | 46327 | 18.1% | 18.6%(-0.486)#467 | 10.0%(+8.14)#6,203 |
| 2. | 46323 | 16.0% | 18.6%(-2.63)#533 | 10.0%(+6.00)#8,038 |
| 3. | 46320 | 14.6% | 18.6%(-3.98)#569 | 10.0%(+4.64)#9,456 |
| 4. | 46324 | 14.3% | 18.6%(-4.27)#578 | 10.0%(+4.36)#9,758 |
1
Common Questions
What are the Top 3 Zip Codes with the Highest Percentage of Population Employed in Manufacturing in Hammond, IN?
Top 3 Zip Codes with the Highest Percentage of Population Employed in Manufacturing in Hammond, IN are:
What zip code has the Highest Percentage of Population Employed in Manufacturing in Hammond, IN?
46327 has the Highest Percentage of Population Employed in Manufacturing in Hammond, IN with 18.1%.
What is the Percentage of Population Employed in Manufacturing in Hammond, IN?
Percentage of Population Employed in Manufacturing in Hammond is 16.7%.
What is the Percentage of Population Employed in Manufacturing in Indiana?
Percentage of Population Employed in Manufacturing in Indiana is 18.6%.
What is the Percentage of Population Employed in Manufacturing in the United States?
Percentage of Population Employed in Manufacturing in the United States is 10.0%.