Francisco, IN Map & Demographics
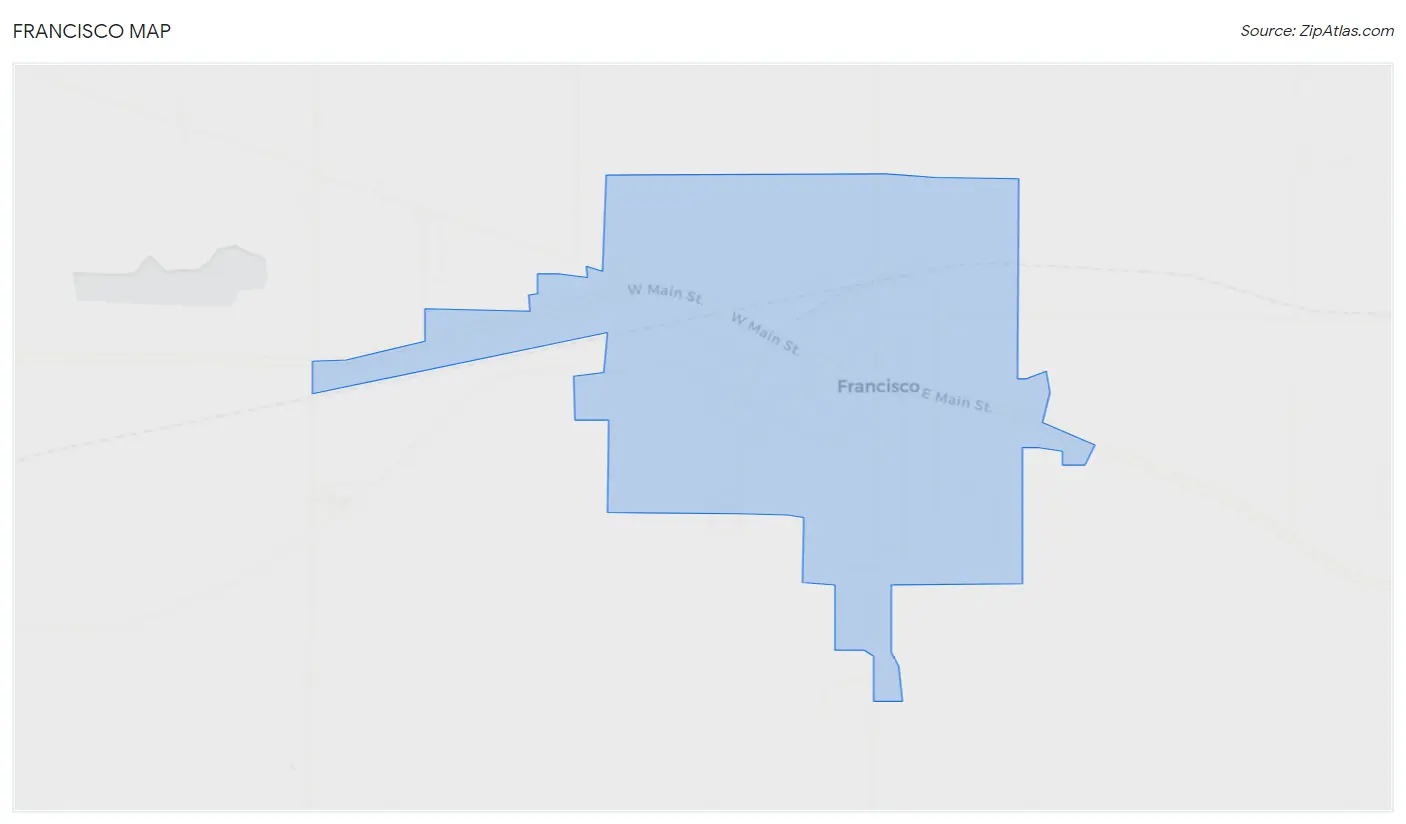
Francisco Map
Francisco Overview
$36,910
PER CAPITA INCOME
$76,000
AVG FAMILY INCOME
$63,750
AVG HOUSEHOLD INCOME
49.5%
WAGE / INCOME GAP [ % ]
50.5¢/ $1
WAGE / INCOME GAP [ $ ]
0.45
INEQUALITY / GINI INDEX
600
TOTAL POPULATION
273
MALE POPULATION
327
FEMALE POPULATION
83.49
MALES / 100 FEMALES
119.78
FEMALES / 100 MALES
43.3
MEDIAN AGE
2.6
AVG FAMILY SIZE
2.4
AVG HOUSEHOLD SIZE
255
LABOR FORCE [ PEOPLE ]
54.8%
PERCENT IN LABOR FORCE
1.6%
UNEMPLOYMENT RATE
Francisco Zip Codes
Francisco Area Codes
Income in Francisco
Income Overview in Francisco
Per Capita Income in Francisco is $36,910, while median incomes of families and households are $76,000 and $63,750 respectively.
| Characteristic | Number | Measure |
| Per Capita Income | 600 | $36,910 |
| Median Family Income | 204 | $76,000 |
| Mean Family Income | 204 | $101,013 |
| Median Household Income | 247 | $63,750 |
| Mean Household Income | 247 | $89,105 |
| Income Deficit | 204 | $0 |
| Wage / Income Gap (%) | 600 | 49.54% |
| Wage / Income Gap ($) | 600 | 50.46¢ per $1 |
| Gini / Inequality Index | 600 | 0.45 |
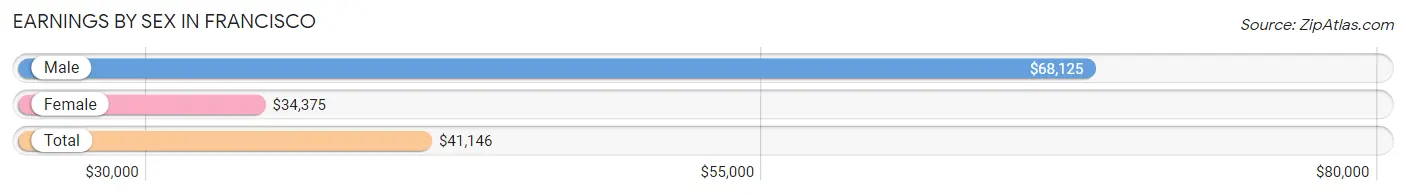
Earnings by Sex in Francisco
Average Earnings in Francisco are $41,146, $68,125 for men and $34,375 for women, a difference of 49.5%.
| Sex | Number | Average Earnings |
| Male | 147 (52.3%) | $68,125 |
| Female | 134 (47.7%) | $34,375 |
| Total | 281 (100.0%) | $41,146 |
Earnings by Sex by Income Bracket in Francisco
The most common earnings brackets in Francisco are $75,000 to $99,999 for men (48 | 32.7%) and $35,000 to $39,999 for women (35 | 26.1%).
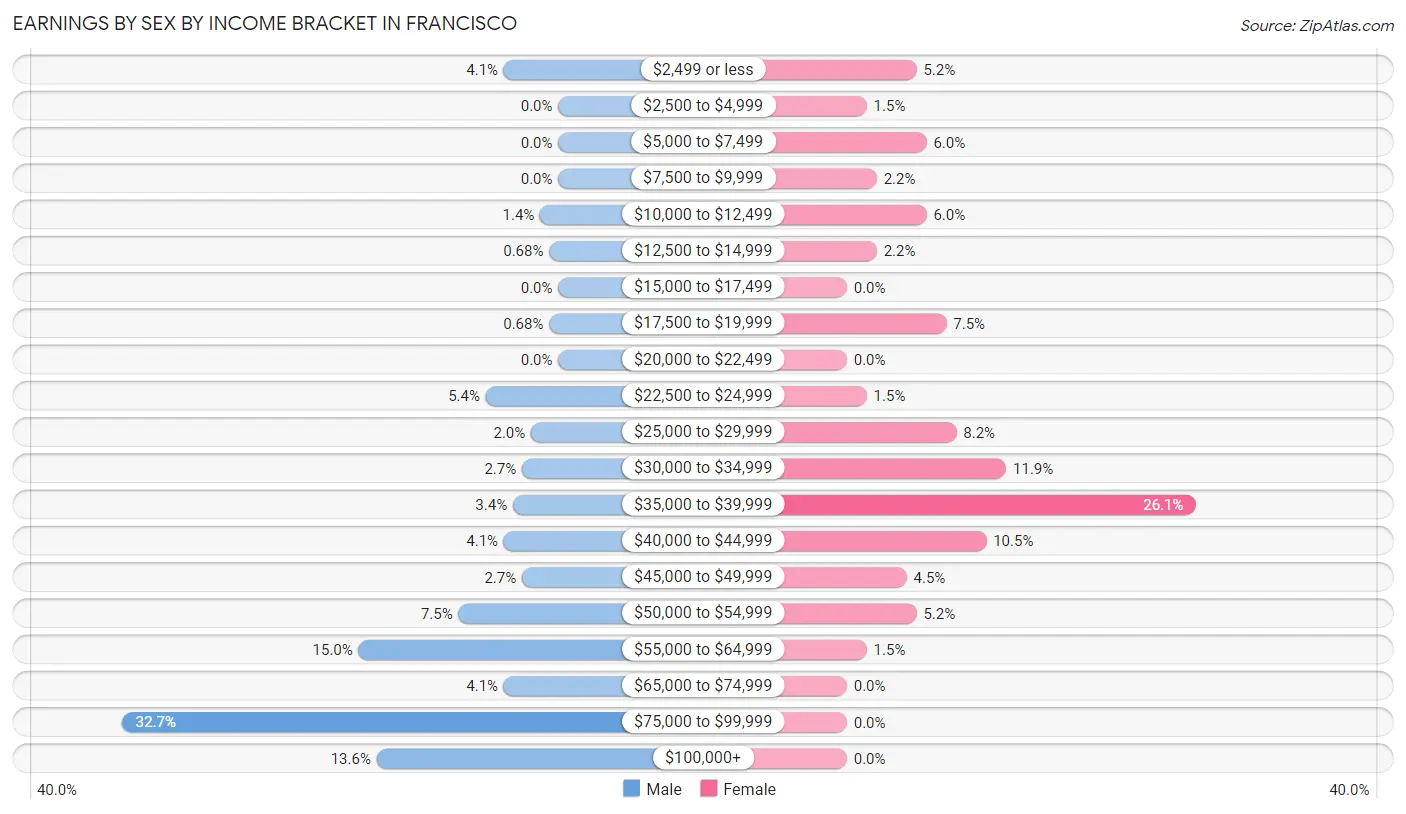
| Income | Male | Female |
| $2,499 or less | 6 (4.1%) | 7 (5.2%) |
| $2,500 to $4,999 | 0 (0.0%) | 2 (1.5%) |
| $5,000 to $7,499 | 0 (0.0%) | 8 (6.0%) |
| $7,500 to $9,999 | 0 (0.0%) | 3 (2.2%) |
| $10,000 to $12,499 | 2 (1.4%) | 8 (6.0%) |
| $12,500 to $14,999 | 1 (0.7%) | 3 (2.2%) |
| $15,000 to $17,499 | 0 (0.0%) | 0 (0.0%) |
| $17,500 to $19,999 | 1 (0.7%) | 10 (7.5%) |
| $20,000 to $22,499 | 0 (0.0%) | 0 (0.0%) |
| $22,500 to $24,999 | 8 (5.4%) | 2 (1.5%) |
| $25,000 to $29,999 | 3 (2.0%) | 11 (8.2%) |
| $30,000 to $34,999 | 4 (2.7%) | 16 (11.9%) |
| $35,000 to $39,999 | 5 (3.4%) | 35 (26.1%) |
| $40,000 to $44,999 | 6 (4.1%) | 14 (10.4%) |
| $45,000 to $49,999 | 4 (2.7%) | 6 (4.5%) |
| $50,000 to $54,999 | 11 (7.5%) | 7 (5.2%) |
| $55,000 to $64,999 | 22 (15.0%) | 2 (1.5%) |
| $65,000 to $74,999 | 6 (4.1%) | 0 (0.0%) |
| $75,000 to $99,999 | 48 (32.7%) | 0 (0.0%) |
| $100,000+ | 20 (13.6%) | 0 (0.0%) |
| Total | 147 (100.0%) | 134 (100.0%) |
Earnings by Sex by Educational Attainment in Francisco
Average earnings in Francisco are $80,046 for men and $35,179 for women, a difference of 56.0%. Men with an educational attainment of graduate degree enjoy the highest average annual earnings of $250,001, while those with high school diploma education earn the least with $80,417. Women with an educational attainment of bachelor's degree earn the most with the average annual earnings of $41,771, while those with college or associate's degree education have the smallest earnings of $23,750.
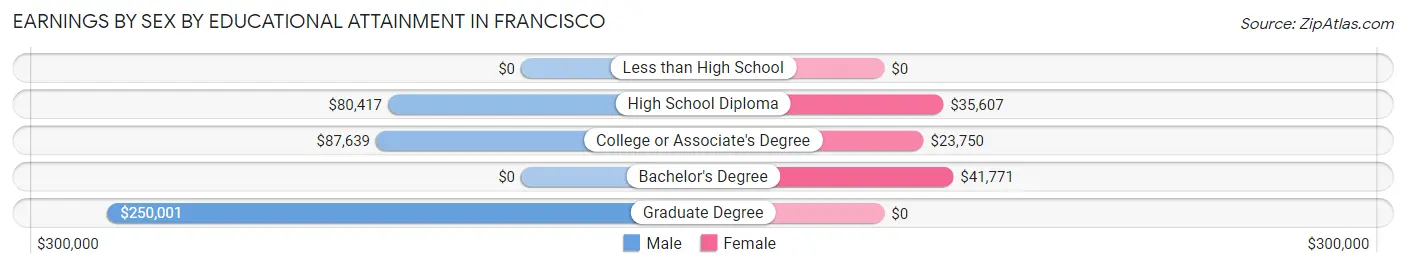
| Educational Attainment | Male Income | Female Income |
| Less than High School | - | - |
| High School Diploma | $80,417 | $35,607 |
| College or Associate's Degree | $87,639 | $23,750 |
| Bachelor's Degree | - | - |
| Graduate Degree | $250,001 | $0 |
| Total | $80,046 | $35,179 |
Family Income in Francisco
Family Income Brackets in Francisco
According to the Francisco family income data, there are 56 families falling into the $75,000 to $99,999 income range, which is the most common income bracket and makes up 27.5% of all families.
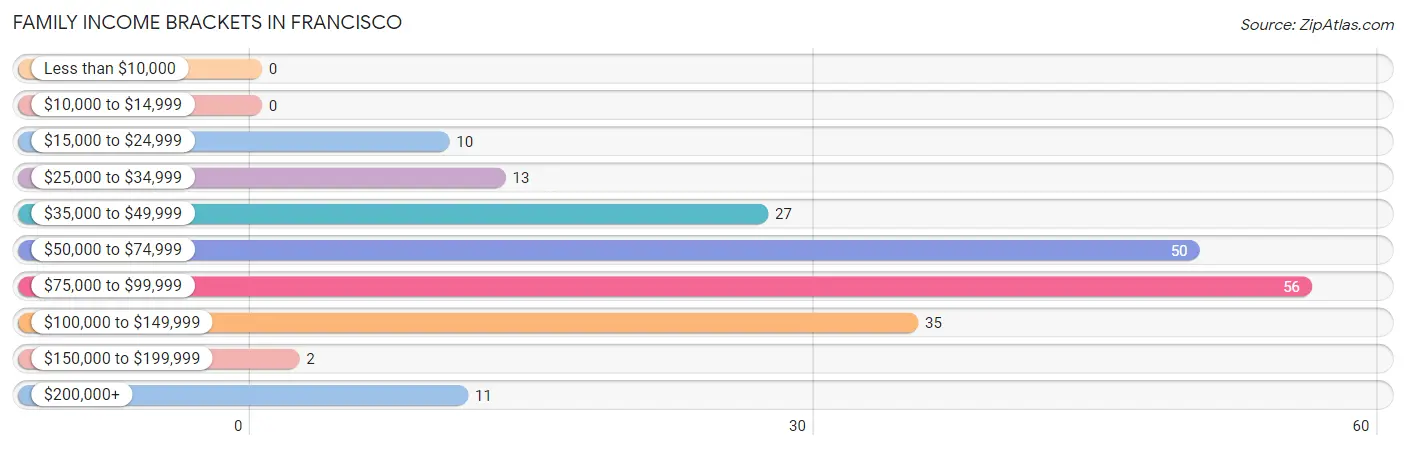
| Income Bracket | # Families | % Families |
| Less than $10,000 | 0 | 0.0% |
| $10,000 to $14,999 | 0 | 0.0% |
| $15,000 to $24,999 | 10 | 4.9% |
| $25,000 to $34,999 | 13 | 6.4% |
| $35,000 to $49,999 | 27 | 13.2% |
| $50,000 to $74,999 | 50 | 24.5% |
| $75,000 to $99,999 | 56 | 27.5% |
| $100,000 to $149,999 | 35 | 17.2% |
| $150,000 to $199,999 | 2 | 1.0% |
| $200,000+ | 11 | 5.4% |
Family Income by Famaliy Size in Francisco
5-person families (16 | 7.8%) account for the highest median family income in Francisco with $250,001 per family, while 5-person families (16 | 7.8%) have the highest median income of $50,000 per family member.
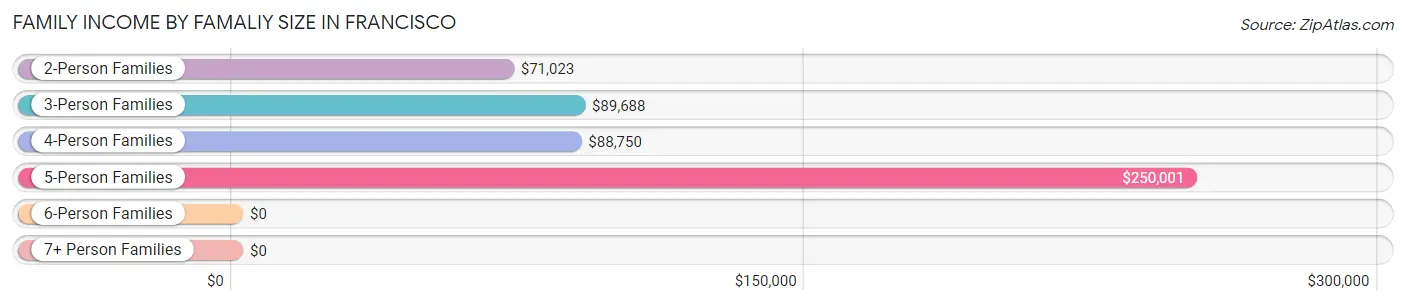
| Income Bracket | # Families | Median Income |
| 2-Person Families | 131 (64.2%) | $71,023 |
| 3-Person Families | 31 (15.2%) | $89,688 |
| 4-Person Families | 23 (11.3%) | $88,750 |
| 5-Person Families | 16 (7.8%) | $250,001 |
| 6-Person Families | 0 (0.0%) | $0 |
| 7+ Person Families | 3 (1.5%) | $0 |
| Total | 204 (100.0%) | $76,000 |
Family Income by Number of Earners in Francisco
The median family income in Francisco is $76,000, with families comprising 3+ earners (7) having the highest median family income of $108,750, while families with no earners (43) have the lowest median family income of $47,321, accounting for 3.4% and 21.1% of families, respectively.
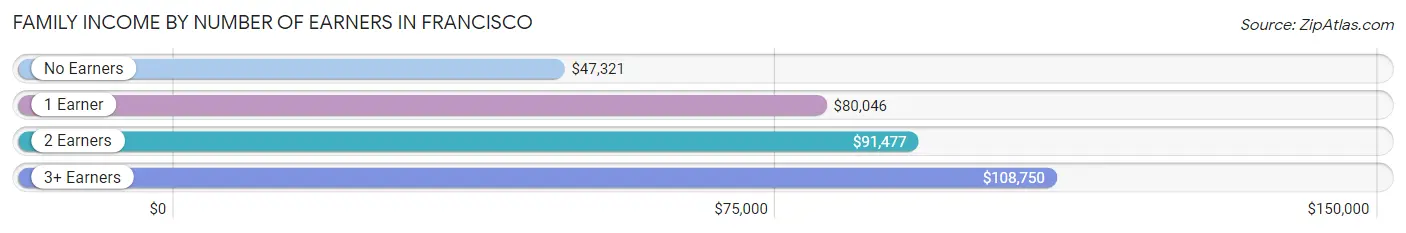
| Number of Earners | # Families | Median Income |
| No Earners | 43 (21.1%) | $47,321 |
| 1 Earner | 87 (42.6%) | $80,046 |
| 2 Earners | 67 (32.8%) | $91,477 |
| 3+ Earners | 7 (3.4%) | $108,750 |
| Total | 204 (100.0%) | $76,000 |
Household Income in Francisco
Household Income Brackets in Francisco
With 61 households falling in the category, the $50,000 to $74,999 income range is the most frequent in Francisco, accounting for 24.7% of all households.
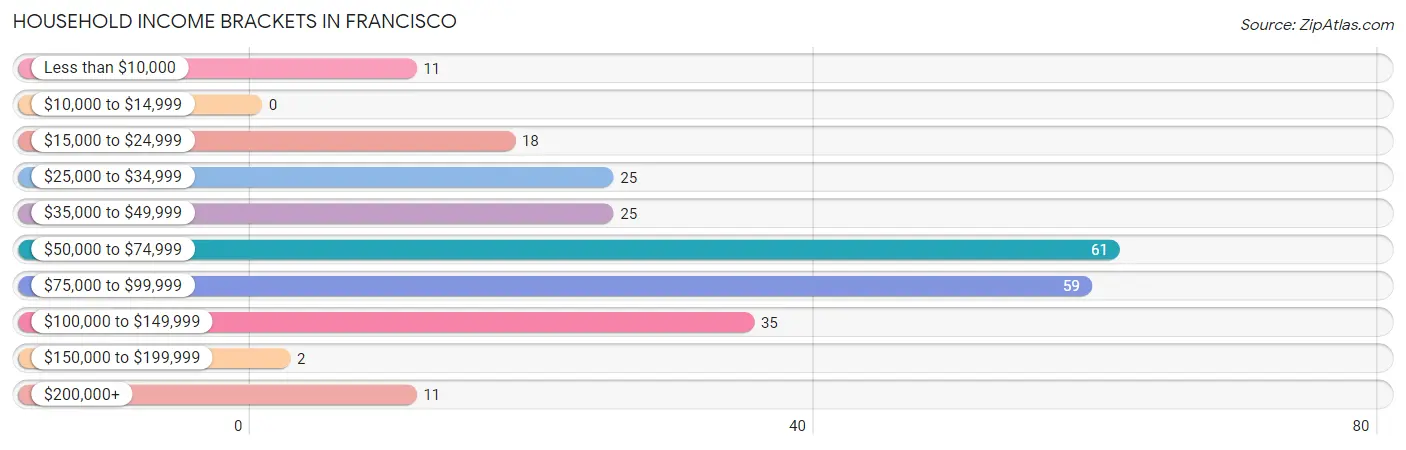
| Income Bracket | # Households | % Households |
| Less than $10,000 | 11 | 4.5% |
| $10,000 to $14,999 | 0 | 0.0% |
| $15,000 to $24,999 | 18 | 7.3% |
| $25,000 to $34,999 | 25 | 10.1% |
| $35,000 to $49,999 | 25 | 10.1% |
| $50,000 to $74,999 | 61 | 24.7% |
| $75,000 to $99,999 | 59 | 23.9% |
| $100,000 to $149,999 | 35 | 14.2% |
| $150,000 to $199,999 | 2 | 0.8% |
| $200,000+ | 11 | 4.5% |
Household Income by Householder Age in Francisco
The median household income in Francisco is $63,750, with the highest median household income of $81,667 found in the 45 to 64 years age bracket for the primary householder. A total of 118 households (47.8%) fall into this category. Meanwhile, the 15 to 24 years age bracket for the primary householder has the lowest median household income of $0, with 3 households (1.2%) in this group.
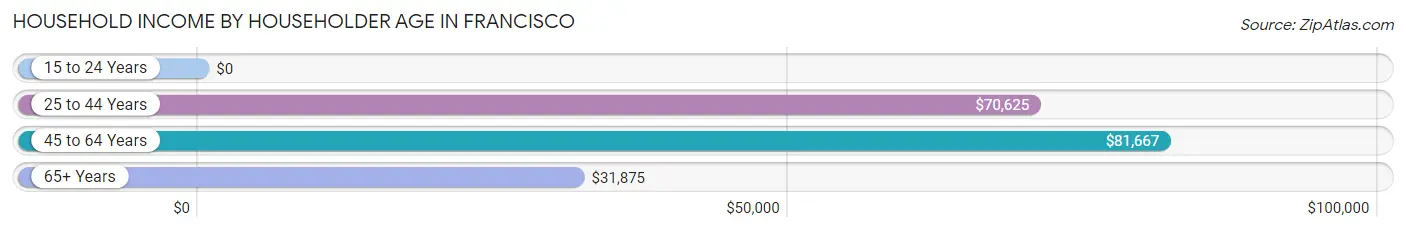
| Income Bracket | # Households | Median Income |
| 15 to 24 Years | 3 (1.2%) | $0 |
| 25 to 44 Years | 56 (22.7%) | $70,625 |
| 45 to 64 Years | 118 (47.8%) | $81,667 |
| 65+ Years | 70 (28.3%) | $31,875 |
| Total | 247 (100.0%) | $63,750 |
Poverty in Francisco
Income Below Poverty by Sex and Age in Francisco
With 4.0% poverty level for males and 11.5% for females among the residents of Francisco, 6 to 11 year old males and 18 to 24 year old females are the most vulnerable to poverty, with 7 males (36.8%) and 8 females (57.1%) in their respective age groups living below the poverty level.
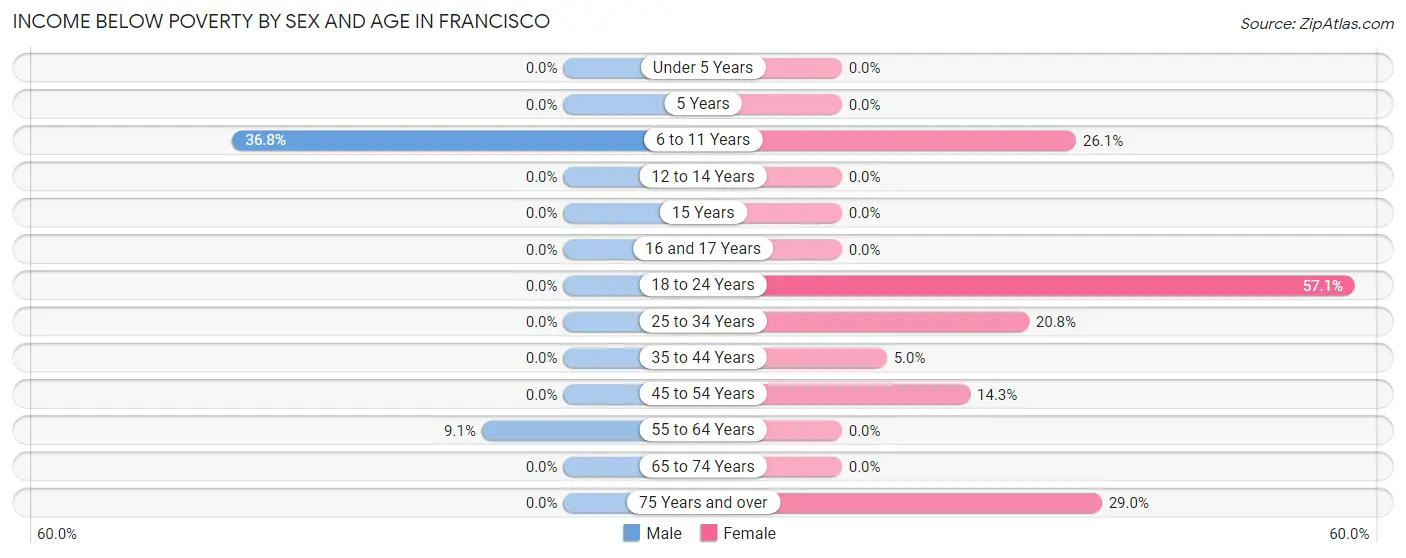
| Age Bracket | Male | Female |
| Under 5 Years | 0 (0.0%) | 0 (0.0%) |
| 5 Years | 0 (0.0%) | 0 (0.0%) |
| 6 to 11 Years | 7 (36.8%) | 6 (26.1%) |
| 12 to 14 Years | 0 (0.0%) | 0 (0.0%) |
| 15 Years | 0 (0.0%) | 0 (0.0%) |
| 16 and 17 Years | 0 (0.0%) | 0 (0.0%) |
| 18 to 24 Years | 0 (0.0%) | 8 (57.1%) |
| 25 to 34 Years | 0 (0.0%) | 5 (20.8%) |
| 35 to 44 Years | 0 (0.0%) | 3 (5.0%) |
| 45 to 54 Years | 0 (0.0%) | 4 (14.3%) |
| 55 to 64 Years | 4 (9.1%) | 0 (0.0%) |
| 65 to 74 Years | 0 (0.0%) | 0 (0.0%) |
| 75 Years and over | 0 (0.0%) | 11 (28.9%) |
| Total | 11 (4.0%) | 37 (11.5%) |
Income Above Poverty by Sex and Age in Francisco
According to the poverty statistics in Francisco, males aged under 5 years and females aged under 5 years are the age groups that are most secure financially, with 100.0% of males and 100.0% of females in these age groups living above the poverty line.
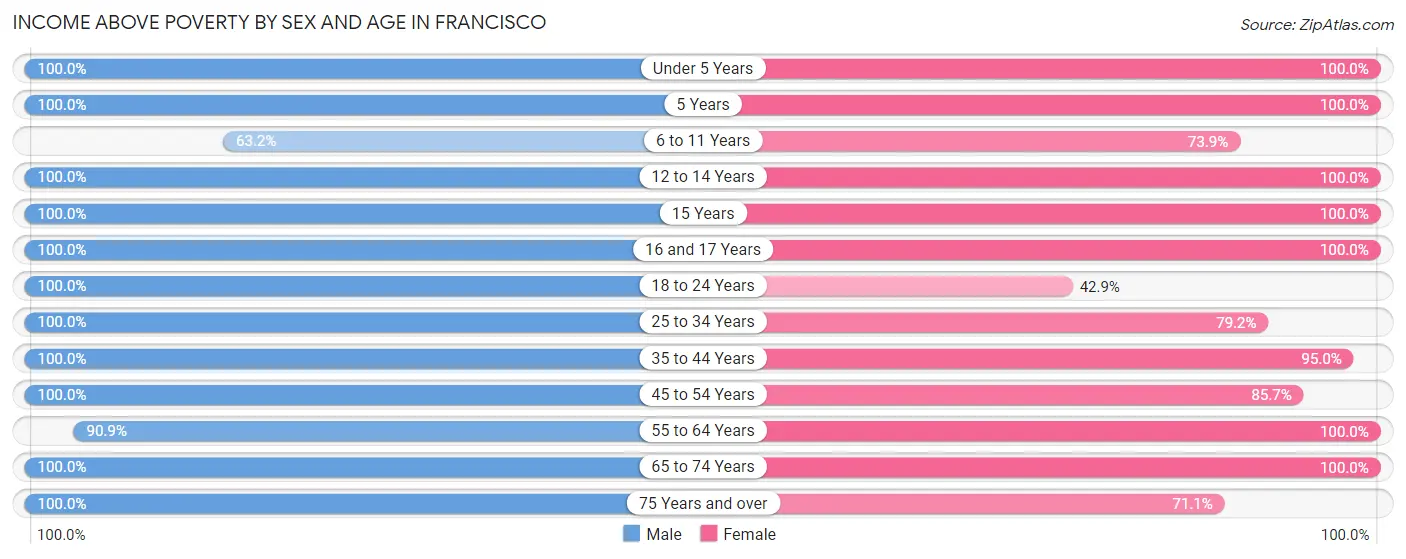
| Age Bracket | Male | Female |
| Under 5 Years | 18 (100.0%) | 17 (100.0%) |
| 5 Years | 3 (100.0%) | 2 (100.0%) |
| 6 to 11 Years | 12 (63.2%) | 17 (73.9%) |
| 12 to 14 Years | 8 (100.0%) | 26 (100.0%) |
| 15 Years | 8 (100.0%) | 5 (100.0%) |
| 16 and 17 Years | 13 (100.0%) | 3 (100.0%) |
| 18 to 24 Years | 18 (100.0%) | 6 (42.9%) |
| 25 to 34 Years | 14 (100.0%) | 19 (79.2%) |
| 35 to 44 Years | 30 (100.0%) | 57 (95.0%) |
| 45 to 54 Years | 56 (100.0%) | 24 (85.7%) |
| 55 to 64 Years | 40 (90.9%) | 41 (100.0%) |
| 65 to 74 Years | 26 (100.0%) | 40 (100.0%) |
| 75 Years and over | 16 (100.0%) | 27 (71.1%) |
| Total | 262 (96.0%) | 284 (88.5%) |
Income Below Poverty Among Married-Couple Families in Francisco
The poverty statistics for married-couple families in Francisco show that 3.0% or 4 of the total 134 families live below the poverty line. Families with no children have the highest poverty rate of 4.5%, comprising of 4 families. On the other hand, families with 1 or 2 children have the lowest poverty rate of 0.0%, which includes 0 families.
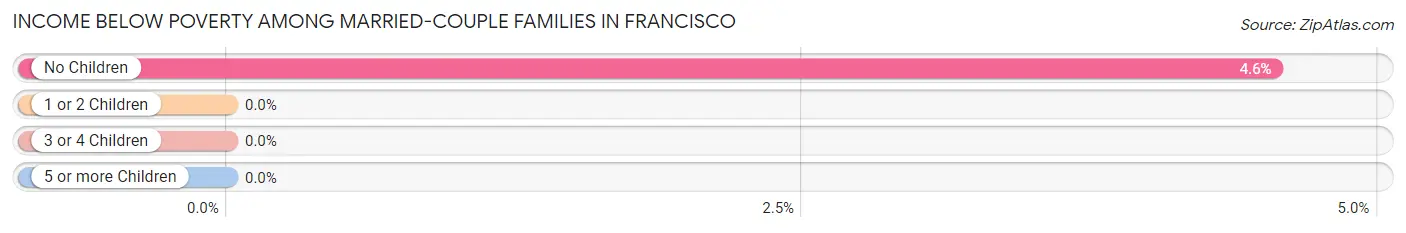
| Children | Above Poverty | Below Poverty |
| No Children | 84 (95.5%) | 4 (4.5%) |
| 1 or 2 Children | 39 (100.0%) | 0 (0.0%) |
| 3 or 4 Children | 7 (100.0%) | 0 (0.0%) |
| 5 or more Children | 0 (0.0%) | 0 (0.0%) |
| Total | 130 (97.0%) | 4 (3.0%) |
Income Below Poverty Among Single-Parent Households in Francisco
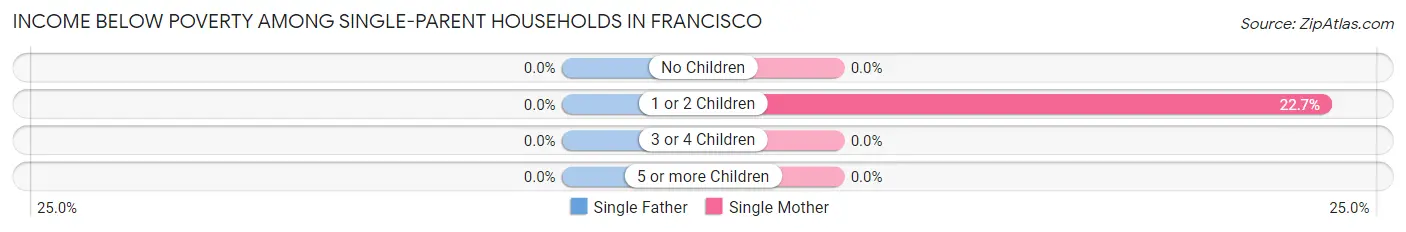
| Children | Single Father | Single Mother |
| No Children | 0 (0.0%) | 0 (0.0%) |
| 1 or 2 Children | 0 (0.0%) | 5 (22.7%) |
| 3 or 4 Children | 0 (0.0%) | 0 (0.0%) |
| 5 or more Children | 0 (0.0%) | 0 (0.0%) |
| Total | 0 (0.0%) | 5 (13.2%) |
Income Below Poverty Among Married-Couple vs Single-Parent Households in Francisco
The poverty data for Francisco shows that 4 of the married-couple family households (3.0%) and 5 of the single-parent households (7.1%) are living below the poverty level. Within the married-couple family households, those with no children have the highest poverty rate, with 4 households (4.5%) falling below the poverty line. Among the single-parent households, those with 1 or 2 children have the highest poverty rate, with 5 household (21.7%) living below poverty.
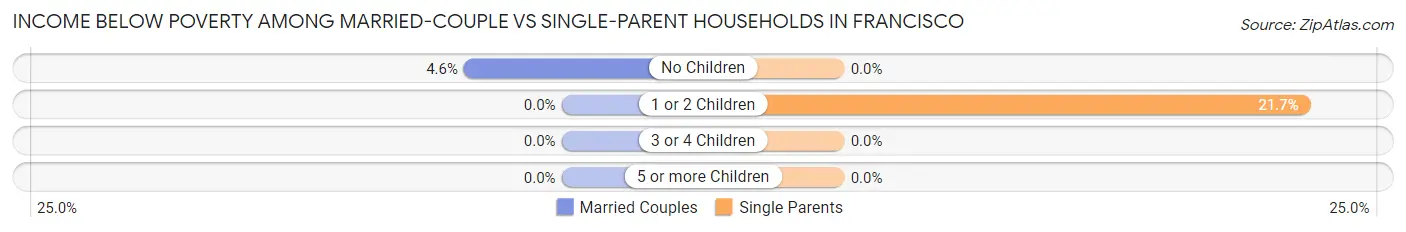
| Children | Married-Couple Families | Single-Parent Households |
| No Children | 4 (4.5%) | 0 (0.0%) |
| 1 or 2 Children | 0 (0.0%) | 5 (21.7%) |
| 3 or 4 Children | 0 (0.0%) | 0 (0.0%) |
| 5 or more Children | 0 (0.0%) | 0 (0.0%) |
| Total | 4 (3.0%) | 5 (7.1%) |
Race in Francisco
The most populous races in Francisco are White / Caucasian (566 | 94.3%), Black / African American (18 | 3.0%), and Two or more Races (10 | 1.7%).
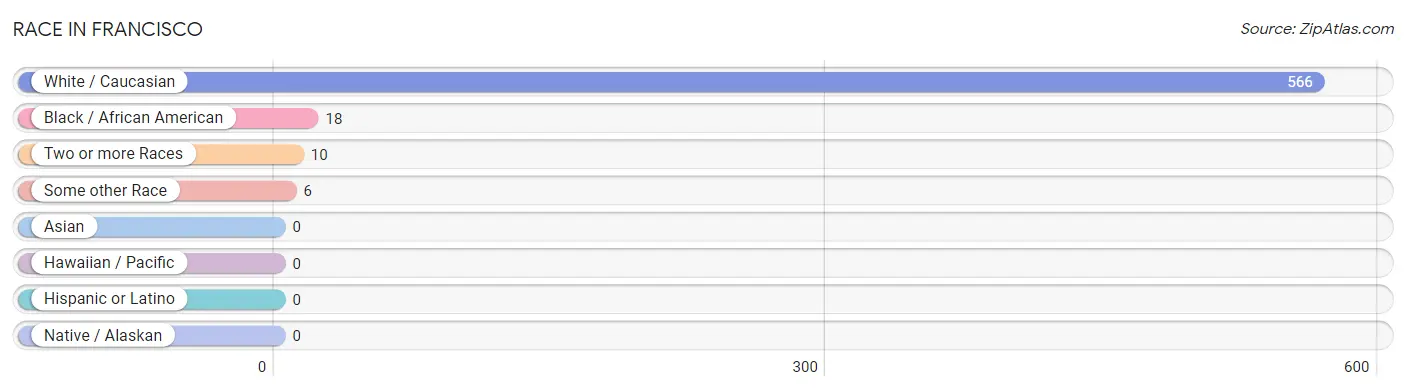
| Race | # Population | % Population |
| Asian | 0 | 0.0% |
| Black / African American | 18 | 3.0% |
| Hawaiian / Pacific | 0 | 0.0% |
| Hispanic or Latino | 0 | 0.0% |
| Native / Alaskan | 0 | 0.0% |
| White / Caucasian | 566 | 94.3% |
| Two or more Races | 10 | 1.7% |
| Some other Race | 6 | 1.0% |
| Total | 600 | 100.0% |
Ancestry in Francisco
The most populous ancestries reported in Francisco are German (162 | 27.0%), English (51 | 8.5%), American (43 | 7.2%), Irish (39 | 6.5%), and European (14 | 2.3%), together accounting for 51.5% of all Francisco residents.
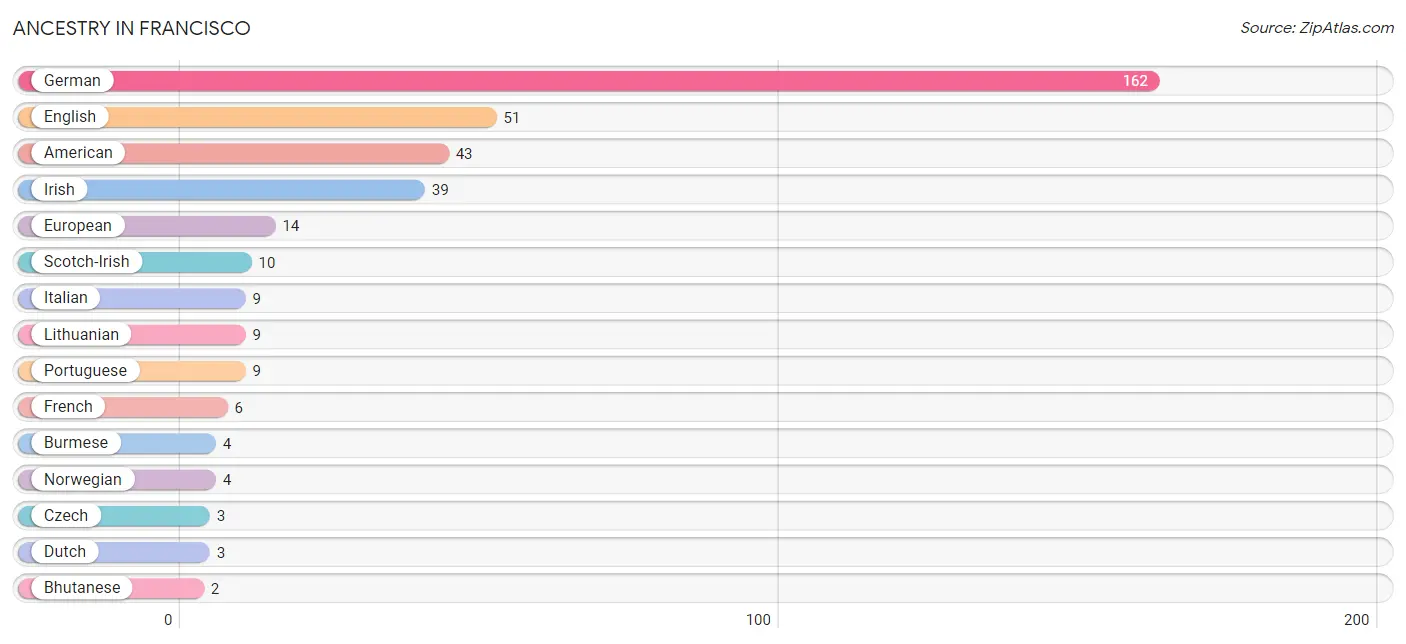
| Ancestry | # Population | % Population |
| American | 43 | 7.2% |
| Bhutanese | 2 | 0.3% |
| Burmese | 4 | 0.7% |
| Czech | 3 | 0.5% |
| Dutch | 3 | 0.5% |
| English | 51 | 8.5% |
| European | 14 | 2.3% |
| French | 6 | 1.0% |
| German | 162 | 27.0% |
| Irish | 39 | 6.5% |
| Italian | 9 | 1.5% |
| Lithuanian | 9 | 1.5% |
| Norwegian | 4 | 0.7% |
| Portuguese | 9 | 1.5% |
| Scotch-Irish | 10 | 1.7% | View All 15 Rows |
Immigrants in Francisco
The most numerous immigrant groups reported in Francisco came from Europe (11 | 1.8%), Germany (11 | 1.8%), and Western Europe (11 | 1.8%), together accounting for 5.5% of all Francisco residents.
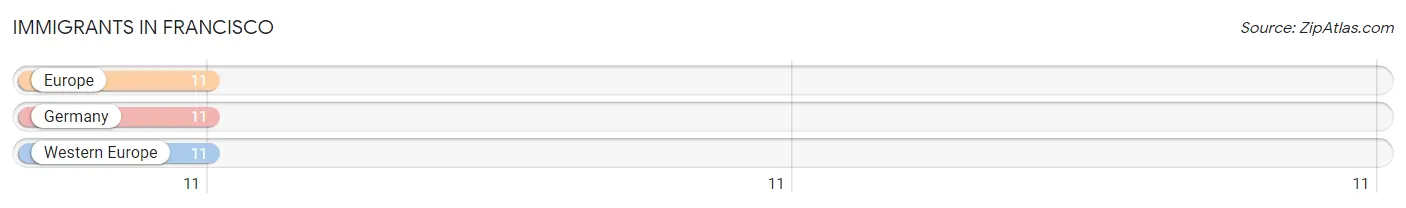
| Immigration Origin | # Population | % Population |
| Europe | 11 | 1.8% |
| Germany | 11 | 1.8% |
| Western Europe | 11 | 1.8% | View All 3 Rows |
Sex and Age in Francisco
Sex and Age in Francisco
The most populous age groups in Francisco are 50 to 54 Years (52 | 19.1%) for men and 10 to 14 Years (42 | 12.8%) for women.
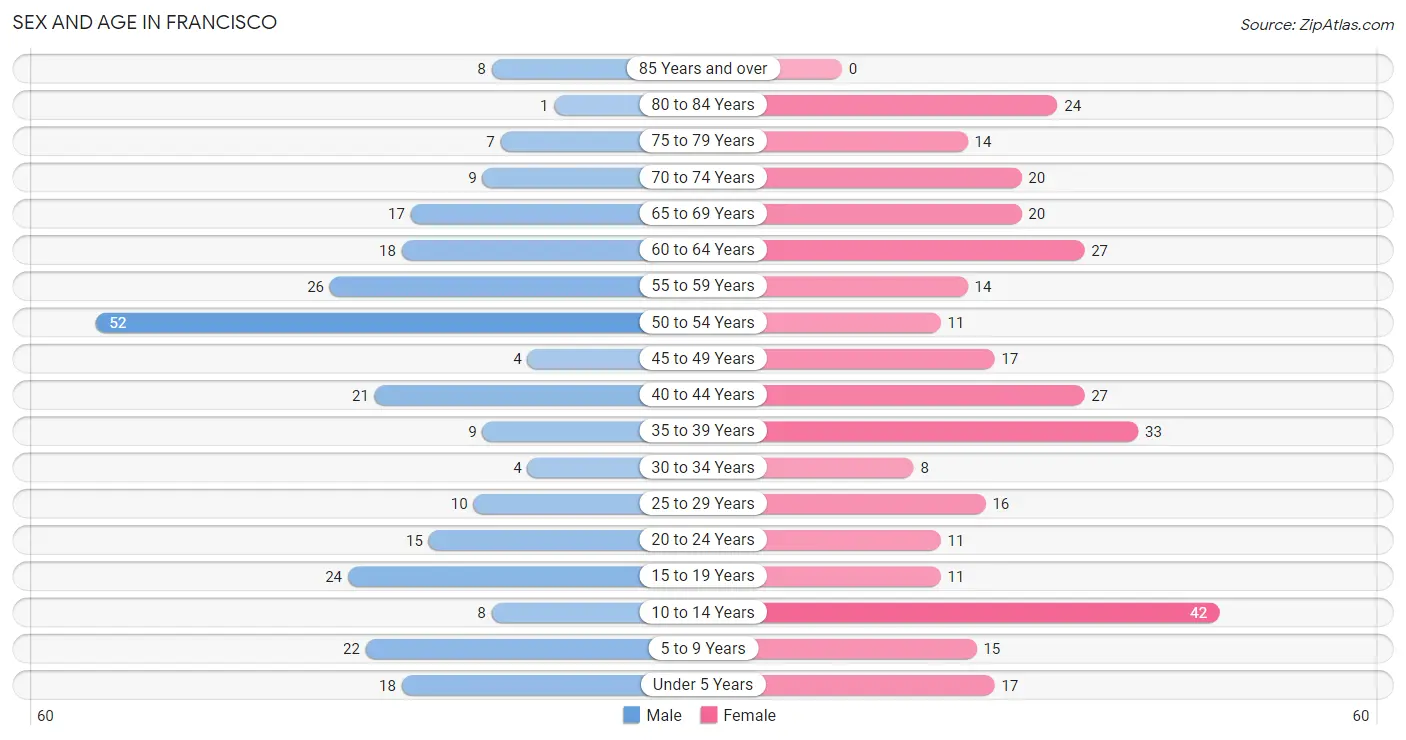
| Age Bracket | Male | Female |
| Under 5 Years | 18 (6.6%) | 17 (5.2%) |
| 5 to 9 Years | 22 (8.1%) | 15 (4.6%) |
| 10 to 14 Years | 8 (2.9%) | 42 (12.8%) |
| 15 to 19 Years | 24 (8.8%) | 11 (3.4%) |
| 20 to 24 Years | 15 (5.5%) | 11 (3.4%) |
| 25 to 29 Years | 10 (3.7%) | 16 (4.9%) |
| 30 to 34 Years | 4 (1.5%) | 8 (2.5%) |
| 35 to 39 Years | 9 (3.3%) | 33 (10.1%) |
| 40 to 44 Years | 21 (7.7%) | 27 (8.3%) |
| 45 to 49 Years | 4 (1.5%) | 17 (5.2%) |
| 50 to 54 Years | 52 (19.1%) | 11 (3.4%) |
| 55 to 59 Years | 26 (9.5%) | 14 (4.3%) |
| 60 to 64 Years | 18 (6.6%) | 27 (8.3%) |
| 65 to 69 Years | 17 (6.2%) | 20 (6.1%) |
| 70 to 74 Years | 9 (3.3%) | 20 (6.1%) |
| 75 to 79 Years | 7 (2.6%) | 14 (4.3%) |
| 80 to 84 Years | 1 (0.4%) | 24 (7.3%) |
| 85 Years and over | 8 (2.9%) | 0 (0.0%) |
| Total | 273 (100.0%) | 327 (100.0%) |
Families and Households in Francisco
Median Family Size in Francisco
The median family size in Francisco is 2.64 persons per family, with single female/mother families (38 | 18.6%) accounting for the largest median family size of 2.74 persons per family. On the other hand, single male/father families (32 | 15.7%) represent the smallest median family size with 2.50 persons per family.
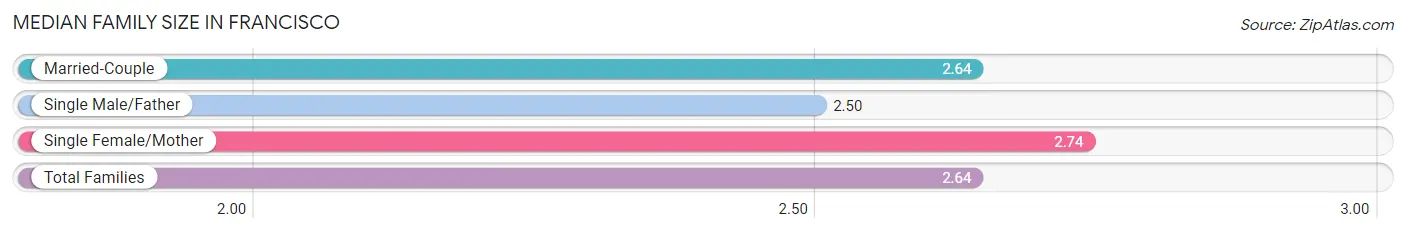
| Family Type | # Families | Family Size |
| Married-Couple | 134 (65.7%) | 2.64 |
| Single Male/Father | 32 (15.7%) | 2.50 |
| Single Female/Mother | 38 (18.6%) | 2.74 |
| Total Families | 204 (100.0%) | 2.64 |
Median Household Size in Francisco
The median household size in Francisco is 2.43 persons per household, with single female/mother households (38 | 15.4%) accounting for the largest median household size of 2.92 persons per household. non-family households (43 | 17.4%) represent the smallest median household size with 1.28 persons per household.
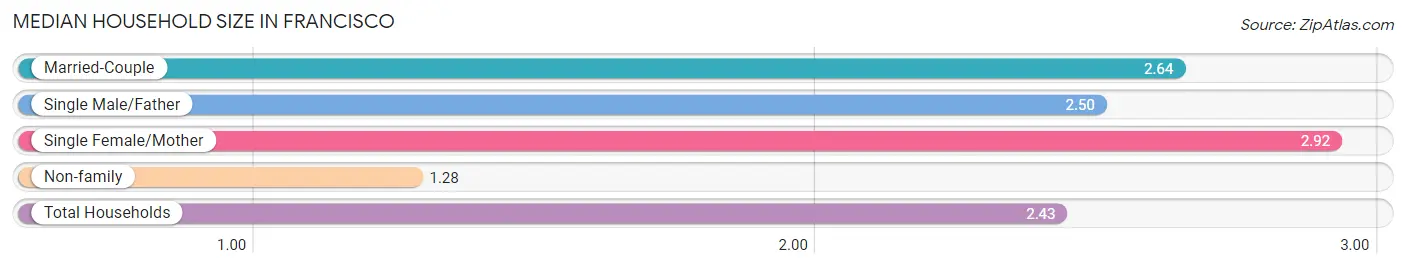
| Household Type | # Households | Household Size |
| Married-Couple | 134 (54.2%) | 2.64 |
| Single Male/Father | 32 (13.0%) | 2.50 |
| Single Female/Mother | 38 (15.4%) | 2.92 |
| Non-family | 43 (17.4%) | 1.28 |
| Total Households | 247 (100.0%) | 2.43 |
Household Size by Marriage Status in Francisco
Out of a total of 247 households in Francisco, 204 (82.6%) are family households, while 43 (17.4%) are nonfamily households. The most numerous type of family households are 2-person households, comprising 131, and the most common type of nonfamily households are 1-person households, comprising 38.
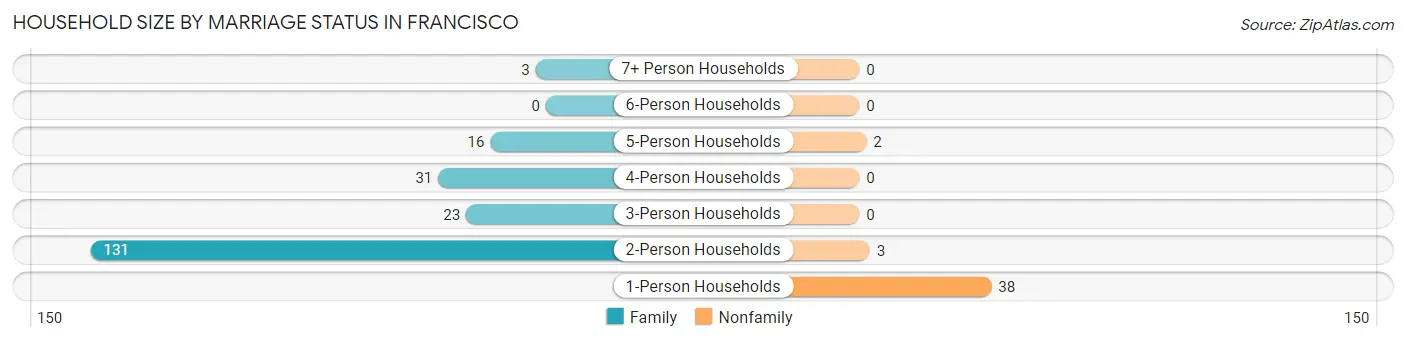
| Household Size | Family Households | Nonfamily Households |
| 1-Person Households | - | 38 (15.4%) |
| 2-Person Households | 131 (53.0%) | 3 (1.2%) |
| 3-Person Households | 23 (9.3%) | 0 (0.0%) |
| 4-Person Households | 31 (12.6%) | 0 (0.0%) |
| 5-Person Households | 16 (6.5%) | 2 (0.8%) |
| 6-Person Households | 0 (0.0%) | 0 (0.0%) |
| 7+ Person Households | 3 (1.2%) | 0 (0.0%) |
| Total | 204 (82.6%) | 43 (17.4%) |
Female Fertility in Francisco
Fertility by Age in Francisco
Average fertility rate in Francisco is 40.0 births per 1,000 women. Women in the age bracket of 20 to 34 years have the highest fertility rate with 143.0 births per 1,000 women. Women in the age bracket of 20 to 34 years acount for 100.0% of all women with births.
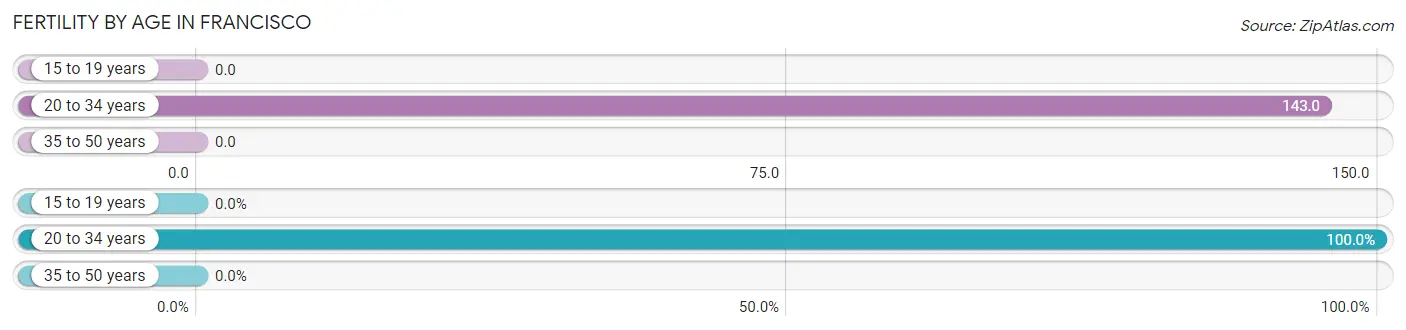
| Age Bracket | Women with Births | Births / 1,000 Women |
| 15 to 19 years | 0 (0.0%) | 0.0 |
| 20 to 34 years | 5 (100.0%) | 143.0 |
| 35 to 50 years | 0 (0.0%) | 0.0 |
| Total | 5 (100.0%) | 40.0 |
Fertility by Age by Marriage Status in Francisco
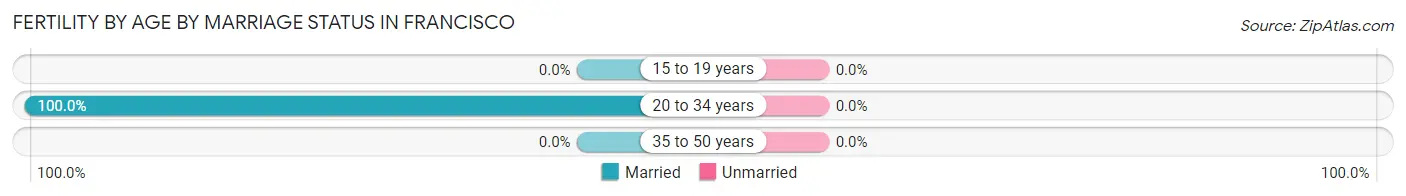
| Age Bracket | Married | Unmarried |
| 15 to 19 years | 0 (0.0%) | 0 (0.0%) |
| 20 to 34 years | 5 (100.0%) | 0 (0.0%) |
| 35 to 50 years | 0 (0.0%) | 0 (0.0%) |
| Total | 5 (100.0%) | 0 (0.0%) |
Fertility by Education in Francisco
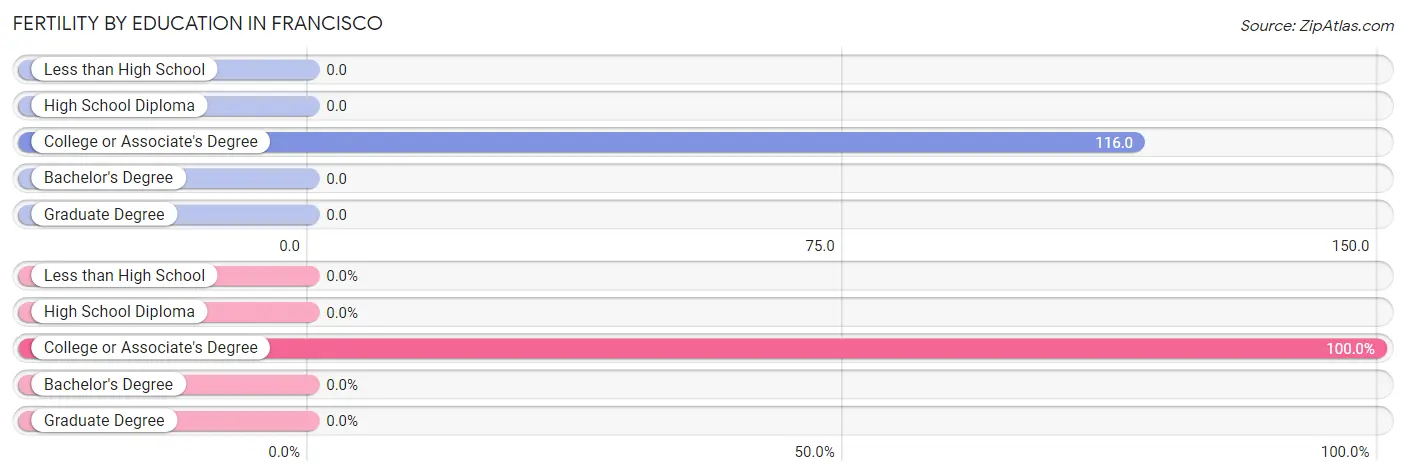
| Educational Attainment | Women with Births | Births / 1,000 Women |
| Less than High School | 0 (0.0%) | 0.0 |
| High School Diploma | 0 (0.0%) | 0.0 |
| College or Associate's Degree | 5 (100.0%) | 116.0 |
| Bachelor's Degree | 0 (0.0%) | 0.0 |
| Graduate Degree | 0 (0.0%) | 0.0 |
| Total | 5 (100.0%) | 40.0 |
Fertility by Education by Marriage Status in Francisco
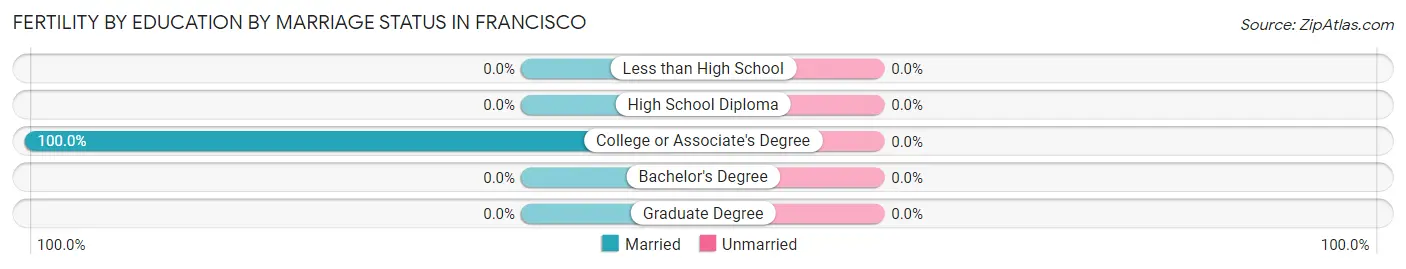
| Educational Attainment | Married | Unmarried |
| Less than High School | 0 (0.0%) | 0 (0.0%) |
| High School Diploma | 0 (0.0%) | 0 (0.0%) |
| College or Associate's Degree | 5 (100.0%) | 0 (0.0%) |
| Bachelor's Degree | 0 (0.0%) | 0 (0.0%) |
| Graduate Degree | 0 (0.0%) | 0 (0.0%) |
| Total | 5 (100.0%) | 0 (0.0%) |
Employment Characteristics in Francisco
Employment by Class of Employer in Francisco
Among the 248 employed individuals in Francisco, private company employees (200 | 80.6%), self-employed (not incorporated) (15 | 6.0%), and local government employees (12 | 4.8%) make up the most common classes of employment.
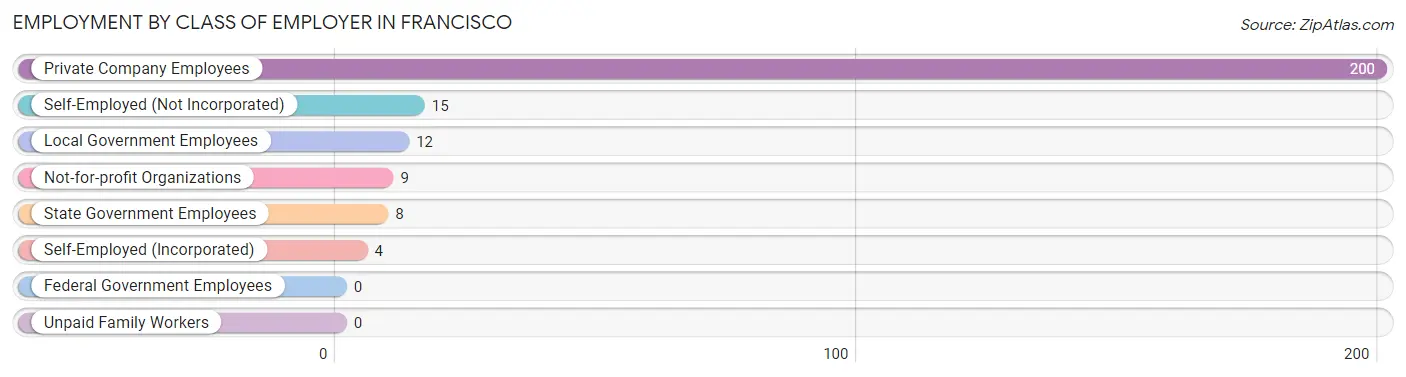
| Employer Class | # Employees | % Employees |
| Private Company Employees | 200 | 80.6% |
| Self-Employed (Incorporated) | 4 | 1.6% |
| Self-Employed (Not Incorporated) | 15 | 6.0% |
| Not-for-profit Organizations | 9 | 3.6% |
| Local Government Employees | 12 | 4.8% |
| State Government Employees | 8 | 3.2% |
| Federal Government Employees | 0 | 0.0% |
| Unpaid Family Workers | 0 | 0.0% |
| Total | 248 | 100.0% |
Employment Status by Age in Francisco
According to the labor force statistics for Francisco, out of the total population over 16 years of age (465), 54.8% or 255 individuals are in the labor force, with 1.6% or 4 of them unemployed. The age group with the highest labor force participation rate is 20 to 24 years, with 96.2% or 25 individuals in the labor force. Within the labor force, the 45 to 54 years age range has the highest percentage of unemployed individuals, with 5.1% or 4 of them being unemployed.
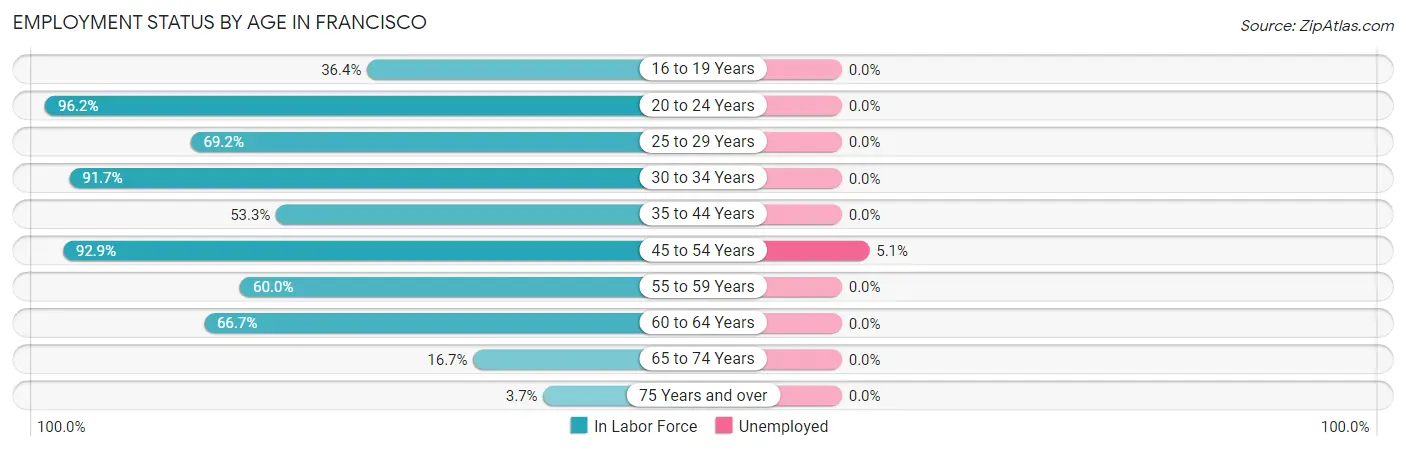
| Age Bracket | In Labor Force | Unemployed |
| 16 to 19 Years | 8 (36.4%) | 0 (0.0%) |
| 20 to 24 Years | 25 (96.2%) | 0 (0.0%) |
| 25 to 29 Years | 18 (69.2%) | 0 (0.0%) |
| 30 to 34 Years | 11 (91.7%) | 0 (0.0%) |
| 35 to 44 Years | 48 (53.3%) | 0 (0.0%) |
| 45 to 54 Years | 78 (92.9%) | 4 (5.1%) |
| 55 to 59 Years | 24 (60.0%) | 0 (0.0%) |
| 60 to 64 Years | 30 (66.7%) | 0 (0.0%) |
| 65 to 74 Years | 11 (16.7%) | 0 (0.0%) |
| 75 Years and over | 2 (3.7%) | 0 (0.0%) |
| Total | 255 (54.8%) | 4 (1.6%) |
Employment Status by Educational Attainment in Francisco
According to labor force statistics for Francisco, 70.4% of individuals (209) out of the total population between 25 and 64 years of age (297) are in the labor force, with 1.9% or 4 of them being unemployed. The group with the highest labor force participation rate are those with the educational attainment of bachelor's degree or higher, with 98.0% or 49 individuals in the labor force. Within the labor force, individuals with less than high school education have the highest percentage of unemployment, with 30.8% or 4 of them being unemployed.
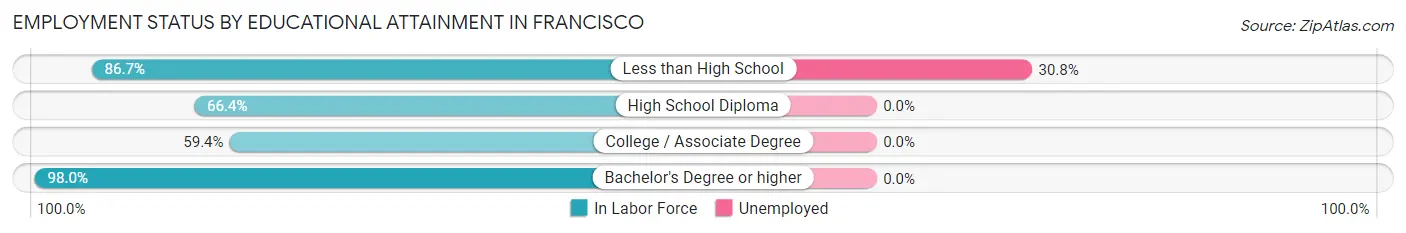
| Educational Attainment | In Labor Force | Unemployed |
| Less than High School | 13 (86.7%) | 5 (30.8%) |
| High School Diploma | 87 (66.4%) | 0 (0.0%) |
| College / Associate Degree | 60 (59.4%) | 0 (0.0%) |
| Bachelor's Degree or higher | 49 (98.0%) | 0 (0.0%) |
| Total | 209 (70.4%) | 6 (1.9%) |
Employment Occupations by Sex in Francisco
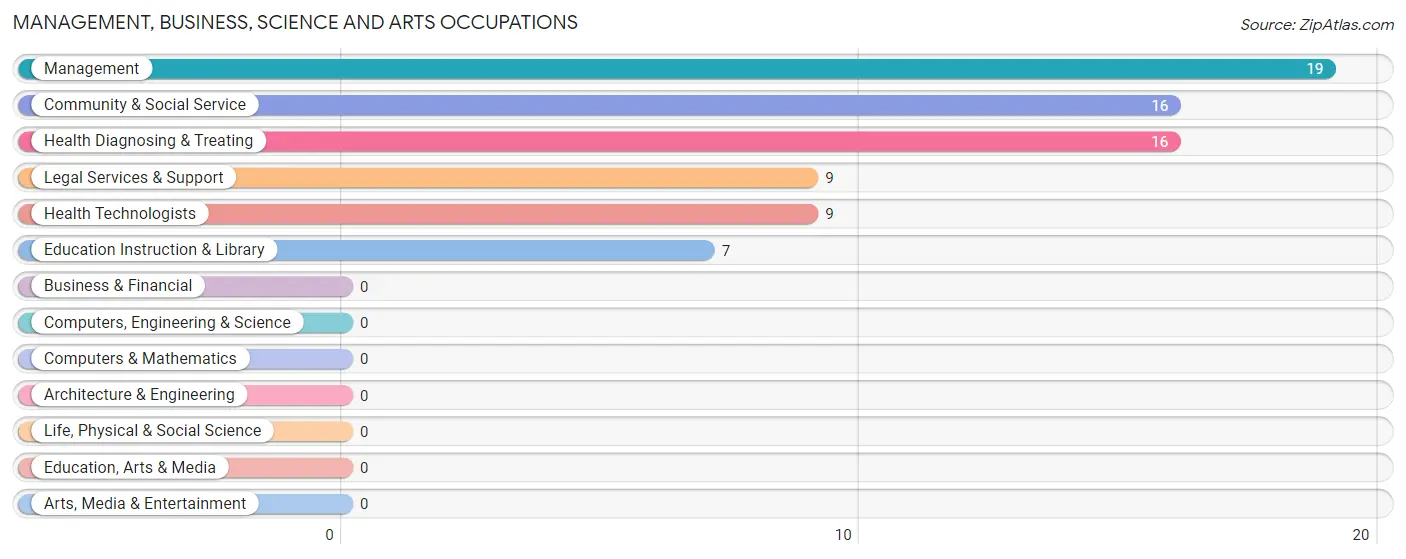
Management, Business, Science and Arts Occupations
The most common Management, Business, Science and Arts occupations in Francisco are Management (19 | 7.6%), Community & Social Service (16 | 6.4%), Health Diagnosing & Treating (16 | 6.4%), Legal Services & Support (9 | 3.6%), and Health Technologists (9 | 3.6%).
Management, Business, Science and Arts Occupations by Sex
Within the Management, Business, Science and Arts occupations in Francisco, the most male-oriented occupations are Legal Services & Support (100.0%), Management (84.2%), and Community & Social Service (68.8%), while the most female-oriented occupations are Health Diagnosing & Treating (100.0%), Health Technologists (100.0%), and Education Instruction & Library (71.4%).
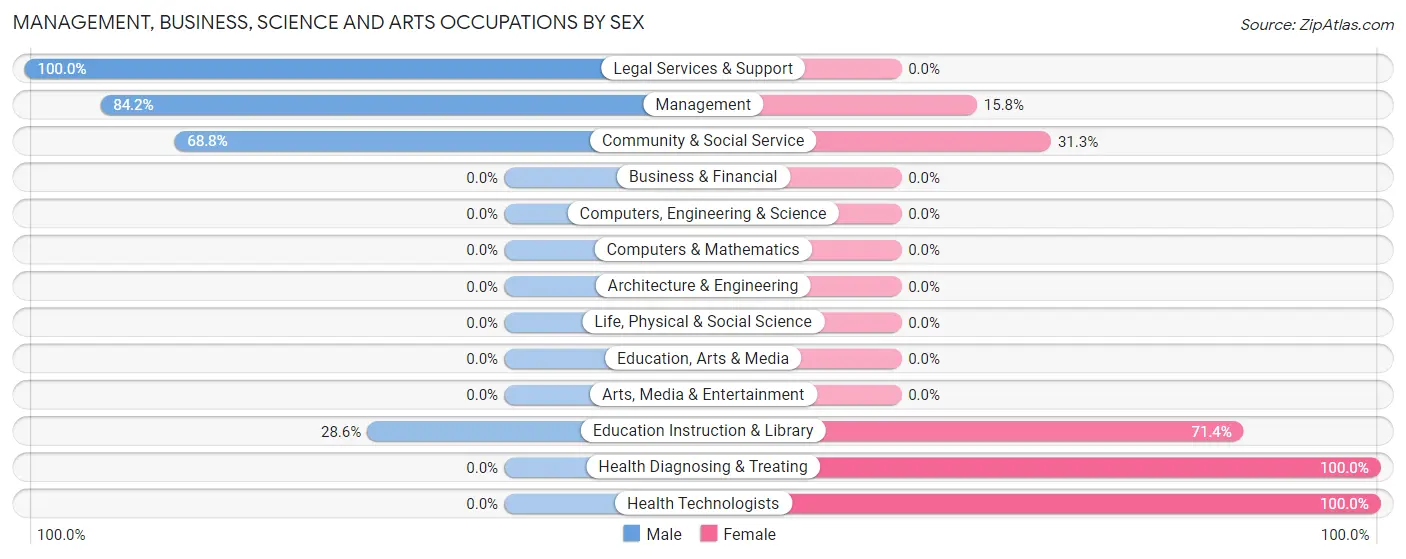
| Occupation | Male | Female |
| Management | 16 (84.2%) | 3 (15.8%) |
| Business & Financial | 0 (0.0%) | 0 (0.0%) |
| Computers, Engineering & Science | 0 (0.0%) | 0 (0.0%) |
| Computers & Mathematics | 0 (0.0%) | 0 (0.0%) |
| Architecture & Engineering | 0 (0.0%) | 0 (0.0%) |
| Life, Physical & Social Science | 0 (0.0%) | 0 (0.0%) |
| Community & Social Service | 11 (68.8%) | 5 (31.2%) |
| Education, Arts & Media | 0 (0.0%) | 0 (0.0%) |
| Legal Services & Support | 9 (100.0%) | 0 (0.0%) |
| Education Instruction & Library | 2 (28.6%) | 5 (71.4%) |
| Arts, Media & Entertainment | 0 (0.0%) | 0 (0.0%) |
| Health Diagnosing & Treating | 0 (0.0%) | 16 (100.0%) |
| Health Technologists | 0 (0.0%) | 9 (100.0%) |
| Total (Category) | 27 (52.9%) | 24 (47.1%) |
| Total (Overall) | 138 (55.0%) | 113 (45.0%) |
Services Occupations
The most common Services occupations in Francisco are Food Preparation & Serving (14 | 5.6%), Cleaning & Maintenance (9 | 3.6%), Security & Protection (3 | 1.2%), Law Enforcement (3 | 1.2%), and Healthcare Support (2 | 0.8%).

Services Occupations by Sex
Within the Services occupations in Francisco, the most male-oriented occupations are Security & Protection (100.0%), Law Enforcement (100.0%), and Cleaning & Maintenance (44.4%), while the most female-oriented occupations are Healthcare Support (100.0%), Food Preparation & Serving (100.0%), and Personal Care & Service (100.0%).
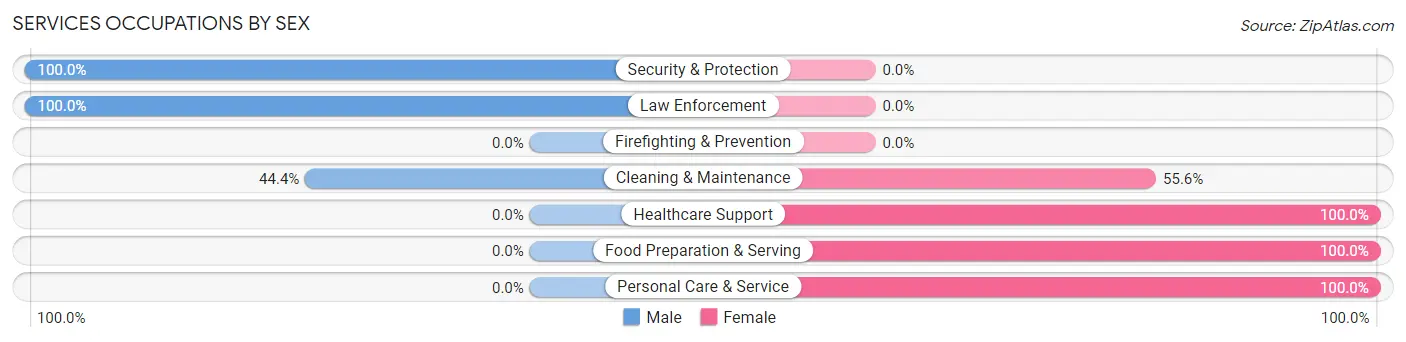
| Occupation | Male | Female |
| Healthcare Support | 0 (0.0%) | 2 (100.0%) |
| Security & Protection | 3 (100.0%) | 0 (0.0%) |
| Firefighting & Prevention | 0 (0.0%) | 0 (0.0%) |
| Law Enforcement | 3 (100.0%) | 0 (0.0%) |
| Food Preparation & Serving | 0 (0.0%) | 14 (100.0%) |
| Cleaning & Maintenance | 4 (44.4%) | 5 (55.6%) |
| Personal Care & Service | 0 (0.0%) | 2 (100.0%) |
| Total (Category) | 7 (23.3%) | 23 (76.7%) |
| Total (Overall) | 138 (55.0%) | 113 (45.0%) |
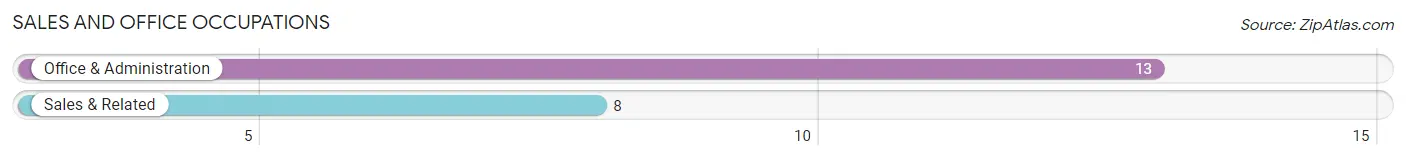
Sales and Office Occupations
The most common Sales and Office occupations in Francisco are Office & Administration (13 | 5.2%), and Sales & Related (8 | 3.2%).
Sales and Office Occupations by Sex
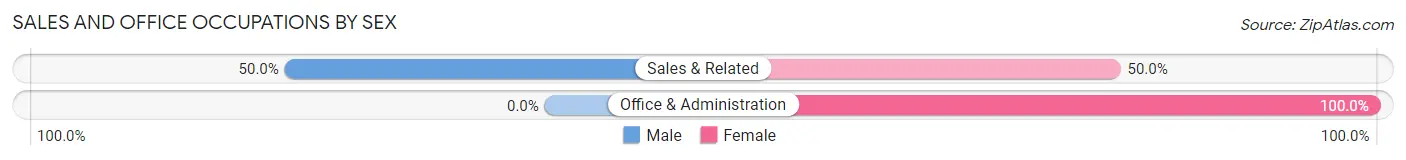
| Occupation | Male | Female |
| Sales & Related | 4 (50.0%) | 4 (50.0%) |
| Office & Administration | 0 (0.0%) | 13 (100.0%) |
| Total (Category) | 4 (19.1%) | 17 (80.9%) |
| Total (Overall) | 138 (55.0%) | 113 (45.0%) |
Natural Resources, Construction and Maintenance Occupations
The most common Natural Resources, Construction and Maintenance occupations in Francisco are Construction & Extraction (33 | 13.2%), and Installation, Maintenance & Repair (12 | 4.8%).
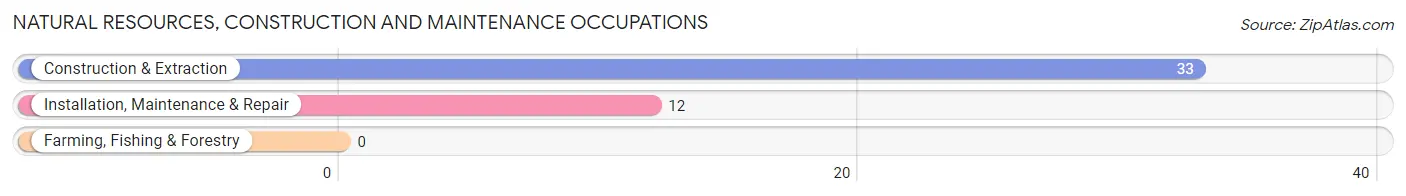
Natural Resources, Construction and Maintenance Occupations by Sex
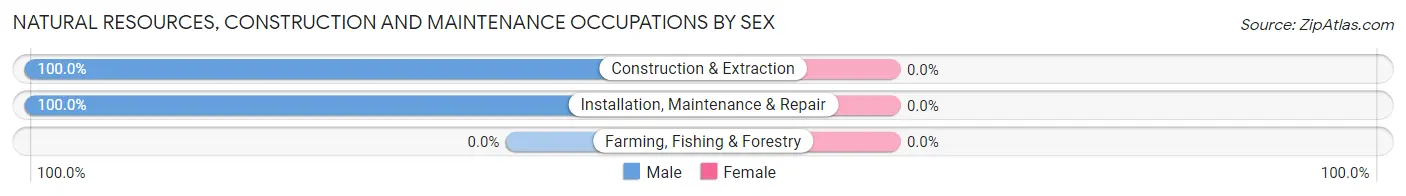
| Occupation | Male | Female |
| Farming, Fishing & Forestry | 0 (0.0%) | 0 (0.0%) |
| Construction & Extraction | 33 (100.0%) | 0 (0.0%) |
| Installation, Maintenance & Repair | 12 (100.0%) | 0 (0.0%) |
| Total (Category) | 45 (100.0%) | 0 (0.0%) |
| Total (Overall) | 138 (55.0%) | 113 (45.0%) |
Production, Transportation and Moving Occupations
The most common Production, Transportation and Moving occupations in Francisco are Production (71 | 28.3%), Material Moving (20 | 8.0%), and Transportation (13 | 5.2%).
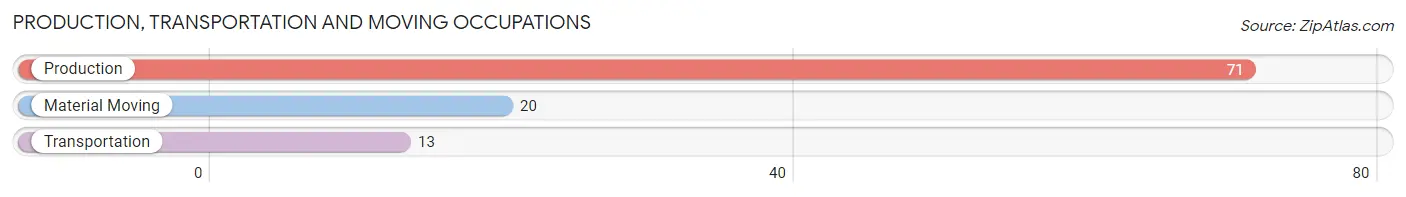
Production, Transportation and Moving Occupations by Sex
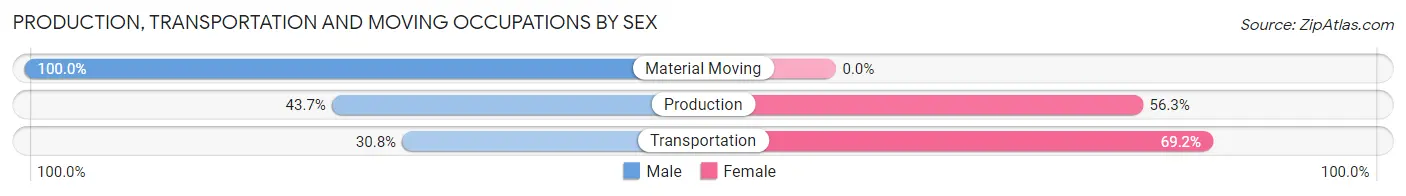
| Occupation | Male | Female |
| Production | 31 (43.7%) | 40 (56.3%) |
| Transportation | 4 (30.8%) | 9 (69.2%) |
| Material Moving | 20 (100.0%) | 0 (0.0%) |
| Total (Category) | 55 (52.9%) | 49 (47.1%) |
| Total (Overall) | 138 (55.0%) | 113 (45.0%) |
Employment Industries by Sex in Francisco
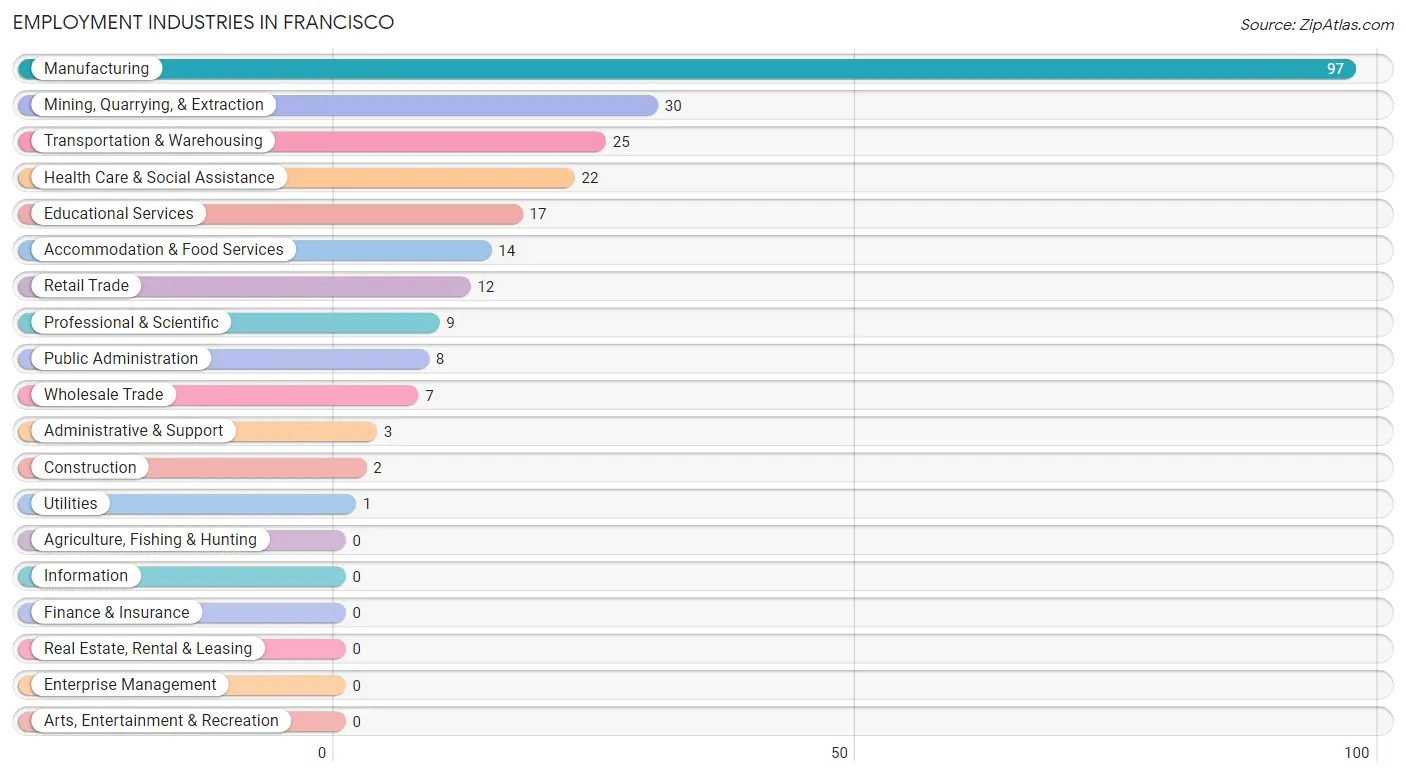
Employment Industries in Francisco
The major employment industries in Francisco include Manufacturing (97 | 38.7%), Mining, Quarrying, & Extraction (30 | 11.9%), Transportation & Warehousing (25 | 10.0%), Health Care & Social Assistance (22 | 8.8%), and Educational Services (17 | 6.8%).
Employment Industries by Sex in Francisco
The Francisco industries that see more men than women are Mining, Quarrying, & Extraction (100.0%), Construction (100.0%), and Utilities (100.0%), whereas the industries that tend to have a higher number of women are Health Care & Social Assistance (100.0%), Accommodation & Food Services (100.0%), and Educational Services (76.5%).
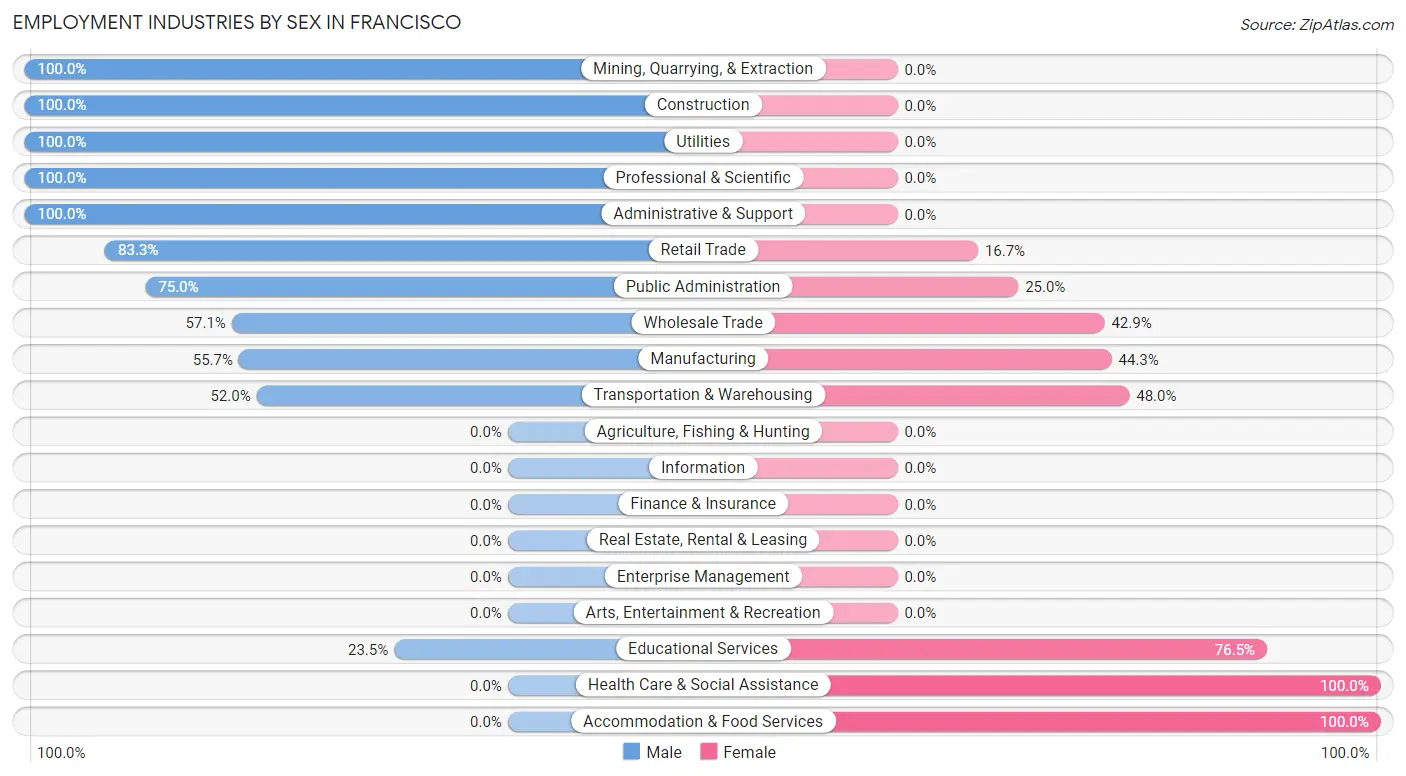
| Industry | Male | Female |
| Agriculture, Fishing & Hunting | 0 (0.0%) | 0 (0.0%) |
| Mining, Quarrying, & Extraction | 30 (100.0%) | 0 (0.0%) |
| Construction | 2 (100.0%) | 0 (0.0%) |
| Manufacturing | 54 (55.7%) | 43 (44.3%) |
| Wholesale Trade | 4 (57.1%) | 3 (42.9%) |
| Retail Trade | 10 (83.3%) | 2 (16.7%) |
| Transportation & Warehousing | 13 (52.0%) | 12 (48.0%) |
| Utilities | 1 (100.0%) | 0 (0.0%) |
| Information | 0 (0.0%) | 0 (0.0%) |
| Finance & Insurance | 0 (0.0%) | 0 (0.0%) |
| Real Estate, Rental & Leasing | 0 (0.0%) | 0 (0.0%) |
| Professional & Scientific | 9 (100.0%) | 0 (0.0%) |
| Enterprise Management | 0 (0.0%) | 0 (0.0%) |
| Administrative & Support | 3 (100.0%) | 0 (0.0%) |
| Educational Services | 4 (23.5%) | 13 (76.5%) |
| Health Care & Social Assistance | 0 (0.0%) | 22 (100.0%) |
| Arts, Entertainment & Recreation | 0 (0.0%) | 0 (0.0%) |
| Accommodation & Food Services | 0 (0.0%) | 14 (100.0%) |
| Public Administration | 6 (75.0%) | 2 (25.0%) |
| Total | 138 (55.0%) | 113 (45.0%) |
Education in Francisco
School Enrollment in Francisco
The most common levels of schooling among the 118 students in Francisco are elementary school (40 | 33.9%), high school (34 | 28.8%), and middle school (22 | 18.6%).
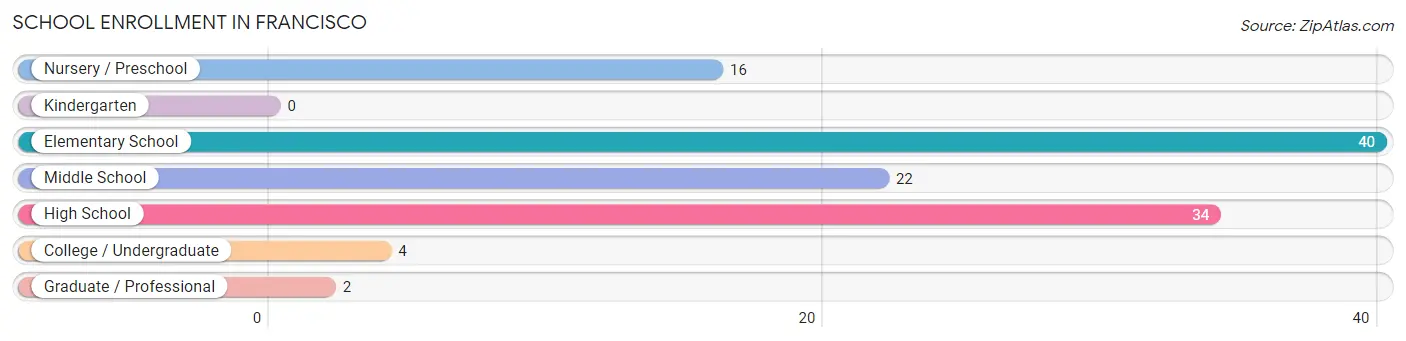
| School Level | # Students | % Students |
| Nursery / Preschool | 16 | 13.6% |
| Kindergarten | 0 | 0.0% |
| Elementary School | 40 | 33.9% |
| Middle School | 22 | 18.6% |
| High School | 34 | 28.8% |
| College / Undergraduate | 4 | 3.4% |
| Graduate / Professional | 2 | 1.7% |
| Total | 118 | 100.0% |
School Enrollment by Age by Funding Source in Francisco
Out of a total of 118 students who are enrolled in schools in Francisco, 17 (14.4%) attend a private institution, while the remaining 101 (85.6%) are enrolled in public schools. The age group of 35 years and over has the highest likelihood of being enrolled in private schools, with 4 (100.0% in the age bracket) enrolled. Conversely, the age group of 15 to 17 year olds has the lowest likelihood of being enrolled in a private school, with 29 (100.0% in the age bracket) attending a public institution.
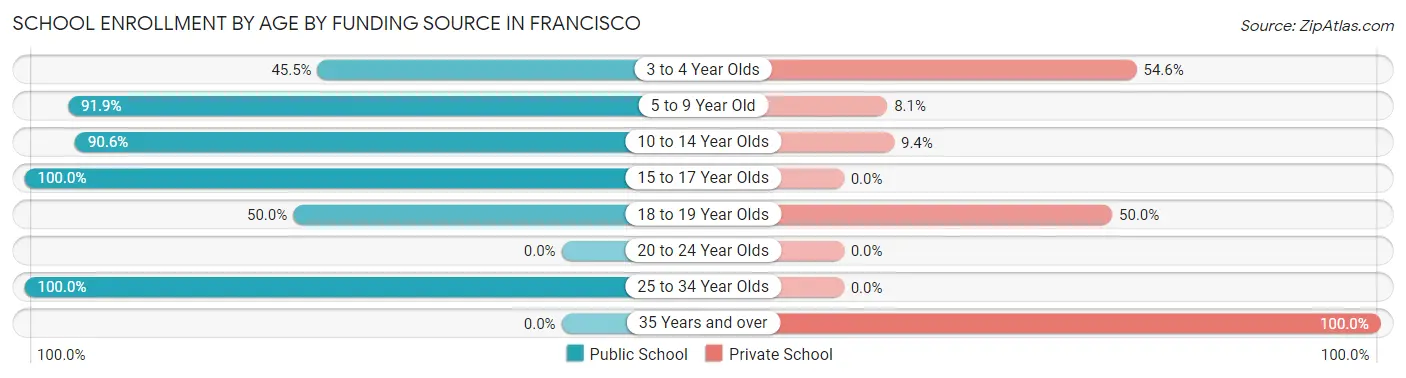
| Age Bracket | Public School | Private School |
| 3 to 4 Year Olds | 5 (45.5%) | 6 (54.5%) |
| 5 to 9 Year Old | 34 (91.9%) | 3 (8.1%) |
| 10 to 14 Year Olds | 29 (90.6%) | 3 (9.4%) |
| 15 to 17 Year Olds | 29 (100.0%) | 0 (0.0%) |
| 18 to 19 Year Olds | 1 (50.0%) | 1 (50.0%) |
| 20 to 24 Year Olds | 0 (0.0%) | 0 (0.0%) |
| 25 to 34 Year Olds | 3 (100.0%) | 0 (0.0%) |
| 35 Years and over | 0 (0.0%) | 4 (100.0%) |
| Total | 101 (85.6%) | 17 (14.4%) |
Educational Attainment by Field of Study in Francisco
Science & technology (13 | 16.3%), arts & humanities (12 | 15.0%), computers & mathematics (11 | 13.8%), education (11 | 13.8%), and bio, nature & agricultural (9 | 11.3%) are the most common fields of study among 80 individuals in Francisco who have obtained a bachelor's degree or higher.
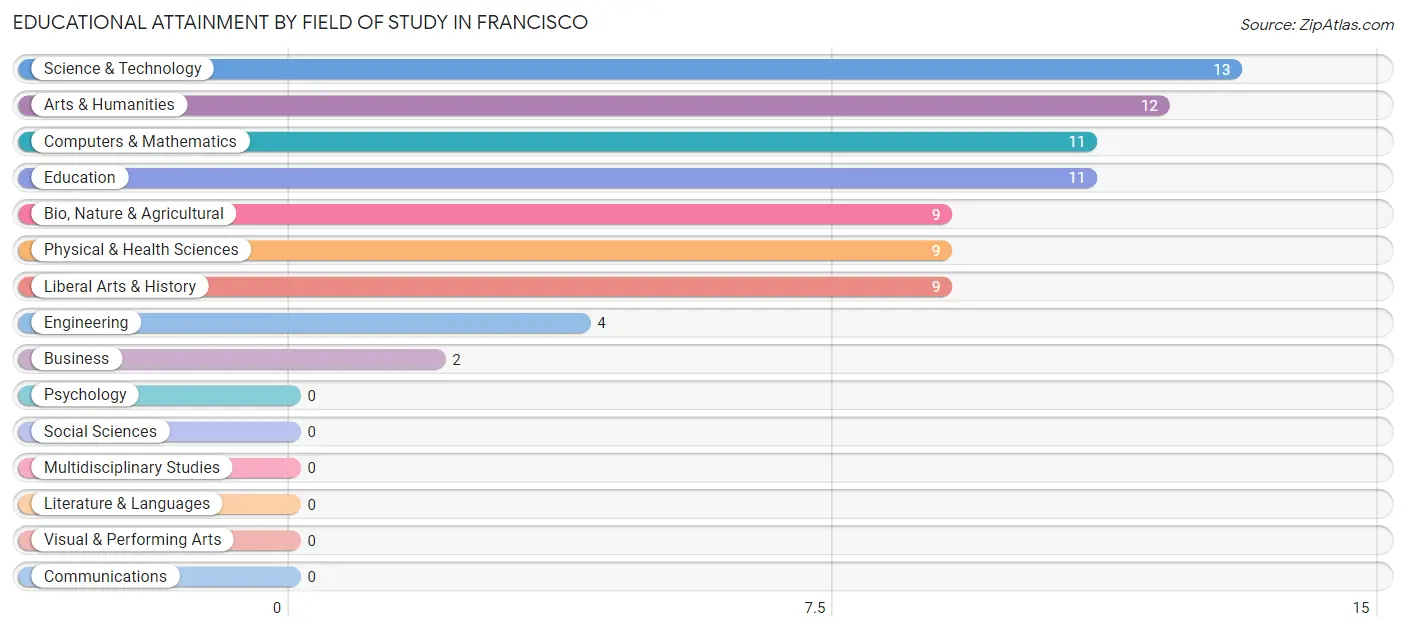
| Field of Study | # Graduates | % Graduates |
| Computers & Mathematics | 11 | 13.8% |
| Bio, Nature & Agricultural | 9 | 11.3% |
| Physical & Health Sciences | 9 | 11.3% |
| Psychology | 0 | 0.0% |
| Social Sciences | 0 | 0.0% |
| Engineering | 4 | 5.0% |
| Multidisciplinary Studies | 0 | 0.0% |
| Science & Technology | 13 | 16.3% |
| Business | 2 | 2.5% |
| Education | 11 | 13.8% |
| Literature & Languages | 0 | 0.0% |
| Liberal Arts & History | 9 | 11.3% |
| Visual & Performing Arts | 0 | 0.0% |
| Communications | 0 | 0.0% |
| Arts & Humanities | 12 | 15.0% |
| Total | 80 | 100.0% |
Transportation & Commute in Francisco
Vehicle Availability by Sex in Francisco
The most prevalent vehicle ownership categories in Francisco are males with 3 vehicles (48, accounting for 34.8%) and females with 3 vehicles (23, making up 43.6%).
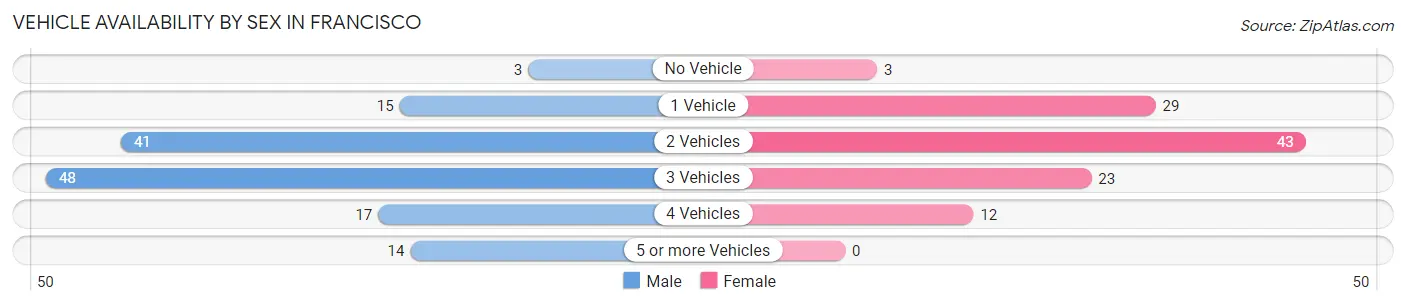
| Vehicles Available | Male | Female |
| No Vehicle | 3 (2.2%) | 3 (2.7%) |
| 1 Vehicle | 15 (10.9%) | 29 (26.4%) |
| 2 Vehicles | 41 (29.7%) | 43 (39.1%) |
| 3 Vehicles | 48 (34.8%) | 23 (20.9%) |
| 4 Vehicles | 17 (12.3%) | 12 (10.9%) |
| 5 or more Vehicles | 14 (10.1%) | 0 (0.0%) |
| Total | 138 (100.0%) | 110 (100.0%) |
Commute Time in Francisco
The most frequently occuring commute durations in Francisco are 10 to 14 minutes (48 commuters, 19.9%), 15 to 19 minutes (40 commuters, 16.6%), and 25 to 29 minutes (38 commuters, 15.8%).
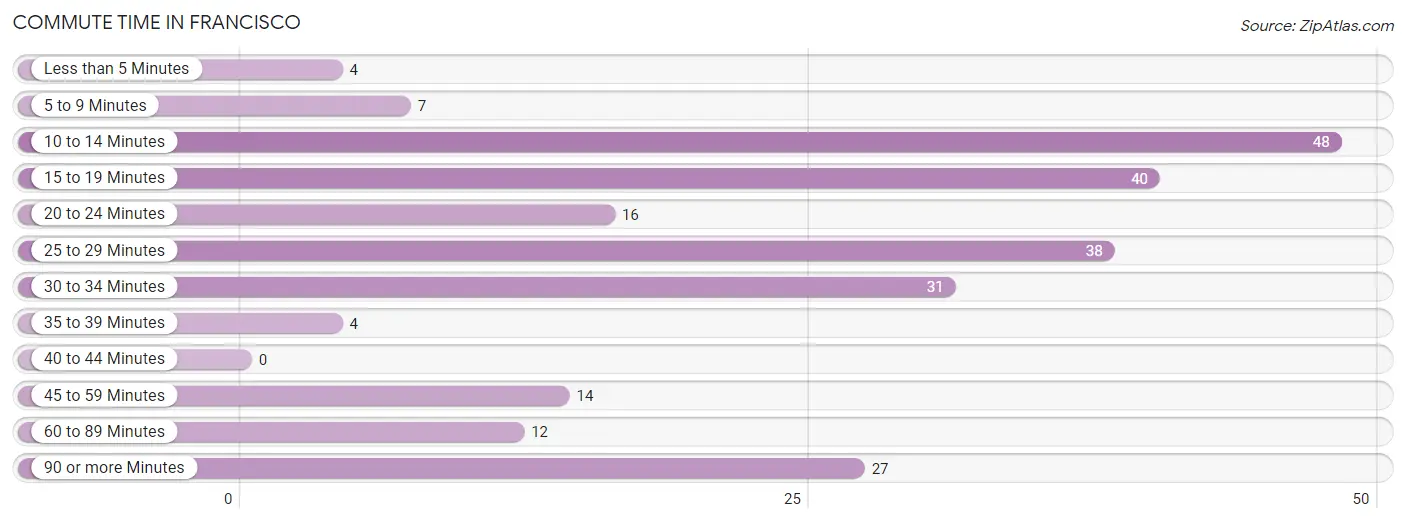
| Commute Time | # Commuters | % Commuters |
| Less than 5 Minutes | 4 | 1.7% |
| 5 to 9 Minutes | 7 | 2.9% |
| 10 to 14 Minutes | 48 | 19.9% |
| 15 to 19 Minutes | 40 | 16.6% |
| 20 to 24 Minutes | 16 | 6.6% |
| 25 to 29 Minutes | 38 | 15.8% |
| 30 to 34 Minutes | 31 | 12.9% |
| 35 to 39 Minutes | 4 | 1.7% |
| 40 to 44 Minutes | 0 | 0.0% |
| 45 to 59 Minutes | 14 | 5.8% |
| 60 to 89 Minutes | 12 | 5.0% |
| 90 or more Minutes | 27 | 11.2% |
Commute Time by Sex in Francisco
The most common commute times in Francisco are 90 or more minutes (27 commuters, 20.0%) for males and 10 to 14 minutes (29 commuters, 27.4%) for females.
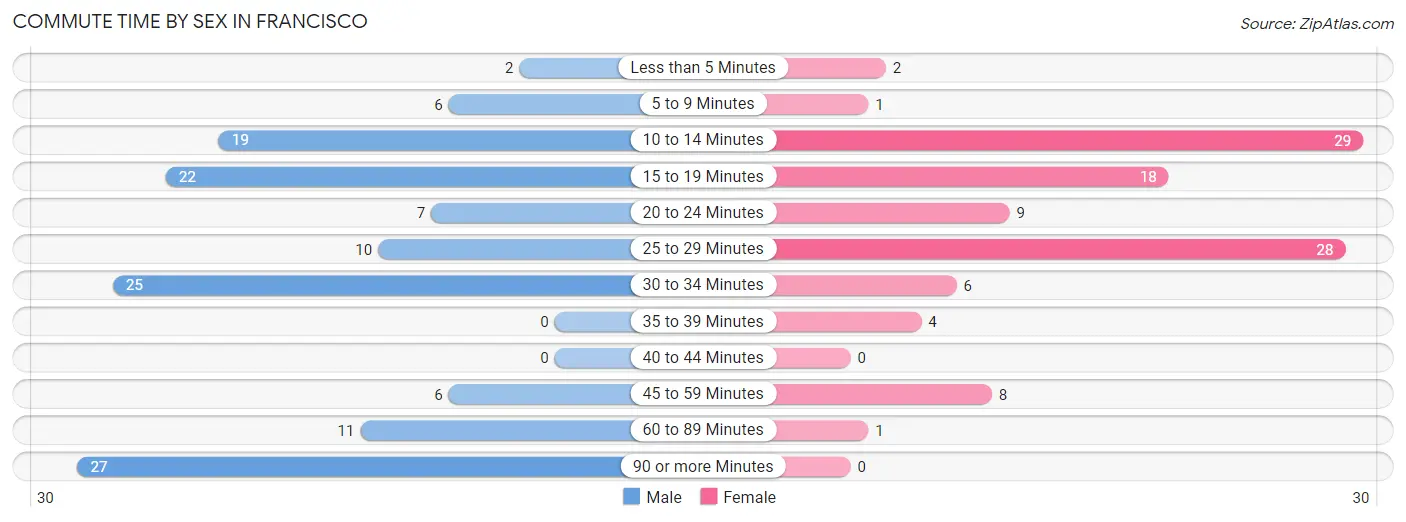
| Commute Time | Male | Female |
| Less than 5 Minutes | 2 (1.5%) | 2 (1.9%) |
| 5 to 9 Minutes | 6 (4.4%) | 1 (0.9%) |
| 10 to 14 Minutes | 19 (14.1%) | 29 (27.4%) |
| 15 to 19 Minutes | 22 (16.3%) | 18 (17.0%) |
| 20 to 24 Minutes | 7 (5.2%) | 9 (8.5%) |
| 25 to 29 Minutes | 10 (7.4%) | 28 (26.4%) |
| 30 to 34 Minutes | 25 (18.5%) | 6 (5.7%) |
| 35 to 39 Minutes | 0 (0.0%) | 4 (3.8%) |
| 40 to 44 Minutes | 0 (0.0%) | 0 (0.0%) |
| 45 to 59 Minutes | 6 (4.4%) | 8 (7.5%) |
| 60 to 89 Minutes | 11 (8.2%) | 1 (0.9%) |
| 90 or more Minutes | 27 (20.0%) | 0 (0.0%) |
Time of Departure to Work by Sex in Francisco
The most frequent times of departure to work in Francisco are 6:30 AM to 6:59 AM (35, 25.9%) for males and 5:30 AM to 5:59 AM (30, 28.3%) for females.
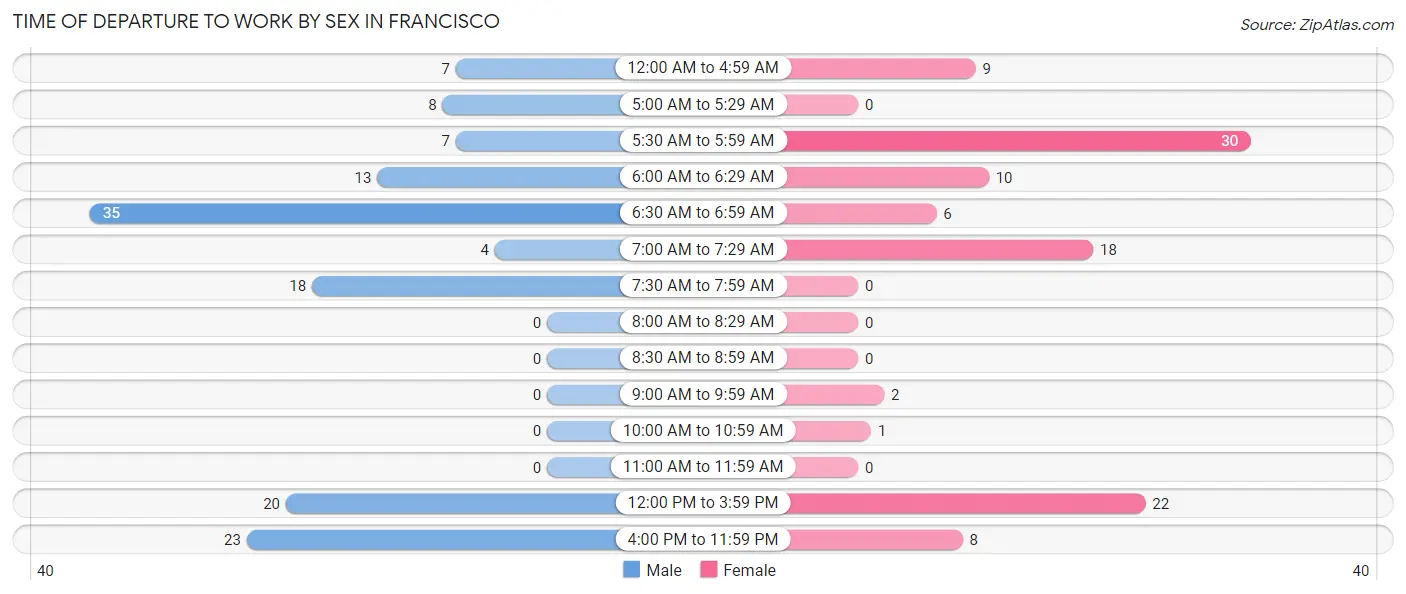
| Time of Departure | Male | Female |
| 12:00 AM to 4:59 AM | 7 (5.2%) | 9 (8.5%) |
| 5:00 AM to 5:29 AM | 8 (5.9%) | 0 (0.0%) |
| 5:30 AM to 5:59 AM | 7 (5.2%) | 30 (28.3%) |
| 6:00 AM to 6:29 AM | 13 (9.6%) | 10 (9.4%) |
| 6:30 AM to 6:59 AM | 35 (25.9%) | 6 (5.7%) |
| 7:00 AM to 7:29 AM | 4 (3.0%) | 18 (17.0%) |
| 7:30 AM to 7:59 AM | 18 (13.3%) | 0 (0.0%) |
| 8:00 AM to 8:29 AM | 0 (0.0%) | 0 (0.0%) |
| 8:30 AM to 8:59 AM | 0 (0.0%) | 0 (0.0%) |
| 9:00 AM to 9:59 AM | 0 (0.0%) | 2 (1.9%) |
| 10:00 AM to 10:59 AM | 0 (0.0%) | 1 (0.9%) |
| 11:00 AM to 11:59 AM | 0 (0.0%) | 0 (0.0%) |
| 12:00 PM to 3:59 PM | 20 (14.8%) | 22 (20.7%) |
| 4:00 PM to 11:59 PM | 23 (17.0%) | 8 (7.5%) |
| Total | 135 (100.0%) | 106 (100.0%) |
Housing Occupancy in Francisco
Occupancy by Ownership in Francisco
Of the total 247 dwellings in Francisco, owner-occupied units account for 203 (82.2%), while renter-occupied units make up 44 (17.8%).
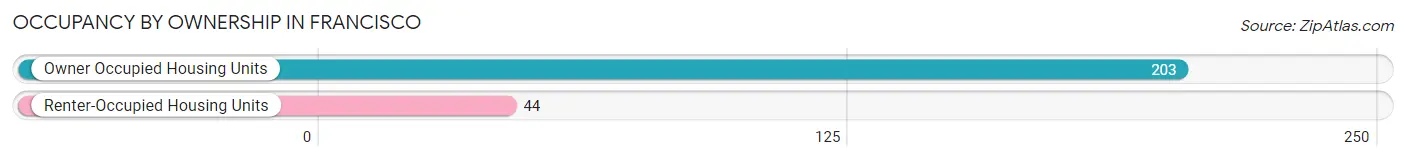
| Occupancy | # Housing Units | % Housing Units |
| Owner Occupied Housing Units | 203 | 82.2% |
| Renter-Occupied Housing Units | 44 | 17.8% |
| Total Occupied Housing Units | 247 | 100.0% |
Occupancy by Household Size in Francisco
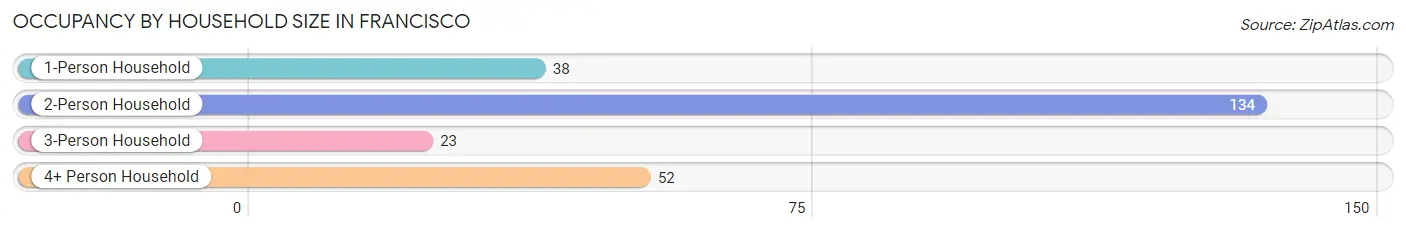
| Household Size | # Housing Units | % Housing Units |
| 1-Person Household | 38 | 15.4% |
| 2-Person Household | 134 | 54.2% |
| 3-Person Household | 23 | 9.3% |
| 4+ Person Household | 52 | 21.0% |
| Total Housing Units | 247 | 100.0% |
Occupancy by Ownership by Household Size in Francisco
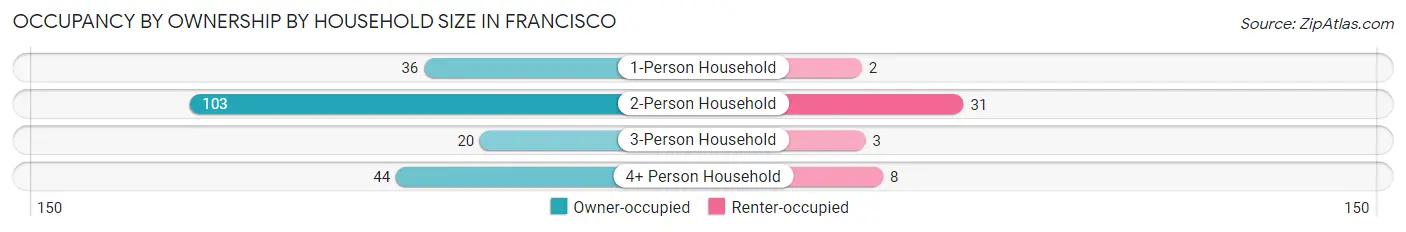
| Household Size | Owner-occupied | Renter-occupied |
| 1-Person Household | 36 (94.7%) | 2 (5.3%) |
| 2-Person Household | 103 (76.9%) | 31 (23.1%) |
| 3-Person Household | 20 (87.0%) | 3 (13.0%) |
| 4+ Person Household | 44 (84.6%) | 8 (15.4%) |
| Total Housing Units | 203 (82.2%) | 44 (17.8%) |
Occupancy by Educational Attainment in Francisco
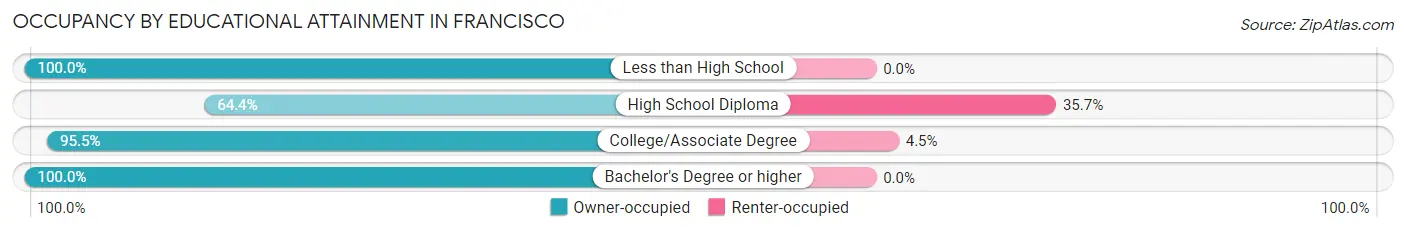
| Household Size | Owner-occupied | Renter-occupied |
| Less than High School | 31 (100.0%) | 0 (0.0%) |
| High School Diploma | 74 (64.3%) | 41 (35.6%) |
| College/Associate Degree | 64 (95.5%) | 3 (4.5%) |
| Bachelor's Degree or higher | 34 (100.0%) | 0 (0.0%) |
Occupancy by Age of Householder in Francisco
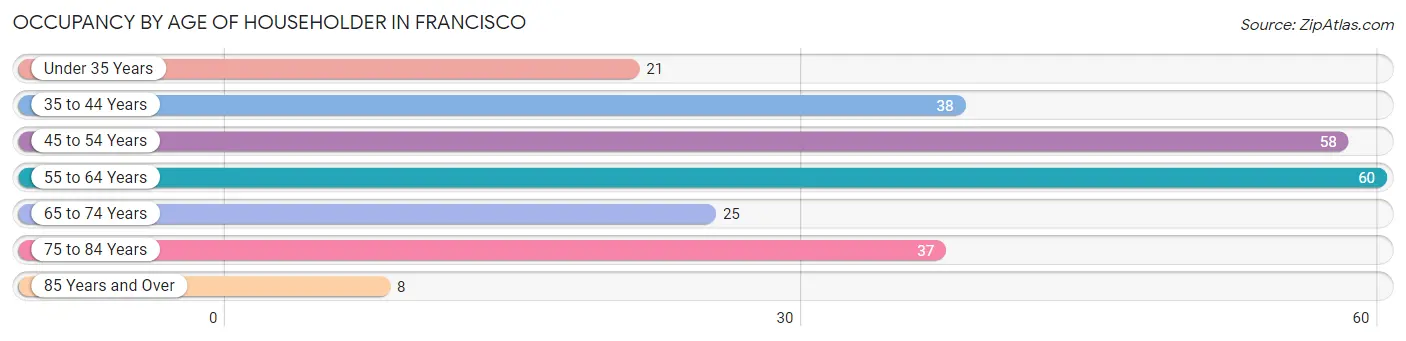
| Age Bracket | # Households | % Households |
| Under 35 Years | 21 | 8.5% |
| 35 to 44 Years | 38 | 15.4% |
| 45 to 54 Years | 58 | 23.5% |
| 55 to 64 Years | 60 | 24.3% |
| 65 to 74 Years | 25 | 10.1% |
| 75 to 84 Years | 37 | 15.0% |
| 85 Years and Over | 8 | 3.2% |
| Total | 247 | 100.0% |
Housing Finances in Francisco
Median Income by Occupancy in Francisco
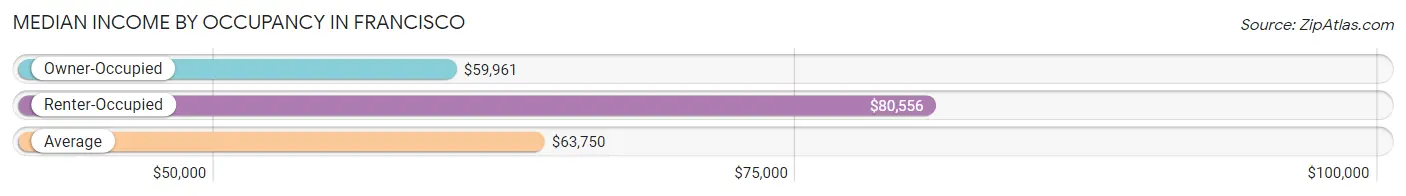
| Occupancy Type | # Households | Median Income |
| Owner-Occupied | 203 (82.2%) | $59,961 |
| Renter-Occupied | 44 (17.8%) | $80,556 |
| Average | 247 (100.0%) | $63,750 |
Occupancy by Householder Income Bracket in Francisco
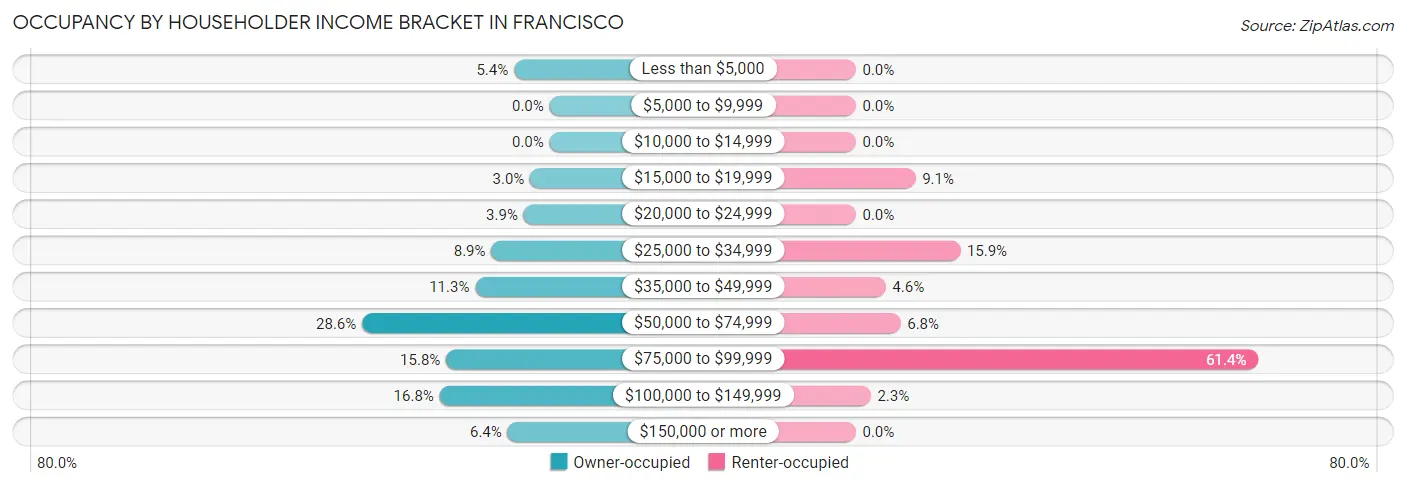
| Income Bracket | Owner-occupied | Renter-occupied |
| Less than $5,000 | 11 (5.4%) | 0 (0.0%) |
| $5,000 to $9,999 | 0 (0.0%) | 0 (0.0%) |
| $10,000 to $14,999 | 0 (0.0%) | 0 (0.0%) |
| $15,000 to $19,999 | 6 (3.0%) | 4 (9.1%) |
| $20,000 to $24,999 | 8 (3.9%) | 0 (0.0%) |
| $25,000 to $34,999 | 18 (8.9%) | 7 (15.9%) |
| $35,000 to $49,999 | 23 (11.3%) | 2 (4.5%) |
| $50,000 to $74,999 | 58 (28.6%) | 3 (6.8%) |
| $75,000 to $99,999 | 32 (15.8%) | 27 (61.4%) |
| $100,000 to $149,999 | 34 (16.8%) | 1 (2.3%) |
| $150,000 or more | 13 (6.4%) | 0 (0.0%) |
| Total | 203 (100.0%) | 44 (100.0%) |
Monthly Housing Cost Tiers in Francisco
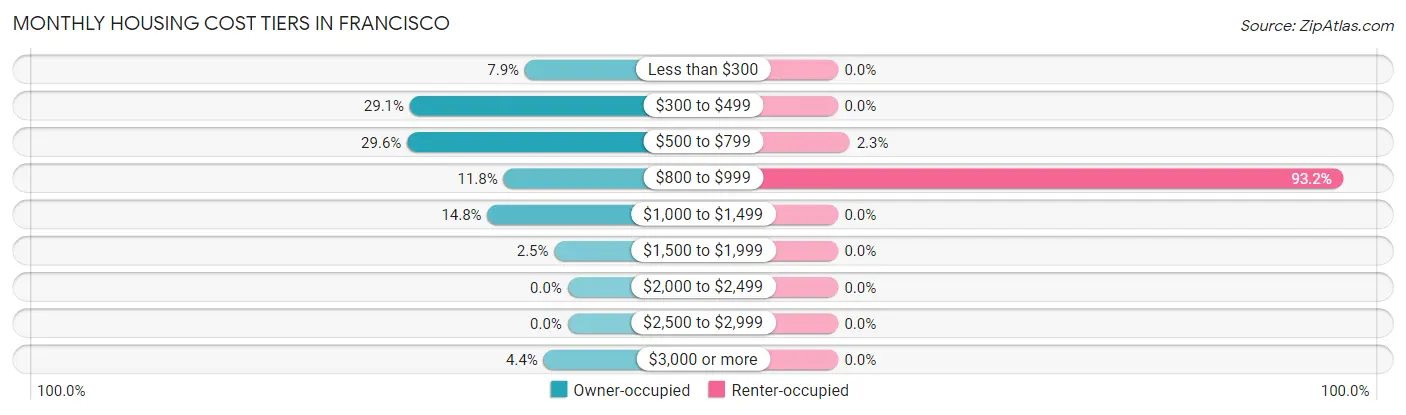
| Monthly Cost | Owner-occupied | Renter-occupied |
| Less than $300 | 16 (7.9%) | 0 (0.0%) |
| $300 to $499 | 59 (29.1%) | 0 (0.0%) |
| $500 to $799 | 60 (29.6%) | 1 (2.3%) |
| $800 to $999 | 24 (11.8%) | 41 (93.2%) |
| $1,000 to $1,499 | 30 (14.8%) | 0 (0.0%) |
| $1,500 to $1,999 | 5 (2.5%) | 0 (0.0%) |
| $2,000 to $2,499 | 0 (0.0%) | 0 (0.0%) |
| $2,500 to $2,999 | 0 (0.0%) | 0 (0.0%) |
| $3,000 or more | 9 (4.4%) | 0 (0.0%) |
| Total | 203 (100.0%) | 44 (100.0%) |
Physical Housing Characteristics in Francisco
Housing Structures in Francisco
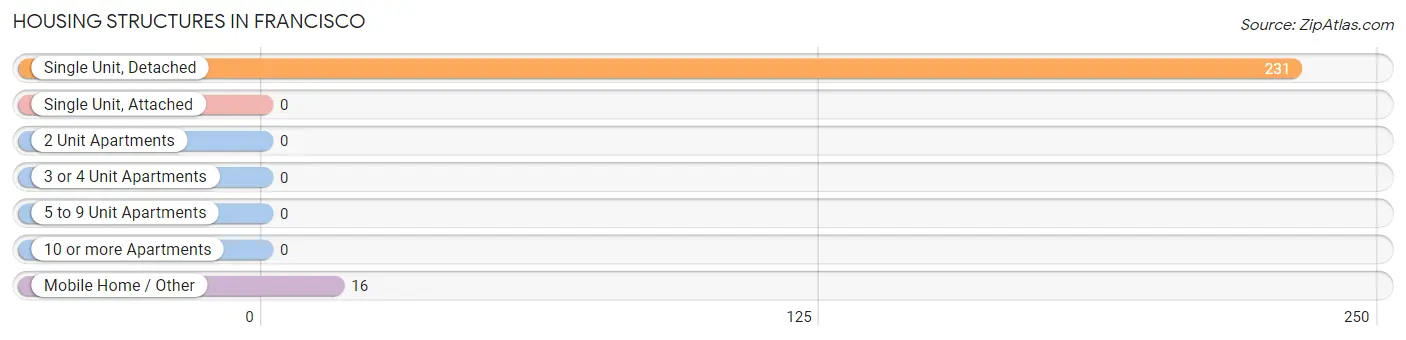
| Structure Type | # Housing Units | % Housing Units |
| Single Unit, Detached | 231 | 93.5% |
| Single Unit, Attached | 0 | 0.0% |
| 2 Unit Apartments | 0 | 0.0% |
| 3 or 4 Unit Apartments | 0 | 0.0% |
| 5 to 9 Unit Apartments | 0 | 0.0% |
| 10 or more Apartments | 0 | 0.0% |
| Mobile Home / Other | 16 | 6.5% |
| Total | 247 | 100.0% |
Housing Structures by Occupancy in Francisco
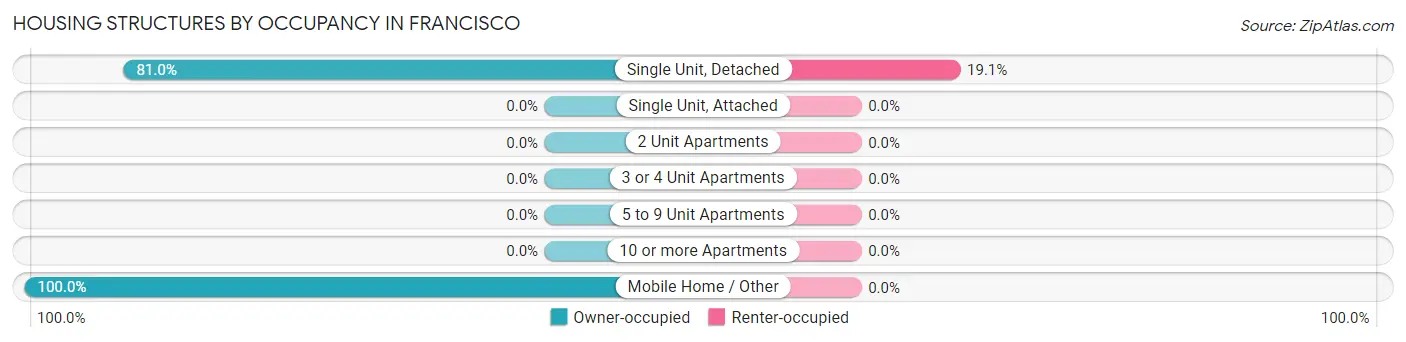
| Structure Type | Owner-occupied | Renter-occupied |
| Single Unit, Detached | 187 (80.9%) | 44 (19.1%) |
| Single Unit, Attached | 0 (0.0%) | 0 (0.0%) |
| 2 Unit Apartments | 0 (0.0%) | 0 (0.0%) |
| 3 or 4 Unit Apartments | 0 (0.0%) | 0 (0.0%) |
| 5 to 9 Unit Apartments | 0 (0.0%) | 0 (0.0%) |
| 10 or more Apartments | 0 (0.0%) | 0 (0.0%) |
| Mobile Home / Other | 16 (100.0%) | 0 (0.0%) |
| Total | 203 (82.2%) | 44 (17.8%) |
Housing Structures by Number of Rooms in Francisco
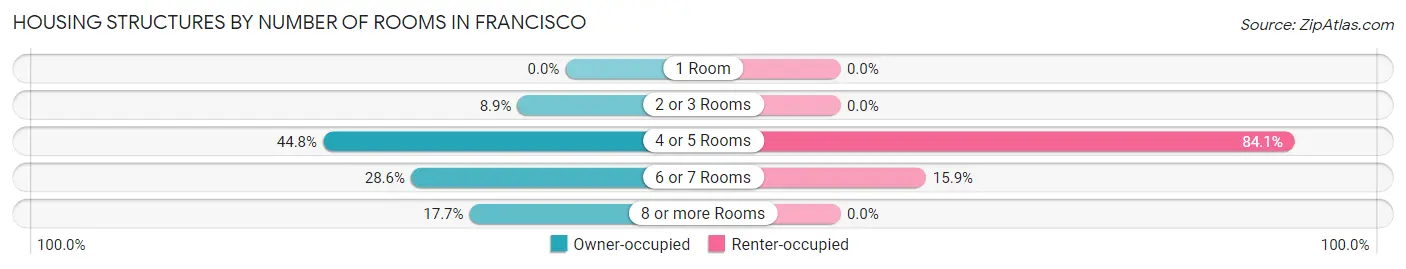
| Number of Rooms | Owner-occupied | Renter-occupied |
| 1 Room | 0 (0.0%) | 0 (0.0%) |
| 2 or 3 Rooms | 18 (8.9%) | 0 (0.0%) |
| 4 or 5 Rooms | 91 (44.8%) | 37 (84.1%) |
| 6 or 7 Rooms | 58 (28.6%) | 7 (15.9%) |
| 8 or more Rooms | 36 (17.7%) | 0 (0.0%) |
| Total | 203 (100.0%) | 44 (100.0%) |
Housing Structure by Heating Type in Francisco
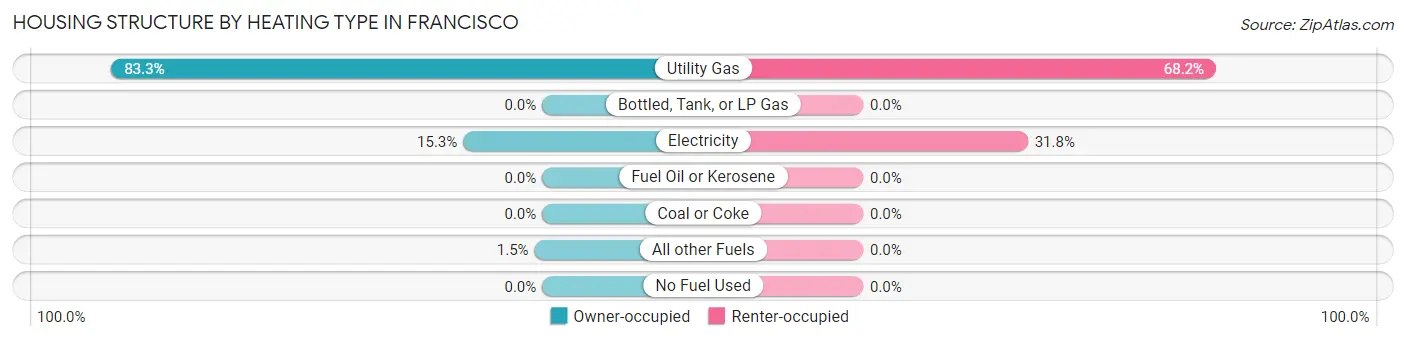
| Heating Type | Owner-occupied | Renter-occupied |
| Utility Gas | 169 (83.3%) | 30 (68.2%) |
| Bottled, Tank, or LP Gas | 0 (0.0%) | 0 (0.0%) |
| Electricity | 31 (15.3%) | 14 (31.8%) |
| Fuel Oil or Kerosene | 0 (0.0%) | 0 (0.0%) |
| Coal or Coke | 0 (0.0%) | 0 (0.0%) |
| All other Fuels | 3 (1.5%) | 0 (0.0%) |
| No Fuel Used | 0 (0.0%) | 0 (0.0%) |
| Total | 203 (100.0%) | 44 (100.0%) |
Household Vehicle Usage in Francisco
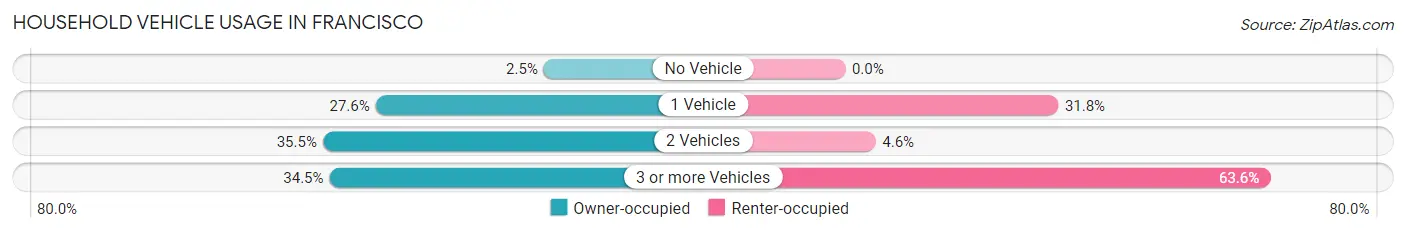
| Vehicles per Household | Owner-occupied | Renter-occupied |
| No Vehicle | 5 (2.5%) | 0 (0.0%) |
| 1 Vehicle | 56 (27.6%) | 14 (31.8%) |
| 2 Vehicles | 72 (35.5%) | 2 (4.5%) |
| 3 or more Vehicles | 70 (34.5%) | 28 (63.6%) |
| Total | 203 (100.0%) | 44 (100.0%) |
Real Estate & Mortgages in Francisco
Real Estate and Mortgage Overview in Francisco
| Characteristic | Without Mortgage | With Mortgage |
| Housing Units | 109 | 94 |
| Median Property Value | $76,600 | $125,000 |
| Median Household Income | $58,164 | $13 |
| Monthly Housing Costs | $443 | $9 |
| Real Estate Taxes | $550 | $0 |
Property Value by Mortgage Status in Francisco
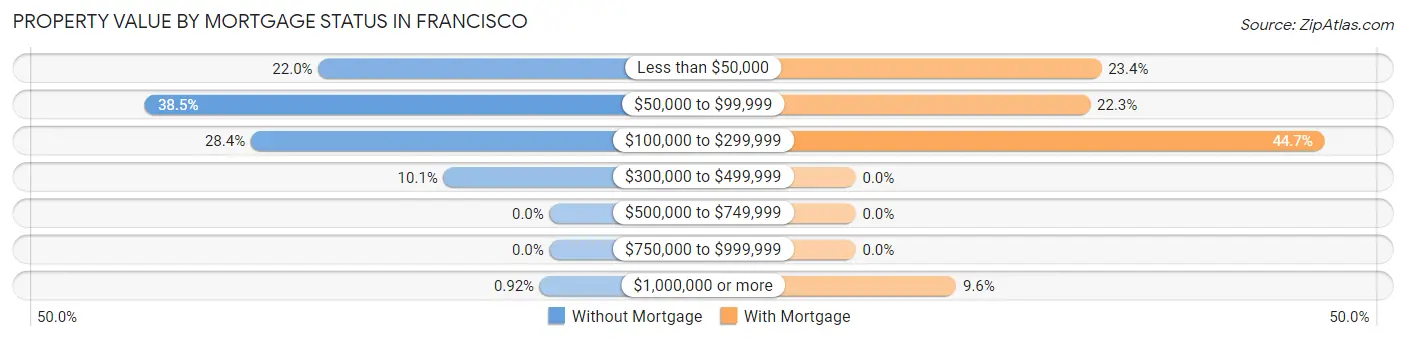
| Property Value | Without Mortgage | With Mortgage |
| Less than $50,000 | 24 (22.0%) | 22 (23.4%) |
| $50,000 to $99,999 | 42 (38.5%) | 21 (22.3%) |
| $100,000 to $299,999 | 31 (28.4%) | 42 (44.7%) |
| $300,000 to $499,999 | 11 (10.1%) | 0 (0.0%) |
| $500,000 to $749,999 | 0 (0.0%) | 0 (0.0%) |
| $750,000 to $999,999 | 0 (0.0%) | 0 (0.0%) |
| $1,000,000 or more | 1 (0.9%) | 9 (9.6%) |
| Total | 109 (100.0%) | 94 (100.0%) |
Household Income by Mortgage Status in Francisco
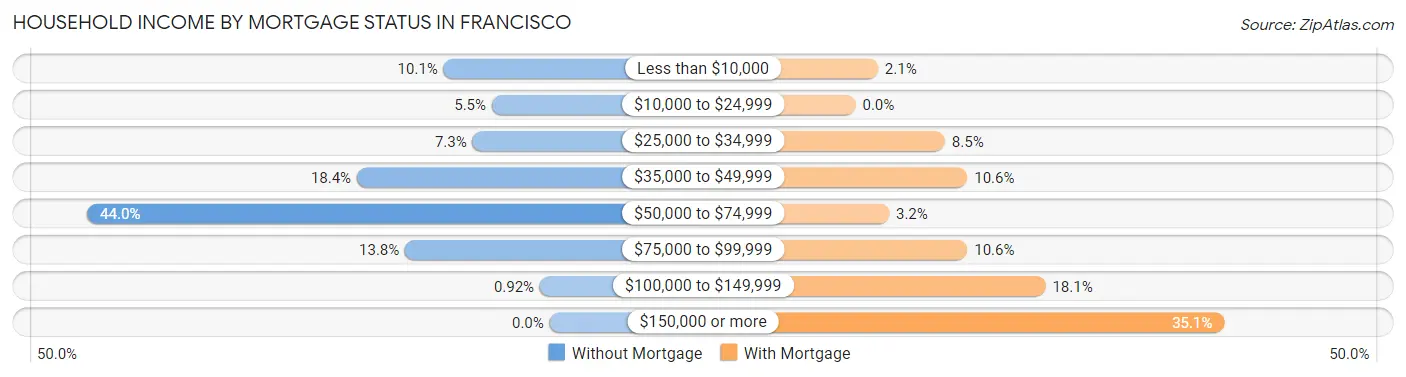
| Household Income | Without Mortgage | With Mortgage |
| Less than $10,000 | 11 (10.1%) | 2 (2.1%) |
| $10,000 to $24,999 | 6 (5.5%) | 0 (0.0%) |
| $25,000 to $34,999 | 8 (7.3%) | 8 (8.5%) |
| $35,000 to $49,999 | 20 (18.3%) | 10 (10.6%) |
| $50,000 to $74,999 | 48 (44.0%) | 3 (3.2%) |
| $75,000 to $99,999 | 15 (13.8%) | 10 (10.6%) |
| $100,000 to $149,999 | 1 (0.9%) | 17 (18.1%) |
| $150,000 or more | 0 (0.0%) | 33 (35.1%) |
| Total | 109 (100.0%) | 94 (100.0%) |
Property Value to Household Income Ratio in Francisco
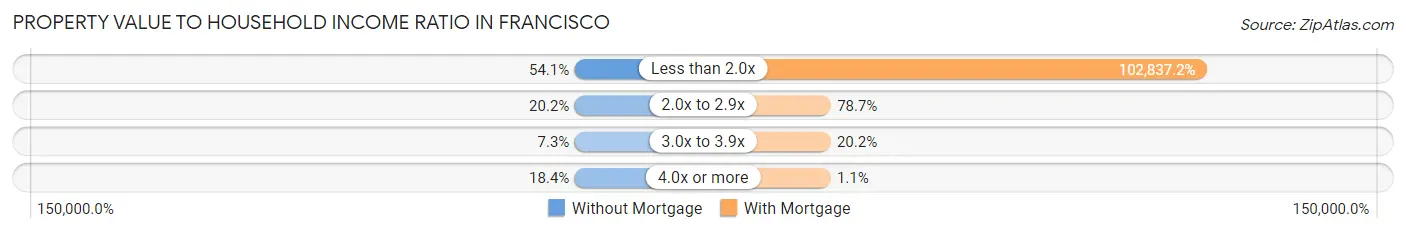
| Value-to-Income Ratio | Without Mortgage | With Mortgage |
| Less than 2.0x | 59 (54.1%) | 96,667 (102,837.2%) |
| 2.0x to 2.9x | 22 (20.2%) | 74 (78.7%) |
| 3.0x to 3.9x | 8 (7.3%) | 19 (20.2%) |
| 4.0x or more | 20 (18.3%) | 1 (1.1%) |
| Total | 109 (100.0%) | 94 (100.0%) |
Real Estate Taxes by Mortgage Status in Francisco
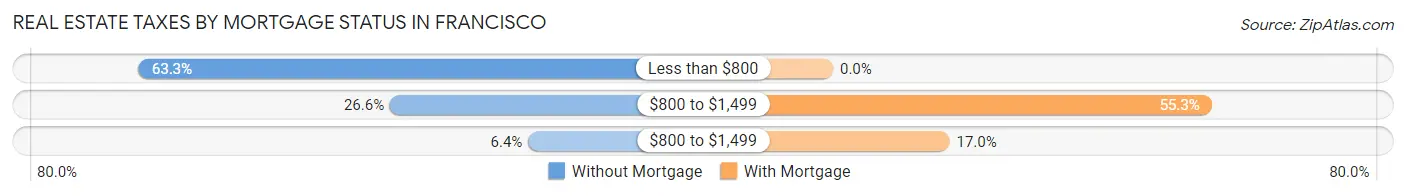
| Property Taxes | Without Mortgage | With Mortgage |
| Less than $800 | 69 (63.3%) | 0 (0.0%) |
| $800 to $1,499 | 29 (26.6%) | 52 (55.3%) |
| $800 to $1,499 | 7 (6.4%) | 16 (17.0%) |
| Total | 109 (100.0%) | 94 (100.0%) |
Health & Disability in Francisco
Health Insurance Coverage by Age in Francisco
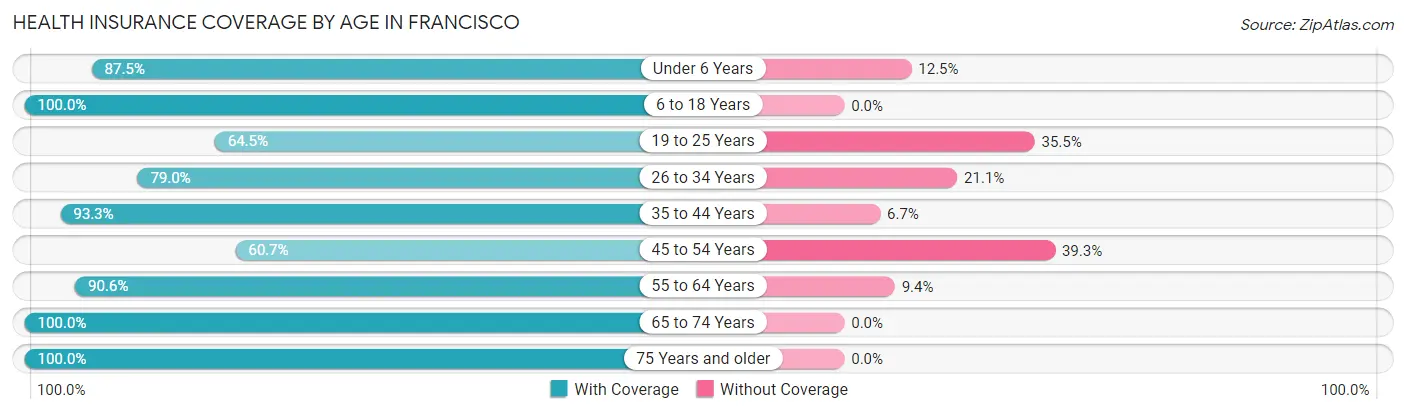
| Age Bracket | With Coverage | Without Coverage |
| Under 6 Years | 35 (87.5%) | 5 (12.5%) |
| 6 to 18 Years | 112 (100.0%) | 0 (0.0%) |
| 19 to 25 Years | 20 (64.5%) | 11 (35.5%) |
| 26 to 34 Years | 30 (78.9%) | 8 (21.0%) |
| 35 to 44 Years | 84 (93.3%) | 6 (6.7%) |
| 45 to 54 Years | 51 (60.7%) | 33 (39.3%) |
| 55 to 64 Years | 77 (90.6%) | 8 (9.4%) |
| 65 to 74 Years | 66 (100.0%) | 0 (0.0%) |
| 75 Years and older | 54 (100.0%) | 0 (0.0%) |
| Total | 529 (88.2%) | 71 (11.8%) |
Health Insurance Coverage by Citizenship Status in Francisco
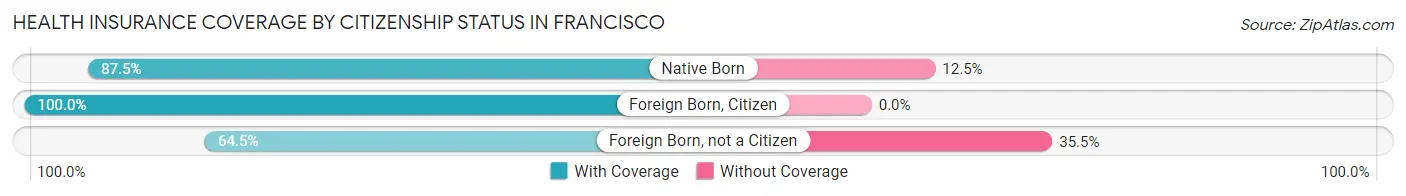
| Citizenship Status | With Coverage | Without Coverage |
| Native Born | 35 (87.5%) | 5 (12.5%) |
| Foreign Born, Citizen | 112 (100.0%) | 0 (0.0%) |
| Foreign Born, not a Citizen | 20 (64.5%) | 11 (35.5%) |
Health Insurance Coverage by Household Income in Francisco
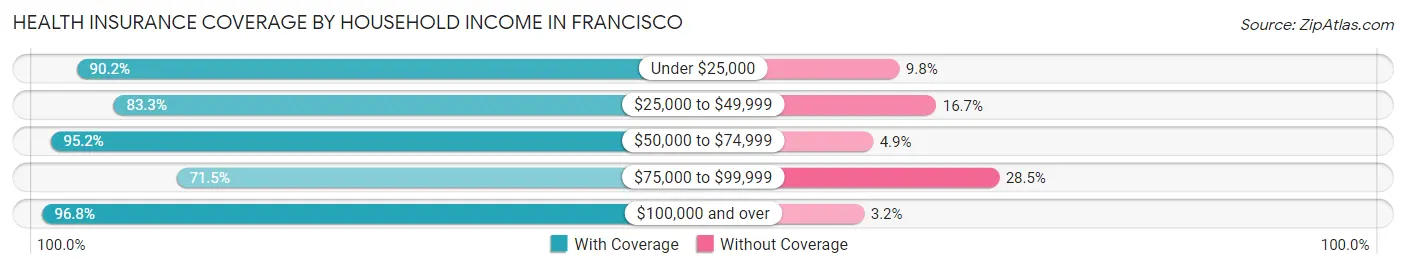
| Household Income | With Coverage | Without Coverage |
| Under $25,000 | 37 (90.2%) | 4 (9.8%) |
| $25,000 to $49,999 | 95 (83.3%) | 19 (16.7%) |
| $50,000 to $74,999 | 157 (95.2%) | 8 (4.9%) |
| $75,000 to $99,999 | 88 (71.5%) | 35 (28.5%) |
| $100,000 and over | 152 (96.8%) | 5 (3.2%) |
Public vs Private Health Insurance Coverage by Age in Francisco
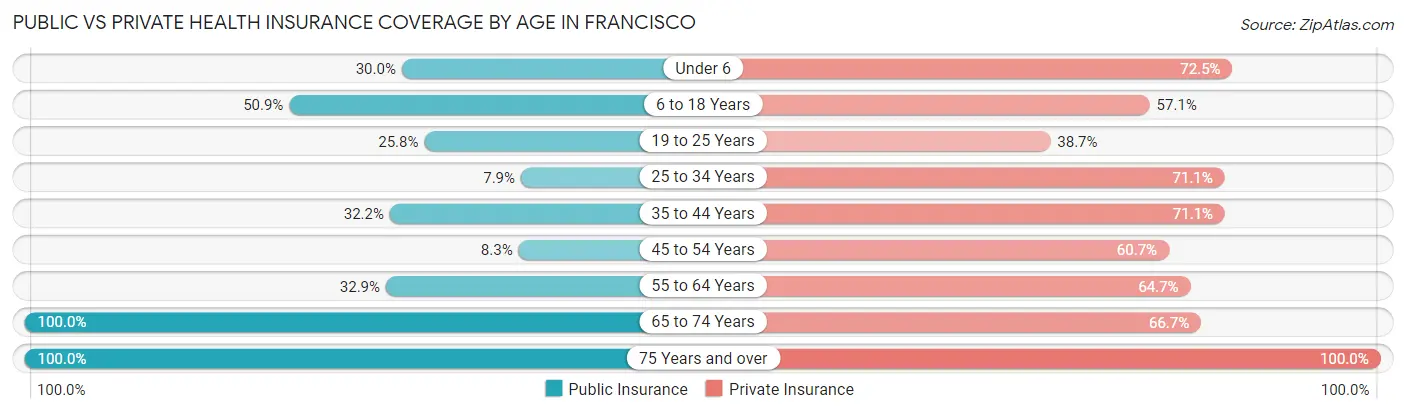
| Age Bracket | Public Insurance | Private Insurance |
| Under 6 | 12 (30.0%) | 29 (72.5%) |
| 6 to 18 Years | 57 (50.9%) | 64 (57.1%) |
| 19 to 25 Years | 8 (25.8%) | 12 (38.7%) |
| 25 to 34 Years | 3 (7.9%) | 27 (71.1%) |
| 35 to 44 Years | 29 (32.2%) | 64 (71.1%) |
| 45 to 54 Years | 7 (8.3%) | 51 (60.7%) |
| 55 to 64 Years | 28 (32.9%) | 55 (64.7%) |
| 65 to 74 Years | 66 (100.0%) | 44 (66.7%) |
| 75 Years and over | 54 (100.0%) | 54 (100.0%) |
| Total | 264 (44.0%) | 400 (66.7%) |
Disability Status by Sex by Age in Francisco
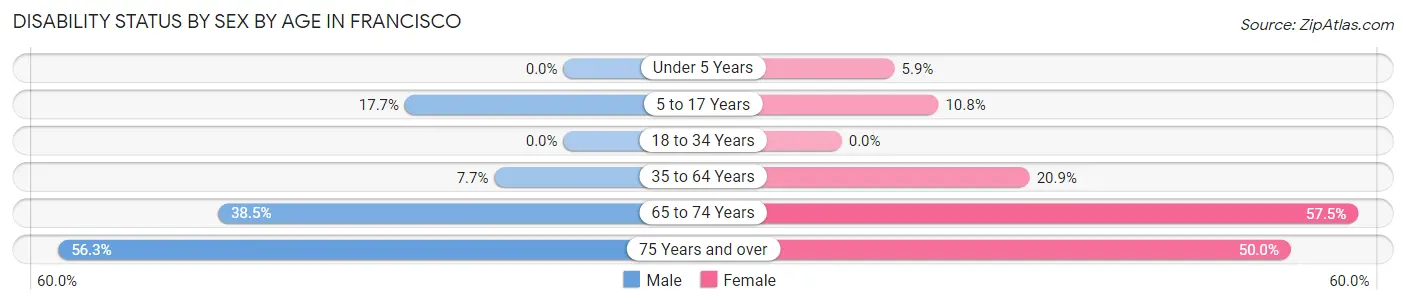
| Age Bracket | Male | Female |
| Under 5 Years | 0 (0.0%) | 1 (5.9%) |
| 5 to 17 Years | 9 (17.6%) | 7 (10.8%) |
| 18 to 34 Years | 0 (0.0%) | 0 (0.0%) |
| 35 to 64 Years | 10 (7.7%) | 27 (20.9%) |
| 65 to 74 Years | 10 (38.5%) | 23 (57.5%) |
| 75 Years and over | 9 (56.2%) | 19 (50.0%) |
Disability Class by Sex by Age in Francisco
Disability Class: Hearing Difficulty
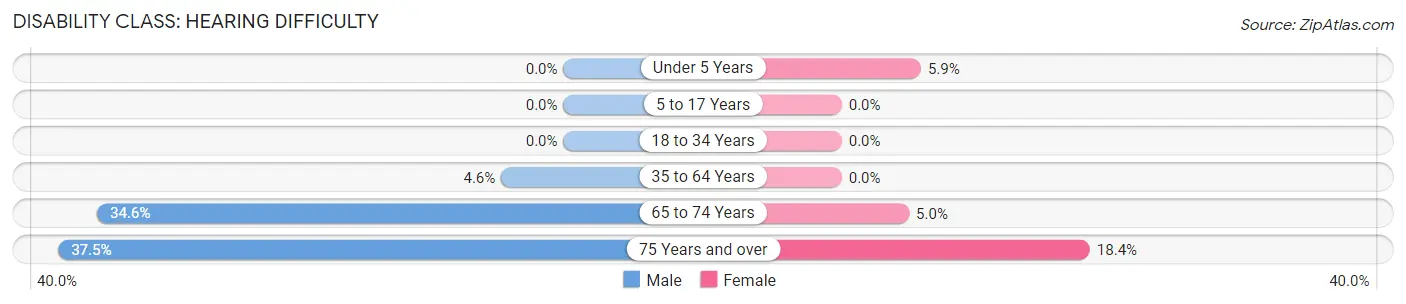
| Age Bracket | Male | Female |
| Under 5 Years | 0 (0.0%) | 1 (5.9%) |
| 5 to 17 Years | 0 (0.0%) | 0 (0.0%) |
| 18 to 34 Years | 0 (0.0%) | 0 (0.0%) |
| 35 to 64 Years | 6 (4.6%) | 0 (0.0%) |
| 65 to 74 Years | 9 (34.6%) | 2 (5.0%) |
| 75 Years and over | 6 (37.5%) | 7 (18.4%) |
Disability Class: Vision Difficulty
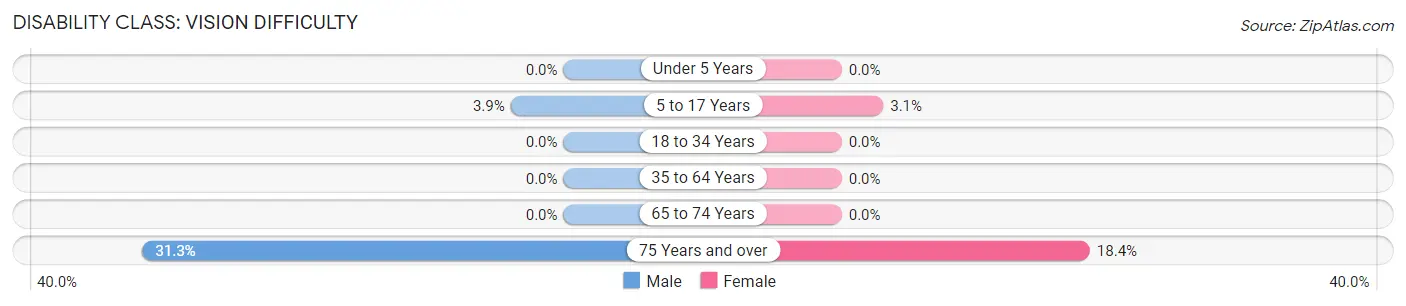
| Age Bracket | Male | Female |
| Under 5 Years | 0 (0.0%) | 0 (0.0%) |
| 5 to 17 Years | 2 (3.9%) | 2 (3.1%) |
| 18 to 34 Years | 0 (0.0%) | 0 (0.0%) |
| 35 to 64 Years | 0 (0.0%) | 0 (0.0%) |
| 65 to 74 Years | 0 (0.0%) | 0 (0.0%) |
| 75 Years and over | 5 (31.2%) | 7 (18.4%) |
Disability Class: Cognitive Difficulty
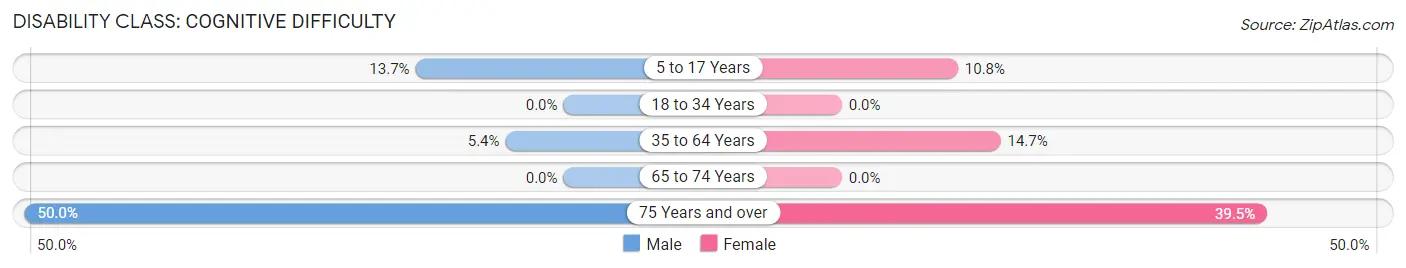
| Age Bracket | Male | Female |
| 5 to 17 Years | 7 (13.7%) | 7 (10.8%) |
| 18 to 34 Years | 0 (0.0%) | 0 (0.0%) |
| 35 to 64 Years | 7 (5.4%) | 19 (14.7%) |
| 65 to 74 Years | 0 (0.0%) | 0 (0.0%) |
| 75 Years and over | 8 (50.0%) | 15 (39.5%) |
Disability Class: Ambulatory Difficulty
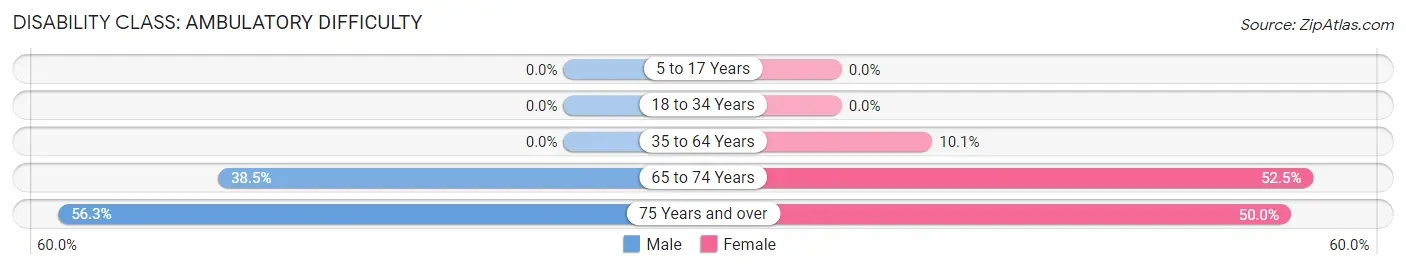
| Age Bracket | Male | Female |
| 5 to 17 Years | 0 (0.0%) | 0 (0.0%) |
| 18 to 34 Years | 0 (0.0%) | 0 (0.0%) |
| 35 to 64 Years | 0 (0.0%) | 13 (10.1%) |
| 65 to 74 Years | 10 (38.5%) | 21 (52.5%) |
| 75 Years and over | 9 (56.2%) | 19 (50.0%) |
Disability Class: Self-Care Difficulty
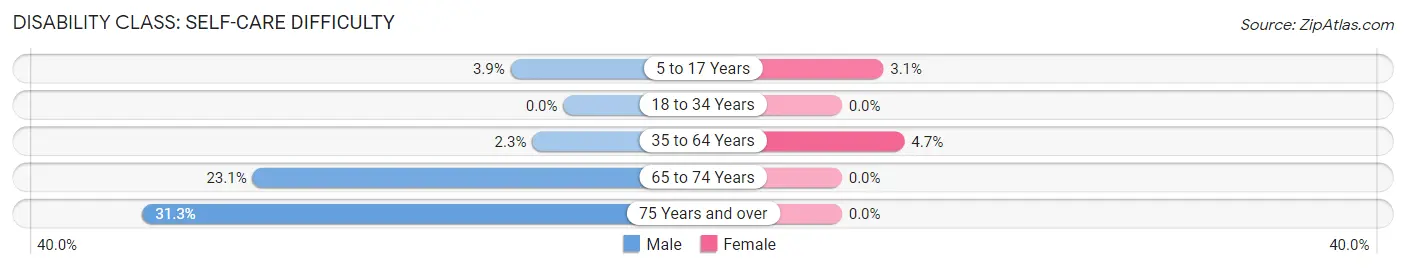
| Age Bracket | Male | Female |
| 5 to 17 Years | 2 (3.9%) | 2 (3.1%) |
| 18 to 34 Years | 0 (0.0%) | 0 (0.0%) |
| 35 to 64 Years | 3 (2.3%) | 6 (4.6%) |
| 65 to 74 Years | 6 (23.1%) | 0 (0.0%) |
| 75 Years and over | 5 (31.2%) | 0 (0.0%) |
Technology Access in Francisco
Computing Device Access in Francisco
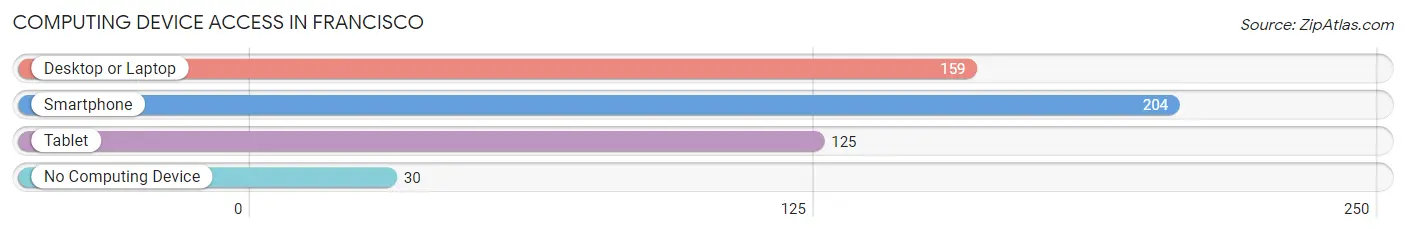
| Device Type | # Households | % Households |
| Desktop or Laptop | 159 | 64.4% |
| Smartphone | 204 | 82.6% |
| Tablet | 125 | 50.6% |
| No Computing Device | 30 | 12.1% |
| Total | 247 | 100.0% |
Internet Access in Francisco
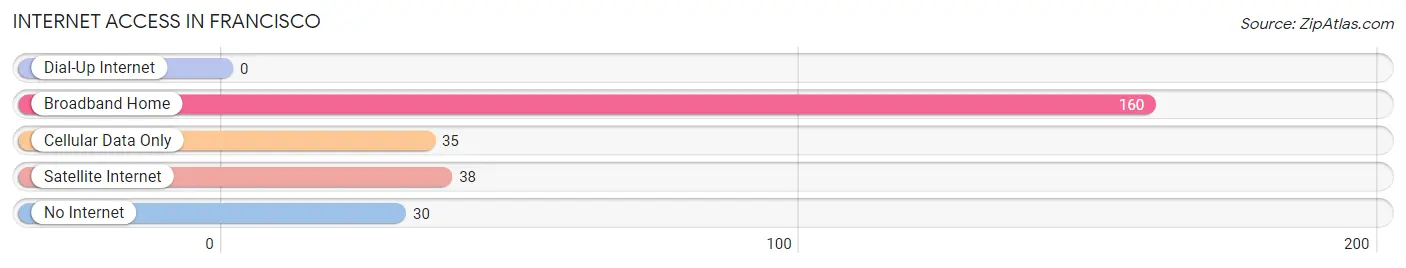
| Internet Type | # Households | % Households |
| Dial-Up Internet | 0 | 0.0% |
| Broadband Home | 160 | 64.8% |
| Cellular Data Only | 35 | 14.2% |
| Satellite Internet | 38 | 15.4% |
| No Internet | 30 | 12.1% |
| Total | 247 | 100.0% |
Francisco Summary
San Francisco is a city located in the state of California in the United States of America. It is the fourth most populous city in the state and the 13th most populous city in the country. San Francisco is located on the northern end of the San Francisco Peninsula, which is bordered by the Pacific Ocean to the west and the San Francisco Bay to the east. The city is home to a diverse population of over 870,000 people, making it one of the most densely populated cities in the United States.
Geography
San Francisco is located on the northern end of the San Francisco Peninsula, which is bordered by the Pacific Ocean to the west and the San Francisco Bay to the east. The city is situated on a hilly terrain, with the highest point being Twin Peaks at 922 feet (281 meters). The city is surrounded by several bodies of water, including the San Francisco Bay, the Golden Gate Strait, and the Pacific Ocean. The city is also home to several islands, including Alcatraz Island, Treasure Island, and Yerba Buena Island.
Climate
San Francisco has a mild climate, with temperatures rarely reaching extreme highs or lows. The average temperature in the city is around 60°F (15°C). The city experiences a dry summer season, with temperatures ranging from the mid-50s to the mid-70s (13-24°C). The winter season is mild, with temperatures ranging from the mid-40s to the mid-60s (7-18°C). The city receives an average of 23 inches (58 cm) of rain per year.
Economy
San Francisco is a major economic center in the United States. The city is home to several Fortune 500 companies, including Salesforce, Wells Fargo, and McKesson. The city is also a major center for the technology industry, with companies such as Google, Apple, and Twitter having their headquarters in the city. The city is also a major financial center, with the headquarters of the Federal Reserve Bank of San Francisco located in the city. Tourism is also a major industry in the city, with over 25 million visitors each year.
Demographics
San Francisco is home to a diverse population of over 870,000 people. The city has a large Asian population, with over 30% of the population identifying as Asian. The city also has a large Hispanic population, with over 15% of the population identifying as Hispanic. The city also has a large African American population, with over 6% of the population identifying as African American. The city also has a large LGBT population, with over 15% of the population identifying as LGBT.
Conclusion
San Francisco is a vibrant and diverse city located in the state of California in the United States. The city is home to a diverse population of over 870,000 people, making it one of the most densely populated cities in the United States. The city is a major economic center, with several Fortune 500 companies and a large technology industry. The city also has a mild climate and is a major tourist destination, with over 25 million visitors each year. San Francisco is a unique and vibrant city that has something to offer everyone.
Common Questions
What is Per Capita Income in Francisco?
Per Capita income in Francisco is $36,910.
What is the Median Family Income in Francisco?
Median Family Income in Francisco is $76,000.
What is the Median Household income in Francisco?
Median Household Income in Francisco is $63,750.
What is Income or Wage Gap in Francisco?
Income or Wage Gap in Francisco is 49.5%.
Women in Francisco earn 50.5 cents for every dollar earned by a man.
What is Inequality or Gini Index in Francisco?
Inequality or Gini Index in Francisco is 0.45.
What is the Total Population of Francisco?
Total Population of Francisco is 600.
What is the Total Male Population of Francisco?
Total Male Population of Francisco is 273.
What is the Total Female Population of Francisco?
Total Female Population of Francisco is 327.
What is the Ratio of Males per 100 Females in Francisco?
There are 83.49 Males per 100 Females in Francisco.
What is the Ratio of Females per 100 Males in Francisco?
There are 119.78 Females per 100 Males in Francisco.
What is the Median Population Age in Francisco?
Median Population Age in Francisco is 43.3 Years.
What is the Average Family Size in Francisco
Average Family Size in Francisco is 2.6 People.
What is the Average Household Size in Francisco
Average Household Size in Francisco is 2.4 People.
How Large is the Labor Force in Francisco?
There are 255 People in the Labor Forcein in Francisco.
What is the Percentage of People in the Labor Force in Francisco?
54.8% of People are in the Labor Force in Francisco.
What is the Unemployment Rate in Francisco?
Unemployment Rate in Francisco is 1.6%.