Fortville, IN Map & Demographics
Fortville Map
Fortville Overview
$34,236
PER CAPITA INCOME
$80,000
AVG FAMILY INCOME
$79,806
AVG HOUSEHOLD INCOME
38.8%
WAGE / INCOME GAP [ % ]
61.2¢/ $1
WAGE / INCOME GAP [ $ ]
0.31
INEQUALITY / GINI INDEX
5,206
TOTAL POPULATION
2,383
MALE POPULATION
2,823
FEMALE POPULATION
84.41
MALES / 100 FEMALES
118.46
FEMALES / 100 MALES
32.8
MEDIAN AGE
3.1
AVG FAMILY SIZE
2.8
AVG HOUSEHOLD SIZE
2,942
LABOR FORCE [ PEOPLE ]
71.5%
PERCENT IN LABOR FORCE
5.2%
UNEMPLOYMENT RATE
Fortville Zip Codes
Fortville Area Codes
Income in Fortville
Income Overview in Fortville
Per Capita Income in Fortville is $34,236, while median incomes of families and households are $80,000 and $79,806 respectively.
| Characteristic | Number | Measure |
| Per Capita Income | 5,206 | $34,236 |
| Median Family Income | 1,286 | $80,000 |
| Mean Family Income | 1,286 | $94,559 |
| Median Household Income | 1,871 | $79,806 |
| Mean Household Income | 1,871 | $85,771 |
| Income Deficit | 1,286 | $0 |
| Wage / Income Gap (%) | 5,206 | 38.77% |
| Wage / Income Gap ($) | 5,206 | 61.23¢ per $1 |
| Gini / Inequality Index | 5,206 | 0.31 |
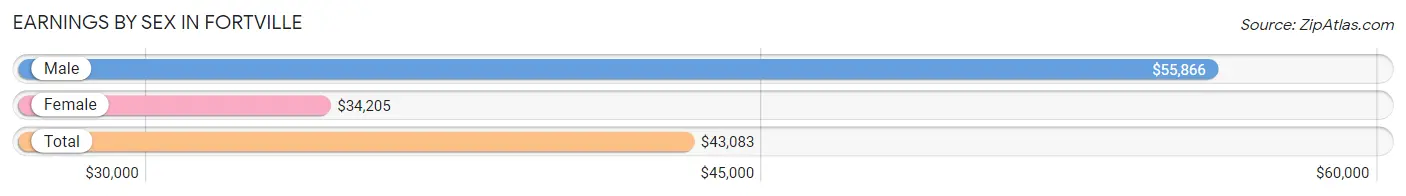
Earnings by Sex in Fortville
Average Earnings in Fortville are $43,083, $55,866 for men and $34,205 for women, a difference of 38.8%.
| Sex | Number | Average Earnings |
| Male | 1,519 (49.3%) | $55,866 |
| Female | 1,562 (50.7%) | $34,205 |
| Total | 3,081 (100.0%) | $43,083 |
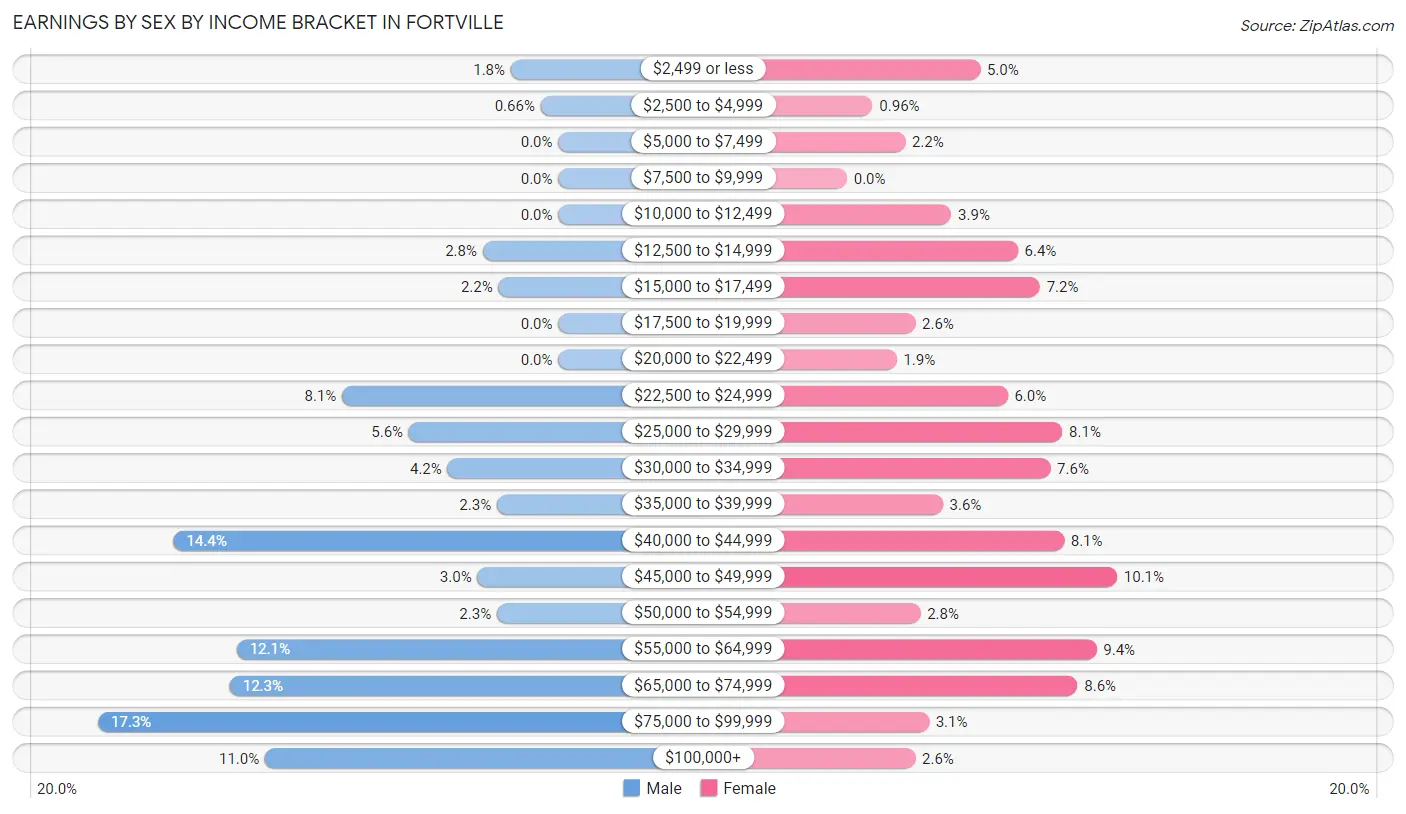
Earnings by Sex by Income Bracket in Fortville
The most common earnings brackets in Fortville are $75,000 to $99,999 for men (262 | 17.2%) and $45,000 to $49,999 for women (158 | 10.1%).
| Income | Male | Female |
| $2,499 or less | 27 (1.8%) | 78 (5.0%) |
| $2,500 to $4,999 | 10 (0.7%) | 15 (1.0%) |
| $5,000 to $7,499 | 0 (0.0%) | 34 (2.2%) |
| $7,500 to $9,999 | 0 (0.0%) | 0 (0.0%) |
| $10,000 to $12,499 | 0 (0.0%) | 61 (3.9%) |
| $12,500 to $14,999 | 43 (2.8%) | 100 (6.4%) |
| $15,000 to $17,499 | 34 (2.2%) | 113 (7.2%) |
| $17,500 to $19,999 | 0 (0.0%) | 40 (2.6%) |
| $20,000 to $22,499 | 0 (0.0%) | 29 (1.9%) |
| $22,500 to $24,999 | 123 (8.1%) | 94 (6.0%) |
| $25,000 to $29,999 | 85 (5.6%) | 126 (8.1%) |
| $30,000 to $34,999 | 63 (4.2%) | 119 (7.6%) |
| $35,000 to $39,999 | 35 (2.3%) | 56 (3.6%) |
| $40,000 to $44,999 | 219 (14.4%) | 127 (8.1%) |
| $45,000 to $49,999 | 46 (3.0%) | 158 (10.1%) |
| $50,000 to $54,999 | 35 (2.3%) | 43 (2.8%) |
| $55,000 to $64,999 | 183 (12.0%) | 146 (9.3%) |
| $65,000 to $74,999 | 187 (12.3%) | 135 (8.6%) |
| $75,000 to $99,999 | 262 (17.2%) | 48 (3.1%) |
| $100,000+ | 167 (11.0%) | 40 (2.6%) |
| Total | 1,519 (100.0%) | 1,562 (100.0%) |
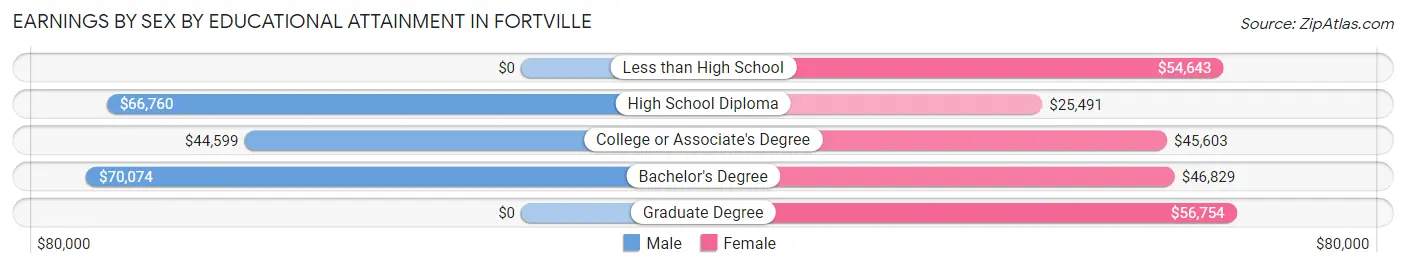
Earnings by Sex by Educational Attainment in Fortville
Average earnings in Fortville are $56,206 for men and $41,309 for women, a difference of 26.5%. Men with an educational attainment of bachelor's degree enjoy the highest average annual earnings of $70,074, while those with college or associate's degree education earn the least with $44,599. Women with an educational attainment of graduate degree earn the most with the average annual earnings of $56,754, while those with high school diploma education have the smallest earnings of $25,491.
| Educational Attainment | Male Income | Female Income |
| Less than High School | - | - |
| High School Diploma | $66,760 | $25,491 |
| College or Associate's Degree | $44,599 | $45,603 |
| Bachelor's Degree | $70,074 | $46,829 |
| Graduate Degree | - | - |
| Total | $56,206 | $41,309 |
Family Income in Fortville
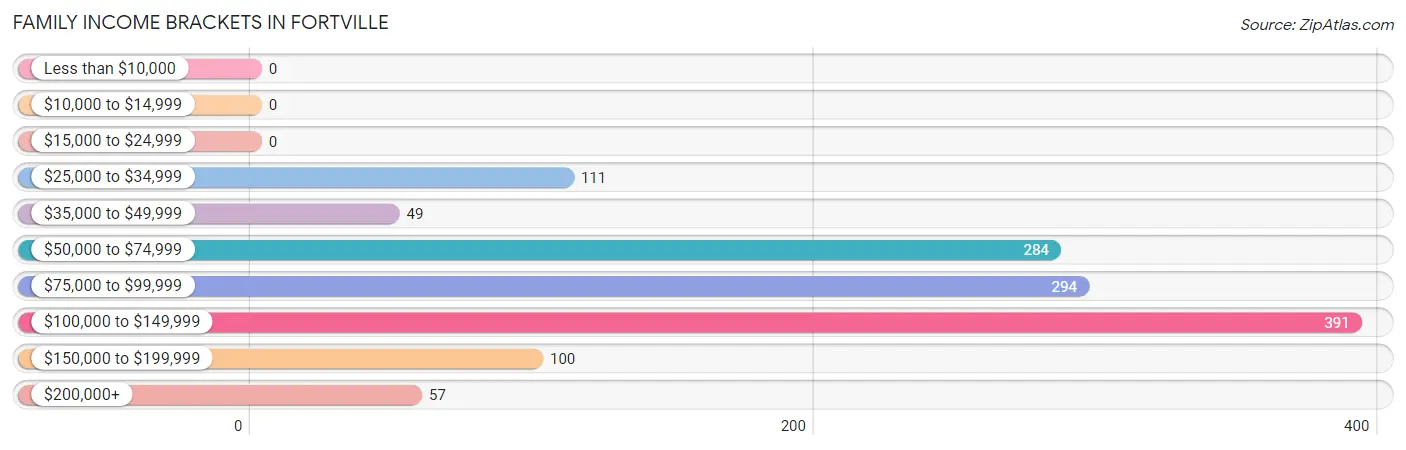
Family Income Brackets in Fortville
According to the Fortville family income data, there are 391 families falling into the $100,000 to $149,999 income range, which is the most common income bracket and makes up 30.4% of all families.
| Income Bracket | # Families | % Families |
| Less than $10,000 | 0 | 0.0% |
| $10,000 to $14,999 | 0 | 0.0% |
| $15,000 to $24,999 | 0 | 0.0% |
| $25,000 to $34,999 | 111 | 8.6% |
| $35,000 to $49,999 | 49 | 3.8% |
| $50,000 to $74,999 | 284 | 22.1% |
| $75,000 to $99,999 | 294 | 22.9% |
| $100,000 to $149,999 | 391 | 30.4% |
| $150,000 to $199,999 | 100 | 7.8% |
| $200,000+ | 57 | 4.4% |
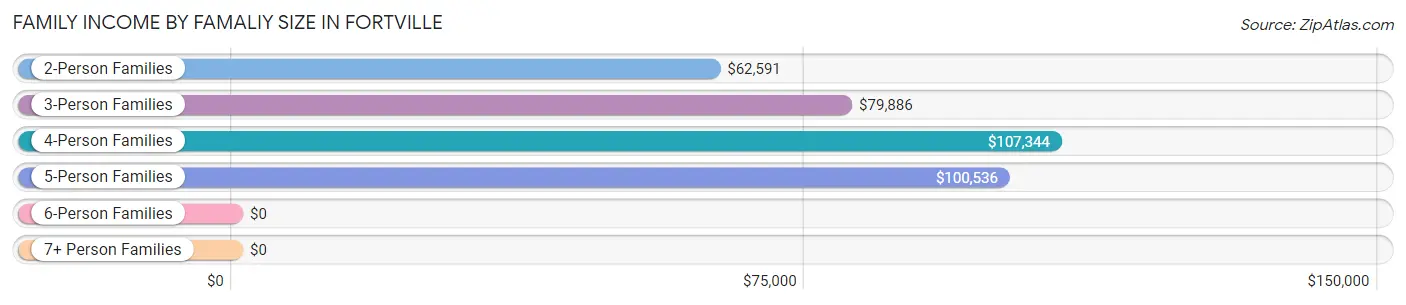
Family Income by Famaliy Size in Fortville
4-person families (240 | 18.7%) account for the highest median family income in Fortville with $107,344 per family, while 2-person families (514 | 40.0%) have the highest median income of $31,296 per family member.
| Income Bracket | # Families | Median Income |
| 2-Person Families | 514 (40.0%) | $62,591 |
| 3-Person Families | 399 (31.0%) | $79,886 |
| 4-Person Families | 240 (18.7%) | $107,344 |
| 5-Person Families | 133 (10.3%) | $100,536 |
| 6-Person Families | 0 (0.0%) | $0 |
| 7+ Person Families | 0 (0.0%) | $0 |
| Total | 1,286 (100.0%) | $80,000 |
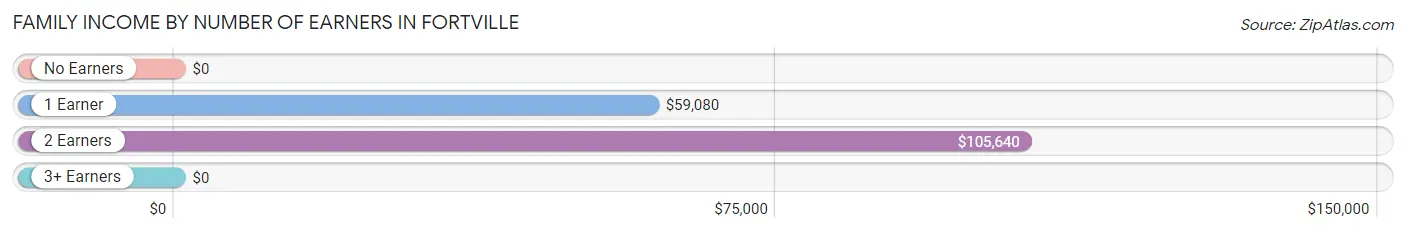
Family Income by Number of Earners in Fortville
| Number of Earners | # Families | Median Income |
| No Earners | 38 (2.9%) | $0 |
| 1 Earner | 557 (43.3%) | $59,080 |
| 2 Earners | 588 (45.7%) | $105,640 |
| 3+ Earners | 103 (8.0%) | $0 |
| Total | 1,286 (100.0%) | $80,000 |
Household Income in Fortville
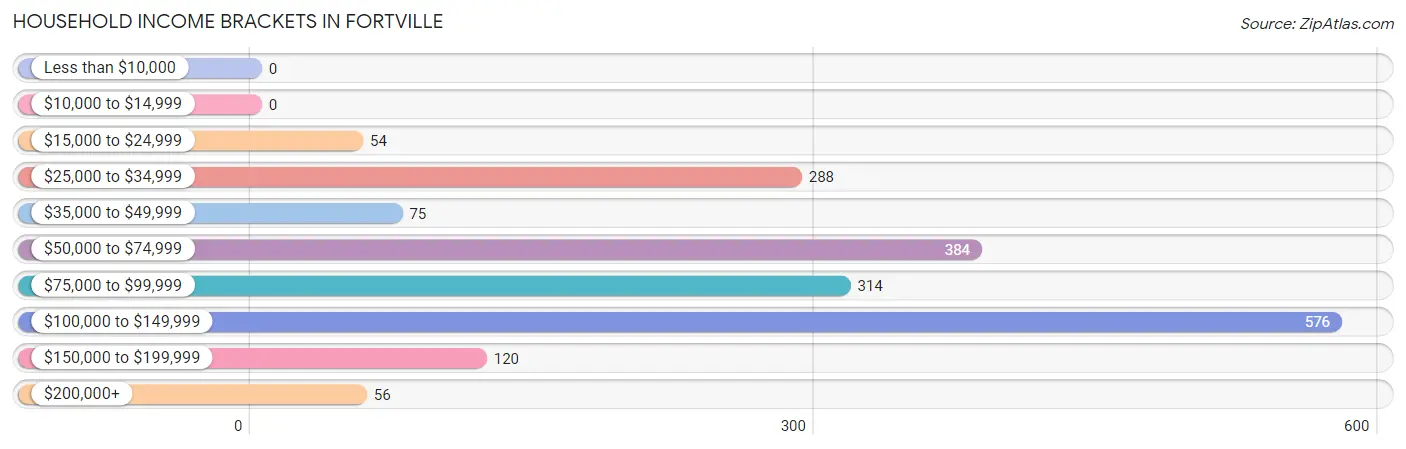
Household Income Brackets in Fortville
With 576 households falling in the category, the $100,000 to $149,999 income range is the most frequent in Fortville, accounting for 30.8% of all households.
| Income Bracket | # Households | % Households |
| Less than $10,000 | 0 | 0.0% |
| $10,000 to $14,999 | 0 | 0.0% |
| $15,000 to $24,999 | 54 | 2.9% |
| $25,000 to $34,999 | 288 | 15.4% |
| $35,000 to $49,999 | 75 | 4.0% |
| $50,000 to $74,999 | 384 | 20.5% |
| $75,000 to $99,999 | 314 | 16.8% |
| $100,000 to $149,999 | 576 | 30.8% |
| $150,000 to $199,999 | 120 | 6.4% |
| $200,000+ | 56 | 3.0% |
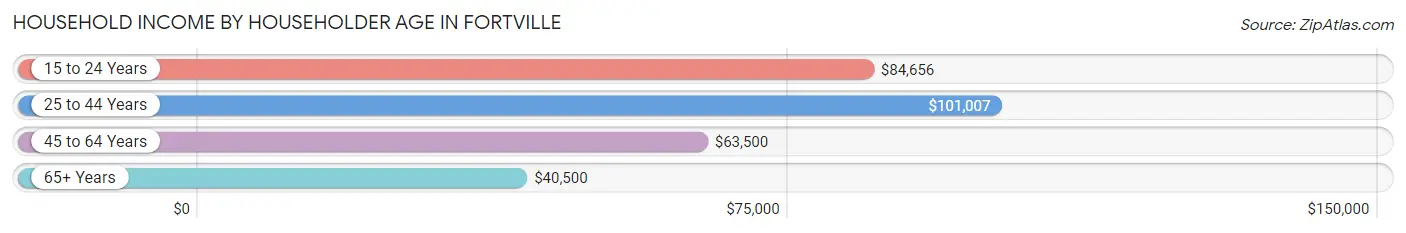
Household Income by Householder Age in Fortville
The median household income in Fortville is $79,806, with the highest median household income of $101,007 found in the 25 to 44 years age bracket for the primary householder. A total of 630 households (33.7%) fall into this category. Meanwhile, the 65+ years age bracket for the primary householder has the lowest median household income of $40,500, with 272 households (14.5%) in this group.
| Income Bracket | # Households | Median Income |
| 15 to 24 Years | 125 (6.7%) | $84,656 |
| 25 to 44 Years | 630 (33.7%) | $101,007 |
| 45 to 64 Years | 844 (45.1%) | $63,500 |
| 65+ Years | 272 (14.5%) | $40,500 |
| Total | 1,871 (100.0%) | $79,806 |
Poverty in Fortville
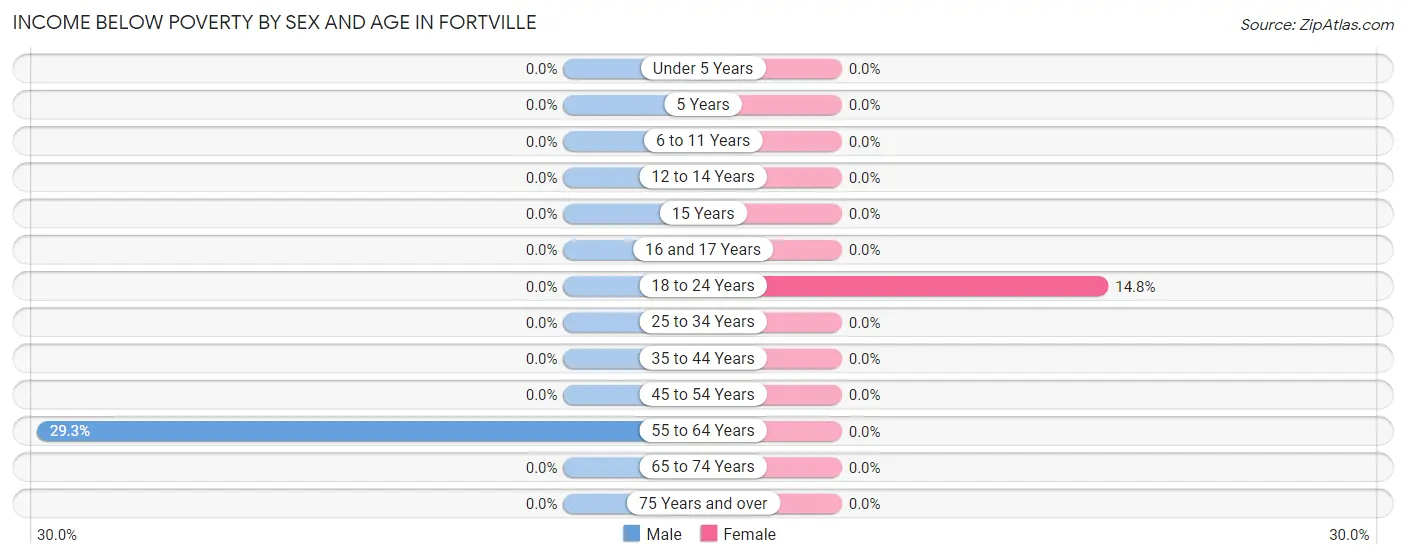
Income Below Poverty by Sex and Age in Fortville
With 4.7% poverty level for males and 1.9% for females among the residents of Fortville, 55 to 64 year old males and 18 to 24 year old females are the most vulnerable to poverty, with 112 males (29.3%) and 54 females (14.8%) in their respective age groups living below the poverty level.
| Age Bracket | Male | Female |
| Under 5 Years | 0 (0.0%) | 0 (0.0%) |
| 5 Years | 0 (0.0%) | 0 (0.0%) |
| 6 to 11 Years | 0 (0.0%) | 0 (0.0%) |
| 12 to 14 Years | 0 (0.0%) | 0 (0.0%) |
| 15 Years | 0 (0.0%) | 0 (0.0%) |
| 16 and 17 Years | 0 (0.0%) | 0 (0.0%) |
| 18 to 24 Years | 0 (0.0%) | 54 (14.8%) |
| 25 to 34 Years | 0 (0.0%) | 0 (0.0%) |
| 35 to 44 Years | 0 (0.0%) | 0 (0.0%) |
| 45 to 54 Years | 0 (0.0%) | 0 (0.0%) |
| 55 to 64 Years | 112 (29.3%) | 0 (0.0%) |
| 65 to 74 Years | 0 (0.0%) | 0 (0.0%) |
| 75 Years and over | 0 (0.0%) | 0 (0.0%) |
| Total | 112 (4.7%) | 54 (1.9%) |
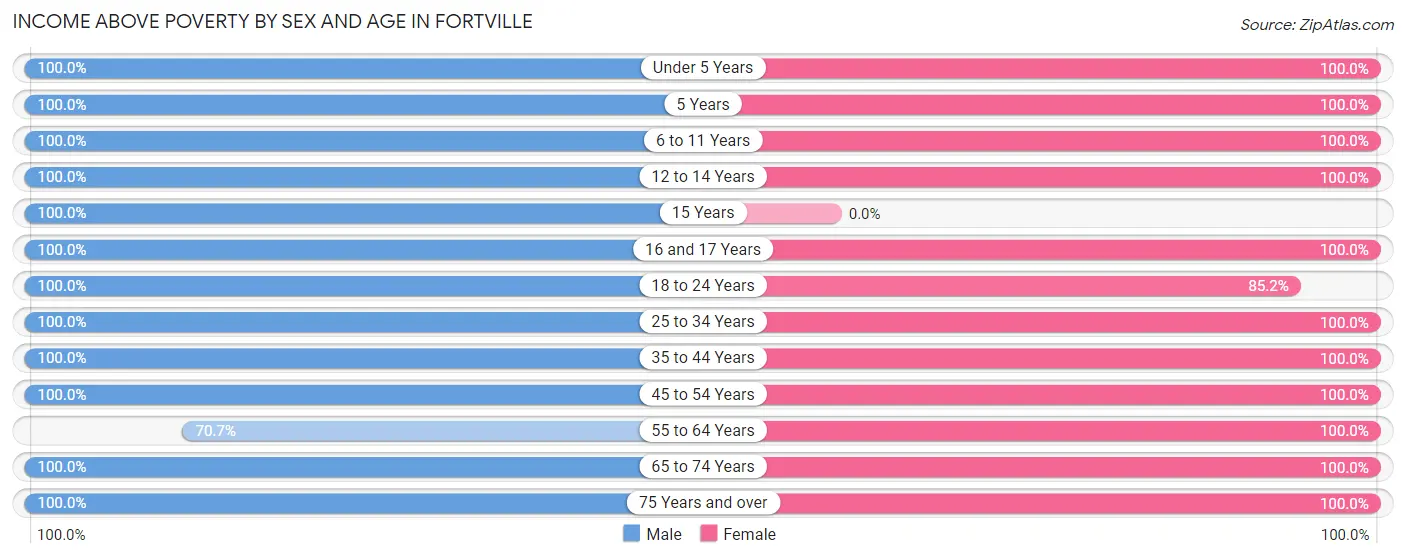
Income Above Poverty by Sex and Age in Fortville
According to the poverty statistics in Fortville, males aged under 5 years and females aged under 5 years are the age groups that are most secure financially, with 100.0% of males and 100.0% of females in these age groups living above the poverty line.
| Age Bracket | Male | Female |
| Under 5 Years | 96 (100.0%) | 286 (100.0%) |
| 5 Years | 39 (100.0%) | 41 (100.0%) |
| 6 to 11 Years | 115 (100.0%) | 263 (100.0%) |
| 12 to 14 Years | 56 (100.0%) | 159 (100.0%) |
| 15 Years | 37 (100.0%) | 0 (0.0%) |
| 16 and 17 Years | 181 (100.0%) | 130 (100.0%) |
| 18 to 24 Years | 232 (100.0%) | 310 (85.2%) |
| 25 to 34 Years | 369 (100.0%) | 401 (100.0%) |
| 35 to 44 Years | 269 (100.0%) | 313 (100.0%) |
| 45 to 54 Years | 338 (100.0%) | 397 (100.0%) |
| 55 to 64 Years | 270 (70.7%) | 301 (100.0%) |
| 65 to 74 Years | 173 (100.0%) | 69 (100.0%) |
| 75 Years and over | 96 (100.0%) | 99 (100.0%) |
| Total | 2,271 (95.3%) | 2,769 (98.1%) |
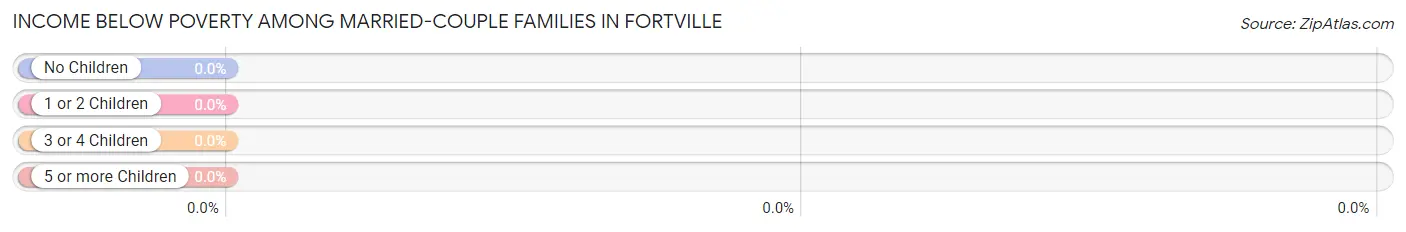
Income Below Poverty Among Married-Couple Families in Fortville
| Children | Above Poverty | Below Poverty |
| No Children | 322 (100.0%) | 0 (0.0%) |
| 1 or 2 Children | 393 (100.0%) | 0 (0.0%) |
| 3 or 4 Children | 75 (100.0%) | 0 (0.0%) |
| 5 or more Children | 0 (0.0%) | 0 (0.0%) |
| Total | 790 (100.0%) | 0 (0.0%) |
Income Below Poverty Among Single-Parent Households in Fortville
| Children | Single Father | Single Mother |
| No Children | 0 (0.0%) | 0 (0.0%) |
| 1 or 2 Children | 0 (0.0%) | 0 (0.0%) |
| 3 or 4 Children | 0 (0.0%) | 0 (0.0%) |
| 5 or more Children | 0 (0.0%) | 0 (0.0%) |
| Total | 0 (0.0%) | 0 (0.0%) |
Income Below Poverty Among Married-Couple vs Single-Parent Households in Fortville
| Children | Married-Couple Families | Single-Parent Households |
| No Children | 0 (0.0%) | 0 (0.0%) |
| 1 or 2 Children | 0 (0.0%) | 0 (0.0%) |
| 3 or 4 Children | 0 (0.0%) | 0 (0.0%) |
| 5 or more Children | 0 (0.0%) | 0 (0.0%) |
| Total | 0 (0.0%) | 0 (0.0%) |
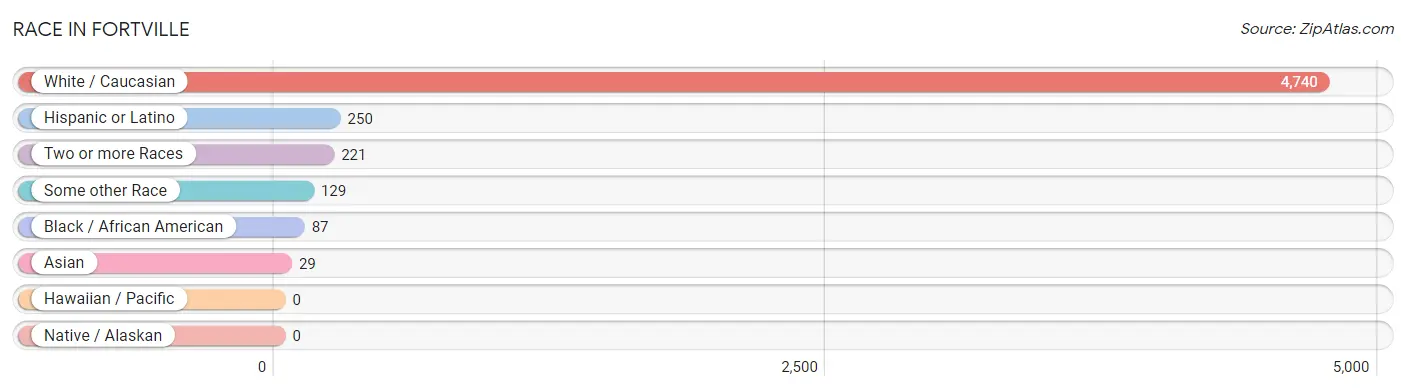
Race in Fortville
The most populous races in Fortville are White / Caucasian (4,740 | 91.0%), Hispanic or Latino (250 | 4.8%), and Two or more Races (221 | 4.3%).
| Race | # Population | % Population |
| Asian | 29 | 0.6% |
| Black / African American | 87 | 1.7% |
| Hawaiian / Pacific | 0 | 0.0% |
| Hispanic or Latino | 250 | 4.8% |
| Native / Alaskan | 0 | 0.0% |
| White / Caucasian | 4,740 | 91.0% |
| Two or more Races | 221 | 4.3% |
| Some other Race | 129 | 2.5% |
| Total | 5,206 | 100.0% |
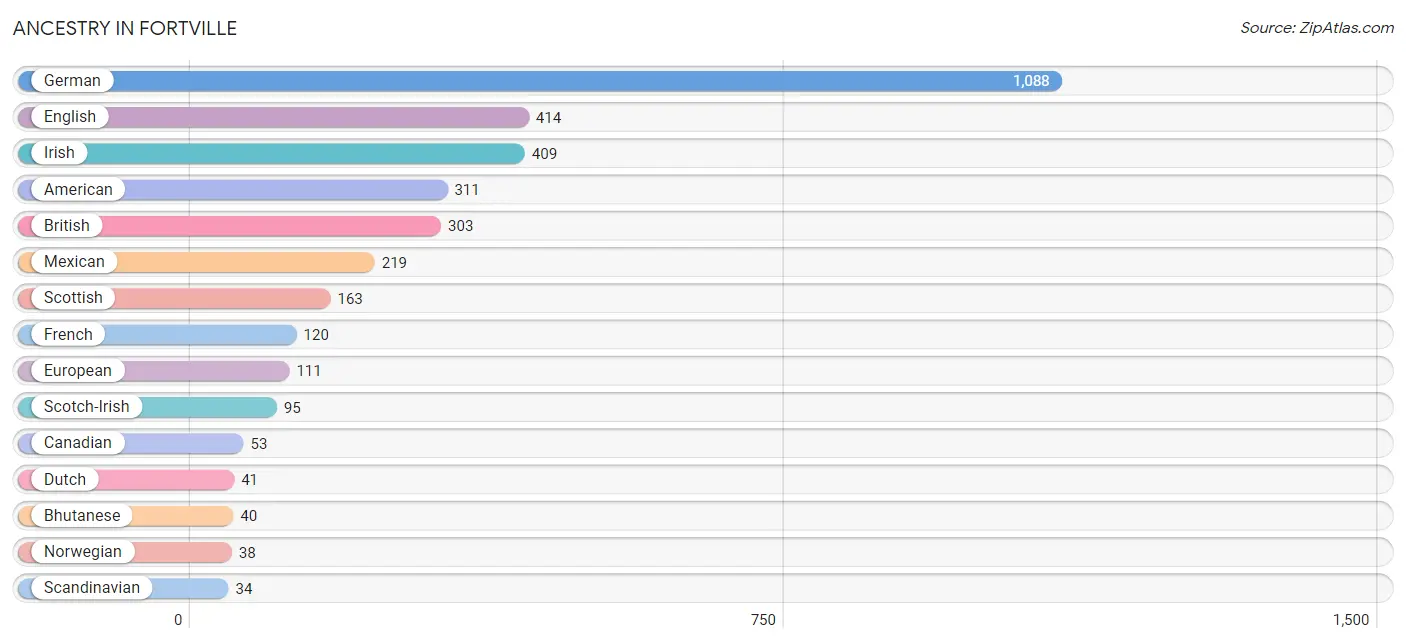
Ancestry in Fortville
The most populous ancestries reported in Fortville are German (1,088 | 20.9%), English (414 | 8.0%), Irish (409 | 7.9%), American (311 | 6.0%), and British (303 | 5.8%), together accounting for 48.5% of all Fortville residents.
| Ancestry | # Population | % Population |
| American | 311 | 6.0% |
| Bhutanese | 40 | 0.8% |
| Blackfeet | 22 | 0.4% |
| British | 303 | 5.8% |
| Canadian | 53 | 1.0% |
| Central American | 31 | 0.6% |
| Cherokee | 18 | 0.4% |
| Czechoslovakian | 16 | 0.3% |
| Dutch | 41 | 0.8% |
| English | 414 | 8.0% |
| European | 111 | 2.1% |
| French | 120 | 2.3% |
| German | 1,088 | 20.9% |
| Greek | 12 | 0.2% |
| Irish | 409 | 7.9% |
| Italian | 22 | 0.4% |
| Jamaican | 20 | 0.4% |
| Mexican | 219 | 4.2% |
| Norwegian | 38 | 0.7% |
| Salvadoran | 31 | 0.6% |
| Scandinavian | 34 | 0.6% |
| Scotch-Irish | 95 | 1.8% |
| Scottish | 163 | 3.1% |
| Sioux | 12 | 0.2% |
| Swiss | 31 | 0.6% |
| Welsh | 28 | 0.5% | View All 26 Rows |
Immigrants in Fortville
The most numerous immigrant groups reported in Fortville came from Central America (32 | 0.6%), Latin America (32 | 0.6%), Mexico (32 | 0.6%), Asia (29 | 0.6%), and Pakistan (29 | 0.6%), together accounting for 3.0% of all Fortville residents.
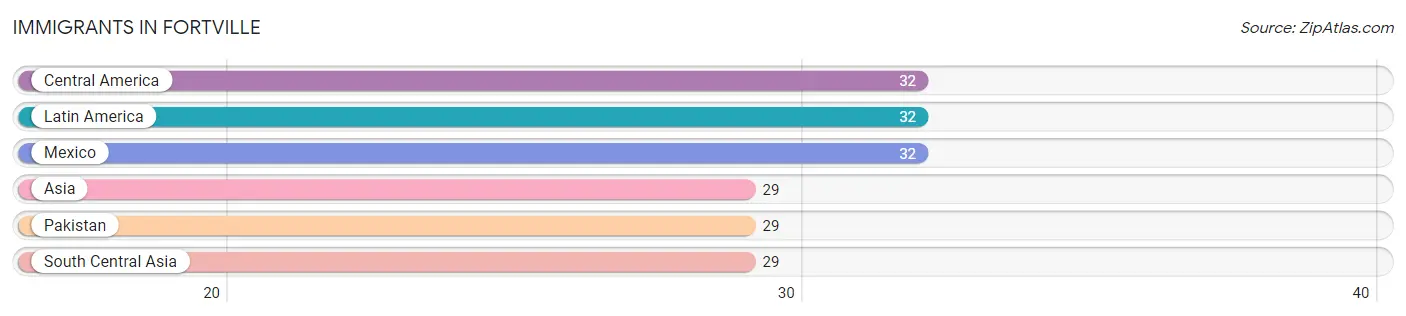
| Immigration Origin | # Population | % Population |
| Asia | 29 | 0.6% |
| Central America | 32 | 0.6% |
| Latin America | 32 | 0.6% |
| Mexico | 32 | 0.6% |
| Pakistan | 29 | 0.6% |
| South Central Asia | 29 | 0.6% | View All 6 Rows |
Sex and Age in Fortville
Sex and Age in Fortville
The most populous age groups in Fortville are 55 to 59 Years (382 | 16.0%) for men and 15 to 19 Years (333 | 11.8%) for women.
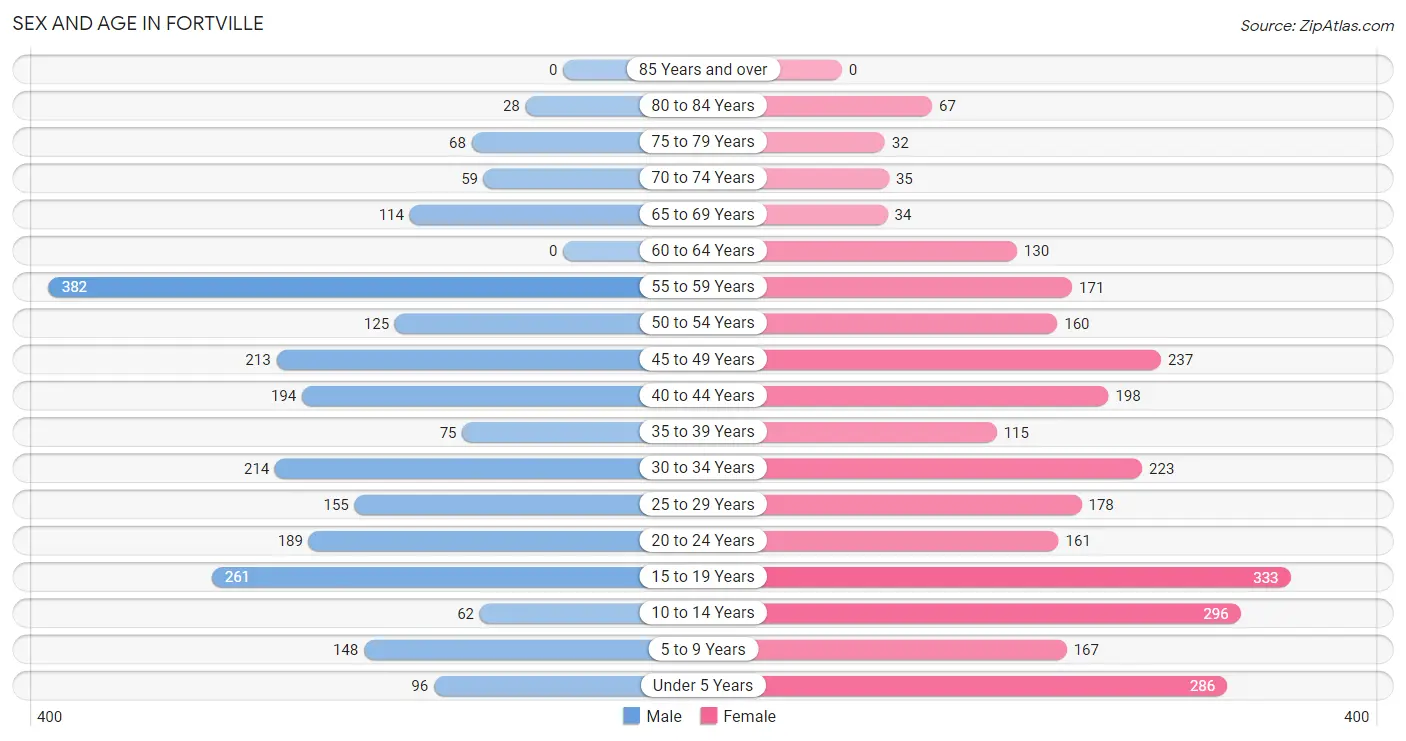
| Age Bracket | Male | Female |
| Under 5 Years | 96 (4.0%) | 286 (10.1%) |
| 5 to 9 Years | 148 (6.2%) | 167 (5.9%) |
| 10 to 14 Years | 62 (2.6%) | 296 (10.5%) |
| 15 to 19 Years | 261 (11.0%) | 333 (11.8%) |
| 20 to 24 Years | 189 (7.9%) | 161 (5.7%) |
| 25 to 29 Years | 155 (6.5%) | 178 (6.3%) |
| 30 to 34 Years | 214 (9.0%) | 223 (7.9%) |
| 35 to 39 Years | 75 (3.2%) | 115 (4.1%) |
| 40 to 44 Years | 194 (8.1%) | 198 (7.0%) |
| 45 to 49 Years | 213 (8.9%) | 237 (8.4%) |
| 50 to 54 Years | 125 (5.2%) | 160 (5.7%) |
| 55 to 59 Years | 382 (16.0%) | 171 (6.1%) |
| 60 to 64 Years | 0 (0.0%) | 130 (4.6%) |
| 65 to 69 Years | 114 (4.8%) | 34 (1.2%) |
| 70 to 74 Years | 59 (2.5%) | 35 (1.2%) |
| 75 to 79 Years | 68 (2.9%) | 32 (1.1%) |
| 80 to 84 Years | 28 (1.2%) | 67 (2.4%) |
| 85 Years and over | 0 (0.0%) | 0 (0.0%) |
| Total | 2,383 (100.0%) | 2,823 (100.0%) |
Families and Households in Fortville
Median Family Size in Fortville
The median family size in Fortville is 3.10 persons per family, with married-couple families (790 | 61.4%) accounting for the largest median family size of 3.35 persons per family. On the other hand, single female/mother families (180 | 14.0%) represent the smallest median family size with 2.37 persons per family.
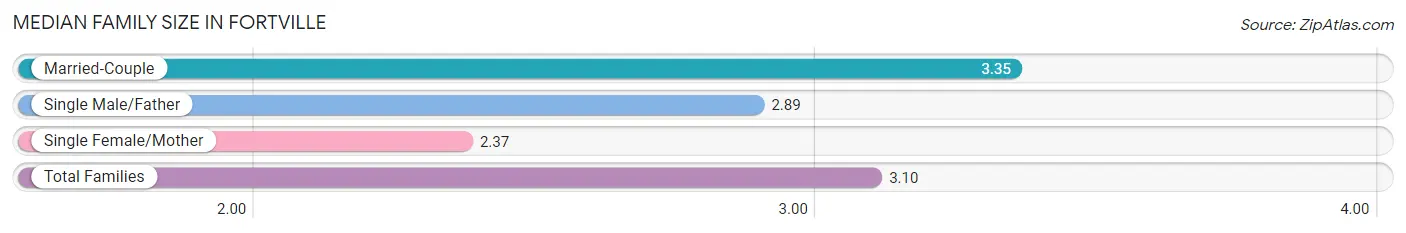
| Family Type | # Families | Family Size |
| Married-Couple | 790 (61.4%) | 3.35 |
| Single Male/Father | 316 (24.6%) | 2.89 |
| Single Female/Mother | 180 (14.0%) | 2.37 |
| Total Families | 1,286 (100.0%) | 3.10 |
Median Household Size in Fortville
The median household size in Fortville is 2.78 persons per household, with single male/father households (316 | 16.9%) accounting for the largest median household size of 3.37 persons per household. non-family households (585 | 31.3%) represent the smallest median household size with 1.70 persons per household.
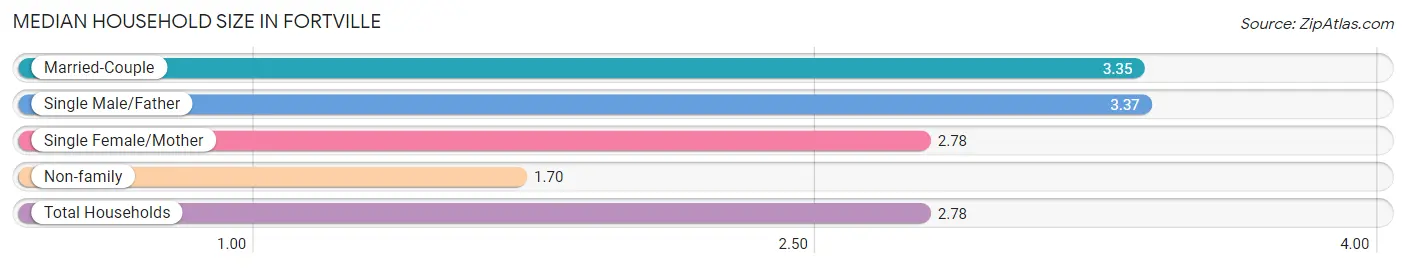
| Household Type | # Households | Household Size |
| Married-Couple | 790 (42.2%) | 3.35 |
| Single Male/Father | 316 (16.9%) | 3.37 |
| Single Female/Mother | 180 (9.6%) | 2.78 |
| Non-family | 585 (31.3%) | 1.70 |
| Total Households | 1,871 (100.0%) | 2.78 |
Household Size by Marriage Status in Fortville
Out of a total of 1,871 households in Fortville, 1,286 (68.7%) are family households, while 585 (31.3%) are nonfamily households. The most numerous type of family households are 2-person households, comprising 446, and the most common type of nonfamily households are 1-person households, comprising 327.
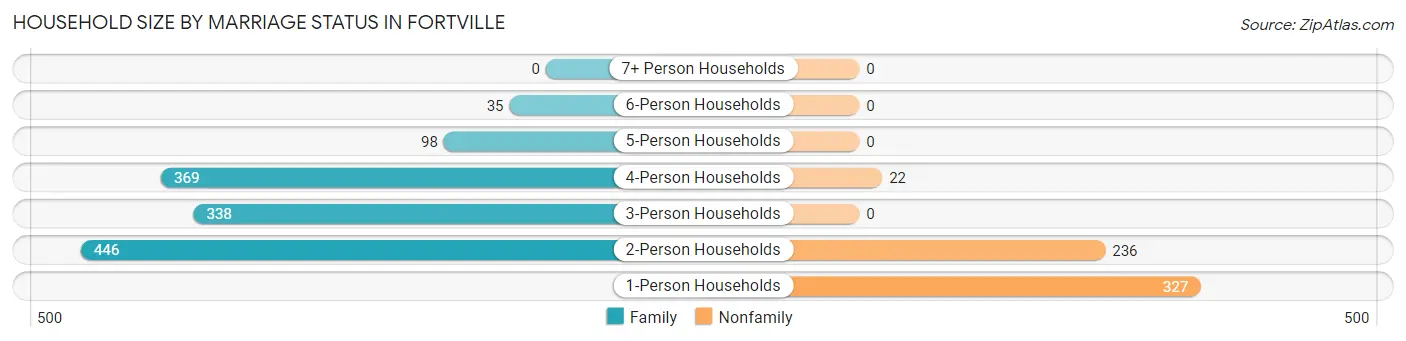
| Household Size | Family Households | Nonfamily Households |
| 1-Person Households | - | 327 (17.5%) |
| 2-Person Households | 446 (23.8%) | 236 (12.6%) |
| 3-Person Households | 338 (18.1%) | 0 (0.0%) |
| 4-Person Households | 369 (19.7%) | 22 (1.2%) |
| 5-Person Households | 98 (5.2%) | 0 (0.0%) |
| 6-Person Households | 35 (1.9%) | 0 (0.0%) |
| 7+ Person Households | 0 (0.0%) | 0 (0.0%) |
| Total | 1,286 (68.7%) | 585 (31.3%) |
Female Fertility in Fortville
Fertility by Age in Fortville
Average fertility rate in Fortville is 31.0 births per 1,000 women. Women in the age bracket of 20 to 34 years have the highest fertility rate with 85.0 births per 1,000 women. Women in the age bracket of 20 to 34 years acount for 100.0% of all women with births.
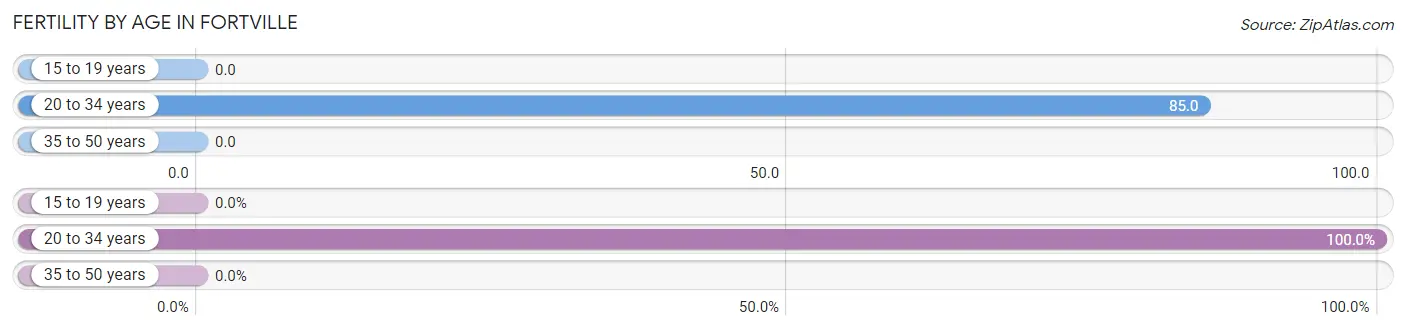
| Age Bracket | Women with Births | Births / 1,000 Women |
| 15 to 19 years | 0 (0.0%) | 0.0 |
| 20 to 34 years | 48 (100.0%) | 85.0 |
| 35 to 50 years | 0 (0.0%) | 0.0 |
| Total | 48 (100.0%) | 31.0 |
Fertility by Age by Marriage Status in Fortville
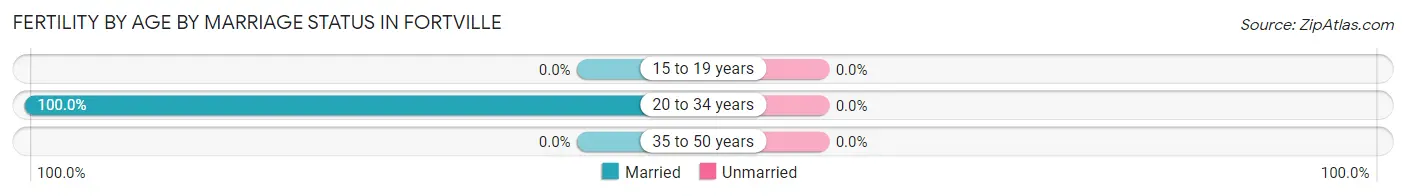
| Age Bracket | Married | Unmarried |
| 15 to 19 years | 0 (0.0%) | 0 (0.0%) |
| 20 to 34 years | 48 (100.0%) | 0 (0.0%) |
| 35 to 50 years | 0 (0.0%) | 0 (0.0%) |
| Total | 48 (100.0%) | 0 (0.0%) |
Fertility by Education in Fortville
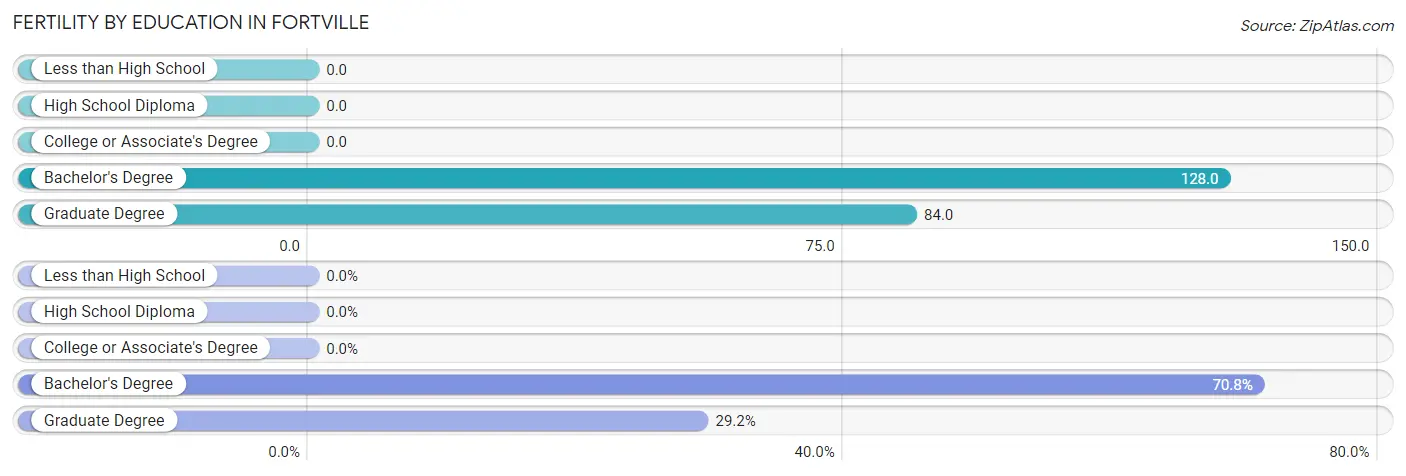
| Educational Attainment | Women with Births | Births / 1,000 Women |
| Less than High School | 0 (0.0%) | 0.0 |
| High School Diploma | 0 (0.0%) | 0.0 |
| College or Associate's Degree | 0 (0.0%) | 0.0 |
| Bachelor's Degree | 34 (70.8%) | 128.0 |
| Graduate Degree | 14 (29.2%) | 84.0 |
| Total | 48 (100.0%) | 31.0 |
Fertility by Education by Marriage Status in Fortville
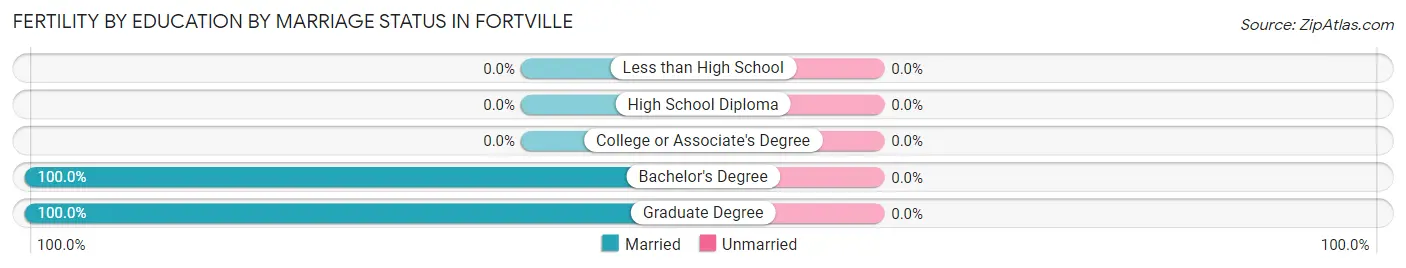
| Educational Attainment | Married | Unmarried |
| Less than High School | 0 (0.0%) | 0 (0.0%) |
| High School Diploma | 0 (0.0%) | 0 (0.0%) |
| College or Associate's Degree | 0 (0.0%) | 0 (0.0%) |
| Bachelor's Degree | 34 (100.0%) | 0 (0.0%) |
| Graduate Degree | 14 (100.0%) | 0 (0.0%) |
| Total | 48 (100.0%) | 0 (0.0%) |
Employment Characteristics in Fortville
Employment by Class of Employer in Fortville
Among the 2,787 employed individuals in Fortville, private company employees (2,057 | 73.8%), self-employed (incorporated) (272 | 9.8%), and not-for-profit organizations (154 | 5.5%) make up the most common classes of employment.
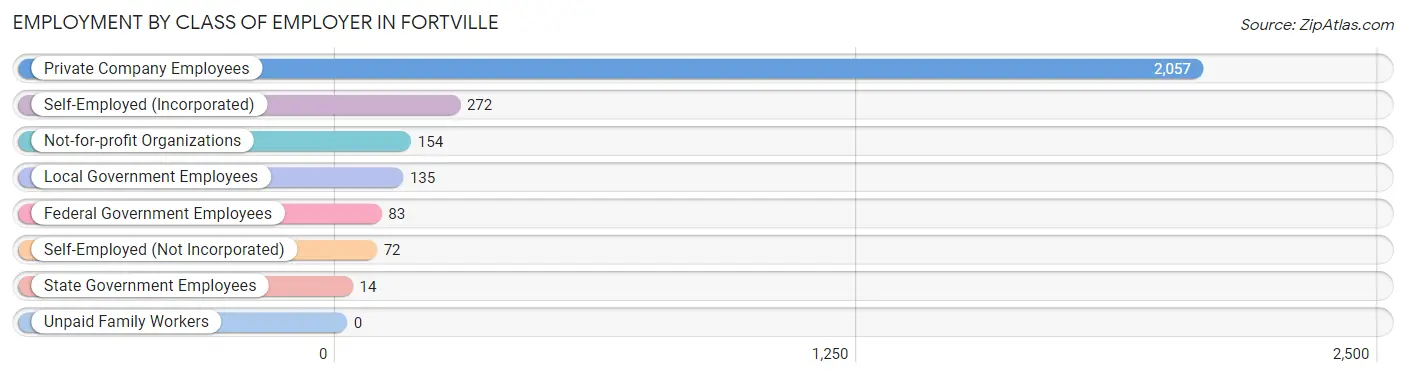
| Employer Class | # Employees | % Employees |
| Private Company Employees | 2,057 | 73.8% |
| Self-Employed (Incorporated) | 272 | 9.8% |
| Self-Employed (Not Incorporated) | 72 | 2.6% |
| Not-for-profit Organizations | 154 | 5.5% |
| Local Government Employees | 135 | 4.8% |
| State Government Employees | 14 | 0.5% |
| Federal Government Employees | 83 | 3.0% |
| Unpaid Family Workers | 0 | 0.0% |
| Total | 2,787 | 100.0% |
Employment Status by Age in Fortville
According to the labor force statistics for Fortville, out of the total population over 16 years of age (4,114), 71.5% or 2,942 individuals are in the labor force, with 5.2% or 153 of them unemployed. The age group with the highest labor force participation rate is 35 to 44 years, with 100.0% or 582 individuals in the labor force. Within the labor force, the 65 to 74 years age range has the highest percentage of unemployed individuals, with 60.0% or 60 of them being unemployed.
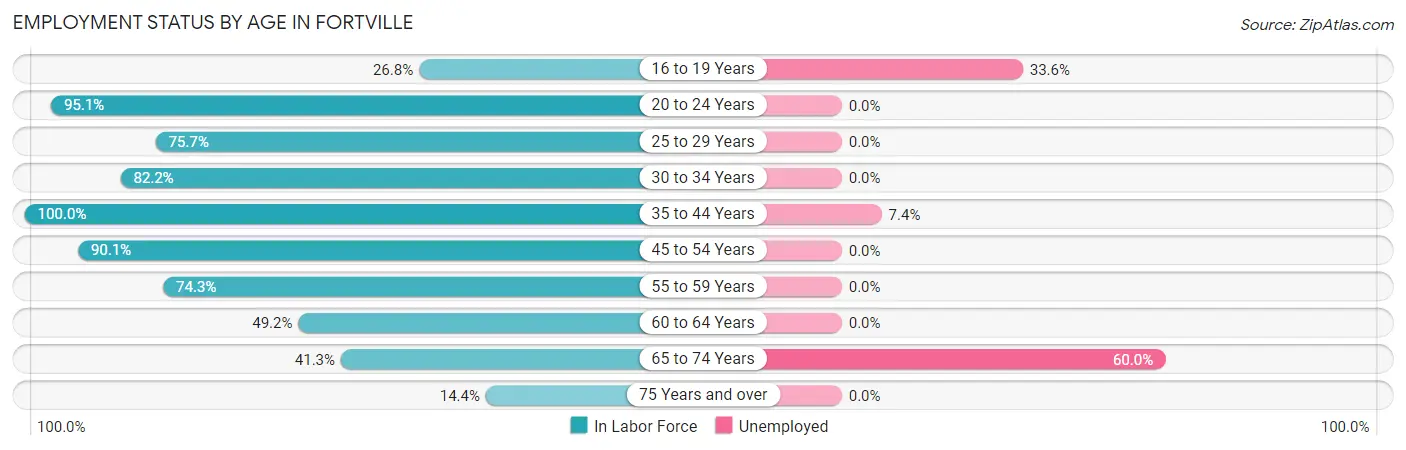
| Age Bracket | In Labor Force | Unemployed |
| 16 to 19 Years | 149 (26.8%) | 50 (33.6%) |
| 20 to 24 Years | 333 (95.1%) | 0 (0.0%) |
| 25 to 29 Years | 252 (75.7%) | 0 (0.0%) |
| 30 to 34 Years | 359 (82.2%) | 0 (0.0%) |
| 35 to 44 Years | 582 (100.0%) | 43 (7.4%) |
| 45 to 54 Years | 662 (90.1%) | 0 (0.0%) |
| 55 to 59 Years | 411 (74.3%) | 0 (0.0%) |
| 60 to 64 Years | 64 (49.2%) | 0 (0.0%) |
| 65 to 74 Years | 100 (41.3%) | 60 (60.0%) |
| 75 Years and over | 28 (14.4%) | 0 (0.0%) |
| Total | 2,942 (71.5%) | 153 (5.2%) |
Employment Status by Educational Attainment in Fortville
According to labor force statistics for Fortville, 84.1% of individuals (2,330) out of the total population between 25 and 64 years of age (2,770) are in the labor force, with 1.8% or 42 of them being unemployed. The group with the highest labor force participation rate are those with the educational attainment of high school diploma, with 88.0% or 975 individuals in the labor force. Within the labor force, individuals with college / associate degree education have the highest percentage of unemployment, with 7.7% or 43 of them being unemployed.
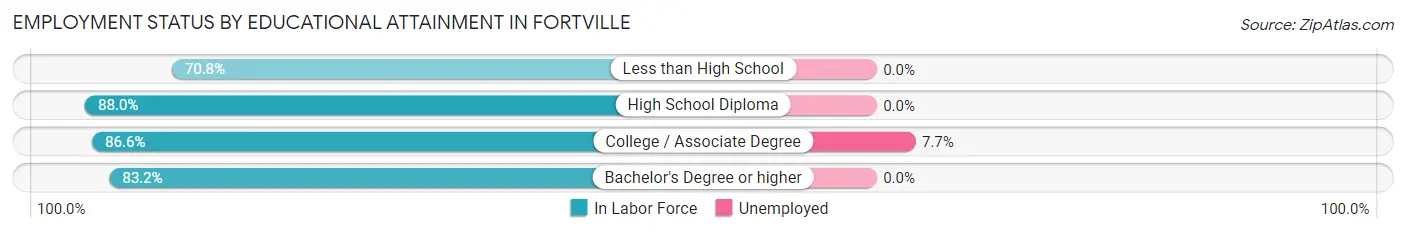
| Educational Attainment | In Labor Force | Unemployed |
| Less than High School | 283 (70.8%) | 0 (0.0%) |
| High School Diploma | 975 (88.0%) | 0 (0.0%) |
| College / Associate Degree | 561 (86.6%) | 50 (7.7%) |
| Bachelor's Degree or higher | 511 (83.2%) | 0 (0.0%) |
| Total | 2,330 (84.1%) | 50 (1.8%) |
Employment Occupations by Sex in Fortville
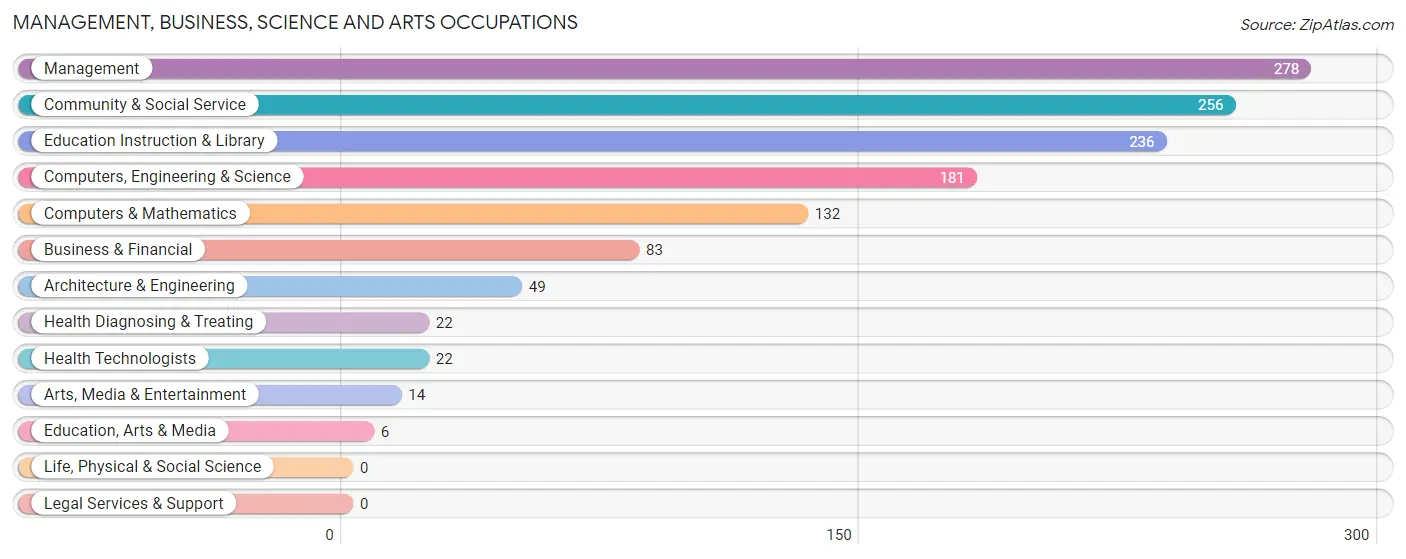
Management, Business, Science and Arts Occupations
The most common Management, Business, Science and Arts occupations in Fortville are Management (278 | 10.0%), Community & Social Service (256 | 9.2%), Education Instruction & Library (236 | 8.5%), Computers, Engineering & Science (181 | 6.5%), and Computers & Mathematics (132 | 4.7%).
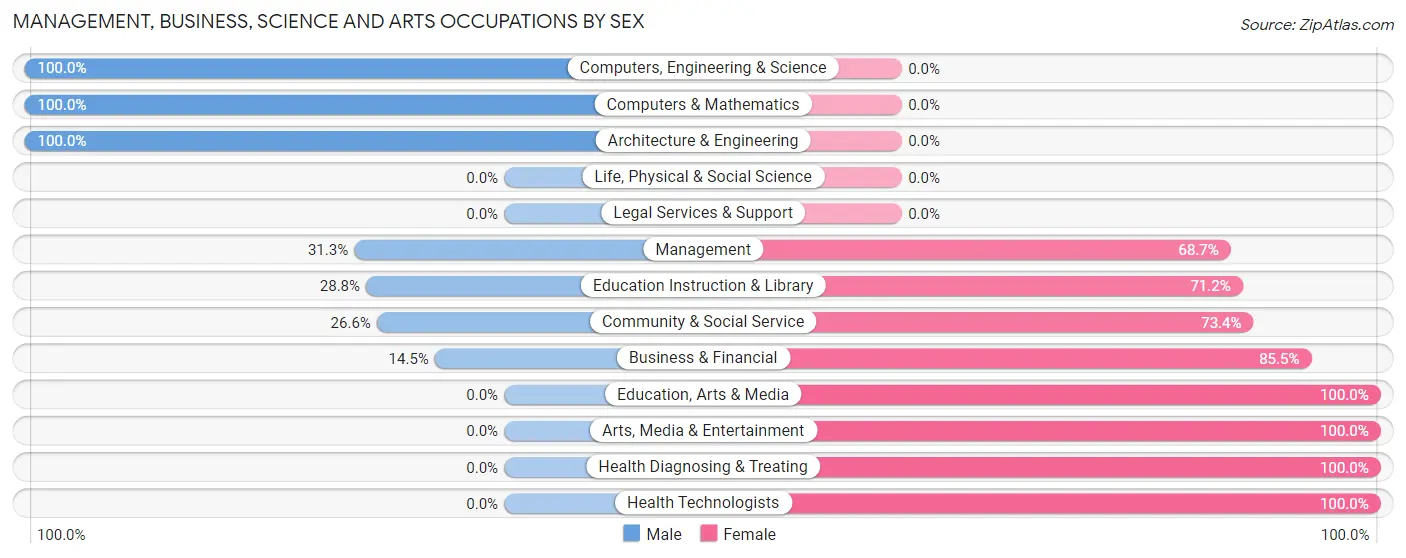
Management, Business, Science and Arts Occupations by Sex
Within the Management, Business, Science and Arts occupations in Fortville, the most male-oriented occupations are Computers, Engineering & Science (100.0%), Computers & Mathematics (100.0%), and Architecture & Engineering (100.0%), while the most female-oriented occupations are Education, Arts & Media (100.0%), Arts, Media & Entertainment (100.0%), and Health Diagnosing & Treating (100.0%).
| Occupation | Male | Female |
| Management | 87 (31.3%) | 191 (68.7%) |
| Business & Financial | 12 (14.5%) | 71 (85.5%) |
| Computers, Engineering & Science | 181 (100.0%) | 0 (0.0%) |
| Computers & Mathematics | 132 (100.0%) | 0 (0.0%) |
| Architecture & Engineering | 49 (100.0%) | 0 (0.0%) |
| Life, Physical & Social Science | 0 (0.0%) | 0 (0.0%) |
| Community & Social Service | 68 (26.6%) | 188 (73.4%) |
| Education, Arts & Media | 0 (0.0%) | 6 (100.0%) |
| Legal Services & Support | 0 (0.0%) | 0 (0.0%) |
| Education Instruction & Library | 68 (28.8%) | 168 (71.2%) |
| Arts, Media & Entertainment | 0 (0.0%) | 14 (100.0%) |
| Health Diagnosing & Treating | 0 (0.0%) | 22 (100.0%) |
| Health Technologists | 0 (0.0%) | 22 (100.0%) |
| Total (Category) | 348 (42.4%) | 472 (57.6%) |
| Total (Overall) | 1,358 (48.7%) | 1,429 (51.3%) |
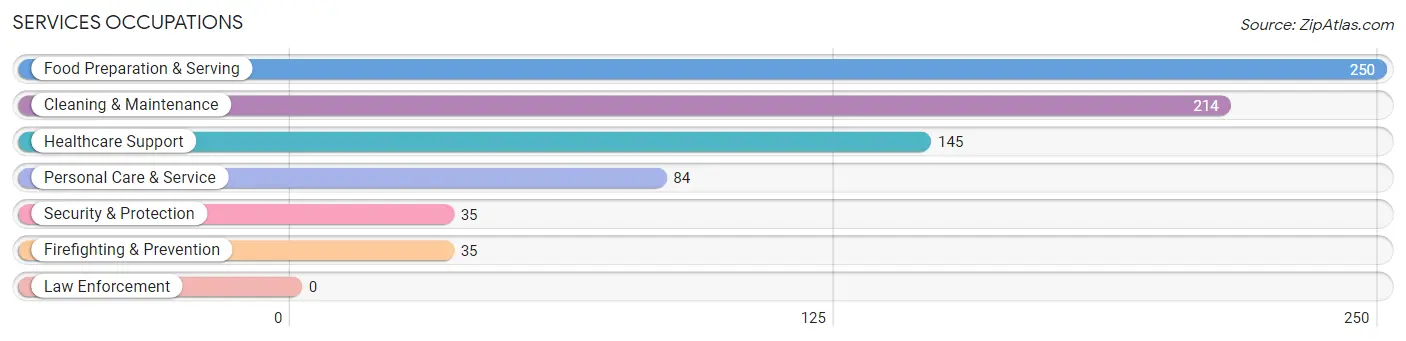
Services Occupations
The most common Services occupations in Fortville are Food Preparation & Serving (250 | 9.0%), Cleaning & Maintenance (214 | 7.7%), Healthcare Support (145 | 5.2%), Personal Care & Service (84 | 3.0%), and Security & Protection (35 | 1.3%).
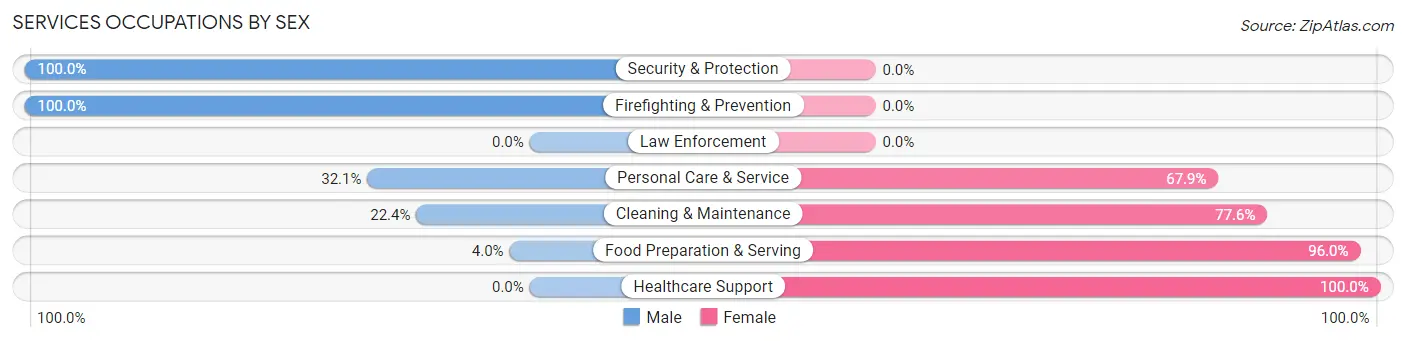
Services Occupations by Sex
Within the Services occupations in Fortville, the most male-oriented occupations are Security & Protection (100.0%), Firefighting & Prevention (100.0%), and Personal Care & Service (32.1%), while the most female-oriented occupations are Healthcare Support (100.0%), Food Preparation & Serving (96.0%), and Cleaning & Maintenance (77.6%).
| Occupation | Male | Female |
| Healthcare Support | 0 (0.0%) | 145 (100.0%) |
| Security & Protection | 35 (100.0%) | 0 (0.0%) |
| Firefighting & Prevention | 35 (100.0%) | 0 (0.0%) |
| Law Enforcement | 0 (0.0%) | 0 (0.0%) |
| Food Preparation & Serving | 10 (4.0%) | 240 (96.0%) |
| Cleaning & Maintenance | 48 (22.4%) | 166 (77.6%) |
| Personal Care & Service | 27 (32.1%) | 57 (67.9%) |
| Total (Category) | 120 (16.5%) | 608 (83.5%) |
| Total (Overall) | 1,358 (48.7%) | 1,429 (51.3%) |
Sales and Office Occupations
The most common Sales and Office occupations in Fortville are Office & Administration (314 | 11.3%), and Sales & Related (146 | 5.2%).

Sales and Office Occupations by Sex

| Occupation | Male | Female |
| Sales & Related | 146 (100.0%) | 0 (0.0%) |
| Office & Administration | 40 (12.7%) | 274 (87.3%) |
| Total (Category) | 186 (40.4%) | 274 (59.6%) |
| Total (Overall) | 1,358 (48.7%) | 1,429 (51.3%) |
Natural Resources, Construction and Maintenance Occupations
The most common Natural Resources, Construction and Maintenance occupations in Fortville are Construction & Extraction (388 | 13.9%), and Installation, Maintenance & Repair (172 | 6.2%).
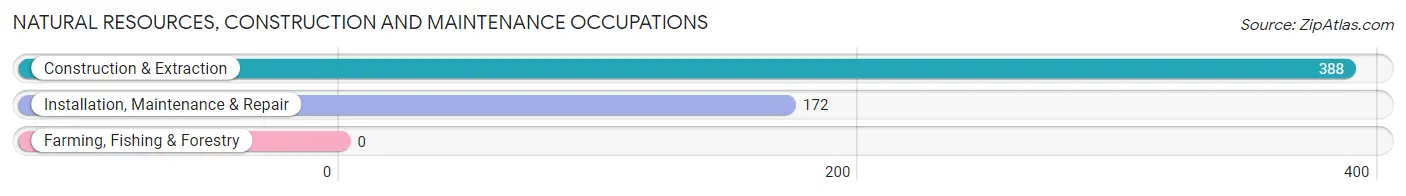
Natural Resources, Construction and Maintenance Occupations by Sex
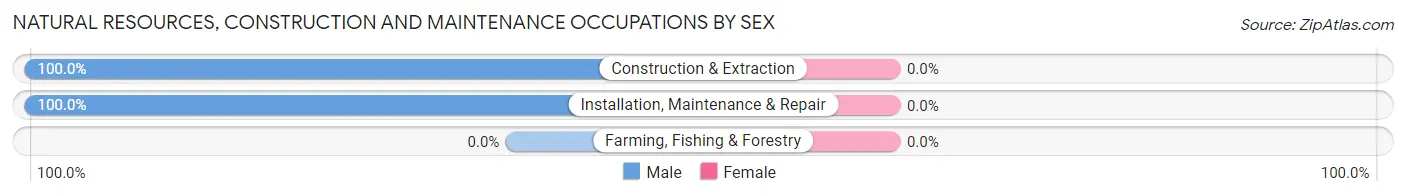
| Occupation | Male | Female |
| Farming, Fishing & Forestry | 0 (0.0%) | 0 (0.0%) |
| Construction & Extraction | 388 (100.0%) | 0 (0.0%) |
| Installation, Maintenance & Repair | 172 (100.0%) | 0 (0.0%) |
| Total (Category) | 560 (100.0%) | 0 (0.0%) |
| Total (Overall) | 1,358 (48.7%) | 1,429 (51.3%) |
Production, Transportation and Moving Occupations
The most common Production, Transportation and Moving occupations in Fortville are Production (94 | 3.4%), Material Moving (74 | 2.7%), and Transportation (51 | 1.8%).
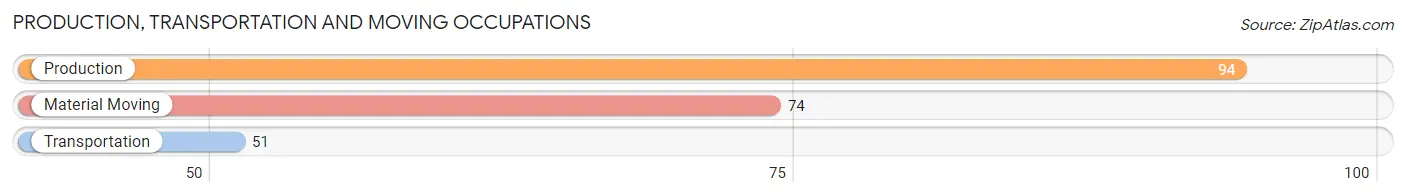
Production, Transportation and Moving Occupations by Sex
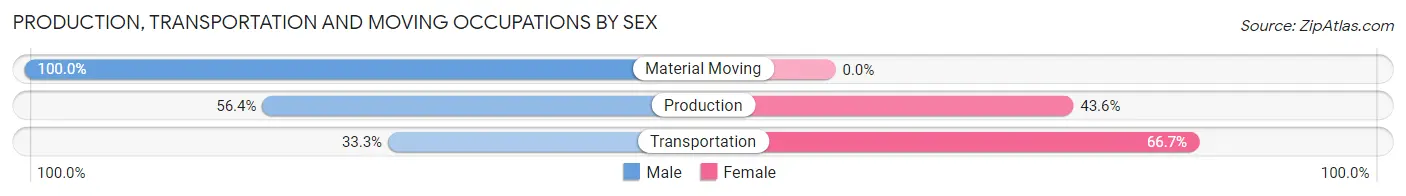
| Occupation | Male | Female |
| Production | 53 (56.4%) | 41 (43.6%) |
| Transportation | 17 (33.3%) | 34 (66.7%) |
| Material Moving | 74 (100.0%) | 0 (0.0%) |
| Total (Category) | 144 (65.7%) | 75 (34.3%) |
| Total (Overall) | 1,358 (48.7%) | 1,429 (51.3%) |
Employment Industries by Sex in Fortville
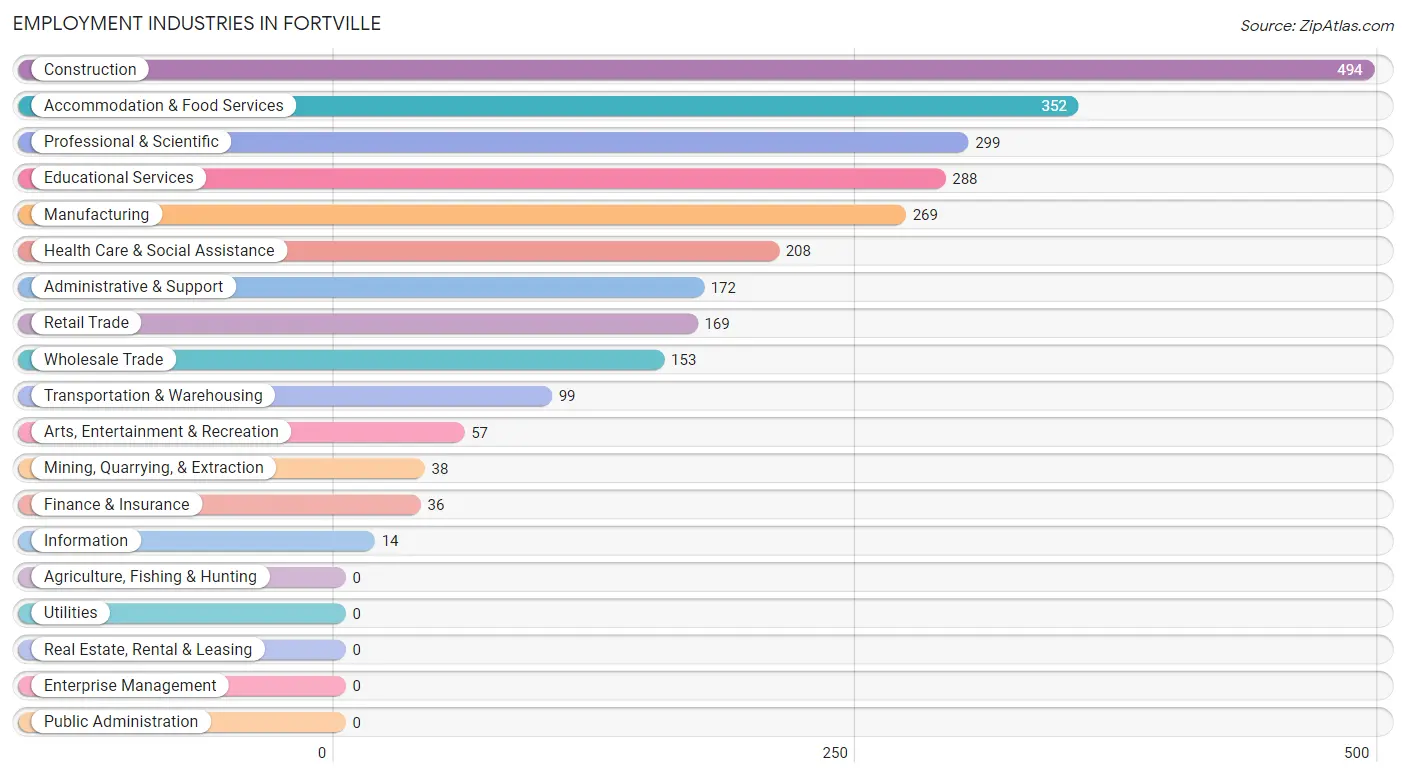
Employment Industries in Fortville
The major employment industries in Fortville include Construction (494 | 17.7%), Accommodation & Food Services (352 | 12.6%), Professional & Scientific (299 | 10.7%), Educational Services (288 | 10.3%), and Manufacturing (269 | 9.7%).
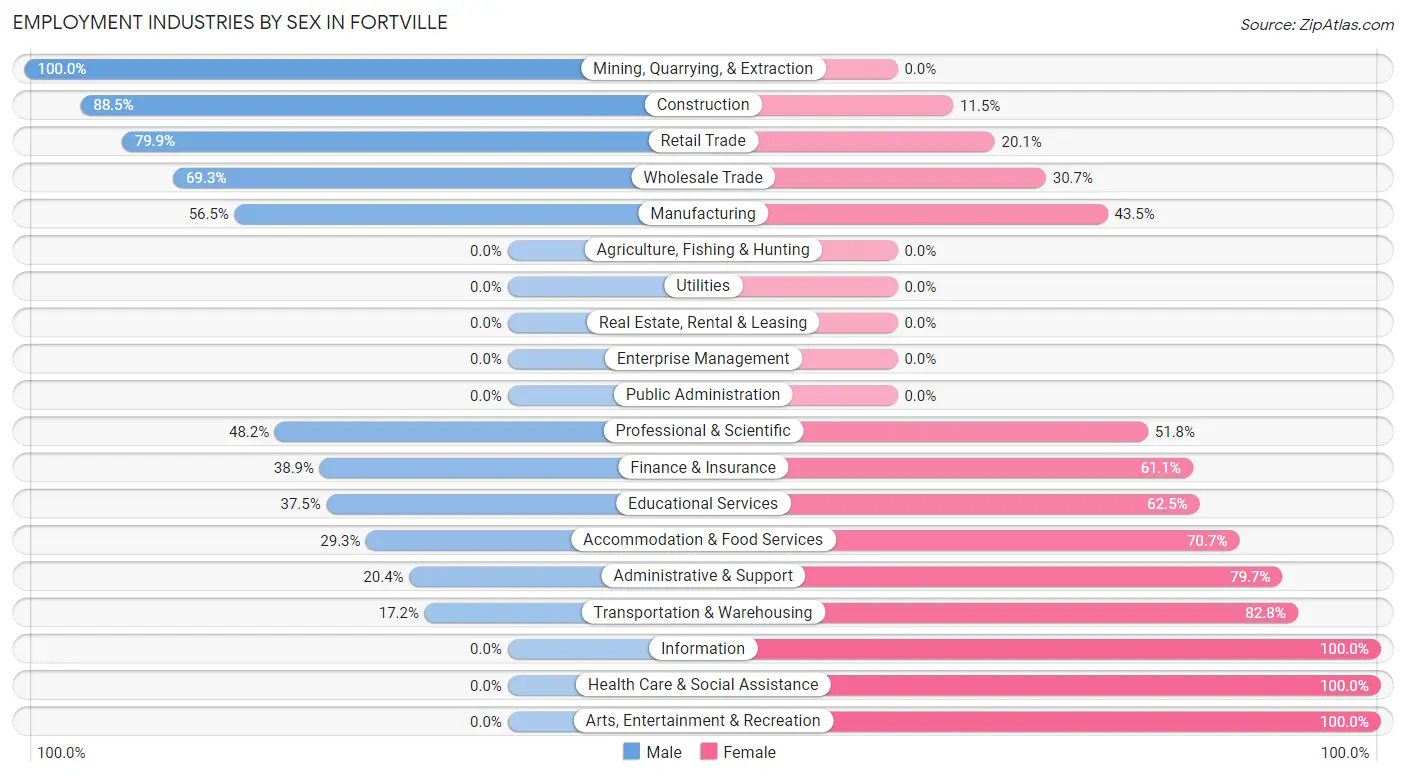
Employment Industries by Sex in Fortville
The Fortville industries that see more men than women are Mining, Quarrying, & Extraction (100.0%), Construction (88.5%), and Retail Trade (79.9%), whereas the industries that tend to have a higher number of women are Information (100.0%), Health Care & Social Assistance (100.0%), and Arts, Entertainment & Recreation (100.0%).
| Industry | Male | Female |
| Agriculture, Fishing & Hunting | 0 (0.0%) | 0 (0.0%) |
| Mining, Quarrying, & Extraction | 38 (100.0%) | 0 (0.0%) |
| Construction | 437 (88.5%) | 57 (11.5%) |
| Manufacturing | 152 (56.5%) | 117 (43.5%) |
| Wholesale Trade | 106 (69.3%) | 47 (30.7%) |
| Retail Trade | 135 (79.9%) | 34 (20.1%) |
| Transportation & Warehousing | 17 (17.2%) | 82 (82.8%) |
| Utilities | 0 (0.0%) | 0 (0.0%) |
| Information | 0 (0.0%) | 14 (100.0%) |
| Finance & Insurance | 14 (38.9%) | 22 (61.1%) |
| Real Estate, Rental & Leasing | 0 (0.0%) | 0 (0.0%) |
| Professional & Scientific | 144 (48.2%) | 155 (51.8%) |
| Enterprise Management | 0 (0.0%) | 0 (0.0%) |
| Administrative & Support | 35 (20.3%) | 137 (79.6%) |
| Educational Services | 108 (37.5%) | 180 (62.5%) |
| Health Care & Social Assistance | 0 (0.0%) | 208 (100.0%) |
| Arts, Entertainment & Recreation | 0 (0.0%) | 57 (100.0%) |
| Accommodation & Food Services | 103 (29.3%) | 249 (70.7%) |
| Public Administration | 0 (0.0%) | 0 (0.0%) |
| Total | 1,358 (48.7%) | 1,429 (51.3%) |
Education in Fortville
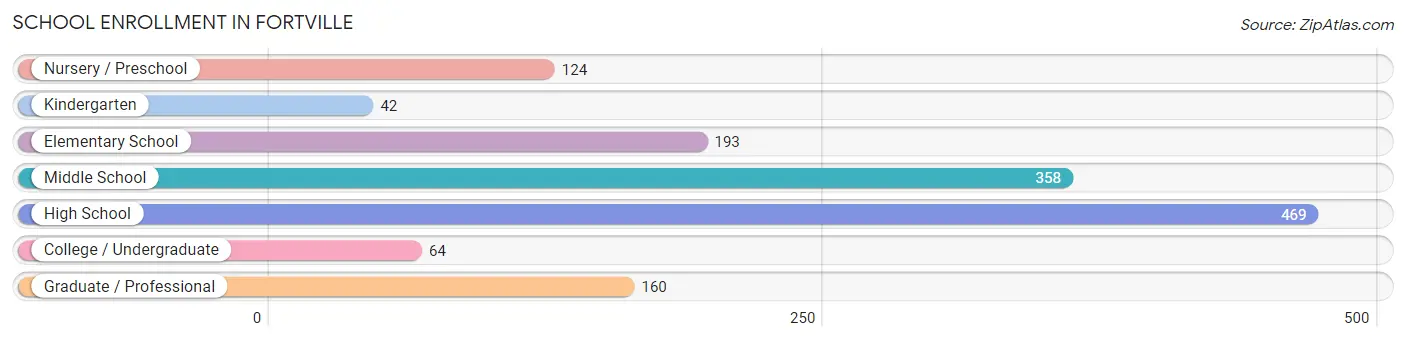
School Enrollment in Fortville
The most common levels of schooling among the 1,410 students in Fortville are high school (469 | 33.3%), middle school (358 | 25.4%), and elementary school (193 | 13.7%).
| School Level | # Students | % Students |
| Nursery / Preschool | 124 | 8.8% |
| Kindergarten | 42 | 3.0% |
| Elementary School | 193 | 13.7% |
| Middle School | 358 | 25.4% |
| High School | 469 | 33.3% |
| College / Undergraduate | 64 | 4.5% |
| Graduate / Professional | 160 | 11.4% |
| Total | 1,410 | 100.0% |
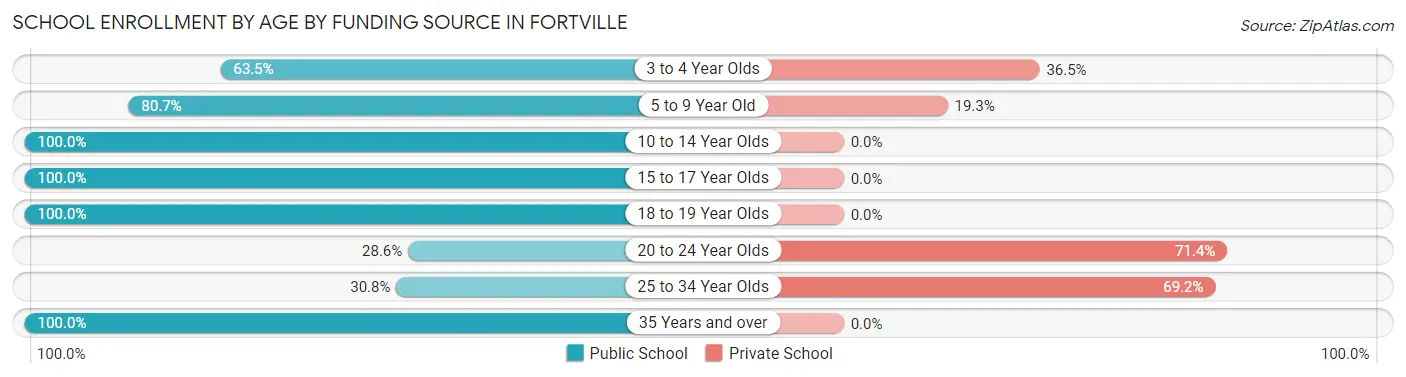
School Enrollment by Age by Funding Source in Fortville
Out of a total of 1,410 students who are enrolled in schools in Fortville, 190 (13.5%) attend a private institution, while the remaining 1,220 (86.5%) are enrolled in public schools. The age group of 20 to 24 year olds has the highest likelihood of being enrolled in private schools, with 35 (71.4% in the age bracket) enrolled. Conversely, the age group of 10 to 14 year olds has the lowest likelihood of being enrolled in a private school, with 358 (100.0% in the age bracket) attending a public institution.
| Age Bracket | Public School | Private School |
| 3 to 4 Year Olds | 54 (63.5%) | 31 (36.5%) |
| 5 to 9 Year Old | 221 (80.7%) | 53 (19.3%) |
| 10 to 14 Year Olds | 358 (100.0%) | 0 (0.0%) |
| 15 to 17 Year Olds | 348 (100.0%) | 0 (0.0%) |
| 18 to 19 Year Olds | 139 (100.0%) | 0 (0.0%) |
| 20 to 24 Year Olds | 14 (28.6%) | 35 (71.4%) |
| 25 to 34 Year Olds | 32 (30.8%) | 72 (69.2%) |
| 35 Years and over | 53 (100.0%) | 0 (0.0%) |
| Total | 1,220 (86.5%) | 190 (13.5%) |
Educational Attainment by Field of Study in Fortville
Education (120 | 14.9%), business (111 | 13.8%), communications (95 | 11.8%), science & technology (85 | 10.6%), and liberal arts & history (80 | 10.0%) are the most common fields of study among 804 individuals in Fortville who have obtained a bachelor's degree or higher.
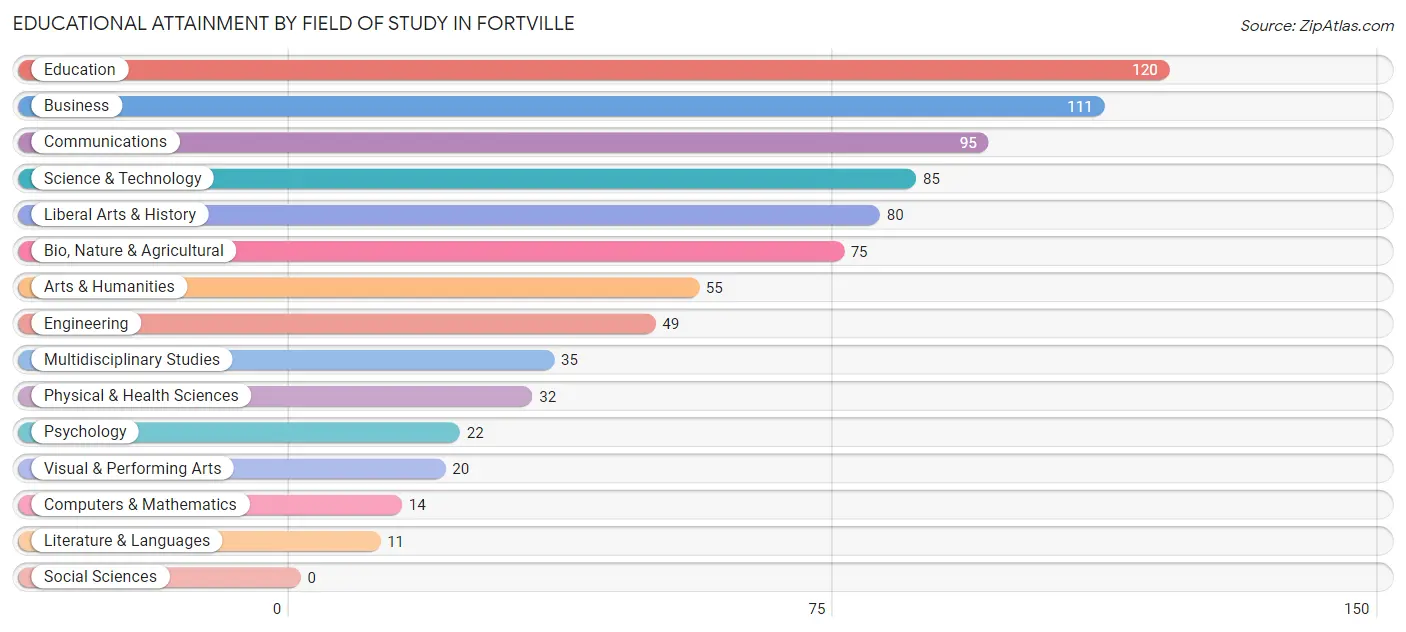
| Field of Study | # Graduates | % Graduates |
| Computers & Mathematics | 14 | 1.7% |
| Bio, Nature & Agricultural | 75 | 9.3% |
| Physical & Health Sciences | 32 | 4.0% |
| Psychology | 22 | 2.7% |
| Social Sciences | 0 | 0.0% |
| Engineering | 49 | 6.1% |
| Multidisciplinary Studies | 35 | 4.3% |
| Science & Technology | 85 | 10.6% |
| Business | 111 | 13.8% |
| Education | 120 | 14.9% |
| Literature & Languages | 11 | 1.4% |
| Liberal Arts & History | 80 | 10.0% |
| Visual & Performing Arts | 20 | 2.5% |
| Communications | 95 | 11.8% |
| Arts & Humanities | 55 | 6.8% |
| Total | 804 | 100.0% |
Transportation & Commute in Fortville
Vehicle Availability by Sex in Fortville
The most prevalent vehicle ownership categories in Fortville are males with 2 vehicles (538, accounting for 39.6%) and females with 2 vehicles (639, making up 37.7%).
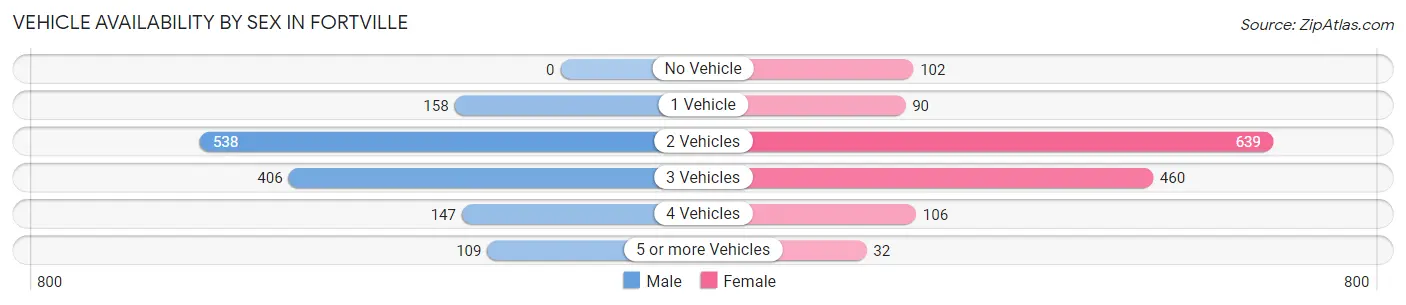
| Vehicles Available | Male | Female |
| No Vehicle | 0 (0.0%) | 102 (7.1%) |
| 1 Vehicle | 158 (11.6%) | 90 (6.3%) |
| 2 Vehicles | 538 (39.6%) | 639 (44.7%) |
| 3 Vehicles | 406 (29.9%) | 460 (32.2%) |
| 4 Vehicles | 147 (10.8%) | 106 (7.4%) |
| 5 or more Vehicles | 109 (8.0%) | 32 (2.2%) |
| Total | 1,358 (100.0%) | 1,429 (100.0%) |
Commute Time in Fortville
The most frequently occuring commute durations in Fortville are 20 to 24 minutes (725 commuters, 29.3%), 30 to 34 minutes (383 commuters, 15.5%), and 45 to 59 minutes (264 commuters, 10.7%).
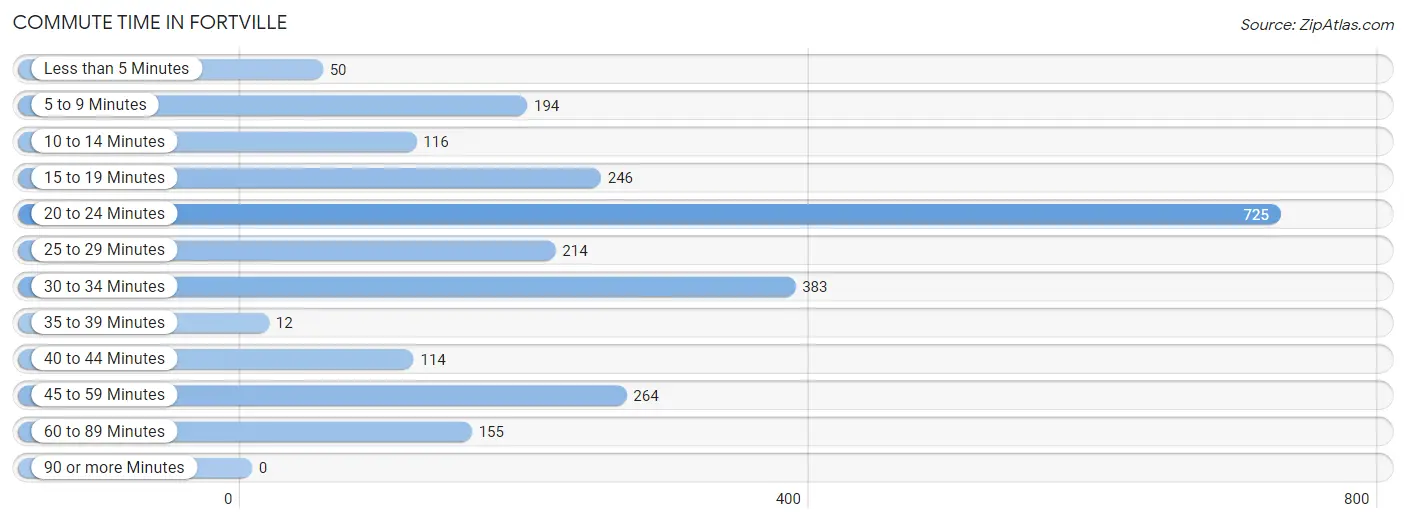
| Commute Time | # Commuters | % Commuters |
| Less than 5 Minutes | 50 | 2.0% |
| 5 to 9 Minutes | 194 | 7.8% |
| 10 to 14 Minutes | 116 | 4.7% |
| 15 to 19 Minutes | 246 | 10.0% |
| 20 to 24 Minutes | 725 | 29.3% |
| 25 to 29 Minutes | 214 | 8.6% |
| 30 to 34 Minutes | 383 | 15.5% |
| 35 to 39 Minutes | 12 | 0.5% |
| 40 to 44 Minutes | 114 | 4.6% |
| 45 to 59 Minutes | 264 | 10.7% |
| 60 to 89 Minutes | 155 | 6.3% |
| 90 or more Minutes | 0 | 0.0% |
Commute Time by Sex in Fortville
The most common commute times in Fortville are 20 to 24 minutes (274 commuters, 21.9%) for males and 20 to 24 minutes (451 commuters, 36.8%) for females.
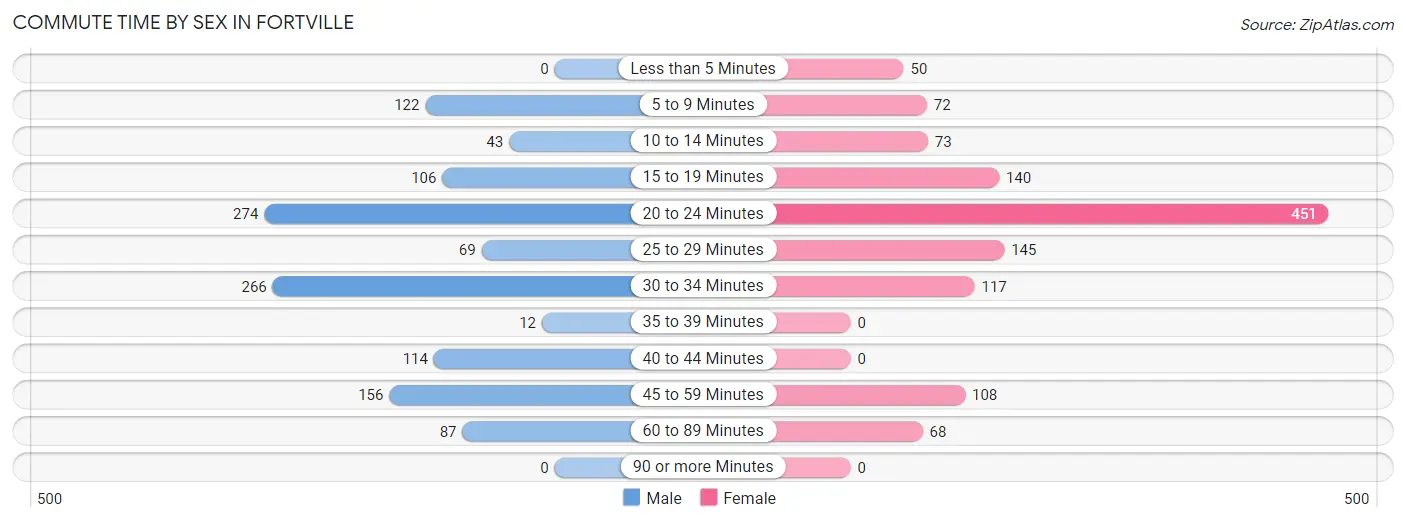
| Commute Time | Male | Female |
| Less than 5 Minutes | 0 (0.0%) | 50 (4.1%) |
| 5 to 9 Minutes | 122 (9.8%) | 72 (5.9%) |
| 10 to 14 Minutes | 43 (3.4%) | 73 (6.0%) |
| 15 to 19 Minutes | 106 (8.5%) | 140 (11.4%) |
| 20 to 24 Minutes | 274 (21.9%) | 451 (36.8%) |
| 25 to 29 Minutes | 69 (5.5%) | 145 (11.8%) |
| 30 to 34 Minutes | 266 (21.3%) | 117 (9.6%) |
| 35 to 39 Minutes | 12 (1.0%) | 0 (0.0%) |
| 40 to 44 Minutes | 114 (9.1%) | 0 (0.0%) |
| 45 to 59 Minutes | 156 (12.5%) | 108 (8.8%) |
| 60 to 89 Minutes | 87 (7.0%) | 68 (5.6%) |
| 90 or more Minutes | 0 (0.0%) | 0 (0.0%) |
Time of Departure to Work by Sex in Fortville
The most frequent times of departure to work in Fortville are 7:00 AM to 7:29 AM (465, 37.2%) for males and 7:00 AM to 7:29 AM (397, 32.4%) for females.
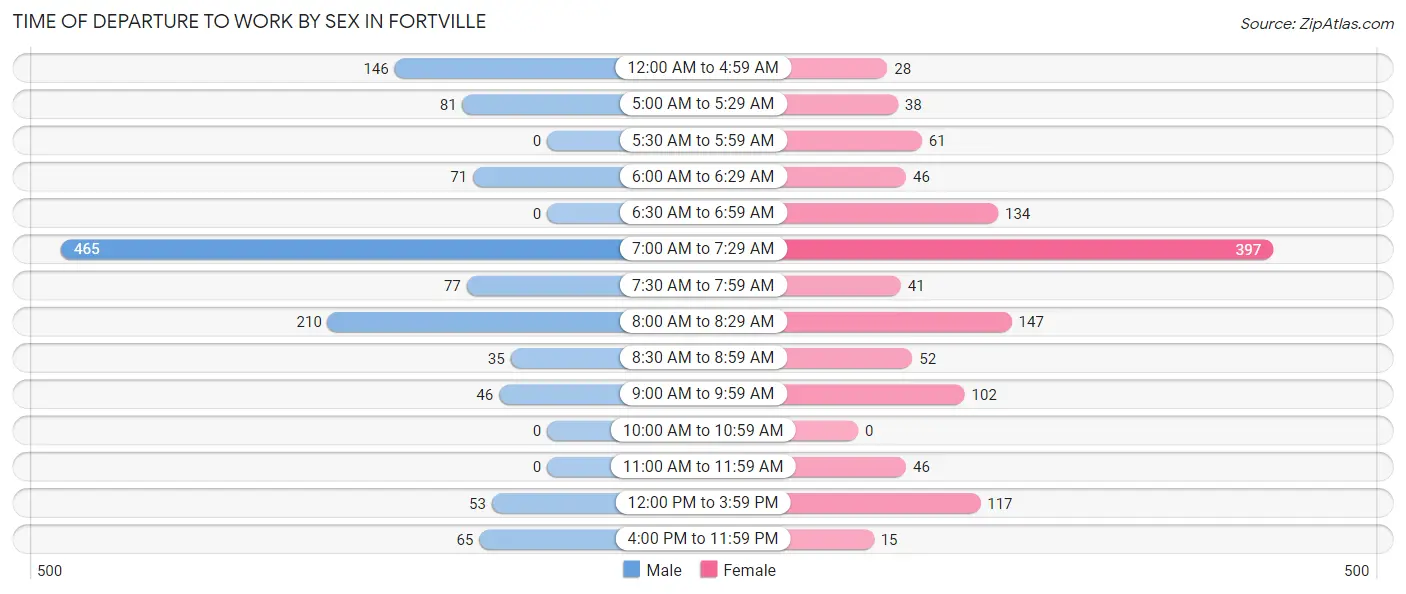
| Time of Departure | Male | Female |
| 12:00 AM to 4:59 AM | 146 (11.7%) | 28 (2.3%) |
| 5:00 AM to 5:29 AM | 81 (6.5%) | 38 (3.1%) |
| 5:30 AM to 5:59 AM | 0 (0.0%) | 61 (5.0%) |
| 6:00 AM to 6:29 AM | 71 (5.7%) | 46 (3.8%) |
| 6:30 AM to 6:59 AM | 0 (0.0%) | 134 (11.0%) |
| 7:00 AM to 7:29 AM | 465 (37.2%) | 397 (32.4%) |
| 7:30 AM to 7:59 AM | 77 (6.2%) | 41 (3.4%) |
| 8:00 AM to 8:29 AM | 210 (16.8%) | 147 (12.0%) |
| 8:30 AM to 8:59 AM | 35 (2.8%) | 52 (4.3%) |
| 9:00 AM to 9:59 AM | 46 (3.7%) | 102 (8.3%) |
| 10:00 AM to 10:59 AM | 0 (0.0%) | 0 (0.0%) |
| 11:00 AM to 11:59 AM | 0 (0.0%) | 46 (3.8%) |
| 12:00 PM to 3:59 PM | 53 (4.2%) | 117 (9.6%) |
| 4:00 PM to 11:59 PM | 65 (5.2%) | 15 (1.2%) |
| Total | 1,249 (100.0%) | 1,224 (100.0%) |
Housing Occupancy in Fortville
Occupancy by Ownership in Fortville
Of the total 1,871 dwellings in Fortville, owner-occupied units account for 1,359 (72.6%), while renter-occupied units make up 512 (27.4%).
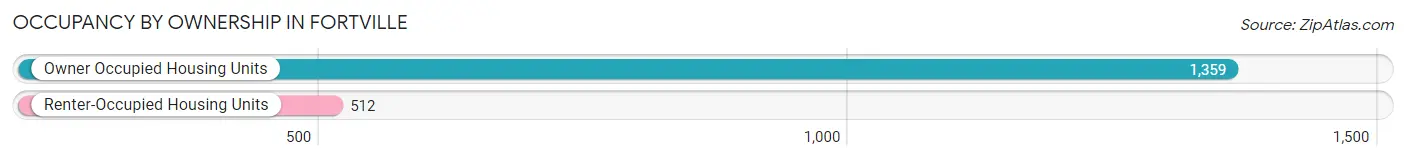
| Occupancy | # Housing Units | % Housing Units |
| Owner Occupied Housing Units | 1,359 | 72.6% |
| Renter-Occupied Housing Units | 512 | 27.4% |
| Total Occupied Housing Units | 1,871 | 100.0% |
Occupancy by Household Size in Fortville
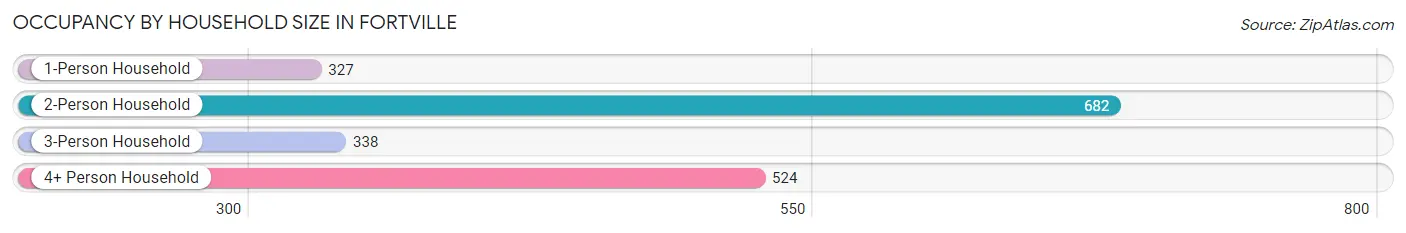
| Household Size | # Housing Units | % Housing Units |
| 1-Person Household | 327 | 17.5% |
| 2-Person Household | 682 | 36.4% |
| 3-Person Household | 338 | 18.1% |
| 4+ Person Household | 524 | 28.0% |
| Total Housing Units | 1,871 | 100.0% |
Occupancy by Ownership by Household Size in Fortville
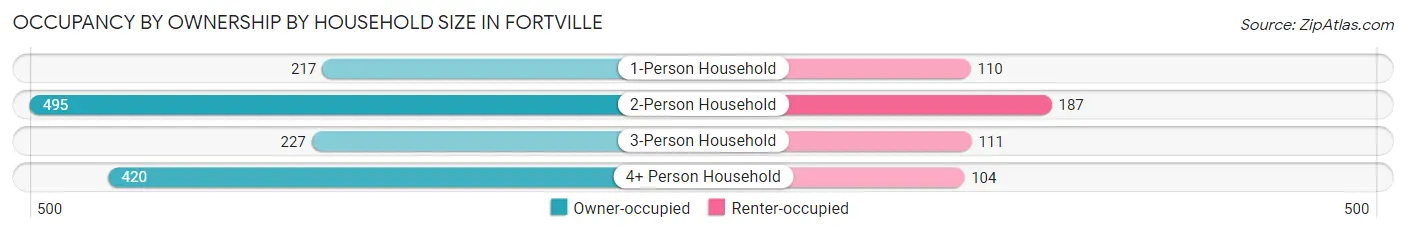
| Household Size | Owner-occupied | Renter-occupied |
| 1-Person Household | 217 (66.4%) | 110 (33.6%) |
| 2-Person Household | 495 (72.6%) | 187 (27.4%) |
| 3-Person Household | 227 (67.2%) | 111 (32.8%) |
| 4+ Person Household | 420 (80.1%) | 104 (19.9%) |
| Total Housing Units | 1,359 (72.6%) | 512 (27.4%) |
Occupancy by Educational Attainment in Fortville
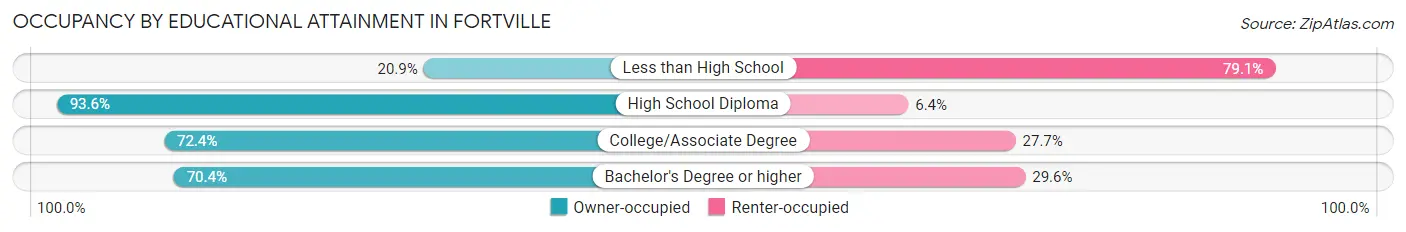
| Household Size | Owner-occupied | Renter-occupied |
| Less than High School | 51 (20.9%) | 193 (79.1%) |
| High School Diploma | 617 (93.6%) | 42 (6.4%) |
| College/Associate Degree | 348 (72.4%) | 133 (27.7%) |
| Bachelor's Degree or higher | 343 (70.4%) | 144 (29.6%) |
Occupancy by Age of Householder in Fortville
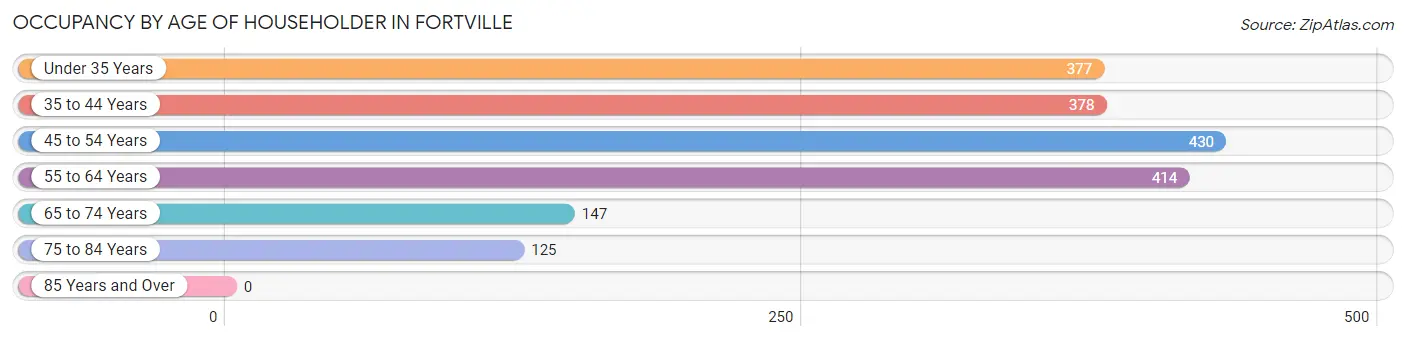
| Age Bracket | # Households | % Households |
| Under 35 Years | 377 | 20.2% |
| 35 to 44 Years | 378 | 20.2% |
| 45 to 54 Years | 430 | 23.0% |
| 55 to 64 Years | 414 | 22.1% |
| 65 to 74 Years | 147 | 7.9% |
| 75 to 84 Years | 125 | 6.7% |
| 85 Years and Over | 0 | 0.0% |
| Total | 1,871 | 100.0% |
Housing Finances in Fortville
Median Income by Occupancy in Fortville
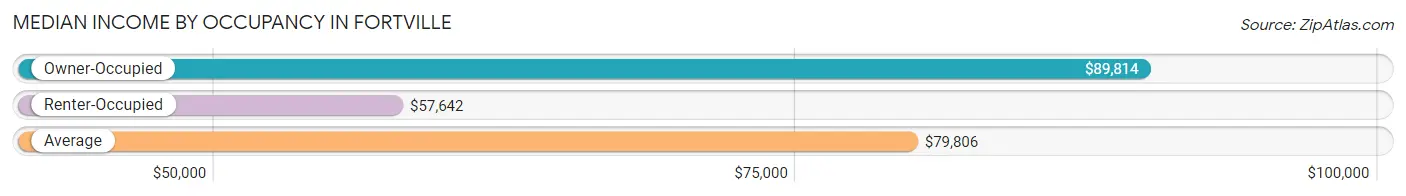
| Occupancy Type | # Households | Median Income |
| Owner-Occupied | 1,359 (72.6%) | $89,814 |
| Renter-Occupied | 512 (27.4%) | $57,642 |
| Average | 1,871 (100.0%) | $79,806 |
Occupancy by Householder Income Bracket in Fortville
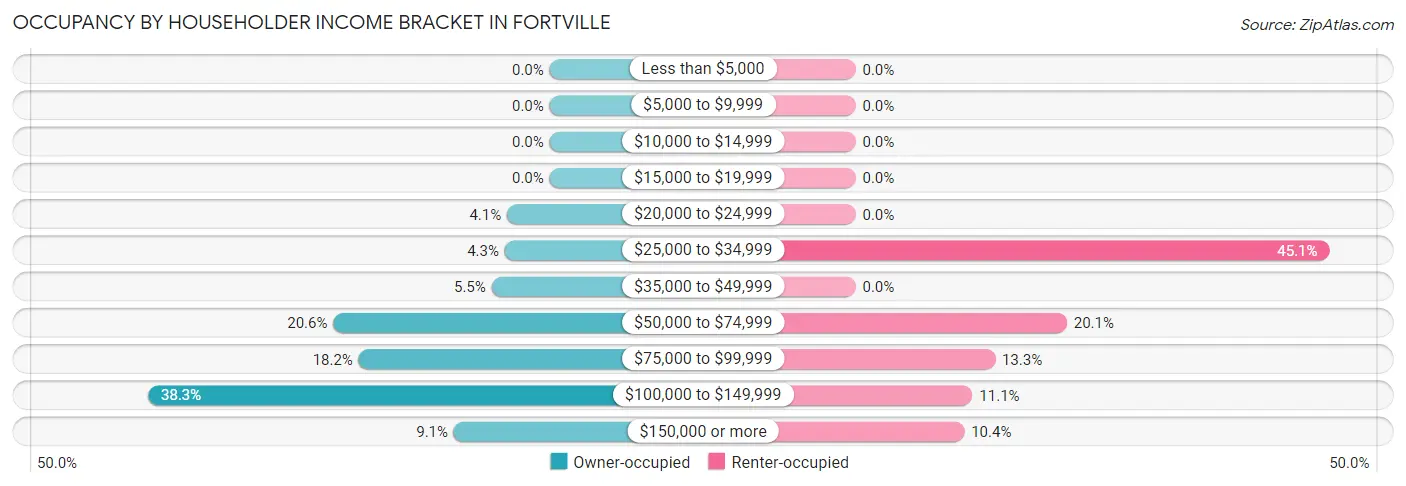
| Income Bracket | Owner-occupied | Renter-occupied |
| Less than $5,000 | 0 (0.0%) | 0 (0.0%) |
| $5,000 to $9,999 | 0 (0.0%) | 0 (0.0%) |
| $10,000 to $14,999 | 0 (0.0%) | 0 (0.0%) |
| $15,000 to $19,999 | 0 (0.0%) | 0 (0.0%) |
| $20,000 to $24,999 | 55 (4.1%) | 0 (0.0%) |
| $25,000 to $34,999 | 58 (4.3%) | 231 (45.1%) |
| $35,000 to $49,999 | 75 (5.5%) | 0 (0.0%) |
| $50,000 to $74,999 | 280 (20.6%) | 103 (20.1%) |
| $75,000 to $99,999 | 247 (18.2%) | 68 (13.3%) |
| $100,000 to $149,999 | 520 (38.3%) | 57 (11.1%) |
| $150,000 or more | 124 (9.1%) | 53 (10.3%) |
| Total | 1,359 (100.0%) | 512 (100.0%) |
Monthly Housing Cost Tiers in Fortville
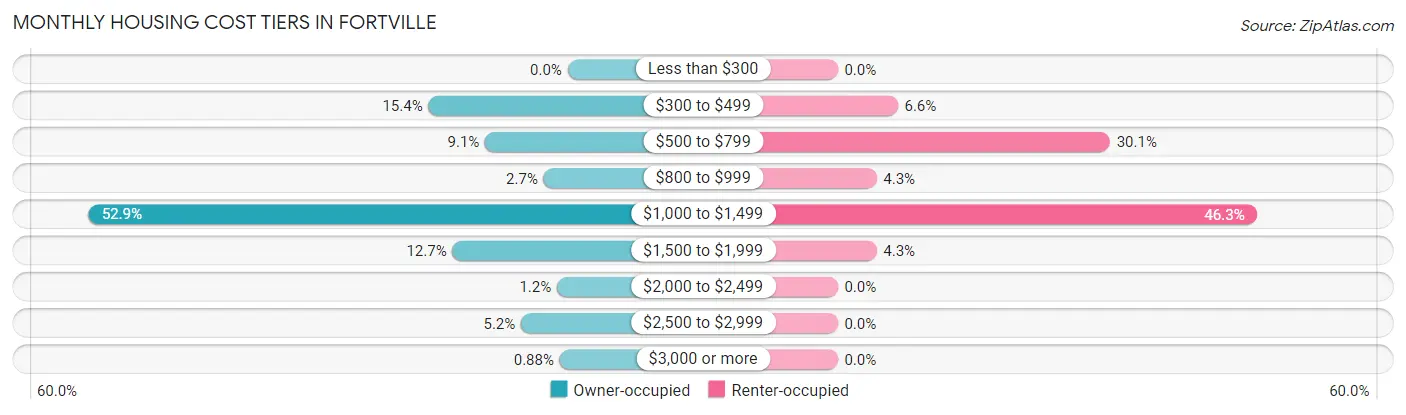
| Monthly Cost | Owner-occupied | Renter-occupied |
| Less than $300 | 0 (0.0%) | 0 (0.0%) |
| $300 to $499 | 209 (15.4%) | 34 (6.6%) |
| $500 to $799 | 124 (9.1%) | 154 (30.1%) |
| $800 to $999 | 36 (2.6%) | 22 (4.3%) |
| $1,000 to $1,499 | 719 (52.9%) | 237 (46.3%) |
| $1,500 to $1,999 | 173 (12.7%) | 22 (4.3%) |
| $2,000 to $2,499 | 16 (1.2%) | 0 (0.0%) |
| $2,500 to $2,999 | 70 (5.1%) | 0 (0.0%) |
| $3,000 or more | 12 (0.9%) | 0 (0.0%) |
| Total | 1,359 (100.0%) | 512 (100.0%) |
Physical Housing Characteristics in Fortville
Housing Structures in Fortville
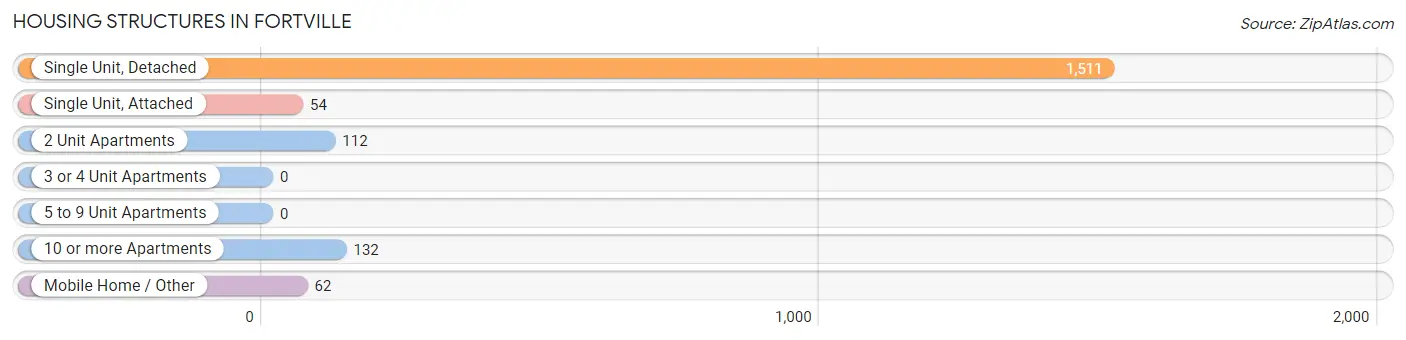
| Structure Type | # Housing Units | % Housing Units |
| Single Unit, Detached | 1,511 | 80.8% |
| Single Unit, Attached | 54 | 2.9% |
| 2 Unit Apartments | 112 | 6.0% |
| 3 or 4 Unit Apartments | 0 | 0.0% |
| 5 to 9 Unit Apartments | 0 | 0.0% |
| 10 or more Apartments | 132 | 7.1% |
| Mobile Home / Other | 62 | 3.3% |
| Total | 1,871 | 100.0% |
Housing Structures by Occupancy in Fortville
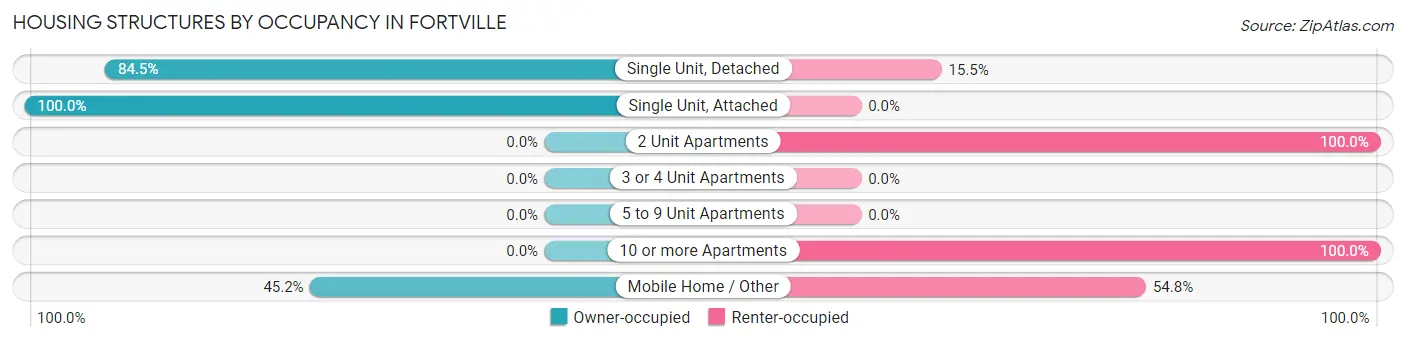
| Structure Type | Owner-occupied | Renter-occupied |
| Single Unit, Detached | 1,277 (84.5%) | 234 (15.5%) |
| Single Unit, Attached | 54 (100.0%) | 0 (0.0%) |
| 2 Unit Apartments | 0 (0.0%) | 112 (100.0%) |
| 3 or 4 Unit Apartments | 0 (0.0%) | 0 (0.0%) |
| 5 to 9 Unit Apartments | 0 (0.0%) | 0 (0.0%) |
| 10 or more Apartments | 0 (0.0%) | 132 (100.0%) |
| Mobile Home / Other | 28 (45.2%) | 34 (54.8%) |
| Total | 1,359 (72.6%) | 512 (27.4%) |
Housing Structures by Number of Rooms in Fortville
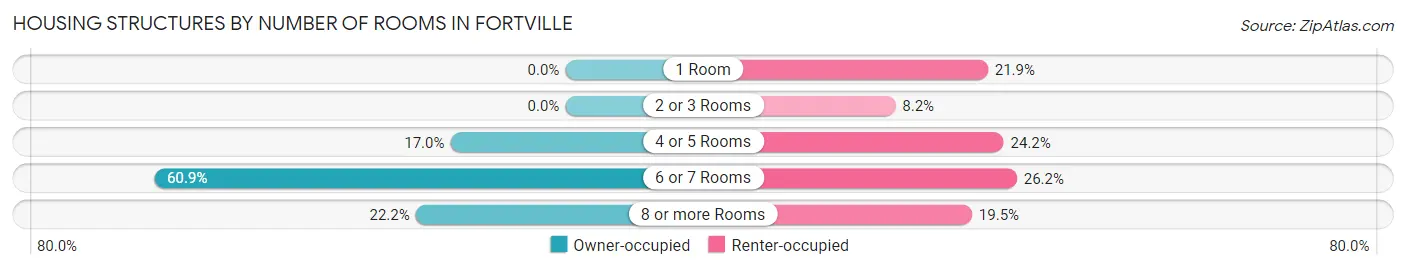
| Number of Rooms | Owner-occupied | Renter-occupied |
| 1 Room | 0 (0.0%) | 112 (21.9%) |
| 2 or 3 Rooms | 0 (0.0%) | 42 (8.2%) |
| 4 or 5 Rooms | 231 (17.0%) | 124 (24.2%) |
| 6 or 7 Rooms | 827 (60.9%) | 134 (26.2%) |
| 8 or more Rooms | 301 (22.2%) | 100 (19.5%) |
| Total | 1,359 (100.0%) | 512 (100.0%) |
Housing Structure by Heating Type in Fortville
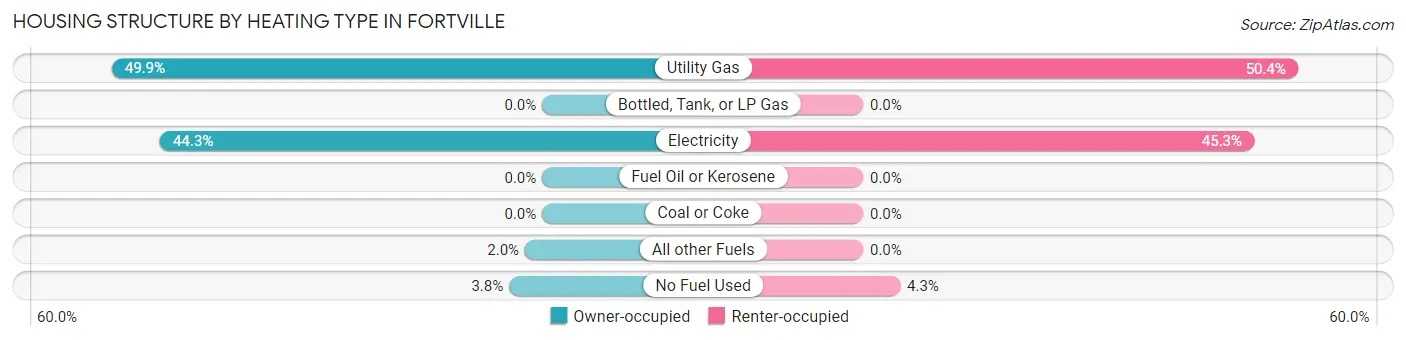
| Heating Type | Owner-occupied | Renter-occupied |
| Utility Gas | 678 (49.9%) | 258 (50.4%) |
| Bottled, Tank, or LP Gas | 0 (0.0%) | 0 (0.0%) |
| Electricity | 602 (44.3%) | 232 (45.3%) |
| Fuel Oil or Kerosene | 0 (0.0%) | 0 (0.0%) |
| Coal or Coke | 0 (0.0%) | 0 (0.0%) |
| All other Fuels | 27 (2.0%) | 0 (0.0%) |
| No Fuel Used | 52 (3.8%) | 22 (4.3%) |
| Total | 1,359 (100.0%) | 512 (100.0%) |
Household Vehicle Usage in Fortville
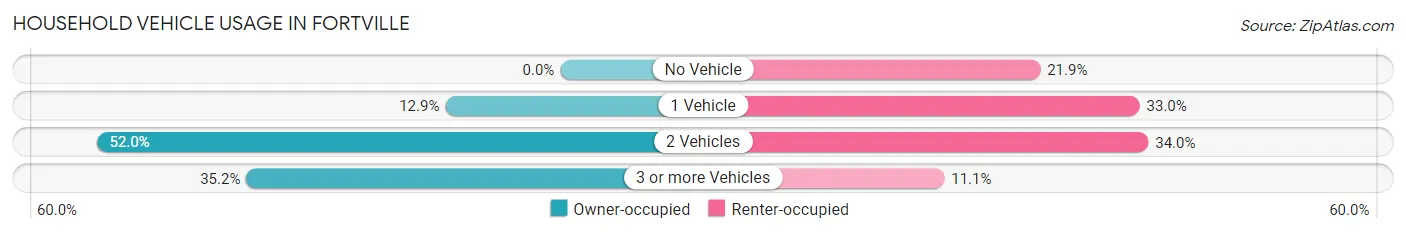
| Vehicles per Household | Owner-occupied | Renter-occupied |
| No Vehicle | 0 (0.0%) | 112 (21.9%) |
| 1 Vehicle | 175 (12.9%) | 169 (33.0%) |
| 2 Vehicles | 706 (51.9%) | 174 (34.0%) |
| 3 or more Vehicles | 478 (35.2%) | 57 (11.1%) |
| Total | 1,359 (100.0%) | 512 (100.0%) |
Real Estate & Mortgages in Fortville
Real Estate and Mortgage Overview in Fortville
| Characteristic | Without Mortgage | With Mortgage |
| Housing Units | 291 | 1,068 |
| Median Property Value | $236,400 | $213,200 |
| Median Household Income | $70,989 | $83 |
| Monthly Housing Costs | $433 | $12 |
| Real Estate Taxes | $1,786 | $14 |
Property Value by Mortgage Status in Fortville
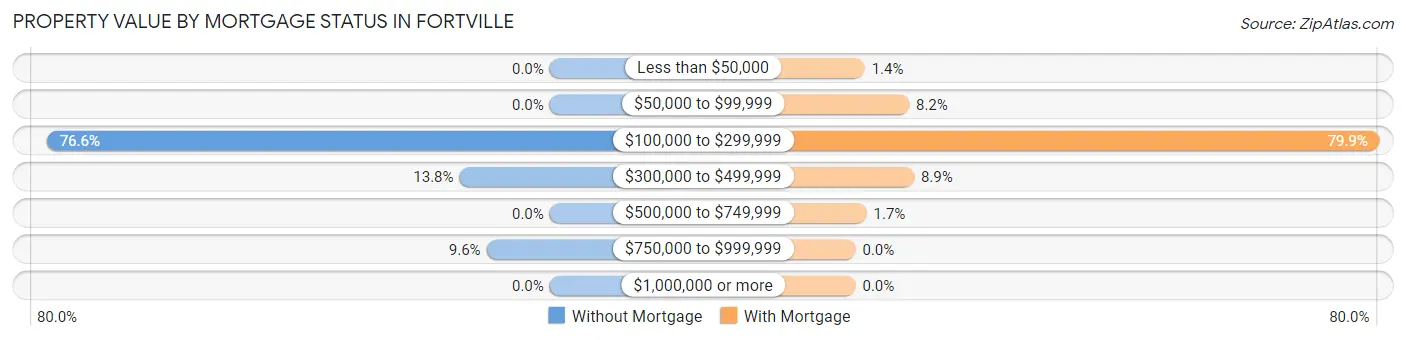
| Property Value | Without Mortgage | With Mortgage |
| Less than $50,000 | 0 (0.0%) | 15 (1.4%) |
| $50,000 to $99,999 | 0 (0.0%) | 87 (8.2%) |
| $100,000 to $299,999 | 223 (76.6%) | 853 (79.9%) |
| $300,000 to $499,999 | 40 (13.8%) | 95 (8.9%) |
| $500,000 to $749,999 | 0 (0.0%) | 18 (1.7%) |
| $750,000 to $999,999 | 28 (9.6%) | 0 (0.0%) |
| $1,000,000 or more | 0 (0.0%) | 0 (0.0%) |
| Total | 291 (100.0%) | 1,068 (100.0%) |
Household Income by Mortgage Status in Fortville
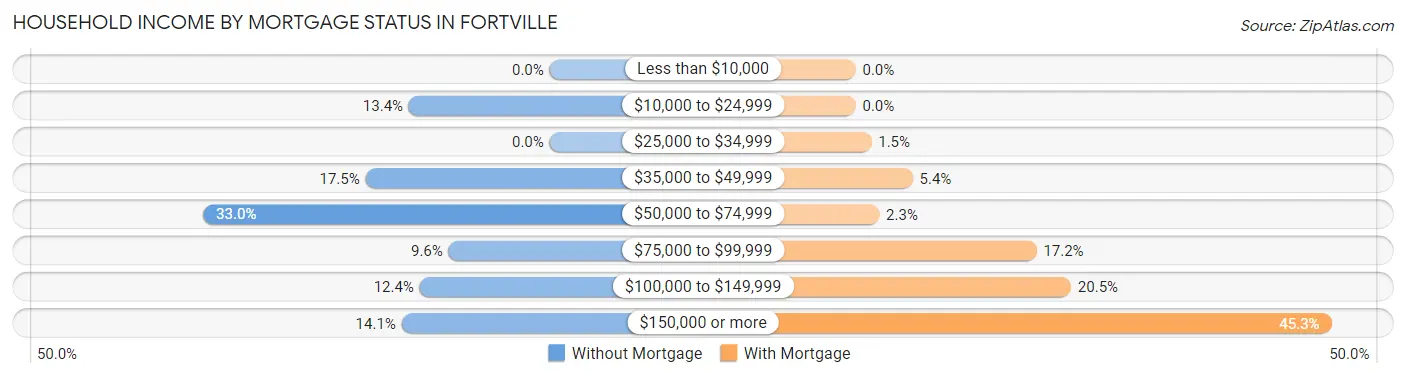
| Household Income | Without Mortgage | With Mortgage |
| Less than $10,000 | 0 (0.0%) | 0 (0.0%) |
| $10,000 to $24,999 | 39 (13.4%) | 0 (0.0%) |
| $25,000 to $34,999 | 0 (0.0%) | 16 (1.5%) |
| $35,000 to $49,999 | 51 (17.5%) | 58 (5.4%) |
| $50,000 to $74,999 | 96 (33.0%) | 24 (2.2%) |
| $75,000 to $99,999 | 28 (9.6%) | 184 (17.2%) |
| $100,000 to $149,999 | 36 (12.4%) | 219 (20.5%) |
| $150,000 or more | 41 (14.1%) | 484 (45.3%) |
| Total | 291 (100.0%) | 1,068 (100.0%) |
Property Value to Household Income Ratio in Fortville
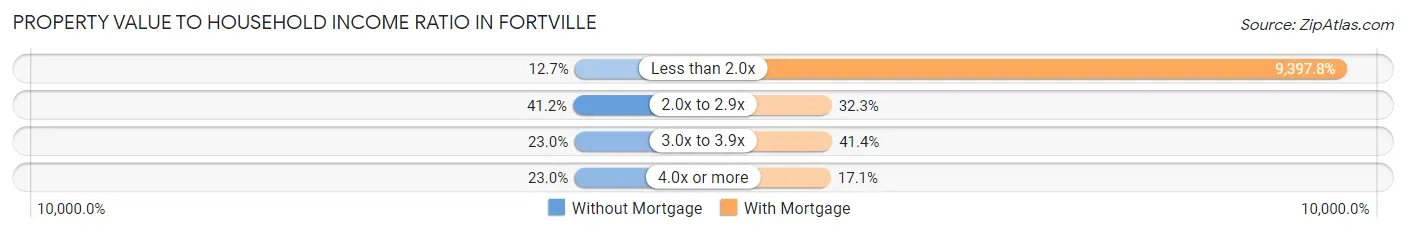
| Value-to-Income Ratio | Without Mortgage | With Mortgage |
| Less than 2.0x | 37 (12.7%) | 100,368 (9,397.8%) |
| 2.0x to 2.9x | 120 (41.2%) | 345 (32.3%) |
| 3.0x to 3.9x | 67 (23.0%) | 442 (41.4%) |
| 4.0x or more | 67 (23.0%) | 183 (17.1%) |
| Total | 291 (100.0%) | 1,068 (100.0%) |
Real Estate Taxes by Mortgage Status in Fortville
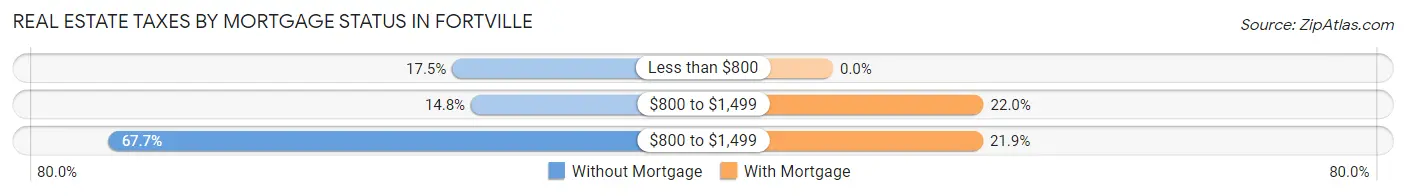
| Property Taxes | Without Mortgage | With Mortgage |
| Less than $800 | 51 (17.5%) | 0 (0.0%) |
| $800 to $1,499 | 43 (14.8%) | 235 (22.0%) |
| $800 to $1,499 | 197 (67.7%) | 234 (21.9%) |
| Total | 291 (100.0%) | 1,068 (100.0%) |
Health & Disability in Fortville
Health Insurance Coverage by Age in Fortville
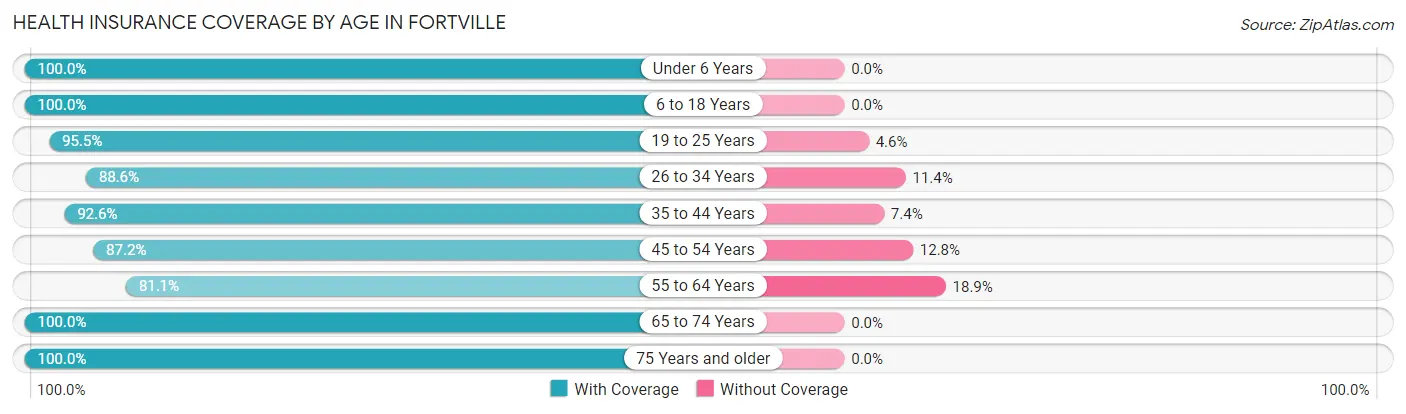
| Age Bracket | With Coverage | Without Coverage |
| Under 6 Years | 462 (100.0%) | 0 (0.0%) |
| 6 to 18 Years | 1,100 (100.0%) | 0 (0.0%) |
| 19 to 25 Years | 525 (95.5%) | 25 (4.5%) |
| 26 to 34 Years | 582 (88.6%) | 75 (11.4%) |
| 35 to 44 Years | 539 (92.6%) | 43 (7.4%) |
| 45 to 54 Years | 641 (87.2%) | 94 (12.8%) |
| 55 to 64 Years | 554 (81.1%) | 129 (18.9%) |
| 65 to 74 Years | 242 (100.0%) | 0 (0.0%) |
| 75 Years and older | 195 (100.0%) | 0 (0.0%) |
| Total | 4,840 (93.0%) | 366 (7.0%) |
Health Insurance Coverage by Citizenship Status in Fortville
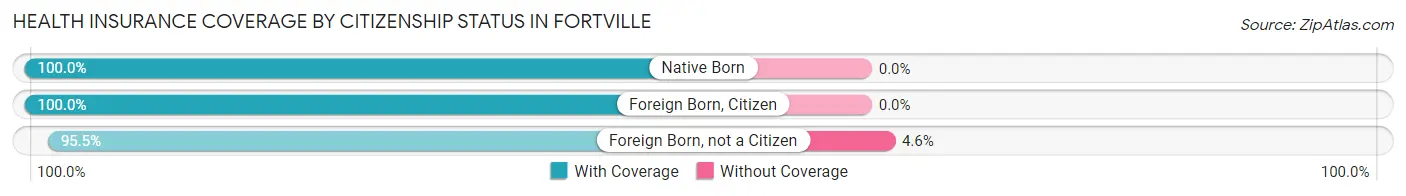
| Citizenship Status | With Coverage | Without Coverage |
| Native Born | 462 (100.0%) | 0 (0.0%) |
| Foreign Born, Citizen | 1,100 (100.0%) | 0 (0.0%) |
| Foreign Born, not a Citizen | 525 (95.5%) | 25 (4.5%) |
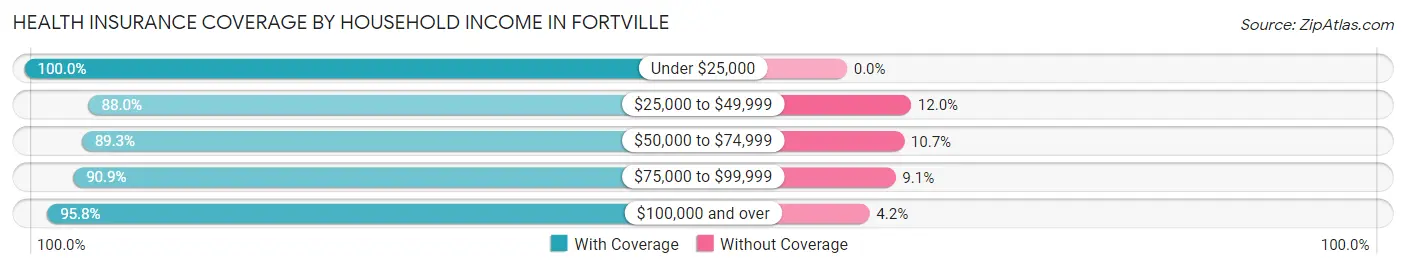
Health Insurance Coverage by Household Income in Fortville
| Household Income | With Coverage | Without Coverage |
| Under $25,000 | 55 (100.0%) | 0 (0.0%) |
| $25,000 to $49,999 | 623 (88.0%) | 85 (12.0%) |
| $50,000 to $74,999 | 726 (89.3%) | 87 (10.7%) |
| $75,000 to $99,999 | 748 (90.9%) | 75 (9.1%) |
| $100,000 and over | 2,688 (95.8%) | 119 (4.2%) |
Public vs Private Health Insurance Coverage by Age in Fortville
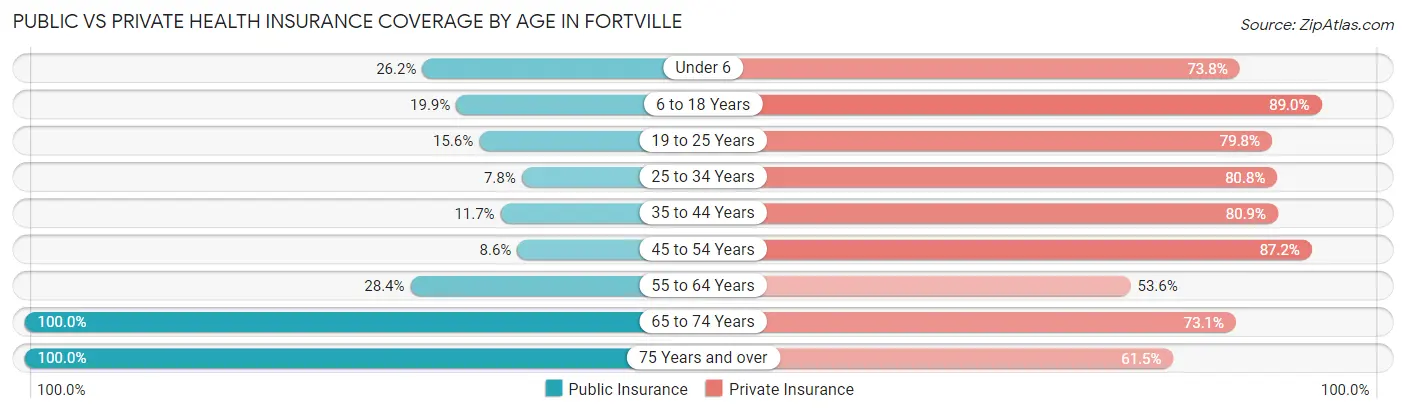
| Age Bracket | Public Insurance | Private Insurance |
| Under 6 | 121 (26.2%) | 341 (73.8%) |
| 6 to 18 Years | 219 (19.9%) | 979 (89.0%) |
| 19 to 25 Years | 86 (15.6%) | 439 (79.8%) |
| 25 to 34 Years | 51 (7.8%) | 531 (80.8%) |
| 35 to 44 Years | 68 (11.7%) | 471 (80.9%) |
| 45 to 54 Years | 63 (8.6%) | 641 (87.2%) |
| 55 to 64 Years | 194 (28.4%) | 366 (53.6%) |
| 65 to 74 Years | 242 (100.0%) | 177 (73.1%) |
| 75 Years and over | 195 (100.0%) | 120 (61.5%) |
| Total | 1,239 (23.8%) | 4,065 (78.1%) |
Disability Status by Sex by Age in Fortville
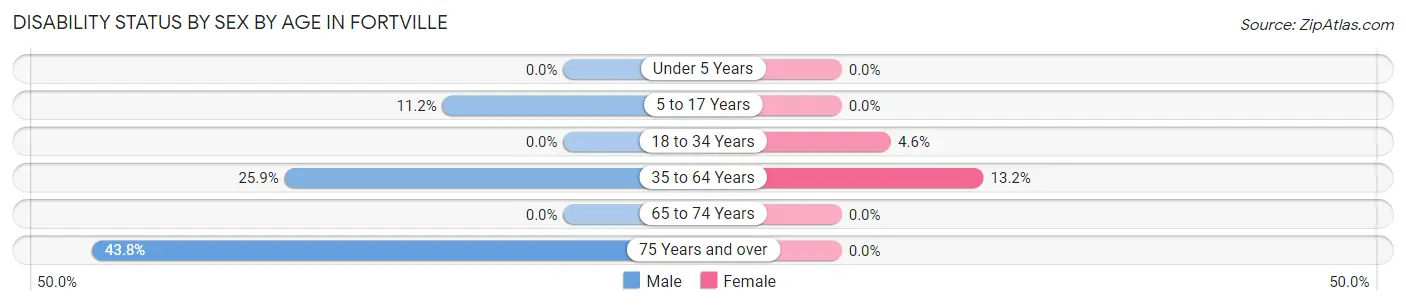
| Age Bracket | Male | Female |
| Under 5 Years | 0 (0.0%) | 0 (0.0%) |
| 5 to 17 Years | 48 (11.2%) | 0 (0.0%) |
| 18 to 34 Years | 0 (0.0%) | 35 (4.6%) |
| 35 to 64 Years | 256 (25.9%) | 133 (13.2%) |
| 65 to 74 Years | 0 (0.0%) | 0 (0.0%) |
| 75 Years and over | 42 (43.8%) | 0 (0.0%) |
Disability Class by Sex by Age in Fortville
Disability Class: Hearing Difficulty
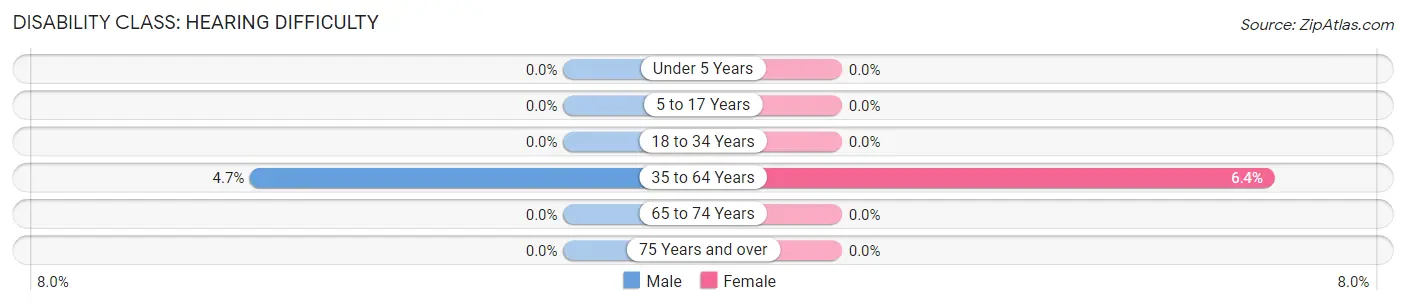
| Age Bracket | Male | Female |
| Under 5 Years | 0 (0.0%) | 0 (0.0%) |
| 5 to 17 Years | 0 (0.0%) | 0 (0.0%) |
| 18 to 34 Years | 0 (0.0%) | 0 (0.0%) |
| 35 to 64 Years | 46 (4.6%) | 65 (6.4%) |
| 65 to 74 Years | 0 (0.0%) | 0 (0.0%) |
| 75 Years and over | 0 (0.0%) | 0 (0.0%) |
Disability Class: Vision Difficulty
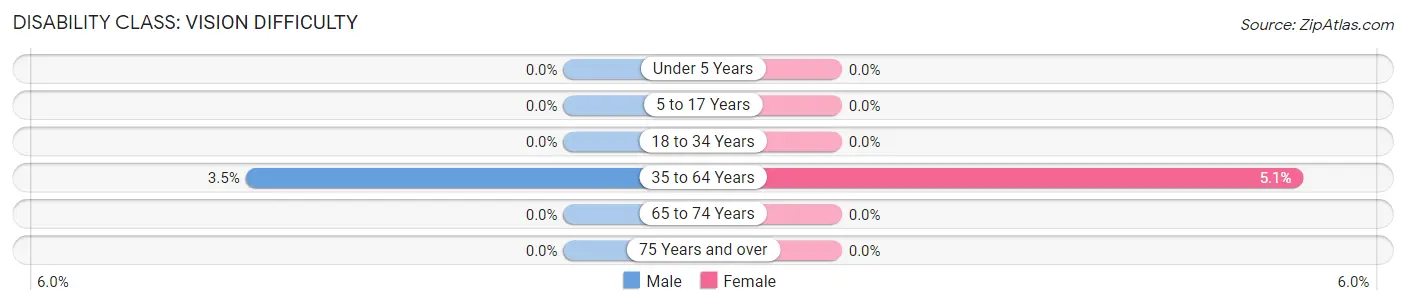
| Age Bracket | Male | Female |
| Under 5 Years | 0 (0.0%) | 0 (0.0%) |
| 5 to 17 Years | 0 (0.0%) | 0 (0.0%) |
| 18 to 34 Years | 0 (0.0%) | 0 (0.0%) |
| 35 to 64 Years | 35 (3.5%) | 52 (5.1%) |
| 65 to 74 Years | 0 (0.0%) | 0 (0.0%) |
| 75 Years and over | 0 (0.0%) | 0 (0.0%) |
Disability Class: Cognitive Difficulty
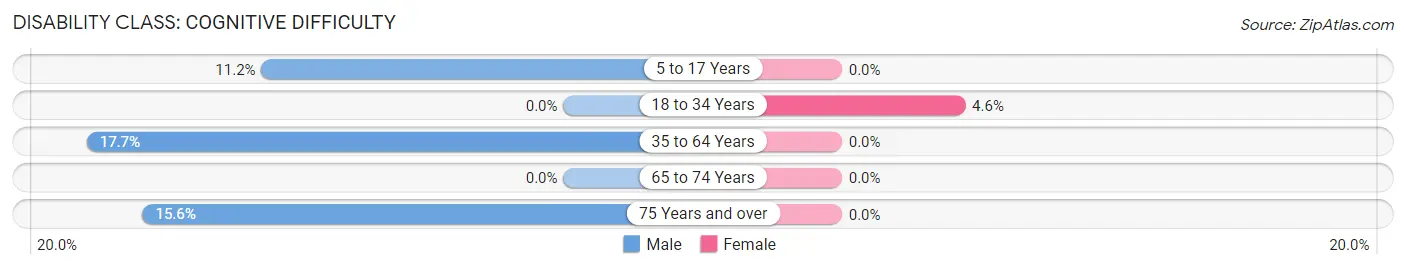
| Age Bracket | Male | Female |
| 5 to 17 Years | 48 (11.2%) | 0 (0.0%) |
| 18 to 34 Years | 0 (0.0%) | 35 (4.6%) |
| 35 to 64 Years | 175 (17.7%) | 0 (0.0%) |
| 65 to 74 Years | 0 (0.0%) | 0 (0.0%) |
| 75 Years and over | 15 (15.6%) | 0 (0.0%) |
Disability Class: Ambulatory Difficulty
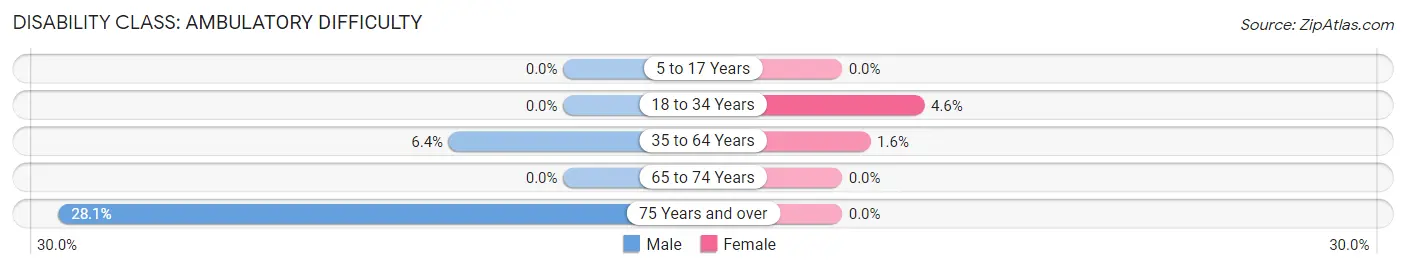
| Age Bracket | Male | Female |
| 5 to 17 Years | 0 (0.0%) | 0 (0.0%) |
| 18 to 34 Years | 0 (0.0%) | 35 (4.6%) |
| 35 to 64 Years | 63 (6.4%) | 16 (1.6%) |
| 65 to 74 Years | 0 (0.0%) | 0 (0.0%) |
| 75 Years and over | 27 (28.1%) | 0 (0.0%) |
Disability Class: Self-Care Difficulty
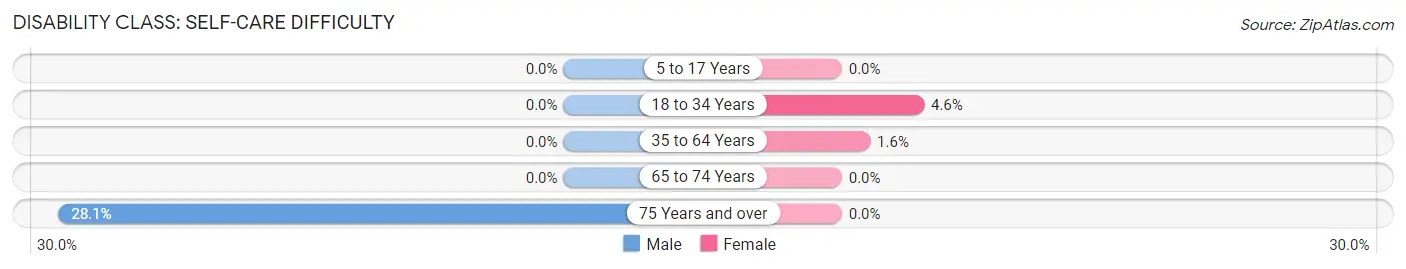
| Age Bracket | Male | Female |
| 5 to 17 Years | 0 (0.0%) | 0 (0.0%) |
| 18 to 34 Years | 0 (0.0%) | 35 (4.6%) |
| 35 to 64 Years | 0 (0.0%) | 16 (1.6%) |
| 65 to 74 Years | 0 (0.0%) | 0 (0.0%) |
| 75 Years and over | 27 (28.1%) | 0 (0.0%) |
Technology Access in Fortville
Computing Device Access in Fortville
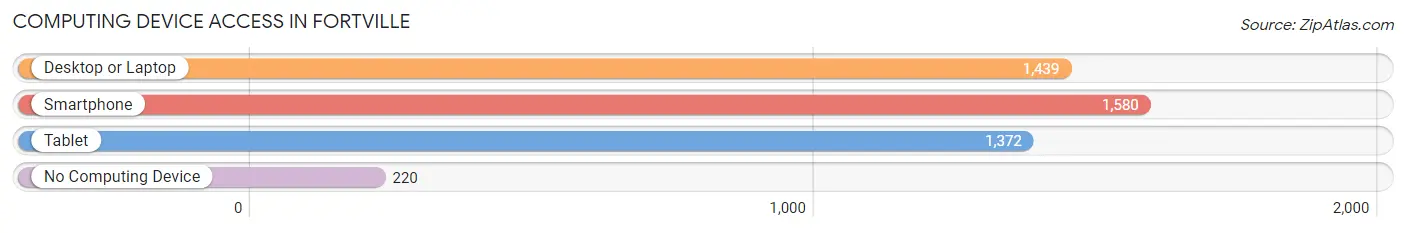
| Device Type | # Households | % Households |
| Desktop or Laptop | 1,439 | 76.9% |
| Smartphone | 1,580 | 84.5% |
| Tablet | 1,372 | 73.3% |
| No Computing Device | 220 | 11.8% |
| Total | 1,871 | 100.0% |
Internet Access in Fortville
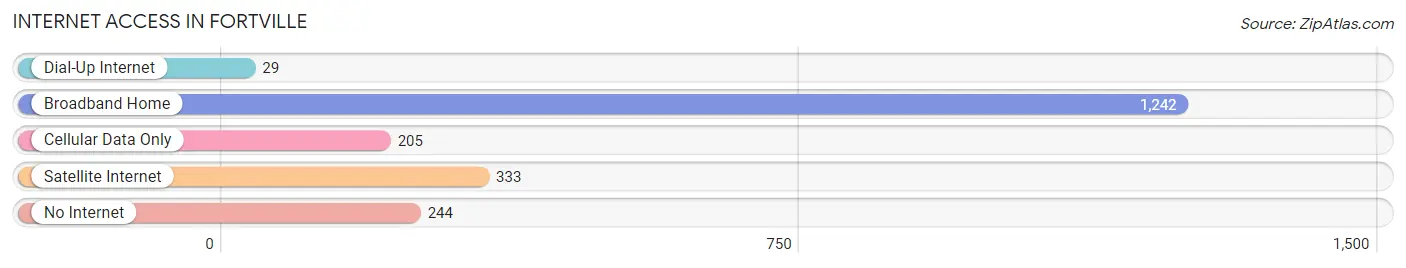
| Internet Type | # Households | % Households |
| Dial-Up Internet | 29 | 1.5% |
| Broadband Home | 1,242 | 66.4% |
| Cellular Data Only | 205 | 11.0% |
| Satellite Internet | 333 | 17.8% |
| No Internet | 244 | 13.0% |
| Total | 1,871 | 100.0% |
Fortville Summary
Fortville is a small town located in Hancock County, Indiana. It is situated in the northeast corner of the state, about 20 miles northeast of Indianapolis. The town was founded in 1851 and has a population of approximately 2,500 people.
History
Fortville was founded in 1851 by a group of settlers from Fort Wayne, Indiana. The town was named after the fort that was built in the area in 1812 during the War of 1812. The fort was used to protect settlers from Native American attacks. The town was incorporated in 1871 and has remained a small, rural community ever since.
The town was home to a number of businesses in the late 19th and early 20th centuries, including a flour mill, a sawmill, a grist mill, a blacksmith shop, a general store, and a hotel. The town also had a post office, a bank, and a newspaper.
Geography
Fortville is located in the northeast corner of Hancock County, Indiana. It is situated about 20 miles northeast of Indianapolis. The town is located on the banks of the White River, which flows through the area. The town is surrounded by farmland and is located near the town of McCordsville.
The town has a total area of 1.2 square miles, all of which is land. The town has a humid continental climate, with hot summers and cold winters. The average temperature in the summer is around 75 degrees Fahrenheit, and the average temperature in the winter is around 30 degrees Fahrenheit.
Economy
The economy of Fortville is largely based on agriculture. The town is home to a number of farms, which produce corn, soybeans, wheat, and other crops. The town also has a number of small businesses, including restaurants, retail stores, and service providers.
The town is also home to a number of manufacturing companies, including a plastics manufacturer, a metal fabricator, and a machine shop. The town is also home to a number of technology companies, including a software development company and a web design firm.
Demographics
As of the 2010 census, the population of Fortville was 2,521. The town has a median household income of $50,000 and a median family income of $60,000. The town has a population that is predominantly white (94.3%), with a small percentage of African Americans (2.2%) and Hispanics (2.2%).
The town has a high school graduation rate of 95.3%, and the town has a low unemployment rate of 3.2%. The town also has a low crime rate, with only 0.3 violent crimes per 1,000 people.
Conclusion
Fortville is a small town located in Hancock County, Indiana. It was founded in 1851 and has a population of approximately 2,500 people. The town has a largely agricultural economy, with a number of small businesses and manufacturing companies. The town has a predominantly white population, with a median household income of $50,000 and a high school graduation rate of 95.3%. The town also has a low crime rate and a low unemployment rate.
Common Questions
What is Per Capita Income in Fortville?
Per Capita income in Fortville is $34,236.
What is the Median Family Income in Fortville?
Median Family Income in Fortville is $80,000.
What is the Median Household income in Fortville?
Median Household Income in Fortville is $79,806.
What is Income or Wage Gap in Fortville?
Income or Wage Gap in Fortville is 38.8%.
Women in Fortville earn 61.2 cents for every dollar earned by a man.
What is Inequality or Gini Index in Fortville?
Inequality or Gini Index in Fortville is 0.31.
What is the Total Population of Fortville?
Total Population of Fortville is 5,206.
What is the Total Male Population of Fortville?
Total Male Population of Fortville is 2,383.
What is the Total Female Population of Fortville?
Total Female Population of Fortville is 2,823.
What is the Ratio of Males per 100 Females in Fortville?
There are 84.41 Males per 100 Females in Fortville.
What is the Ratio of Females per 100 Males in Fortville?
There are 118.46 Females per 100 Males in Fortville.
What is the Median Population Age in Fortville?
Median Population Age in Fortville is 32.8 Years.
What is the Average Family Size in Fortville
Average Family Size in Fortville is 3.1 People.
What is the Average Household Size in Fortville
Average Household Size in Fortville is 2.8 People.
How Large is the Labor Force in Fortville?
There are 2,942 People in the Labor Forcein in Fortville.
What is the Percentage of People in the Labor Force in Fortville?
71.5% of People are in the Labor Force in Fortville.
What is the Unemployment Rate in Fortville?
Unemployment Rate in Fortville is 5.2%.