English, IN Map & Demographics
English Map
English Overview
$13,285
PER CAPITA INCOME
$43,333
AVG FAMILY INCOME
$26,599
AVG HOUSEHOLD INCOME
14.3%
WAGE / INCOME GAP [ % ]
85.7¢/ $1
WAGE / INCOME GAP [ $ ]
$15,359
FAMILY INCOME DEFICIT
0.47
INEQUALITY / GINI INDEX
1,101
TOTAL POPULATION
564
MALE POPULATION
537
FEMALE POPULATION
105.03
MALES / 100 FEMALES
95.21
FEMALES / 100 MALES
26.3
MEDIAN AGE
5.4
AVG FAMILY SIZE
3.2
AVG HOUSEHOLD SIZE
299
LABOR FORCE [ PEOPLE ]
47.8%
PERCENT IN LABOR FORCE
3.0%
UNEMPLOYMENT RATE
English Zip Codes
English Area Codes
Income in English
Income Overview in English
Per Capita Income in English is $13,285, while median incomes of families and households are $43,333 and $26,599 respectively.
| Characteristic | Number | Measure |
| Per Capita Income | 1,101 | $13,285 |
| Median Family Income | 168 | $43,333 |
| Mean Family Income | 168 | $53,243 |
| Median Household Income | 341 | $26,599 |
| Mean Household Income | 341 | $39,916 |
| Income Deficit | 168 | $15,359 |
| Wage / Income Gap (%) | 1,101 | 14.28% |
| Wage / Income Gap ($) | 1,101 | 85.72¢ per $1 |
| Gini / Inequality Index | 1,101 | 0.47 |
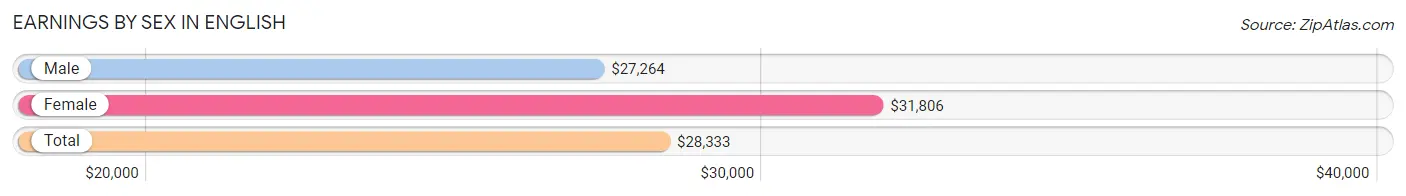
Earnings by Sex in English
Average Earnings in English are $28,333, $27,264 for men and $31,806 for women, a difference of 14.3%.
| Sex | Number | Average Earnings |
| Male | 203 (63.0%) | $27,264 |
| Female | 119 (37.0%) | $31,806 |
| Total | 322 (100.0%) | $28,333 |
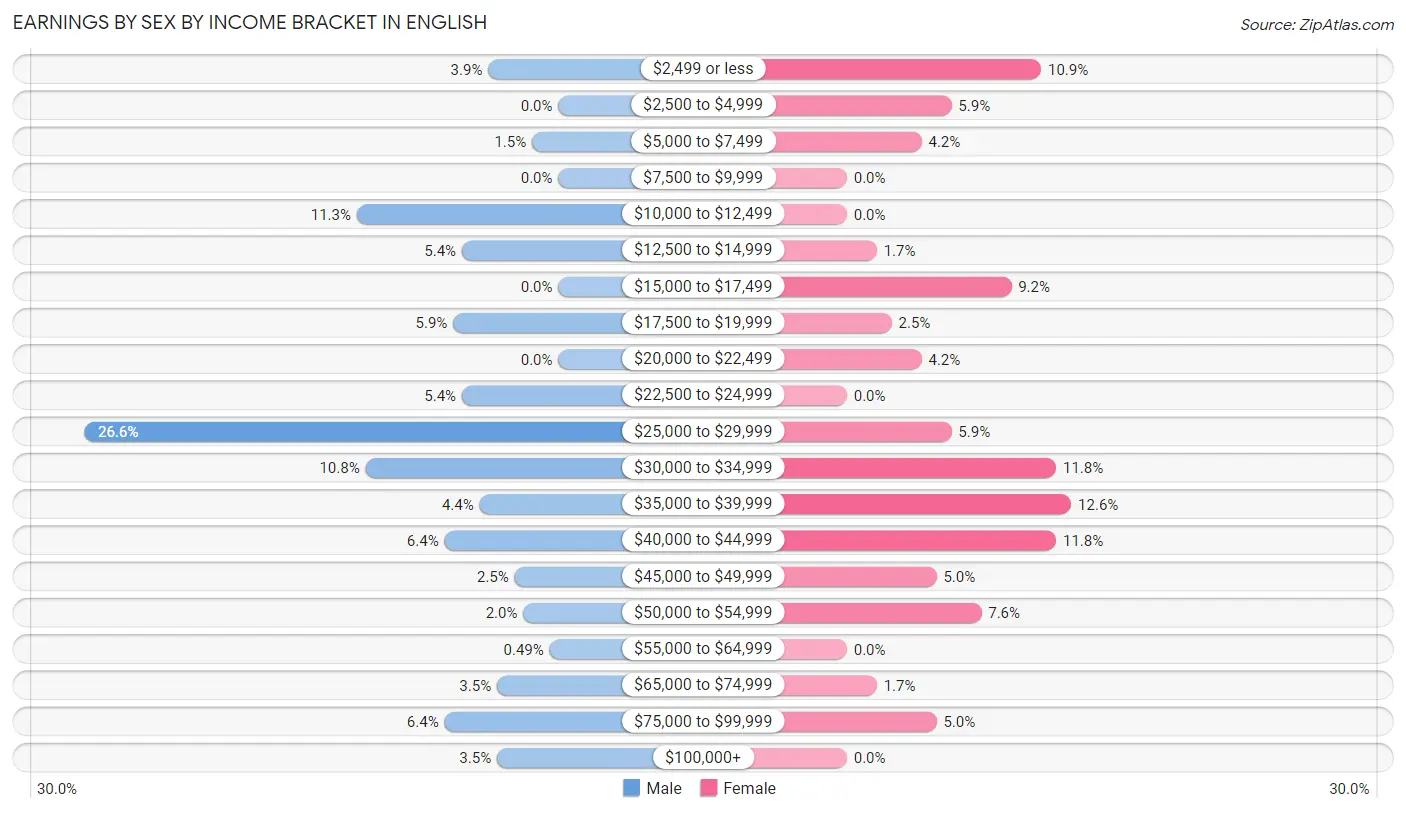
Earnings by Sex by Income Bracket in English
The most common earnings brackets in English are $25,000 to $29,999 for men (54 | 26.6%) and $35,000 to $39,999 for women (15 | 12.6%).
| Income | Male | Female |
| $2,499 or less | 8 (3.9%) | 13 (10.9%) |
| $2,500 to $4,999 | 0 (0.0%) | 7 (5.9%) |
| $5,000 to $7,499 | 3 (1.5%) | 5 (4.2%) |
| $7,500 to $9,999 | 0 (0.0%) | 0 (0.0%) |
| $10,000 to $12,499 | 23 (11.3%) | 0 (0.0%) |
| $12,500 to $14,999 | 11 (5.4%) | 2 (1.7%) |
| $15,000 to $17,499 | 0 (0.0%) | 11 (9.2%) |
| $17,500 to $19,999 | 12 (5.9%) | 3 (2.5%) |
| $20,000 to $22,499 | 0 (0.0%) | 5 (4.2%) |
| $22,500 to $24,999 | 11 (5.4%) | 0 (0.0%) |
| $25,000 to $29,999 | 54 (26.6%) | 7 (5.9%) |
| $30,000 to $34,999 | 22 (10.8%) | 14 (11.8%) |
| $35,000 to $39,999 | 9 (4.4%) | 15 (12.6%) |
| $40,000 to $44,999 | 13 (6.4%) | 14 (11.8%) |
| $45,000 to $49,999 | 5 (2.5%) | 6 (5.0%) |
| $50,000 to $54,999 | 4 (2.0%) | 9 (7.6%) |
| $55,000 to $64,999 | 1 (0.5%) | 0 (0.0%) |
| $65,000 to $74,999 | 7 (3.5%) | 2 (1.7%) |
| $75,000 to $99,999 | 13 (6.4%) | 6 (5.0%) |
| $100,000+ | 7 (3.5%) | 0 (0.0%) |
| Total | 203 (100.0%) | 119 (100.0%) |
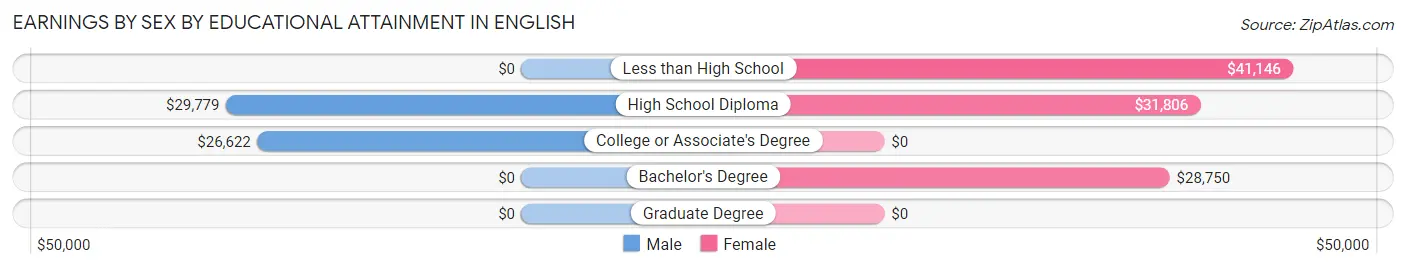
Earnings by Sex by Educational Attainment in English
Average earnings in English are $28,015 for men and $32,500 for women, a difference of 13.8%. Men with an educational attainment of high school diploma enjoy the highest average annual earnings of $29,779, while those with college or associate's degree education earn the least with $26,622. Women with an educational attainment of less than high school earn the most with the average annual earnings of $41,146, while those with bachelor's degree education have the smallest earnings of $28,750.
| Educational Attainment | Male Income | Female Income |
| Less than High School | - | - |
| High School Diploma | $29,779 | $31,806 |
| College or Associate's Degree | $26,622 | $0 |
| Bachelor's Degree | - | - |
| Graduate Degree | - | - |
| Total | $28,015 | $32,500 |
Family Income in English
Family Income Brackets in English
According to the English family income data, there are 30 families falling into the $15,000 to $24,999 income range, which is the most common income bracket and makes up 17.9% of all families.
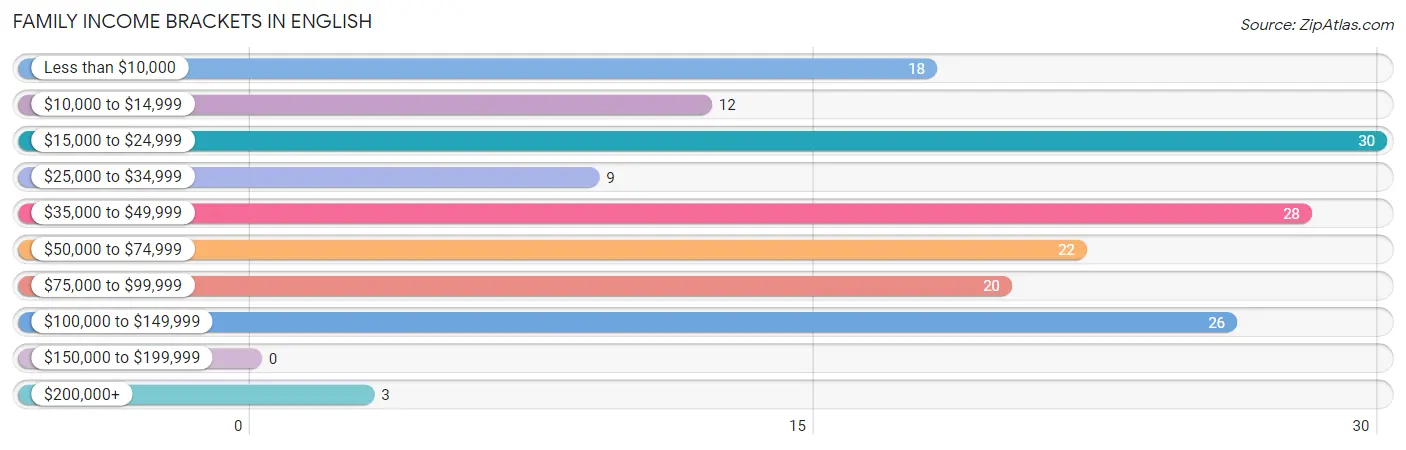
| Income Bracket | # Families | % Families |
| Less than $10,000 | 18 | 10.7% |
| $10,000 to $14,999 | 12 | 7.1% |
| $15,000 to $24,999 | 30 | 17.9% |
| $25,000 to $34,999 | 9 | 5.4% |
| $35,000 to $49,999 | 28 | 16.7% |
| $50,000 to $74,999 | 22 | 13.1% |
| $75,000 to $99,999 | 20 | 11.9% |
| $100,000 to $149,999 | 26 | 15.5% |
| $150,000 to $199,999 | 0 | 0.0% |
| $200,000+ | 3 | 1.8% |
Family Income by Famaliy Size in English
3-person families (31 | 18.4%) account for the highest median family income in English with $74,688 per family, while 3-person families (31 | 18.4%) have the highest median income of $24,896 per family member.
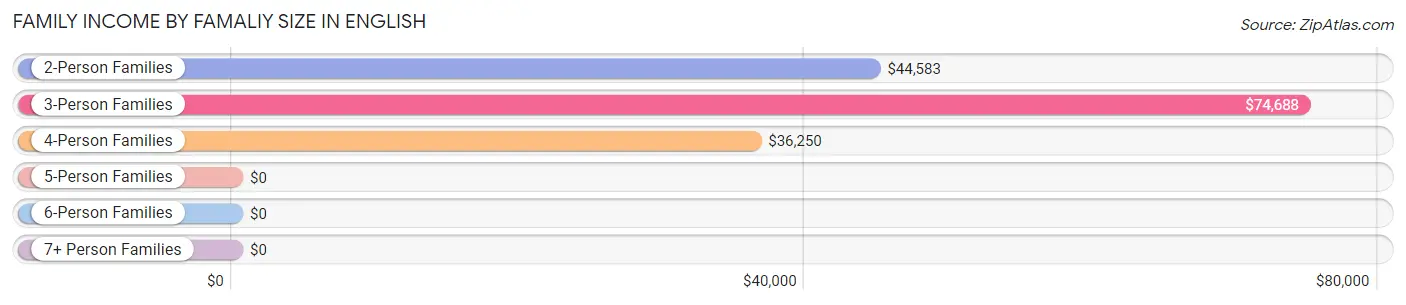
| Income Bracket | # Families | Median Income |
| 2-Person Families | 72 (42.9%) | $44,583 |
| 3-Person Families | 31 (18.4%) | $74,688 |
| 4-Person Families | 11 (6.6%) | $36,250 |
| 5-Person Families | 27 (16.1%) | $0 |
| 6-Person Families | 27 (16.1%) | $0 |
| 7+ Person Families | 0 (0.0%) | $0 |
| Total | 168 (100.0%) | $43,333 |
Family Income by Number of Earners in English
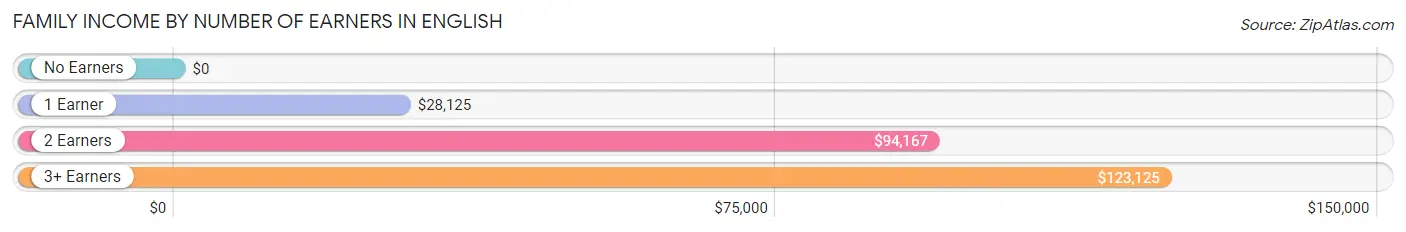
| Number of Earners | # Families | Median Income |
| No Earners | 33 (19.6%) | $0 |
| 1 Earner | 87 (51.8%) | $28,125 |
| 2 Earners | 32 (19.1%) | $94,167 |
| 3+ Earners | 16 (9.5%) | $123,125 |
| Total | 168 (100.0%) | $43,333 |
Household Income in English
Household Income Brackets in English
With 65 households falling in the category, the $25,000 to $34,999 income range is the most frequent in English, accounting for 19.1% of all households.
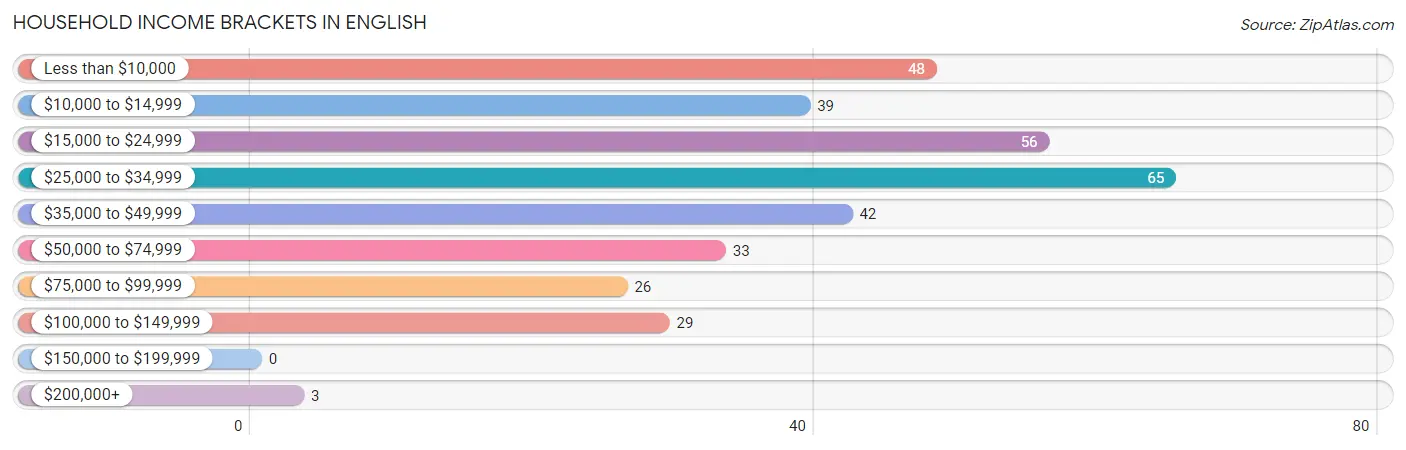
| Income Bracket | # Households | % Households |
| Less than $10,000 | 48 | 14.1% |
| $10,000 to $14,999 | 39 | 11.4% |
| $15,000 to $24,999 | 56 | 16.4% |
| $25,000 to $34,999 | 65 | 19.1% |
| $35,000 to $49,999 | 42 | 12.3% |
| $50,000 to $74,999 | 33 | 9.7% |
| $75,000 to $99,999 | 26 | 7.6% |
| $100,000 to $149,999 | 29 | 8.5% |
| $150,000 to $199,999 | 0 | 0.0% |
| $200,000+ | 3 | 0.9% |
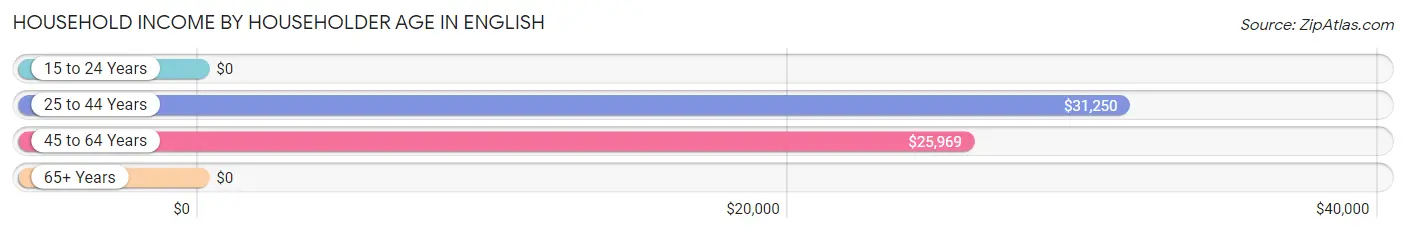
Household Income by Householder Age in English
The median household income in English is $26,599, with the highest median household income of $31,250 found in the 25 to 44 years age bracket for the primary householder. A total of 88 households (25.8%) fall into this category. Meanwhile, the 15 to 24 years age bracket for the primary householder has the lowest median household income of $0, with 4 households (1.2%) in this group.
| Income Bracket | # Households | Median Income |
| 15 to 24 Years | 4 (1.2%) | $0 |
| 25 to 44 Years | 88 (25.8%) | $31,250 |
| 45 to 64 Years | 149 (43.7%) | $25,969 |
| 65+ Years | 100 (29.3%) | $0 |
| Total | 341 (100.0%) | $26,599 |
Poverty in English
Income Below Poverty by Sex and Age in English
With 49.8% poverty level for males and 52.9% for females among the residents of English, 6 to 11 year old males and 12 to 14 year old females are the most vulnerable to poverty, with 127 males (81.4%) and 103 females (90.3%) in their respective age groups living below the poverty level.
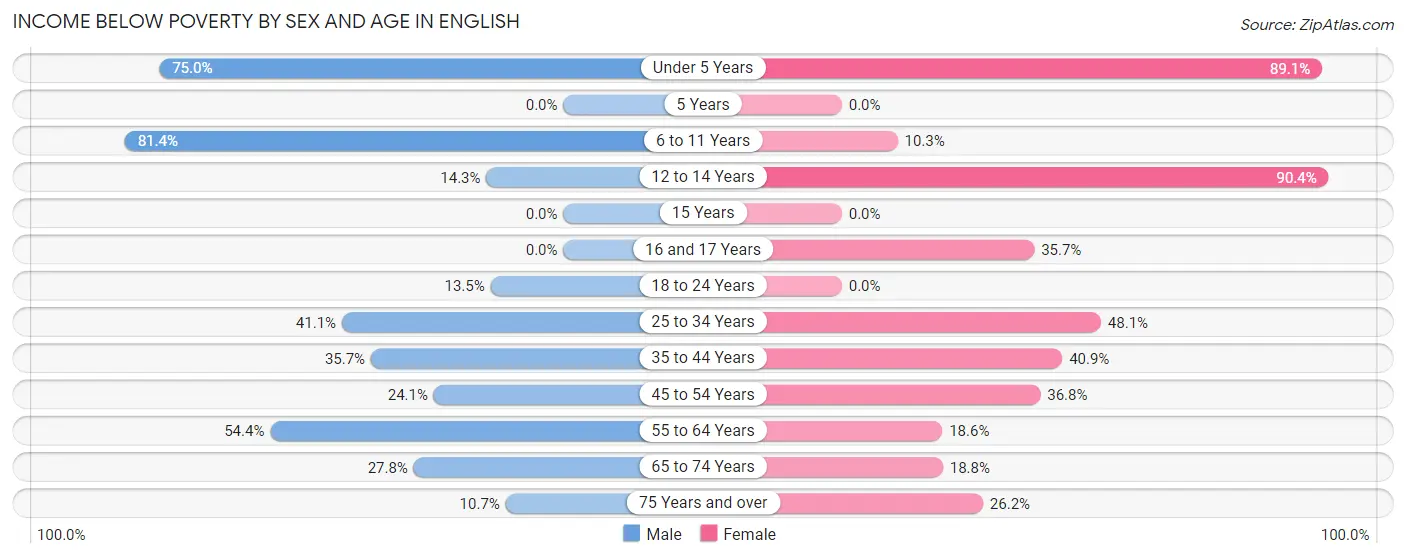
| Age Bracket | Male | Female |
| Under 5 Years | 42 (75.0%) | 82 (89.1%) |
| 5 Years | 0 (0.0%) | 0 (0.0%) |
| 6 to 11 Years | 127 (81.4%) | 3 (10.3%) |
| 12 to 14 Years | 3 (14.3%) | 103 (90.3%) |
| 15 Years | 0 (0.0%) | 0 (0.0%) |
| 16 and 17 Years | 0 (0.0%) | 5 (35.7%) |
| 18 to 24 Years | 5 (13.5%) | 0 (0.0%) |
| 25 to 34 Years | 30 (41.1%) | 38 (48.1%) |
| 35 to 44 Years | 10 (35.7%) | 9 (40.9%) |
| 45 to 54 Years | 19 (24.0%) | 14 (36.8%) |
| 55 to 64 Years | 37 (54.4%) | 11 (18.6%) |
| 65 to 74 Years | 5 (27.8%) | 6 (18.8%) |
| 75 Years and over | 3 (10.7%) | 11 (26.2%) |
| Total | 281 (49.8%) | 282 (52.9%) |
Income Above Poverty by Sex and Age in English
According to the poverty statistics in English, males aged 75 years and over and females aged 15 years are the age groups that are most secure financially, with 89.3% of males and 100.0% of females in these age groups living above the poverty line.
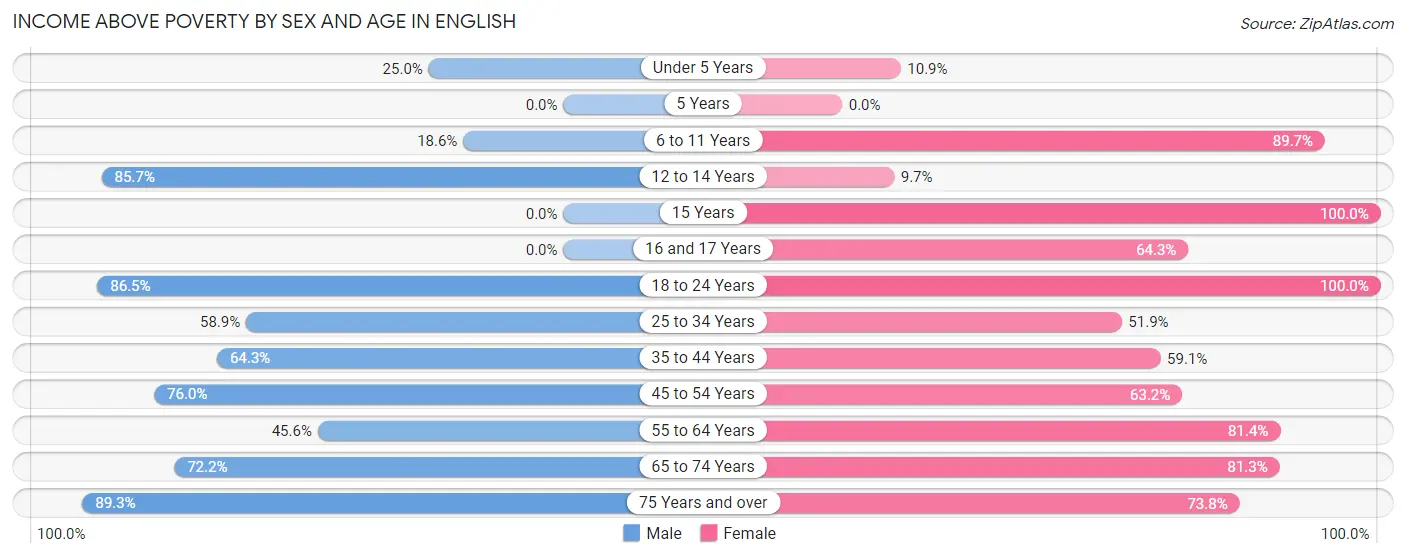
| Age Bracket | Male | Female |
| Under 5 Years | 14 (25.0%) | 10 (10.9%) |
| 5 Years | 0 (0.0%) | 0 (0.0%) |
| 6 to 11 Years | 29 (18.6%) | 26 (89.7%) |
| 12 to 14 Years | 18 (85.7%) | 11 (9.7%) |
| 15 Years | 0 (0.0%) | 4 (100.0%) |
| 16 and 17 Years | 0 (0.0%) | 9 (64.3%) |
| 18 to 24 Years | 32 (86.5%) | 8 (100.0%) |
| 25 to 34 Years | 43 (58.9%) | 41 (51.9%) |
| 35 to 44 Years | 18 (64.3%) | 13 (59.1%) |
| 45 to 54 Years | 60 (75.9%) | 24 (63.2%) |
| 55 to 64 Years | 31 (45.6%) | 48 (81.4%) |
| 65 to 74 Years | 13 (72.2%) | 26 (81.2%) |
| 75 Years and over | 25 (89.3%) | 31 (73.8%) |
| Total | 283 (50.2%) | 251 (47.1%) |
Income Below Poverty Among Married-Couple Families in English
The poverty statistics for married-couple families in English show that 27.9% or 39 of the total 140 families live below the poverty line. Families with 3 or 4 children have the highest poverty rate of 65.2%, comprising of 30 families. On the other hand, families with no children have the lowest poverty rate of 8.0%, which includes 6 families.
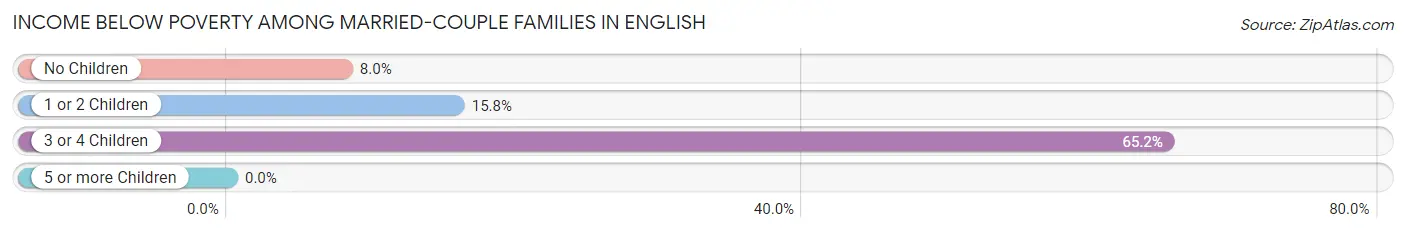
| Children | Above Poverty | Below Poverty |
| No Children | 69 (92.0%) | 6 (8.0%) |
| 1 or 2 Children | 16 (84.2%) | 3 (15.8%) |
| 3 or 4 Children | 16 (34.8%) | 30 (65.2%) |
| 5 or more Children | 0 (0.0%) | 0 (0.0%) |
| Total | 101 (72.1%) | 39 (27.9%) |
Income Below Poverty Among Single-Parent Households in English
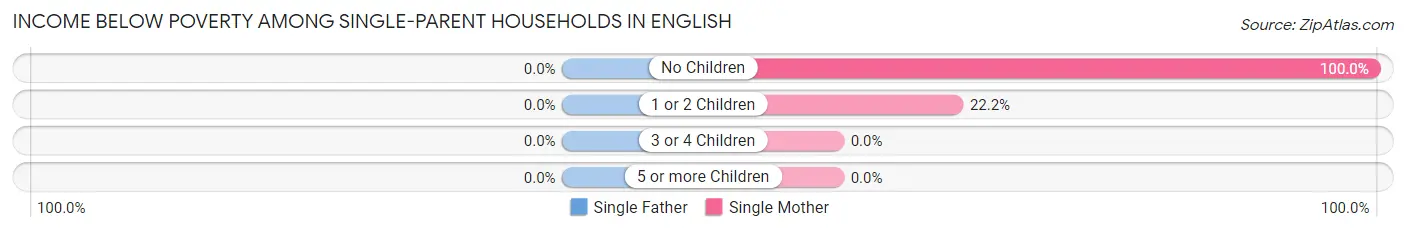
| Children | Single Father | Single Mother |
| No Children | 0 (0.0%) | 17 (100.0%) |
| 1 or 2 Children | 0 (0.0%) | 2 (22.2%) |
| 3 or 4 Children | 0 (0.0%) | 0 (0.0%) |
| 5 or more Children | 0 (0.0%) | 0 (0.0%) |
| Total | 0 (0.0%) | 19 (67.9%) |
Income Below Poverty Among Married-Couple vs Single-Parent Households in English
The poverty data for English shows that 39 of the married-couple family households (27.9%) and 19 of the single-parent households (67.9%) are living below the poverty level. Within the married-couple family households, those with 3 or 4 children have the highest poverty rate, with 30 households (65.2%) falling below the poverty line. Among the single-parent households, those with no children have the highest poverty rate, with 17 household (100.0%) living below poverty.
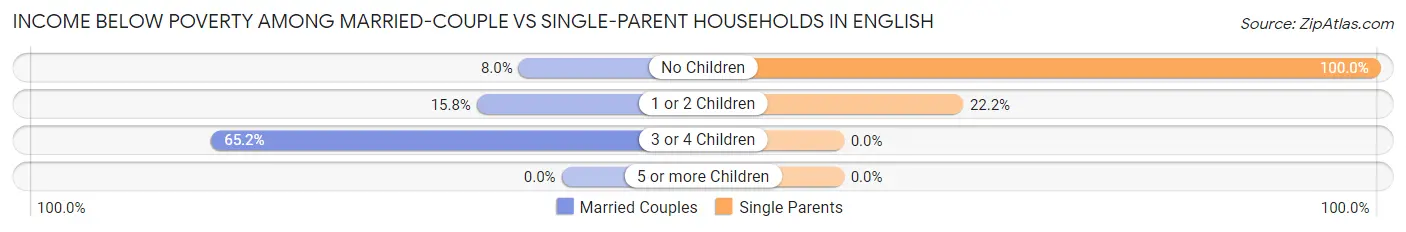
| Children | Married-Couple Families | Single-Parent Households |
| No Children | 6 (8.0%) | 17 (100.0%) |
| 1 or 2 Children | 3 (15.8%) | 2 (22.2%) |
| 3 or 4 Children | 30 (65.2%) | 0 (0.0%) |
| 5 or more Children | 0 (0.0%) | 0 (0.0%) |
| Total | 39 (27.9%) | 19 (67.9%) |
Race in English
The most populous races in English are White / Caucasian (1,066 | 96.8%), Two or more Races (35 | 3.2%), and Hispanic or Latino (23 | 2.1%).
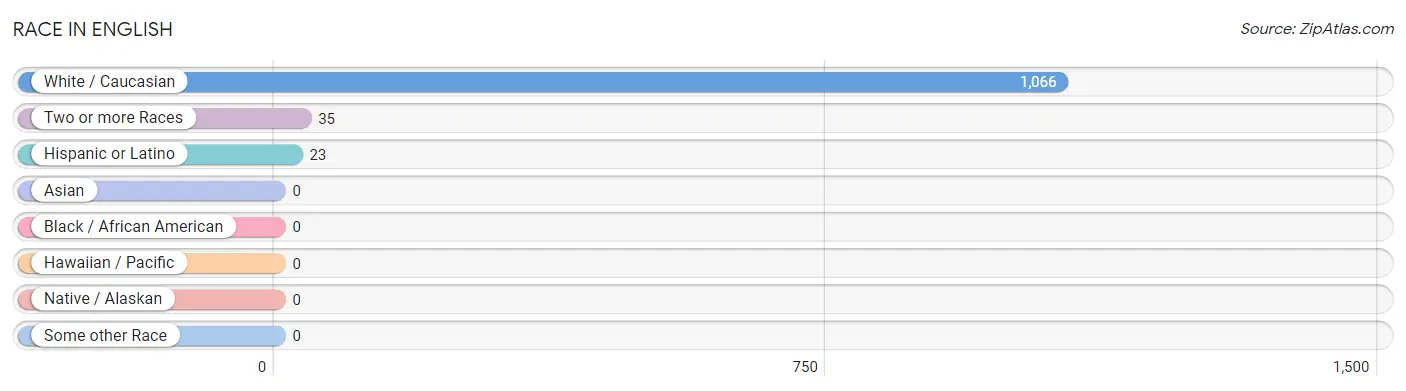
| Race | # Population | % Population |
| Asian | 0 | 0.0% |
| Black / African American | 0 | 0.0% |
| Hawaiian / Pacific | 0 | 0.0% |
| Hispanic or Latino | 23 | 2.1% |
| Native / Alaskan | 0 | 0.0% |
| White / Caucasian | 1,066 | 96.8% |
| Two or more Races | 35 | 3.2% |
| Some other Race | 0 | 0.0% |
| Total | 1,101 | 100.0% |
Ancestry in English
The most populous ancestries reported in English are German (546 | 49.6%), Scottish (345 | 31.3%), Irish (92 | 8.4%), English (87 | 7.9%), and American (61 | 5.5%), together accounting for 102.7% of all English residents.
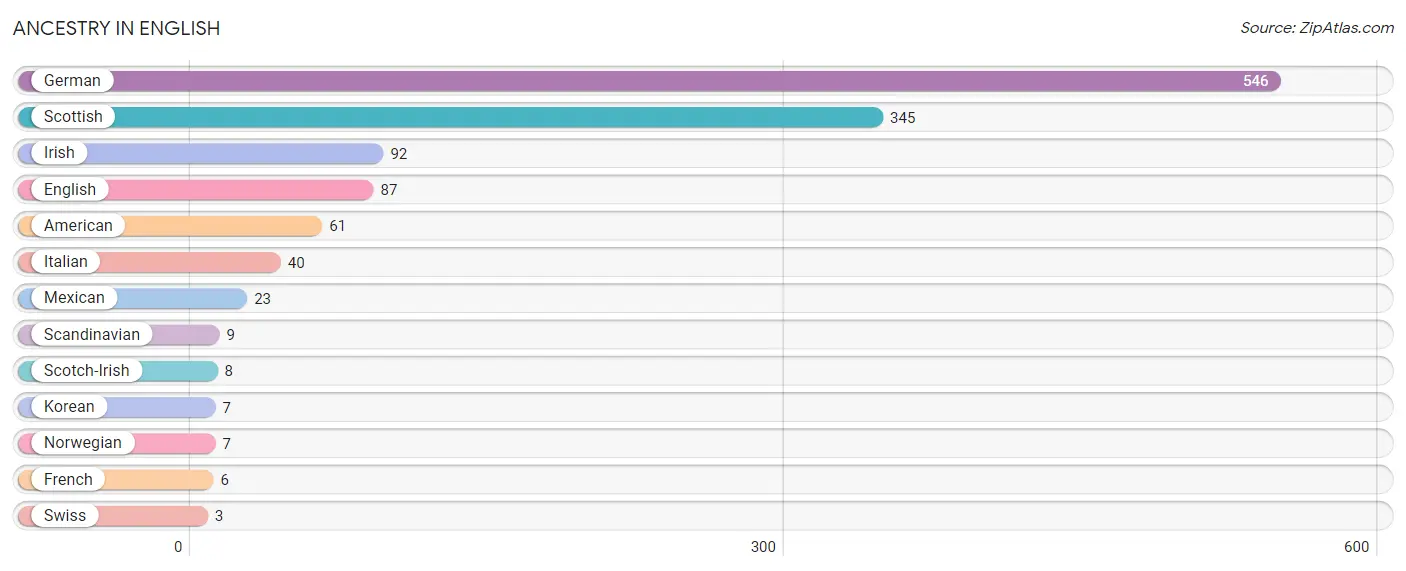
| Ancestry | # Population | % Population |
| American | 61 | 5.5% |
| English | 87 | 7.9% |
| French | 6 | 0.5% |
| German | 546 | 49.6% |
| Irish | 92 | 8.4% |
| Italian | 40 | 3.6% |
| Korean | 7 | 0.6% |
| Mexican | 23 | 2.1% |
| Norwegian | 7 | 0.6% |
| Scandinavian | 9 | 0.8% |
| Scotch-Irish | 8 | 0.7% |
| Scottish | 345 | 31.3% |
| Swiss | 3 | 0.3% | View All 13 Rows |
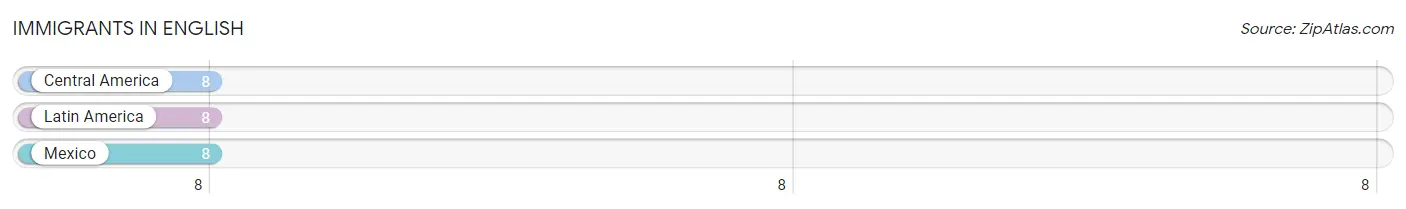
Immigrants in English
The most numerous immigrant groups reported in English came from Central America (8 | 0.7%), Latin America (8 | 0.7%), and Mexico (8 | 0.7%), together accounting for 2.2% of all English residents.
| Immigration Origin | # Population | % Population |
| Central America | 8 | 0.7% |
| Latin America | 8 | 0.7% |
| Mexico | 8 | 0.7% | View All 3 Rows |
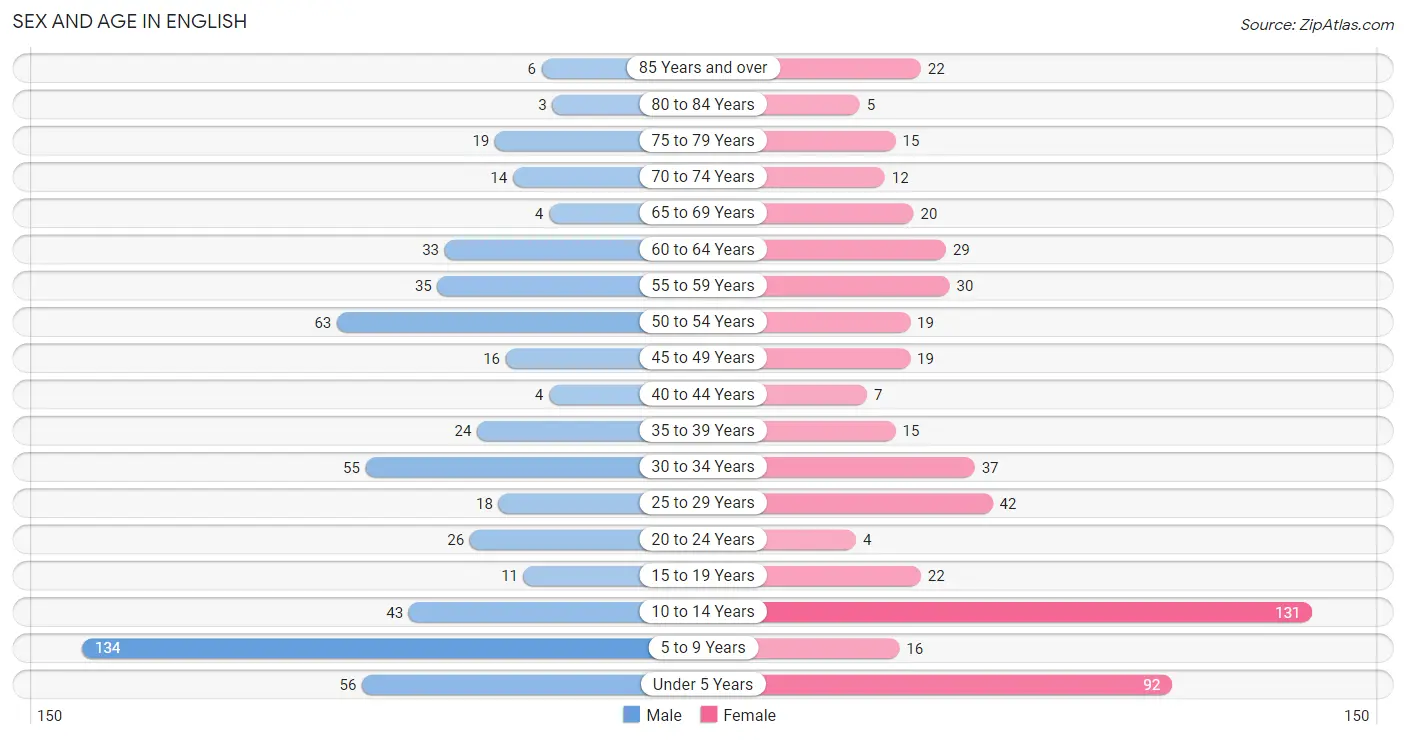
Sex and Age in English
Sex and Age in English
The most populous age groups in English are 5 to 9 Years (134 | 23.8%) for men and 10 to 14 Years (131 | 24.4%) for women.
| Age Bracket | Male | Female |
| Under 5 Years | 56 (9.9%) | 92 (17.1%) |
| 5 to 9 Years | 134 (23.8%) | 16 (3.0%) |
| 10 to 14 Years | 43 (7.6%) | 131 (24.4%) |
| 15 to 19 Years | 11 (1.9%) | 22 (4.1%) |
| 20 to 24 Years | 26 (4.6%) | 4 (0.7%) |
| 25 to 29 Years | 18 (3.2%) | 42 (7.8%) |
| 30 to 34 Years | 55 (9.8%) | 37 (6.9%) |
| 35 to 39 Years | 24 (4.3%) | 15 (2.8%) |
| 40 to 44 Years | 4 (0.7%) | 7 (1.3%) |
| 45 to 49 Years | 16 (2.8%) | 19 (3.5%) |
| 50 to 54 Years | 63 (11.2%) | 19 (3.5%) |
| 55 to 59 Years | 35 (6.2%) | 30 (5.6%) |
| 60 to 64 Years | 33 (5.9%) | 29 (5.4%) |
| 65 to 69 Years | 4 (0.7%) | 20 (3.7%) |
| 70 to 74 Years | 14 (2.5%) | 12 (2.2%) |
| 75 to 79 Years | 19 (3.4%) | 15 (2.8%) |
| 80 to 84 Years | 3 (0.5%) | 5 (0.9%) |
| 85 Years and over | 6 (1.1%) | 22 (4.1%) |
| Total | 564 (100.0%) | 537 (100.0%) |
Families and Households in English
Median Family Size in English
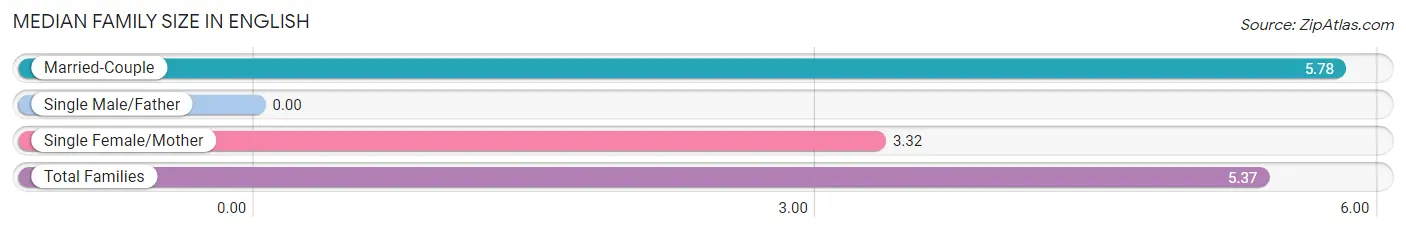
| Family Type | # Families | Family Size |
| Married-Couple | 140 (83.3%) | 5.78 |
| Single Male/Father | 0 (0.0%) | - |
| Single Female/Mother | 28 (16.7%) | 3.32 |
| Total Families | 168 (100.0%) | 5.37 |
Median Household Size in English
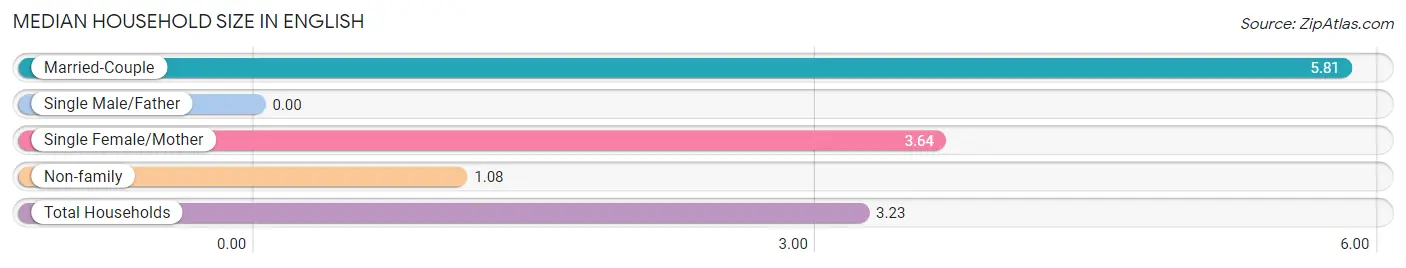
| Household Type | # Households | Household Size |
| Married-Couple | 140 (41.1%) | 5.81 |
| Single Male/Father | 0 (0.0%) | - |
| Single Female/Mother | 28 (8.2%) | 3.64 |
| Non-family | 173 (50.7%) | 1.08 |
| Total Households | 341 (100.0%) | 3.23 |
Household Size by Marriage Status in English
Out of a total of 341 households in English, 168 (49.3%) are family households, while 173 (50.7%) are nonfamily households. The most numerous type of family households are 2-person households, comprising 64, and the most common type of nonfamily households are 1-person households, comprising 164.
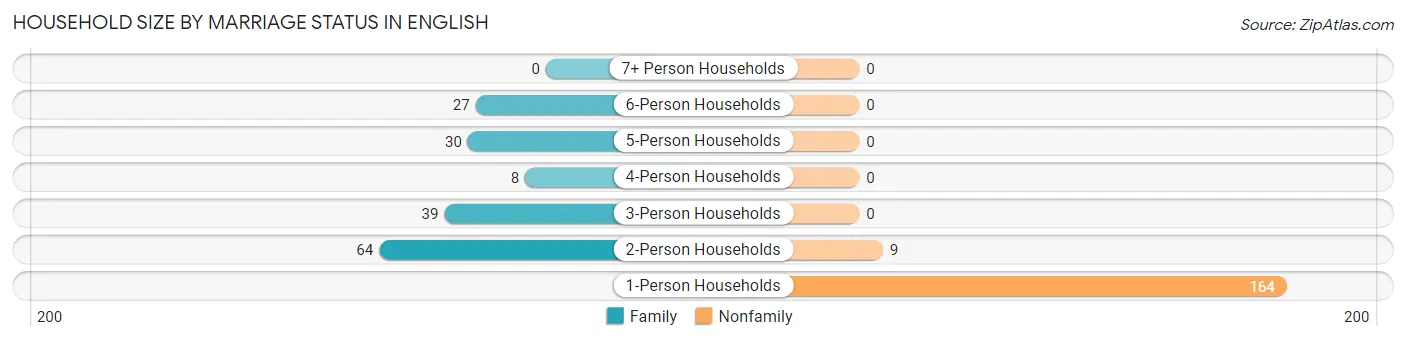
| Household Size | Family Households | Nonfamily Households |
| 1-Person Households | - | 164 (48.1%) |
| 2-Person Households | 64 (18.8%) | 9 (2.6%) |
| 3-Person Households | 39 (11.4%) | 0 (0.0%) |
| 4-Person Households | 8 (2.4%) | 0 (0.0%) |
| 5-Person Households | 30 (8.8%) | 0 (0.0%) |
| 6-Person Households | 27 (7.9%) | 0 (0.0%) |
| 7+ Person Households | 0 (0.0%) | 0 (0.0%) |
| Total | 168 (49.3%) | 173 (50.7%) |
Female Fertility in English
Fertility by Age in English
| Age Bracket | Women with Births | Births / 1,000 Women |
| 15 to 19 years | 0 (0.0%) | 0.0 |
| 20 to 34 years | 0 (0.0%) | 0.0 |
| 35 to 50 years | 0 (0.0%) | 0.0 |
| Total | 0 (0.0%) | 0.0 |
Fertility by Age by Marriage Status in English
| Age Bracket | Married | Unmarried |
| 15 to 19 years | 0 (0.0%) | 0 (0.0%) |
| 20 to 34 years | 0 (0.0%) | 0 (0.0%) |
| 35 to 50 years | 0 (0.0%) | 0 (0.0%) |
| Total | 0 (0.0%) | 0 (0.0%) |
Fertility by Education in English
| Educational Attainment | Women with Births | Births / 1,000 Women |
| Less than High School | 0 (0.0%) | 0.0 |
| High School Diploma | 0 (0.0%) | 0.0 |
| College or Associate's Degree | 0 (0.0%) | 0.0 |
| Bachelor's Degree | 0 (0.0%) | 0.0 |
| Graduate Degree | 0 (0.0%) | 0.0 |
| Total | 0 (0.0%) | 0.0 |
Fertility by Education by Marriage Status in English
| Educational Attainment | Married | Unmarried |
| Less than High School | 0 (0.0%) | 0 (0.0%) |
| High School Diploma | 0 (0.0%) | 0 (0.0%) |
| College or Associate's Degree | 0 (0.0%) | 0 (0.0%) |
| Bachelor's Degree | 0 (0.0%) | 0 (0.0%) |
| Graduate Degree | 0 (0.0%) | 0 (0.0%) |
| Total | 0 (0.0%) | 0 (0.0%) |
Employment Characteristics in English
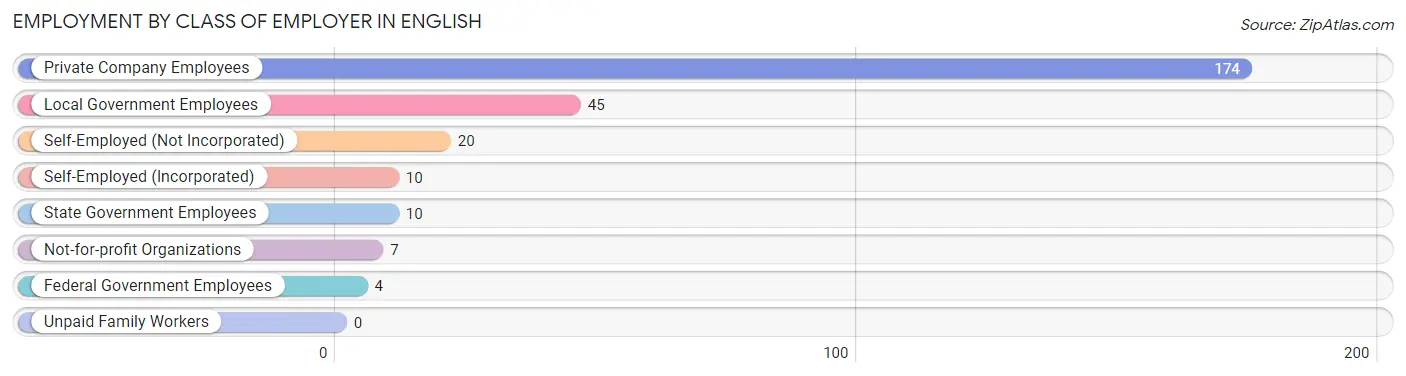
Employment by Class of Employer in English
Among the 270 employed individuals in English, private company employees (174 | 64.4%), local government employees (45 | 16.7%), and self-employed (not incorporated) (20 | 7.4%) make up the most common classes of employment.
| Employer Class | # Employees | % Employees |
| Private Company Employees | 174 | 64.4% |
| Self-Employed (Incorporated) | 10 | 3.7% |
| Self-Employed (Not Incorporated) | 20 | 7.4% |
| Not-for-profit Organizations | 7 | 2.6% |
| Local Government Employees | 45 | 16.7% |
| State Government Employees | 10 | 3.7% |
| Federal Government Employees | 4 | 1.5% |
| Unpaid Family Workers | 0 | 0.0% |
| Total | 270 | 100.0% |
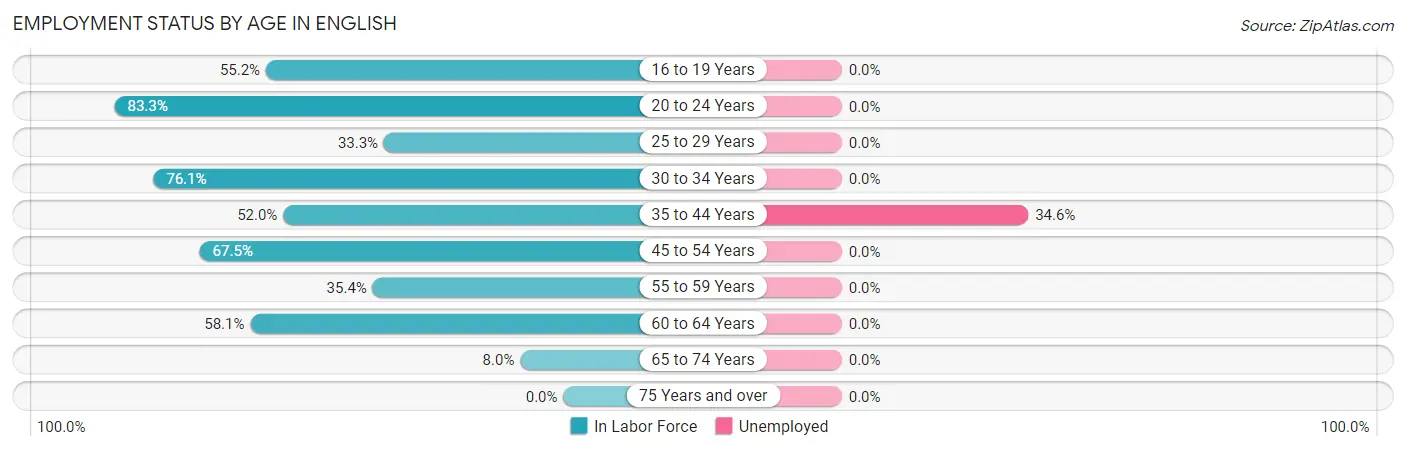
Employment Status by Age in English
According to the labor force statistics for English, out of the total population over 16 years of age (625), 47.8% or 299 individuals are in the labor force, with 3.0% or 9 of them unemployed. The age group with the highest labor force participation rate is 20 to 24 years, with 83.3% or 25 individuals in the labor force. Within the labor force, the 35 to 44 years age range has the highest percentage of unemployed individuals, with 34.6% or 9 of them being unemployed.
| Age Bracket | In Labor Force | Unemployed |
| 16 to 19 Years | 16 (55.2%) | 0 (0.0%) |
| 20 to 24 Years | 25 (83.3%) | 0 (0.0%) |
| 25 to 29 Years | 20 (33.3%) | 0 (0.0%) |
| 30 to 34 Years | 70 (76.1%) | 0 (0.0%) |
| 35 to 44 Years | 26 (52.0%) | 9 (34.6%) |
| 45 to 54 Years | 79 (67.5%) | 0 (0.0%) |
| 55 to 59 Years | 23 (35.4%) | 0 (0.0%) |
| 60 to 64 Years | 36 (58.1%) | 0 (0.0%) |
| 65 to 74 Years | 4 (8.0%) | 0 (0.0%) |
| 75 Years and over | 0 (0.0%) | 0 (0.0%) |
| Total | 299 (47.8%) | 9 (3.0%) |
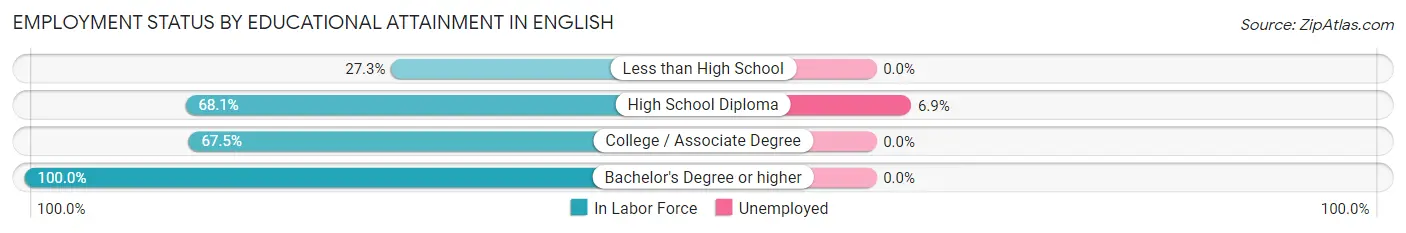
Employment Status by Educational Attainment in English
According to labor force statistics for English, 57.0% of individuals (254) out of the total population between 25 and 64 years of age (446) are in the labor force, with 3.5% or 9 of them being unemployed. The group with the highest labor force participation rate are those with the educational attainment of bachelor's degree or higher, with 100.0% or 10 individuals in the labor force. Within the labor force, individuals with high school diploma education have the highest percentage of unemployment, with 6.9% or 9 of them being unemployed.
| Educational Attainment | In Labor Force | Unemployed |
| Less than High School | 35 (27.3%) | 0 (0.0%) |
| High School Diploma | 130 (68.1%) | 13 (6.9%) |
| College / Associate Degree | 79 (67.5%) | 0 (0.0%) |
| Bachelor's Degree or higher | 10 (100.0%) | 0 (0.0%) |
| Total | 254 (57.0%) | 16 (3.5%) |
Employment Occupations by Sex in English
Management, Business, Science and Arts Occupations
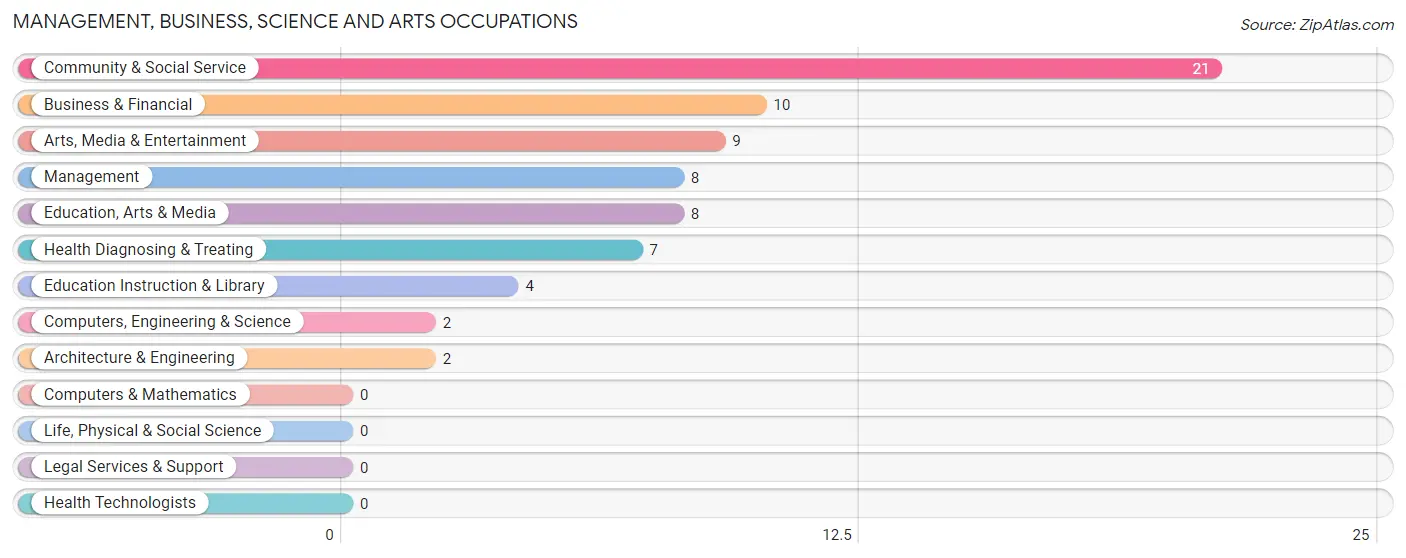
The most common Management, Business, Science and Arts occupations in English are Community & Social Service (21 | 7.2%), Business & Financial (10 | 3.5%), Arts, Media & Entertainment (9 | 3.1%), Management (8 | 2.8%), and Education, Arts & Media (8 | 2.8%).
Management, Business, Science and Arts Occupations by Sex
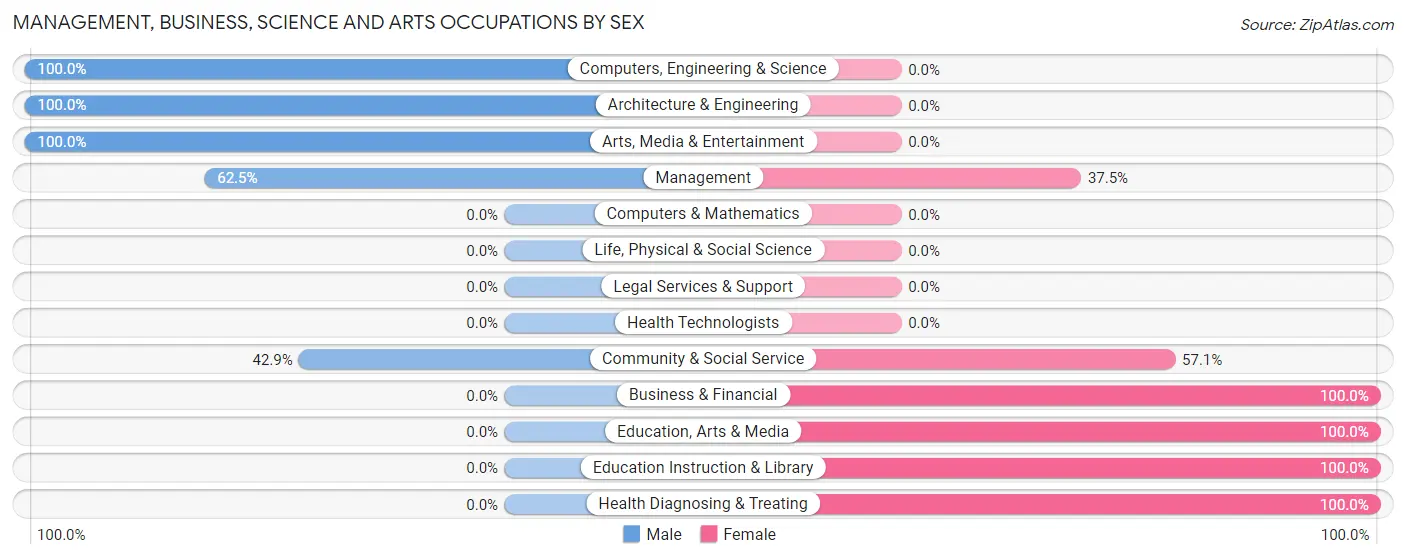
Within the Management, Business, Science and Arts occupations in English, the most male-oriented occupations are Computers, Engineering & Science (100.0%), Architecture & Engineering (100.0%), and Arts, Media & Entertainment (100.0%), while the most female-oriented occupations are Business & Financial (100.0%), Education, Arts & Media (100.0%), and Education Instruction & Library (100.0%).
| Occupation | Male | Female |
| Management | 5 (62.5%) | 3 (37.5%) |
| Business & Financial | 0 (0.0%) | 10 (100.0%) |
| Computers, Engineering & Science | 2 (100.0%) | 0 (0.0%) |
| Computers & Mathematics | 0 (0.0%) | 0 (0.0%) |
| Architecture & Engineering | 2 (100.0%) | 0 (0.0%) |
| Life, Physical & Social Science | 0 (0.0%) | 0 (0.0%) |
| Community & Social Service | 9 (42.9%) | 12 (57.1%) |
| Education, Arts & Media | 0 (0.0%) | 8 (100.0%) |
| Legal Services & Support | 0 (0.0%) | 0 (0.0%) |
| Education Instruction & Library | 0 (0.0%) | 4 (100.0%) |
| Arts, Media & Entertainment | 9 (100.0%) | 0 (0.0%) |
| Health Diagnosing & Treating | 0 (0.0%) | 7 (100.0%) |
| Health Technologists | 0 (0.0%) | 0 (0.0%) |
| Total (Category) | 16 (33.3%) | 32 (66.7%) |
| Total (Overall) | 186 (64.1%) | 104 (35.9%) |
Services Occupations
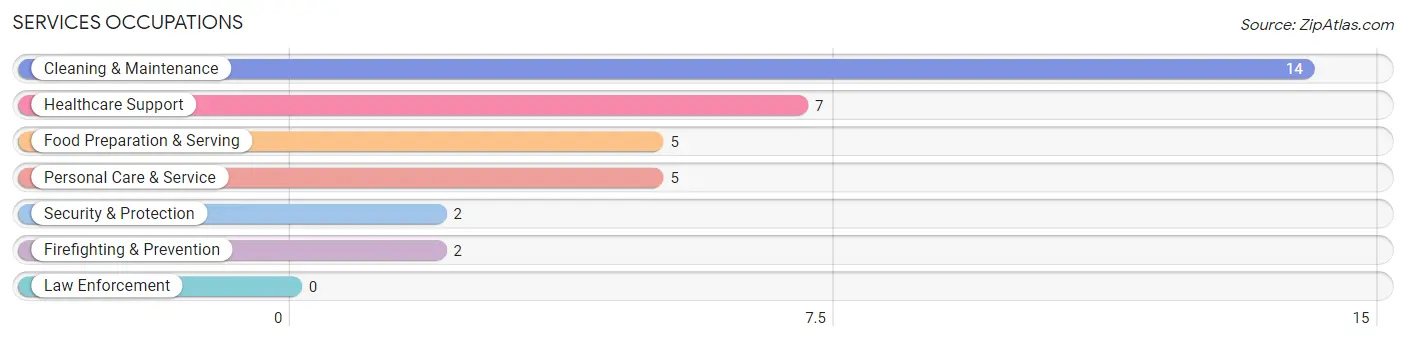
The most common Services occupations in English are Cleaning & Maintenance (14 | 4.8%), Healthcare Support (7 | 2.4%), Food Preparation & Serving (5 | 1.7%), Personal Care & Service (5 | 1.7%), and Security & Protection (2 | 0.7%).
Services Occupations by Sex
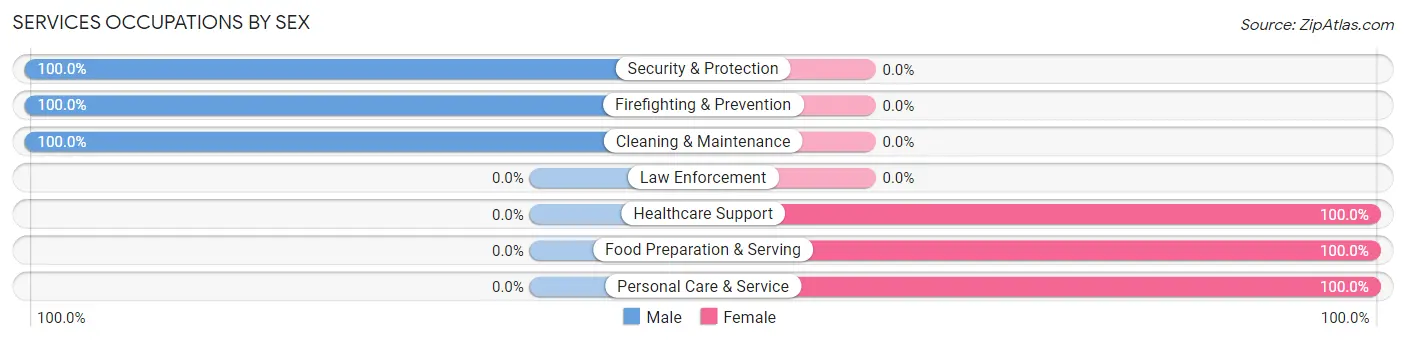
Within the Services occupations in English, the most male-oriented occupations are Security & Protection (100.0%), Firefighting & Prevention (100.0%), and Cleaning & Maintenance (100.0%), while the most female-oriented occupations are Healthcare Support (100.0%), Food Preparation & Serving (100.0%), and Personal Care & Service (100.0%).
| Occupation | Male | Female |
| Healthcare Support | 0 (0.0%) | 7 (100.0%) |
| Security & Protection | 2 (100.0%) | 0 (0.0%) |
| Firefighting & Prevention | 2 (100.0%) | 0 (0.0%) |
| Law Enforcement | 0 (0.0%) | 0 (0.0%) |
| Food Preparation & Serving | 0 (0.0%) | 5 (100.0%) |
| Cleaning & Maintenance | 14 (100.0%) | 0 (0.0%) |
| Personal Care & Service | 0 (0.0%) | 5 (100.0%) |
| Total (Category) | 16 (48.5%) | 17 (51.5%) |
| Total (Overall) | 186 (64.1%) | 104 (35.9%) |
Sales and Office Occupations
The most common Sales and Office occupations in English are Sales & Related (28 | 9.7%), and Office & Administration (15 | 5.2%).
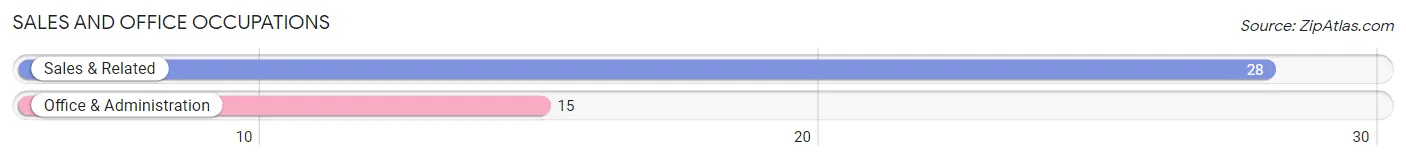
Sales and Office Occupations by Sex

| Occupation | Male | Female |
| Sales & Related | 7 (25.0%) | 21 (75.0%) |
| Office & Administration | 0 (0.0%) | 15 (100.0%) |
| Total (Category) | 7 (16.3%) | 36 (83.7%) |
| Total (Overall) | 186 (64.1%) | 104 (35.9%) |
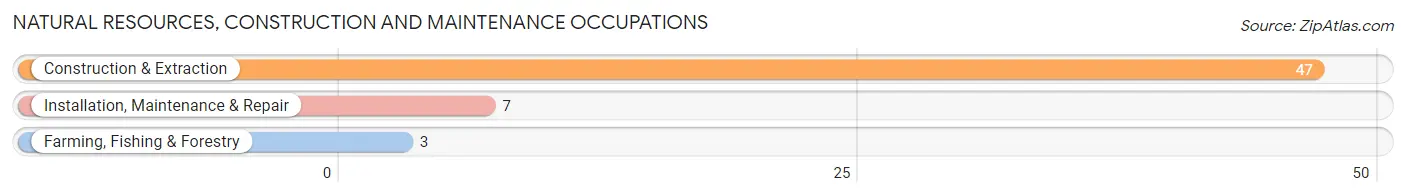
Natural Resources, Construction and Maintenance Occupations
The most common Natural Resources, Construction and Maintenance occupations in English are Construction & Extraction (47 | 16.2%), Installation, Maintenance & Repair (7 | 2.4%), and Farming, Fishing & Forestry (3 | 1.0%).
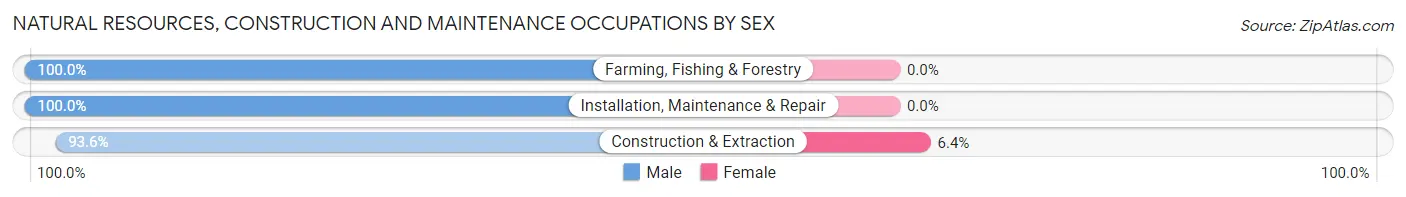
Natural Resources, Construction and Maintenance Occupations by Sex
| Occupation | Male | Female |
| Farming, Fishing & Forestry | 3 (100.0%) | 0 (0.0%) |
| Construction & Extraction | 44 (93.6%) | 3 (6.4%) |
| Installation, Maintenance & Repair | 7 (100.0%) | 0 (0.0%) |
| Total (Category) | 54 (94.7%) | 3 (5.3%) |
| Total (Overall) | 186 (64.1%) | 104 (35.9%) |
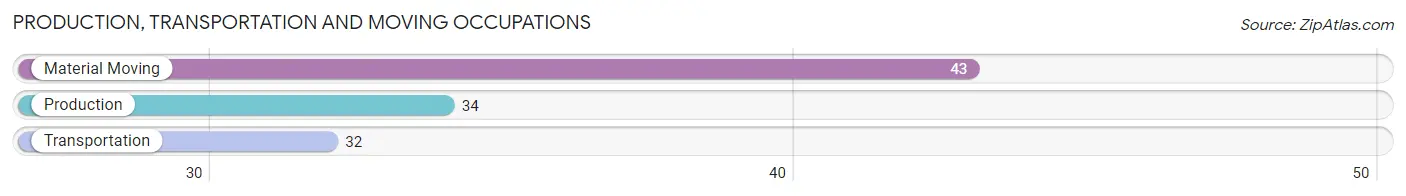
Production, Transportation and Moving Occupations
The most common Production, Transportation and Moving occupations in English are Material Moving (43 | 14.8%), Production (34 | 11.7%), and Transportation (32 | 11.0%).
Production, Transportation and Moving Occupations by Sex
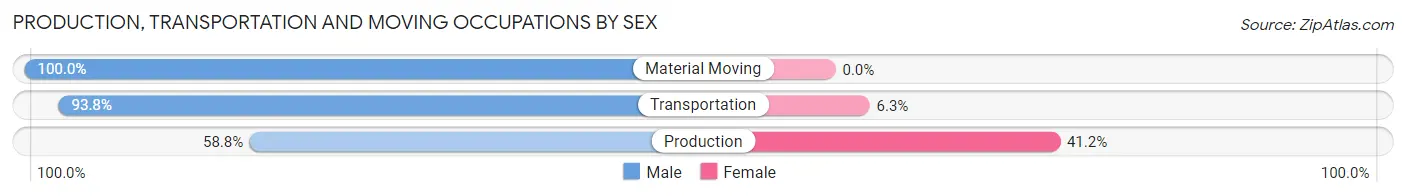
| Occupation | Male | Female |
| Production | 20 (58.8%) | 14 (41.2%) |
| Transportation | 30 (93.8%) | 2 (6.2%) |
| Material Moving | 43 (100.0%) | 0 (0.0%) |
| Total (Category) | 93 (85.3%) | 16 (14.7%) |
| Total (Overall) | 186 (64.1%) | 104 (35.9%) |
Employment Industries by Sex in English
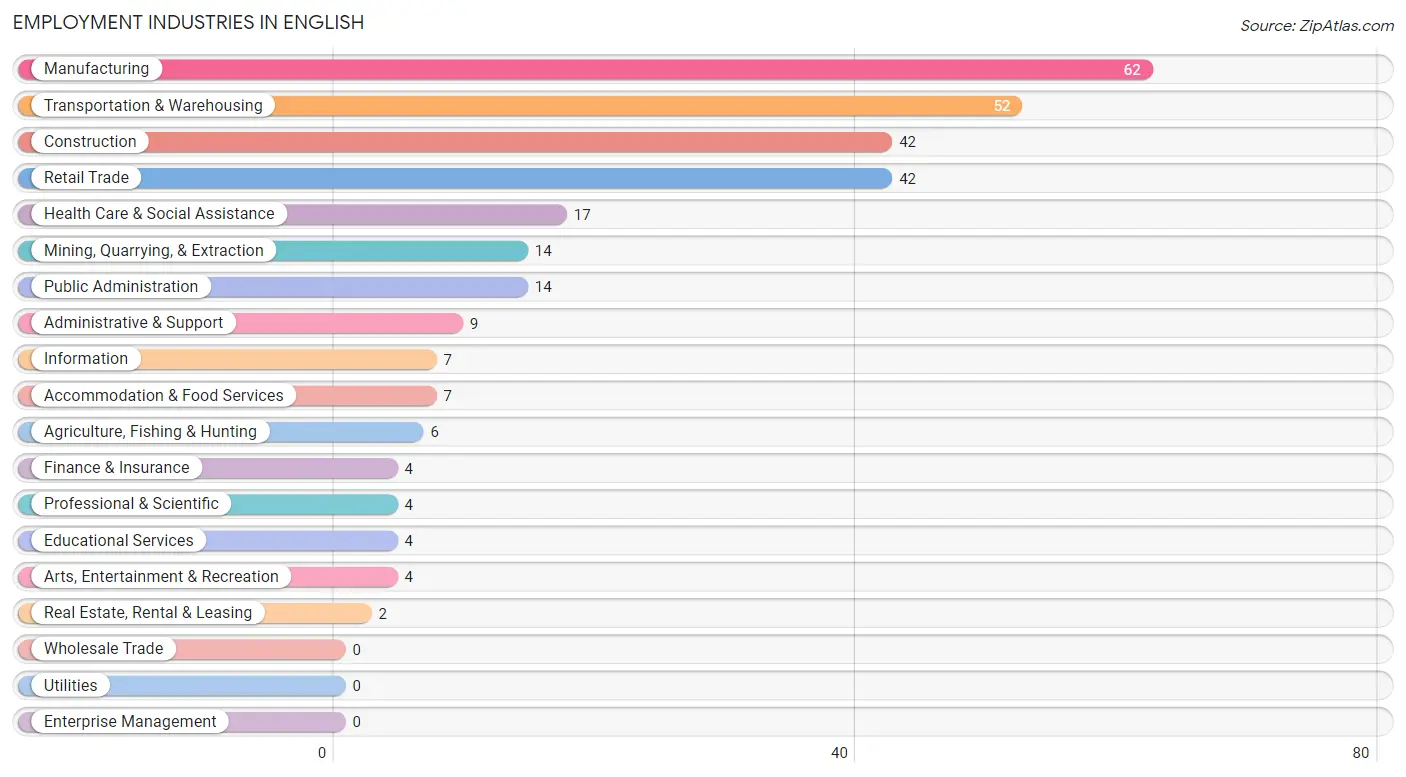
Employment Industries in English
The major employment industries in English include Manufacturing (62 | 21.4%), Transportation & Warehousing (52 | 17.9%), Construction (42 | 14.5%), Retail Trade (42 | 14.5%), and Health Care & Social Assistance (17 | 5.9%).
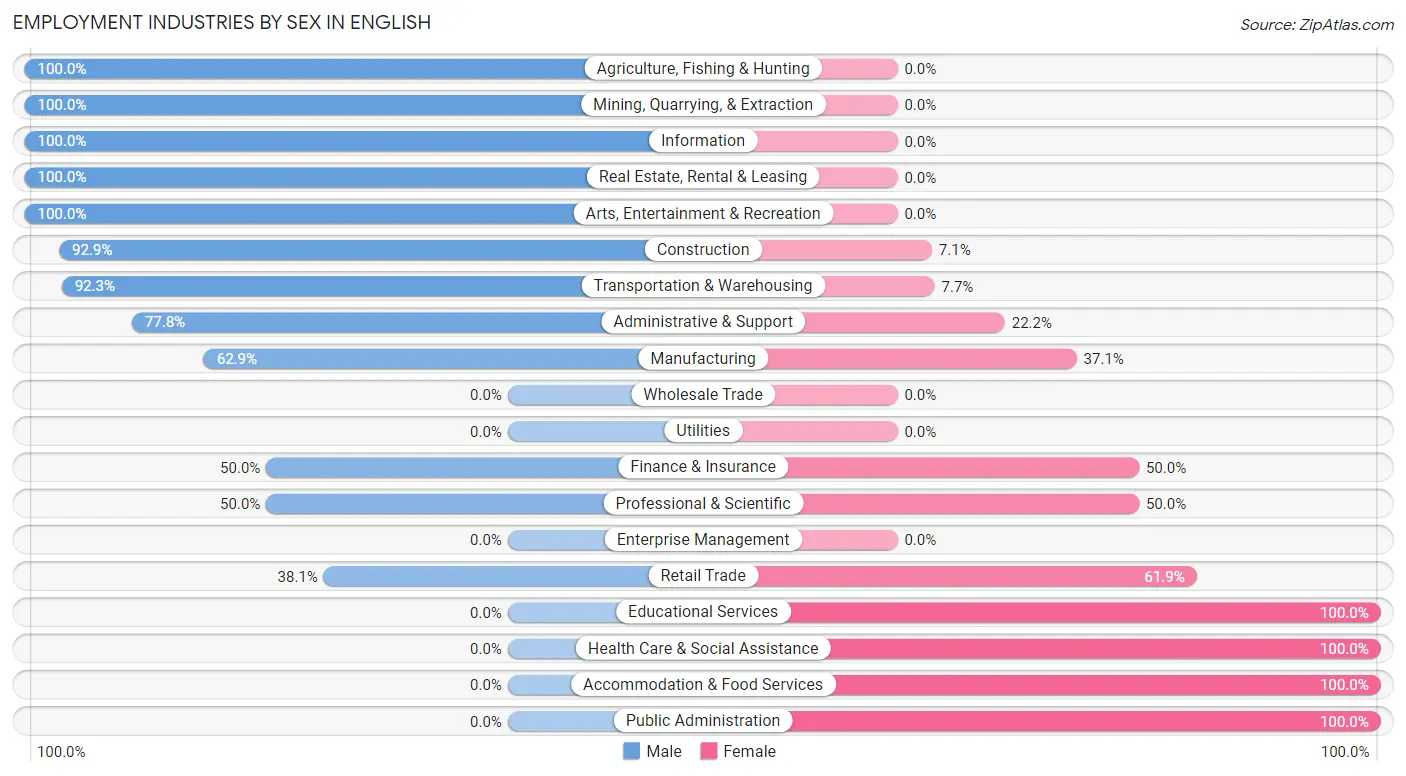
Employment Industries by Sex in English
The English industries that see more men than women are Agriculture, Fishing & Hunting (100.0%), Mining, Quarrying, & Extraction (100.0%), and Information (100.0%), whereas the industries that tend to have a higher number of women are Educational Services (100.0%), Health Care & Social Assistance (100.0%), and Accommodation & Food Services (100.0%).
| Industry | Male | Female |
| Agriculture, Fishing & Hunting | 6 (100.0%) | 0 (0.0%) |
| Mining, Quarrying, & Extraction | 14 (100.0%) | 0 (0.0%) |
| Construction | 39 (92.9%) | 3 (7.1%) |
| Manufacturing | 39 (62.9%) | 23 (37.1%) |
| Wholesale Trade | 0 (0.0%) | 0 (0.0%) |
| Retail Trade | 16 (38.1%) | 26 (61.9%) |
| Transportation & Warehousing | 48 (92.3%) | 4 (7.7%) |
| Utilities | 0 (0.0%) | 0 (0.0%) |
| Information | 7 (100.0%) | 0 (0.0%) |
| Finance & Insurance | 2 (50.0%) | 2 (50.0%) |
| Real Estate, Rental & Leasing | 2 (100.0%) | 0 (0.0%) |
| Professional & Scientific | 2 (50.0%) | 2 (50.0%) |
| Enterprise Management | 0 (0.0%) | 0 (0.0%) |
| Administrative & Support | 7 (77.8%) | 2 (22.2%) |
| Educational Services | 0 (0.0%) | 4 (100.0%) |
| Health Care & Social Assistance | 0 (0.0%) | 17 (100.0%) |
| Arts, Entertainment & Recreation | 4 (100.0%) | 0 (0.0%) |
| Accommodation & Food Services | 0 (0.0%) | 7 (100.0%) |
| Public Administration | 0 (0.0%) | 14 (100.0%) |
| Total | 186 (64.1%) | 104 (35.9%) |
Education in English
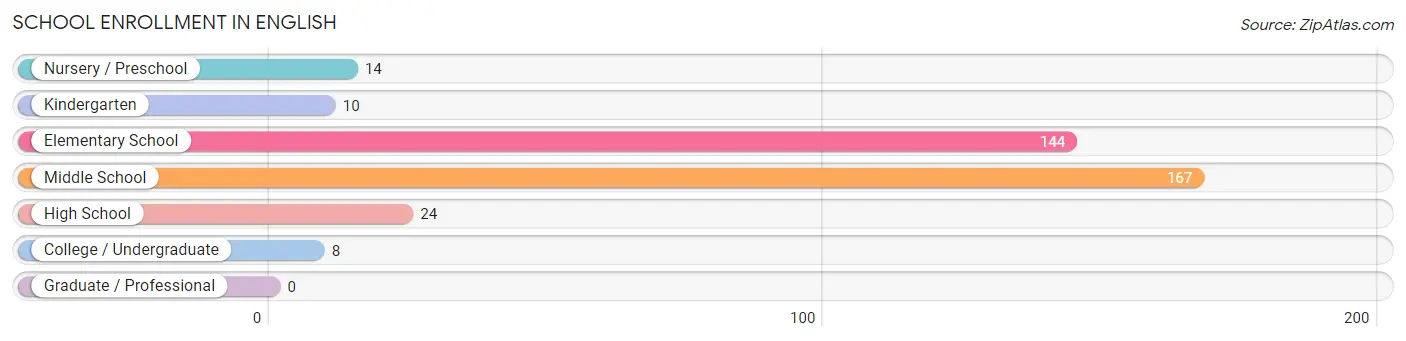
School Enrollment in English
The most common levels of schooling among the 367 students in English are middle school (167 | 45.5%), elementary school (144 | 39.2%), and high school (24 | 6.5%).
| School Level | # Students | % Students |
| Nursery / Preschool | 14 | 3.8% |
| Kindergarten | 10 | 2.7% |
| Elementary School | 144 | 39.2% |
| Middle School | 167 | 45.5% |
| High School | 24 | 6.5% |
| College / Undergraduate | 8 | 2.2% |
| Graduate / Professional | 0 | 0.0% |
| Total | 367 | 100.0% |
School Enrollment by Age by Funding Source in English
Out of a total of 367 students who are enrolled in schools in English, 10 (2.7%) attend a private institution, while the remaining 357 (97.3%) are enrolled in public schools. The age group of 3 to 4 year olds has the highest likelihood of being enrolled in private schools, with 3 (21.4% in the age bracket) enrolled. Conversely, the age group of 5 to 9 year old has the lowest likelihood of being enrolled in a private school, with 150 (100.0% in the age bracket) attending a public institution.
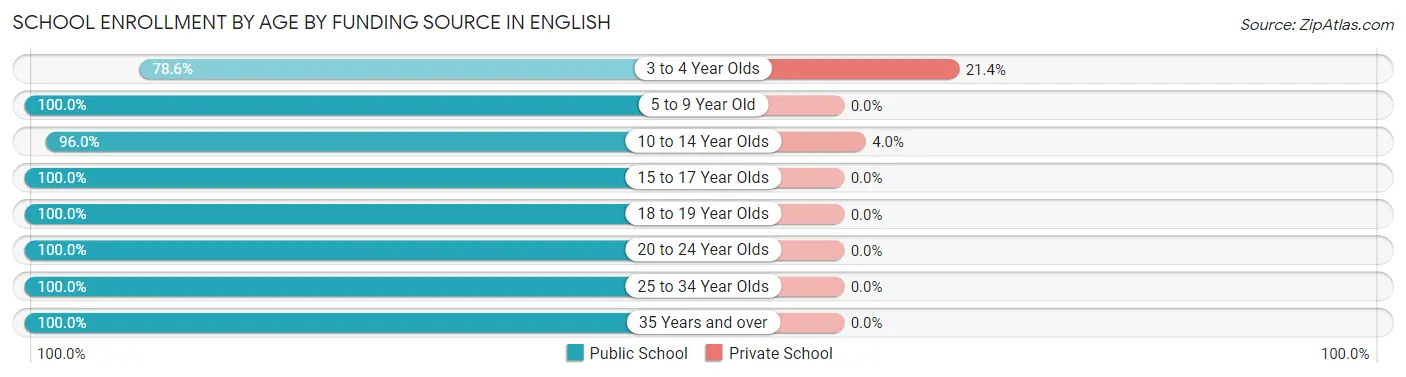
| Age Bracket | Public School | Private School |
| 3 to 4 Year Olds | 11 (78.6%) | 3 (21.4%) |
| 5 to 9 Year Old | 150 (100.0%) | 0 (0.0%) |
| 10 to 14 Year Olds | 167 (96.0%) | 7 (4.0%) |
| 15 to 17 Year Olds | 13 (100.0%) | 0 (0.0%) |
| 18 to 19 Year Olds | 8 (100.0%) | 0 (0.0%) |
| 20 to 24 Year Olds | 4 (100.0%) | 0 (0.0%) |
| 25 to 34 Year Olds | 2 (100.0%) | 0 (0.0%) |
| 35 Years and over | 2 (100.0%) | 0 (0.0%) |
| Total | 357 (97.3%) | 10 (2.7%) |
Educational Attainment by Field of Study in English
Education (5 | 38.5%), psychology (2 | 15.4%), social sciences (2 | 15.4%), business (2 | 15.4%), and arts & humanities (2 | 15.4%) are the most common fields of study among 13 individuals in English who have obtained a bachelor's degree or higher.
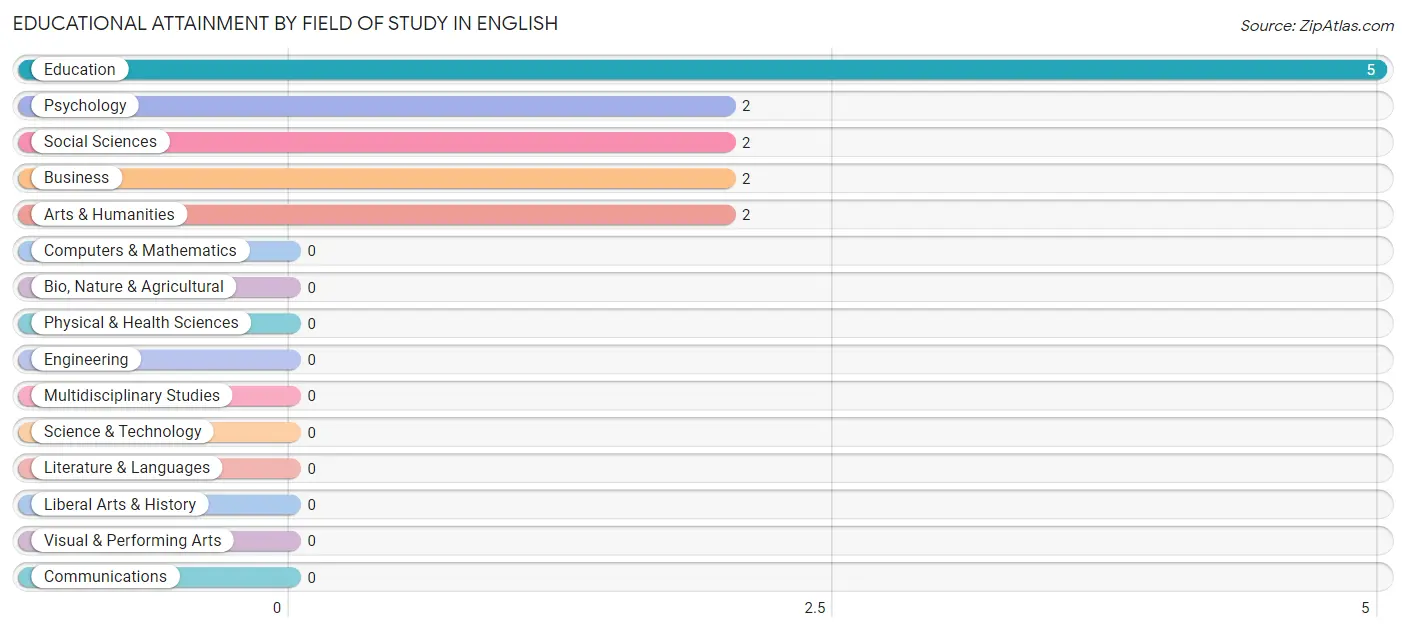
| Field of Study | # Graduates | % Graduates |
| Computers & Mathematics | 0 | 0.0% |
| Bio, Nature & Agricultural | 0 | 0.0% |
| Physical & Health Sciences | 0 | 0.0% |
| Psychology | 2 | 15.4% |
| Social Sciences | 2 | 15.4% |
| Engineering | 0 | 0.0% |
| Multidisciplinary Studies | 0 | 0.0% |
| Science & Technology | 0 | 0.0% |
| Business | 2 | 15.4% |
| Education | 5 | 38.5% |
| Literature & Languages | 0 | 0.0% |
| Liberal Arts & History | 0 | 0.0% |
| Visual & Performing Arts | 0 | 0.0% |
| Communications | 0 | 0.0% |
| Arts & Humanities | 2 | 15.4% |
| Total | 13 | 100.0% |
Transportation & Commute in English
Vehicle Availability by Sex in English
The most prevalent vehicle ownership categories in English are males with 2 vehicles (70, accounting for 42.2%) and females with 2 vehicles (36, making up 67.3%).
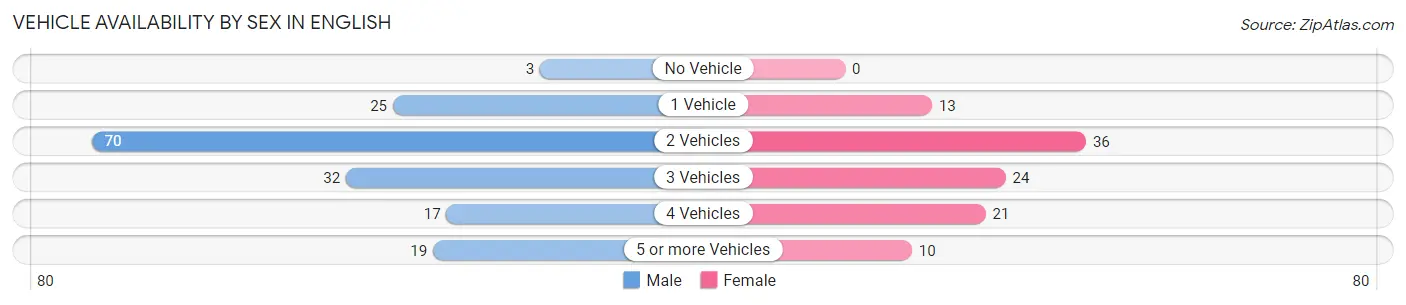
| Vehicles Available | Male | Female |
| No Vehicle | 3 (1.8%) | 0 (0.0%) |
| 1 Vehicle | 25 (15.1%) | 13 (12.5%) |
| 2 Vehicles | 70 (42.2%) | 36 (34.6%) |
| 3 Vehicles | 32 (19.3%) | 24 (23.1%) |
| 4 Vehicles | 17 (10.2%) | 21 (20.2%) |
| 5 or more Vehicles | 19 (11.5%) | 10 (9.6%) |
| Total | 166 (100.0%) | 104 (100.0%) |
Commute Time in English
The most frequently occuring commute durations in English are 5 to 9 minutes (53 commuters, 20.5%), 45 to 59 minutes (45 commuters, 17.4%), and less than 5 minutes (25 commuters, 9.7%).
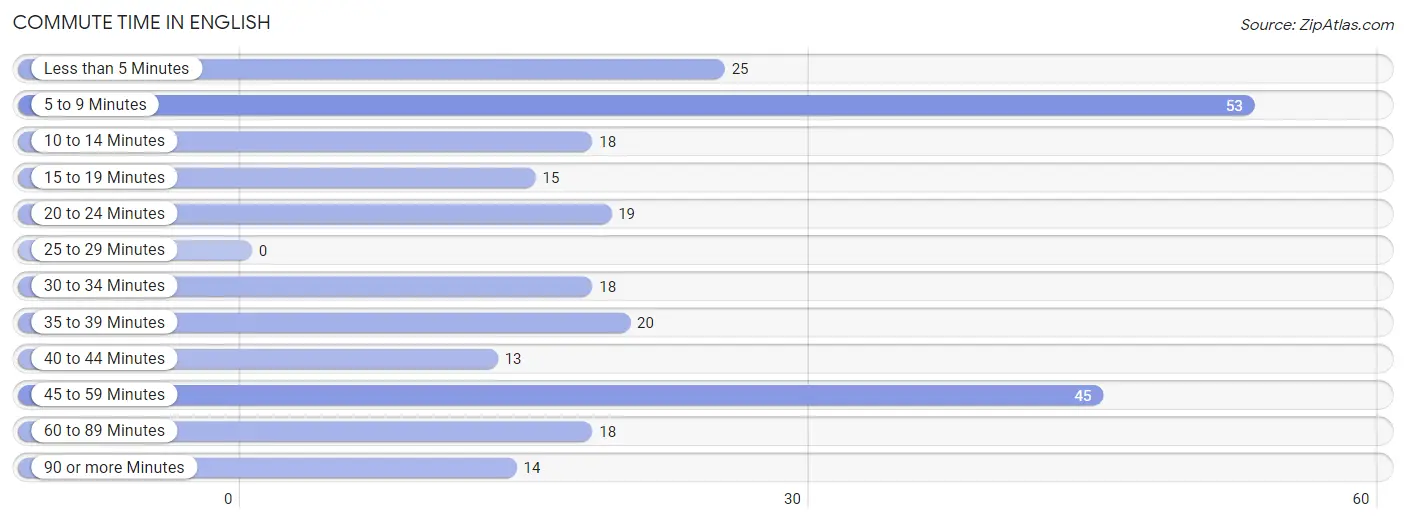
| Commute Time | # Commuters | % Commuters |
| Less than 5 Minutes | 25 | 9.7% |
| 5 to 9 Minutes | 53 | 20.5% |
| 10 to 14 Minutes | 18 | 7.0% |
| 15 to 19 Minutes | 15 | 5.8% |
| 20 to 24 Minutes | 19 | 7.4% |
| 25 to 29 Minutes | 0 | 0.0% |
| 30 to 34 Minutes | 18 | 7.0% |
| 35 to 39 Minutes | 20 | 7.7% |
| 40 to 44 Minutes | 13 | 5.0% |
| 45 to 59 Minutes | 45 | 17.4% |
| 60 to 89 Minutes | 18 | 7.0% |
| 90 or more Minutes | 14 | 5.4% |
Commute Time by Sex in English
The most common commute times in English are 5 to 9 minutes (44 commuters, 26.8%) for males and 45 to 59 minutes (24 commuters, 25.5%) for females.
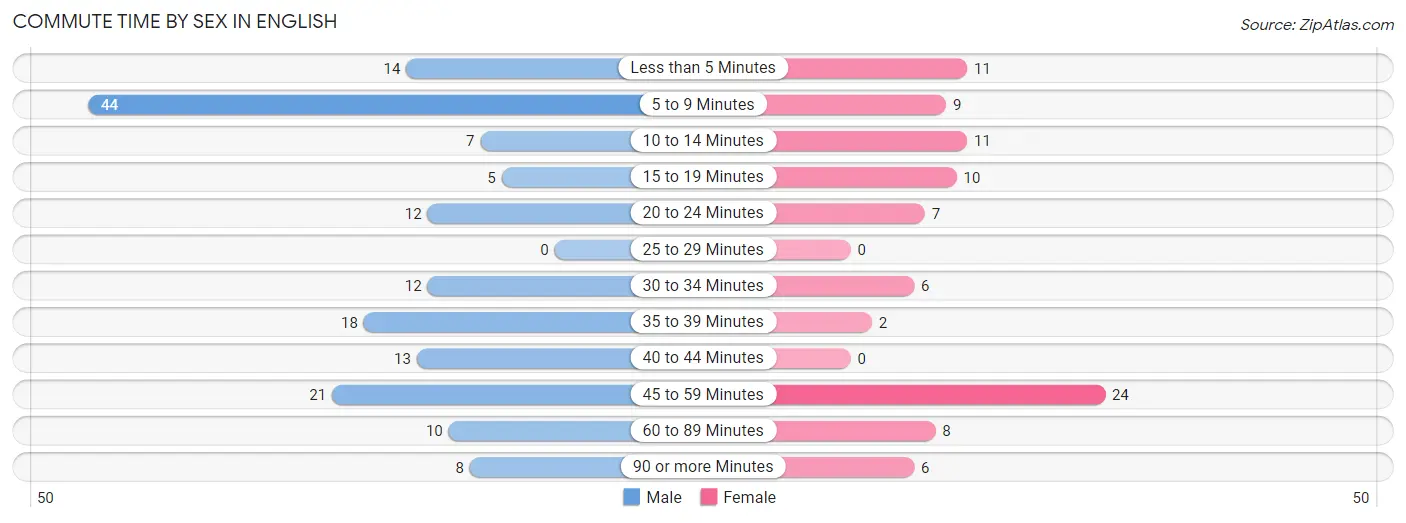
| Commute Time | Male | Female |
| Less than 5 Minutes | 14 (8.5%) | 11 (11.7%) |
| 5 to 9 Minutes | 44 (26.8%) | 9 (9.6%) |
| 10 to 14 Minutes | 7 (4.3%) | 11 (11.7%) |
| 15 to 19 Minutes | 5 (3.0%) | 10 (10.6%) |
| 20 to 24 Minutes | 12 (7.3%) | 7 (7.4%) |
| 25 to 29 Minutes | 0 (0.0%) | 0 (0.0%) |
| 30 to 34 Minutes | 12 (7.3%) | 6 (6.4%) |
| 35 to 39 Minutes | 18 (11.0%) | 2 (2.1%) |
| 40 to 44 Minutes | 13 (7.9%) | 0 (0.0%) |
| 45 to 59 Minutes | 21 (12.8%) | 24 (25.5%) |
| 60 to 89 Minutes | 10 (6.1%) | 8 (8.5%) |
| 90 or more Minutes | 8 (4.9%) | 6 (6.4%) |
Time of Departure to Work by Sex in English
The most frequent times of departure to work in English are 7:30 AM to 7:59 AM (49, 29.9%) for males and 12:00 AM to 4:59 AM (16, 17.0%) for females.
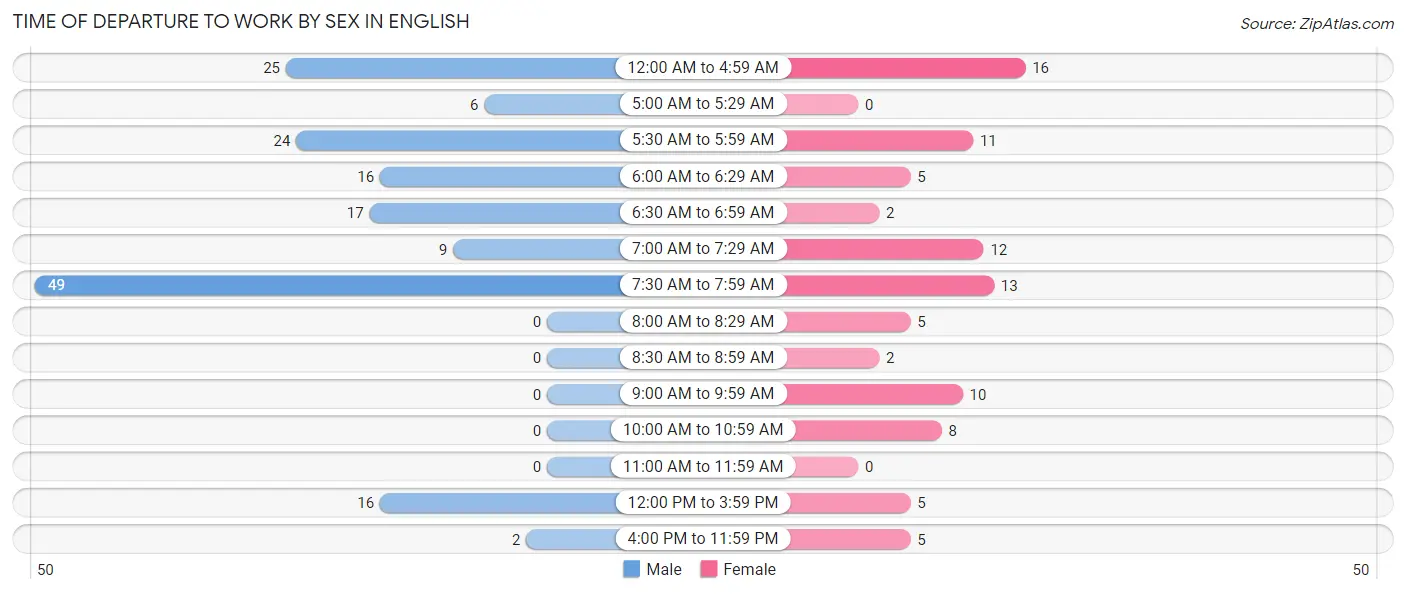
| Time of Departure | Male | Female |
| 12:00 AM to 4:59 AM | 25 (15.2%) | 16 (17.0%) |
| 5:00 AM to 5:29 AM | 6 (3.7%) | 0 (0.0%) |
| 5:30 AM to 5:59 AM | 24 (14.6%) | 11 (11.7%) |
| 6:00 AM to 6:29 AM | 16 (9.8%) | 5 (5.3%) |
| 6:30 AM to 6:59 AM | 17 (10.4%) | 2 (2.1%) |
| 7:00 AM to 7:29 AM | 9 (5.5%) | 12 (12.8%) |
| 7:30 AM to 7:59 AM | 49 (29.9%) | 13 (13.8%) |
| 8:00 AM to 8:29 AM | 0 (0.0%) | 5 (5.3%) |
| 8:30 AM to 8:59 AM | 0 (0.0%) | 2 (2.1%) |
| 9:00 AM to 9:59 AM | 0 (0.0%) | 10 (10.6%) |
| 10:00 AM to 10:59 AM | 0 (0.0%) | 8 (8.5%) |
| 11:00 AM to 11:59 AM | 0 (0.0%) | 0 (0.0%) |
| 12:00 PM to 3:59 PM | 16 (9.8%) | 5 (5.3%) |
| 4:00 PM to 11:59 PM | 2 (1.2%) | 5 (5.3%) |
| Total | 164 (100.0%) | 94 (100.0%) |
Housing Occupancy in English
Occupancy by Ownership in English
Of the total 341 dwellings in English, owner-occupied units account for 237 (69.5%), while renter-occupied units make up 104 (30.5%).
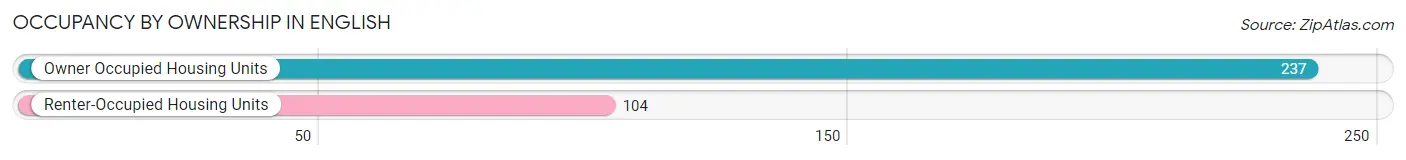
| Occupancy | # Housing Units | % Housing Units |
| Owner Occupied Housing Units | 237 | 69.5% |
| Renter-Occupied Housing Units | 104 | 30.5% |
| Total Occupied Housing Units | 341 | 100.0% |
Occupancy by Household Size in English
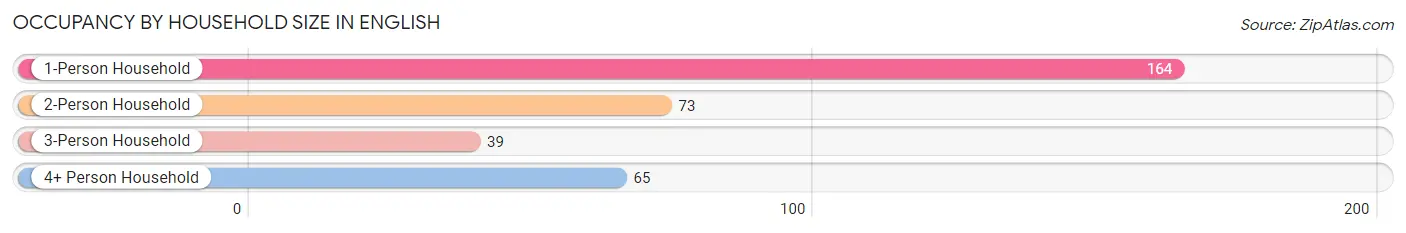
| Household Size | # Housing Units | % Housing Units |
| 1-Person Household | 164 | 48.1% |
| 2-Person Household | 73 | 21.4% |
| 3-Person Household | 39 | 11.4% |
| 4+ Person Household | 65 | 19.1% |
| Total Housing Units | 341 | 100.0% |
Occupancy by Ownership by Household Size in English
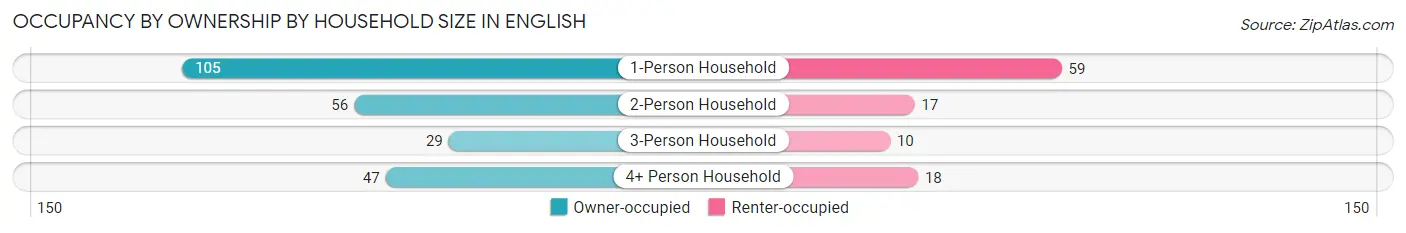
| Household Size | Owner-occupied | Renter-occupied |
| 1-Person Household | 105 (64.0%) | 59 (36.0%) |
| 2-Person Household | 56 (76.7%) | 17 (23.3%) |
| 3-Person Household | 29 (74.4%) | 10 (25.6%) |
| 4+ Person Household | 47 (72.3%) | 18 (27.7%) |
| Total Housing Units | 237 (69.5%) | 104 (30.5%) |
Occupancy by Educational Attainment in English
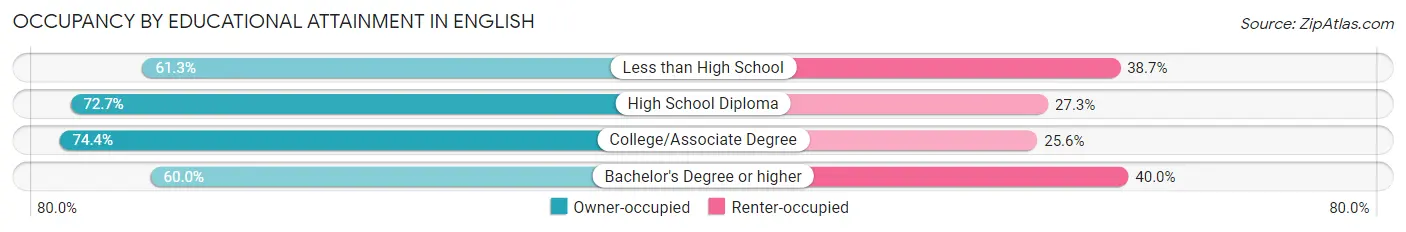
| Household Size | Owner-occupied | Renter-occupied |
| Less than High School | 57 (61.3%) | 36 (38.7%) |
| High School Diploma | 104 (72.7%) | 39 (27.3%) |
| College/Associate Degree | 67 (74.4%) | 23 (25.6%) |
| Bachelor's Degree or higher | 9 (60.0%) | 6 (40.0%) |
Occupancy by Age of Householder in English
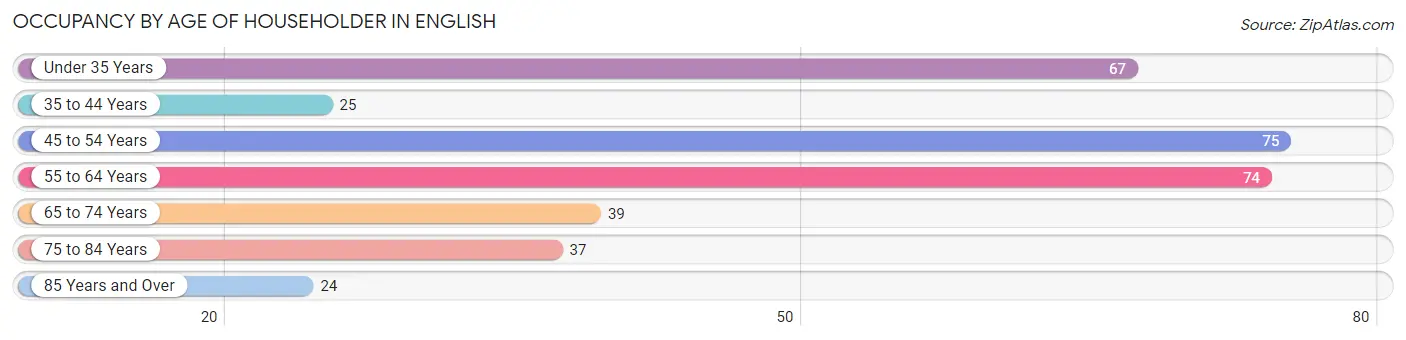
| Age Bracket | # Households | % Households |
| Under 35 Years | 67 | 19.7% |
| 35 to 44 Years | 25 | 7.3% |
| 45 to 54 Years | 75 | 22.0% |
| 55 to 64 Years | 74 | 21.7% |
| 65 to 74 Years | 39 | 11.4% |
| 75 to 84 Years | 37 | 10.8% |
| 85 Years and Over | 24 | 7.0% |
| Total | 341 | 100.0% |
Housing Finances in English
Median Income by Occupancy in English
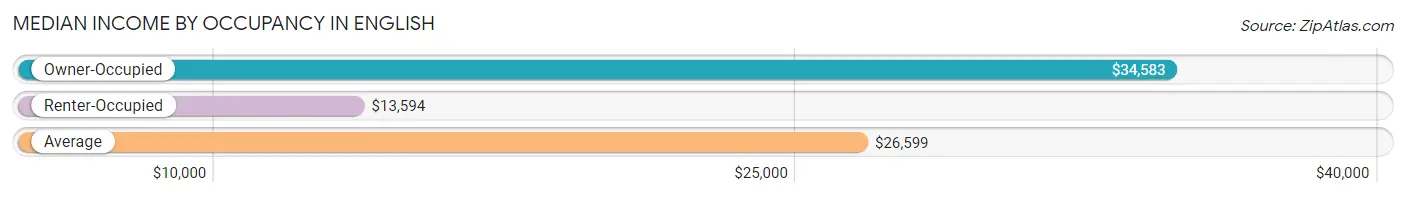
| Occupancy Type | # Households | Median Income |
| Owner-Occupied | 237 (69.5%) | $34,583 |
| Renter-Occupied | 104 (30.5%) | $13,594 |
| Average | 341 (100.0%) | $26,599 |
Occupancy by Householder Income Bracket in English
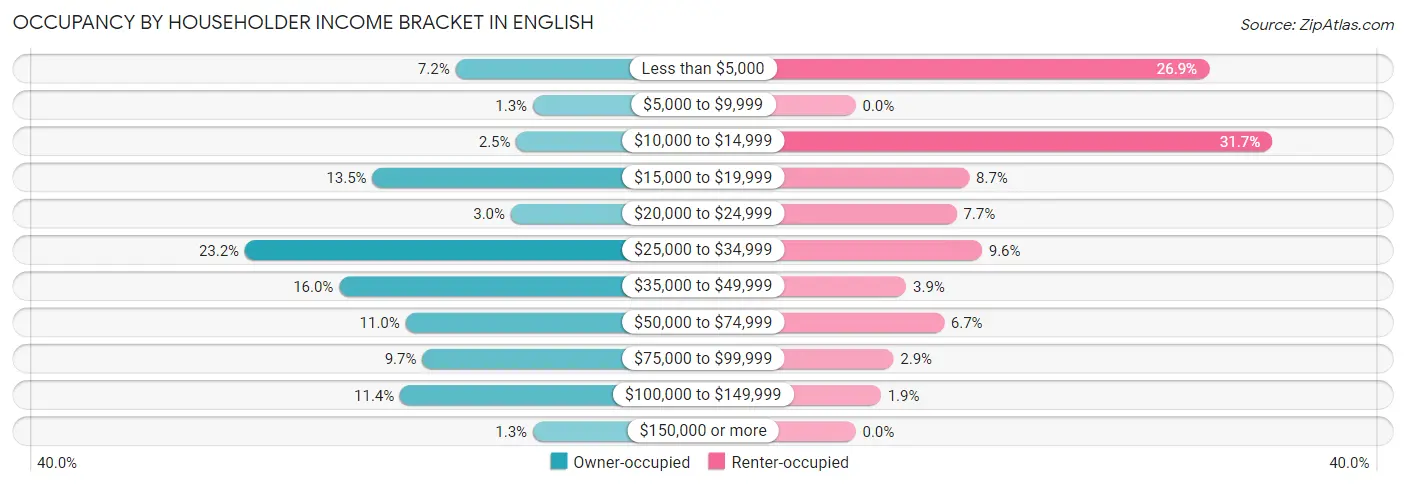
| Income Bracket | Owner-occupied | Renter-occupied |
| Less than $5,000 | 17 (7.2%) | 28 (26.9%) |
| $5,000 to $9,999 | 3 (1.3%) | 0 (0.0%) |
| $10,000 to $14,999 | 6 (2.5%) | 33 (31.7%) |
| $15,000 to $19,999 | 32 (13.5%) | 9 (8.6%) |
| $20,000 to $24,999 | 7 (2.9%) | 8 (7.7%) |
| $25,000 to $34,999 | 55 (23.2%) | 10 (9.6%) |
| $35,000 to $49,999 | 38 (16.0%) | 4 (3.8%) |
| $50,000 to $74,999 | 26 (11.0%) | 7 (6.7%) |
| $75,000 to $99,999 | 23 (9.7%) | 3 (2.9%) |
| $100,000 to $149,999 | 27 (11.4%) | 2 (1.9%) |
| $150,000 or more | 3 (1.3%) | 0 (0.0%) |
| Total | 237 (100.0%) | 104 (100.0%) |
Monthly Housing Cost Tiers in English
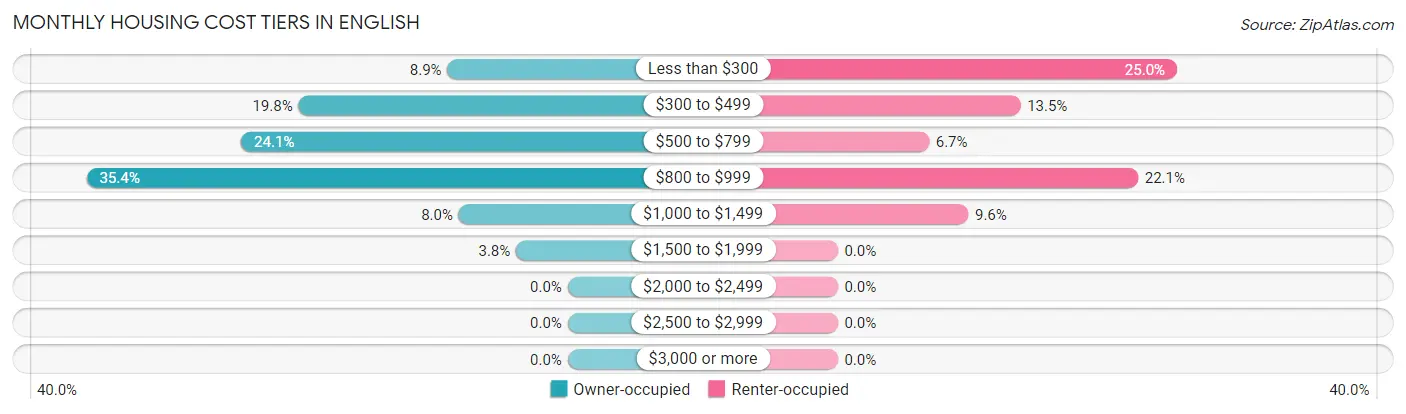
| Monthly Cost | Owner-occupied | Renter-occupied |
| Less than $300 | 21 (8.9%) | 26 (25.0%) |
| $300 to $499 | 47 (19.8%) | 14 (13.5%) |
| $500 to $799 | 57 (24.0%) | 7 (6.7%) |
| $800 to $999 | 84 (35.4%) | 23 (22.1%) |
| $1,000 to $1,499 | 19 (8.0%) | 10 (9.6%) |
| $1,500 to $1,999 | 9 (3.8%) | 0 (0.0%) |
| $2,000 to $2,499 | 0 (0.0%) | 0 (0.0%) |
| $2,500 to $2,999 | 0 (0.0%) | 0 (0.0%) |
| $3,000 or more | 0 (0.0%) | 0 (0.0%) |
| Total | 237 (100.0%) | 104 (100.0%) |
Physical Housing Characteristics in English
Housing Structures in English
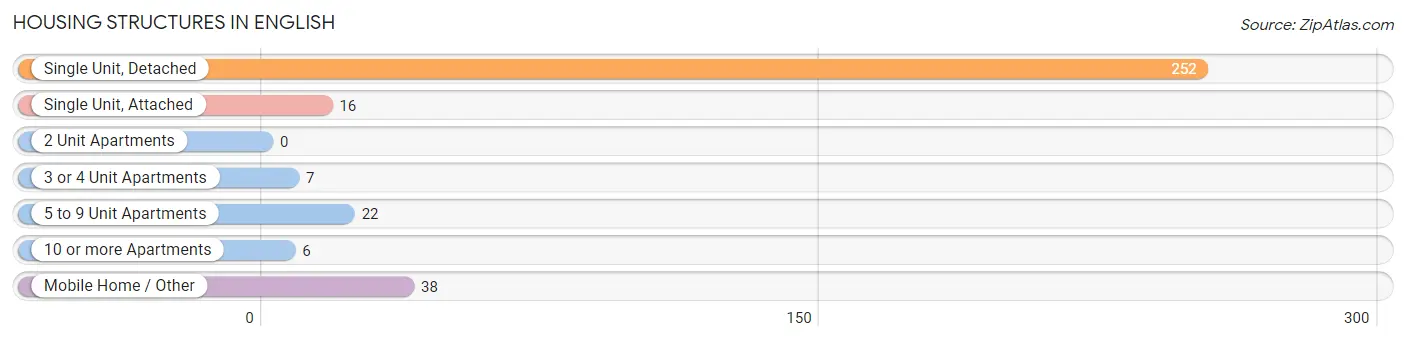
| Structure Type | # Housing Units | % Housing Units |
| Single Unit, Detached | 252 | 73.9% |
| Single Unit, Attached | 16 | 4.7% |
| 2 Unit Apartments | 0 | 0.0% |
| 3 or 4 Unit Apartments | 7 | 2.1% |
| 5 to 9 Unit Apartments | 22 | 6.5% |
| 10 or more Apartments | 6 | 1.8% |
| Mobile Home / Other | 38 | 11.1% |
| Total | 341 | 100.0% |
Housing Structures by Occupancy in English
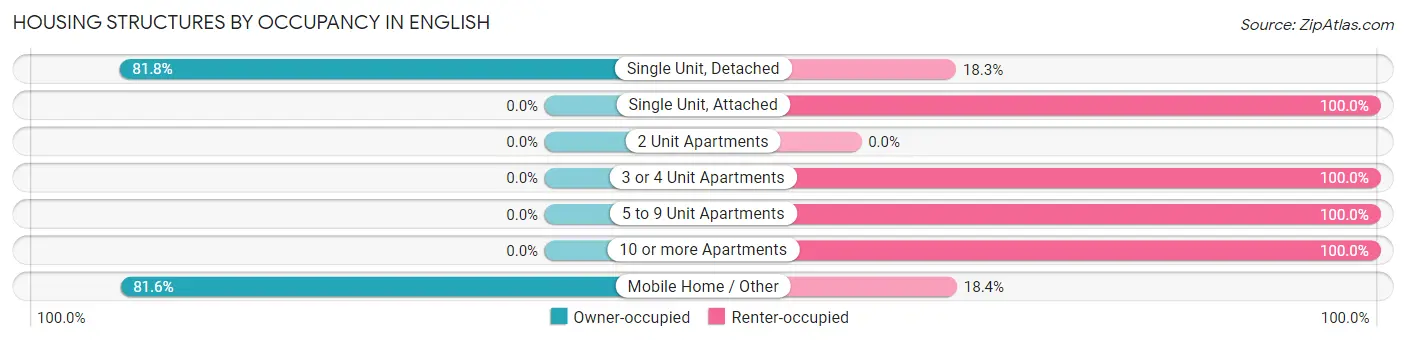
| Structure Type | Owner-occupied | Renter-occupied |
| Single Unit, Detached | 206 (81.8%) | 46 (18.2%) |
| Single Unit, Attached | 0 (0.0%) | 16 (100.0%) |
| 2 Unit Apartments | 0 (0.0%) | 0 (0.0%) |
| 3 or 4 Unit Apartments | 0 (0.0%) | 7 (100.0%) |
| 5 to 9 Unit Apartments | 0 (0.0%) | 22 (100.0%) |
| 10 or more Apartments | 0 (0.0%) | 6 (100.0%) |
| Mobile Home / Other | 31 (81.6%) | 7 (18.4%) |
| Total | 237 (69.5%) | 104 (30.5%) |
Housing Structures by Number of Rooms in English
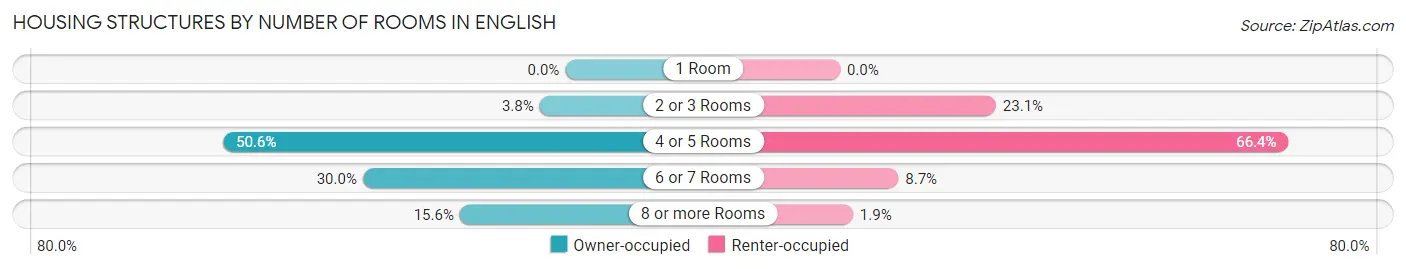
| Number of Rooms | Owner-occupied | Renter-occupied |
| 1 Room | 0 (0.0%) | 0 (0.0%) |
| 2 or 3 Rooms | 9 (3.8%) | 24 (23.1%) |
| 4 or 5 Rooms | 120 (50.6%) | 69 (66.3%) |
| 6 or 7 Rooms | 71 (30.0%) | 9 (8.6%) |
| 8 or more Rooms | 37 (15.6%) | 2 (1.9%) |
| Total | 237 (100.0%) | 104 (100.0%) |
Housing Structure by Heating Type in English
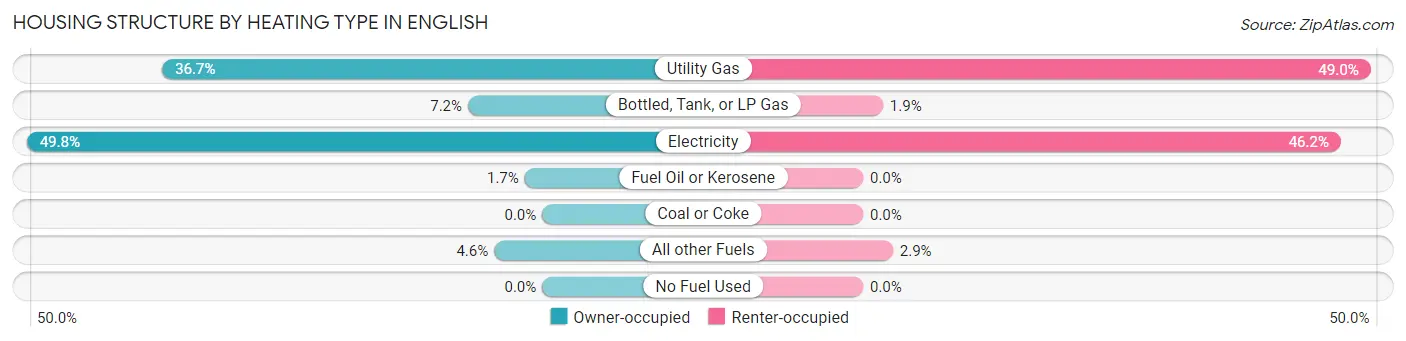
| Heating Type | Owner-occupied | Renter-occupied |
| Utility Gas | 87 (36.7%) | 51 (49.0%) |
| Bottled, Tank, or LP Gas | 17 (7.2%) | 2 (1.9%) |
| Electricity | 118 (49.8%) | 48 (46.2%) |
| Fuel Oil or Kerosene | 4 (1.7%) | 0 (0.0%) |
| Coal or Coke | 0 (0.0%) | 0 (0.0%) |
| All other Fuels | 11 (4.6%) | 3 (2.9%) |
| No Fuel Used | 0 (0.0%) | 0 (0.0%) |
| Total | 237 (100.0%) | 104 (100.0%) |
Household Vehicle Usage in English
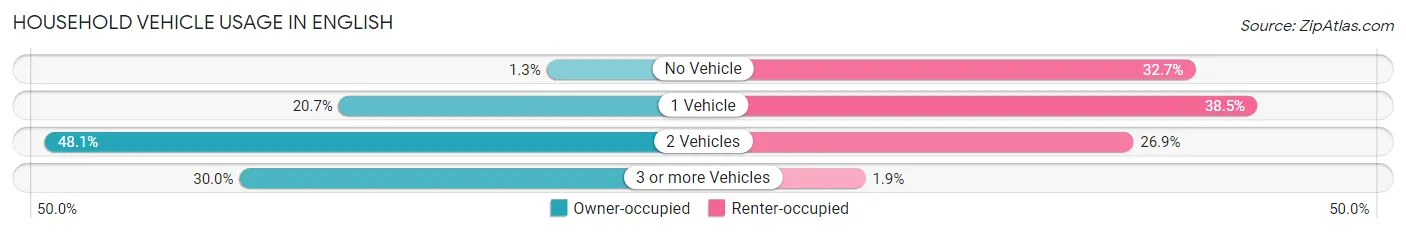
| Vehicles per Household | Owner-occupied | Renter-occupied |
| No Vehicle | 3 (1.3%) | 34 (32.7%) |
| 1 Vehicle | 49 (20.7%) | 40 (38.5%) |
| 2 Vehicles | 114 (48.1%) | 28 (26.9%) |
| 3 or more Vehicles | 71 (30.0%) | 2 (1.9%) |
| Total | 237 (100.0%) | 104 (100.0%) |
Real Estate & Mortgages in English
Real Estate and Mortgage Overview in English
| Characteristic | Without Mortgage | With Mortgage |
| Housing Units | 88 | 149 |
| Median Property Value | $48,000 | $86,300 |
| Median Household Income | $28,333 | $3 |
| Monthly Housing Costs | $381 | $0 |
| Real Estate Taxes | $530 | $13 |
Property Value by Mortgage Status in English
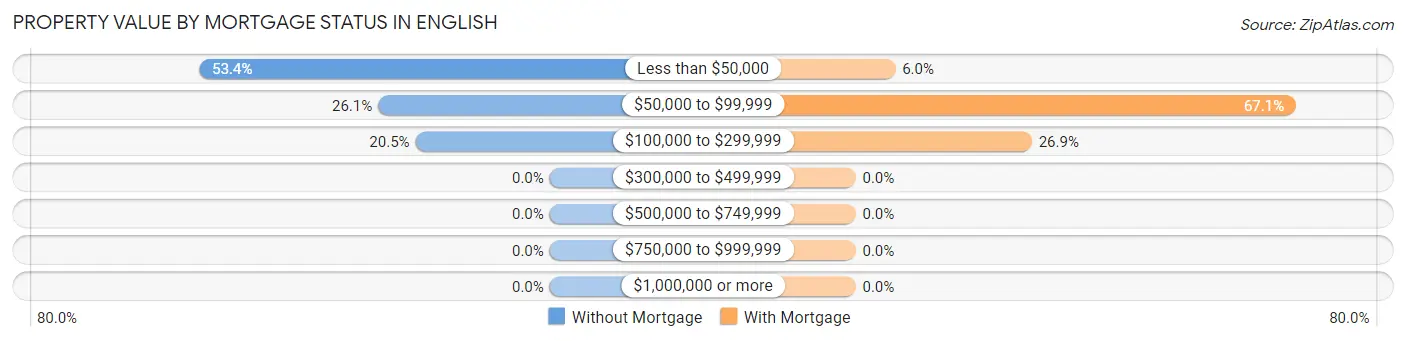
| Property Value | Without Mortgage | With Mortgage |
| Less than $50,000 | 47 (53.4%) | 9 (6.0%) |
| $50,000 to $99,999 | 23 (26.1%) | 100 (67.1%) |
| $100,000 to $299,999 | 18 (20.4%) | 40 (26.9%) |
| $300,000 to $499,999 | 0 (0.0%) | 0 (0.0%) |
| $500,000 to $749,999 | 0 (0.0%) | 0 (0.0%) |
| $750,000 to $999,999 | 0 (0.0%) | 0 (0.0%) |
| $1,000,000 or more | 0 (0.0%) | 0 (0.0%) |
| Total | 88 (100.0%) | 149 (100.0%) |
Household Income by Mortgage Status in English
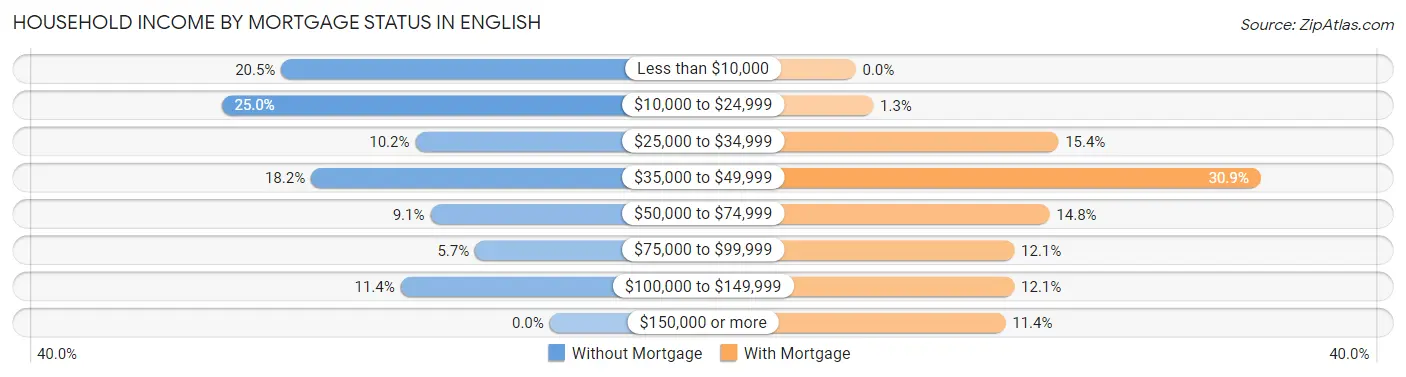
| Household Income | Without Mortgage | With Mortgage |
| Less than $10,000 | 18 (20.4%) | 0 (0.0%) |
| $10,000 to $24,999 | 22 (25.0%) | 2 (1.3%) |
| $25,000 to $34,999 | 9 (10.2%) | 23 (15.4%) |
| $35,000 to $49,999 | 16 (18.2%) | 46 (30.9%) |
| $50,000 to $74,999 | 8 (9.1%) | 22 (14.8%) |
| $75,000 to $99,999 | 5 (5.7%) | 18 (12.1%) |
| $100,000 to $149,999 | 10 (11.4%) | 18 (12.1%) |
| $150,000 or more | 0 (0.0%) | 17 (11.4%) |
| Total | 88 (100.0%) | 149 (100.0%) |
Property Value to Household Income Ratio in English
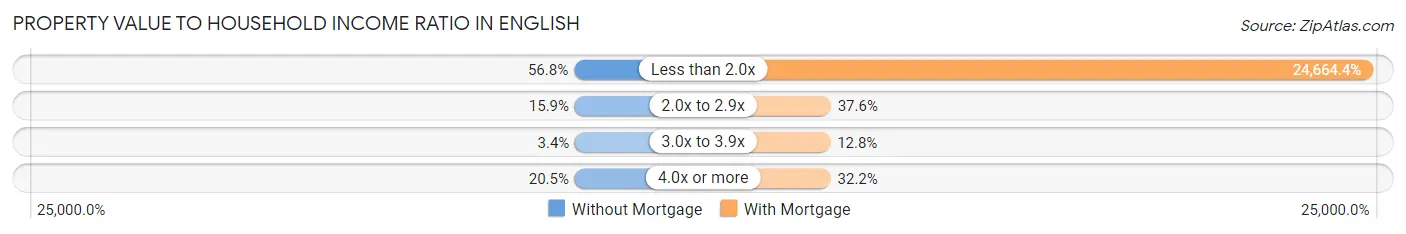
| Value-to-Income Ratio | Without Mortgage | With Mortgage |
| Less than 2.0x | 50 (56.8%) | 36,750 (24,664.4%) |
| 2.0x to 2.9x | 14 (15.9%) | 56 (37.6%) |
| 3.0x to 3.9x | 3 (3.4%) | 19 (12.8%) |
| 4.0x or more | 18 (20.4%) | 48 (32.2%) |
| Total | 88 (100.0%) | 149 (100.0%) |
Real Estate Taxes by Mortgage Status in English
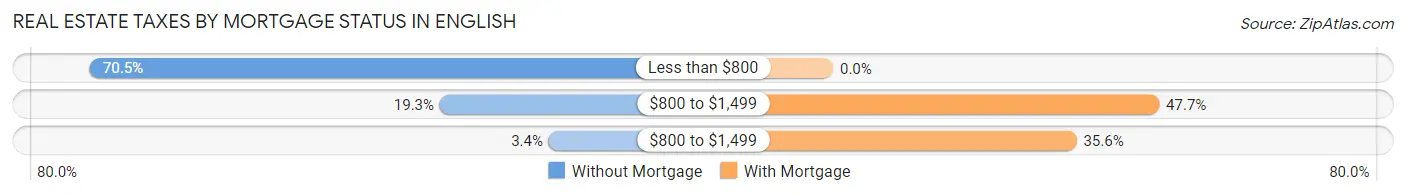
| Property Taxes | Without Mortgage | With Mortgage |
| Less than $800 | 62 (70.5%) | 0 (0.0%) |
| $800 to $1,499 | 17 (19.3%) | 71 (47.6%) |
| $800 to $1,499 | 3 (3.4%) | 53 (35.6%) |
| Total | 88 (100.0%) | 149 (100.0%) |
Health & Disability in English
Health Insurance Coverage by Age in English
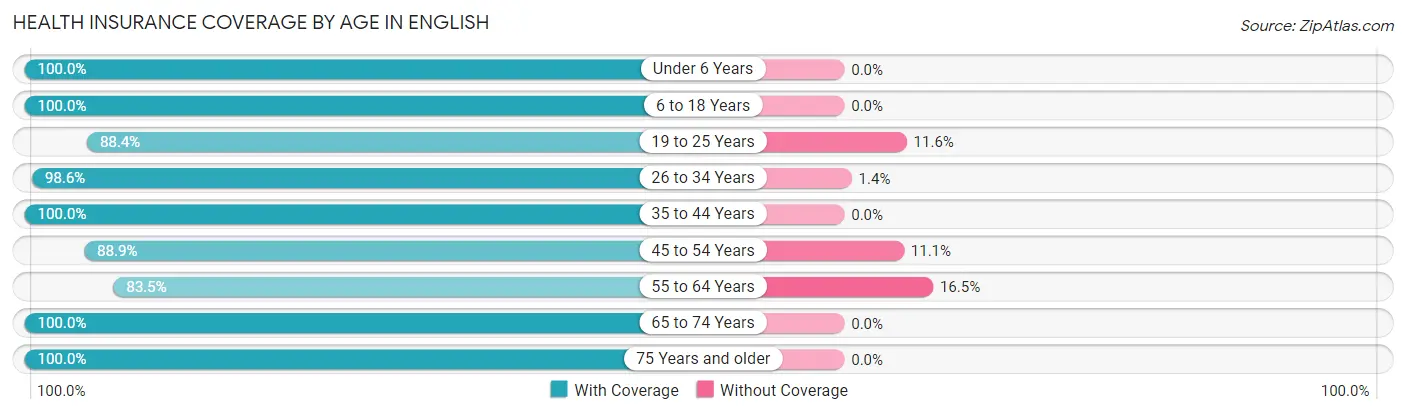
| Age Bracket | With Coverage | Without Coverage |
| Under 6 Years | 148 (100.0%) | 0 (0.0%) |
| 6 to 18 Years | 350 (100.0%) | 0 (0.0%) |
| 19 to 25 Years | 38 (88.4%) | 5 (11.6%) |
| 26 to 34 Years | 144 (98.6%) | 2 (1.4%) |
| 35 to 44 Years | 50 (100.0%) | 0 (0.0%) |
| 45 to 54 Years | 104 (88.9%) | 13 (11.1%) |
| 55 to 64 Years | 106 (83.5%) | 21 (16.5%) |
| 65 to 74 Years | 50 (100.0%) | 0 (0.0%) |
| 75 Years and older | 70 (100.0%) | 0 (0.0%) |
| Total | 1,060 (96.3%) | 41 (3.7%) |
Health Insurance Coverage by Citizenship Status in English
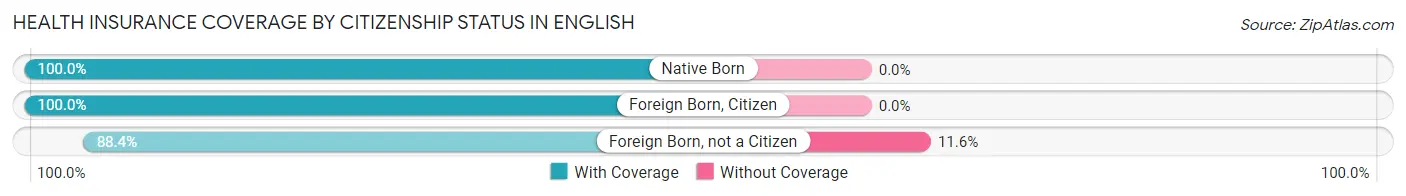
| Citizenship Status | With Coverage | Without Coverage |
| Native Born | 148 (100.0%) | 0 (0.0%) |
| Foreign Born, Citizen | 350 (100.0%) | 0 (0.0%) |
| Foreign Born, not a Citizen | 38 (88.4%) | 5 (11.6%) |
Health Insurance Coverage by Household Income in English
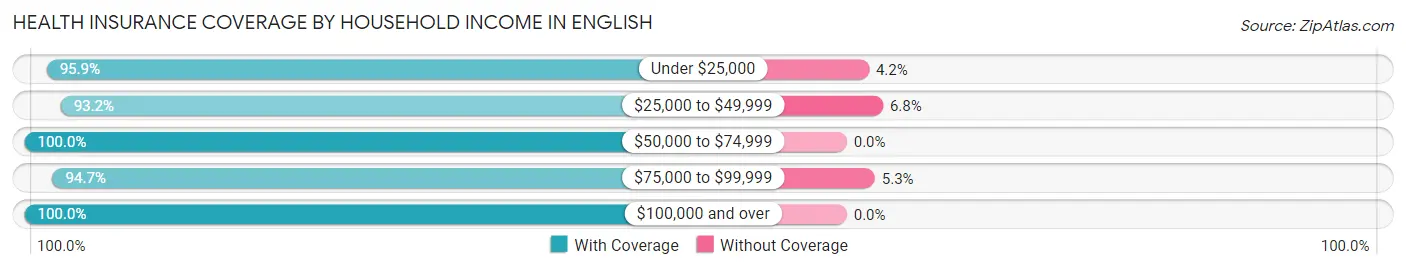
| Household Income | With Coverage | Without Coverage |
| Under $25,000 | 578 (95.9%) | 25 (4.2%) |
| $25,000 to $49,999 | 179 (93.2%) | 13 (6.8%) |
| $50,000 to $74,999 | 103 (100.0%) | 0 (0.0%) |
| $75,000 to $99,999 | 54 (94.7%) | 3 (5.3%) |
| $100,000 and over | 146 (100.0%) | 0 (0.0%) |
Public vs Private Health Insurance Coverage by Age in English
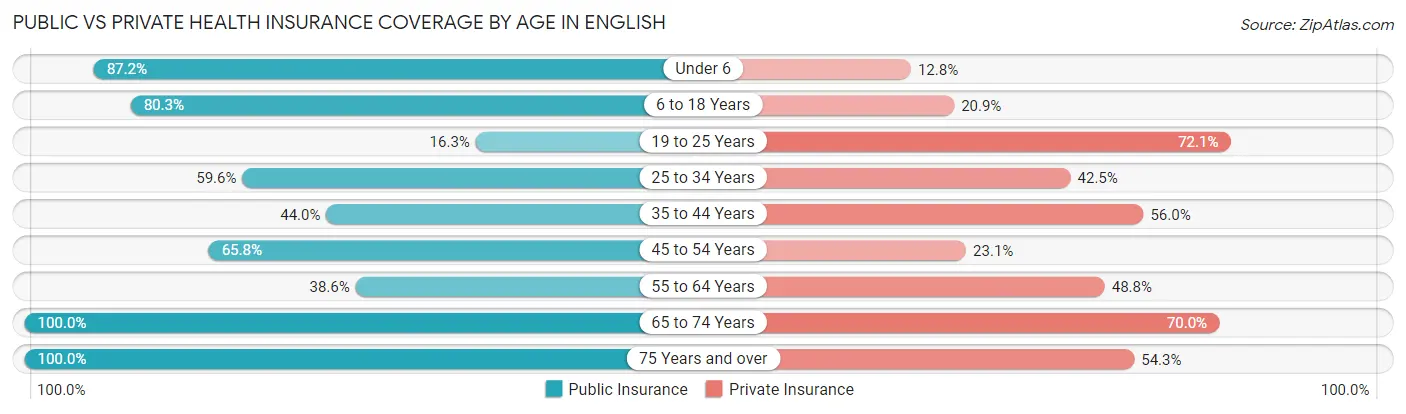
| Age Bracket | Public Insurance | Private Insurance |
| Under 6 | 129 (87.2%) | 19 (12.8%) |
| 6 to 18 Years | 281 (80.3%) | 73 (20.9%) |
| 19 to 25 Years | 7 (16.3%) | 31 (72.1%) |
| 25 to 34 Years | 87 (59.6%) | 62 (42.5%) |
| 35 to 44 Years | 22 (44.0%) | 28 (56.0%) |
| 45 to 54 Years | 77 (65.8%) | 27 (23.1%) |
| 55 to 64 Years | 49 (38.6%) | 62 (48.8%) |
| 65 to 74 Years | 50 (100.0%) | 35 (70.0%) |
| 75 Years and over | 70 (100.0%) | 38 (54.3%) |
| Total | 772 (70.1%) | 375 (34.1%) |
Disability Status by Sex by Age in English
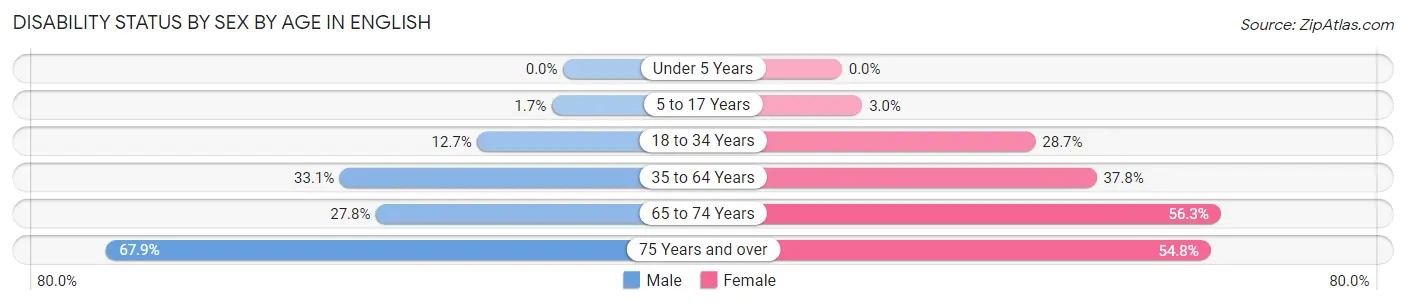
| Age Bracket | Male | Female |
| Under 5 Years | 0 (0.0%) | 0 (0.0%) |
| 5 to 17 Years | 3 (1.7%) | 5 (3.0%) |
| 18 to 34 Years | 14 (12.7%) | 25 (28.7%) |
| 35 to 64 Years | 58 (33.1%) | 45 (37.8%) |
| 65 to 74 Years | 5 (27.8%) | 18 (56.2%) |
| 75 Years and over | 19 (67.9%) | 23 (54.8%) |
Disability Class by Sex by Age in English
Disability Class: Hearing Difficulty
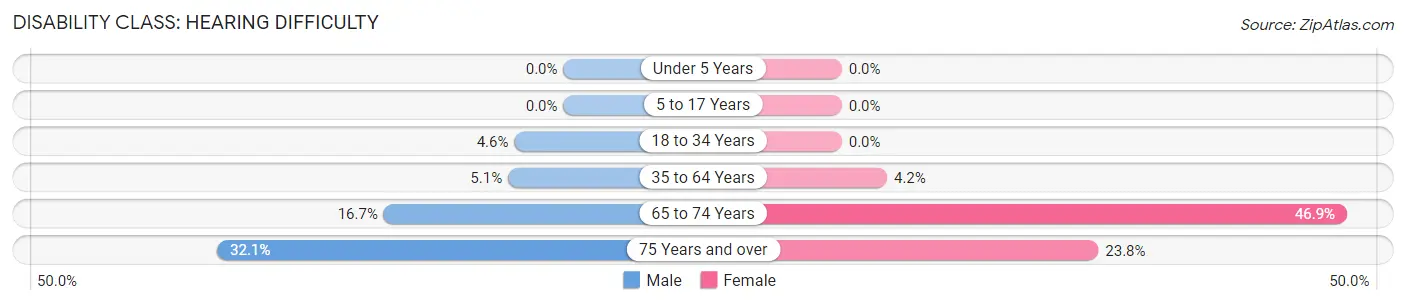
| Age Bracket | Male | Female |
| Under 5 Years | 0 (0.0%) | 0 (0.0%) |
| 5 to 17 Years | 0 (0.0%) | 0 (0.0%) |
| 18 to 34 Years | 5 (4.5%) | 0 (0.0%) |
| 35 to 64 Years | 9 (5.1%) | 5 (4.2%) |
| 65 to 74 Years | 3 (16.7%) | 15 (46.9%) |
| 75 Years and over | 9 (32.1%) | 10 (23.8%) |
Disability Class: Vision Difficulty
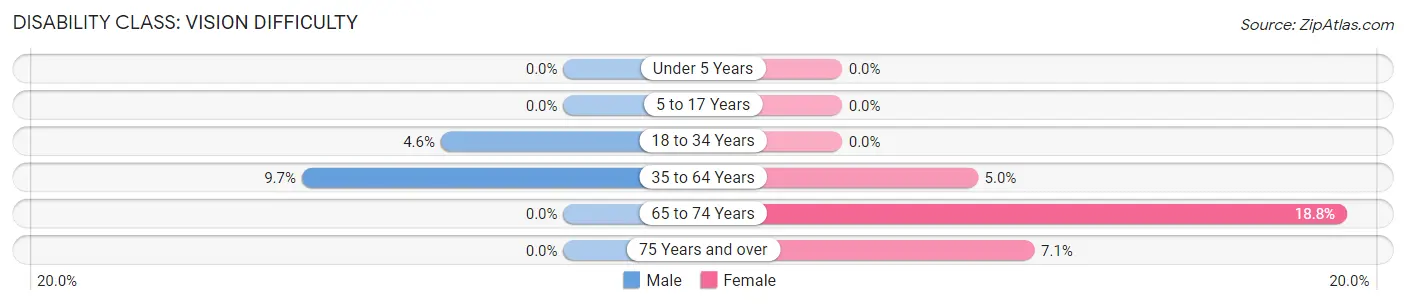
| Age Bracket | Male | Female |
| Under 5 Years | 0 (0.0%) | 0 (0.0%) |
| 5 to 17 Years | 0 (0.0%) | 0 (0.0%) |
| 18 to 34 Years | 5 (4.5%) | 0 (0.0%) |
| 35 to 64 Years | 17 (9.7%) | 6 (5.0%) |
| 65 to 74 Years | 0 (0.0%) | 6 (18.8%) |
| 75 Years and over | 0 (0.0%) | 3 (7.1%) |
Disability Class: Cognitive Difficulty
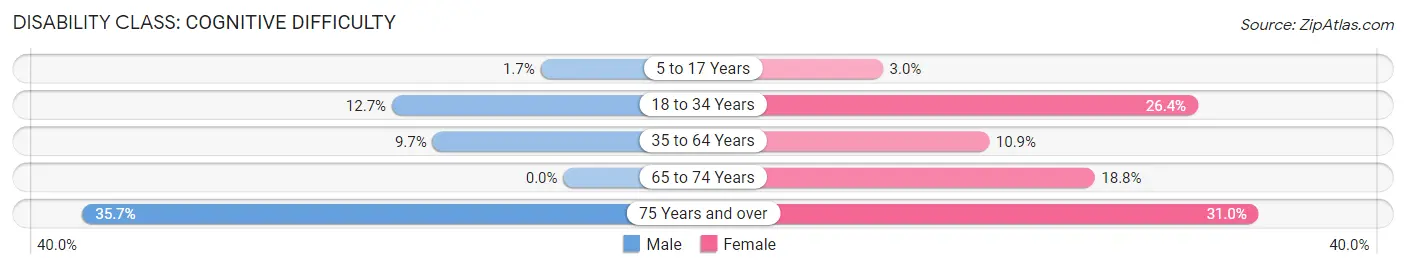
| Age Bracket | Male | Female |
| 5 to 17 Years | 3 (1.7%) | 5 (3.0%) |
| 18 to 34 Years | 14 (12.7%) | 23 (26.4%) |
| 35 to 64 Years | 17 (9.7%) | 13 (10.9%) |
| 65 to 74 Years | 0 (0.0%) | 6 (18.8%) |
| 75 Years and over | 10 (35.7%) | 13 (30.9%) |
Disability Class: Ambulatory Difficulty
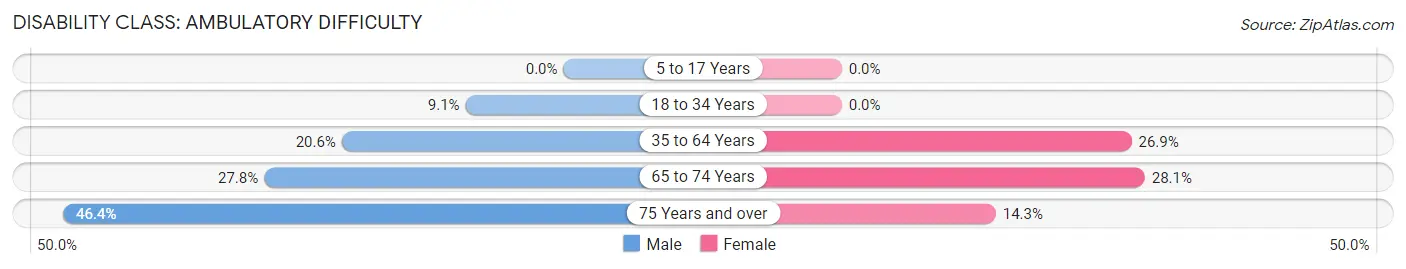
| Age Bracket | Male | Female |
| 5 to 17 Years | 0 (0.0%) | 0 (0.0%) |
| 18 to 34 Years | 10 (9.1%) | 0 (0.0%) |
| 35 to 64 Years | 36 (20.6%) | 32 (26.9%) |
| 65 to 74 Years | 5 (27.8%) | 9 (28.1%) |
| 75 Years and over | 13 (46.4%) | 6 (14.3%) |
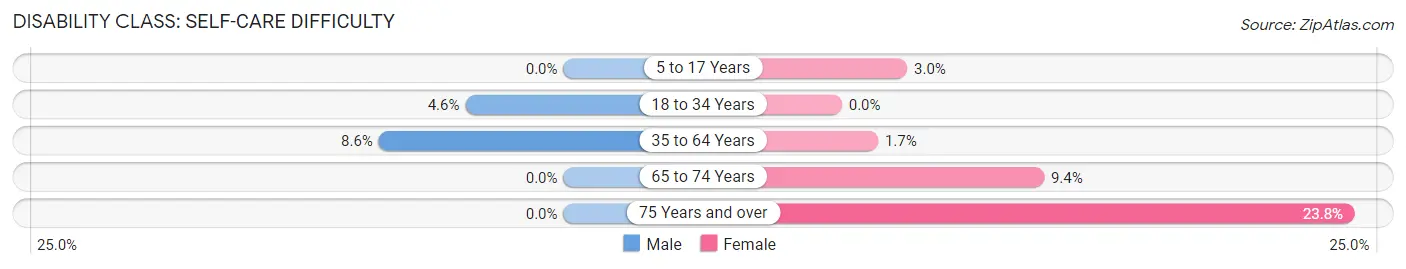
Disability Class: Self-Care Difficulty
| Age Bracket | Male | Female |
| 5 to 17 Years | 0 (0.0%) | 5 (3.0%) |
| 18 to 34 Years | 5 (4.5%) | 0 (0.0%) |
| 35 to 64 Years | 15 (8.6%) | 2 (1.7%) |
| 65 to 74 Years | 0 (0.0%) | 3 (9.4%) |
| 75 Years and over | 0 (0.0%) | 10 (23.8%) |
Technology Access in English
Computing Device Access in English
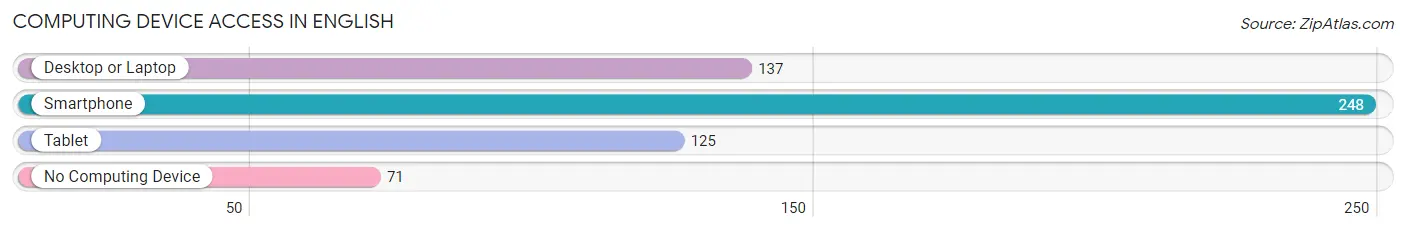
| Device Type | # Households | % Households |
| Desktop or Laptop | 137 | 40.2% |
| Smartphone | 248 | 72.7% |
| Tablet | 125 | 36.7% |
| No Computing Device | 71 | 20.8% |
| Total | 341 | 100.0% |
Internet Access in English
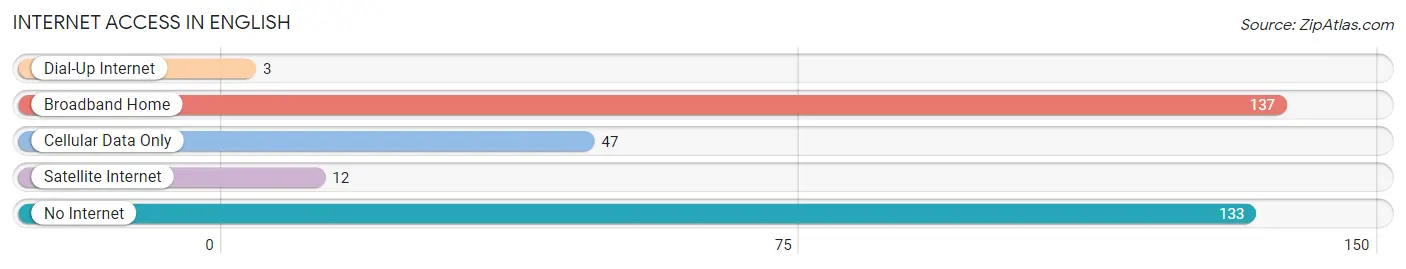
| Internet Type | # Households | % Households |
| Dial-Up Internet | 3 | 0.9% |
| Broadband Home | 137 | 40.2% |
| Cellular Data Only | 47 | 13.8% |
| Satellite Internet | 12 | 3.5% |
| No Internet | 133 | 39.0% |
| Total | 341 | 100.0% |
English Summary
English History
The history of England is long and complex, stretching back to the arrival of the Anglo-Saxons in the 5th century. The country has seen many changes over the centuries, from the Norman Conquest in 1066 to the Industrial Revolution in the 18th century. England has been a major player in world events, from the Hundred Years War to the two World Wars. The country has also been a major cultural force, producing some of the world’s most famous writers, artists, and musicians.
The Anglo-Saxons arrived in England in the 5th century, bringing with them their own language and culture. They established several kingdoms, the most powerful of which was Wessex. In 1066, the Normans invaded England and defeated the Anglo-Saxons at the Battle of Hastings. The Normans brought with them a new language, culture, and government. They also built castles and cathedrals, and introduced the feudal system.
The Middle Ages saw the rise of the English monarchy, with the reigns of Henry II, Richard I, and Edward I. This period also saw the establishment of the Magna Carta, which limited the power of the monarchy and established the rights of the people. The Hundred Years War between England and France began in 1337 and lasted until 1453. During this time, England was ruled by the Plantagenet dynasty.
The Tudor period began in 1485 with the reign of Henry VII. This period saw the establishment of the Church of England and the beginning of the English Reformation. It also saw the exploration of the New World by English explorers such as Sir Francis Drake and the establishment of the first British colonies in North America.
The Stuart period began in 1603 with the reign of James I. This period saw the English Civil War, the Glorious Revolution, and the Act of Union with Scotland. It also saw the rise of the British Empire, with the establishment of colonies in India, Africa, and the Americas.
The Georgian period began in 1714 with the reign of George I. This period saw the Industrial Revolution, which transformed England from an agricultural society to an industrial one. It also saw the expansion of the British Empire and the abolition of slavery.
The Victorian period began in 1837 with the reign of Queen Victoria. This period saw the expansion of the British Empire, the development of the railway system, and the growth of industry. It also saw the rise of the middle class and the development of public education.
The Edwardian period began in 1901 with the reign of Edward VII. This period saw the development of the welfare state, the rise of the Labour Party, and the emergence of the suffragette movement. It also saw the beginning of the First World War.
The 20th century saw the rise of the Labour Party, the establishment of the National Health Service, and the end of the British Empire. It also saw the emergence of the United Kingdom as a major world power.
Geography
England is located in the British Isles, off the northwest coast of Europe. It is bordered by Scotland to the north, Wales to the west, and the Irish Sea to the west and south. The country is divided into nine regions: North East, North West, Yorkshire and the Humber, East Midlands, West Midlands, East of England, London, South East, and South West.
England is a relatively small country, with an area of 130,395 square kilometres. It is mostly low-lying, with the highest point being Scafell Pike in the Lake District, at 978 metres. The country is divided into two main physical regions: the lowland areas in the south and east, and the upland areas in the north and west.
The climate of England is temperate, with mild winters and warm summers. The south and east of the country are generally warmer and drier than the north and west. The country receives most of its rainfall in the winter months, with the south and east receiving more than the north and west.
Economy
The economy of England is one of the largest and most developed in the world. It is a major exporter of goods and services, and is home to some of the world’s largest companies. The country is a member of the European Union and the G7.
The economy of England is largely based on services, which account for around 80% of the country’s GDP. The main sectors are finance, business services, and public administration. Manufacturing and agriculture are also important sectors, although they account for a smaller share of the economy.
The currency of England is the pound sterling. The country has a highly developed financial sector, with London being one of the world’s leading financial centres. The country also has a well-developed infrastructure, with a network of roads, railways, and airports.
Demographics
England has a population of around 53 million people. The majority of the population is of British descent, although there are also significant minority populations of Irish, South Asian, and African descent. The largest cities are London, Birmingham, Manchester, Leeds, and Liverpool.
The official language of England is English, although there are also significant minority languages such as Welsh, Scottish Gaelic, and Cornish. The majority of the population is Christian, although there are also significant minority religions such as Islam, Hinduism, and Sikhism.
The life expectancy in England is around 81 years for men and 84 years for women. The country has a high literacy rate, with around 99% of the population being able to read and write. The country also has a high level of education, with around 40% of the population having a university degree.
Common Questions
What is Per Capita Income in English?
Per Capita income in English is $13,285.
What is the Median Family Income in English?
Median Family Income in English is $43,333.
What is the Median Household income in English?
Median Household Income in English is $26,599.
What is Income or Wage Gap in English?
Income or Wage Gap in English is 14.3%.
Women in English earn 85.7 cents for every dollar earned by a man.
What is Family Income Deficit in English?
Family Income Deficit in English is $15,359.
Families that are below poverty line in English earn $15,359 less on average than the poverty threshold level.
What is Inequality or Gini Index in English?
Inequality or Gini Index in English is 0.47.
What is the Total Population of English?
Total Population of English is 1,101.
What is the Total Male Population of English?
Total Male Population of English is 564.
What is the Total Female Population of English?
Total Female Population of English is 537.
What is the Ratio of Males per 100 Females in English?
There are 105.03 Males per 100 Females in English.
What is the Ratio of Females per 100 Males in English?
There are 95.21 Females per 100 Males in English.
What is the Median Population Age in English?
Median Population Age in English is 26.3 Years.
What is the Average Family Size in English
Average Family Size in English is 5.4 People.
What is the Average Household Size in English
Average Household Size in English is 3.2 People.
How Large is the Labor Force in English?
There are 299 People in the Labor Forcein in English.
What is the Percentage of People in the Labor Force in English?
47.8% of People are in the Labor Force in English.
What is the Unemployment Rate in English?
Unemployment Rate in English is 3.0%.