Ellettsville, IN Map & Demographics
Ellettsville Map
Ellettsville Overview
$36,273
PER CAPITA INCOME
$93,925
AVG FAMILY INCOME
$79,455
AVG HOUSEHOLD INCOME
19.4%
WAGE / INCOME GAP [ % ]
80.6¢/ $1
WAGE / INCOME GAP [ $ ]
0.36
INEQUALITY / GINI INDEX
6,653
TOTAL POPULATION
3,111
MALE POPULATION
3,542
FEMALE POPULATION
87.83
MALES / 100 FEMALES
113.85
FEMALES / 100 MALES
35.2
MEDIAN AGE
2.8
AVG FAMILY SIZE
2.4
AVG HOUSEHOLD SIZE
3,694
LABOR FORCE [ PEOPLE ]
71.4%
PERCENT IN LABOR FORCE
1.7%
UNEMPLOYMENT RATE
Ellettsville Zip Codes
Ellettsville Area Codes
Income in Ellettsville
Income Overview in Ellettsville
Per Capita Income in Ellettsville is $36,273, while median incomes of families and households are $93,925 and $79,455 respectively.
| Characteristic | Number | Measure |
| Per Capita Income | 6,653 | $36,273 |
| Median Family Income | 2,024 | $93,925 |
| Mean Family Income | 2,024 | $100,785 |
| Median Household Income | 2,707 | $79,455 |
| Mean Household Income | 2,707 | $90,097 |
| Income Deficit | 2,024 | $0 |
| Wage / Income Gap (%) | 6,653 | 19.45% |
| Wage / Income Gap ($) | 6,653 | 80.55¢ per $1 |
| Gini / Inequality Index | 6,653 | 0.36 |
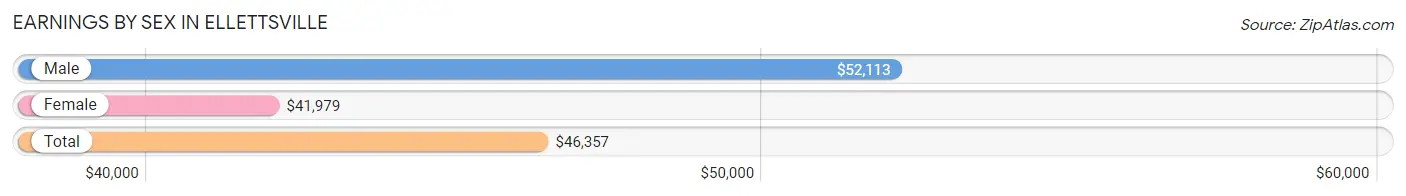
Earnings by Sex in Ellettsville
Average Earnings in Ellettsville are $46,357, $52,113 for men and $41,979 for women, a difference of 19.5%.
| Sex | Number | Average Earnings |
| Male | 1,882 (50.2%) | $52,113 |
| Female | 1,868 (49.8%) | $41,979 |
| Total | 3,750 (100.0%) | $46,357 |
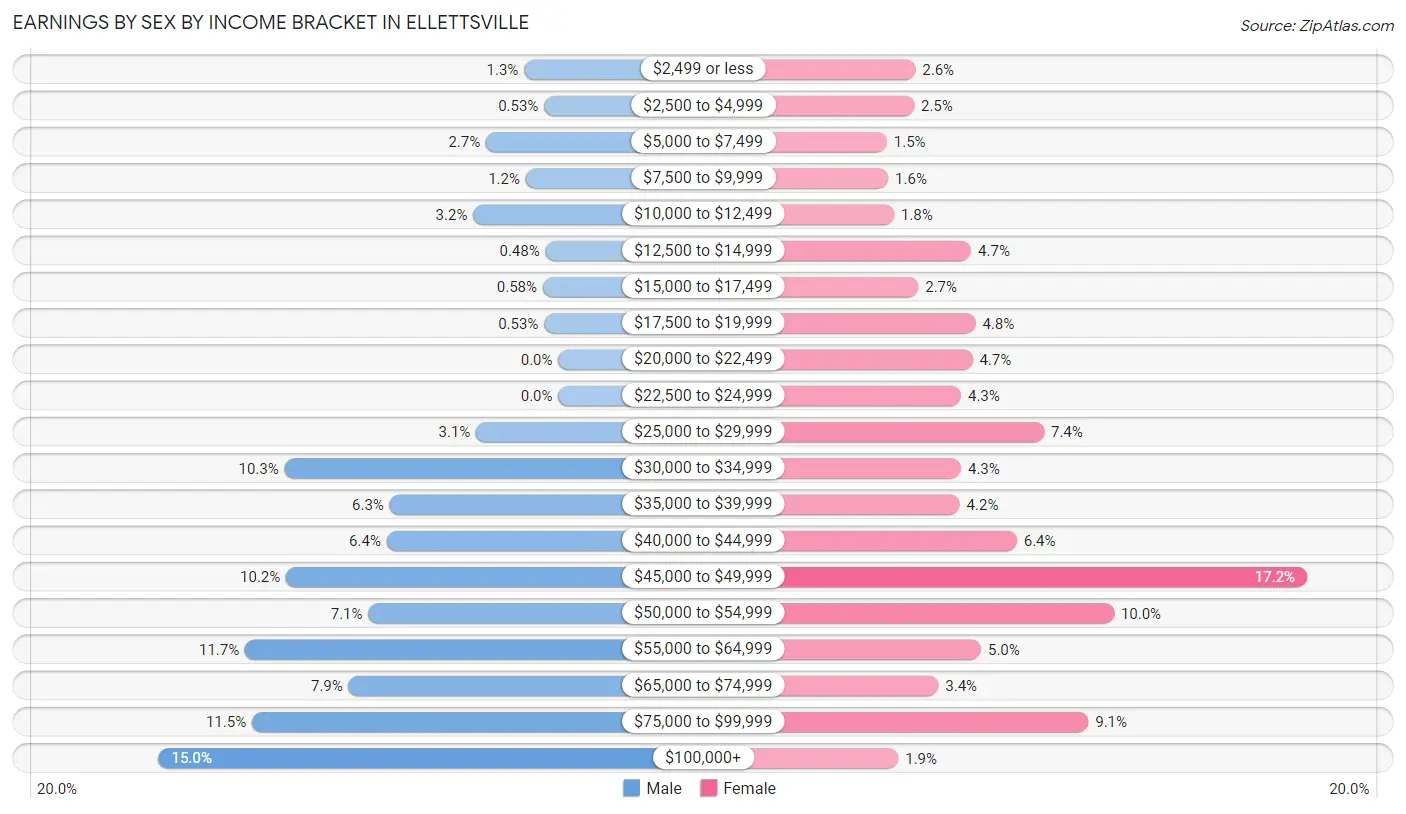
Earnings by Sex by Income Bracket in Ellettsville
The most common earnings brackets in Ellettsville are $100,000+ for men (282 | 15.0%) and $45,000 to $49,999 for women (322 | 17.2%).
| Income | Male | Female |
| $2,499 or less | 24 (1.3%) | 48 (2.6%) |
| $2,500 to $4,999 | 10 (0.5%) | 47 (2.5%) |
| $5,000 to $7,499 | 51 (2.7%) | 28 (1.5%) |
| $7,500 to $9,999 | 23 (1.2%) | 29 (1.5%) |
| $10,000 to $12,499 | 60 (3.2%) | 33 (1.8%) |
| $12,500 to $14,999 | 9 (0.5%) | 87 (4.7%) |
| $15,000 to $17,499 | 11 (0.6%) | 50 (2.7%) |
| $17,500 to $19,999 | 10 (0.5%) | 90 (4.8%) |
| $20,000 to $22,499 | 0 (0.0%) | 88 (4.7%) |
| $22,500 to $24,999 | 0 (0.0%) | 80 (4.3%) |
| $25,000 to $29,999 | 58 (3.1%) | 138 (7.4%) |
| $30,000 to $34,999 | 193 (10.3%) | 80 (4.3%) |
| $35,000 to $39,999 | 119 (6.3%) | 79 (4.2%) |
| $40,000 to $44,999 | 121 (6.4%) | 119 (6.4%) |
| $45,000 to $49,999 | 192 (10.2%) | 322 (17.2%) |
| $50,000 to $54,999 | 134 (7.1%) | 187 (10.0%) |
| $55,000 to $64,999 | 221 (11.7%) | 94 (5.0%) |
| $65,000 to $74,999 | 148 (7.9%) | 64 (3.4%) |
| $75,000 to $99,999 | 216 (11.5%) | 169 (9.0%) |
| $100,000+ | 282 (15.0%) | 36 (1.9%) |
| Total | 1,882 (100.0%) | 1,868 (100.0%) |
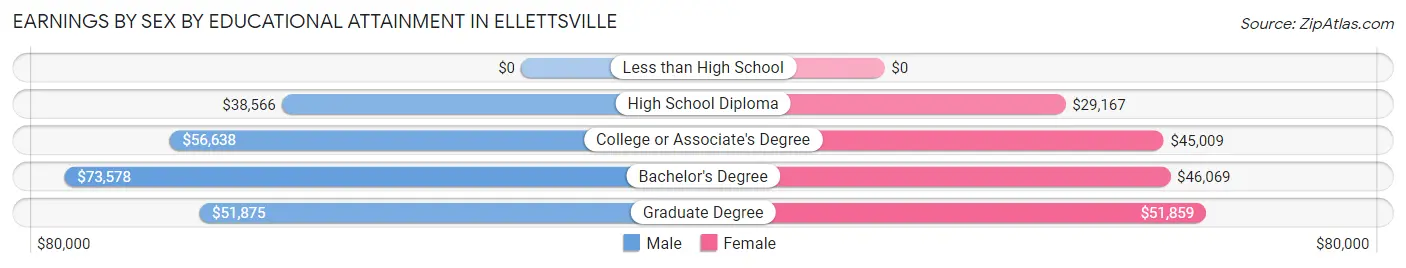
Earnings by Sex by Educational Attainment in Ellettsville
Average earnings in Ellettsville are $56,581 for men and $45,581 for women, a difference of 19.4%. Men with an educational attainment of bachelor's degree enjoy the highest average annual earnings of $73,578, while those with high school diploma education earn the least with $38,566. Women with an educational attainment of graduate degree earn the most with the average annual earnings of $51,859, while those with high school diploma education have the smallest earnings of $29,167.
| Educational Attainment | Male Income | Female Income |
| Less than High School | - | - |
| High School Diploma | $38,566 | $29,167 |
| College or Associate's Degree | $56,638 | $45,009 |
| Bachelor's Degree | $73,578 | $46,069 |
| Graduate Degree | $51,875 | $51,859 |
| Total | $56,581 | $45,581 |
Family Income in Ellettsville
Family Income Brackets in Ellettsville
According to the Ellettsville family income data, there are 650 families falling into the $100,000 to $149,999 income range, which is the most common income bracket and makes up 32.1% of all families.
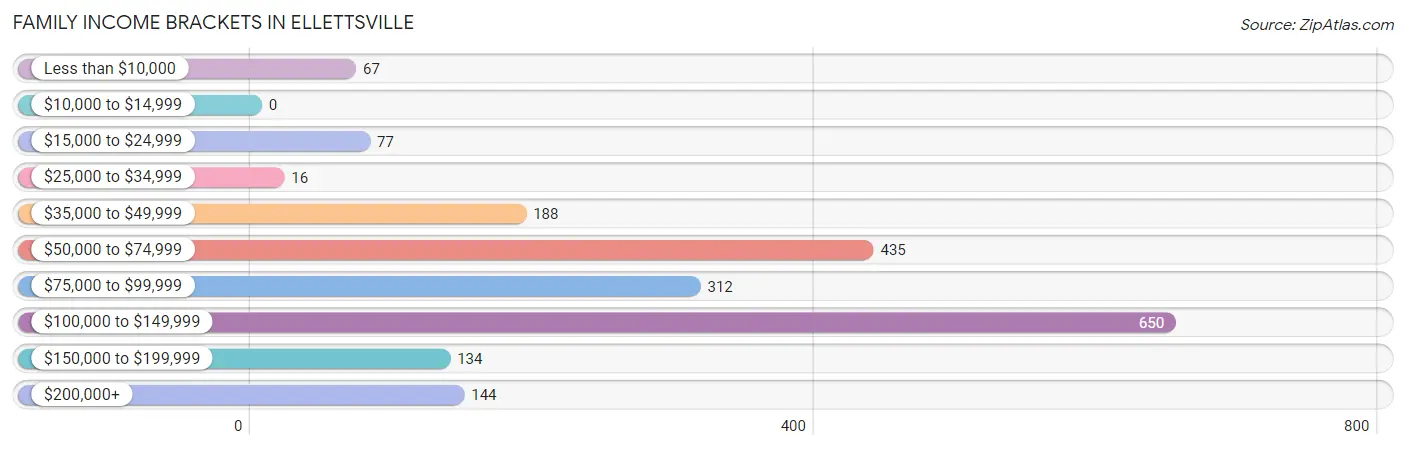
| Income Bracket | # Families | % Families |
| Less than $10,000 | 67 | 3.3% |
| $10,000 to $14,999 | 0 | 0.0% |
| $15,000 to $24,999 | 77 | 3.8% |
| $25,000 to $34,999 | 16 | 0.8% |
| $35,000 to $49,999 | 188 | 9.3% |
| $50,000 to $74,999 | 435 | 21.5% |
| $75,000 to $99,999 | 312 | 15.4% |
| $100,000 to $149,999 | 650 | 32.1% |
| $150,000 to $199,999 | 134 | 6.6% |
| $200,000+ | 144 | 7.1% |
Family Income by Famaliy Size in Ellettsville
4-person families (431 | 21.3%) account for the highest median family income in Ellettsville with $125,341 per family, while 3-person families (449 | 22.2%) have the highest median income of $33,823 per family member.
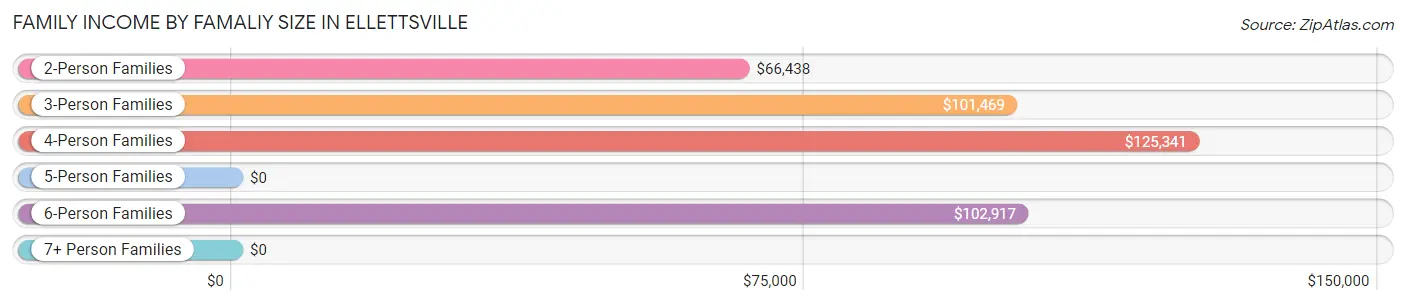
| Income Bracket | # Families | Median Income |
| 2-Person Families | 974 (48.1%) | $66,438 |
| 3-Person Families | 449 (22.2%) | $101,469 |
| 4-Person Families | 431 (21.3%) | $125,341 |
| 5-Person Families | 120 (5.9%) | $0 |
| 6-Person Families | 50 (2.5%) | $102,917 |
| 7+ Person Families | 0 (0.0%) | $0 |
| Total | 2,024 (100.0%) | $93,925 |
Family Income by Number of Earners in Ellettsville
The median family income in Ellettsville is $93,925, with families comprising 2 earners (1,032) having the highest median family income of $108,167, while families with 1 earner (400) have the lowest median family income of $55,000, accounting for 51.0% and 19.8% of families, respectively.
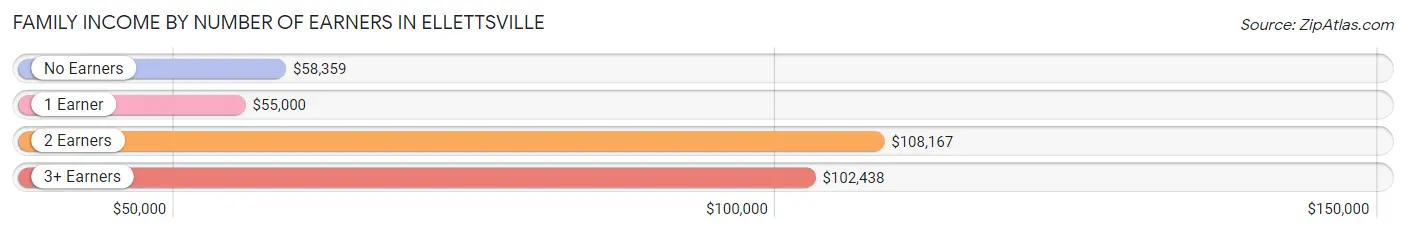
| Number of Earners | # Families | Median Income |
| No Earners | 379 (18.7%) | $58,359 |
| 1 Earner | 400 (19.8%) | $55,000 |
| 2 Earners | 1,032 (51.0%) | $108,167 |
| 3+ Earners | 213 (10.5%) | $102,438 |
| Total | 2,024 (100.0%) | $93,925 |
Household Income in Ellettsville
Household Income Brackets in Ellettsville
With 736 households falling in the category, the $100,000 to $149,999 income range is the most frequent in Ellettsville, accounting for 27.2% of all households. In contrast, only 19 households (0.7%) fall into the $10,000 to $14,999 income bracket, making it the least populous group.
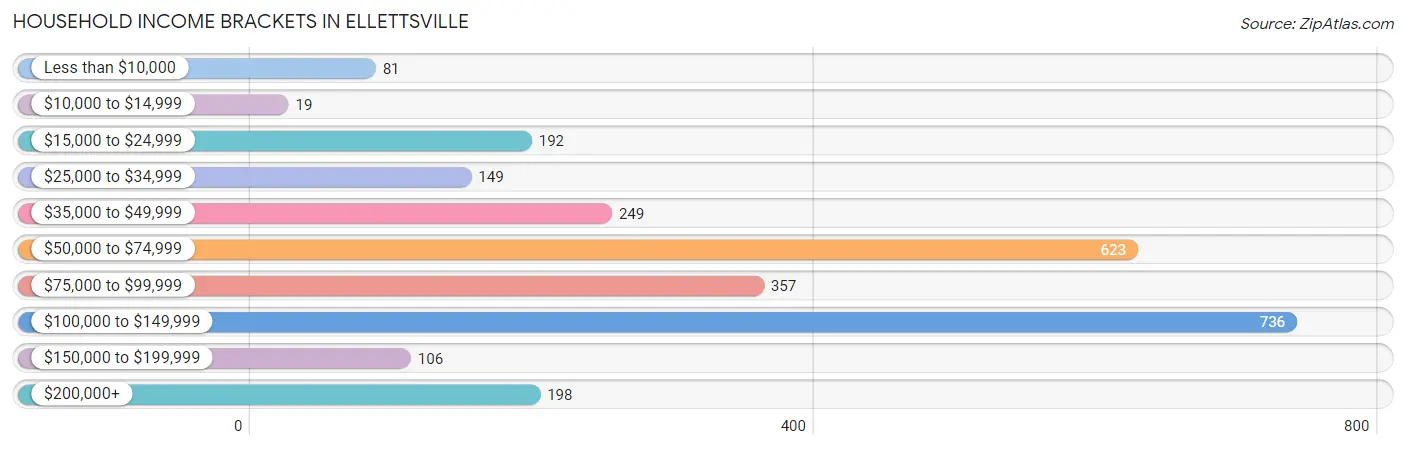
| Income Bracket | # Households | % Households |
| Less than $10,000 | 81 | 3.0% |
| $10,000 to $14,999 | 19 | 0.7% |
| $15,000 to $24,999 | 192 | 7.1% |
| $25,000 to $34,999 | 149 | 5.5% |
| $35,000 to $49,999 | 249 | 9.2% |
| $50,000 to $74,999 | 623 | 23.0% |
| $75,000 to $99,999 | 357 | 13.2% |
| $100,000 to $149,999 | 736 | 27.2% |
| $150,000 to $199,999 | 106 | 3.9% |
| $200,000+ | 198 | 7.3% |
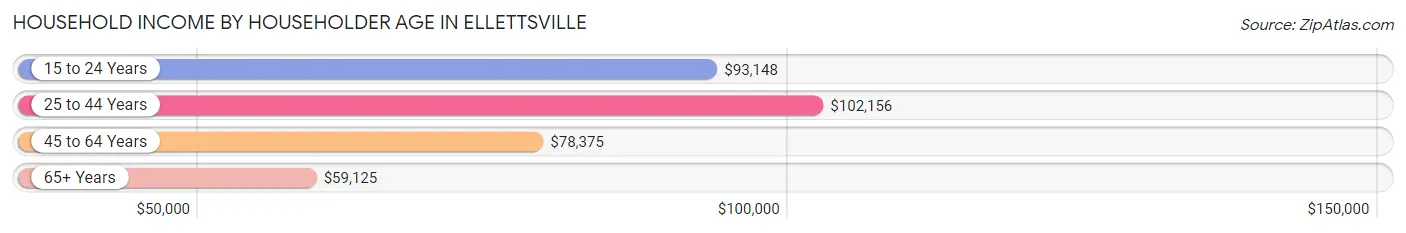
Household Income by Householder Age in Ellettsville
The median household income in Ellettsville is $79,455, with the highest median household income of $102,156 found in the 25 to 44 years age bracket for the primary householder. A total of 1,201 households (44.4%) fall into this category. Meanwhile, the 65+ years age bracket for the primary householder has the lowest median household income of $59,125, with 569 households (21.0%) in this group.
| Income Bracket | # Households | Median Income |
| 15 to 24 Years | 80 (3.0%) | $93,148 |
| 25 to 44 Years | 1,201 (44.4%) | $102,156 |
| 45 to 64 Years | 857 (31.7%) | $78,375 |
| 65+ Years | 569 (21.0%) | $59,125 |
| Total | 2,707 (100.0%) | $79,455 |
Poverty in Ellettsville
Income Below Poverty by Sex and Age in Ellettsville
With 3.0% poverty level for males and 7.8% for females among the residents of Ellettsville, 5 year old males and under 5 year old females are the most vulnerable to poverty, with 10 males (30.3%) and 34 females (20.6%) in their respective age groups living below the poverty level.
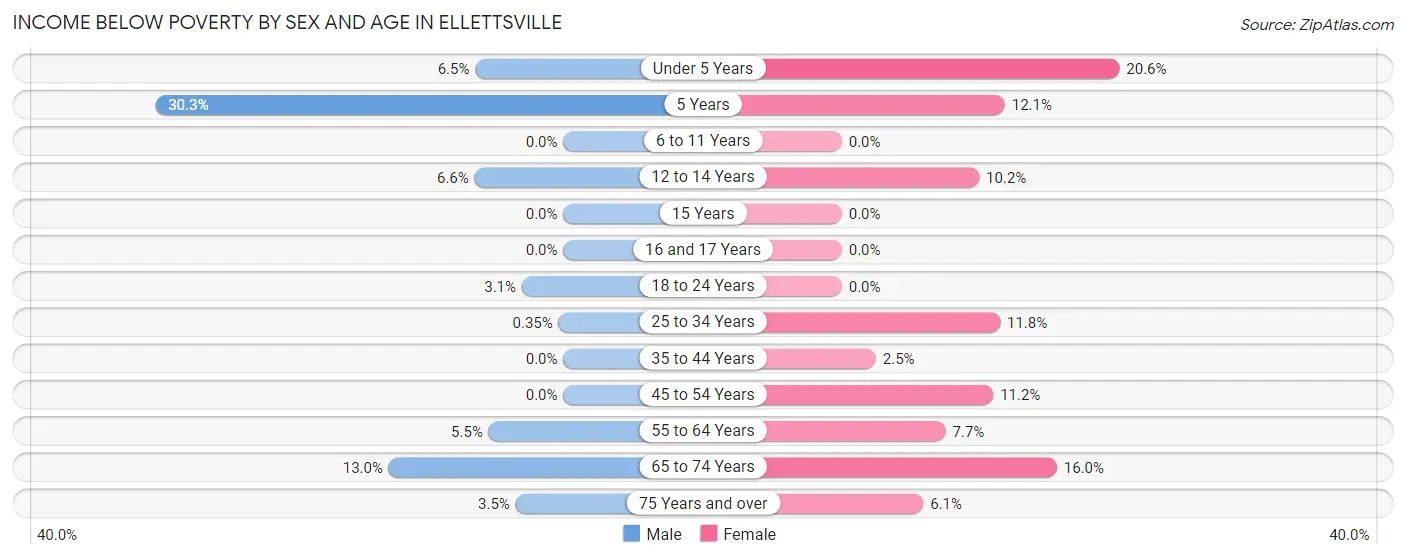
| Age Bracket | Male | Female |
| Under 5 Years | 17 (6.5%) | 34 (20.6%) |
| 5 Years | 10 (30.3%) | 15 (12.1%) |
| 6 to 11 Years | 0 (0.0%) | 0 (0.0%) |
| 12 to 14 Years | 11 (6.6%) | 10 (10.2%) |
| 15 Years | 0 (0.0%) | 0 (0.0%) |
| 16 and 17 Years | 0 (0.0%) | 0 (0.0%) |
| 18 to 24 Years | 8 (3.1%) | 0 (0.0%) |
| 25 to 34 Years | 2 (0.4%) | 76 (11.7%) |
| 35 to 44 Years | 0 (0.0%) | 12 (2.5%) |
| 45 to 54 Years | 0 (0.0%) | 39 (11.2%) |
| 55 to 64 Years | 16 (5.5%) | 29 (7.7%) |
| 65 to 74 Years | 21 (13.0%) | 38 (16.0%) |
| 75 Years and over | 9 (3.5%) | 21 (6.0%) |
| Total | 94 (3.0%) | 274 (7.8%) |
Income Above Poverty by Sex and Age in Ellettsville
According to the poverty statistics in Ellettsville, males aged 6 to 11 years and females aged 6 to 11 years are the age groups that are most secure financially, with 100.0% of males and 100.0% of females in these age groups living above the poverty line.
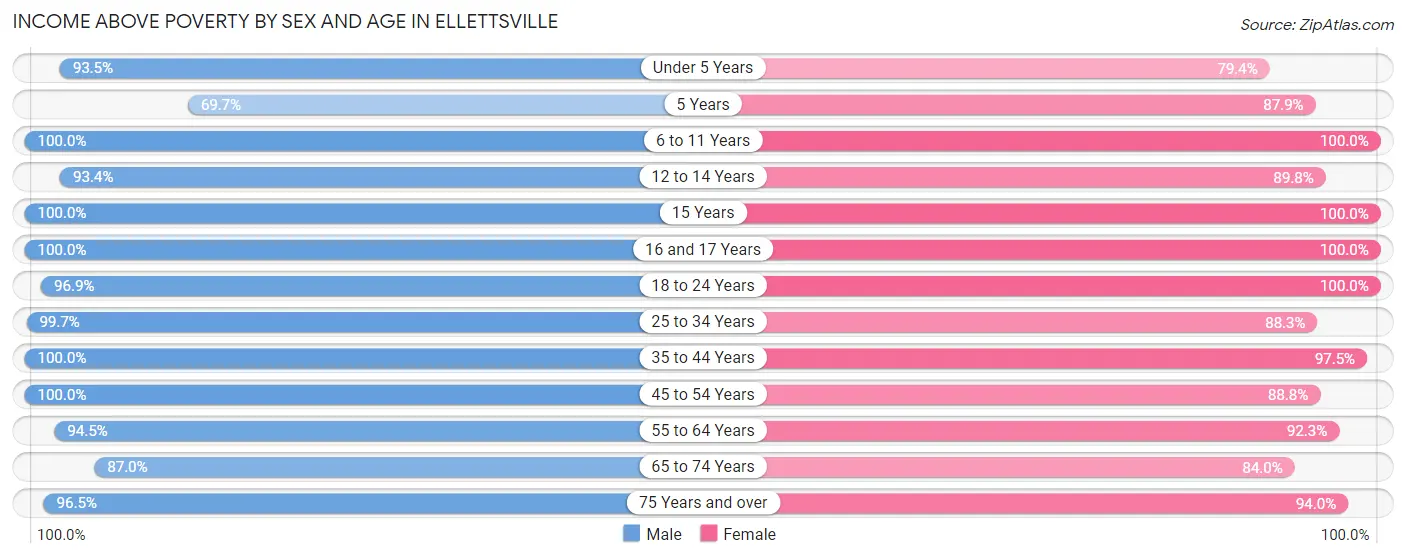
| Age Bracket | Male | Female |
| Under 5 Years | 243 (93.5%) | 131 (79.4%) |
| 5 Years | 23 (69.7%) | 109 (87.9%) |
| 6 to 11 Years | 208 (100.0%) | 352 (100.0%) |
| 12 to 14 Years | 156 (93.4%) | 88 (89.8%) |
| 15 Years | 48 (100.0%) | 16 (100.0%) |
| 16 and 17 Years | 10 (100.0%) | 71 (100.0%) |
| 18 to 24 Years | 252 (96.9%) | 251 (100.0%) |
| 25 to 34 Years | 572 (99.7%) | 571 (88.2%) |
| 35 to 44 Years | 504 (100.0%) | 462 (97.5%) |
| 45 to 54 Years | 334 (100.0%) | 308 (88.8%) |
| 55 to 64 Years | 273 (94.5%) | 347 (92.3%) |
| 65 to 74 Years | 141 (87.0%) | 200 (84.0%) |
| 75 Years and over | 245 (96.5%) | 326 (94.0%) |
| Total | 3,009 (97.0%) | 3,232 (92.2%) |
Income Below Poverty Among Married-Couple Families in Ellettsville
The poverty statistics for married-couple families in Ellettsville show that 0.9% or 14 of the total 1,555 families live below the poverty line. Families with no children have the highest poverty rate of 1.7%, comprising of 14 families. On the other hand, families with 1 or 2 children have the lowest poverty rate of 0.0%, which includes 0 families.
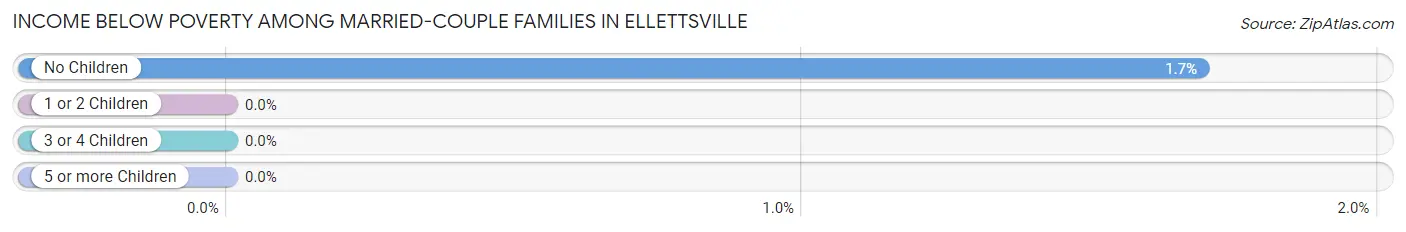
| Children | Above Poverty | Below Poverty |
| No Children | 812 (98.3%) | 14 (1.7%) |
| 1 or 2 Children | 630 (100.0%) | 0 (0.0%) |
| 3 or 4 Children | 99 (100.0%) | 0 (0.0%) |
| 5 or more Children | 0 (0.0%) | 0 (0.0%) |
| Total | 1,541 (99.1%) | 14 (0.9%) |
Income Below Poverty Among Single-Parent Households in Ellettsville
According to the poverty data in Ellettsville, 6.9% or 9 single-father households and 15.6% or 53 single-mother households are living below the poverty line. Among single-father households, those with no children have the highest poverty rate, with 9 households (11.7%) experiencing poverty. Likewise, among single-mother households, those with 3 or 4 children have the highest poverty rate, with 12 households (100.0%) falling below the poverty line.
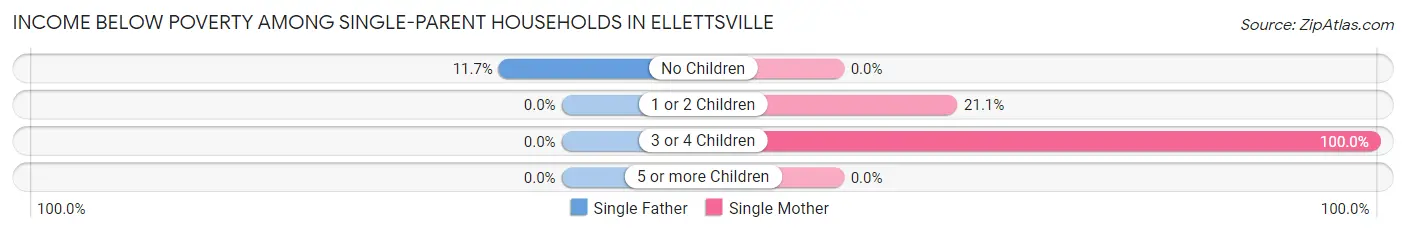
| Children | Single Father | Single Mother |
| No Children | 9 (11.7%) | 0 (0.0%) |
| 1 or 2 Children | 0 (0.0%) | 41 (21.1%) |
| 3 or 4 Children | 0 (0.0%) | 12 (100.0%) |
| 5 or more Children | 0 (0.0%) | 0 (0.0%) |
| Total | 9 (6.9%) | 53 (15.6%) |
Income Below Poverty Among Married-Couple vs Single-Parent Households in Ellettsville
The poverty data for Ellettsville shows that 14 of the married-couple family households (0.9%) and 62 of the single-parent households (13.2%) are living below the poverty level. Within the married-couple family households, those with no children have the highest poverty rate, with 14 households (1.7%) falling below the poverty line. Among the single-parent households, those with 3 or 4 children have the highest poverty rate, with 12 household (100.0%) living below poverty.
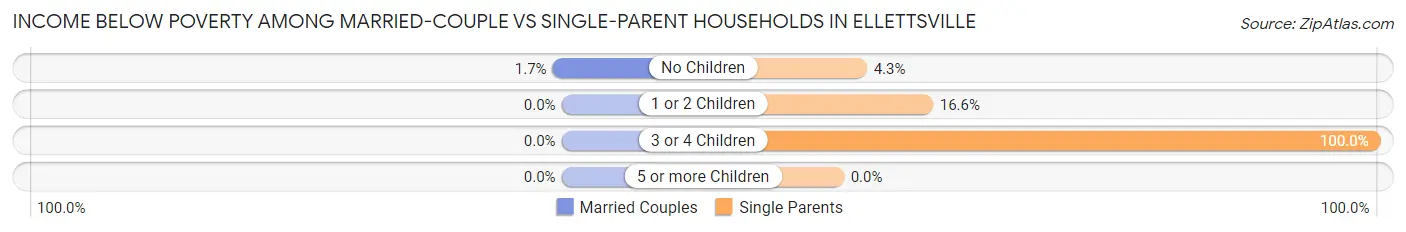
| Children | Married-Couple Families | Single-Parent Households |
| No Children | 14 (1.7%) | 9 (4.3%) |
| 1 or 2 Children | 0 (0.0%) | 41 (16.6%) |
| 3 or 4 Children | 0 (0.0%) | 12 (100.0%) |
| 5 or more Children | 0 (0.0%) | 0 (0.0%) |
| Total | 14 (0.9%) | 62 (13.2%) |
Race in Ellettsville
The most populous races in Ellettsville are White / Caucasian (6,222 | 93.5%), Two or more Races (320 | 4.8%), and Black / African American (63 | 0.9%).
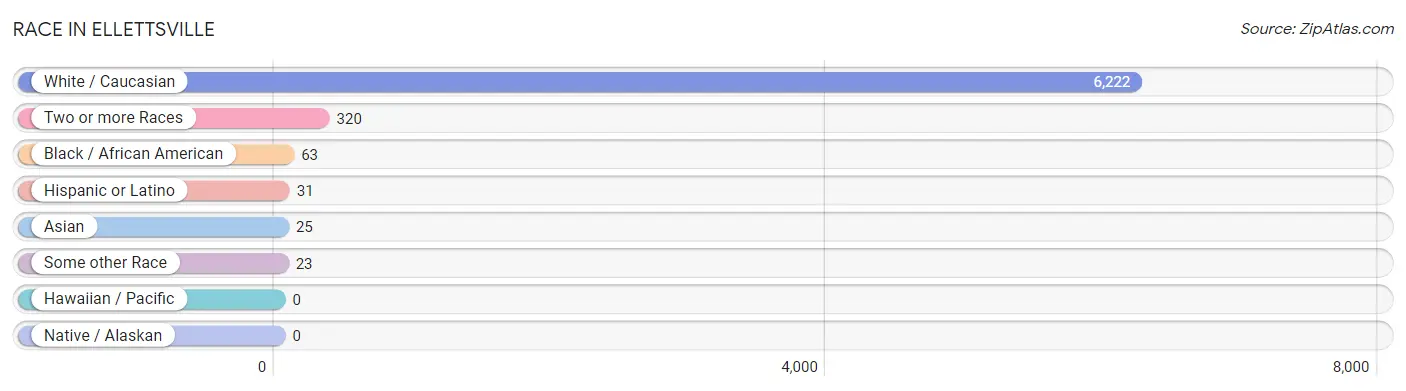
| Race | # Population | % Population |
| Asian | 25 | 0.4% |
| Black / African American | 63 | 0.9% |
| Hawaiian / Pacific | 0 | 0.0% |
| Hispanic or Latino | 31 | 0.5% |
| Native / Alaskan | 0 | 0.0% |
| White / Caucasian | 6,222 | 93.5% |
| Two or more Races | 320 | 4.8% |
| Some other Race | 23 | 0.4% |
| Total | 6,653 | 100.0% |
Ancestry in Ellettsville
The most populous ancestries reported in Ellettsville are German (1,266 | 19.0%), Irish (934 | 14.0%), English (933 | 14.0%), American (605 | 9.1%), and Italian (179 | 2.7%), together accounting for 58.9% of all Ellettsville residents.
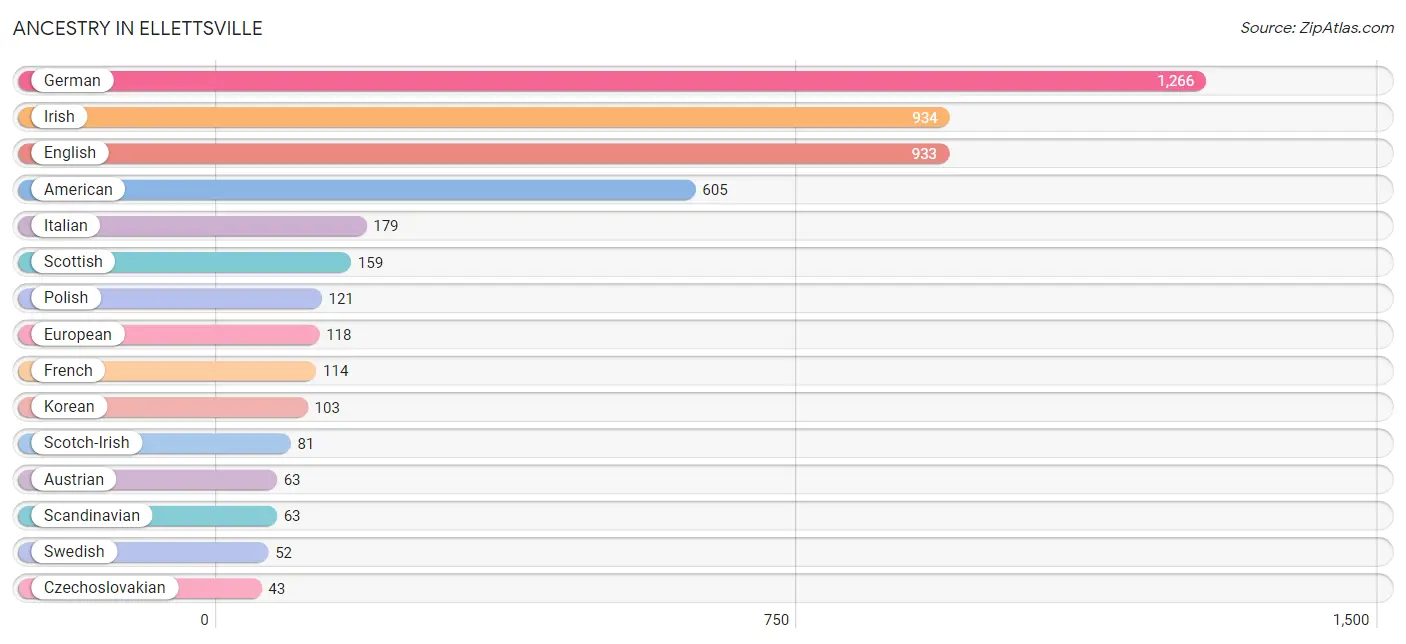
| Ancestry | # Population | % Population |
| American | 605 | 9.1% |
| Austrian | 63 | 0.9% |
| Bhutanese | 30 | 0.4% |
| Blackfeet | 2 | 0.0% |
| British | 20 | 0.3% |
| Cherokee | 28 | 0.4% |
| Czechoslovakian | 43 | 0.6% |
| Danish | 7 | 0.1% |
| Dutch | 38 | 0.6% |
| English | 933 | 14.0% |
| European | 118 | 1.8% |
| French | 114 | 1.7% |
| German | 1,266 | 19.0% |
| Greek | 7 | 0.1% |
| Hungarian | 10 | 0.2% |
| Irish | 934 | 14.0% |
| Iroquois | 8 | 0.1% |
| Italian | 179 | 2.7% |
| Korean | 103 | 1.5% |
| Mexican | 31 | 0.5% |
| Northern European | 15 | 0.2% |
| Norwegian | 9 | 0.1% |
| Pakistani | 26 | 0.4% |
| Polish | 121 | 1.8% |
| Portuguese | 36 | 0.5% |
| Potawatomi | 2 | 0.0% |
| Russian | 29 | 0.4% |
| Scandinavian | 63 | 0.9% |
| Scotch-Irish | 81 | 1.2% |
| Scottish | 159 | 2.4% |
| Serbian | 28 | 0.4% |
| Slovene | 12 | 0.2% |
| Swedish | 52 | 0.8% |
| Welsh | 10 | 0.2% | View All 34 Rows |
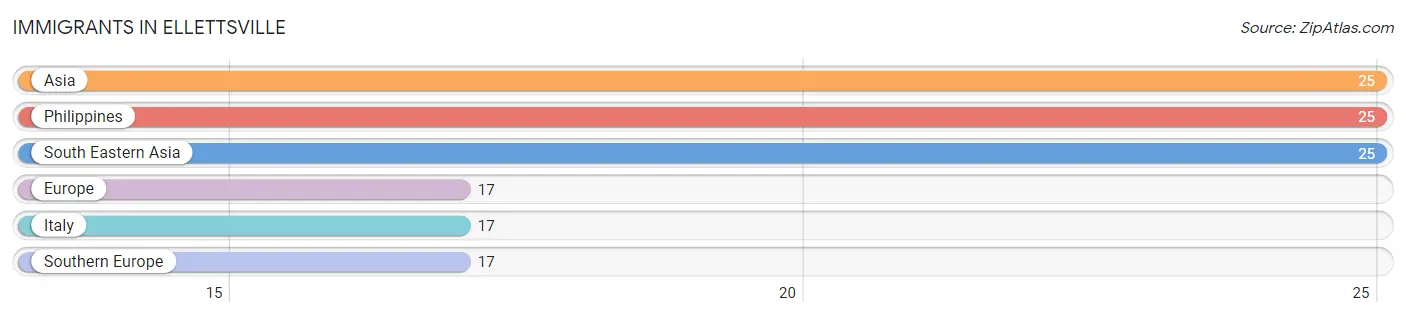
Immigrants in Ellettsville
The most numerous immigrant groups reported in Ellettsville came from Asia (25 | 0.4%), Philippines (25 | 0.4%), South Eastern Asia (25 | 0.4%), Europe (17 | 0.3%), and Italy (17 | 0.3%), together accounting for 1.7% of all Ellettsville residents.
| Immigration Origin | # Population | % Population |
| Asia | 25 | 0.4% |
| Europe | 17 | 0.3% |
| Italy | 17 | 0.3% |
| Philippines | 25 | 0.4% |
| South Eastern Asia | 25 | 0.4% |
| Southern Europe | 17 | 0.3% | View All 6 Rows |
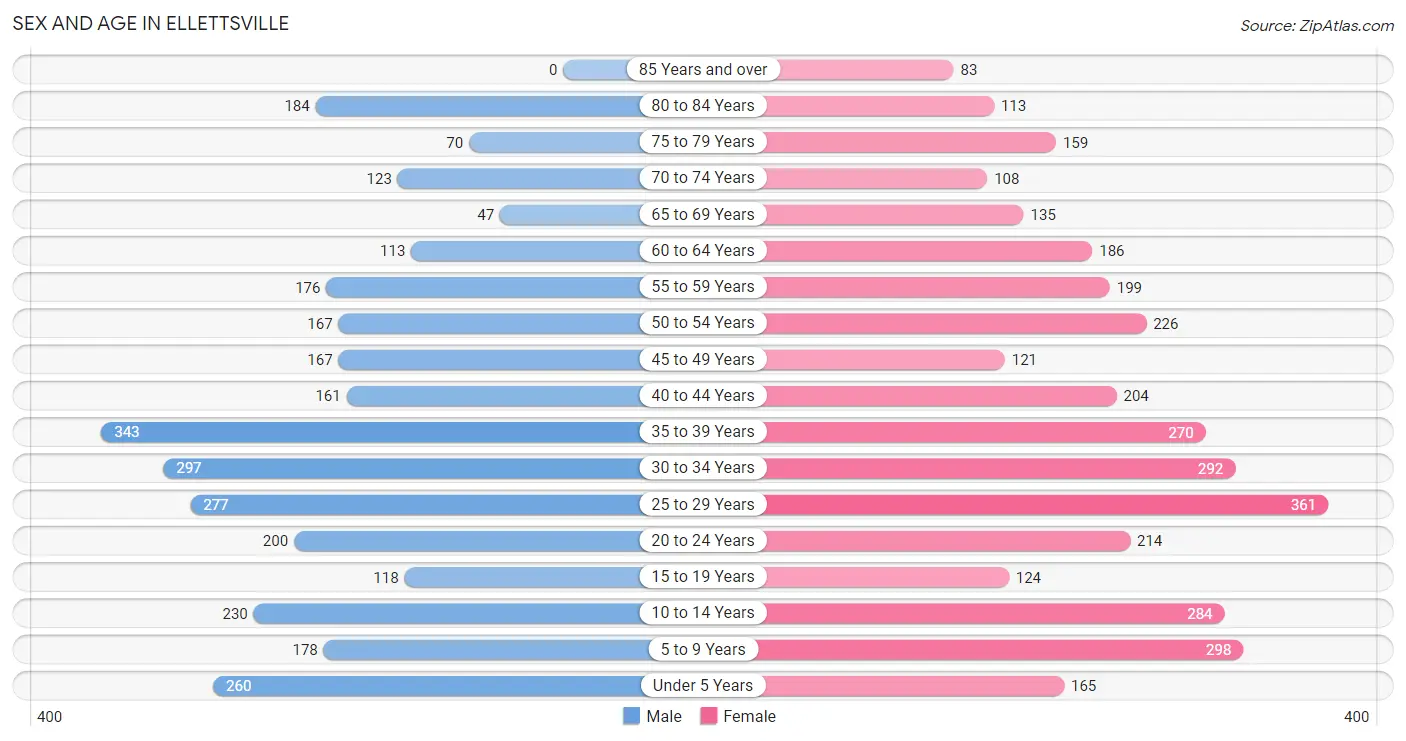
Sex and Age in Ellettsville
Sex and Age in Ellettsville
The most populous age groups in Ellettsville are 35 to 39 Years (343 | 11.0%) for men and 25 to 29 Years (361 | 10.2%) for women.
| Age Bracket | Male | Female |
| Under 5 Years | 260 (8.4%) | 165 (4.7%) |
| 5 to 9 Years | 178 (5.7%) | 298 (8.4%) |
| 10 to 14 Years | 230 (7.4%) | 284 (8.0%) |
| 15 to 19 Years | 118 (3.8%) | 124 (3.5%) |
| 20 to 24 Years | 200 (6.4%) | 214 (6.0%) |
| 25 to 29 Years | 277 (8.9%) | 361 (10.2%) |
| 30 to 34 Years | 297 (9.6%) | 292 (8.2%) |
| 35 to 39 Years | 343 (11.0%) | 270 (7.6%) |
| 40 to 44 Years | 161 (5.2%) | 204 (5.8%) |
| 45 to 49 Years | 167 (5.4%) | 121 (3.4%) |
| 50 to 54 Years | 167 (5.4%) | 226 (6.4%) |
| 55 to 59 Years | 176 (5.7%) | 199 (5.6%) |
| 60 to 64 Years | 113 (3.6%) | 186 (5.2%) |
| 65 to 69 Years | 47 (1.5%) | 135 (3.8%) |
| 70 to 74 Years | 123 (4.0%) | 108 (3.0%) |
| 75 to 79 Years | 70 (2.2%) | 159 (4.5%) |
| 80 to 84 Years | 184 (5.9%) | 113 (3.2%) |
| 85 Years and over | 0 (0.0%) | 83 (2.3%) |
| Total | 3,111 (100.0%) | 3,542 (100.0%) |
Families and Households in Ellettsville
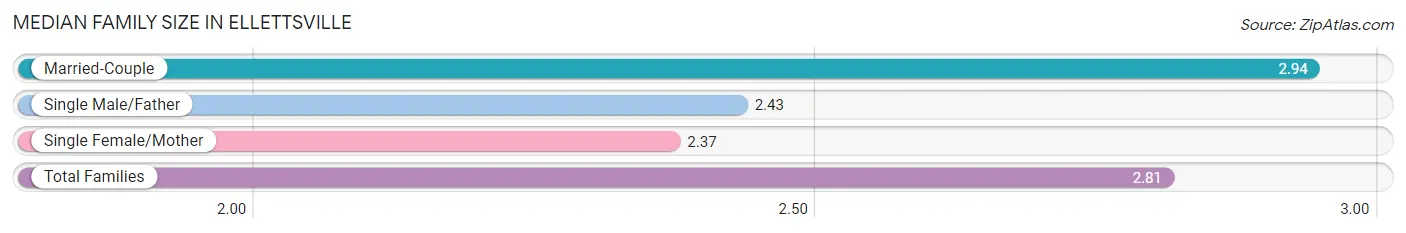
Median Family Size in Ellettsville
The median family size in Ellettsville is 2.81 persons per family, with married-couple families (1,555 | 76.8%) accounting for the largest median family size of 2.94 persons per family. On the other hand, single female/mother families (339 | 16.8%) represent the smallest median family size with 2.37 persons per family.
| Family Type | # Families | Family Size |
| Married-Couple | 1,555 (76.8%) | 2.94 |
| Single Male/Father | 130 (6.4%) | 2.43 |
| Single Female/Mother | 339 (16.8%) | 2.37 |
| Total Families | 2,024 (100.0%) | 2.81 |
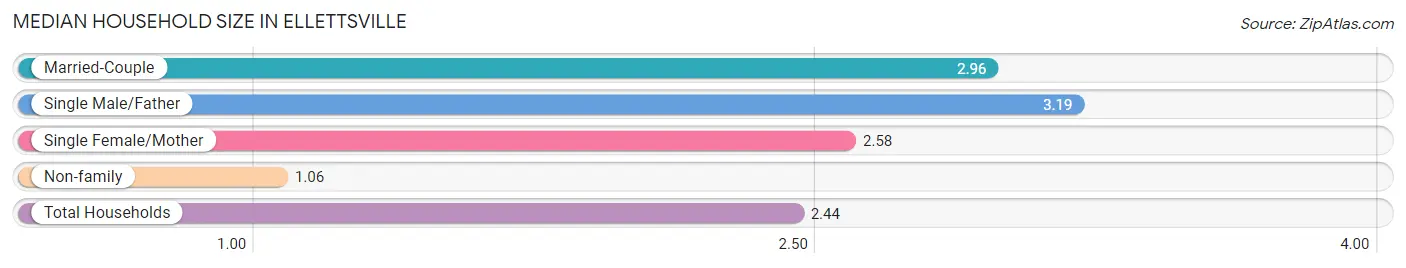
Median Household Size in Ellettsville
The median household size in Ellettsville is 2.44 persons per household, with single male/father households (130 | 4.8%) accounting for the largest median household size of 3.19 persons per household. non-family households (683 | 25.2%) represent the smallest median household size with 1.06 persons per household.
| Household Type | # Households | Household Size |
| Married-Couple | 1,555 (57.4%) | 2.96 |
| Single Male/Father | 130 (4.8%) | 3.19 |
| Single Female/Mother | 339 (12.5%) | 2.58 |
| Non-family | 683 (25.2%) | 1.06 |
| Total Households | 2,707 (100.0%) | 2.44 |
Household Size by Marriage Status in Ellettsville
Out of a total of 2,707 households in Ellettsville, 2,024 (74.8%) are family households, while 683 (25.2%) are nonfamily households. The most numerous type of family households are 2-person households, comprising 910, and the most common type of nonfamily households are 1-person households, comprising 637.
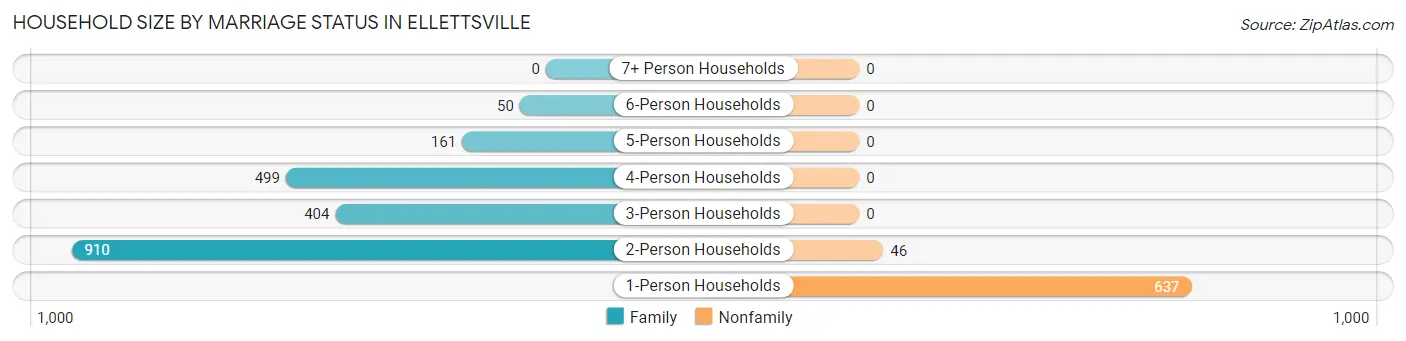
| Household Size | Family Households | Nonfamily Households |
| 1-Person Households | - | 637 (23.5%) |
| 2-Person Households | 910 (33.6%) | 46 (1.7%) |
| 3-Person Households | 404 (14.9%) | 0 (0.0%) |
| 4-Person Households | 499 (18.4%) | 0 (0.0%) |
| 5-Person Households | 161 (5.9%) | 0 (0.0%) |
| 6-Person Households | 50 (1.8%) | 0 (0.0%) |
| 7+ Person Households | 0 (0.0%) | 0 (0.0%) |
| Total | 2,024 (74.8%) | 683 (25.2%) |
Female Fertility in Ellettsville
Fertility by Age in Ellettsville
Average fertility rate in Ellettsville is 93.0 births per 1,000 women. Women in the age bracket of 20 to 34 years have the highest fertility rate with 173.0 births per 1,000 women. Women in the age bracket of 20 to 34 years acount for 100.0% of all women with births.
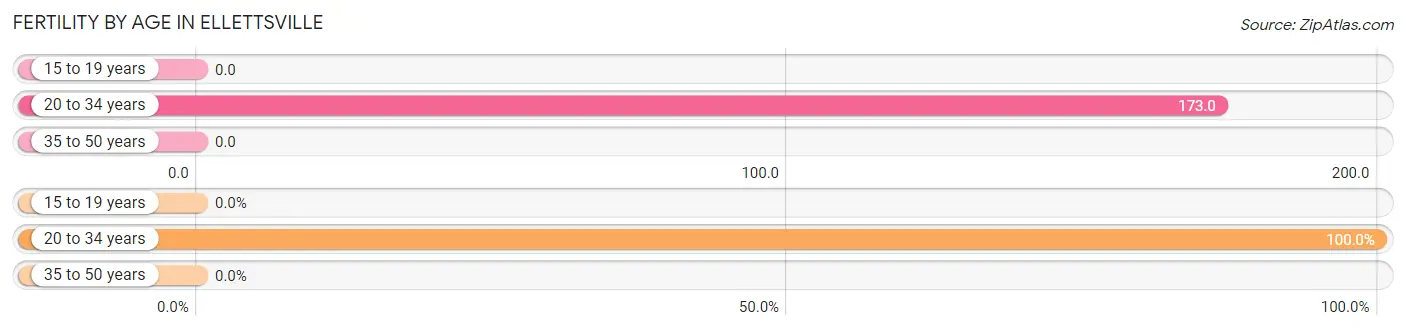
| Age Bracket | Women with Births | Births / 1,000 Women |
| 15 to 19 years | 0 (0.0%) | 0.0 |
| 20 to 34 years | 150 (100.0%) | 173.0 |
| 35 to 50 years | 0 (0.0%) | 0.0 |
| Total | 150 (100.0%) | 93.0 |
Fertility by Age by Marriage Status in Ellettsville
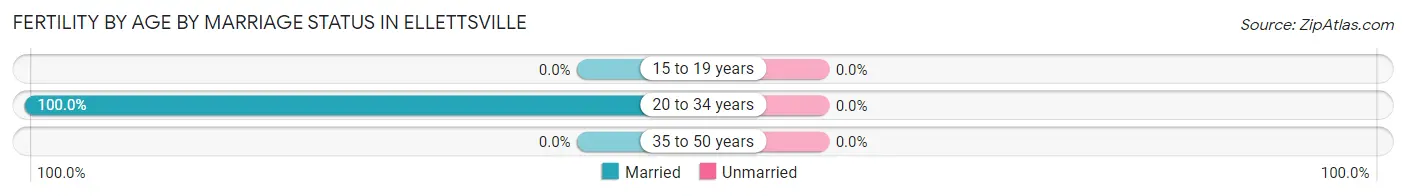
| Age Bracket | Married | Unmarried |
| 15 to 19 years | 0 (0.0%) | 0 (0.0%) |
| 20 to 34 years | 150 (100.0%) | 0 (0.0%) |
| 35 to 50 years | 0 (0.0%) | 0 (0.0%) |
| Total | 150 (100.0%) | 0 (0.0%) |
Fertility by Education in Ellettsville
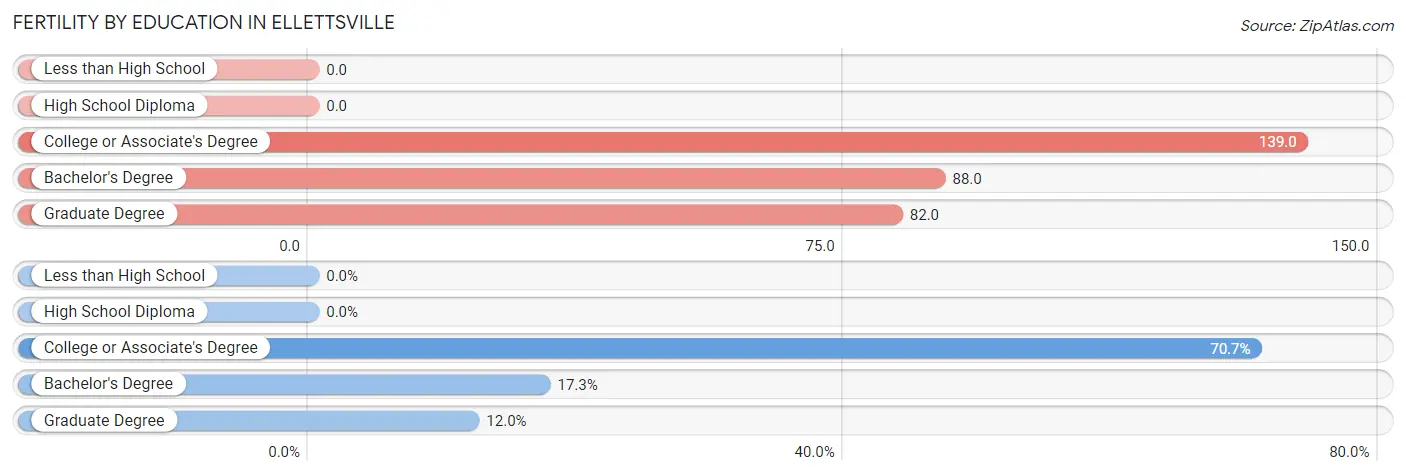
| Educational Attainment | Women with Births | Births / 1,000 Women |
| Less than High School | 0 (0.0%) | 0.0 |
| High School Diploma | 0 (0.0%) | 0.0 |
| College or Associate's Degree | 106 (70.7%) | 139.0 |
| Bachelor's Degree | 26 (17.3%) | 88.0 |
| Graduate Degree | 18 (12.0%) | 82.0 |
| Total | 150 (100.0%) | 93.0 |
Fertility by Education by Marriage Status in Ellettsville
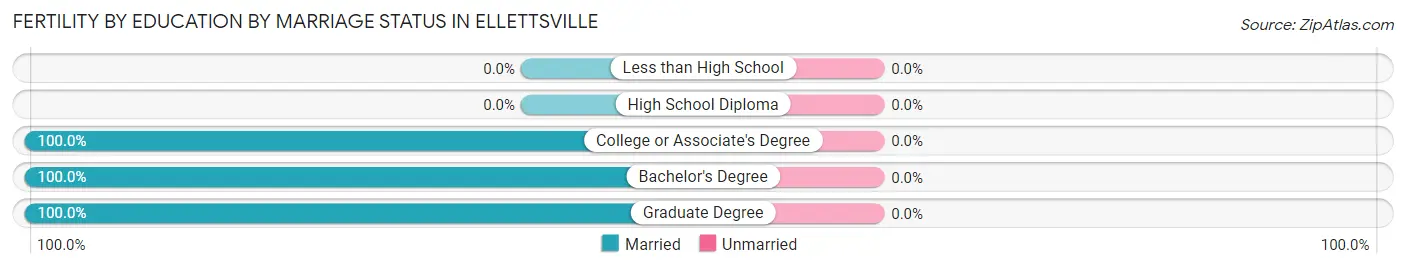
| Educational Attainment | Married | Unmarried |
| Less than High School | 0 (0.0%) | 0 (0.0%) |
| High School Diploma | 0 (0.0%) | 0 (0.0%) |
| College or Associate's Degree | 106 (100.0%) | 0 (0.0%) |
| Bachelor's Degree | 26 (100.0%) | 0 (0.0%) |
| Graduate Degree | 18 (100.0%) | 0 (0.0%) |
| Total | 150 (100.0%) | 0 (0.0%) |
Employment Characteristics in Ellettsville
Employment by Class of Employer in Ellettsville
Among the 3,576 employed individuals in Ellettsville, private company employees (2,131 | 59.6%), not-for-profit organizations (408 | 11.4%), and state government employees (228 | 6.4%) make up the most common classes of employment.
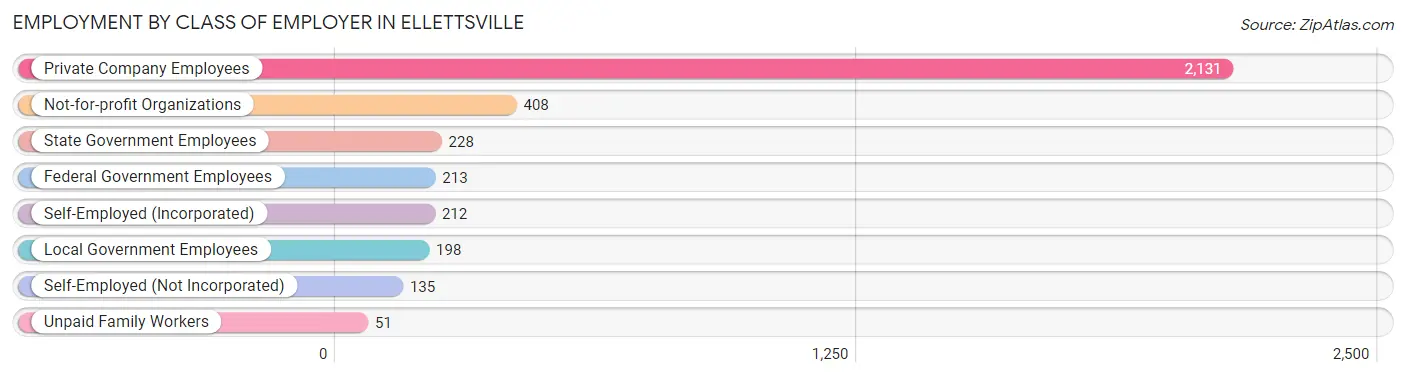
| Employer Class | # Employees | % Employees |
| Private Company Employees | 2,131 | 59.6% |
| Self-Employed (Incorporated) | 212 | 5.9% |
| Self-Employed (Not Incorporated) | 135 | 3.8% |
| Not-for-profit Organizations | 408 | 11.4% |
| Local Government Employees | 198 | 5.5% |
| State Government Employees | 228 | 6.4% |
| Federal Government Employees | 213 | 6.0% |
| Unpaid Family Workers | 51 | 1.4% |
| Total | 3,576 | 100.0% |
Employment Status by Age in Ellettsville
According to the labor force statistics for Ellettsville, out of the total population over 16 years of age (5,174), 71.4% or 3,694 individuals are in the labor force, with 1.7% or 63 of them unemployed. The age group with the highest labor force participation rate is 30 to 34 years, with 95.2% or 561 individuals in the labor force. Within the labor force, the 60 to 64 years age range has the highest percentage of unemployed individuals, with 11.2% or 16 of them being unemployed.
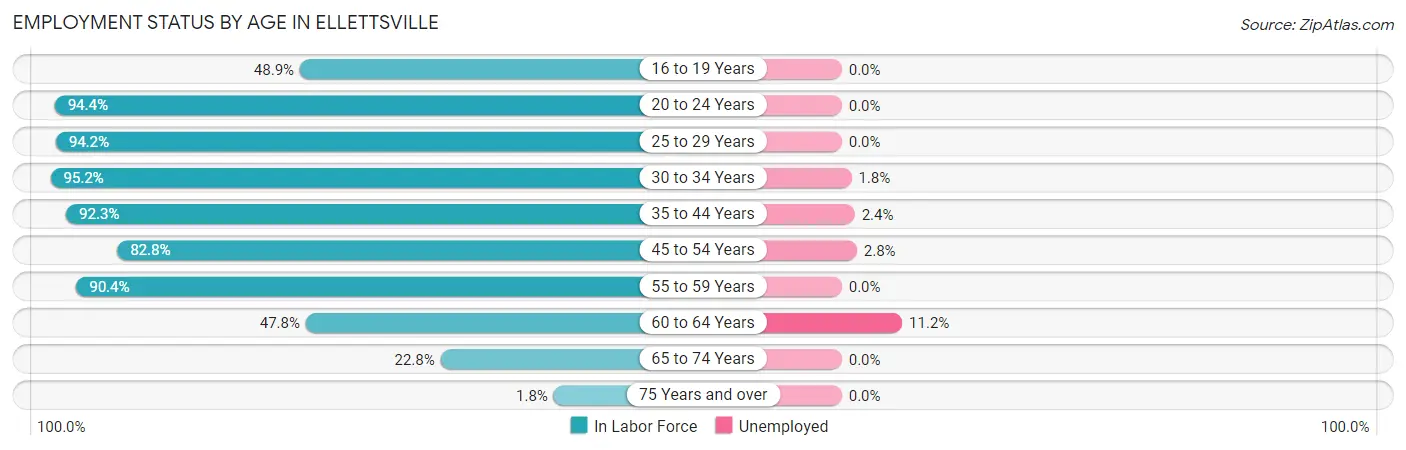
| Age Bracket | In Labor Force | Unemployed |
| 16 to 19 Years | 87 (48.9%) | 0 (0.0%) |
| 20 to 24 Years | 391 (94.4%) | 0 (0.0%) |
| 25 to 29 Years | 601 (94.2%) | 0 (0.0%) |
| 30 to 34 Years | 561 (95.2%) | 10 (1.8%) |
| 35 to 44 Years | 903 (92.3%) | 22 (2.4%) |
| 45 to 54 Years | 564 (82.8%) | 16 (2.8%) |
| 55 to 59 Years | 339 (90.4%) | 0 (0.0%) |
| 60 to 64 Years | 143 (47.8%) | 16 (11.2%) |
| 65 to 74 Years | 94 (22.8%) | 0 (0.0%) |
| 75 Years and over | 11 (1.8%) | 0 (0.0%) |
| Total | 3,694 (71.4%) | 63 (1.7%) |
Employment Status by Educational Attainment in Ellettsville
According to labor force statistics for Ellettsville, 87.4% of individuals (3,111) out of the total population between 25 and 64 years of age (3,560) are in the labor force, with 2.1% or 65 of them being unemployed. The group with the highest labor force participation rate are those with the educational attainment of bachelor's degree or higher, with 90.7% or 1,294 individuals in the labor force. Within the labor force, individuals with high school diploma education have the highest percentage of unemployment, with 8.9% or 42 of them being unemployed.
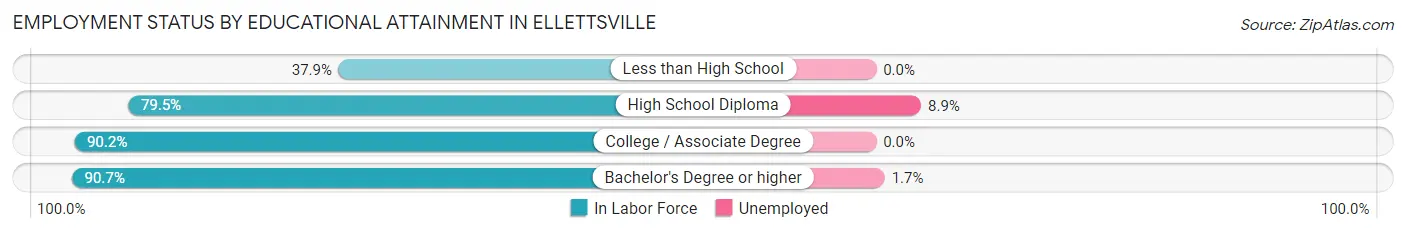
| Educational Attainment | In Labor Force | Unemployed |
| Less than High School | 33 (37.9%) | 0 (0.0%) |
| High School Diploma | 470 (79.5%) | 53 (8.9%) |
| College / Associate Degree | 1,312 (90.2%) | 0 (0.0%) |
| Bachelor's Degree or higher | 1,294 (90.7%) | 24 (1.7%) |
| Total | 3,111 (87.4%) | 75 (2.1%) |
Employment Occupations by Sex in Ellettsville
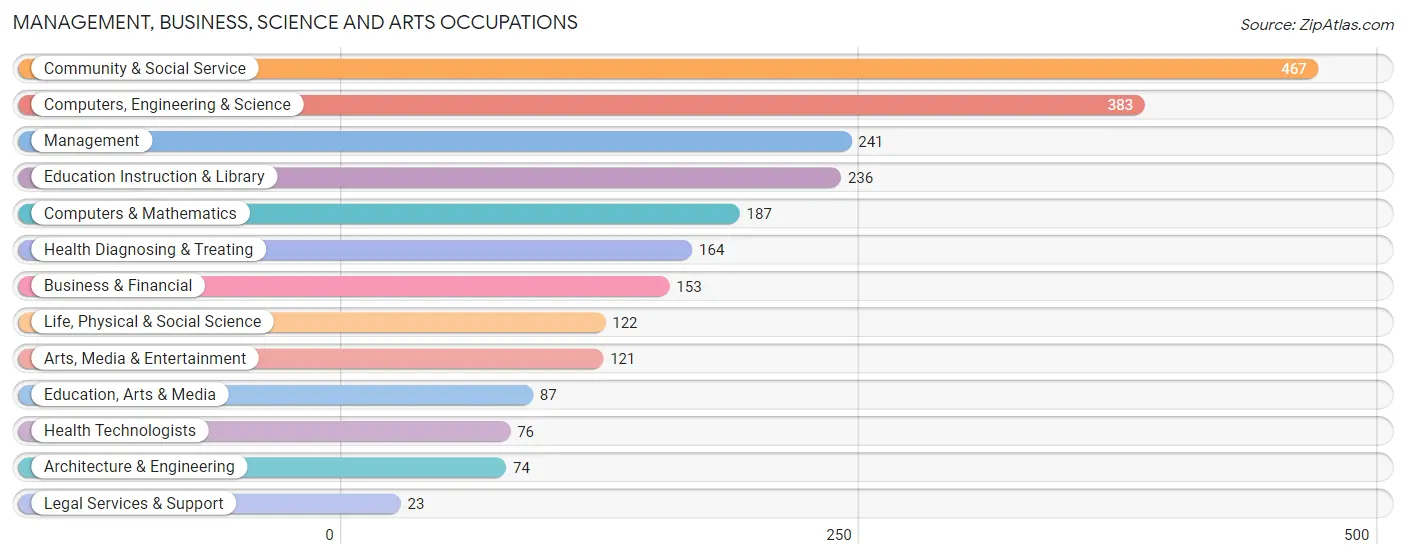
Management, Business, Science and Arts Occupations
The most common Management, Business, Science and Arts occupations in Ellettsville are Community & Social Service (467 | 12.9%), Computers, Engineering & Science (383 | 10.5%), Management (241 | 6.6%), Education Instruction & Library (236 | 6.5%), and Computers & Mathematics (187 | 5.1%).
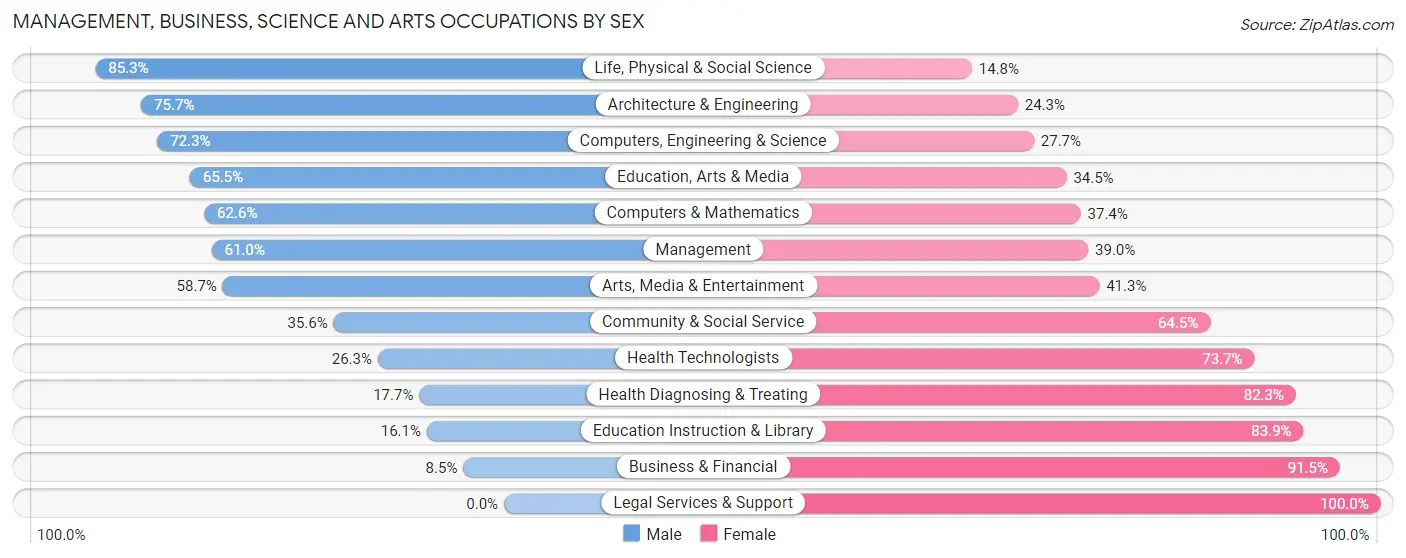
Management, Business, Science and Arts Occupations by Sex
Within the Management, Business, Science and Arts occupations in Ellettsville, the most male-oriented occupations are Life, Physical & Social Science (85.3%), Architecture & Engineering (75.7%), and Computers, Engineering & Science (72.3%), while the most female-oriented occupations are Legal Services & Support (100.0%), Business & Financial (91.5%), and Education Instruction & Library (83.9%).
| Occupation | Male | Female |
| Management | 147 (61.0%) | 94 (39.0%) |
| Business & Financial | 13 (8.5%) | 140 (91.5%) |
| Computers, Engineering & Science | 277 (72.3%) | 106 (27.7%) |
| Computers & Mathematics | 117 (62.6%) | 70 (37.4%) |
| Architecture & Engineering | 56 (75.7%) | 18 (24.3%) |
| Life, Physical & Social Science | 104 (85.3%) | 18 (14.7%) |
| Community & Social Service | 166 (35.5%) | 301 (64.4%) |
| Education, Arts & Media | 57 (65.5%) | 30 (34.5%) |
| Legal Services & Support | 0 (0.0%) | 23 (100.0%) |
| Education Instruction & Library | 38 (16.1%) | 198 (83.9%) |
| Arts, Media & Entertainment | 71 (58.7%) | 50 (41.3%) |
| Health Diagnosing & Treating | 29 (17.7%) | 135 (82.3%) |
| Health Technologists | 20 (26.3%) | 56 (73.7%) |
| Total (Category) | 632 (44.9%) | 776 (55.1%) |
| Total (Overall) | 1,839 (50.7%) | 1,791 (49.3%) |
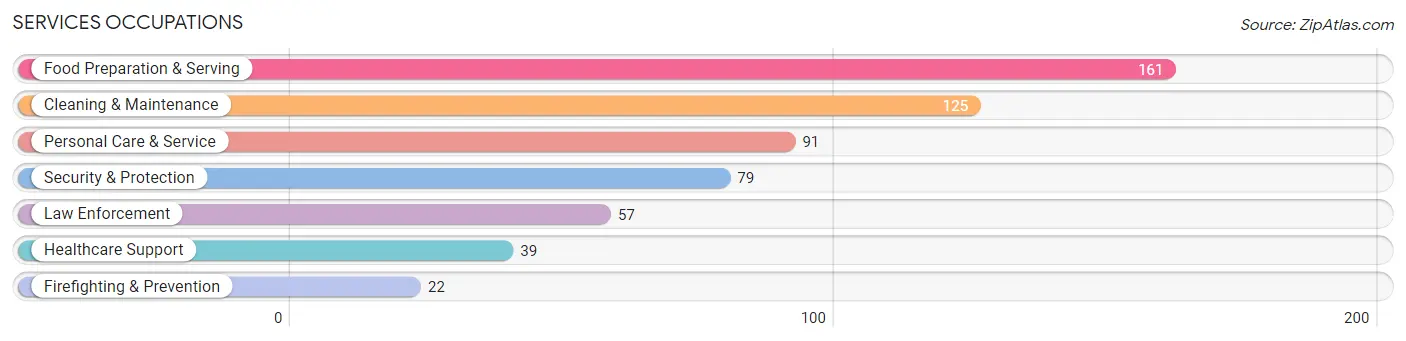
Services Occupations
The most common Services occupations in Ellettsville are Food Preparation & Serving (161 | 4.4%), Cleaning & Maintenance (125 | 3.4%), Personal Care & Service (91 | 2.5%), Security & Protection (79 | 2.2%), and Law Enforcement (57 | 1.6%).
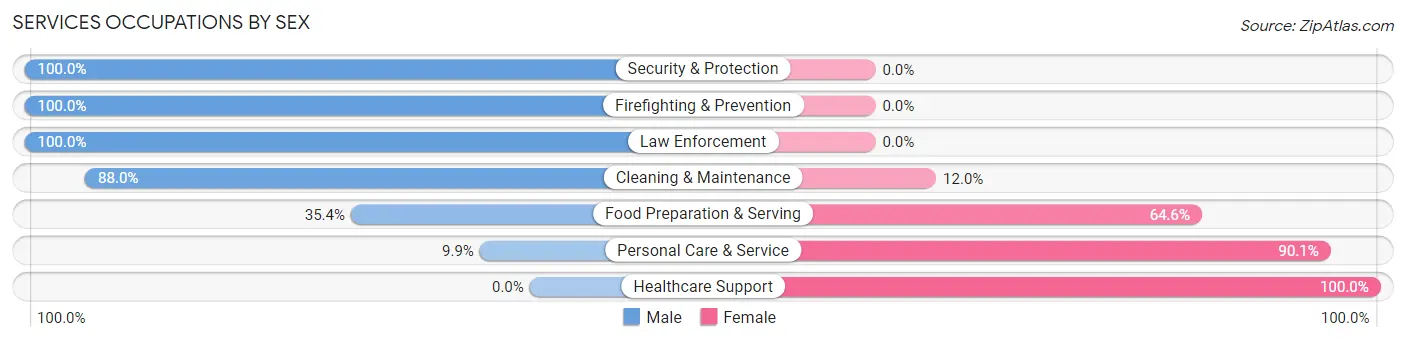
Services Occupations by Sex
Within the Services occupations in Ellettsville, the most male-oriented occupations are Security & Protection (100.0%), Firefighting & Prevention (100.0%), and Law Enforcement (100.0%), while the most female-oriented occupations are Healthcare Support (100.0%), Personal Care & Service (90.1%), and Food Preparation & Serving (64.6%).
| Occupation | Male | Female |
| Healthcare Support | 0 (0.0%) | 39 (100.0%) |
| Security & Protection | 79 (100.0%) | 0 (0.0%) |
| Firefighting & Prevention | 22 (100.0%) | 0 (0.0%) |
| Law Enforcement | 57 (100.0%) | 0 (0.0%) |
| Food Preparation & Serving | 57 (35.4%) | 104 (64.6%) |
| Cleaning & Maintenance | 110 (88.0%) | 15 (12.0%) |
| Personal Care & Service | 9 (9.9%) | 82 (90.1%) |
| Total (Category) | 255 (51.5%) | 240 (48.5%) |
| Total (Overall) | 1,839 (50.7%) | 1,791 (49.3%) |
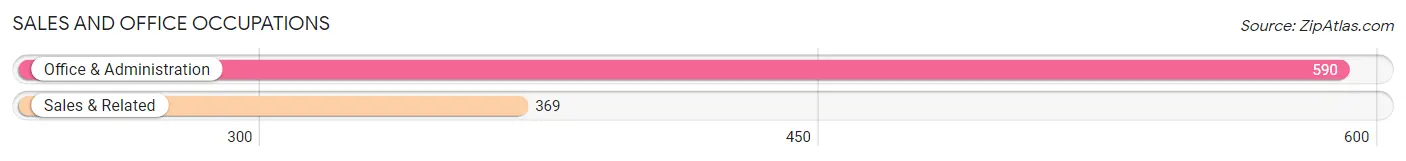
Sales and Office Occupations
The most common Sales and Office occupations in Ellettsville are Office & Administration (590 | 16.3%), and Sales & Related (369 | 10.2%).
Sales and Office Occupations by Sex
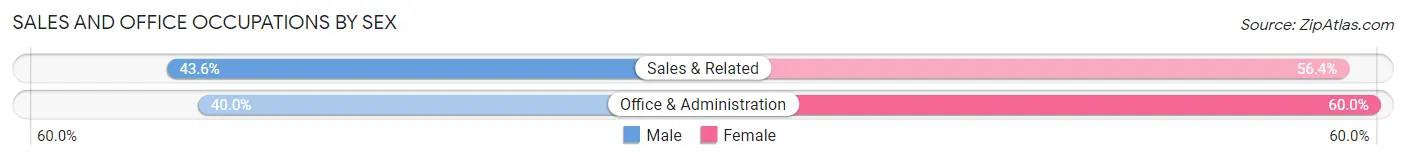
| Occupation | Male | Female |
| Sales & Related | 161 (43.6%) | 208 (56.4%) |
| Office & Administration | 236 (40.0%) | 354 (60.0%) |
| Total (Category) | 397 (41.4%) | 562 (58.6%) |
| Total (Overall) | 1,839 (50.7%) | 1,791 (49.3%) |
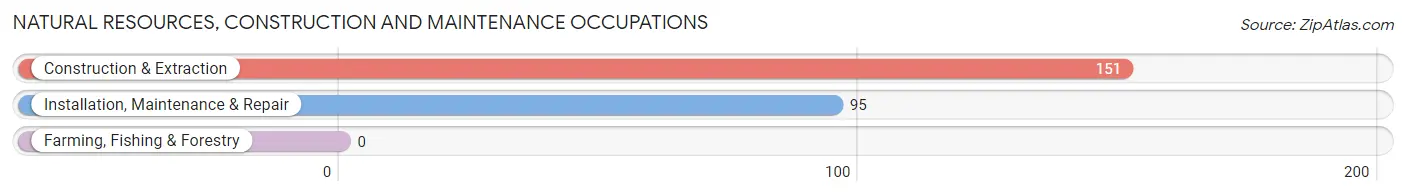
Natural Resources, Construction and Maintenance Occupations
The most common Natural Resources, Construction and Maintenance occupations in Ellettsville are Construction & Extraction (151 | 4.2%), and Installation, Maintenance & Repair (95 | 2.6%).
Natural Resources, Construction and Maintenance Occupations by Sex
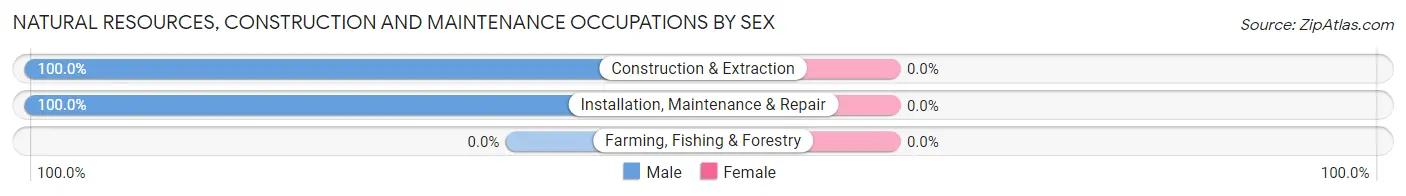
| Occupation | Male | Female |
| Farming, Fishing & Forestry | 0 (0.0%) | 0 (0.0%) |
| Construction & Extraction | 151 (100.0%) | 0 (0.0%) |
| Installation, Maintenance & Repair | 95 (100.0%) | 0 (0.0%) |
| Total (Category) | 246 (100.0%) | 0 (0.0%) |
| Total (Overall) | 1,839 (50.7%) | 1,791 (49.3%) |
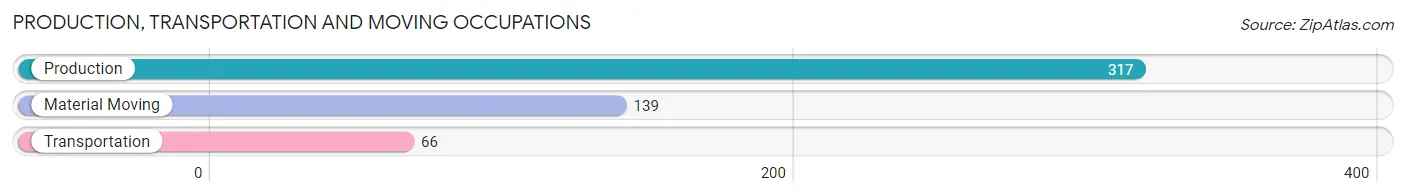
Production, Transportation and Moving Occupations
The most common Production, Transportation and Moving occupations in Ellettsville are Production (317 | 8.7%), Material Moving (139 | 3.8%), and Transportation (66 | 1.8%).
Production, Transportation and Moving Occupations by Sex
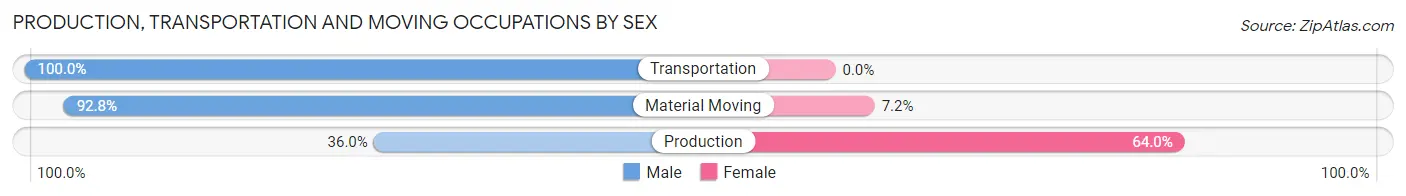
| Occupation | Male | Female |
| Production | 114 (36.0%) | 203 (64.0%) |
| Transportation | 66 (100.0%) | 0 (0.0%) |
| Material Moving | 129 (92.8%) | 10 (7.2%) |
| Total (Category) | 309 (59.2%) | 213 (40.8%) |
| Total (Overall) | 1,839 (50.7%) | 1,791 (49.3%) |
Employment Industries by Sex in Ellettsville
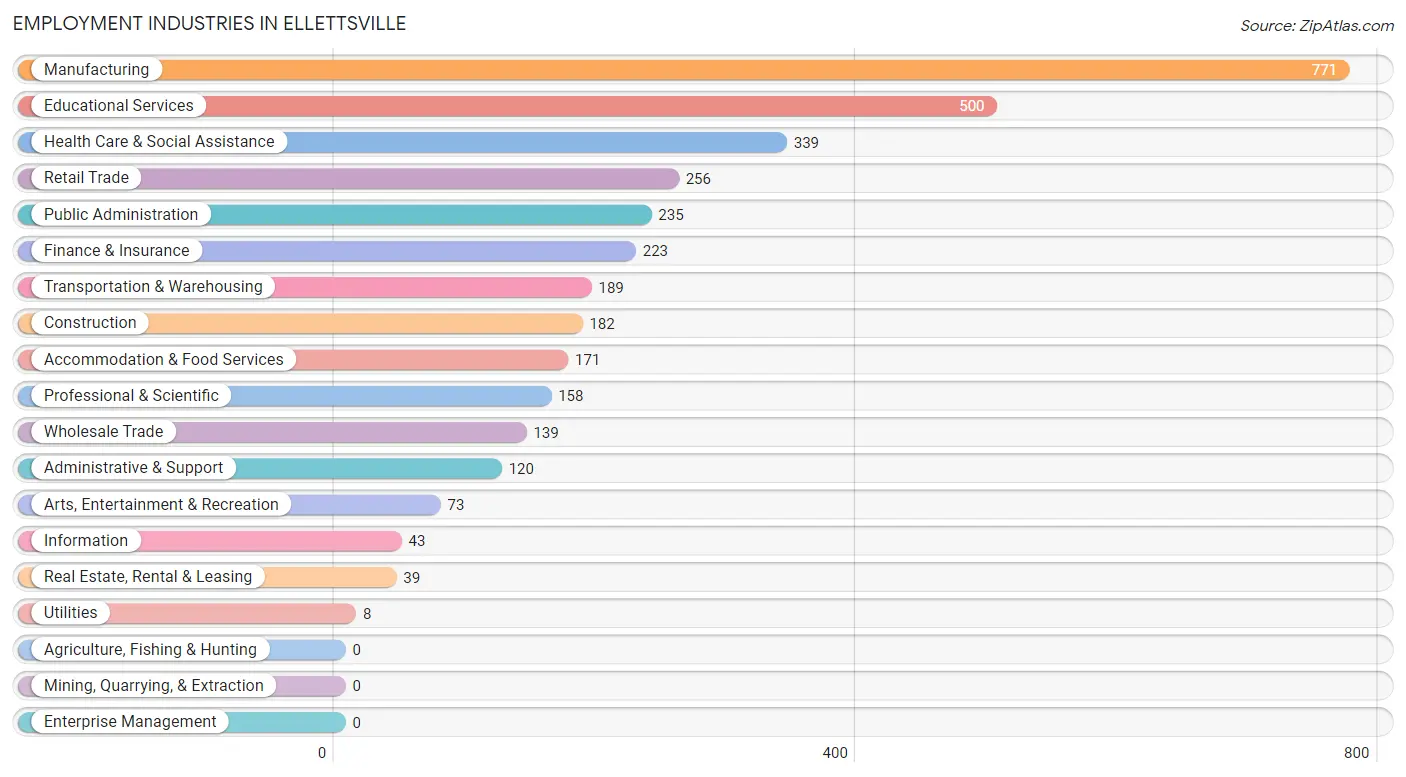
Employment Industries in Ellettsville
The major employment industries in Ellettsville include Manufacturing (771 | 21.2%), Educational Services (500 | 13.8%), Health Care & Social Assistance (339 | 9.3%), Retail Trade (256 | 7.0%), and Public Administration (235 | 6.5%).
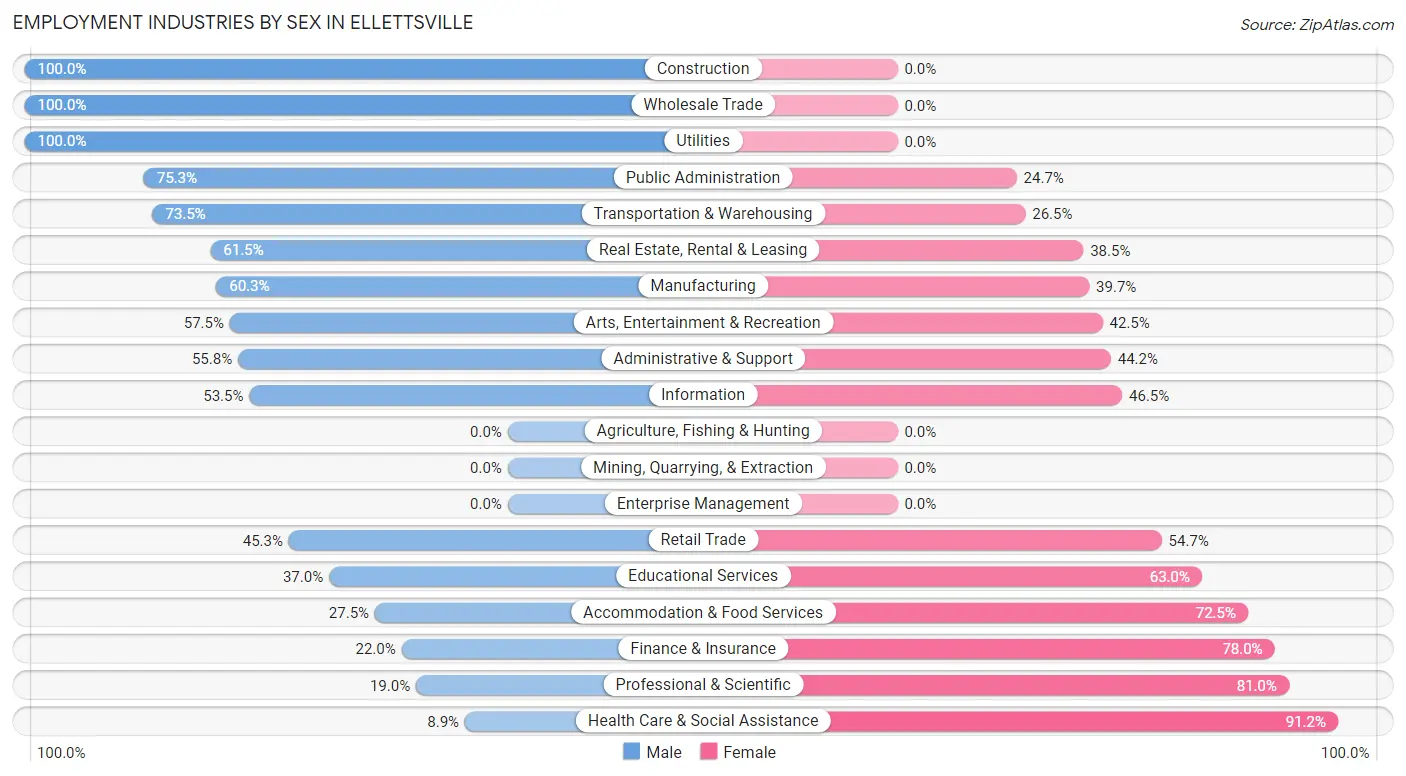
Employment Industries by Sex in Ellettsville
The Ellettsville industries that see more men than women are Construction (100.0%), Wholesale Trade (100.0%), and Utilities (100.0%), whereas the industries that tend to have a higher number of women are Health Care & Social Assistance (91.1%), Professional & Scientific (81.0%), and Finance & Insurance (78.0%).
| Industry | Male | Female |
| Agriculture, Fishing & Hunting | 0 (0.0%) | 0 (0.0%) |
| Mining, Quarrying, & Extraction | 0 (0.0%) | 0 (0.0%) |
| Construction | 182 (100.0%) | 0 (0.0%) |
| Manufacturing | 465 (60.3%) | 306 (39.7%) |
| Wholesale Trade | 139 (100.0%) | 0 (0.0%) |
| Retail Trade | 116 (45.3%) | 140 (54.7%) |
| Transportation & Warehousing | 139 (73.5%) | 50 (26.5%) |
| Utilities | 8 (100.0%) | 0 (0.0%) |
| Information | 23 (53.5%) | 20 (46.5%) |
| Finance & Insurance | 49 (22.0%) | 174 (78.0%) |
| Real Estate, Rental & Leasing | 24 (61.5%) | 15 (38.5%) |
| Professional & Scientific | 30 (19.0%) | 128 (81.0%) |
| Enterprise Management | 0 (0.0%) | 0 (0.0%) |
| Administrative & Support | 67 (55.8%) | 53 (44.2%) |
| Educational Services | 185 (37.0%) | 315 (63.0%) |
| Health Care & Social Assistance | 30 (8.8%) | 309 (91.1%) |
| Arts, Entertainment & Recreation | 42 (57.5%) | 31 (42.5%) |
| Accommodation & Food Services | 47 (27.5%) | 124 (72.5%) |
| Public Administration | 177 (75.3%) | 58 (24.7%) |
| Total | 1,839 (50.7%) | 1,791 (49.3%) |
Education in Ellettsville
School Enrollment in Ellettsville
The most common levels of schooling among the 1,677 students in Ellettsville are elementary school (367 | 21.9%), middle school (350 | 20.9%), and college / undergraduate (287 | 17.1%).
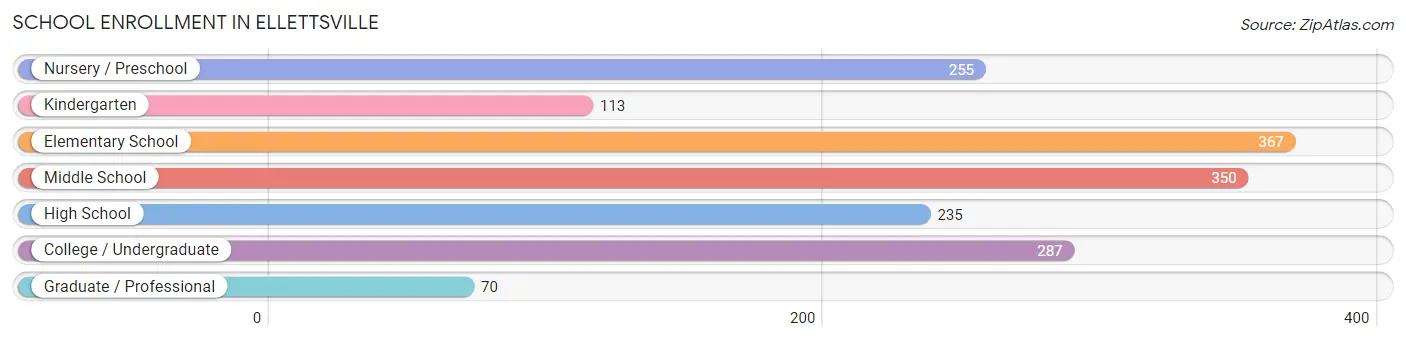
| School Level | # Students | % Students |
| Nursery / Preschool | 255 | 15.2% |
| Kindergarten | 113 | 6.7% |
| Elementary School | 367 | 21.9% |
| Middle School | 350 | 20.9% |
| High School | 235 | 14.0% |
| College / Undergraduate | 287 | 17.1% |
| Graduate / Professional | 70 | 4.2% |
| Total | 1,677 | 100.0% |
School Enrollment by Age by Funding Source in Ellettsville
Out of a total of 1,677 students who are enrolled in schools in Ellettsville, 421 (25.1%) attend a private institution, while the remaining 1,256 (74.9%) are enrolled in public schools. The age group of 3 to 4 year olds has the highest likelihood of being enrolled in private schools, with 148 (96.1% in the age bracket) enrolled. Conversely, the age group of 18 to 19 year olds has the lowest likelihood of being enrolled in a private school, with 78 (100.0% in the age bracket) attending a public institution.
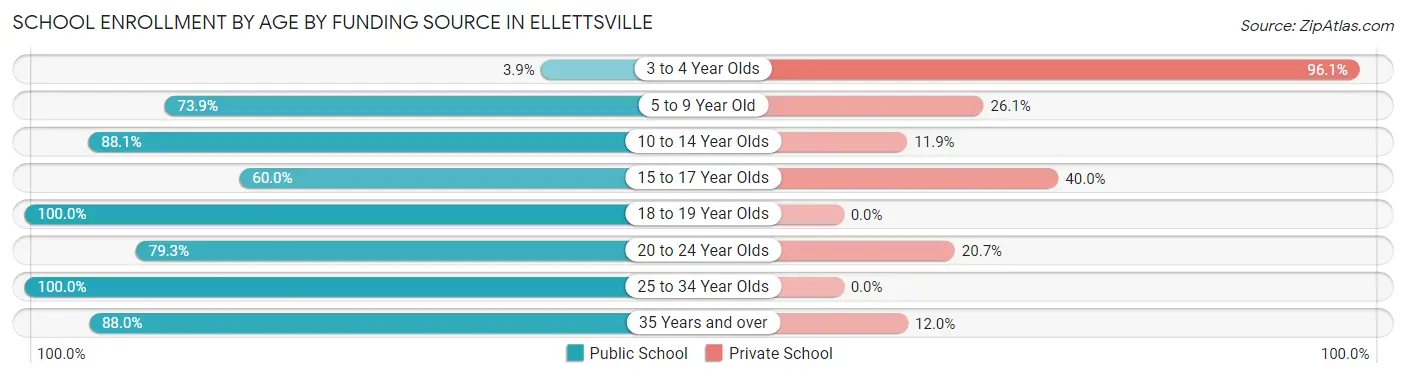
| Age Bracket | Public School | Private School |
| 3 to 4 Year Olds | 6 (3.9%) | 148 (96.1%) |
| 5 to 9 Year Old | 346 (73.9%) | 122 (26.1%) |
| 10 to 14 Year Olds | 453 (88.1%) | 61 (11.9%) |
| 15 to 17 Year Olds | 87 (60.0%) | 58 (40.0%) |
| 18 to 19 Year Olds | 78 (100.0%) | 0 (0.0%) |
| 20 to 24 Year Olds | 88 (79.3%) | 23 (20.7%) |
| 25 to 34 Year Olds | 132 (100.0%) | 0 (0.0%) |
| 35 Years and over | 66 (88.0%) | 9 (12.0%) |
| Total | 1,256 (74.9%) | 421 (25.1%) |
Educational Attainment by Field of Study in Ellettsville
Education (238 | 13.4%), bio, nature & agricultural (223 | 12.6%), business (200 | 11.3%), science & technology (193 | 10.9%), and arts & humanities (186 | 10.5%) are the most common fields of study among 1,774 individuals in Ellettsville who have obtained a bachelor's degree or higher.
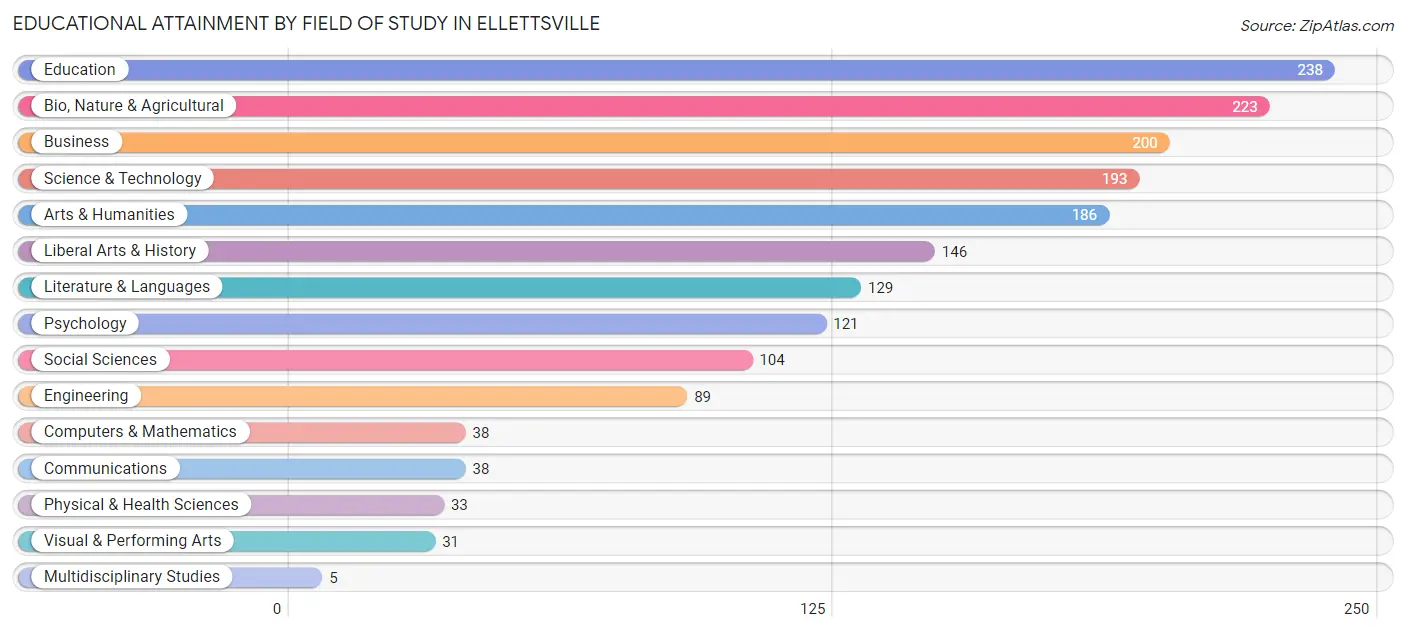
| Field of Study | # Graduates | % Graduates |
| Computers & Mathematics | 38 | 2.1% |
| Bio, Nature & Agricultural | 223 | 12.6% |
| Physical & Health Sciences | 33 | 1.9% |
| Psychology | 121 | 6.8% |
| Social Sciences | 104 | 5.9% |
| Engineering | 89 | 5.0% |
| Multidisciplinary Studies | 5 | 0.3% |
| Science & Technology | 193 | 10.9% |
| Business | 200 | 11.3% |
| Education | 238 | 13.4% |
| Literature & Languages | 129 | 7.3% |
| Liberal Arts & History | 146 | 8.2% |
| Visual & Performing Arts | 31 | 1.8% |
| Communications | 38 | 2.1% |
| Arts & Humanities | 186 | 10.5% |
| Total | 1,774 | 100.0% |
Transportation & Commute in Ellettsville
Vehicle Availability by Sex in Ellettsville
The most prevalent vehicle ownership categories in Ellettsville are males with 2 vehicles (900, accounting for 49.1%) and females with 2 vehicles (851, making up 51.6%).
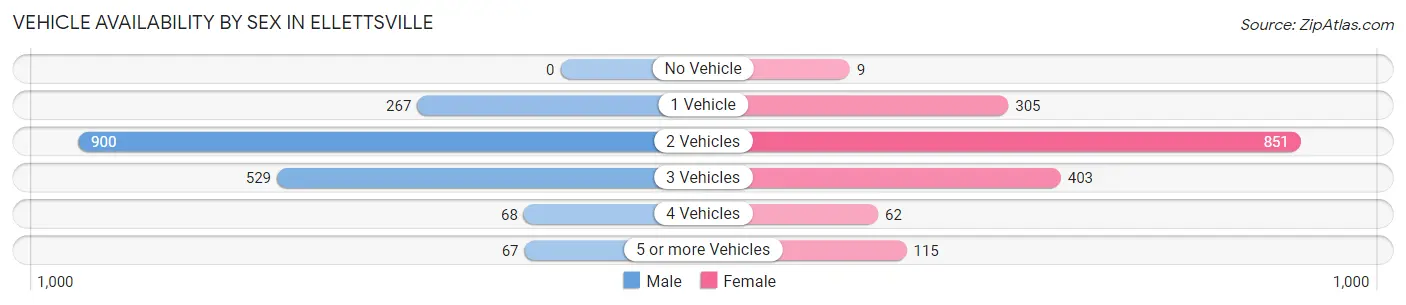
| Vehicles Available | Male | Female |
| No Vehicle | 0 (0.0%) | 9 (0.5%) |
| 1 Vehicle | 267 (14.6%) | 305 (17.5%) |
| 2 Vehicles | 900 (49.1%) | 851 (48.8%) |
| 3 Vehicles | 529 (28.9%) | 403 (23.1%) |
| 4 Vehicles | 68 (3.7%) | 62 (3.5%) |
| 5 or more Vehicles | 67 (3.7%) | 115 (6.6%) |
| Total | 1,831 (100.0%) | 1,745 (100.0%) |
Commute Time in Ellettsville
The most frequently occuring commute durations in Ellettsville are 20 to 24 minutes (976 commuters, 29.5%), 15 to 19 minutes (857 commuters, 25.9%), and 5 to 9 minutes (383 commuters, 11.6%).
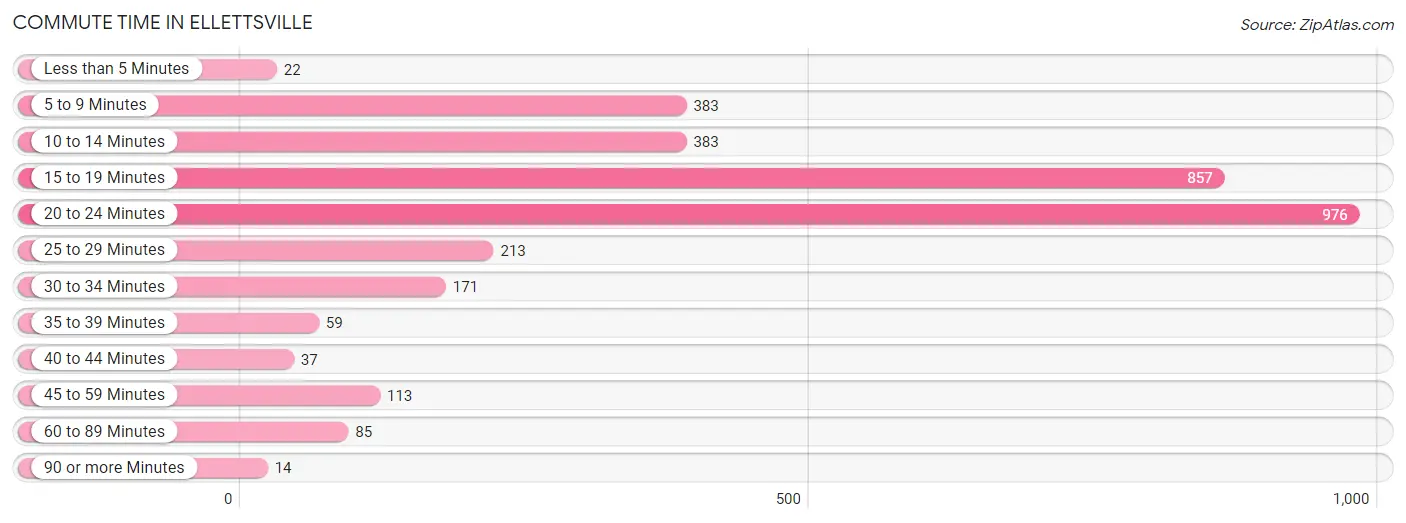
| Commute Time | # Commuters | % Commuters |
| Less than 5 Minutes | 22 | 0.7% |
| 5 to 9 Minutes | 383 | 11.6% |
| 10 to 14 Minutes | 383 | 11.6% |
| 15 to 19 Minutes | 857 | 25.9% |
| 20 to 24 Minutes | 976 | 29.5% |
| 25 to 29 Minutes | 213 | 6.4% |
| 30 to 34 Minutes | 171 | 5.2% |
| 35 to 39 Minutes | 59 | 1.8% |
| 40 to 44 Minutes | 37 | 1.1% |
| 45 to 59 Minutes | 113 | 3.4% |
| 60 to 89 Minutes | 85 | 2.6% |
| 90 or more Minutes | 14 | 0.4% |
Commute Time by Sex in Ellettsville
The most common commute times in Ellettsville are 20 to 24 minutes (479 commuters, 27.8%) for males and 20 to 24 minutes (497 commuters, 31.3%) for females.
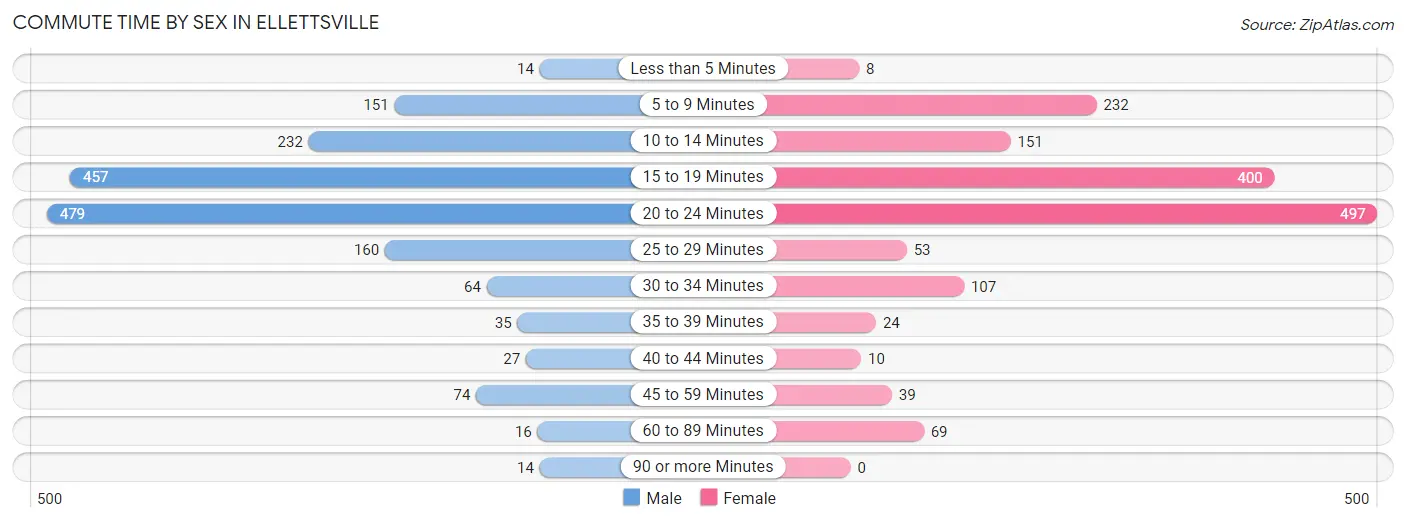
| Commute Time | Male | Female |
| Less than 5 Minutes | 14 (0.8%) | 8 (0.5%) |
| 5 to 9 Minutes | 151 (8.8%) | 232 (14.6%) |
| 10 to 14 Minutes | 232 (13.5%) | 151 (9.5%) |
| 15 to 19 Minutes | 457 (26.5%) | 400 (25.2%) |
| 20 to 24 Minutes | 479 (27.8%) | 497 (31.3%) |
| 25 to 29 Minutes | 160 (9.3%) | 53 (3.3%) |
| 30 to 34 Minutes | 64 (3.7%) | 107 (6.7%) |
| 35 to 39 Minutes | 35 (2.0%) | 24 (1.5%) |
| 40 to 44 Minutes | 27 (1.6%) | 10 (0.6%) |
| 45 to 59 Minutes | 74 (4.3%) | 39 (2.5%) |
| 60 to 89 Minutes | 16 (0.9%) | 69 (4.3%) |
| 90 or more Minutes | 14 (0.8%) | 0 (0.0%) |
Time of Departure to Work by Sex in Ellettsville
The most frequent times of departure to work in Ellettsville are 6:30 AM to 6:59 AM (291, 16.9%) for males and 8:30 AM to 8:59 AM (239, 15.0%) for females.
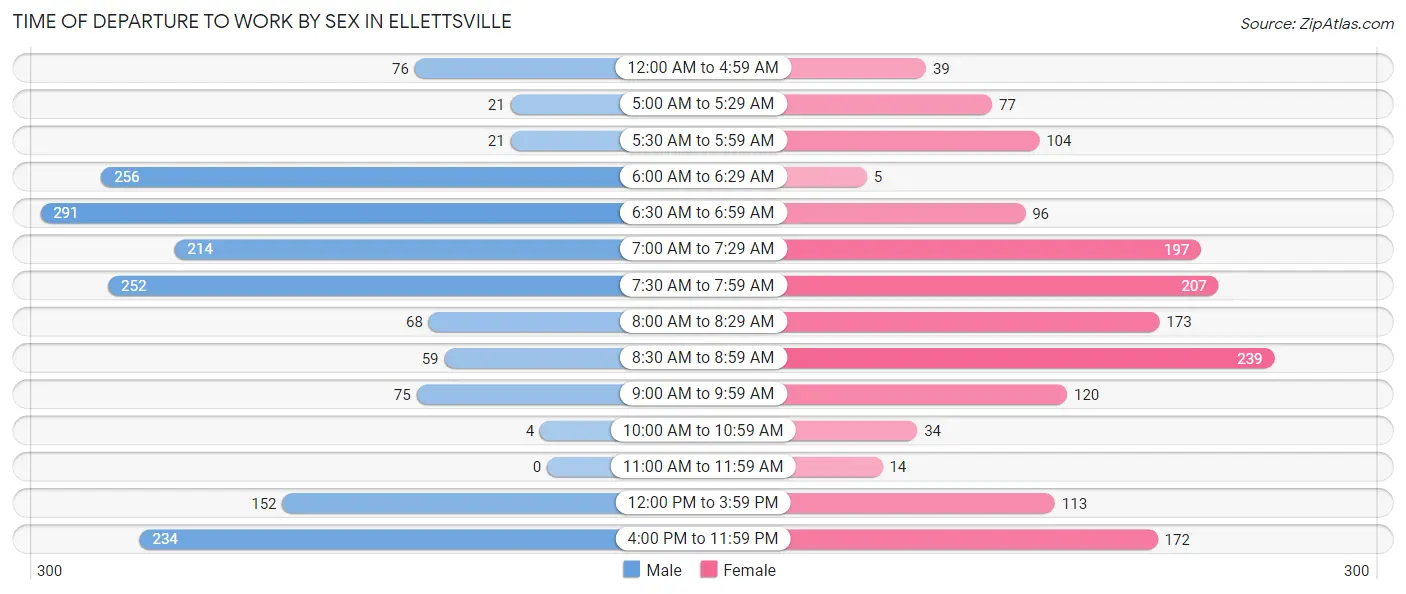
| Time of Departure | Male | Female |
| 12:00 AM to 4:59 AM | 76 (4.4%) | 39 (2.5%) |
| 5:00 AM to 5:29 AM | 21 (1.2%) | 77 (4.8%) |
| 5:30 AM to 5:59 AM | 21 (1.2%) | 104 (6.5%) |
| 6:00 AM to 6:29 AM | 256 (14.9%) | 5 (0.3%) |
| 6:30 AM to 6:59 AM | 291 (16.9%) | 96 (6.0%) |
| 7:00 AM to 7:29 AM | 214 (12.4%) | 197 (12.4%) |
| 7:30 AM to 7:59 AM | 252 (14.6%) | 207 (13.0%) |
| 8:00 AM to 8:29 AM | 68 (4.0%) | 173 (10.9%) |
| 8:30 AM to 8:59 AM | 59 (3.4%) | 239 (15.0%) |
| 9:00 AM to 9:59 AM | 75 (4.3%) | 120 (7.5%) |
| 10:00 AM to 10:59 AM | 4 (0.2%) | 34 (2.1%) |
| 11:00 AM to 11:59 AM | 0 (0.0%) | 14 (0.9%) |
| 12:00 PM to 3:59 PM | 152 (8.8%) | 113 (7.1%) |
| 4:00 PM to 11:59 PM | 234 (13.6%) | 172 (10.8%) |
| Total | 1,723 (100.0%) | 1,590 (100.0%) |
Housing Occupancy in Ellettsville
Occupancy by Ownership in Ellettsville
Of the total 2,707 dwellings in Ellettsville, owner-occupied units account for 2,336 (86.3%), while renter-occupied units make up 371 (13.7%).
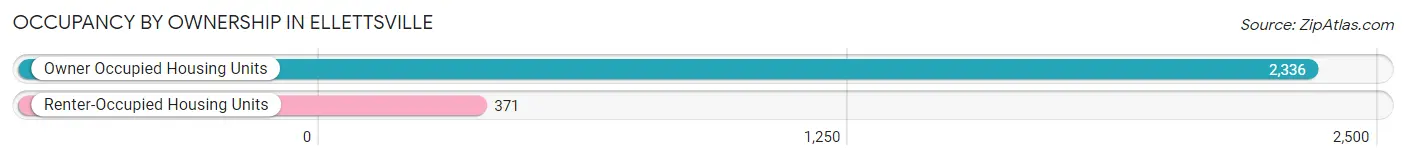
| Occupancy | # Housing Units | % Housing Units |
| Owner Occupied Housing Units | 2,336 | 86.3% |
| Renter-Occupied Housing Units | 371 | 13.7% |
| Total Occupied Housing Units | 2,707 | 100.0% |
Occupancy by Household Size in Ellettsville
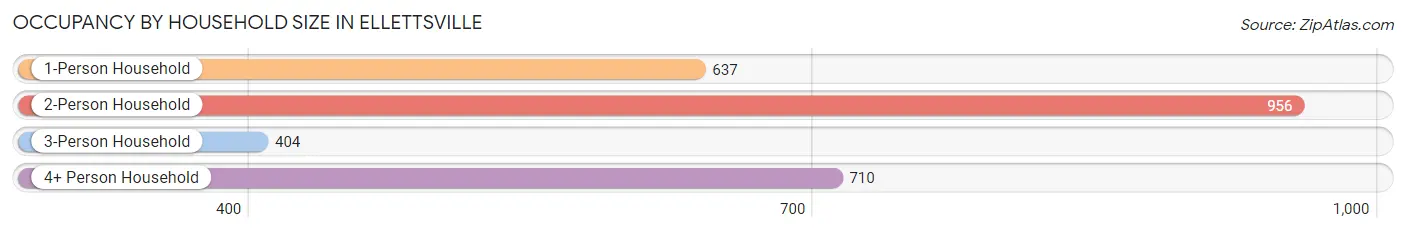
| Household Size | # Housing Units | % Housing Units |
| 1-Person Household | 637 | 23.5% |
| 2-Person Household | 956 | 35.3% |
| 3-Person Household | 404 | 14.9% |
| 4+ Person Household | 710 | 26.2% |
| Total Housing Units | 2,707 | 100.0% |
Occupancy by Ownership by Household Size in Ellettsville
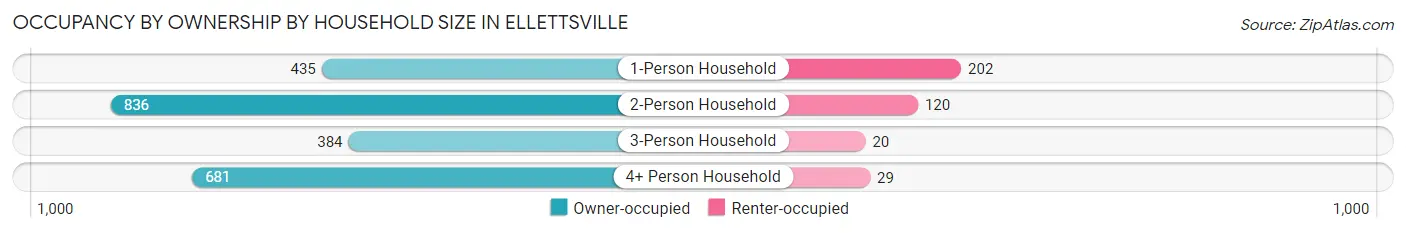
| Household Size | Owner-occupied | Renter-occupied |
| 1-Person Household | 435 (68.3%) | 202 (31.7%) |
| 2-Person Household | 836 (87.5%) | 120 (12.6%) |
| 3-Person Household | 384 (95.1%) | 20 (5.0%) |
| 4+ Person Household | 681 (95.9%) | 29 (4.1%) |
| Total Housing Units | 2,336 (86.3%) | 371 (13.7%) |
Occupancy by Educational Attainment in Ellettsville
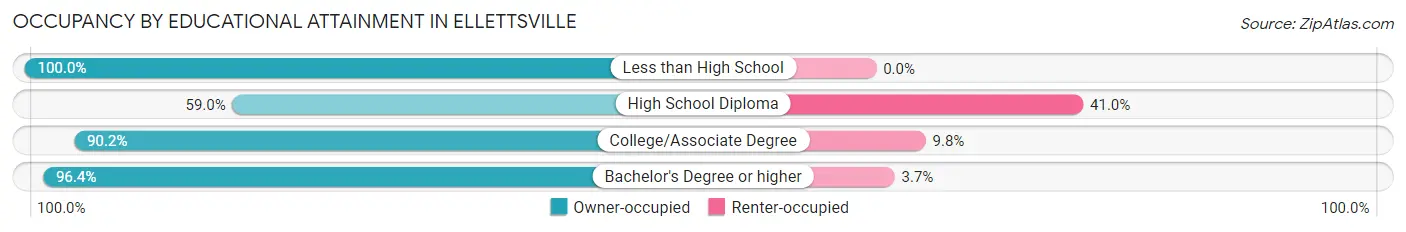
| Household Size | Owner-occupied | Renter-occupied |
| Less than High School | 24 (100.0%) | 0 (0.0%) |
| High School Diploma | 322 (59.0%) | 224 (41.0%) |
| College/Associate Degree | 1,013 (90.2%) | 110 (9.8%) |
| Bachelor's Degree or higher | 977 (96.4%) | 37 (3.6%) |
Occupancy by Age of Householder in Ellettsville
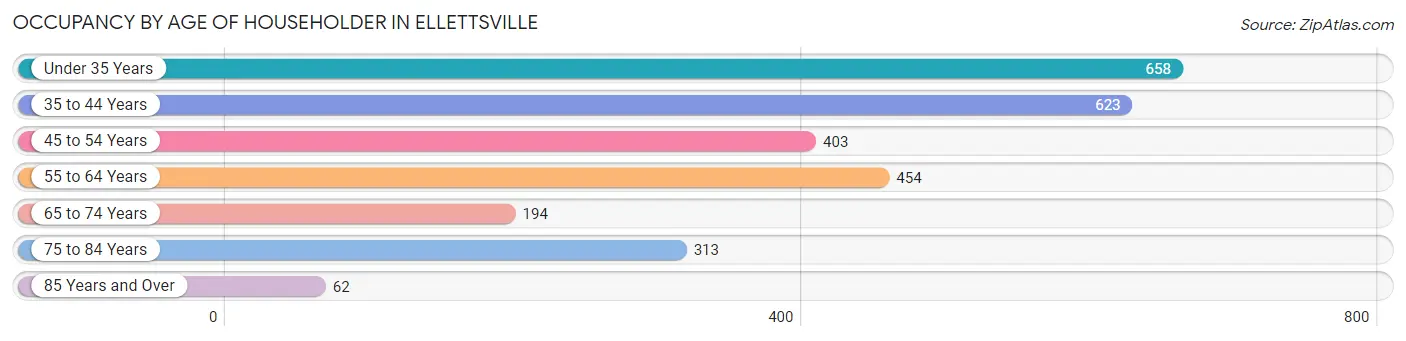
| Age Bracket | # Households | % Households |
| Under 35 Years | 658 | 24.3% |
| 35 to 44 Years | 623 | 23.0% |
| 45 to 54 Years | 403 | 14.9% |
| 55 to 64 Years | 454 | 16.8% |
| 65 to 74 Years | 194 | 7.2% |
| 75 to 84 Years | 313 | 11.6% |
| 85 Years and Over | 62 | 2.3% |
| Total | 2,707 | 100.0% |
Housing Finances in Ellettsville
Median Income by Occupancy in Ellettsville
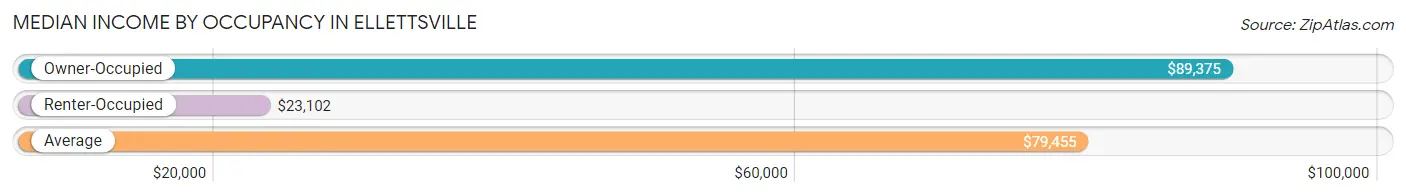
| Occupancy Type | # Households | Median Income |
| Owner-Occupied | 2,336 (86.3%) | $89,375 |
| Renter-Occupied | 371 (13.7%) | $23,102 |
| Average | 2,707 (100.0%) | $79,455 |
Occupancy by Householder Income Bracket in Ellettsville
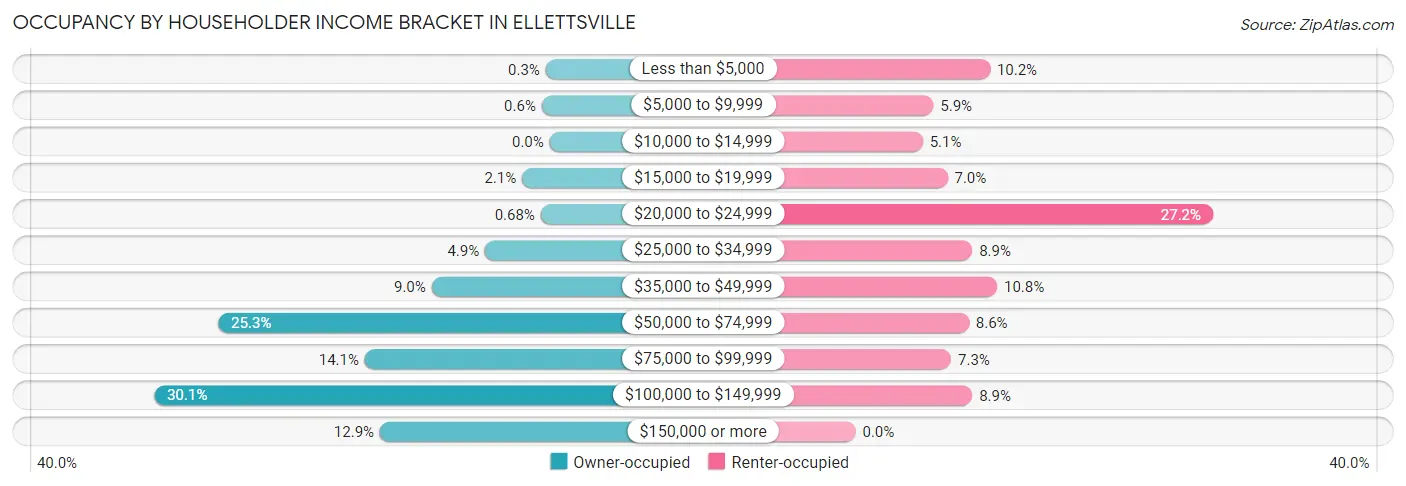
| Income Bracket | Owner-occupied | Renter-occupied |
| Less than $5,000 | 7 (0.3%) | 38 (10.2%) |
| $5,000 to $9,999 | 14 (0.6%) | 22 (5.9%) |
| $10,000 to $14,999 | 0 (0.0%) | 19 (5.1%) |
| $15,000 to $19,999 | 49 (2.1%) | 26 (7.0%) |
| $20,000 to $24,999 | 16 (0.7%) | 101 (27.2%) |
| $25,000 to $34,999 | 115 (4.9%) | 33 (8.9%) |
| $35,000 to $49,999 | 210 (9.0%) | 40 (10.8%) |
| $50,000 to $74,999 | 590 (25.3%) | 32 (8.6%) |
| $75,000 to $99,999 | 329 (14.1%) | 27 (7.3%) |
| $100,000 to $149,999 | 704 (30.1%) | 33 (8.9%) |
| $150,000 or more | 302 (12.9%) | 0 (0.0%) |
| Total | 2,336 (100.0%) | 371 (100.0%) |
Monthly Housing Cost Tiers in Ellettsville
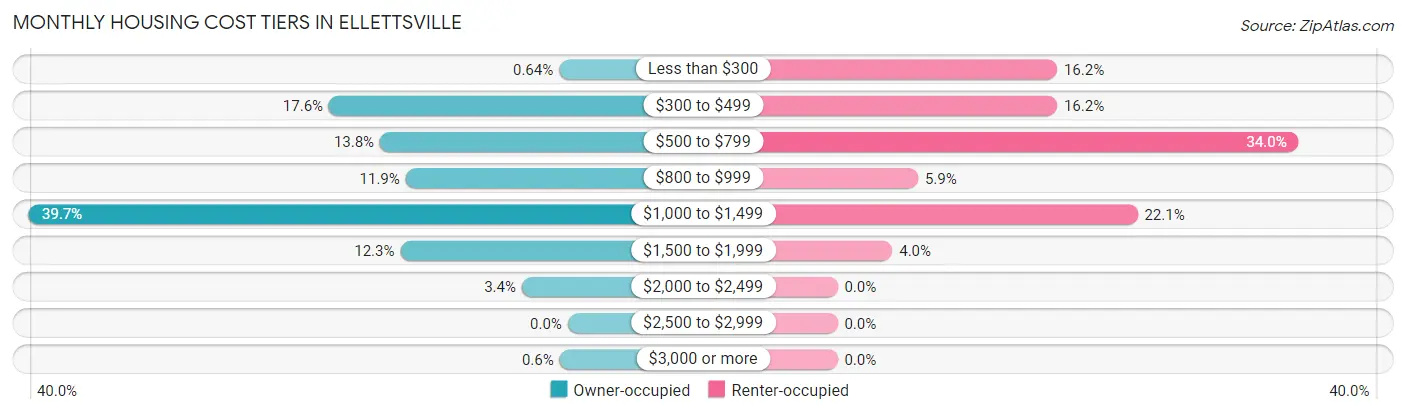
| Monthly Cost | Owner-occupied | Renter-occupied |
| Less than $300 | 15 (0.6%) | 60 (16.2%) |
| $300 to $499 | 411 (17.6%) | 60 (16.2%) |
| $500 to $799 | 323 (13.8%) | 126 (34.0%) |
| $800 to $999 | 279 (11.9%) | 22 (5.9%) |
| $1,000 to $1,499 | 927 (39.7%) | 82 (22.1%) |
| $1,500 to $1,999 | 288 (12.3%) | 15 (4.0%) |
| $2,000 to $2,499 | 79 (3.4%) | 0 (0.0%) |
| $2,500 to $2,999 | 0 (0.0%) | 0 (0.0%) |
| $3,000 or more | 14 (0.6%) | 0 (0.0%) |
| Total | 2,336 (100.0%) | 371 (100.0%) |
Physical Housing Characteristics in Ellettsville
Housing Structures in Ellettsville
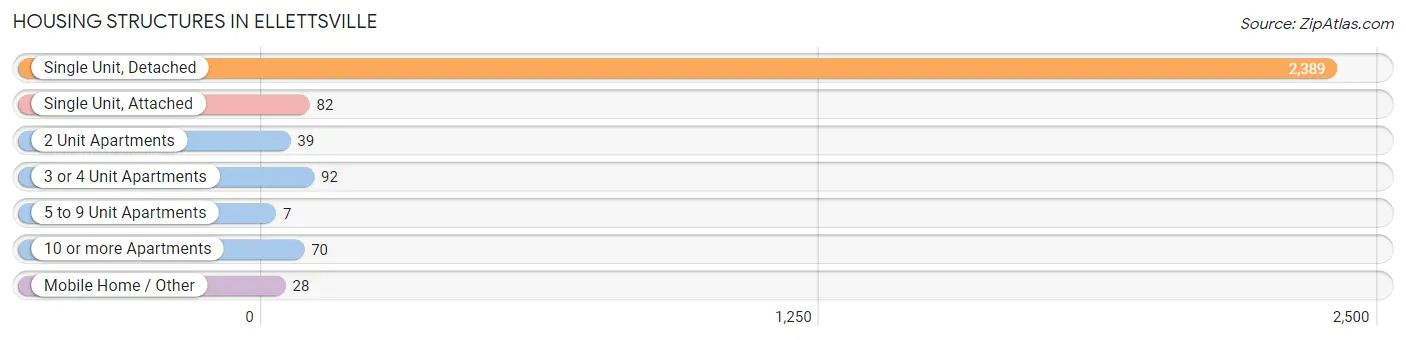
| Structure Type | # Housing Units | % Housing Units |
| Single Unit, Detached | 2,389 | 88.2% |
| Single Unit, Attached | 82 | 3.0% |
| 2 Unit Apartments | 39 | 1.4% |
| 3 or 4 Unit Apartments | 92 | 3.4% |
| 5 to 9 Unit Apartments | 7 | 0.3% |
| 10 or more Apartments | 70 | 2.6% |
| Mobile Home / Other | 28 | 1.0% |
| Total | 2,707 | 100.0% |
Housing Structures by Occupancy in Ellettsville
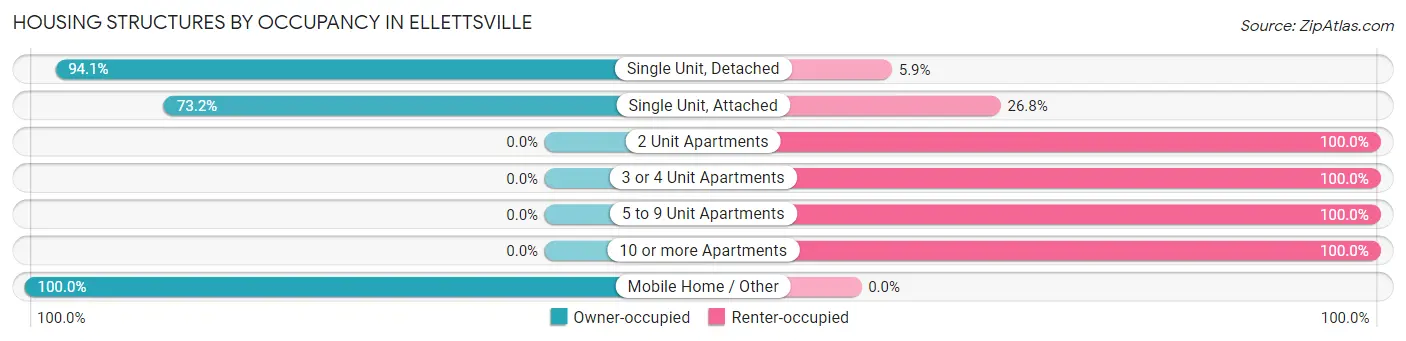
| Structure Type | Owner-occupied | Renter-occupied |
| Single Unit, Detached | 2,248 (94.1%) | 141 (5.9%) |
| Single Unit, Attached | 60 (73.2%) | 22 (26.8%) |
| 2 Unit Apartments | 0 (0.0%) | 39 (100.0%) |
| 3 or 4 Unit Apartments | 0 (0.0%) | 92 (100.0%) |
| 5 to 9 Unit Apartments | 0 (0.0%) | 7 (100.0%) |
| 10 or more Apartments | 0 (0.0%) | 70 (100.0%) |
| Mobile Home / Other | 28 (100.0%) | 0 (0.0%) |
| Total | 2,336 (86.3%) | 371 (13.7%) |
Housing Structures by Number of Rooms in Ellettsville
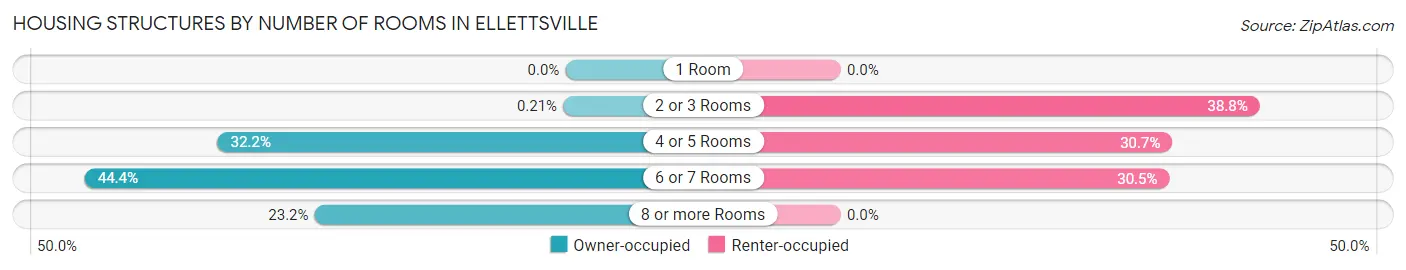
| Number of Rooms | Owner-occupied | Renter-occupied |
| 1 Room | 0 (0.0%) | 0 (0.0%) |
| 2 or 3 Rooms | 5 (0.2%) | 144 (38.8%) |
| 4 or 5 Rooms | 751 (32.2%) | 114 (30.7%) |
| 6 or 7 Rooms | 1,038 (44.4%) | 113 (30.5%) |
| 8 or more Rooms | 542 (23.2%) | 0 (0.0%) |
| Total | 2,336 (100.0%) | 371 (100.0%) |
Housing Structure by Heating Type in Ellettsville
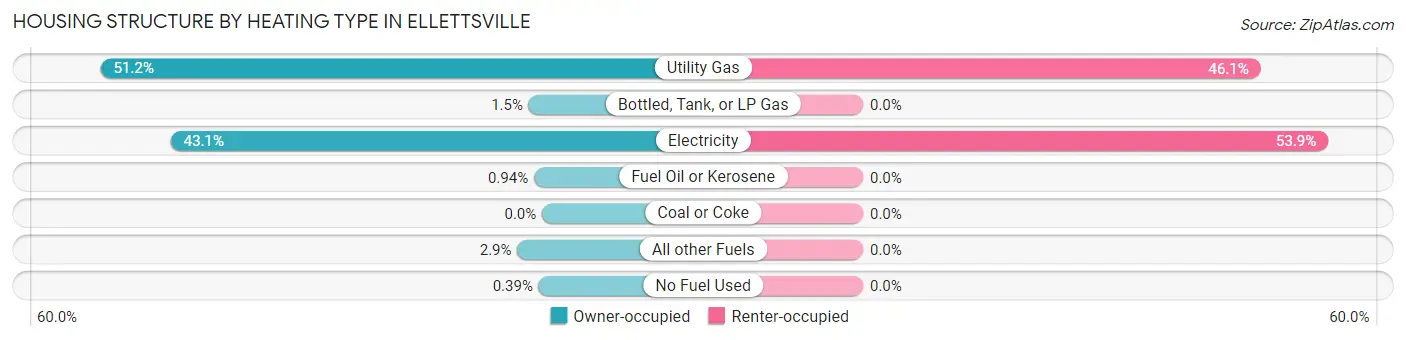
| Heating Type | Owner-occupied | Renter-occupied |
| Utility Gas | 1,196 (51.2%) | 171 (46.1%) |
| Bottled, Tank, or LP Gas | 36 (1.5%) | 0 (0.0%) |
| Electricity | 1,006 (43.1%) | 200 (53.9%) |
| Fuel Oil or Kerosene | 22 (0.9%) | 0 (0.0%) |
| Coal or Coke | 0 (0.0%) | 0 (0.0%) |
| All other Fuels | 67 (2.9%) | 0 (0.0%) |
| No Fuel Used | 9 (0.4%) | 0 (0.0%) |
| Total | 2,336 (100.0%) | 371 (100.0%) |
Household Vehicle Usage in Ellettsville
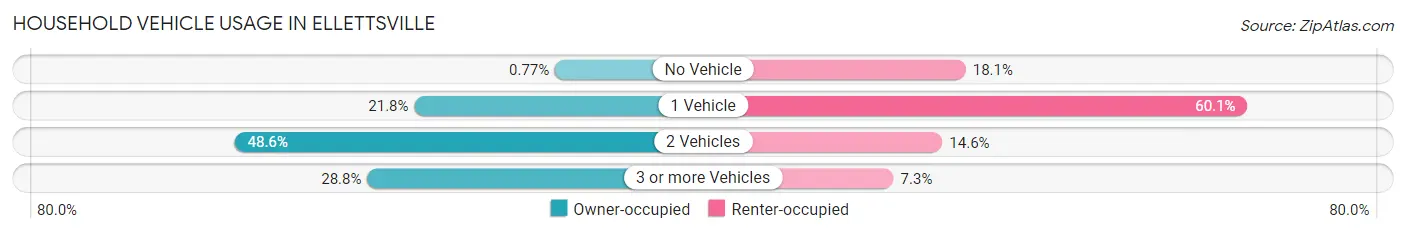
| Vehicles per Household | Owner-occupied | Renter-occupied |
| No Vehicle | 18 (0.8%) | 67 (18.1%) |
| 1 Vehicle | 509 (21.8%) | 223 (60.1%) |
| 2 Vehicles | 1,136 (48.6%) | 54 (14.6%) |
| 3 or more Vehicles | 673 (28.8%) | 27 (7.3%) |
| Total | 2,336 (100.0%) | 371 (100.0%) |
Real Estate & Mortgages in Ellettsville
Real Estate and Mortgage Overview in Ellettsville
| Characteristic | Without Mortgage | With Mortgage |
| Housing Units | 617 | 1,719 |
| Median Property Value | $227,000 | $199,700 |
| Median Household Income | $56,157 | $244 |
| Monthly Housing Costs | $462 | $7 |
| Real Estate Taxes | $1,674 | $133 |
Property Value by Mortgage Status in Ellettsville
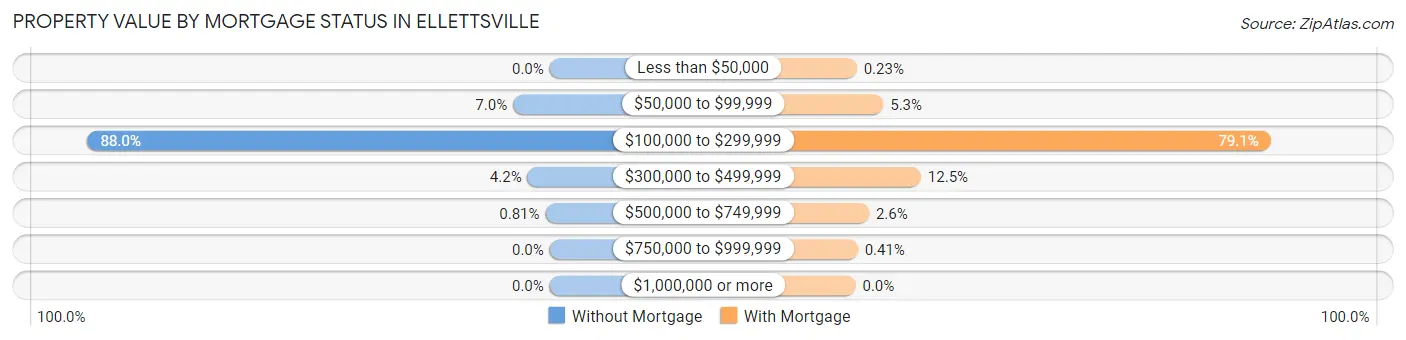
| Property Value | Without Mortgage | With Mortgage |
| Less than $50,000 | 0 (0.0%) | 4 (0.2%) |
| $50,000 to $99,999 | 43 (7.0%) | 91 (5.3%) |
| $100,000 to $299,999 | 543 (88.0%) | 1,359 (79.1%) |
| $300,000 to $499,999 | 26 (4.2%) | 214 (12.4%) |
| $500,000 to $749,999 | 5 (0.8%) | 44 (2.6%) |
| $750,000 to $999,999 | 0 (0.0%) | 7 (0.4%) |
| $1,000,000 or more | 0 (0.0%) | 0 (0.0%) |
| Total | 617 (100.0%) | 1,719 (100.0%) |
Household Income by Mortgage Status in Ellettsville
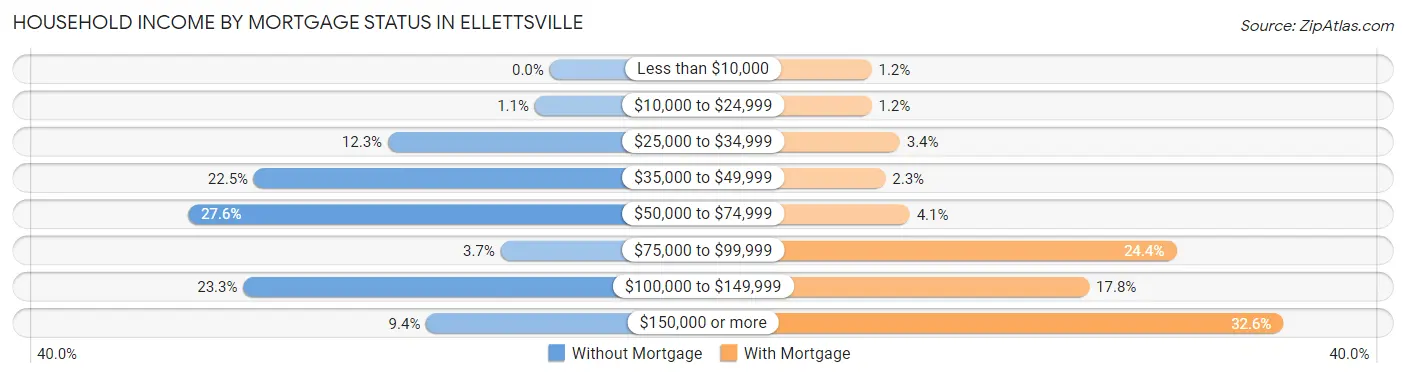
| Household Income | Without Mortgage | With Mortgage |
| Less than $10,000 | 0 (0.0%) | 21 (1.2%) |
| $10,000 to $24,999 | 7 (1.1%) | 21 (1.2%) |
| $25,000 to $34,999 | 76 (12.3%) | 58 (3.4%) |
| $35,000 to $49,999 | 139 (22.5%) | 39 (2.3%) |
| $50,000 to $74,999 | 170 (27.6%) | 71 (4.1%) |
| $75,000 to $99,999 | 23 (3.7%) | 420 (24.4%) |
| $100,000 to $149,999 | 144 (23.3%) | 306 (17.8%) |
| $150,000 or more | 58 (9.4%) | 560 (32.6%) |
| Total | 617 (100.0%) | 1,719 (100.0%) |
Property Value to Household Income Ratio in Ellettsville
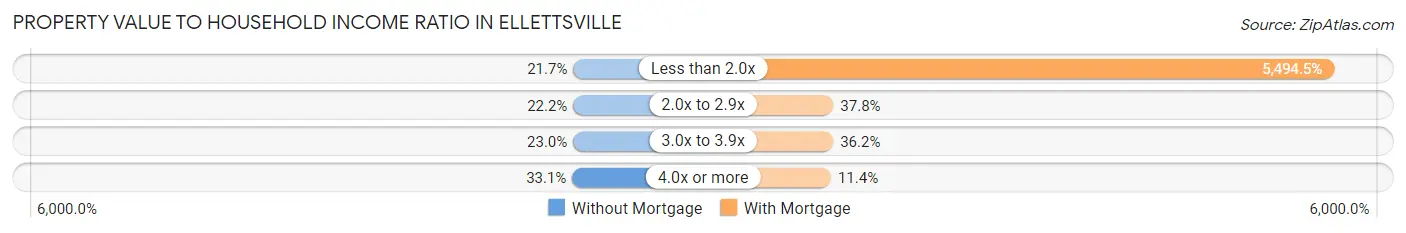
| Value-to-Income Ratio | Without Mortgage | With Mortgage |
| Less than 2.0x | 134 (21.7%) | 94,451 (5,494.5%) |
| 2.0x to 2.9x | 137 (22.2%) | 650 (37.8%) |
| 3.0x to 3.9x | 142 (23.0%) | 623 (36.2%) |
| 4.0x or more | 204 (33.1%) | 196 (11.4%) |
| Total | 617 (100.0%) | 1,719 (100.0%) |
Real Estate Taxes by Mortgage Status in Ellettsville
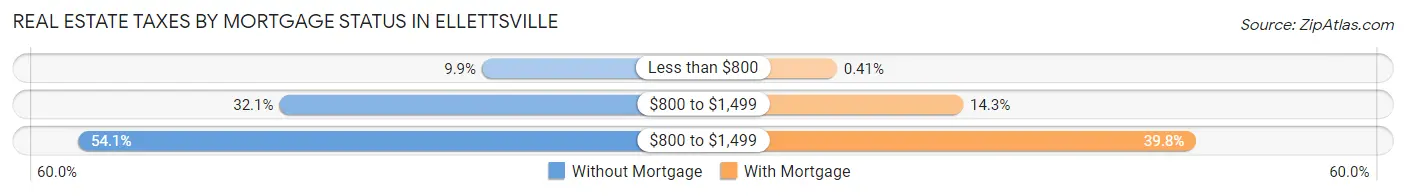
| Property Taxes | Without Mortgage | With Mortgage |
| Less than $800 | 61 (9.9%) | 7 (0.4%) |
| $800 to $1,499 | 198 (32.1%) | 245 (14.2%) |
| $800 to $1,499 | 334 (54.1%) | 684 (39.8%) |
| Total | 617 (100.0%) | 1,719 (100.0%) |
Health & Disability in Ellettsville
Health Insurance Coverage by Age in Ellettsville
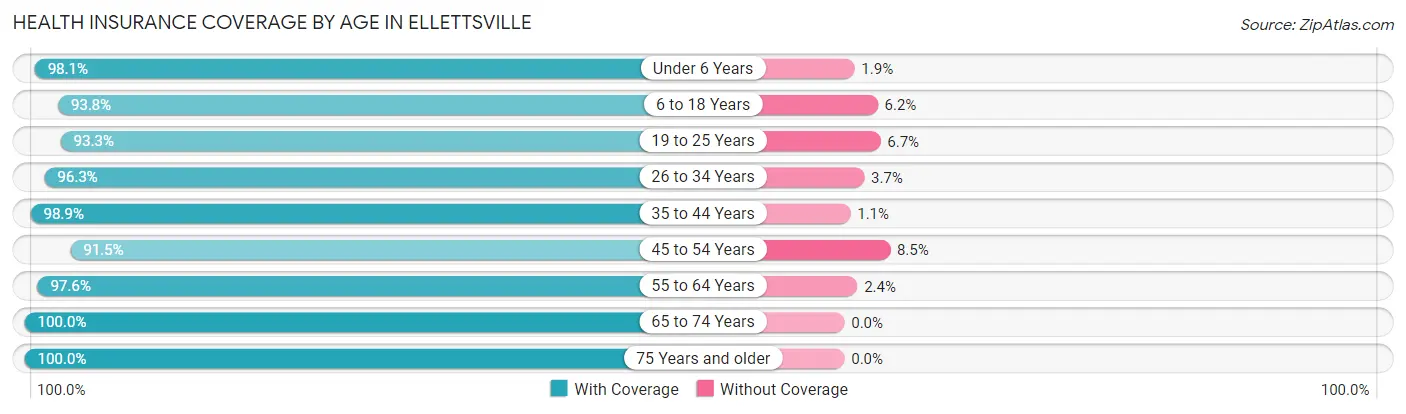
| Age Bracket | With Coverage | Without Coverage |
| Under 6 Years | 571 (98.1%) | 11 (1.9%) |
| 6 to 18 Years | 981 (93.8%) | 65 (6.2%) |
| 19 to 25 Years | 444 (93.3%) | 32 (6.7%) |
| 26 to 34 Years | 1,144 (96.3%) | 44 (3.7%) |
| 35 to 44 Years | 967 (98.9%) | 11 (1.1%) |
| 45 to 54 Years | 623 (91.5%) | 58 (8.5%) |
| 55 to 64 Years | 649 (97.6%) | 16 (2.4%) |
| 65 to 74 Years | 400 (100.0%) | 0 (0.0%) |
| 75 Years and older | 601 (100.0%) | 0 (0.0%) |
| Total | 6,380 (96.4%) | 237 (3.6%) |
Health Insurance Coverage by Citizenship Status in Ellettsville
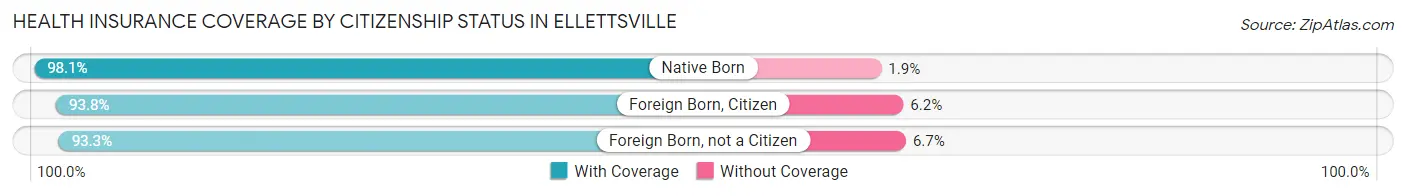
| Citizenship Status | With Coverage | Without Coverage |
| Native Born | 571 (98.1%) | 11 (1.9%) |
| Foreign Born, Citizen | 981 (93.8%) | 65 (6.2%) |
| Foreign Born, not a Citizen | 444 (93.3%) | 32 (6.7%) |
Health Insurance Coverage by Household Income in Ellettsville
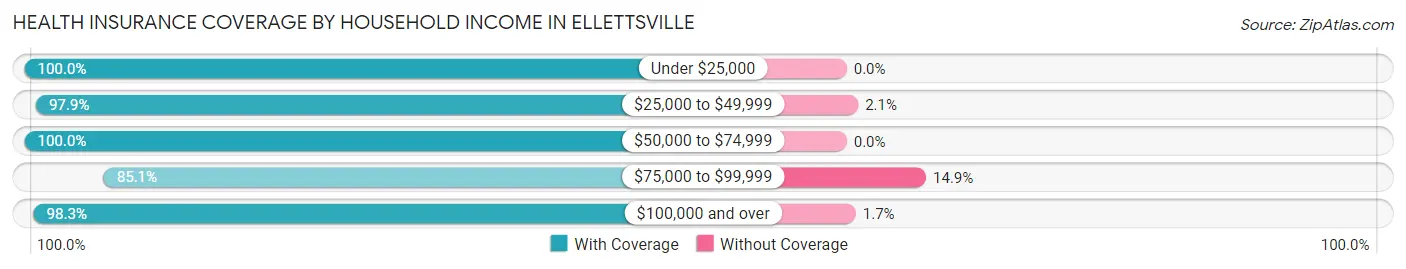
| Household Income | With Coverage | Without Coverage |
| Under $25,000 | 384 (100.0%) | 0 (0.0%) |
| $25,000 to $49,999 | 733 (97.9%) | 16 (2.1%) |
| $50,000 to $74,999 | 1,183 (100.0%) | 0 (0.0%) |
| $75,000 to $99,999 | 957 (85.1%) | 167 (14.9%) |
| $100,000 and over | 3,123 (98.3%) | 54 (1.7%) |
Public vs Private Health Insurance Coverage by Age in Ellettsville
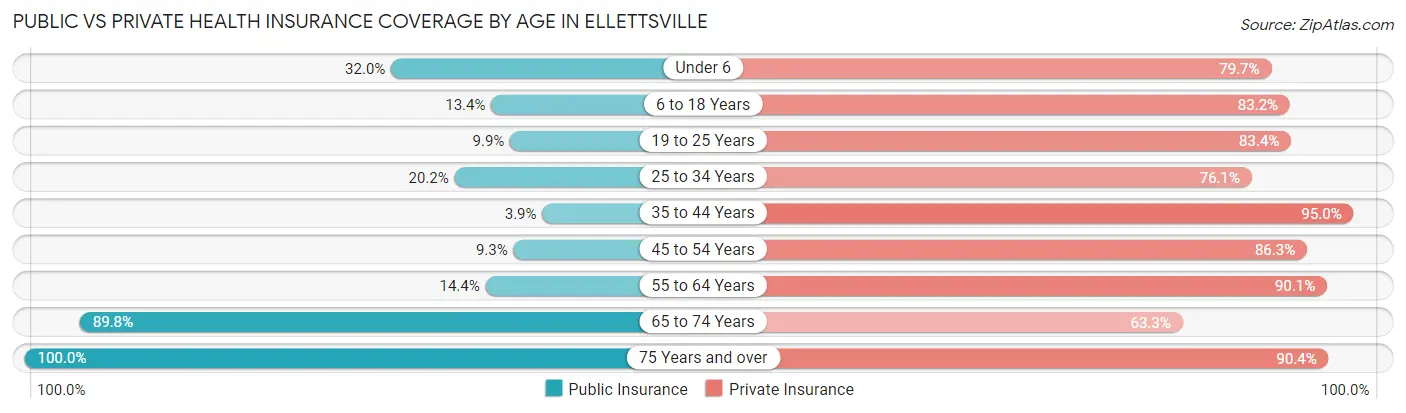
| Age Bracket | Public Insurance | Private Insurance |
| Under 6 | 186 (32.0%) | 464 (79.7%) |
| 6 to 18 Years | 140 (13.4%) | 870 (83.2%) |
| 19 to 25 Years | 47 (9.9%) | 397 (83.4%) |
| 25 to 34 Years | 240 (20.2%) | 904 (76.1%) |
| 35 to 44 Years | 38 (3.9%) | 929 (95.0%) |
| 45 to 54 Years | 63 (9.2%) | 588 (86.3%) |
| 55 to 64 Years | 96 (14.4%) | 599 (90.1%) |
| 65 to 74 Years | 359 (89.7%) | 253 (63.2%) |
| 75 Years and over | 601 (100.0%) | 543 (90.3%) |
| Total | 1,770 (26.8%) | 5,547 (83.8%) |
Disability Status by Sex by Age in Ellettsville
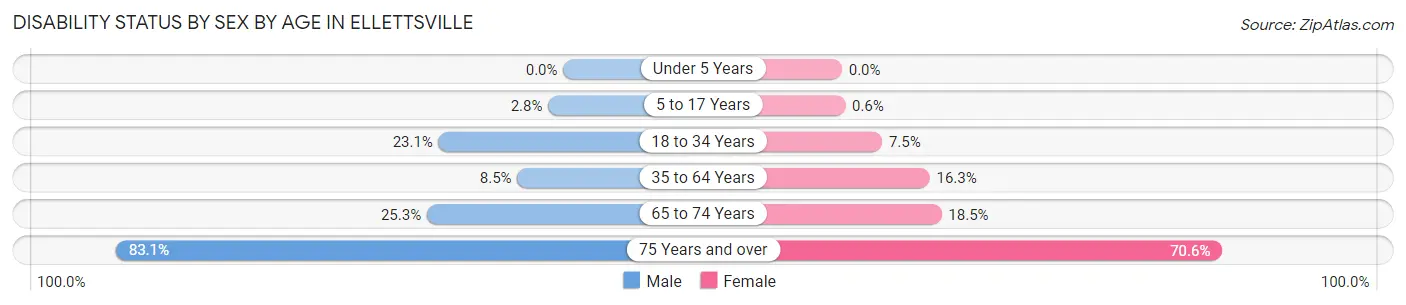
| Age Bracket | Male | Female |
| Under 5 Years | 0 (0.0%) | 0 (0.0%) |
| 5 to 17 Years | 13 (2.8%) | 4 (0.6%) |
| 18 to 34 Years | 193 (23.1%) | 67 (7.5%) |
| 35 to 64 Years | 96 (8.5%) | 195 (16.3%) |
| 65 to 74 Years | 41 (25.3%) | 44 (18.5%) |
| 75 Years and over | 211 (83.1%) | 245 (70.6%) |
Disability Class by Sex by Age in Ellettsville
Disability Class: Hearing Difficulty
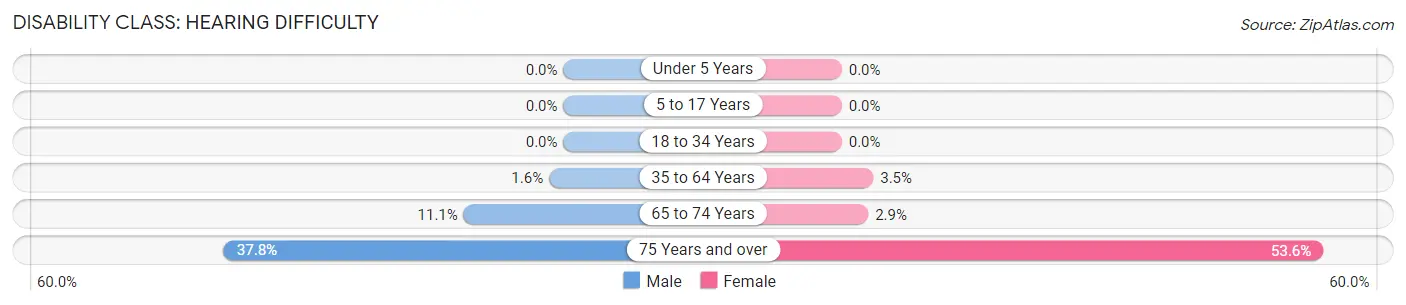
| Age Bracket | Male | Female |
| Under 5 Years | 0 (0.0%) | 0 (0.0%) |
| 5 to 17 Years | 0 (0.0%) | 0 (0.0%) |
| 18 to 34 Years | 0 (0.0%) | 0 (0.0%) |
| 35 to 64 Years | 18 (1.6%) | 42 (3.5%) |
| 65 to 74 Years | 18 (11.1%) | 7 (2.9%) |
| 75 Years and over | 96 (37.8%) | 186 (53.6%) |
Disability Class: Vision Difficulty
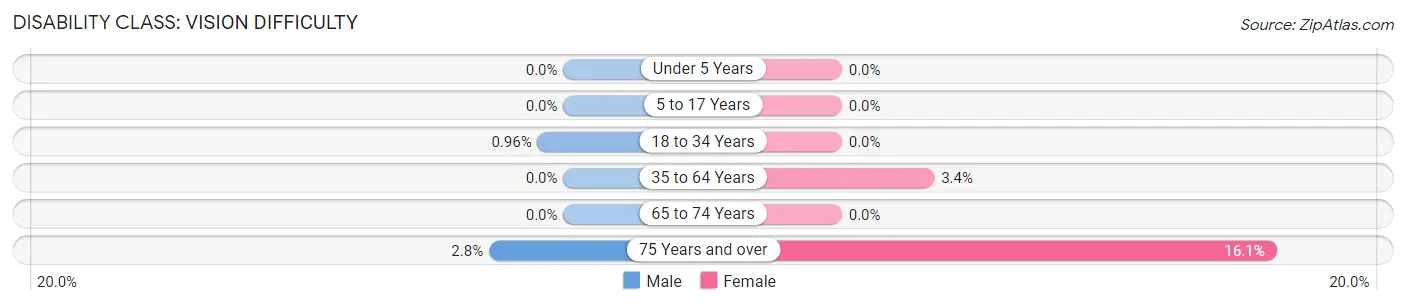
| Age Bracket | Male | Female |
| Under 5 Years | 0 (0.0%) | 0 (0.0%) |
| 5 to 17 Years | 0 (0.0%) | 0 (0.0%) |
| 18 to 34 Years | 8 (1.0%) | 0 (0.0%) |
| 35 to 64 Years | 0 (0.0%) | 41 (3.4%) |
| 65 to 74 Years | 0 (0.0%) | 0 (0.0%) |
| 75 Years and over | 7 (2.8%) | 56 (16.1%) |
Disability Class: Cognitive Difficulty
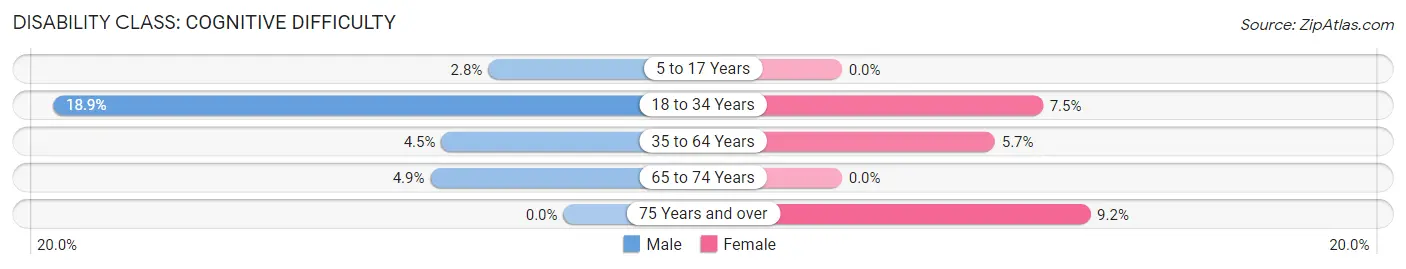
| Age Bracket | Male | Female |
| 5 to 17 Years | 13 (2.8%) | 0 (0.0%) |
| 18 to 34 Years | 158 (18.9%) | 67 (7.5%) |
| 35 to 64 Years | 51 (4.5%) | 68 (5.7%) |
| 65 to 74 Years | 8 (4.9%) | 0 (0.0%) |
| 75 Years and over | 0 (0.0%) | 32 (9.2%) |
Disability Class: Ambulatory Difficulty
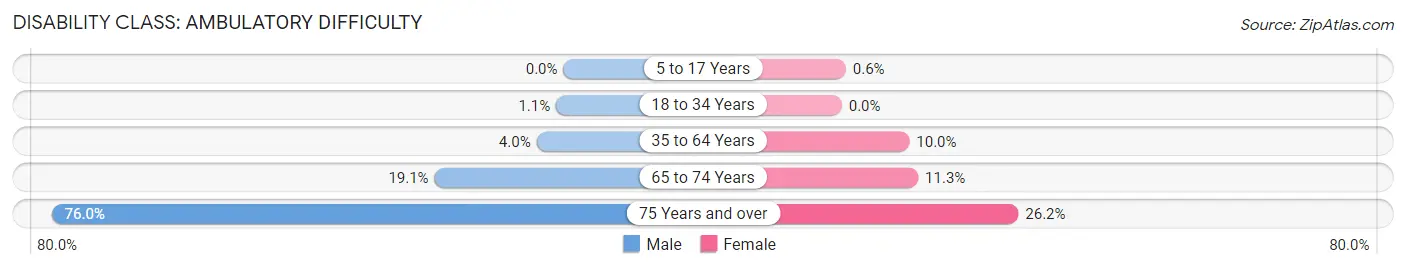
| Age Bracket | Male | Female |
| 5 to 17 Years | 0 (0.0%) | 4 (0.6%) |
| 18 to 34 Years | 9 (1.1%) | 0 (0.0%) |
| 35 to 64 Years | 45 (4.0%) | 120 (10.0%) |
| 65 to 74 Years | 31 (19.1%) | 27 (11.3%) |
| 75 Years and over | 193 (76.0%) | 91 (26.2%) |
Disability Class: Self-Care Difficulty
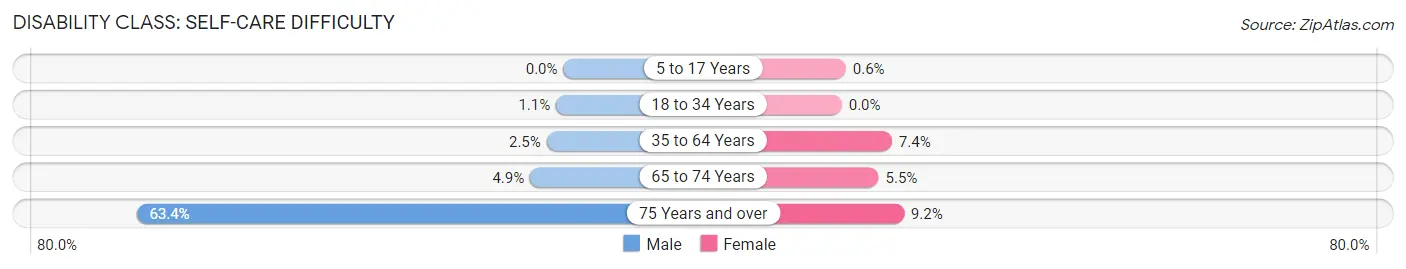
| Age Bracket | Male | Female |
| 5 to 17 Years | 0 (0.0%) | 4 (0.6%) |
| 18 to 34 Years | 9 (1.1%) | 0 (0.0%) |
| 35 to 64 Years | 28 (2.5%) | 89 (7.4%) |
| 65 to 74 Years | 8 (4.9%) | 13 (5.5%) |
| 75 Years and over | 161 (63.4%) | 32 (9.2%) |
Technology Access in Ellettsville
Computing Device Access in Ellettsville
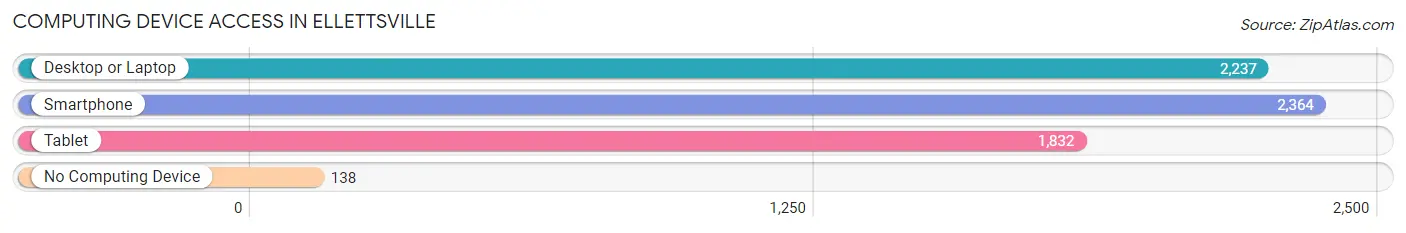
| Device Type | # Households | % Households |
| Desktop or Laptop | 2,237 | 82.6% |
| Smartphone | 2,364 | 87.3% |
| Tablet | 1,832 | 67.7% |
| No Computing Device | 138 | 5.1% |
| Total | 2,707 | 100.0% |
Internet Access in Ellettsville
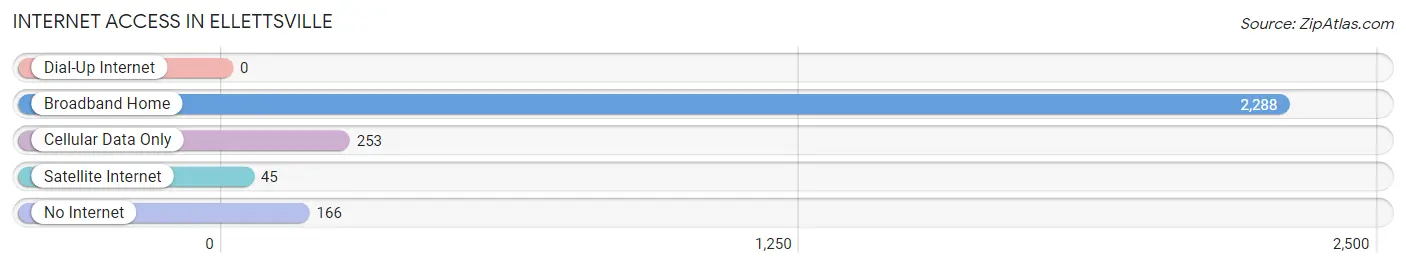
| Internet Type | # Households | % Households |
| Dial-Up Internet | 0 | 0.0% |
| Broadband Home | 2,288 | 84.5% |
| Cellular Data Only | 253 | 9.3% |
| Satellite Internet | 45 | 1.7% |
| No Internet | 166 | 6.1% |
| Total | 2,707 | 100.0% |
Ellettsville Summary
Ellettsville, Indiana is a small town located in Monroe County, Indiana. It is situated just west of Bloomington, Indiana and is part of the Bloomington Metropolitan Statistical Area. The town was founded in 1837 and has a population of approximately 5,000 people.
History
Ellettsville was founded in 1837 by William Ellett, a Revolutionary War veteran. Ellett was a farmer and a blacksmith who had moved to the area from North Carolina. He purchased the land from the government and began to build a small settlement. The town was originally called Ellett's Village, but the name was later changed to Ellettsville.
The town grew slowly over the years, but it was not until the late 19th century that it began to experience significant growth. In 1883, the Monon Railroad was built through the town, which allowed for increased transportation and commerce. This led to the development of several businesses, including a flour mill, a sawmill, and a brickyard.
In the early 20th century, Ellettsville experienced a period of rapid growth. The town was incorporated in 1908 and the population grew to over 1,000 by 1910. The town continued to grow throughout the 20th century, reaching a peak population of 5,000 in 2000.
Geography
Ellettsville is located in Monroe County, Indiana. It is situated just west of Bloomington, Indiana and is part of the Bloomington Metropolitan Statistical Area. The town is located in the rolling hills of southern Indiana and is surrounded by farmland. The town is situated on the banks of the White River, which provides a scenic backdrop.
The town covers an area of 2.3 square miles and has an elevation of 845 feet. The climate is humid continental, with hot summers and cold winters. The average annual temperature is 54 degrees Fahrenheit and the average annual precipitation is 40 inches.
Economy
Ellettsville has a diverse economy that is largely based on agriculture and manufacturing. The town is home to several large employers, including the Ellettsville Brick Company, the Ellettsville Flour Mill, and the Ellettsville Sawmill. The town is also home to several small businesses, including restaurants, retail stores, and service providers.
The town is also home to several educational institutions, including Indiana University Bloomington, Ivy Tech Community College, and the Ellettsville Community School Corporation.
Demographics
As of the 2010 census, Ellettsville had a population of 5,478. The racial makeup of the town was 95.3% White, 1.2% African American, 0.3% Native American, 0.7% Asian, 0.1% Pacific Islander, 0.7% from other races, and 1.7% from two or more races. Hispanic or Latino of any race were 2.2% of the population.
The median household income in Ellettsville was $45,938 and the median family income was $54,844. The per capita income was $21,945. About 8.3% of families and 11.2% of the population were below the poverty line, including 15.2% of those under age 18 and 8.2% of those age 65 or over.
Common Questions
What is Per Capita Income in Ellettsville?
Per Capita income in Ellettsville is $36,273.
What is the Median Family Income in Ellettsville?
Median Family Income in Ellettsville is $93,925.
What is the Median Household income in Ellettsville?
Median Household Income in Ellettsville is $79,455.
What is Income or Wage Gap in Ellettsville?
Income or Wage Gap in Ellettsville is 19.4%.
Women in Ellettsville earn 80.6 cents for every dollar earned by a man.
What is Inequality or Gini Index in Ellettsville?
Inequality or Gini Index in Ellettsville is 0.36.
What is the Total Population of Ellettsville?
Total Population of Ellettsville is 6,653.
What is the Total Male Population of Ellettsville?
Total Male Population of Ellettsville is 3,111.
What is the Total Female Population of Ellettsville?
Total Female Population of Ellettsville is 3,542.
What is the Ratio of Males per 100 Females in Ellettsville?
There are 87.83 Males per 100 Females in Ellettsville.
What is the Ratio of Females per 100 Males in Ellettsville?
There are 113.85 Females per 100 Males in Ellettsville.
What is the Median Population Age in Ellettsville?
Median Population Age in Ellettsville is 35.2 Years.
What is the Average Family Size in Ellettsville
Average Family Size in Ellettsville is 2.8 People.
What is the Average Household Size in Ellettsville
Average Household Size in Ellettsville is 2.4 People.
How Large is the Labor Force in Ellettsville?
There are 3,694 People in the Labor Forcein in Ellettsville.
What is the Percentage of People in the Labor Force in Ellettsville?
71.4% of People are in the Labor Force in Ellettsville.
What is the Unemployment Rate in Ellettsville?
Unemployment Rate in Ellettsville is 1.7%.