Danville, IN Map & Demographics
Danville Map
Danville Overview
$36,335
PER CAPITA INCOME
$101,288
AVG FAMILY INCOME
$90,686
AVG HOUSEHOLD INCOME
26.1%
WAGE / INCOME GAP [ % ]
73.9¢/ $1
WAGE / INCOME GAP [ $ ]
0.37
INEQUALITY / GINI INDEX
10,842
TOTAL POPULATION
5,256
MALE POPULATION
5,586
FEMALE POPULATION
94.09
MALES / 100 FEMALES
106.28
FEMALES / 100 MALES
35.8
MEDIAN AGE
3.2
AVG FAMILY SIZE
2.7
AVG HOUSEHOLD SIZE
5,812
LABOR FORCE [ PEOPLE ]
71.8%
PERCENT IN LABOR FORCE
1.5%
UNEMPLOYMENT RATE
Danville Zip Codes
Danville Area Codes
Income in Danville
Income Overview in Danville
Per Capita Income in Danville is $36,335, while median incomes of families and households are $101,288 and $90,686 respectively.
| Characteristic | Number | Measure |
| Per Capita Income | 10,842 | $36,335 |
| Median Family Income | 2,795 | $101,288 |
| Mean Family Income | 2,795 | $119,537 |
| Median Household Income | 4,008 | $90,686 |
| Mean Household Income | 4,008 | $99,179 |
| Income Deficit | 2,795 | $0 |
| Wage / Income Gap (%) | 10,842 | 26.05% |
| Wage / Income Gap ($) | 10,842 | 73.95¢ per $1 |
| Gini / Inequality Index | 10,842 | 0.37 |
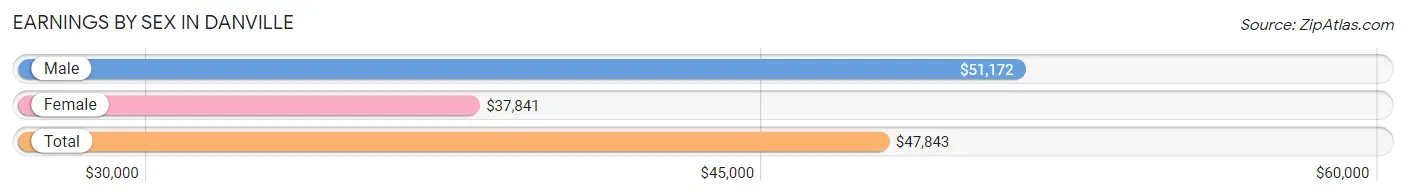
Earnings by Sex in Danville
Average Earnings in Danville are $47,843, $51,172 for men and $37,841 for women, a difference of 26.1%.
| Sex | Number | Average Earnings |
| Male | 3,143 (52.1%) | $51,172 |
| Female | 2,885 (47.9%) | $37,841 |
| Total | 6,028 (100.0%) | $47,843 |
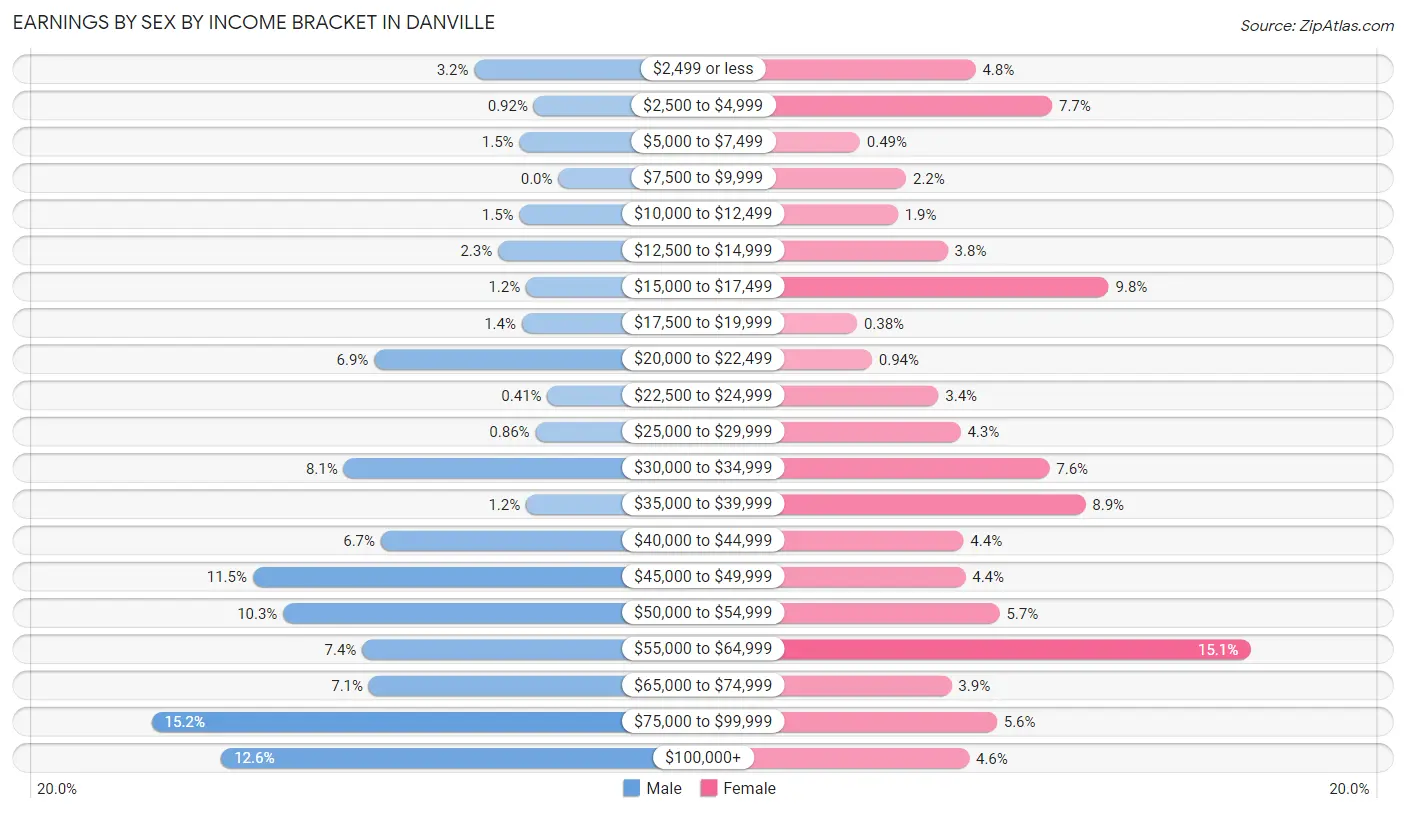
Earnings by Sex by Income Bracket in Danville
The most common earnings brackets in Danville are $75,000 to $99,999 for men (479 | 15.2%) and $55,000 to $64,999 for women (436 | 15.1%).
| Income | Male | Female |
| $2,499 or less | 99 (3.2%) | 139 (4.8%) |
| $2,500 to $4,999 | 29 (0.9%) | 222 (7.7%) |
| $5,000 to $7,499 | 46 (1.5%) | 14 (0.5%) |
| $7,500 to $9,999 | 0 (0.0%) | 64 (2.2%) |
| $10,000 to $12,499 | 46 (1.5%) | 55 (1.9%) |
| $12,500 to $14,999 | 71 (2.3%) | 109 (3.8%) |
| $15,000 to $17,499 | 38 (1.2%) | 283 (9.8%) |
| $17,500 to $19,999 | 43 (1.4%) | 11 (0.4%) |
| $20,000 to $22,499 | 217 (6.9%) | 27 (0.9%) |
| $22,500 to $24,999 | 13 (0.4%) | 99 (3.4%) |
| $25,000 to $29,999 | 27 (0.9%) | 123 (4.3%) |
| $30,000 to $34,999 | 253 (8.1%) | 219 (7.6%) |
| $35,000 to $39,999 | 38 (1.2%) | 258 (8.9%) |
| $40,000 to $44,999 | 209 (6.7%) | 126 (4.4%) |
| $45,000 to $49,999 | 360 (11.5%) | 128 (4.4%) |
| $50,000 to $54,999 | 324 (10.3%) | 165 (5.7%) |
| $55,000 to $64,999 | 231 (7.3%) | 436 (15.1%) |
| $65,000 to $74,999 | 223 (7.1%) | 113 (3.9%) |
| $75,000 to $99,999 | 479 (15.2%) | 162 (5.6%) |
| $100,000+ | 397 (12.6%) | 132 (4.6%) |
| Total | 3,143 (100.0%) | 2,885 (100.0%) |
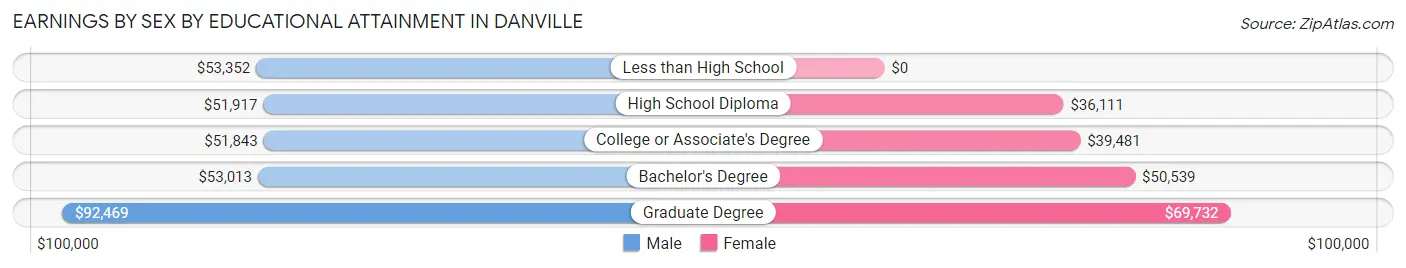
Earnings by Sex by Educational Attainment in Danville
Average earnings in Danville are $53,328 for men and $39,827 for women, a difference of 25.3%. Men with an educational attainment of graduate degree enjoy the highest average annual earnings of $92,469, while those with college or associate's degree education earn the least with $51,843. Women with an educational attainment of graduate degree earn the most with the average annual earnings of $69,732, while those with high school diploma education have the smallest earnings of $36,111.
| Educational Attainment | Male Income | Female Income |
| Less than High School | $53,352 | $0 |
| High School Diploma | $51,917 | $36,111 |
| College or Associate's Degree | $51,843 | $39,481 |
| Bachelor's Degree | $53,013 | $50,539 |
| Graduate Degree | $92,469 | $69,732 |
| Total | $53,328 | $39,827 |
Family Income in Danville
Family Income Brackets in Danville
According to the Danville family income data, there are 981 families falling into the $100,000 to $149,999 income range, which is the most common income bracket and makes up 35.1% of all families.
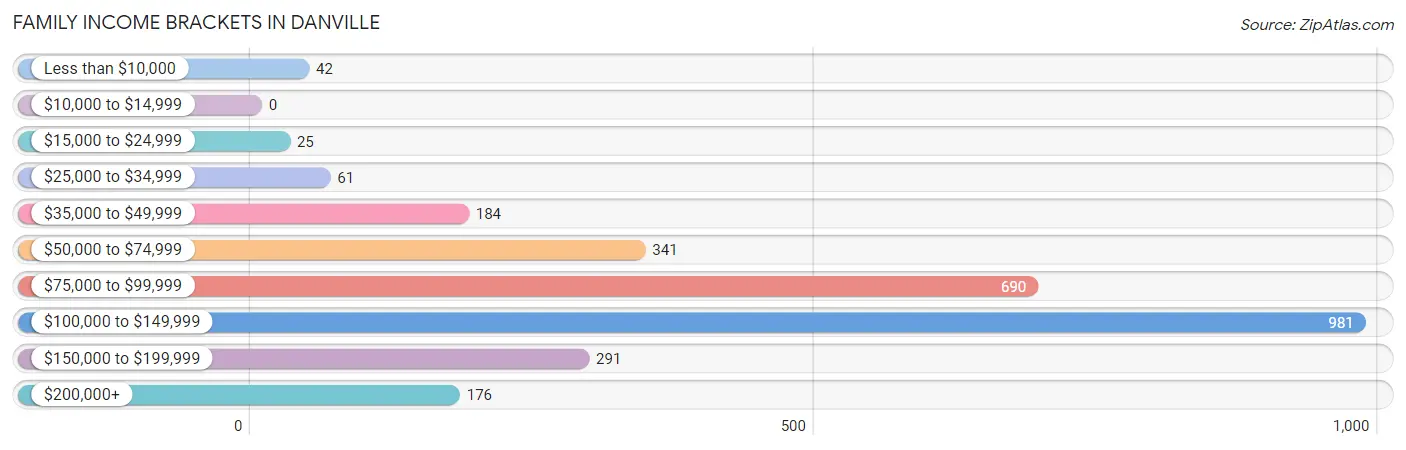
| Income Bracket | # Families | % Families |
| Less than $10,000 | 42 | 1.5% |
| $10,000 to $14,999 | 0 | 0.0% |
| $15,000 to $24,999 | 25 | 0.9% |
| $25,000 to $34,999 | 61 | 2.2% |
| $35,000 to $49,999 | 184 | 6.6% |
| $50,000 to $74,999 | 341 | 12.2% |
| $75,000 to $99,999 | 690 | 24.7% |
| $100,000 to $149,999 | 981 | 35.1% |
| $150,000 to $199,999 | 291 | 10.4% |
| $200,000+ | 176 | 6.3% |
Family Income by Famaliy Size in Danville
6-person families (56 | 2.0%) account for the highest median family income in Danville with $152,935 per family, while 2-person families (1,064 | 38.1%) have the highest median income of $45,693 per family member.
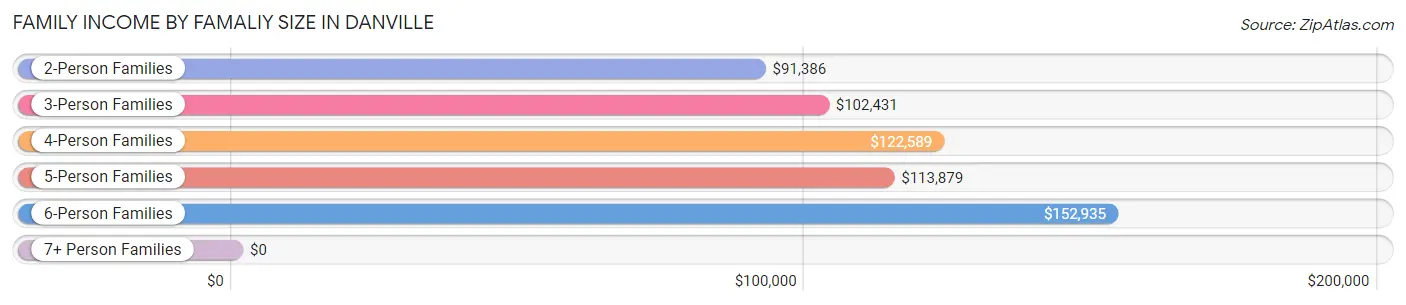
| Income Bracket | # Families | Median Income |
| 2-Person Families | 1,064 (38.1%) | $91,386 |
| 3-Person Families | 748 (26.8%) | $102,431 |
| 4-Person Families | 564 (20.2%) | $122,589 |
| 5-Person Families | 292 (10.4%) | $113,879 |
| 6-Person Families | 56 (2.0%) | $152,935 |
| 7+ Person Families | 71 (2.5%) | $0 |
| Total | 2,795 (100.0%) | $101,288 |
Family Income by Number of Earners in Danville
The median family income in Danville is $101,288, with families comprising 3+ earners (500) having the highest median family income of $133,837, while families with no earners (319) have the lowest median family income of $75,972, accounting for 17.9% and 11.4% of families, respectively.
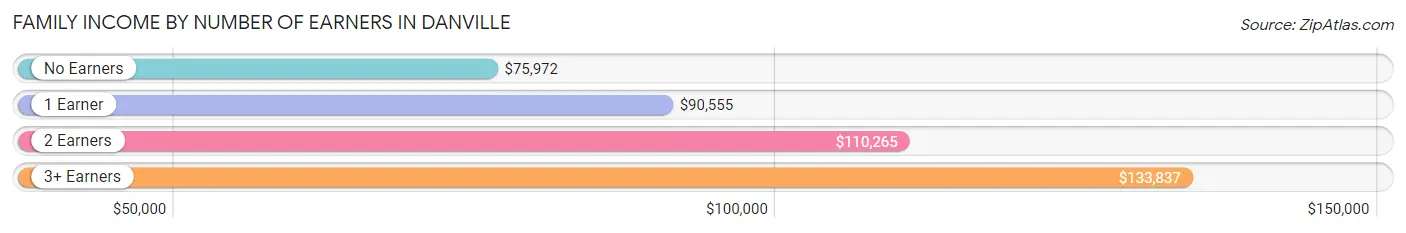
| Number of Earners | # Families | Median Income |
| No Earners | 319 (11.4%) | $75,972 |
| 1 Earner | 588 (21.0%) | $90,555 |
| 2 Earners | 1,388 (49.7%) | $110,265 |
| 3+ Earners | 500 (17.9%) | $133,837 |
| Total | 2,795 (100.0%) | $101,288 |
Household Income in Danville
Household Income Brackets in Danville
With 1,106 households falling in the category, the $100,000 to $149,999 income range is the most frequent in Danville, accounting for 27.6% of all households. In contrast, only 44 households (1.1%) fall into the less than $10,000 income bracket, making it the least populous group.
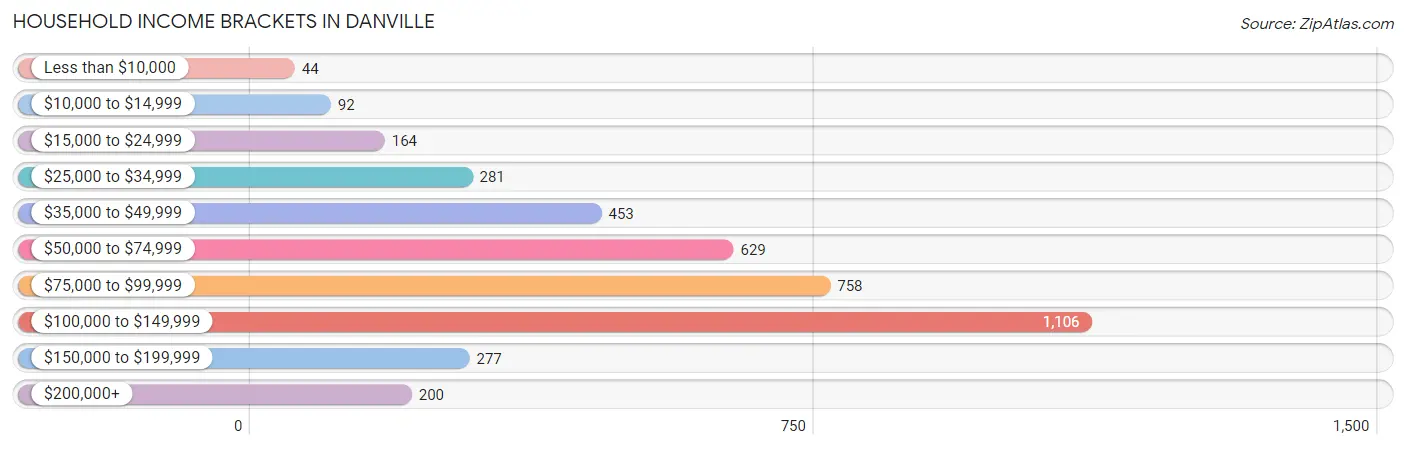
| Income Bracket | # Households | % Households |
| Less than $10,000 | 44 | 1.1% |
| $10,000 to $14,999 | 92 | 2.3% |
| $15,000 to $24,999 | 164 | 4.1% |
| $25,000 to $34,999 | 281 | 7.0% |
| $35,000 to $49,999 | 453 | 11.3% |
| $50,000 to $74,999 | 629 | 15.7% |
| $75,000 to $99,999 | 758 | 18.9% |
| $100,000 to $149,999 | 1,106 | 27.6% |
| $150,000 to $199,999 | 277 | 6.9% |
| $200,000+ | 200 | 5.0% |
Household Income by Householder Age in Danville
The median household income in Danville is $90,686, with the highest median household income of $101,750 found in the 25 to 44 years age bracket for the primary householder. A total of 1,483 households (37.0%) fall into this category. Meanwhile, the 15 to 24 years age bracket for the primary householder has the lowest median household income of $0, with 148 households (3.7%) in this group.
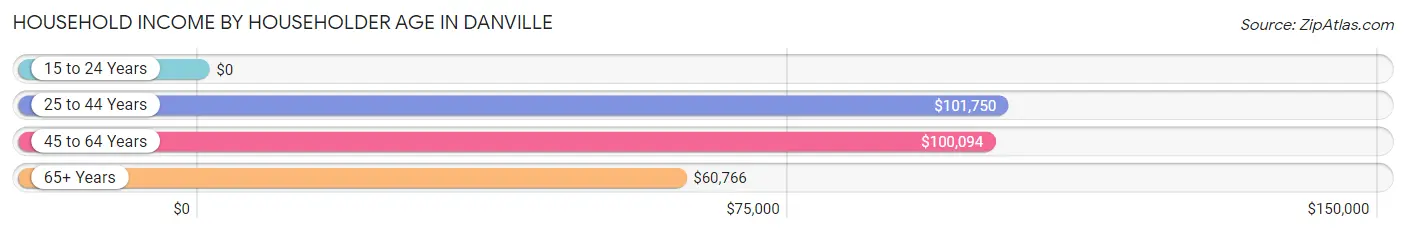
| Income Bracket | # Households | Median Income |
| 15 to 24 Years | 148 (3.7%) | $0 |
| 25 to 44 Years | 1,483 (37.0%) | $101,750 |
| 45 to 64 Years | 1,422 (35.5%) | $100,094 |
| 65+ Years | 955 (23.8%) | $60,766 |
| Total | 4,008 (100.0%) | $90,686 |
Poverty in Danville
Income Below Poverty by Sex and Age in Danville
With 4.1% poverty level for males and 6.9% for females among the residents of Danville, 55 to 64 year old males and 18 to 24 year old females are the most vulnerable to poverty, with 55 males (11.8%) and 79 females (17.4%) in their respective age groups living below the poverty level.
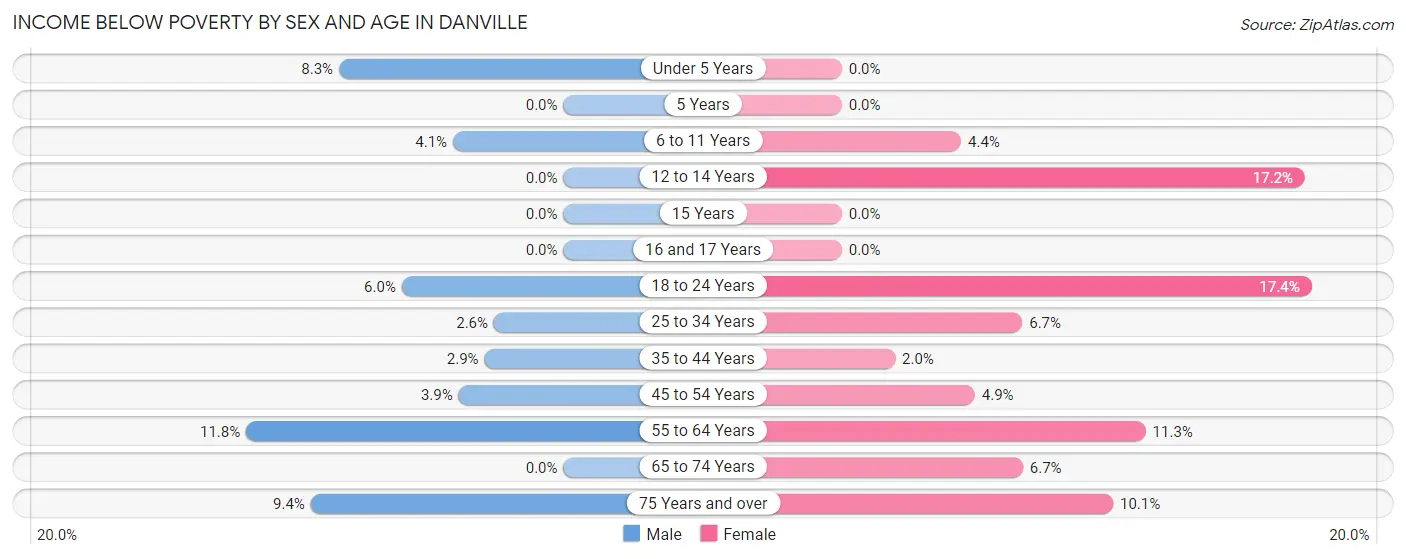
| Age Bracket | Male | Female |
| Under 5 Years | 21 (8.3%) | 0 (0.0%) |
| 5 Years | 0 (0.0%) | 0 (0.0%) |
| 6 to 11 Years | 24 (4.1%) | 22 (4.4%) |
| 12 to 14 Years | 0 (0.0%) | 44 (17.2%) |
| 15 Years | 0 (0.0%) | 0 (0.0%) |
| 16 and 17 Years | 0 (0.0%) | 0 (0.0%) |
| 18 to 24 Years | 25 (6.0%) | 79 (17.4%) |
| 25 to 34 Years | 21 (2.6%) | 45 (6.7%) |
| 35 to 44 Years | 22 (2.9%) | 14 (2.0%) |
| 45 to 54 Years | 32 (3.9%) | 33 (4.9%) |
| 55 to 64 Years | 55 (11.8%) | 66 (11.3%) |
| 65 to 74 Years | 0 (0.0%) | 42 (6.7%) |
| 75 Years and over | 15 (9.4%) | 29 (10.1%) |
| Total | 215 (4.1%) | 374 (6.9%) |
Income Above Poverty by Sex and Age in Danville
According to the poverty statistics in Danville, males aged 5 years and females aged under 5 years are the age groups that are most secure financially, with 100.0% of males and 100.0% of females in these age groups living above the poverty line.
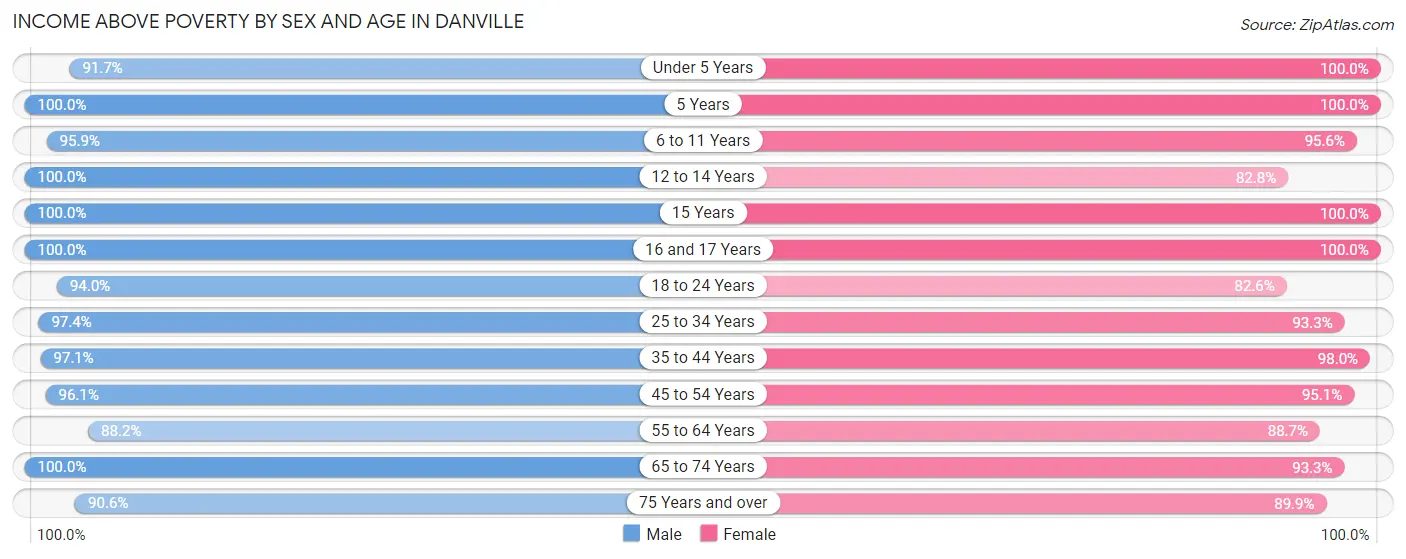
| Age Bracket | Male | Female |
| Under 5 Years | 231 (91.7%) | 357 (100.0%) |
| 5 Years | 115 (100.0%) | 115 (100.0%) |
| 6 to 11 Years | 562 (95.9%) | 475 (95.6%) |
| 12 to 14 Years | 222 (100.0%) | 212 (82.8%) |
| 15 Years | 120 (100.0%) | 113 (100.0%) |
| 16 and 17 Years | 101 (100.0%) | 71 (100.0%) |
| 18 to 24 Years | 392 (94.0%) | 374 (82.6%) |
| 25 to 34 Years | 793 (97.4%) | 627 (93.3%) |
| 35 to 44 Years | 730 (97.1%) | 693 (98.0%) |
| 45 to 54 Years | 790 (96.1%) | 635 (95.1%) |
| 55 to 64 Years | 412 (88.2%) | 519 (88.7%) |
| 65 to 74 Years | 375 (100.0%) | 583 (93.3%) |
| 75 Years and over | 145 (90.6%) | 259 (89.9%) |
| Total | 4,988 (95.9%) | 5,033 (93.1%) |
Income Below Poverty Among Married-Couple Families in Danville
The poverty statistics for married-couple families in Danville show that 0.6% or 15 of the total 2,502 families live below the poverty line. Families with no children have the highest poverty rate of 1.2%, comprising of 15 families. On the other hand, families with 1 or 2 children have the lowest poverty rate of 0.0%, which includes 0 families.
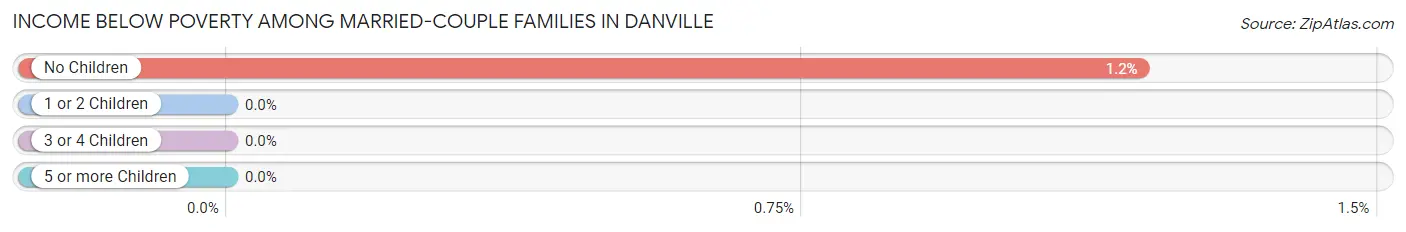
| Children | Above Poverty | Below Poverty |
| No Children | 1,244 (98.8%) | 15 (1.2%) |
| 1 or 2 Children | 969 (100.0%) | 0 (0.0%) |
| 3 or 4 Children | 226 (100.0%) | 0 (0.0%) |
| 5 or more Children | 48 (100.0%) | 0 (0.0%) |
| Total | 2,487 (99.4%) | 15 (0.6%) |
Income Below Poverty Among Single-Parent Households in Danville
According to the poverty data in Danville, 17.6% or 24 single-father households and 17.8% or 28 single-mother households are living below the poverty line. Among single-father households, those with 1 or 2 children have the highest poverty rate, with 24 households (24.5%) experiencing poverty. Likewise, among single-mother households, those with 3 or 4 children have the highest poverty rate, with 28 households (100.0%) falling below the poverty line.
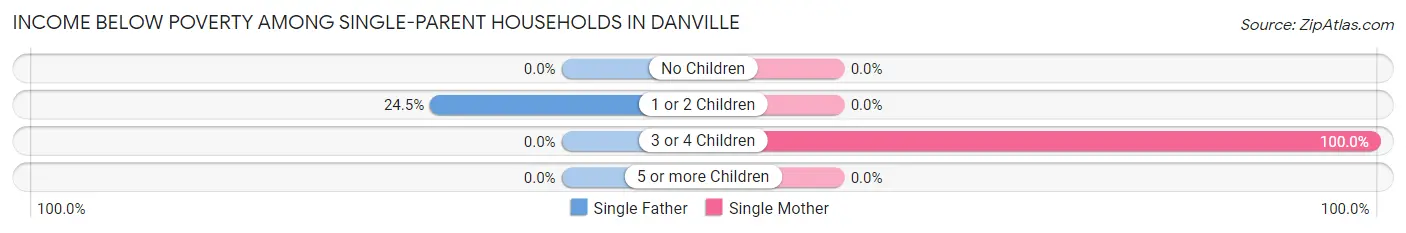
| Children | Single Father | Single Mother |
| No Children | 0 (0.0%) | 0 (0.0%) |
| 1 or 2 Children | 24 (24.5%) | 0 (0.0%) |
| 3 or 4 Children | 0 (0.0%) | 28 (100.0%) |
| 5 or more Children | 0 (0.0%) | 0 (0.0%) |
| Total | 24 (17.6%) | 28 (17.8%) |
Income Below Poverty Among Married-Couple vs Single-Parent Households in Danville
The poverty data for Danville shows that 15 of the married-couple family households (0.6%) and 52 of the single-parent households (17.7%) are living below the poverty level. Within the married-couple family households, those with no children have the highest poverty rate, with 15 households (1.2%) falling below the poverty line. Among the single-parent households, those with 3 or 4 children have the highest poverty rate, with 28 household (100.0%) living below poverty.
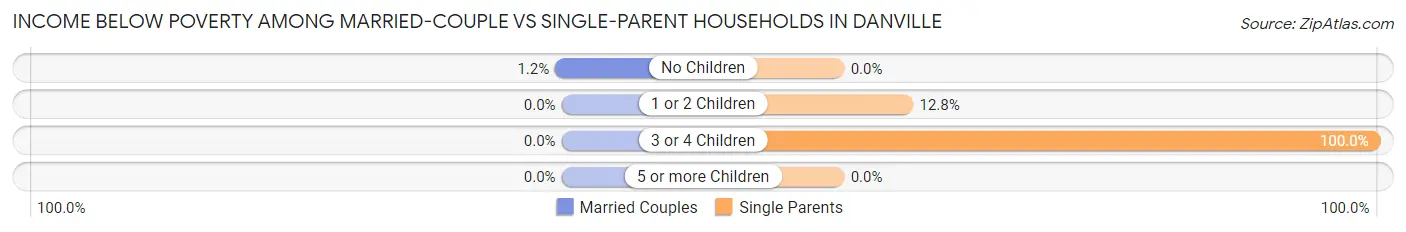
| Children | Married-Couple Families | Single-Parent Households |
| No Children | 15 (1.2%) | 0 (0.0%) |
| 1 or 2 Children | 0 (0.0%) | 24 (12.8%) |
| 3 or 4 Children | 0 (0.0%) | 28 (100.0%) |
| 5 or more Children | 0 (0.0%) | 0 (0.0%) |
| Total | 15 (0.6%) | 52 (17.7%) |
Race in Danville
The most populous races in Danville are White / Caucasian (10,052 | 92.7%), Black / African American (346 | 3.2%), and Hispanic or Latino (306 | 2.8%).
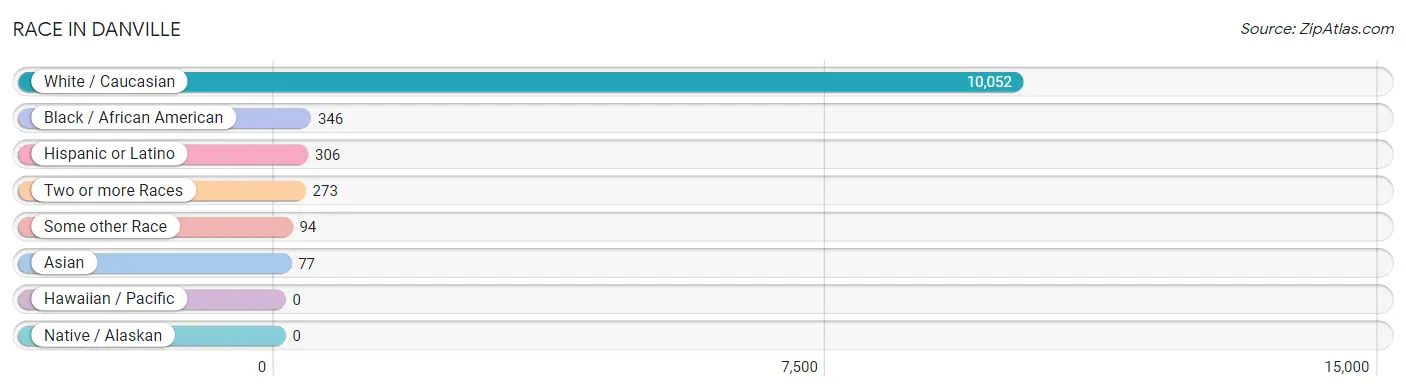
| Race | # Population | % Population |
| Asian | 77 | 0.7% |
| Black / African American | 346 | 3.2% |
| Hawaiian / Pacific | 0 | 0.0% |
| Hispanic or Latino | 306 | 2.8% |
| Native / Alaskan | 0 | 0.0% |
| White / Caucasian | 10,052 | 92.7% |
| Two or more Races | 273 | 2.5% |
| Some other Race | 94 | 0.9% |
| Total | 10,842 | 100.0% |
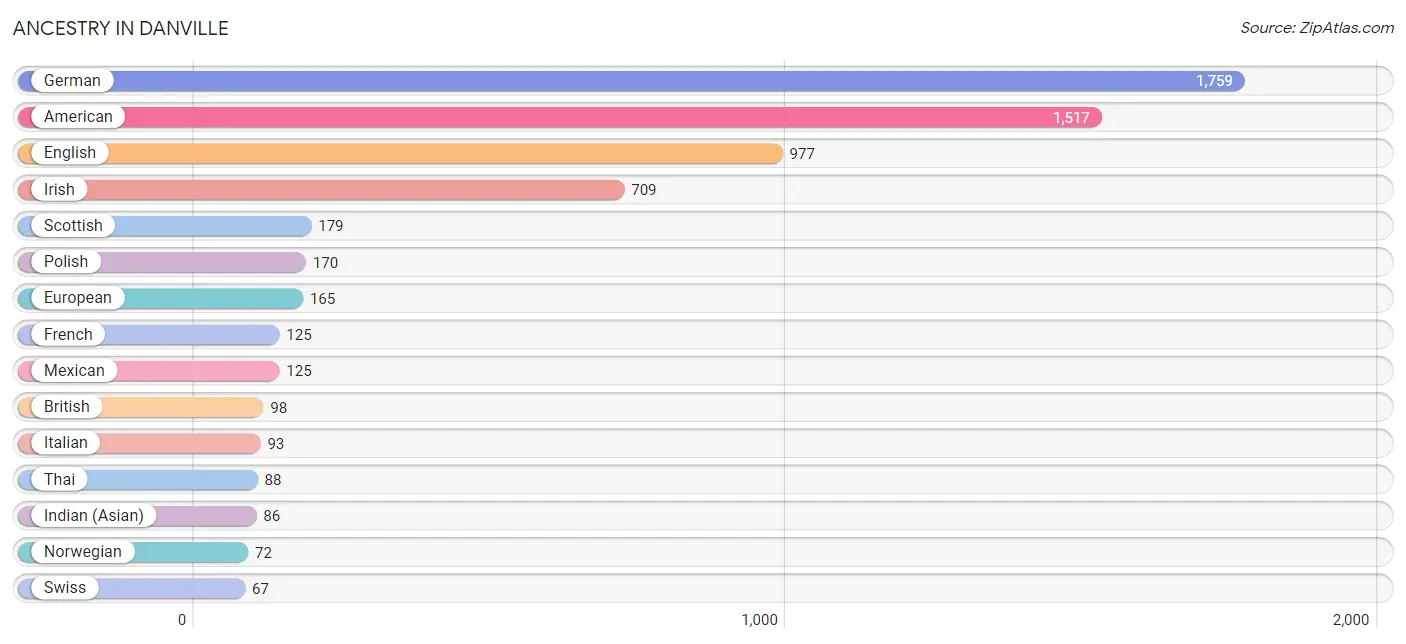
Ancestry in Danville
The most populous ancestries reported in Danville are German (1,759 | 16.2%), American (1,517 | 14.0%), English (977 | 9.0%), Irish (709 | 6.5%), and Scottish (179 | 1.7%), together accounting for 47.4% of all Danville residents.
| Ancestry | # Population | % Population |
| American | 1,517 | 14.0% |
| Austrian | 5 | 0.1% |
| Bhutanese | 13 | 0.1% |
| British | 98 | 0.9% |
| Croatian | 16 | 0.2% |
| Cuban | 11 | 0.1% |
| Czechoslovakian | 17 | 0.2% |
| Danish | 14 | 0.1% |
| Dutch | 30 | 0.3% |
| English | 977 | 9.0% |
| European | 165 | 1.5% |
| French | 125 | 1.1% |
| French Canadian | 35 | 0.3% |
| German | 1,759 | 16.2% |
| Hungarian | 30 | 0.3% |
| Indian (Asian) | 86 | 0.8% |
| Irish | 709 | 6.5% |
| Italian | 93 | 0.9% |
| Korean | 4 | 0.0% |
| Mexican | 125 | 1.1% |
| Norwegian | 72 | 0.7% |
| Pennsylvania German | 12 | 0.1% |
| Polish | 170 | 1.6% |
| Portuguese | 11 | 0.1% |
| Puerto Rican | 42 | 0.4% |
| Scotch-Irish | 27 | 0.3% |
| Scottish | 179 | 1.7% |
| Spanish | 34 | 0.3% |
| Swedish | 49 | 0.4% |
| Swiss | 67 | 0.6% |
| Thai | 88 | 0.8% |
| Ukrainian | 21 | 0.2% | View All 32 Rows |
Immigrants in Danville
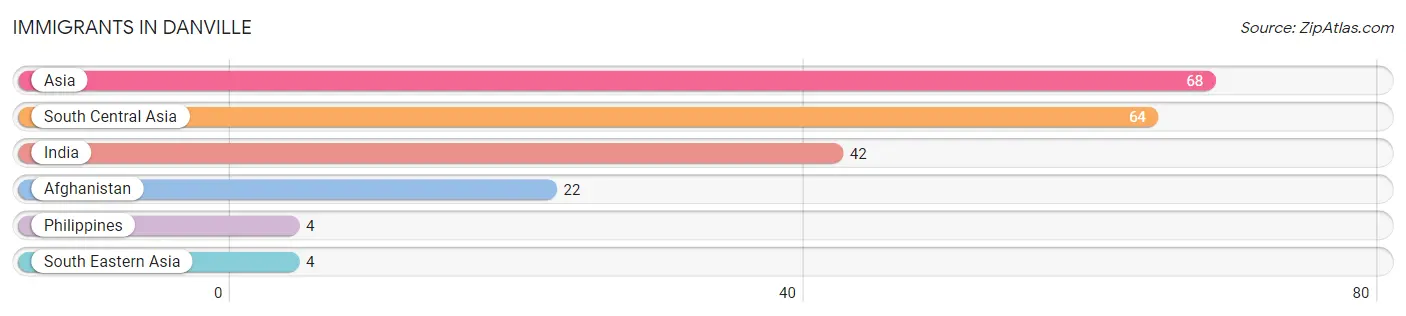
The most numerous immigrant groups reported in Danville came from Asia (68 | 0.6%), South Central Asia (64 | 0.6%), India (42 | 0.4%), Afghanistan (22 | 0.2%), and Philippines (4 | 0.0%), together accounting for 1.8% of all Danville residents.
| Immigration Origin | # Population | % Population |
| Afghanistan | 22 | 0.2% |
| Asia | 68 | 0.6% |
| India | 42 | 0.4% |
| Philippines | 4 | 0.0% |
| South Central Asia | 64 | 0.6% |
| South Eastern Asia | 4 | 0.0% | View All 6 Rows |
Sex and Age in Danville
Sex and Age in Danville
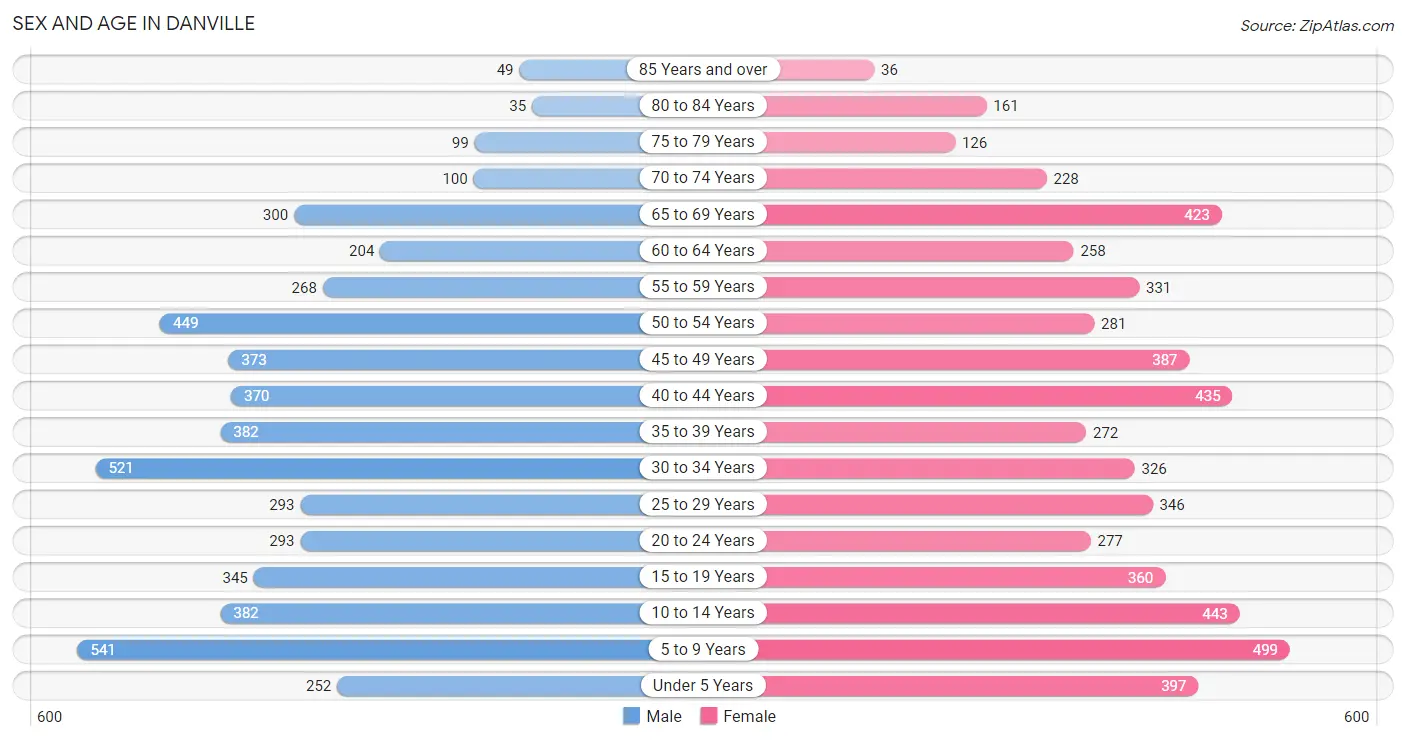
The most populous age groups in Danville are 5 to 9 Years (541 | 10.3%) for men and 5 to 9 Years (499 | 8.9%) for women.
| Age Bracket | Male | Female |
| Under 5 Years | 252 (4.8%) | 397 (7.1%) |
| 5 to 9 Years | 541 (10.3%) | 499 (8.9%) |
| 10 to 14 Years | 382 (7.3%) | 443 (7.9%) |
| 15 to 19 Years | 345 (6.6%) | 360 (6.4%) |
| 20 to 24 Years | 293 (5.6%) | 277 (5.0%) |
| 25 to 29 Years | 293 (5.6%) | 346 (6.2%) |
| 30 to 34 Years | 521 (9.9%) | 326 (5.8%) |
| 35 to 39 Years | 382 (7.3%) | 272 (4.9%) |
| 40 to 44 Years | 370 (7.0%) | 435 (7.8%) |
| 45 to 49 Years | 373 (7.1%) | 387 (6.9%) |
| 50 to 54 Years | 449 (8.5%) | 281 (5.0%) |
| 55 to 59 Years | 268 (5.1%) | 331 (5.9%) |
| 60 to 64 Years | 204 (3.9%) | 258 (4.6%) |
| 65 to 69 Years | 300 (5.7%) | 423 (7.6%) |
| 70 to 74 Years | 100 (1.9%) | 228 (4.1%) |
| 75 to 79 Years | 99 (1.9%) | 126 (2.3%) |
| 80 to 84 Years | 35 (0.7%) | 161 (2.9%) |
| 85 Years and over | 49 (0.9%) | 36 (0.6%) |
| Total | 5,256 (100.0%) | 5,586 (100.0%) |
Families and Households in Danville
Median Family Size in Danville
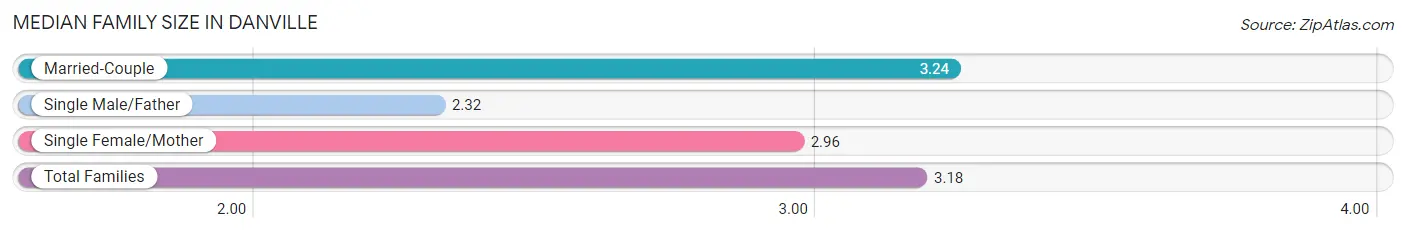
The median family size in Danville is 3.18 persons per family, with married-couple families (2,502 | 89.5%) accounting for the largest median family size of 3.24 persons per family. On the other hand, single male/father families (136 | 4.9%) represent the smallest median family size with 2.32 persons per family.
| Family Type | # Families | Family Size |
| Married-Couple | 2,502 (89.5%) | 3.24 |
| Single Male/Father | 136 (4.9%) | 2.32 |
| Single Female/Mother | 157 (5.6%) | 2.96 |
| Total Families | 2,795 (100.0%) | 3.18 |
Median Household Size in Danville
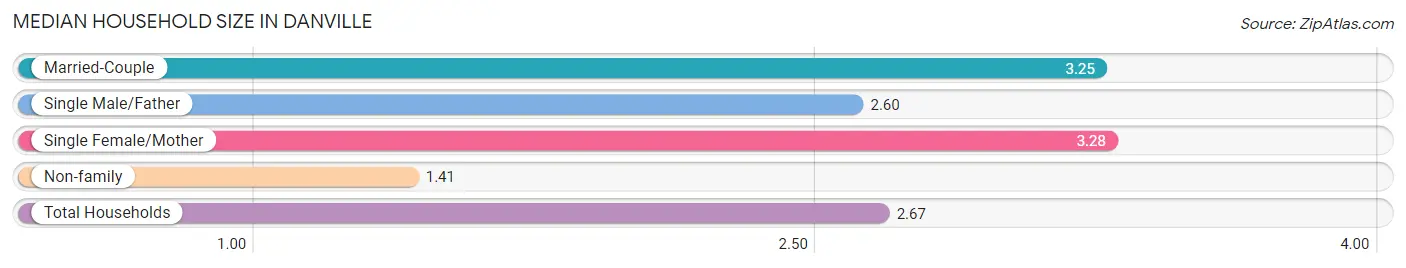
The median household size in Danville is 2.67 persons per household, with single female/mother households (157 | 3.9%) accounting for the largest median household size of 3.28 persons per household. non-family households (1,213 | 30.3%) represent the smallest median household size with 1.41 persons per household.
| Household Type | # Households | Household Size |
| Married-Couple | 2,502 (62.4%) | 3.25 |
| Single Male/Father | 136 (3.4%) | 2.60 |
| Single Female/Mother | 157 (3.9%) | 3.28 |
| Non-family | 1,213 (30.3%) | 1.41 |
| Total Households | 4,008 (100.0%) | 2.67 |
Household Size by Marriage Status in Danville
Out of a total of 4,008 households in Danville, 2,795 (69.7%) are family households, while 1,213 (30.3%) are nonfamily households. The most numerous type of family households are 2-person households, comprising 1,025, and the most common type of nonfamily households are 1-person households, comprising 943.
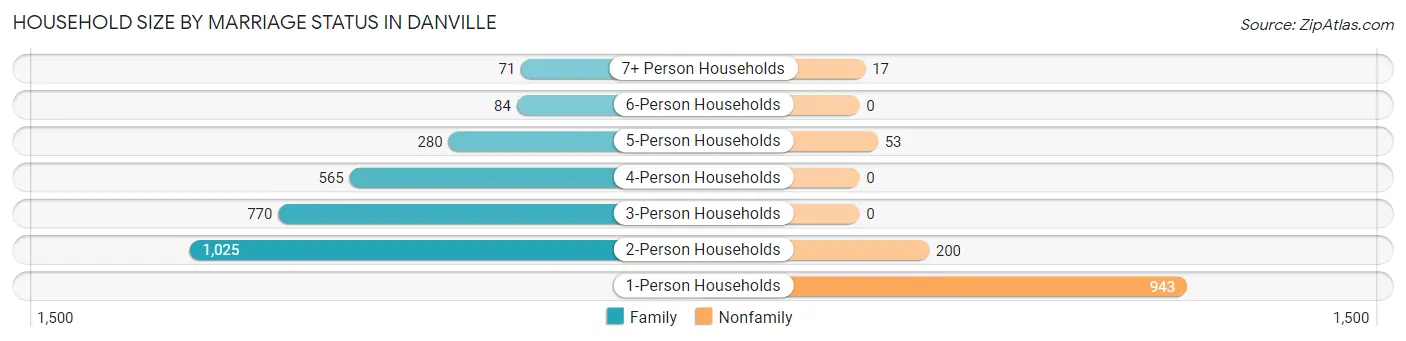
| Household Size | Family Households | Nonfamily Households |
| 1-Person Households | - | 943 (23.5%) |
| 2-Person Households | 1,025 (25.6%) | 200 (5.0%) |
| 3-Person Households | 770 (19.2%) | 0 (0.0%) |
| 4-Person Households | 565 (14.1%) | 0 (0.0%) |
| 5-Person Households | 280 (7.0%) | 53 (1.3%) |
| 6-Person Households | 84 (2.1%) | 0 (0.0%) |
| 7+ Person Households | 71 (1.8%) | 17 (0.4%) |
| Total | 2,795 (69.7%) | 1,213 (30.3%) |
Female Fertility in Danville
Fertility by Age in Danville
Average fertility rate in Danville is 58.0 births per 1,000 women. Women in the age bracket of 20 to 34 years have the highest fertility rate with 117.0 births per 1,000 women. Women in the age bracket of 20 to 34 years acount for 79.3% of all women with births.
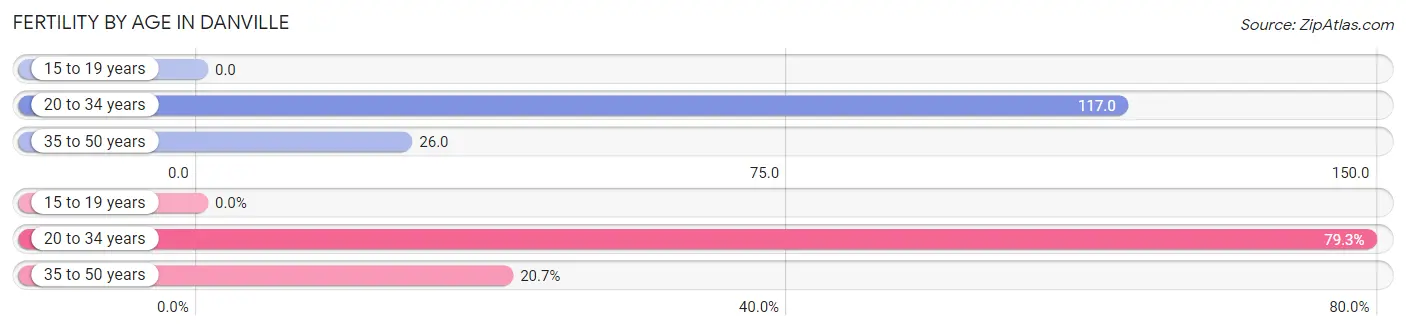
| Age Bracket | Women with Births | Births / 1,000 Women |
| 15 to 19 years | 0 (0.0%) | 0.0 |
| 20 to 34 years | 111 (79.3%) | 117.0 |
| 35 to 50 years | 29 (20.7%) | 26.0 |
| Total | 140 (100.0%) | 58.0 |
Fertility by Age by Marriage Status in Danville
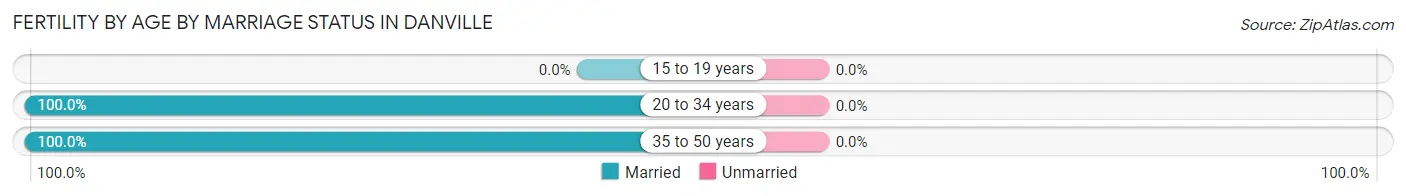
| Age Bracket | Married | Unmarried |
| 15 to 19 years | 0 (0.0%) | 0 (0.0%) |
| 20 to 34 years | 111 (100.0%) | 0 (0.0%) |
| 35 to 50 years | 29 (100.0%) | 0 (0.0%) |
| Total | 140 (100.0%) | 0 (0.0%) |
Fertility by Education in Danville
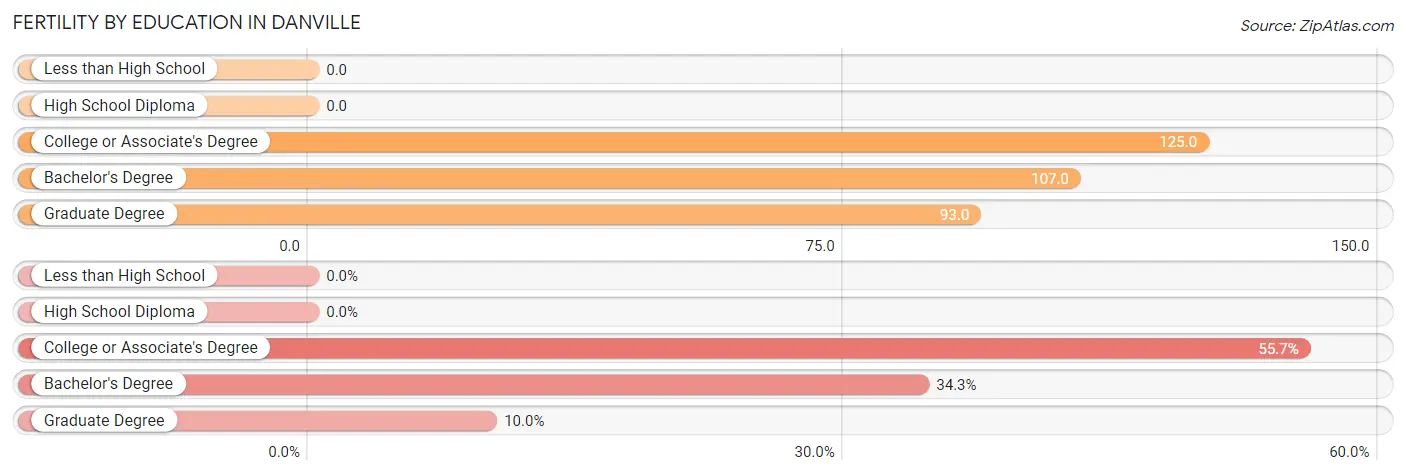
| Educational Attainment | Women with Births | Births / 1,000 Women |
| Less than High School | 0 (0.0%) | 0.0 |
| High School Diploma | 0 (0.0%) | 0.0 |
| College or Associate's Degree | 78 (55.7%) | 125.0 |
| Bachelor's Degree | 48 (34.3%) | 107.0 |
| Graduate Degree | 14 (10.0%) | 93.0 |
| Total | 140 (100.0%) | 58.0 |
Fertility by Education by Marriage Status in Danville
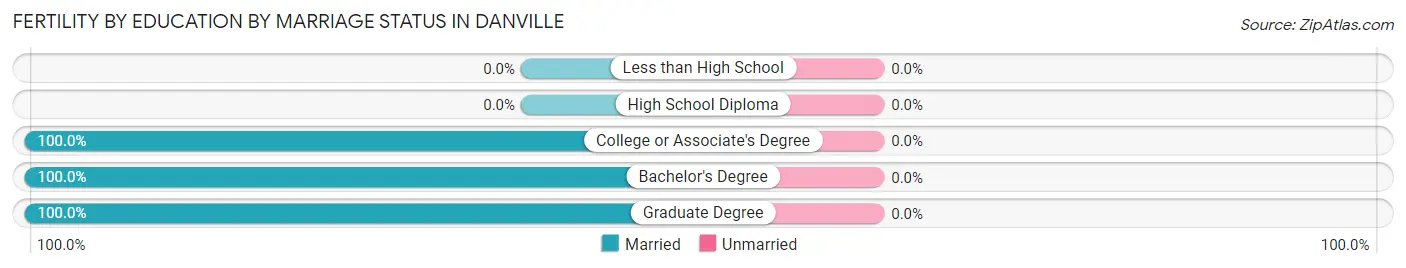
| Educational Attainment | Married | Unmarried |
| Less than High School | 0 (0.0%) | 0 (0.0%) |
| High School Diploma | 0 (0.0%) | 0 (0.0%) |
| College or Associate's Degree | 78 (100.0%) | 0 (0.0%) |
| Bachelor's Degree | 48 (100.0%) | 0 (0.0%) |
| Graduate Degree | 14 (100.0%) | 0 (0.0%) |
| Total | 140 (100.0%) | 0 (0.0%) |
Employment Characteristics in Danville
Employment by Class of Employer in Danville
Among the 5,725 employed individuals in Danville, private company employees (3,925 | 68.6%), not-for-profit organizations (743 | 13.0%), and local government employees (571 | 10.0%) make up the most common classes of employment.
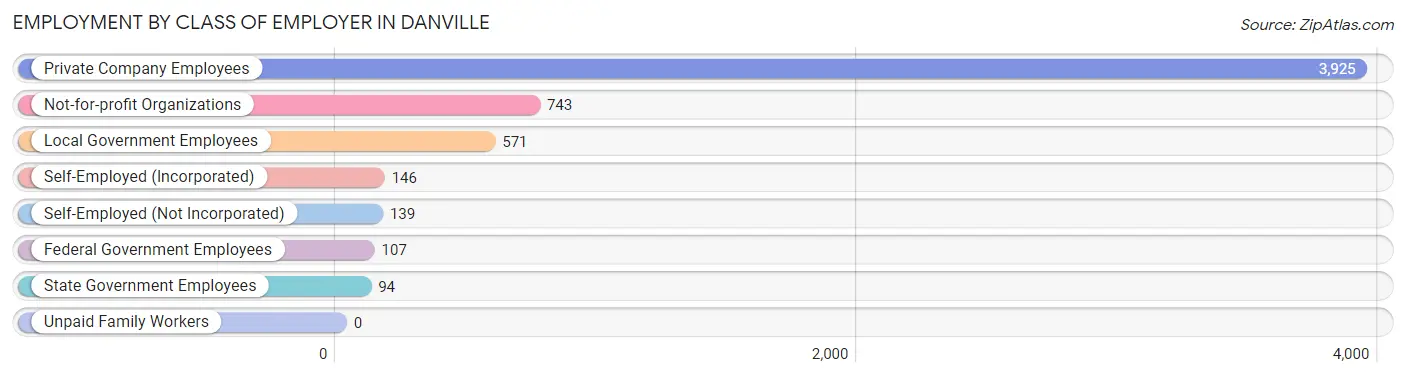
| Employer Class | # Employees | % Employees |
| Private Company Employees | 3,925 | 68.6% |
| Self-Employed (Incorporated) | 146 | 2.5% |
| Self-Employed (Not Incorporated) | 139 | 2.4% |
| Not-for-profit Organizations | 743 | 13.0% |
| Local Government Employees | 571 | 10.0% |
| State Government Employees | 94 | 1.6% |
| Federal Government Employees | 107 | 1.9% |
| Unpaid Family Workers | 0 | 0.0% |
| Total | 5,725 | 100.0% |
Employment Status by Age in Danville
According to the labor force statistics for Danville, out of the total population over 16 years of age (8,095), 71.8% or 5,812 individuals are in the labor force, with 1.5% or 87 of them unemployed. The age group with the highest labor force participation rate is 30 to 34 years, with 100.0% or 847 individuals in the labor force. Within the labor force, the 16 to 19 years age range has the highest percentage of unemployed individuals, with 22.5% or 61 of them being unemployed.
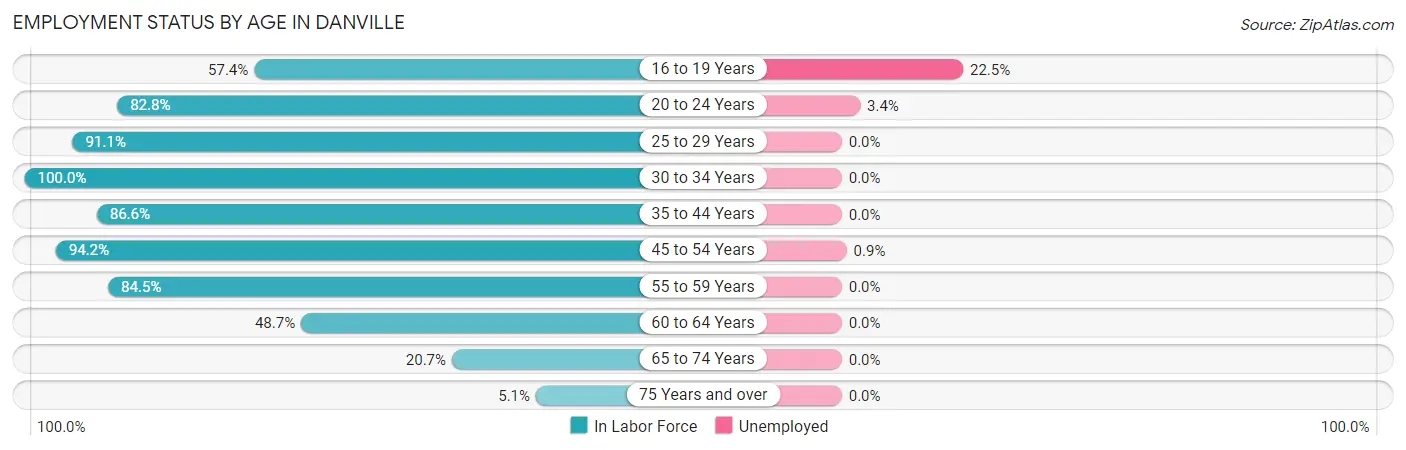
| Age Bracket | In Labor Force | Unemployed |
| 16 to 19 Years | 271 (57.4%) | 61 (22.5%) |
| 20 to 24 Years | 472 (82.8%) | 16 (3.4%) |
| 25 to 29 Years | 582 (91.1%) | 0 (0.0%) |
| 30 to 34 Years | 847 (100.0%) | 0 (0.0%) |
| 35 to 44 Years | 1,263 (86.6%) | 0 (0.0%) |
| 45 to 54 Years | 1,404 (94.2%) | 13 (0.9%) |
| 55 to 59 Years | 506 (84.5%) | 0 (0.0%) |
| 60 to 64 Years | 225 (48.7%) | 0 (0.0%) |
| 65 to 74 Years | 218 (20.7%) | 0 (0.0%) |
| 75 Years and over | 26 (5.1%) | 0 (0.0%) |
| Total | 5,812 (71.8%) | 87 (1.5%) |
Employment Status by Educational Attainment in Danville
According to labor force statistics for Danville, 87.8% of individuals (4,825) out of the total population between 25 and 64 years of age (5,496) are in the labor force, with 0.3% or 14 of them being unemployed. The group with the highest labor force participation rate are those with the educational attainment of college / associate degree, with 94.0% or 1,970 individuals in the labor force. Within the labor force, individuals with bachelor's degree or higher education have the highest percentage of unemployment, with 0.9% or 13 of them being unemployed.
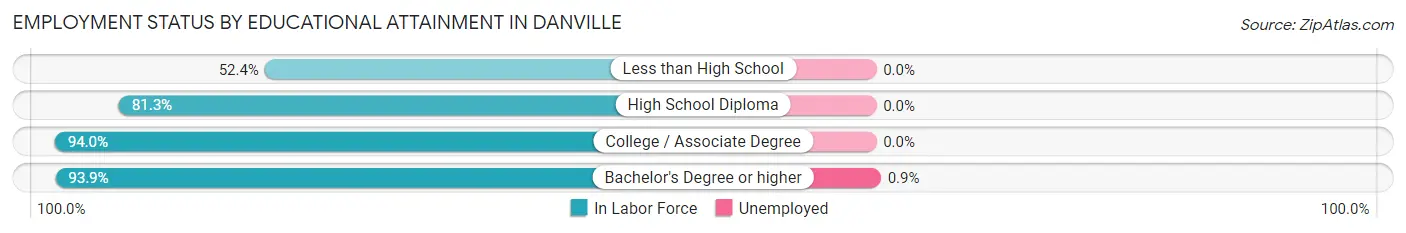
| Educational Attainment | In Labor Force | Unemployed |
| Less than High School | 183 (52.4%) | 0 (0.0%) |
| High School Diploma | 1,229 (81.3%) | 0 (0.0%) |
| College / Associate Degree | 1,970 (94.0%) | 0 (0.0%) |
| Bachelor's Degree or higher | 1,445 (93.9%) | 14 (0.9%) |
| Total | 4,825 (87.8%) | 16 (0.3%) |
Employment Occupations by Sex in Danville
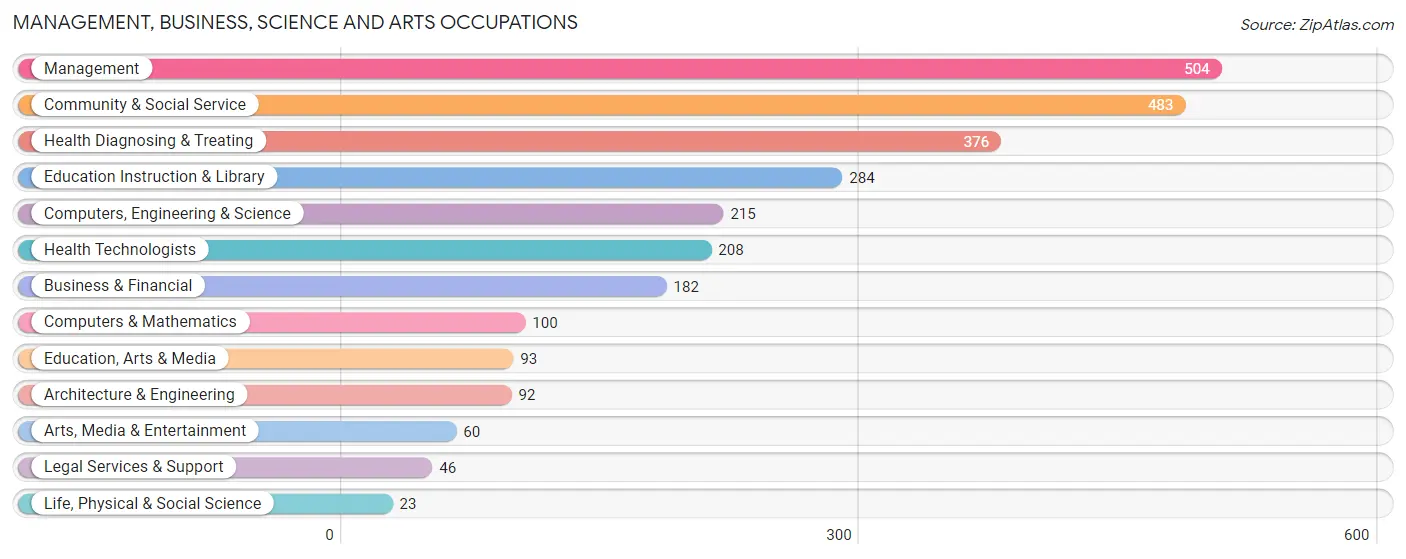
Management, Business, Science and Arts Occupations
The most common Management, Business, Science and Arts occupations in Danville are Management (504 | 8.8%), Community & Social Service (483 | 8.4%), Health Diagnosing & Treating (376 | 6.6%), Education Instruction & Library (284 | 5.0%), and Computers, Engineering & Science (215 | 3.8%).
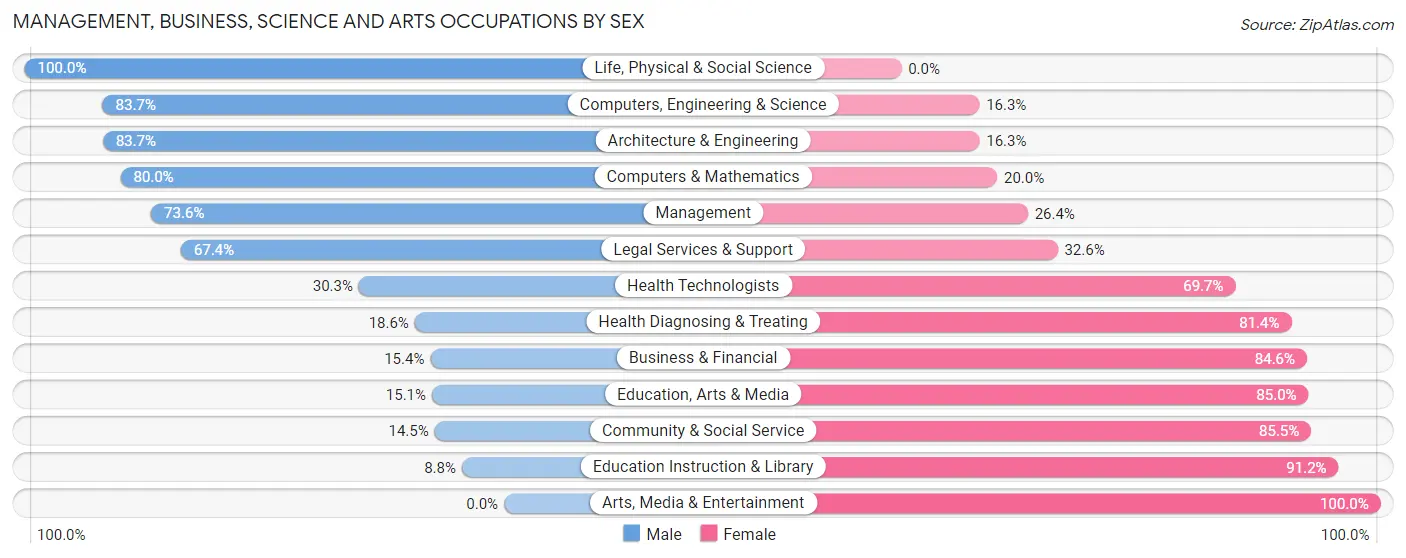
Management, Business, Science and Arts Occupations by Sex
Within the Management, Business, Science and Arts occupations in Danville, the most male-oriented occupations are Life, Physical & Social Science (100.0%), Computers, Engineering & Science (83.7%), and Architecture & Engineering (83.7%), while the most female-oriented occupations are Arts, Media & Entertainment (100.0%), Education Instruction & Library (91.2%), and Community & Social Service (85.5%).
| Occupation | Male | Female |
| Management | 371 (73.6%) | 133 (26.4%) |
| Business & Financial | 28 (15.4%) | 154 (84.6%) |
| Computers, Engineering & Science | 180 (83.7%) | 35 (16.3%) |
| Computers & Mathematics | 80 (80.0%) | 20 (20.0%) |
| Architecture & Engineering | 77 (83.7%) | 15 (16.3%) |
| Life, Physical & Social Science | 23 (100.0%) | 0 (0.0%) |
| Community & Social Service | 70 (14.5%) | 413 (85.5%) |
| Education, Arts & Media | 14 (15.0%) | 79 (85.0%) |
| Legal Services & Support | 31 (67.4%) | 15 (32.6%) |
| Education Instruction & Library | 25 (8.8%) | 259 (91.2%) |
| Arts, Media & Entertainment | 0 (0.0%) | 60 (100.0%) |
| Health Diagnosing & Treating | 70 (18.6%) | 306 (81.4%) |
| Health Technologists | 63 (30.3%) | 145 (69.7%) |
| Total (Category) | 719 (40.8%) | 1,041 (59.2%) |
| Total (Overall) | 3,017 (52.7%) | 2,708 (47.3%) |
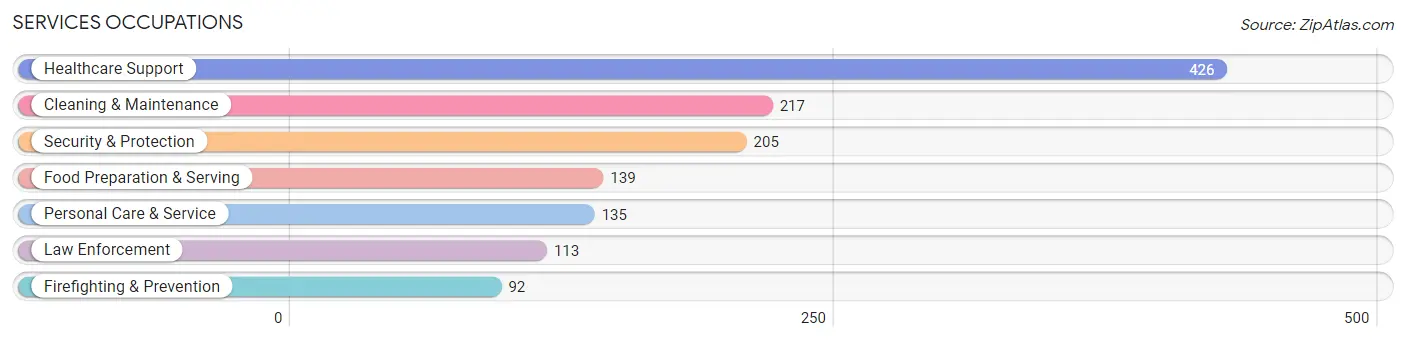
Services Occupations
The most common Services occupations in Danville are Healthcare Support (426 | 7.4%), Cleaning & Maintenance (217 | 3.8%), Security & Protection (205 | 3.6%), Food Preparation & Serving (139 | 2.4%), and Personal Care & Service (135 | 2.4%).
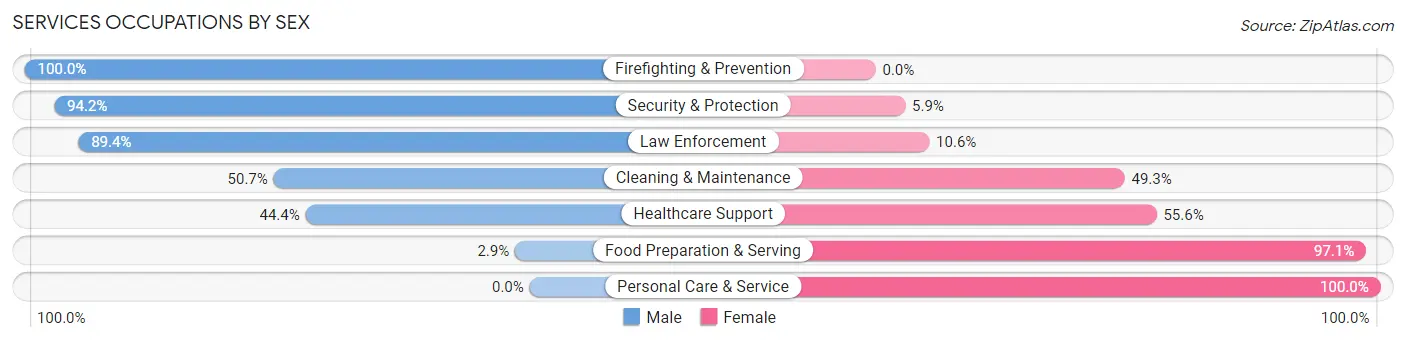
Services Occupations by Sex
Within the Services occupations in Danville, the most male-oriented occupations are Firefighting & Prevention (100.0%), Security & Protection (94.2%), and Law Enforcement (89.4%), while the most female-oriented occupations are Personal Care & Service (100.0%), Food Preparation & Serving (97.1%), and Healthcare Support (55.6%).
| Occupation | Male | Female |
| Healthcare Support | 189 (44.4%) | 237 (55.6%) |
| Security & Protection | 193 (94.2%) | 12 (5.9%) |
| Firefighting & Prevention | 92 (100.0%) | 0 (0.0%) |
| Law Enforcement | 101 (89.4%) | 12 (10.6%) |
| Food Preparation & Serving | 4 (2.9%) | 135 (97.1%) |
| Cleaning & Maintenance | 110 (50.7%) | 107 (49.3%) |
| Personal Care & Service | 0 (0.0%) | 135 (100.0%) |
| Total (Category) | 496 (44.2%) | 626 (55.8%) |
| Total (Overall) | 3,017 (52.7%) | 2,708 (47.3%) |
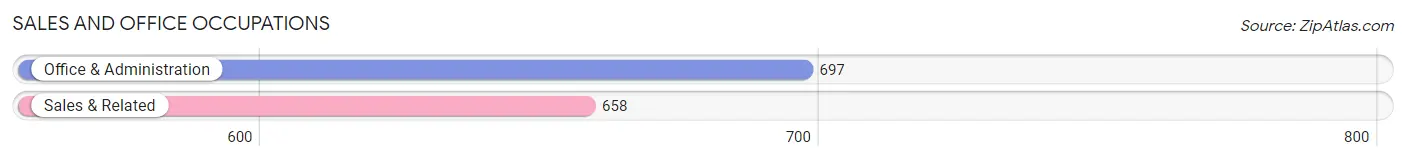
Sales and Office Occupations
The most common Sales and Office occupations in Danville are Office & Administration (697 | 12.2%), and Sales & Related (658 | 11.5%).
Sales and Office Occupations by Sex
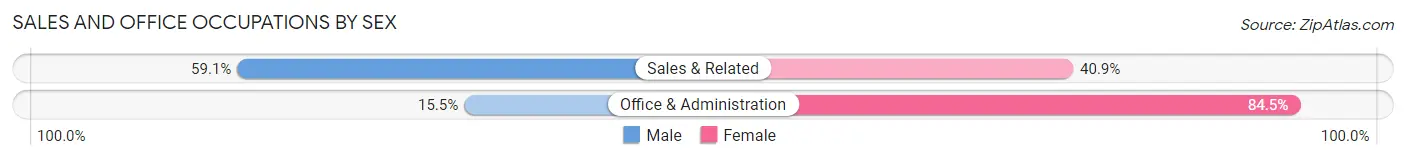
| Occupation | Male | Female |
| Sales & Related | 389 (59.1%) | 269 (40.9%) |
| Office & Administration | 108 (15.5%) | 589 (84.5%) |
| Total (Category) | 497 (36.7%) | 858 (63.3%) |
| Total (Overall) | 3,017 (52.7%) | 2,708 (47.3%) |
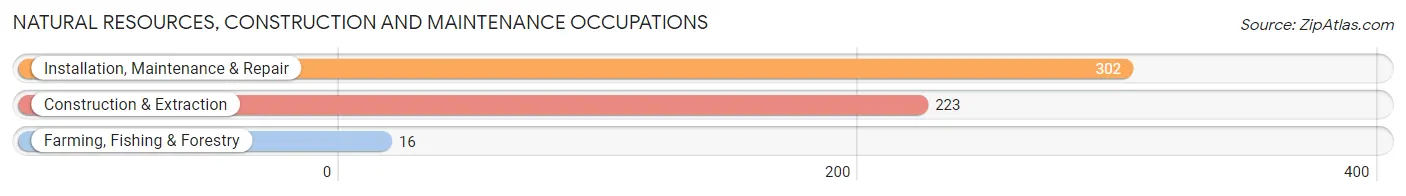
Natural Resources, Construction and Maintenance Occupations
The most common Natural Resources, Construction and Maintenance occupations in Danville are Installation, Maintenance & Repair (302 | 5.3%), Construction & Extraction (223 | 3.9%), and Farming, Fishing & Forestry (16 | 0.3%).
Natural Resources, Construction and Maintenance Occupations by Sex
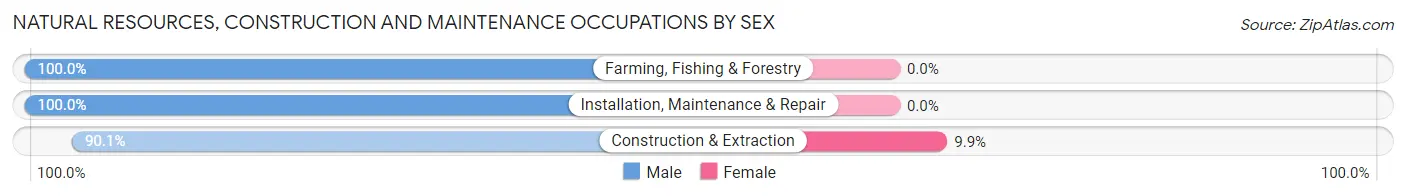
| Occupation | Male | Female |
| Farming, Fishing & Forestry | 16 (100.0%) | 0 (0.0%) |
| Construction & Extraction | 201 (90.1%) | 22 (9.9%) |
| Installation, Maintenance & Repair | 302 (100.0%) | 0 (0.0%) |
| Total (Category) | 519 (95.9%) | 22 (4.1%) |
| Total (Overall) | 3,017 (52.7%) | 2,708 (47.3%) |
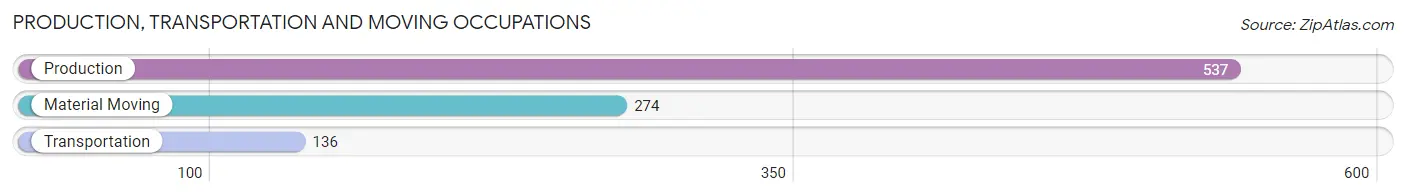
Production, Transportation and Moving Occupations
The most common Production, Transportation and Moving occupations in Danville are Production (537 | 9.4%), Material Moving (274 | 4.8%), and Transportation (136 | 2.4%).
Production, Transportation and Moving Occupations by Sex
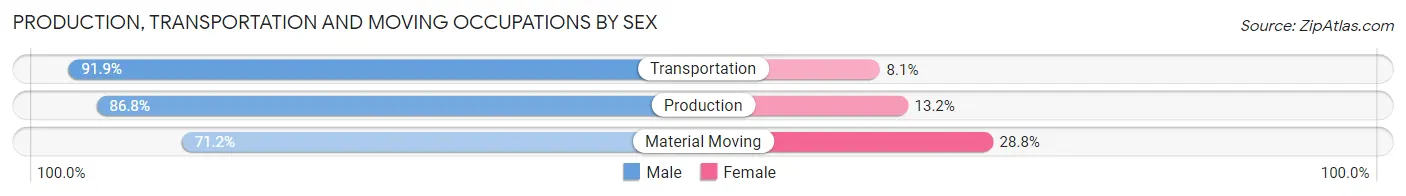
| Occupation | Male | Female |
| Production | 466 (86.8%) | 71 (13.2%) |
| Transportation | 125 (91.9%) | 11 (8.1%) |
| Material Moving | 195 (71.2%) | 79 (28.8%) |
| Total (Category) | 786 (83.0%) | 161 (17.0%) |
| Total (Overall) | 3,017 (52.7%) | 2,708 (47.3%) |
Employment Industries by Sex in Danville
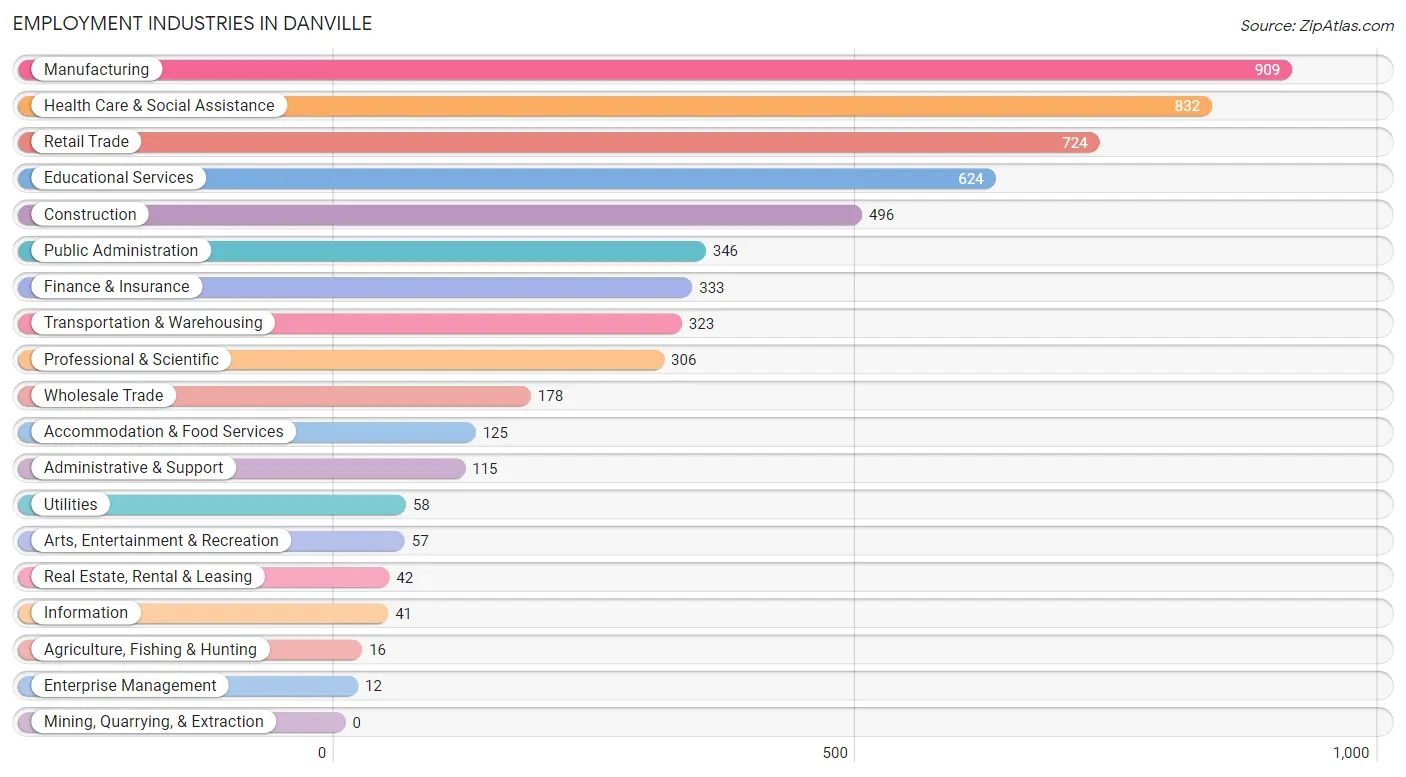
Employment Industries in Danville
The major employment industries in Danville include Manufacturing (909 | 15.9%), Health Care & Social Assistance (832 | 14.5%), Retail Trade (724 | 12.7%), Educational Services (624 | 10.9%), and Construction (496 | 8.7%).
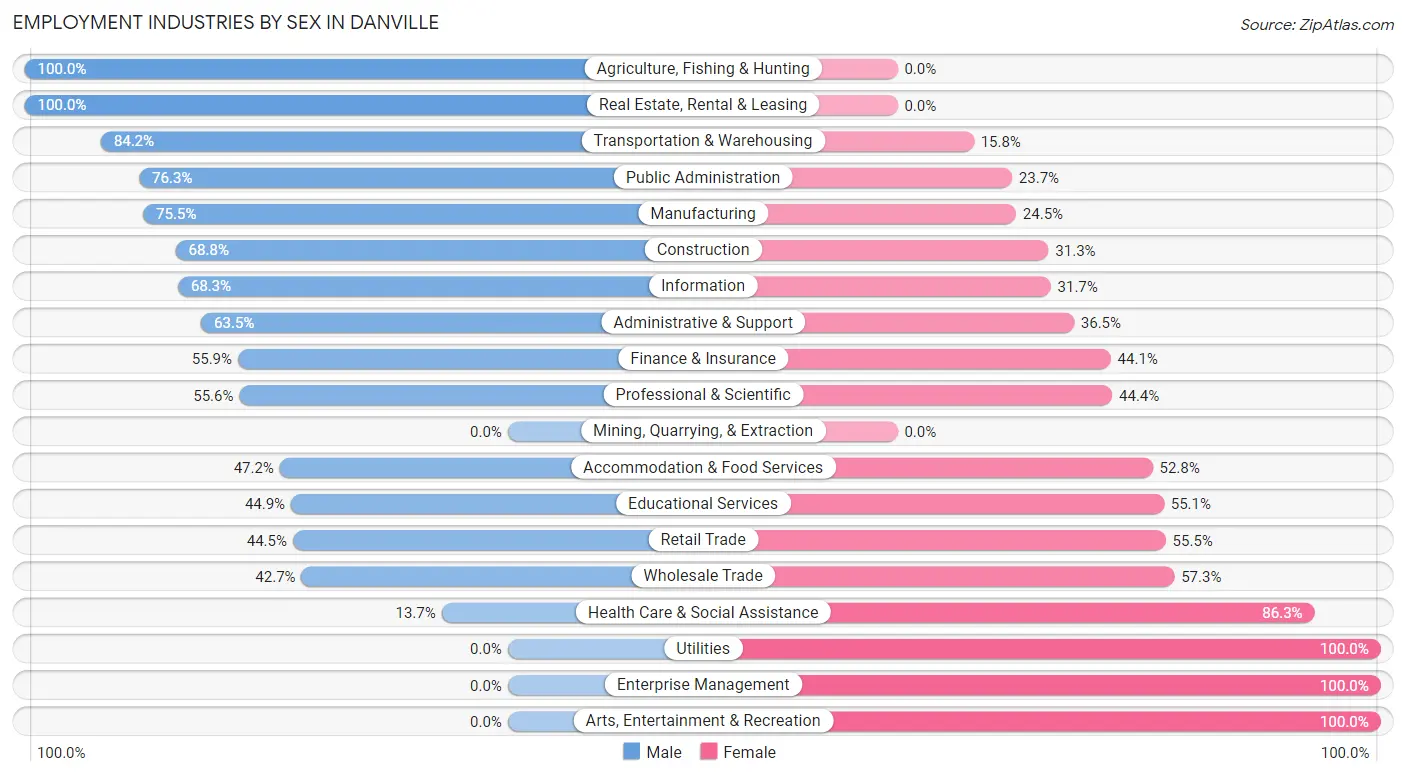
Employment Industries by Sex in Danville
The Danville industries that see more men than women are Agriculture, Fishing & Hunting (100.0%), Real Estate, Rental & Leasing (100.0%), and Transportation & Warehousing (84.2%), whereas the industries that tend to have a higher number of women are Utilities (100.0%), Enterprise Management (100.0%), and Arts, Entertainment & Recreation (100.0%).
| Industry | Male | Female |
| Agriculture, Fishing & Hunting | 16 (100.0%) | 0 (0.0%) |
| Mining, Quarrying, & Extraction | 0 (0.0%) | 0 (0.0%) |
| Construction | 341 (68.8%) | 155 (31.2%) |
| Manufacturing | 686 (75.5%) | 223 (24.5%) |
| Wholesale Trade | 76 (42.7%) | 102 (57.3%) |
| Retail Trade | 322 (44.5%) | 402 (55.5%) |
| Transportation & Warehousing | 272 (84.2%) | 51 (15.8%) |
| Utilities | 0 (0.0%) | 58 (100.0%) |
| Information | 28 (68.3%) | 13 (31.7%) |
| Finance & Insurance | 186 (55.9%) | 147 (44.1%) |
| Real Estate, Rental & Leasing | 42 (100.0%) | 0 (0.0%) |
| Professional & Scientific | 170 (55.6%) | 136 (44.4%) |
| Enterprise Management | 0 (0.0%) | 12 (100.0%) |
| Administrative & Support | 73 (63.5%) | 42 (36.5%) |
| Educational Services | 280 (44.9%) | 344 (55.1%) |
| Health Care & Social Assistance | 114 (13.7%) | 718 (86.3%) |
| Arts, Entertainment & Recreation | 0 (0.0%) | 57 (100.0%) |
| Accommodation & Food Services | 59 (47.2%) | 66 (52.8%) |
| Public Administration | 264 (76.3%) | 82 (23.7%) |
| Total | 3,017 (52.7%) | 2,708 (47.3%) |
Education in Danville
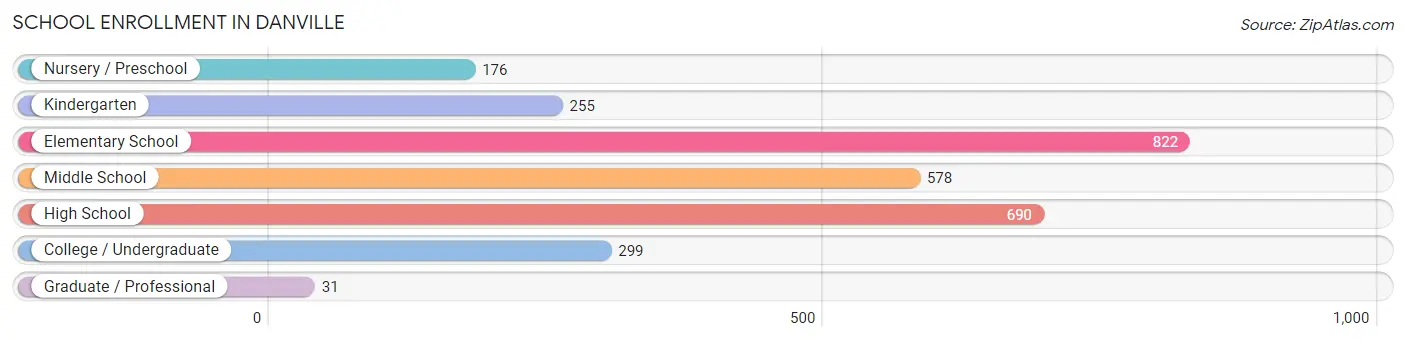
School Enrollment in Danville
The most common levels of schooling among the 2,851 students in Danville are elementary school (822 | 28.8%), high school (690 | 24.2%), and middle school (578 | 20.3%).
| School Level | # Students | % Students |
| Nursery / Preschool | 176 | 6.2% |
| Kindergarten | 255 | 8.9% |
| Elementary School | 822 | 28.8% |
| Middle School | 578 | 20.3% |
| High School | 690 | 24.2% |
| College / Undergraduate | 299 | 10.5% |
| Graduate / Professional | 31 | 1.1% |
| Total | 2,851 | 100.0% |
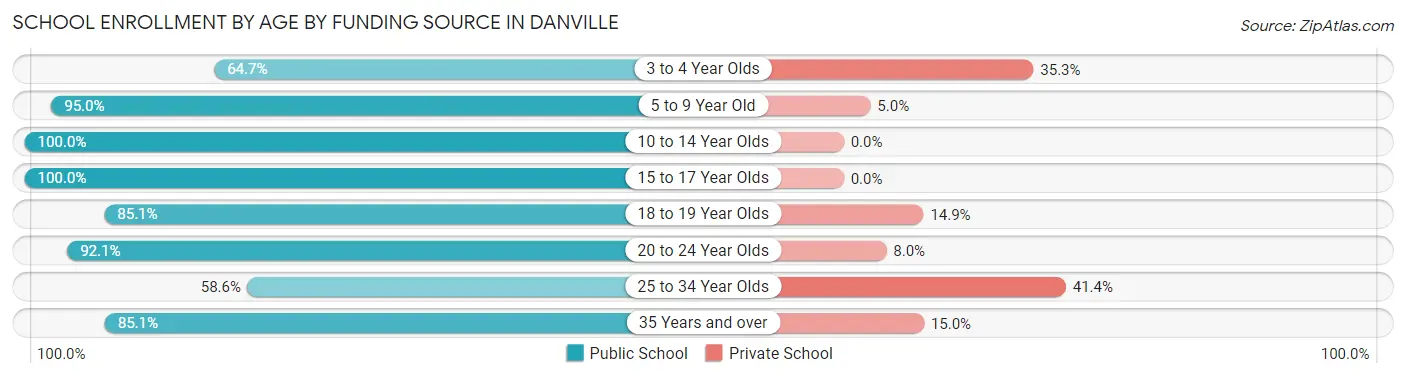
School Enrollment by Age by Funding Source in Danville
Out of a total of 2,851 students who are enrolled in schools in Danville, 188 (6.6%) attend a private institution, while the remaining 2,663 (93.4%) are enrolled in public schools. The age group of 25 to 34 year olds has the highest likelihood of being enrolled in private schools, with 24 (41.4% in the age bracket) enrolled. Conversely, the age group of 10 to 14 year olds has the lowest likelihood of being enrolled in a private school, with 825 (100.0% in the age bracket) attending a public institution.
| Age Bracket | Public School | Private School |
| 3 to 4 Year Olds | 97 (64.7%) | 53 (35.3%) |
| 5 to 9 Year Old | 955 (95.0%) | 50 (5.0%) |
| 10 to 14 Year Olds | 825 (100.0%) | 0 (0.0%) |
| 15 to 17 Year Olds | 333 (100.0%) | 0 (0.0%) |
| 18 to 19 Year Olds | 189 (85.1%) | 33 (14.9%) |
| 20 to 24 Year Olds | 139 (92.0%) | 12 (8.0%) |
| 25 to 34 Year Olds | 34 (58.6%) | 24 (41.4%) |
| 35 Years and over | 91 (85.1%) | 16 (14.9%) |
| Total | 2,663 (93.4%) | 188 (6.6%) |
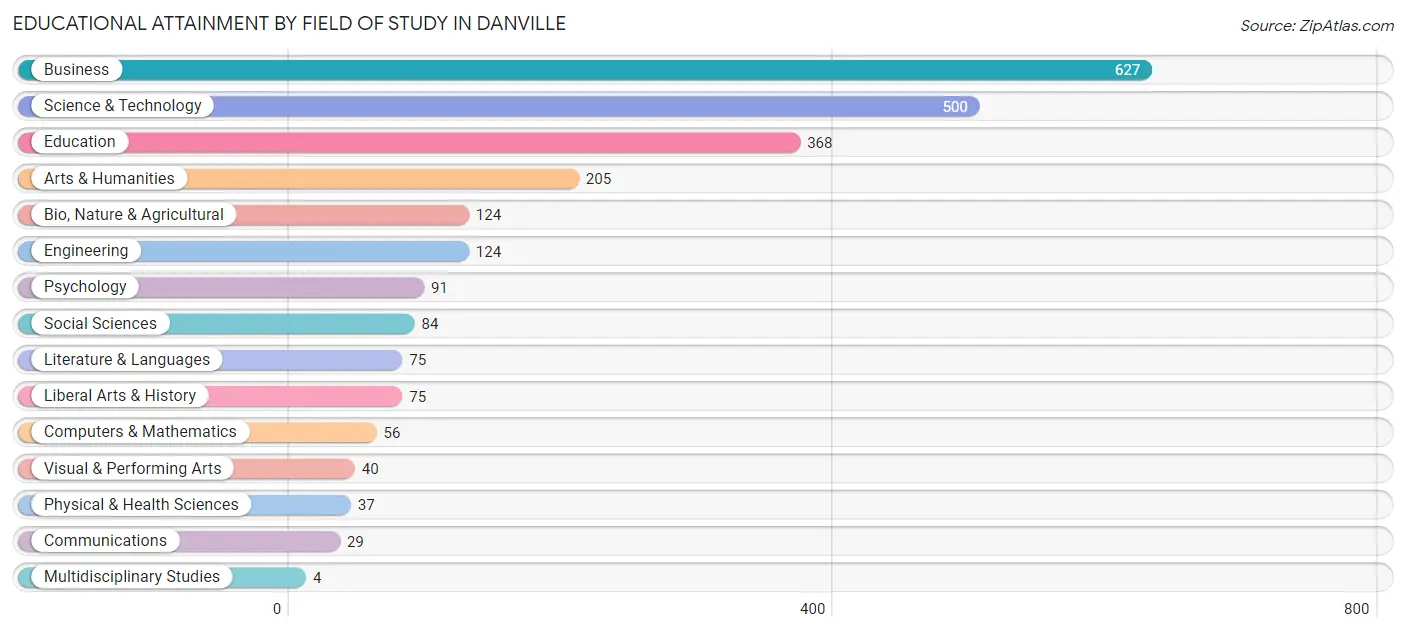
Educational Attainment by Field of Study in Danville
Business (627 | 25.7%), science & technology (500 | 20.5%), education (368 | 15.1%), arts & humanities (205 | 8.4%), and bio, nature & agricultural (124 | 5.1%) are the most common fields of study among 2,439 individuals in Danville who have obtained a bachelor's degree or higher.
| Field of Study | # Graduates | % Graduates |
| Computers & Mathematics | 56 | 2.3% |
| Bio, Nature & Agricultural | 124 | 5.1% |
| Physical & Health Sciences | 37 | 1.5% |
| Psychology | 91 | 3.7% |
| Social Sciences | 84 | 3.4% |
| Engineering | 124 | 5.1% |
| Multidisciplinary Studies | 4 | 0.2% |
| Science & Technology | 500 | 20.5% |
| Business | 627 | 25.7% |
| Education | 368 | 15.1% |
| Literature & Languages | 75 | 3.1% |
| Liberal Arts & History | 75 | 3.1% |
| Visual & Performing Arts | 40 | 1.6% |
| Communications | 29 | 1.2% |
| Arts & Humanities | 205 | 8.4% |
| Total | 2,439 | 100.0% |
Transportation & Commute in Danville
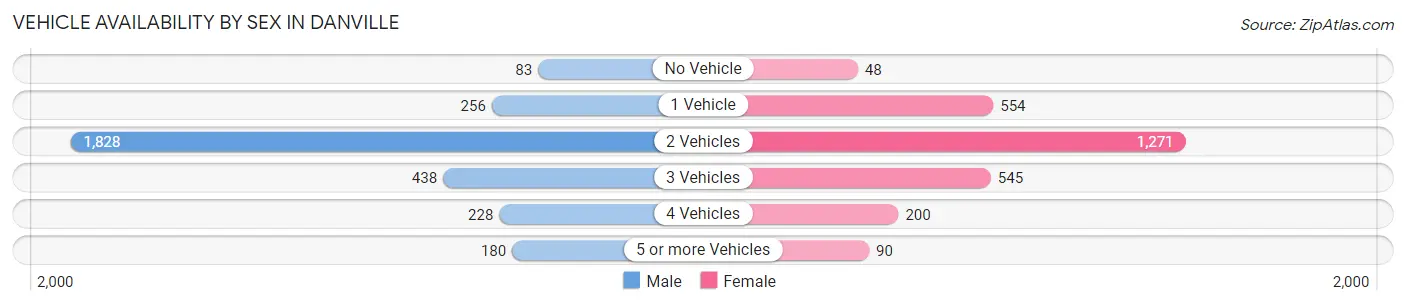
Vehicle Availability by Sex in Danville
The most prevalent vehicle ownership categories in Danville are males with 2 vehicles (1,828, accounting for 60.7%) and females with 2 vehicles (1,271, making up 67.5%).
| Vehicles Available | Male | Female |
| No Vehicle | 83 (2.8%) | 48 (1.8%) |
| 1 Vehicle | 256 (8.5%) | 554 (20.5%) |
| 2 Vehicles | 1,828 (60.7%) | 1,271 (46.9%) |
| 3 Vehicles | 438 (14.5%) | 545 (20.1%) |
| 4 Vehicles | 228 (7.6%) | 200 (7.4%) |
| 5 or more Vehicles | 180 (6.0%) | 90 (3.3%) |
| Total | 3,013 (100.0%) | 2,708 (100.0%) |
Commute Time in Danville
The most frequently occuring commute durations in Danville are 10 to 14 minutes (898 commuters, 17.0%), 30 to 34 minutes (893 commuters, 16.9%), and 5 to 9 minutes (578 commuters, 10.9%).
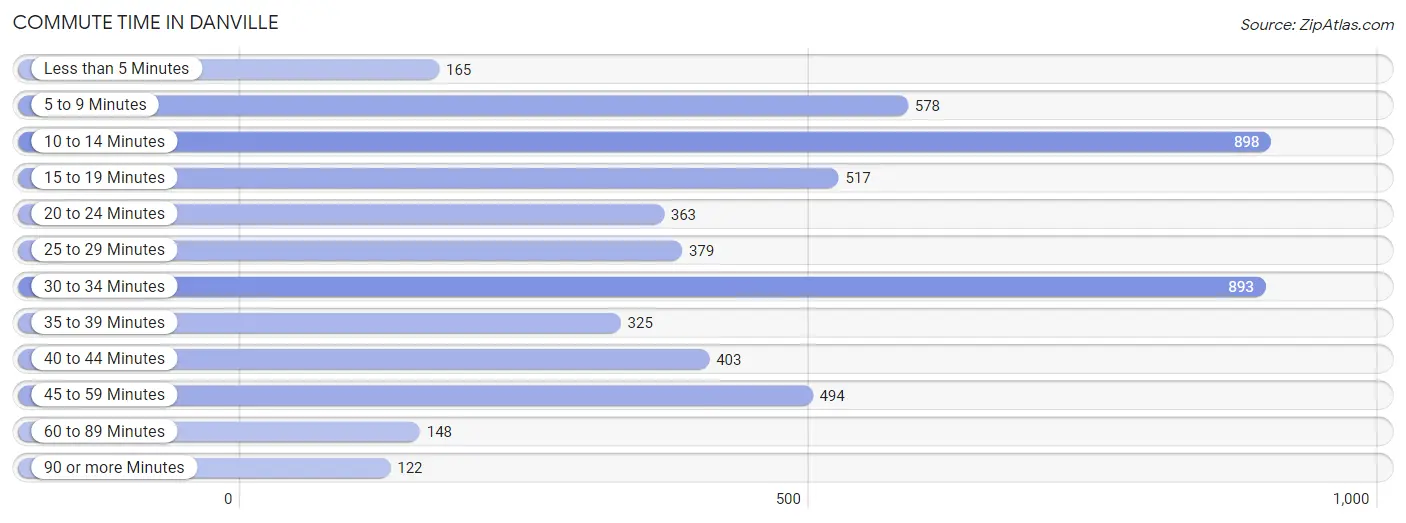
| Commute Time | # Commuters | % Commuters |
| Less than 5 Minutes | 165 | 3.1% |
| 5 to 9 Minutes | 578 | 10.9% |
| 10 to 14 Minutes | 898 | 17.0% |
| 15 to 19 Minutes | 517 | 9.8% |
| 20 to 24 Minutes | 363 | 6.9% |
| 25 to 29 Minutes | 379 | 7.2% |
| 30 to 34 Minutes | 893 | 16.9% |
| 35 to 39 Minutes | 325 | 6.1% |
| 40 to 44 Minutes | 403 | 7.6% |
| 45 to 59 Minutes | 494 | 9.3% |
| 60 to 89 Minutes | 148 | 2.8% |
| 90 or more Minutes | 122 | 2.3% |
Commute Time by Sex in Danville
The most common commute times in Danville are 10 to 14 minutes (544 commuters, 19.0%) for males and 30 to 34 minutes (481 commuters, 19.8%) for females.
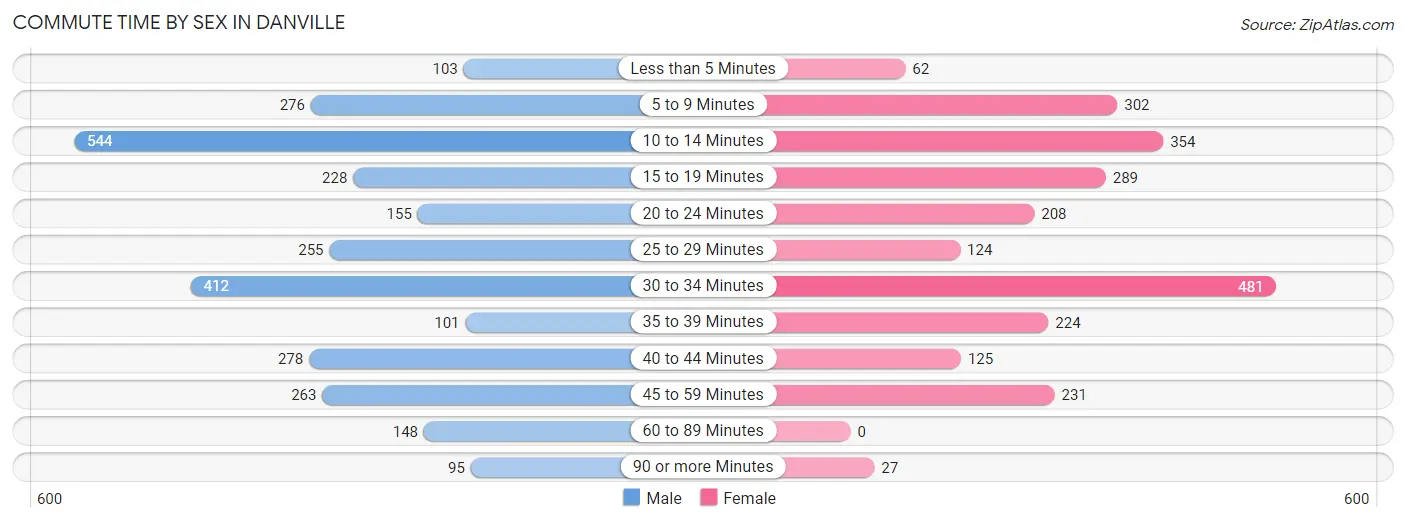
| Commute Time | Male | Female |
| Less than 5 Minutes | 103 (3.6%) | 62 (2.5%) |
| 5 to 9 Minutes | 276 (9.7%) | 302 (12.4%) |
| 10 to 14 Minutes | 544 (19.0%) | 354 (14.6%) |
| 15 to 19 Minutes | 228 (8.0%) | 289 (11.9%) |
| 20 to 24 Minutes | 155 (5.4%) | 208 (8.6%) |
| 25 to 29 Minutes | 255 (8.9%) | 124 (5.1%) |
| 30 to 34 Minutes | 412 (14.4%) | 481 (19.8%) |
| 35 to 39 Minutes | 101 (3.5%) | 224 (9.2%) |
| 40 to 44 Minutes | 278 (9.7%) | 125 (5.1%) |
| 45 to 59 Minutes | 263 (9.2%) | 231 (9.5%) |
| 60 to 89 Minutes | 148 (5.2%) | 0 (0.0%) |
| 90 or more Minutes | 95 (3.3%) | 27 (1.1%) |
Time of Departure to Work by Sex in Danville
The most frequent times of departure to work in Danville are 6:30 AM to 6:59 AM (630, 22.0%) for males and 7:00 AM to 7:29 AM (349, 14.4%) for females.
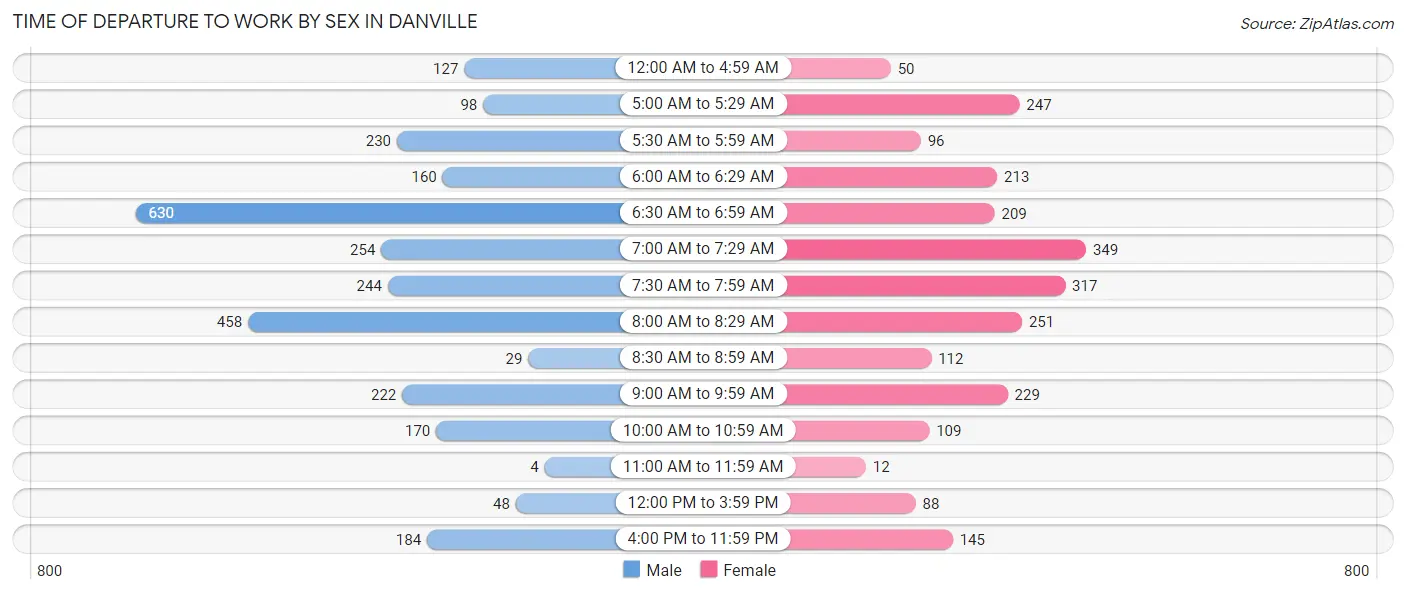
| Time of Departure | Male | Female |
| 12:00 AM to 4:59 AM | 127 (4.4%) | 50 (2.1%) |
| 5:00 AM to 5:29 AM | 98 (3.4%) | 247 (10.2%) |
| 5:30 AM to 5:59 AM | 230 (8.1%) | 96 (4.0%) |
| 6:00 AM to 6:29 AM | 160 (5.6%) | 213 (8.8%) |
| 6:30 AM to 6:59 AM | 630 (22.0%) | 209 (8.6%) |
| 7:00 AM to 7:29 AM | 254 (8.9%) | 349 (14.4%) |
| 7:30 AM to 7:59 AM | 244 (8.5%) | 317 (13.1%) |
| 8:00 AM to 8:29 AM | 458 (16.0%) | 251 (10.3%) |
| 8:30 AM to 8:59 AM | 29 (1.0%) | 112 (4.6%) |
| 9:00 AM to 9:59 AM | 222 (7.8%) | 229 (9.4%) |
| 10:00 AM to 10:59 AM | 170 (5.9%) | 109 (4.5%) |
| 11:00 AM to 11:59 AM | 4 (0.1%) | 12 (0.5%) |
| 12:00 PM to 3:59 PM | 48 (1.7%) | 88 (3.6%) |
| 4:00 PM to 11:59 PM | 184 (6.4%) | 145 (6.0%) |
| Total | 2,858 (100.0%) | 2,427 (100.0%) |
Housing Occupancy in Danville
Occupancy by Ownership in Danville
Of the total 4,008 dwellings in Danville, owner-occupied units account for 2,829 (70.6%), while renter-occupied units make up 1,179 (29.4%).
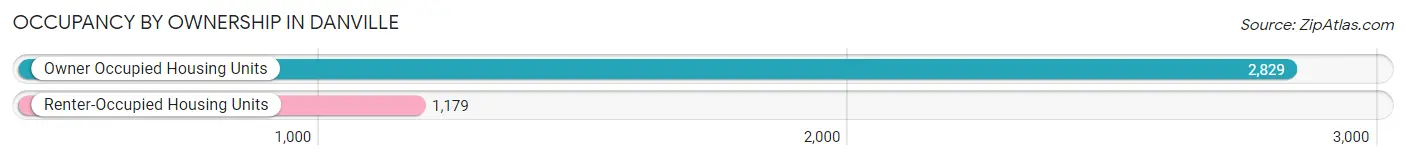
| Occupancy | # Housing Units | % Housing Units |
| Owner Occupied Housing Units | 2,829 | 70.6% |
| Renter-Occupied Housing Units | 1,179 | 29.4% |
| Total Occupied Housing Units | 4,008 | 100.0% |
Occupancy by Household Size in Danville
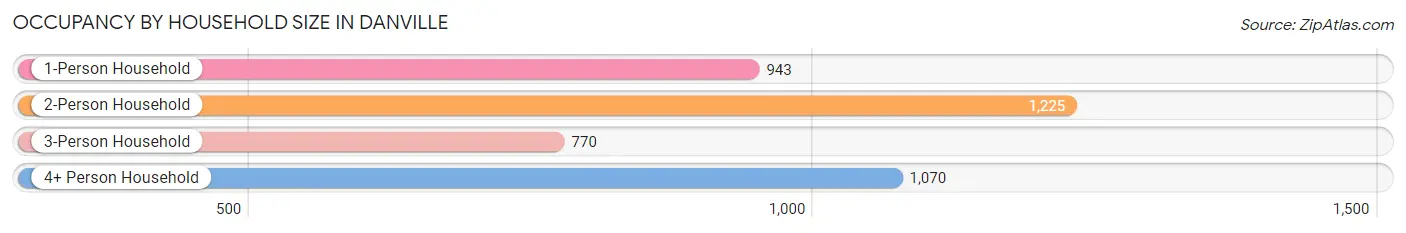
| Household Size | # Housing Units | % Housing Units |
| 1-Person Household | 943 | 23.5% |
| 2-Person Household | 1,225 | 30.6% |
| 3-Person Household | 770 | 19.2% |
| 4+ Person Household | 1,070 | 26.7% |
| Total Housing Units | 4,008 | 100.0% |
Occupancy by Ownership by Household Size in Danville
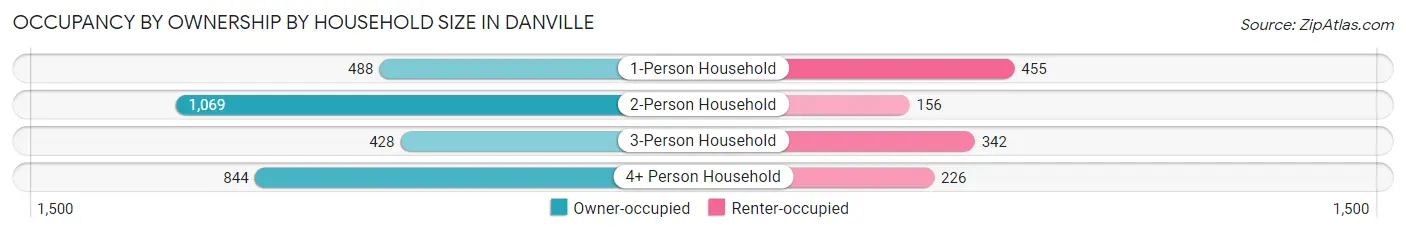
| Household Size | Owner-occupied | Renter-occupied |
| 1-Person Household | 488 (51.7%) | 455 (48.2%) |
| 2-Person Household | 1,069 (87.3%) | 156 (12.7%) |
| 3-Person Household | 428 (55.6%) | 342 (44.4%) |
| 4+ Person Household | 844 (78.9%) | 226 (21.1%) |
| Total Housing Units | 2,829 (70.6%) | 1,179 (29.4%) |
Occupancy by Educational Attainment in Danville
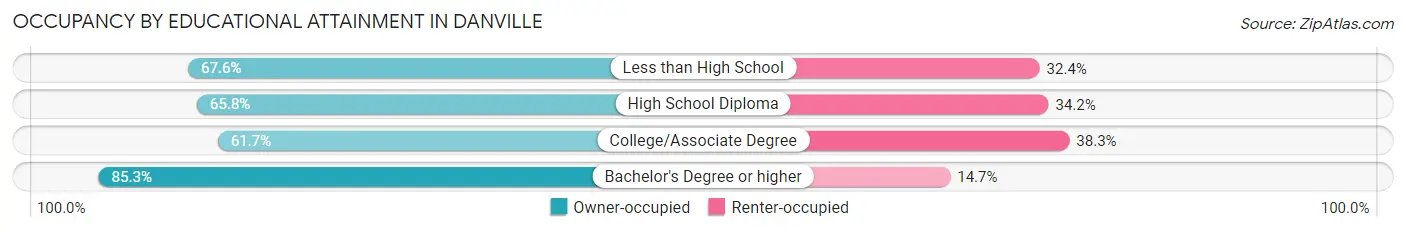
| Household Size | Owner-occupied | Renter-occupied |
| Less than High School | 146 (67.6%) | 70 (32.4%) |
| High School Diploma | 711 (65.8%) | 369 (34.2%) |
| College/Associate Degree | 892 (61.7%) | 554 (38.3%) |
| Bachelor's Degree or higher | 1,080 (85.3%) | 186 (14.7%) |
Occupancy by Age of Householder in Danville
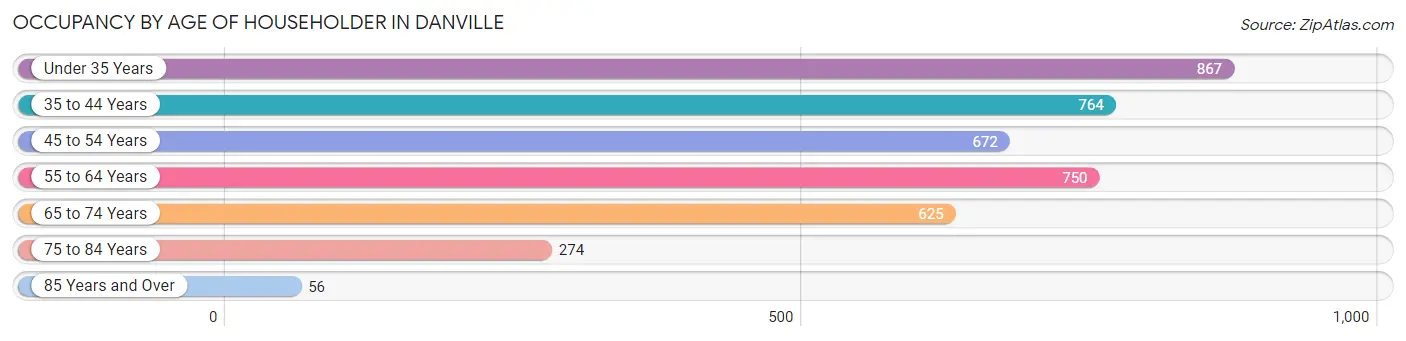
| Age Bracket | # Households | % Households |
| Under 35 Years | 867 | 21.6% |
| 35 to 44 Years | 764 | 19.1% |
| 45 to 54 Years | 672 | 16.8% |
| 55 to 64 Years | 750 | 18.7% |
| 65 to 74 Years | 625 | 15.6% |
| 75 to 84 Years | 274 | 6.8% |
| 85 Years and Over | 56 | 1.4% |
| Total | 4,008 | 100.0% |
Housing Finances in Danville
Median Income by Occupancy in Danville
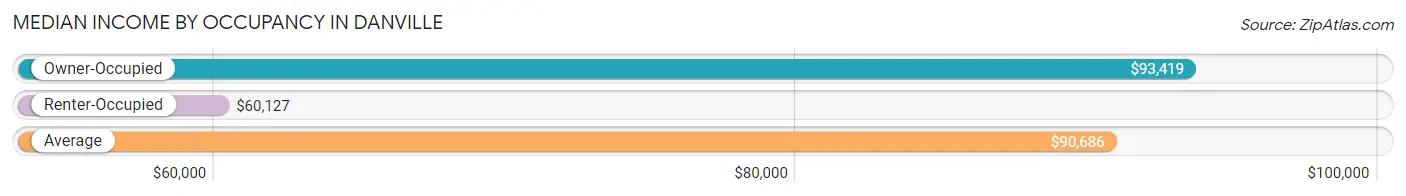
| Occupancy Type | # Households | Median Income |
| Owner-Occupied | 2,829 (70.6%) | $93,419 |
| Renter-Occupied | 1,179 (29.4%) | $60,127 |
| Average | 4,008 (100.0%) | $90,686 |
Occupancy by Householder Income Bracket in Danville
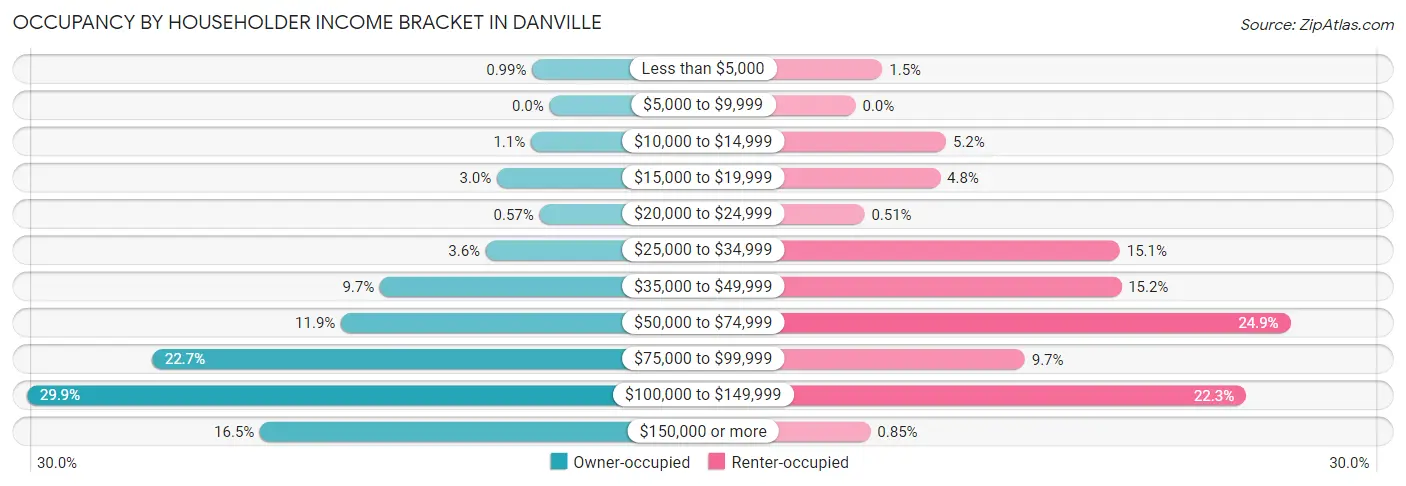
| Income Bracket | Owner-occupied | Renter-occupied |
| Less than $5,000 | 28 (1.0%) | 18 (1.5%) |
| $5,000 to $9,999 | 0 (0.0%) | 0 (0.0%) |
| $10,000 to $14,999 | 30 (1.1%) | 61 (5.2%) |
| $15,000 to $19,999 | 85 (3.0%) | 57 (4.8%) |
| $20,000 to $24,999 | 16 (0.6%) | 6 (0.5%) |
| $25,000 to $34,999 | 103 (3.6%) | 178 (15.1%) |
| $35,000 to $49,999 | 274 (9.7%) | 179 (15.2%) |
| $50,000 to $74,999 | 337 (11.9%) | 293 (24.8%) |
| $75,000 to $99,999 | 643 (22.7%) | 114 (9.7%) |
| $100,000 to $149,999 | 845 (29.9%) | 263 (22.3%) |
| $150,000 or more | 468 (16.5%) | 10 (0.9%) |
| Total | 2,829 (100.0%) | 1,179 (100.0%) |
Monthly Housing Cost Tiers in Danville
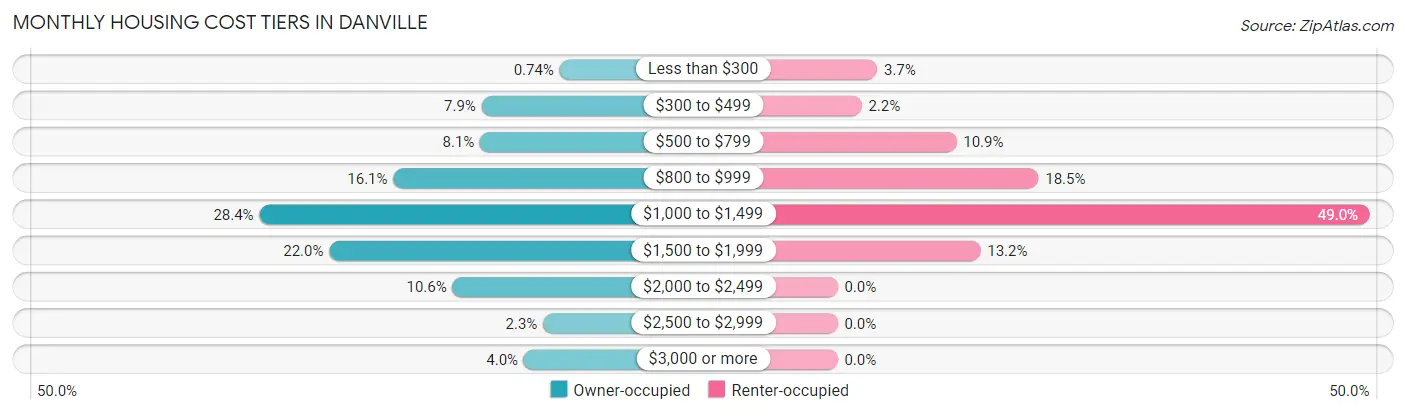
| Monthly Cost | Owner-occupied | Renter-occupied |
| Less than $300 | 21 (0.7%) | 43 (3.6%) |
| $300 to $499 | 224 (7.9%) | 26 (2.2%) |
| $500 to $799 | 228 (8.1%) | 129 (10.9%) |
| $800 to $999 | 454 (16.1%) | 218 (18.5%) |
| $1,000 to $1,499 | 803 (28.4%) | 578 (49.0%) |
| $1,500 to $1,999 | 621 (22.0%) | 155 (13.2%) |
| $2,000 to $2,499 | 300 (10.6%) | 0 (0.0%) |
| $2,500 to $2,999 | 64 (2.3%) | 0 (0.0%) |
| $3,000 or more | 114 (4.0%) | 0 (0.0%) |
| Total | 2,829 (100.0%) | 1,179 (100.0%) |
Physical Housing Characteristics in Danville
Housing Structures in Danville
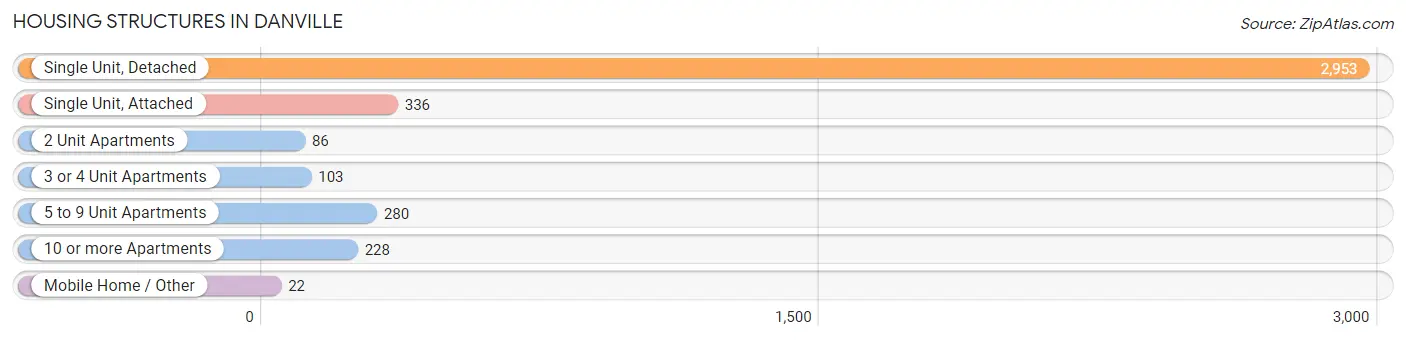
| Structure Type | # Housing Units | % Housing Units |
| Single Unit, Detached | 2,953 | 73.7% |
| Single Unit, Attached | 336 | 8.4% |
| 2 Unit Apartments | 86 | 2.1% |
| 3 or 4 Unit Apartments | 103 | 2.6% |
| 5 to 9 Unit Apartments | 280 | 7.0% |
| 10 or more Apartments | 228 | 5.7% |
| Mobile Home / Other | 22 | 0.5% |
| Total | 4,008 | 100.0% |
Housing Structures by Occupancy in Danville
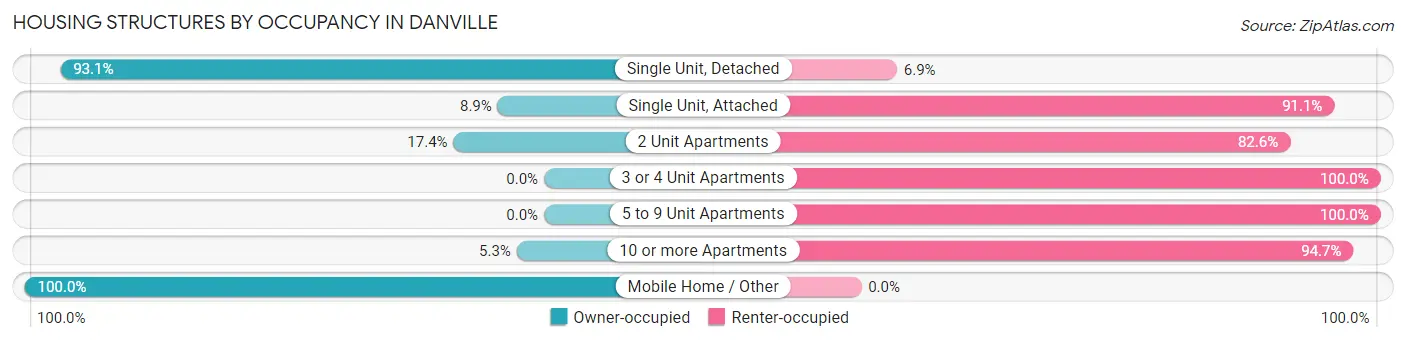
| Structure Type | Owner-occupied | Renter-occupied |
| Single Unit, Detached | 2,750 (93.1%) | 203 (6.9%) |
| Single Unit, Attached | 30 (8.9%) | 306 (91.1%) |
| 2 Unit Apartments | 15 (17.4%) | 71 (82.6%) |
| 3 or 4 Unit Apartments | 0 (0.0%) | 103 (100.0%) |
| 5 to 9 Unit Apartments | 0 (0.0%) | 280 (100.0%) |
| 10 or more Apartments | 12 (5.3%) | 216 (94.7%) |
| Mobile Home / Other | 22 (100.0%) | 0 (0.0%) |
| Total | 2,829 (70.6%) | 1,179 (29.4%) |
Housing Structures by Number of Rooms in Danville
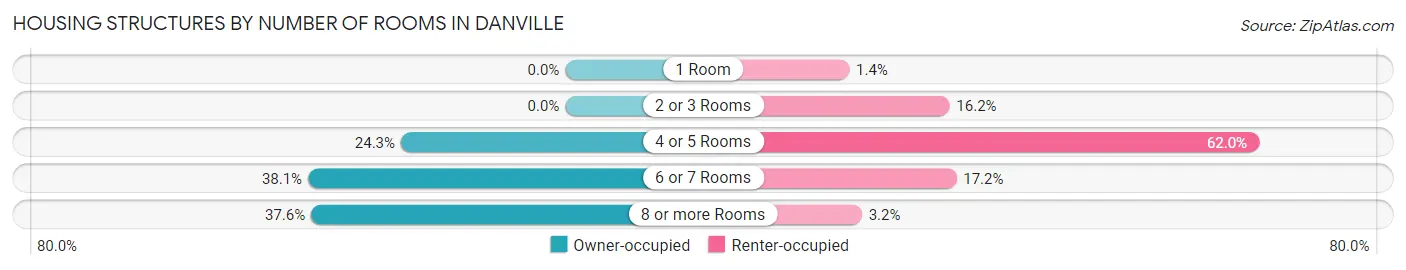
| Number of Rooms | Owner-occupied | Renter-occupied |
| 1 Room | 0 (0.0%) | 16 (1.4%) |
| 2 or 3 Rooms | 0 (0.0%) | 191 (16.2%) |
| 4 or 5 Rooms | 688 (24.3%) | 731 (62.0%) |
| 6 or 7 Rooms | 1,077 (38.1%) | 203 (17.2%) |
| 8 or more Rooms | 1,064 (37.6%) | 38 (3.2%) |
| Total | 2,829 (100.0%) | 1,179 (100.0%) |
Housing Structure by Heating Type in Danville
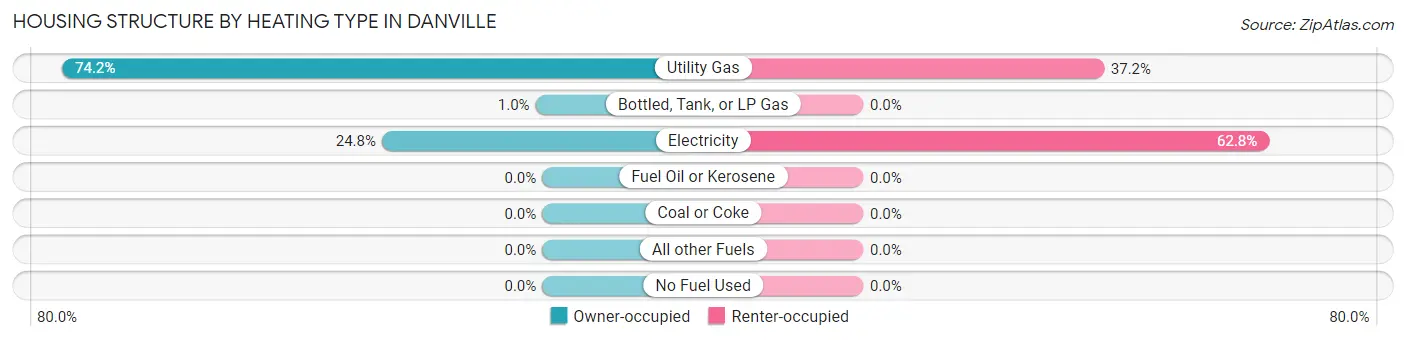
| Heating Type | Owner-occupied | Renter-occupied |
| Utility Gas | 2,099 (74.2%) | 439 (37.2%) |
| Bottled, Tank, or LP Gas | 29 (1.0%) | 0 (0.0%) |
| Electricity | 701 (24.8%) | 740 (62.8%) |
| Fuel Oil or Kerosene | 0 (0.0%) | 0 (0.0%) |
| Coal or Coke | 0 (0.0%) | 0 (0.0%) |
| All other Fuels | 0 (0.0%) | 0 (0.0%) |
| No Fuel Used | 0 (0.0%) | 0 (0.0%) |
| Total | 2,829 (100.0%) | 1,179 (100.0%) |
Household Vehicle Usage in Danville
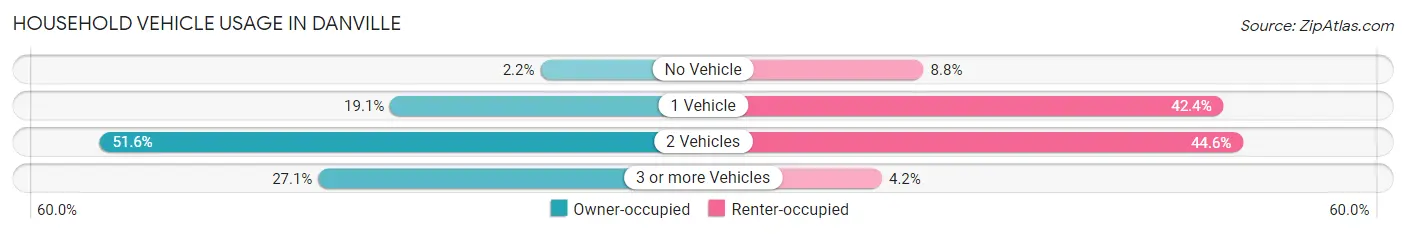
| Vehicles per Household | Owner-occupied | Renter-occupied |
| No Vehicle | 63 (2.2%) | 104 (8.8%) |
| 1 Vehicle | 539 (19.1%) | 500 (42.4%) |
| 2 Vehicles | 1,460 (51.6%) | 526 (44.6%) |
| 3 or more Vehicles | 767 (27.1%) | 49 (4.2%) |
| Total | 2,829 (100.0%) | 1,179 (100.0%) |
Real Estate & Mortgages in Danville
Real Estate and Mortgage Overview in Danville
| Characteristic | Without Mortgage | With Mortgage |
| Housing Units | 699 | 2,130 |
| Median Property Value | $305,400 | $208,900 |
| Median Household Income | $90,249 | $455 |
| Monthly Housing Costs | $758 | $114 |
| Real Estate Taxes | $2,792 | $35 |
Property Value by Mortgage Status in Danville
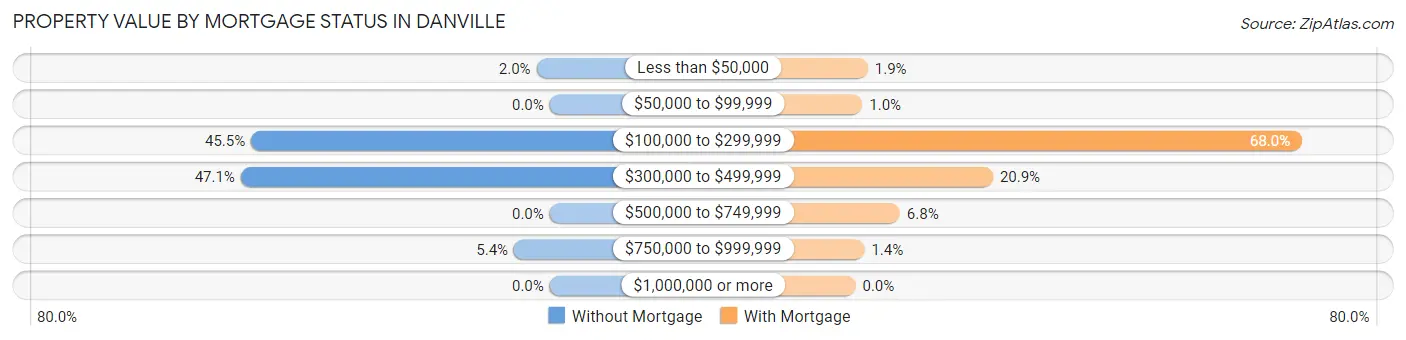
| Property Value | Without Mortgage | With Mortgage |
| Less than $50,000 | 14 (2.0%) | 40 (1.9%) |
| $50,000 to $99,999 | 0 (0.0%) | 22 (1.0%) |
| $100,000 to $299,999 | 318 (45.5%) | 1,449 (68.0%) |
| $300,000 to $499,999 | 329 (47.1%) | 446 (20.9%) |
| $500,000 to $749,999 | 0 (0.0%) | 144 (6.8%) |
| $750,000 to $999,999 | 38 (5.4%) | 29 (1.4%) |
| $1,000,000 or more | 0 (0.0%) | 0 (0.0%) |
| Total | 699 (100.0%) | 2,130 (100.0%) |
Household Income by Mortgage Status in Danville
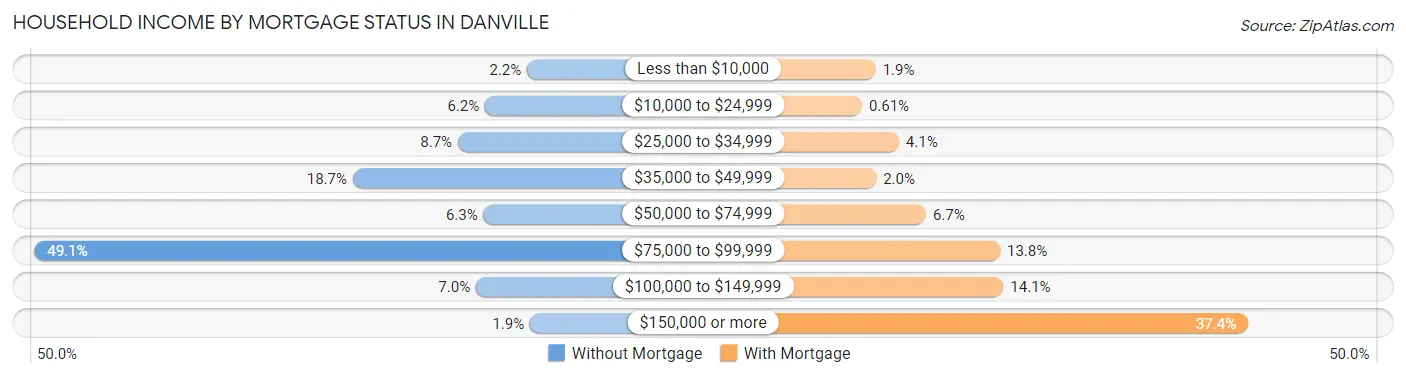
| Household Income | Without Mortgage | With Mortgage |
| Less than $10,000 | 15 (2.1%) | 41 (1.9%) |
| $10,000 to $24,999 | 43 (6.1%) | 13 (0.6%) |
| $25,000 to $34,999 | 61 (8.7%) | 88 (4.1%) |
| $35,000 to $49,999 | 131 (18.7%) | 42 (2.0%) |
| $50,000 to $74,999 | 44 (6.3%) | 143 (6.7%) |
| $75,000 to $99,999 | 343 (49.1%) | 293 (13.8%) |
| $100,000 to $149,999 | 49 (7.0%) | 300 (14.1%) |
| $150,000 or more | 13 (1.9%) | 796 (37.4%) |
| Total | 699 (100.0%) | 2,130 (100.0%) |
Property Value to Household Income Ratio in Danville
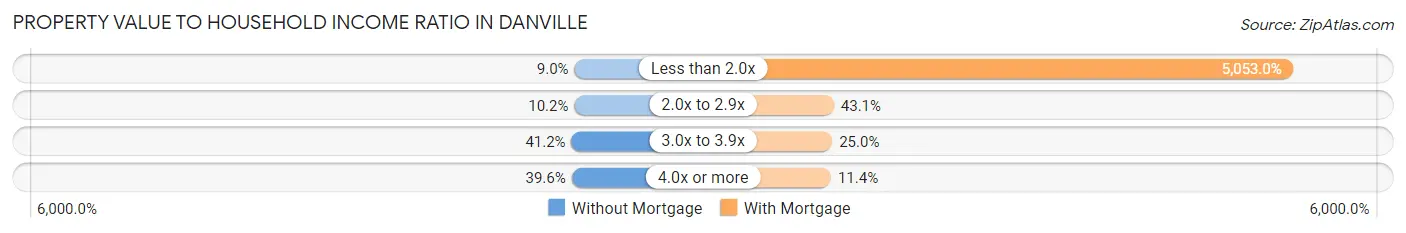
| Value-to-Income Ratio | Without Mortgage | With Mortgage |
| Less than 2.0x | 63 (9.0%) | 107,628 (5,053.0%) |
| 2.0x to 2.9x | 71 (10.2%) | 917 (43.0%) |
| 3.0x to 3.9x | 288 (41.2%) | 532 (25.0%) |
| 4.0x or more | 277 (39.6%) | 242 (11.4%) |
| Total | 699 (100.0%) | 2,130 (100.0%) |
Real Estate Taxes by Mortgage Status in Danville
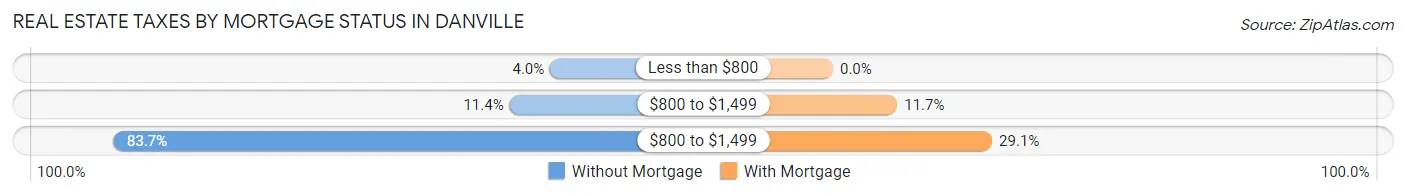
| Property Taxes | Without Mortgage | With Mortgage |
| Less than $800 | 28 (4.0%) | 0 (0.0%) |
| $800 to $1,499 | 80 (11.4%) | 250 (11.7%) |
| $800 to $1,499 | 585 (83.7%) | 619 (29.1%) |
| Total | 699 (100.0%) | 2,130 (100.0%) |
Health & Disability in Danville
Health Insurance Coverage by Age in Danville
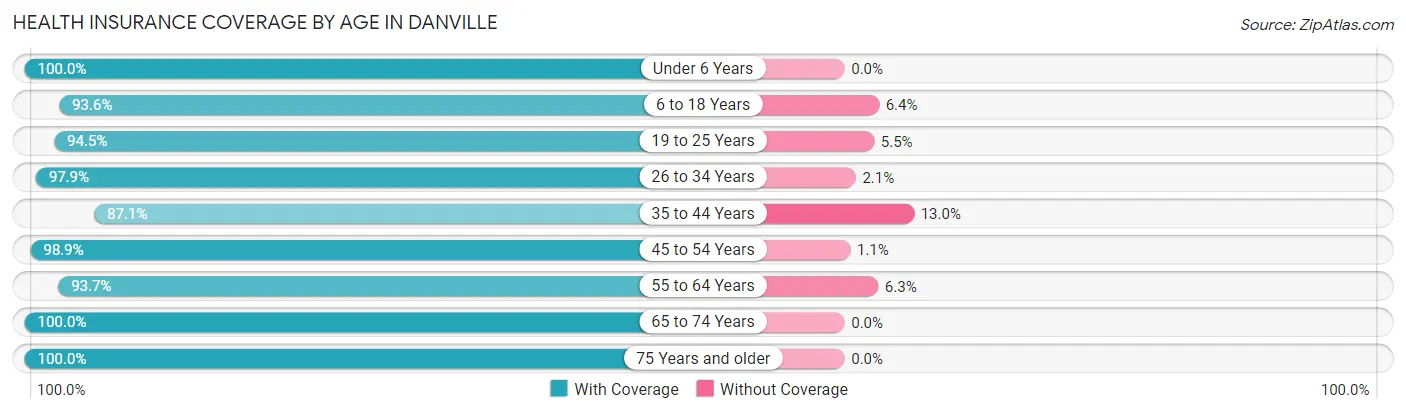
| Age Bracket | With Coverage | Without Coverage |
| Under 6 Years | 879 (100.0%) | 0 (0.0%) |
| 6 to 18 Years | 2,055 (93.6%) | 141 (6.4%) |
| 19 to 25 Years | 857 (94.5%) | 50 (5.5%) |
| 26 to 34 Years | 1,266 (97.9%) | 27 (2.1%) |
| 35 to 44 Years | 1,270 (87.1%) | 189 (13.0%) |
| 45 to 54 Years | 1,474 (98.9%) | 16 (1.1%) |
| 55 to 64 Years | 986 (93.7%) | 66 (6.3%) |
| 65 to 74 Years | 1,000 (100.0%) | 0 (0.0%) |
| 75 Years and older | 448 (100.0%) | 0 (0.0%) |
| Total | 10,235 (95.4%) | 489 (4.6%) |
Health Insurance Coverage by Citizenship Status in Danville
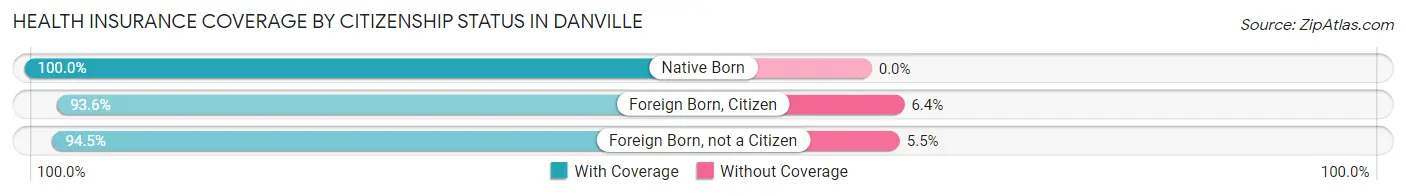
| Citizenship Status | With Coverage | Without Coverage |
| Native Born | 879 (100.0%) | 0 (0.0%) |
| Foreign Born, Citizen | 2,055 (93.6%) | 141 (6.4%) |
| Foreign Born, not a Citizen | 857 (94.5%) | 50 (5.5%) |
Health Insurance Coverage by Household Income in Danville
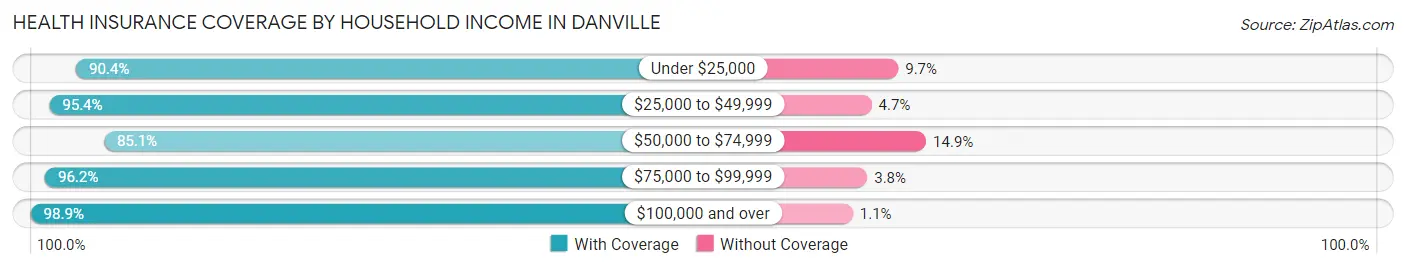
| Household Income | With Coverage | Without Coverage |
| Under $25,000 | 337 (90.3%) | 36 (9.7%) |
| $25,000 to $49,999 | 1,168 (95.4%) | 57 (4.6%) |
| $50,000 to $74,999 | 1,500 (85.1%) | 262 (14.9%) |
| $75,000 to $99,999 | 1,777 (96.2%) | 71 (3.8%) |
| $100,000 and over | 5,442 (98.9%) | 63 (1.1%) |
Public vs Private Health Insurance Coverage by Age in Danville
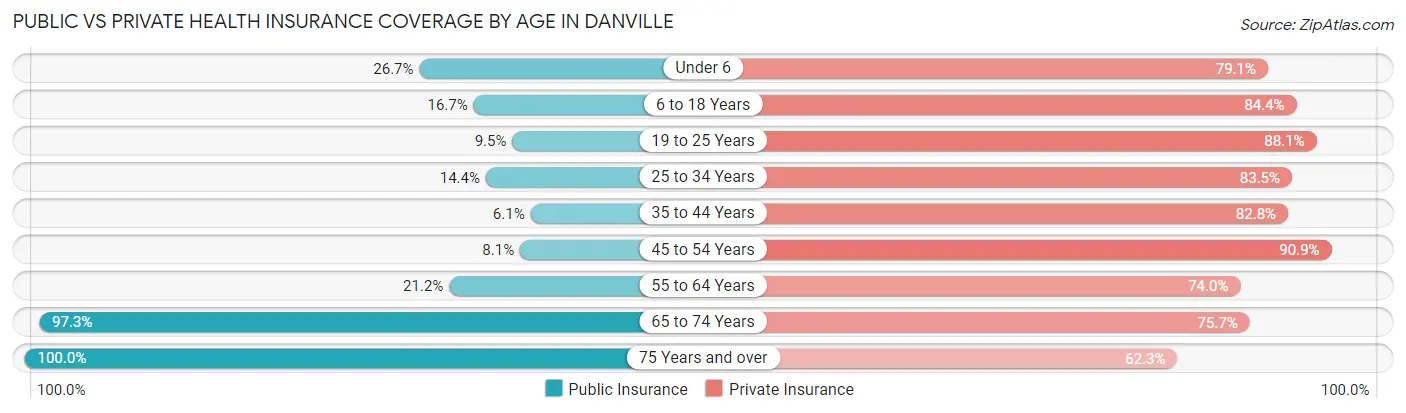
| Age Bracket | Public Insurance | Private Insurance |
| Under 6 | 235 (26.7%) | 695 (79.1%) |
| 6 to 18 Years | 366 (16.7%) | 1,853 (84.4%) |
| 19 to 25 Years | 86 (9.5%) | 799 (88.1%) |
| 25 to 34 Years | 186 (14.4%) | 1,080 (83.5%) |
| 35 to 44 Years | 89 (6.1%) | 1,208 (82.8%) |
| 45 to 54 Years | 120 (8.1%) | 1,354 (90.9%) |
| 55 to 64 Years | 223 (21.2%) | 778 (74.0%) |
| 65 to 74 Years | 973 (97.3%) | 757 (75.7%) |
| 75 Years and over | 448 (100.0%) | 279 (62.3%) |
| Total | 2,726 (25.4%) | 8,803 (82.1%) |
Disability Status by Sex by Age in Danville
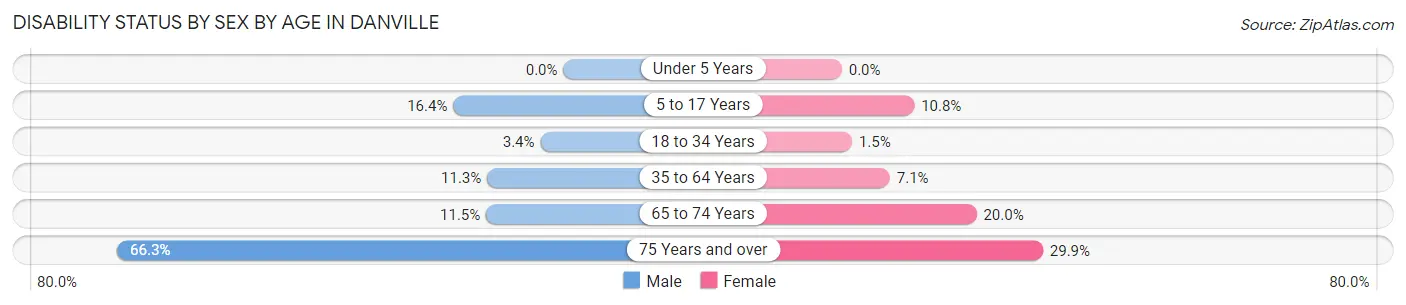
| Age Bracket | Male | Female |
| Under 5 Years | 0 (0.0%) | 0 (0.0%) |
| 5 to 17 Years | 187 (16.4%) | 121 (10.7%) |
| 18 to 34 Years | 42 (3.4%) | 17 (1.5%) |
| 35 to 64 Years | 231 (11.3%) | 140 (7.1%) |
| 65 to 74 Years | 43 (11.5%) | 125 (20.0%) |
| 75 Years and over | 106 (66.2%) | 86 (29.9%) |
Disability Class by Sex by Age in Danville
Disability Class: Hearing Difficulty
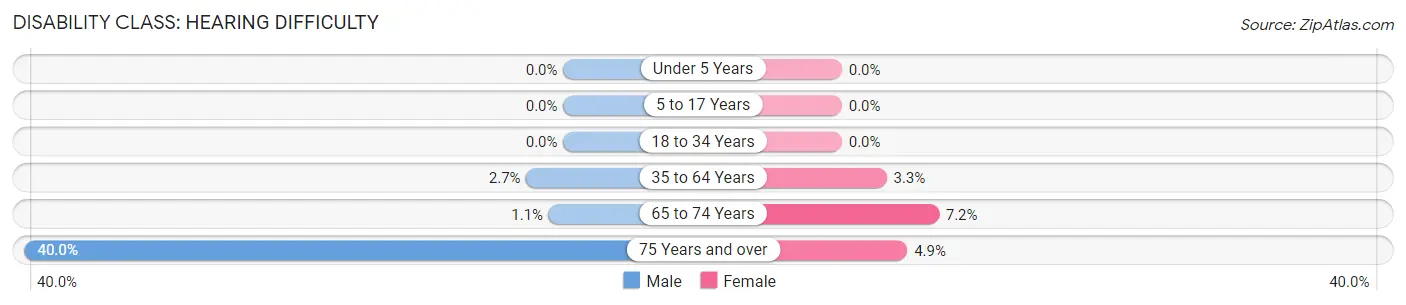
| Age Bracket | Male | Female |
| Under 5 Years | 0 (0.0%) | 0 (0.0%) |
| 5 to 17 Years | 0 (0.0%) | 0 (0.0%) |
| 18 to 34 Years | 0 (0.0%) | 0 (0.0%) |
| 35 to 64 Years | 56 (2.7%) | 65 (3.3%) |
| 65 to 74 Years | 4 (1.1%) | 45 (7.2%) |
| 75 Years and over | 64 (40.0%) | 14 (4.9%) |
Disability Class: Vision Difficulty
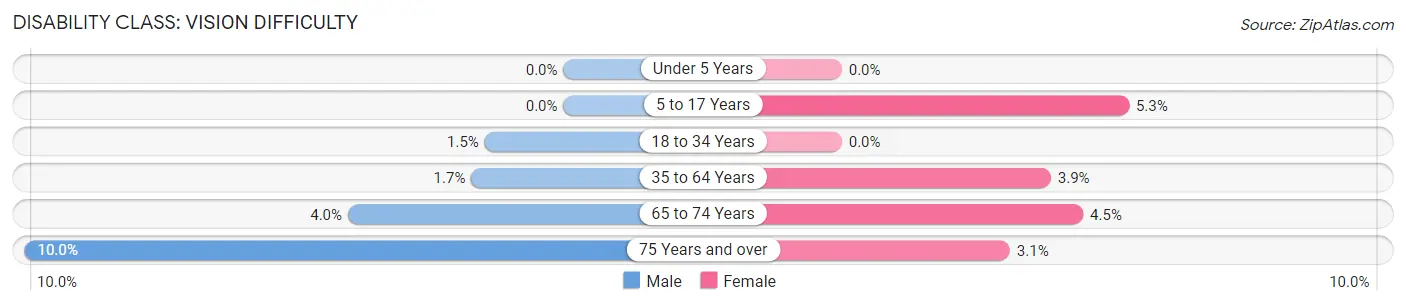
| Age Bracket | Male | Female |
| Under 5 Years | 0 (0.0%) | 0 (0.0%) |
| 5 to 17 Years | 0 (0.0%) | 60 (5.3%) |
| 18 to 34 Years | 18 (1.5%) | 0 (0.0%) |
| 35 to 64 Years | 35 (1.7%) | 76 (3.9%) |
| 65 to 74 Years | 15 (4.0%) | 28 (4.5%) |
| 75 Years and over | 16 (10.0%) | 9 (3.1%) |
Disability Class: Cognitive Difficulty
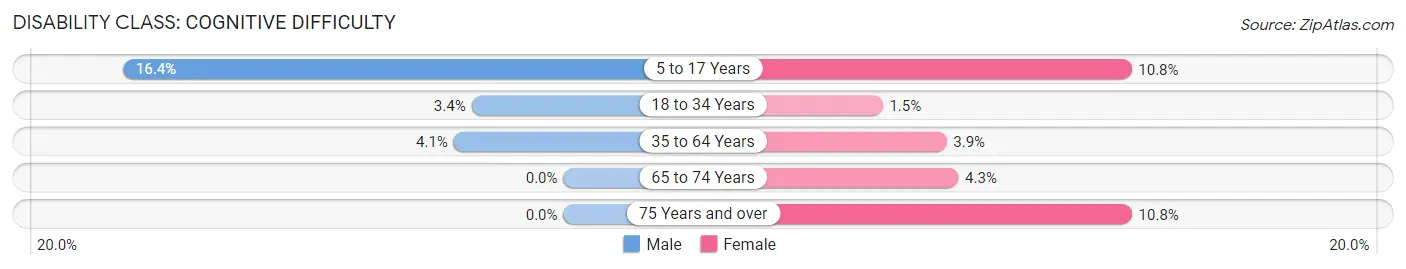
| Age Bracket | Male | Female |
| 5 to 17 Years | 187 (16.4%) | 121 (10.7%) |
| 18 to 34 Years | 42 (3.4%) | 17 (1.5%) |
| 35 to 64 Years | 83 (4.1%) | 76 (3.9%) |
| 65 to 74 Years | 0 (0.0%) | 27 (4.3%) |
| 75 Years and over | 0 (0.0%) | 31 (10.8%) |
Disability Class: Ambulatory Difficulty
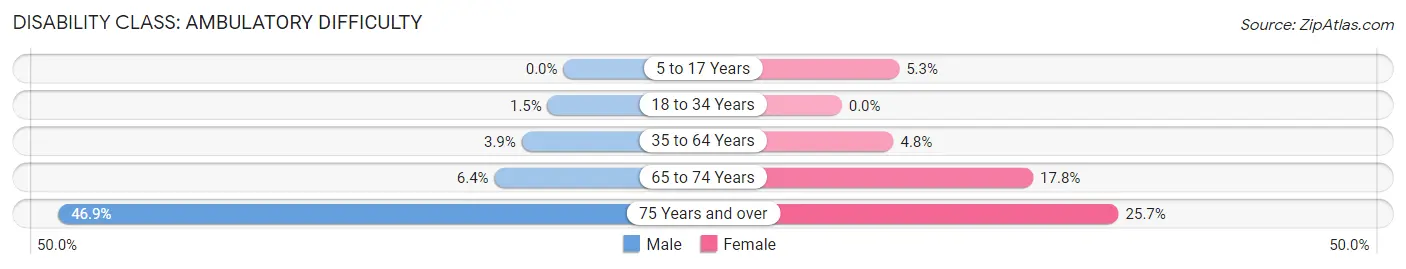
| Age Bracket | Male | Female |
| 5 to 17 Years | 0 (0.0%) | 60 (5.3%) |
| 18 to 34 Years | 18 (1.5%) | 0 (0.0%) |
| 35 to 64 Years | 79 (3.9%) | 94 (4.8%) |
| 65 to 74 Years | 24 (6.4%) | 111 (17.8%) |
| 75 Years and over | 75 (46.9%) | 74 (25.7%) |
Disability Class: Self-Care Difficulty
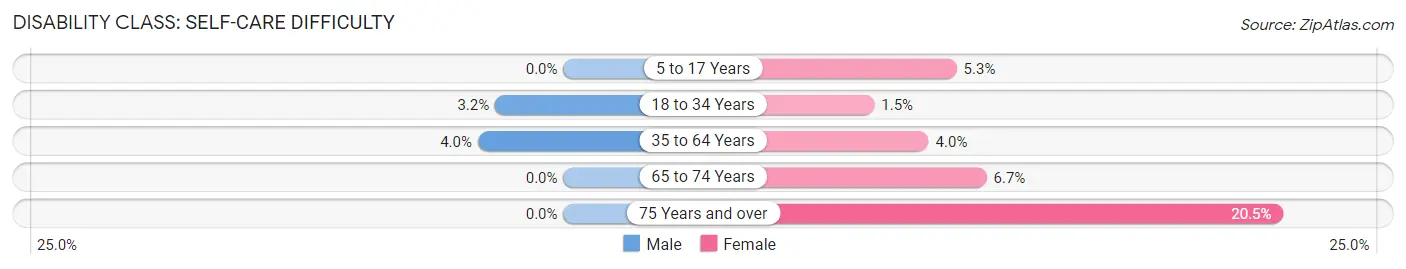
| Age Bracket | Male | Female |
| 5 to 17 Years | 0 (0.0%) | 60 (5.3%) |
| 18 to 34 Years | 39 (3.2%) | 17 (1.5%) |
| 35 to 64 Years | 81 (4.0%) | 79 (4.0%) |
| 65 to 74 Years | 0 (0.0%) | 42 (6.7%) |
| 75 Years and over | 0 (0.0%) | 59 (20.5%) |
Technology Access in Danville
Computing Device Access in Danville
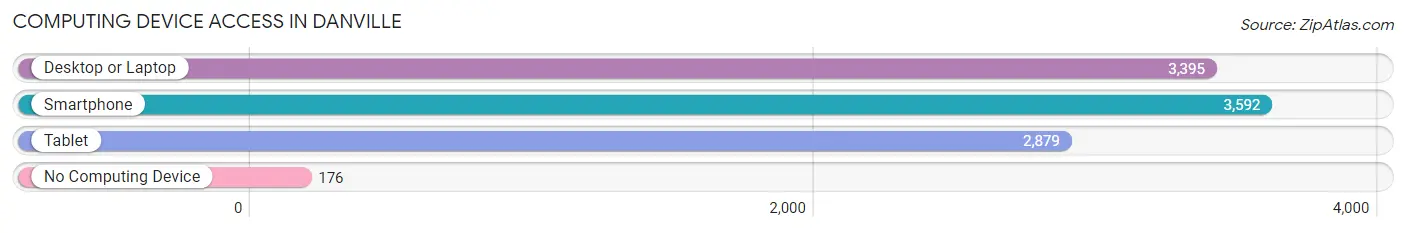
| Device Type | # Households | % Households |
| Desktop or Laptop | 3,395 | 84.7% |
| Smartphone | 3,592 | 89.6% |
| Tablet | 2,879 | 71.8% |
| No Computing Device | 176 | 4.4% |
| Total | 4,008 | 100.0% |
Internet Access in Danville
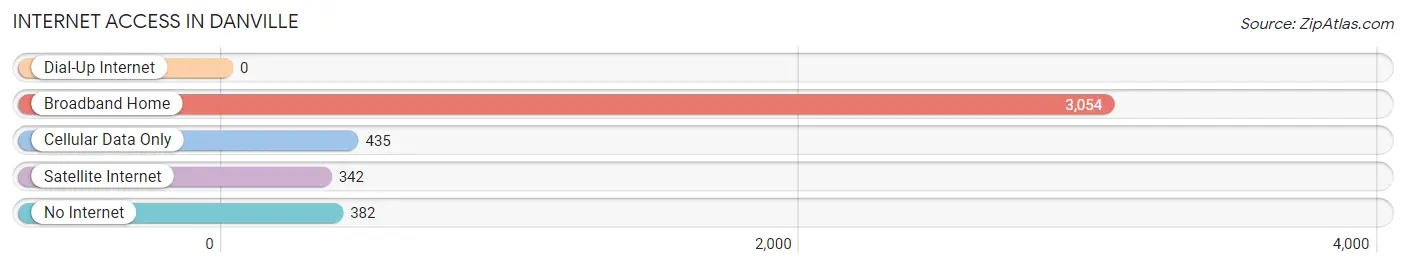
| Internet Type | # Households | % Households |
| Dial-Up Internet | 0 | 0.0% |
| Broadband Home | 3,054 | 76.2% |
| Cellular Data Only | 435 | 10.8% |
| Satellite Internet | 342 | 8.5% |
| No Internet | 382 | 9.5% |
| Total | 4,008 | 100.0% |
Danville Summary
Danville, Indiana is a small town located in Hendricks County, Indiana. It is situated in the western part of the state, about 25 miles west of Indianapolis. The town has a population of approximately 8,000 people and is part of the Indianapolis metropolitan area.
History
The area that is now Danville was first settled in 1824 by a group of Quakers from North Carolina. The town was originally called New Burlington, but was later renamed Danville in 1827 after Daniel Lane, a local Quaker leader. The town was officially incorporated in 1837.
In the late 19th century, Danville was a major center for the production of woolen goods. The town was home to several woolen mills, which employed hundreds of people. The town also had a thriving agricultural industry, with many farmers growing corn, wheat, and other crops.
In the early 20th century, Danville experienced a period of growth and prosperity. The town was home to several factories, including a glass factory, a canning factory, and a furniture factory. The town also had a thriving business district, with several stores and restaurants.
Geography
Danville is located in the western part of Hendricks County, Indiana. The town is situated on the banks of the White River, which flows through the town. The town is surrounded by rolling hills and farmland. The town is located about 25 miles west of Indianapolis.
Economy
The economy of Danville is largely based on agriculture and manufacturing. The town is home to several factories, including a glass factory, a canning factory, and a furniture factory. The town also has a thriving business district, with several stores and restaurants.
The town is also home to several educational institutions, including Danville Community College and Ivy Tech Community College. The town is also home to several medical facilities, including Hendricks Regional Health and Hendricks County Hospital.
Demographics
As of the 2010 census, the population of Danville was 8,068. The racial makeup of the town was 94.3% White, 1.3% African American, 0.3% Native American, 0.7% Asian, 0.1% Pacific Islander, 1.2% from other races, and 2.3% from two or more races. Hispanic or Latino of any race were 3.2% of the population.
The median household income in Danville was $45,945, and the median family income was $54,945. The per capita income in Danville was $21,945. About 8.3% of families and 10.3% of the population were below the poverty line, including 14.3% of those under age 18 and 6.3% of those age 65 or over.
Common Questions
What is Per Capita Income in Danville?
Per Capita income in Danville is $36,335.
What is the Median Family Income in Danville?
Median Family Income in Danville is $101,288.
What is the Median Household income in Danville?
Median Household Income in Danville is $90,686.
What is Income or Wage Gap in Danville?
Income or Wage Gap in Danville is 26.1%.
Women in Danville earn 73.9 cents for every dollar earned by a man.
What is Inequality or Gini Index in Danville?
Inequality or Gini Index in Danville is 0.37.
What is the Total Population of Danville?
Total Population of Danville is 10,842.
What is the Total Male Population of Danville?
Total Male Population of Danville is 5,256.
What is the Total Female Population of Danville?
Total Female Population of Danville is 5,586.
What is the Ratio of Males per 100 Females in Danville?
There are 94.09 Males per 100 Females in Danville.
What is the Ratio of Females per 100 Males in Danville?
There are 106.28 Females per 100 Males in Danville.
What is the Median Population Age in Danville?
Median Population Age in Danville is 35.8 Years.
What is the Average Family Size in Danville
Average Family Size in Danville is 3.2 People.
What is the Average Household Size in Danville
Average Household Size in Danville is 2.7 People.
How Large is the Labor Force in Danville?
There are 5,812 People in the Labor Forcein in Danville.
What is the Percentage of People in the Labor Force in Danville?
71.8% of People are in the Labor Force in Danville.
What is the Unemployment Rate in Danville?
Unemployment Rate in Danville is 1.5%.