Culver, IN Map & Demographics
Culver Map
Culver Overview
$38,345
PER CAPITA INCOME
$76,000
AVG FAMILY INCOME
$40,556
AVG HOUSEHOLD INCOME
24.5%
WAGE / INCOME GAP [ % ]
75.5¢/ $1
WAGE / INCOME GAP [ $ ]
$13,501
FAMILY INCOME DEFICIT
0.57
INEQUALITY / GINI INDEX
1,230
TOTAL POPULATION
579
MALE POPULATION
651
FEMALE POPULATION
88.94
MALES / 100 FEMALES
112.44
FEMALES / 100 MALES
56.9
MEDIAN AGE
2.5
AVG FAMILY SIZE
2.0
AVG HOUSEHOLD SIZE
494
LABOR FORCE [ PEOPLE ]
44.6%
PERCENT IN LABOR FORCE
6.9%
UNEMPLOYMENT RATE
Culver Zip Codes
Culver Area Codes
Income in Culver
Income Overview in Culver
Per Capita Income in Culver is $38,345, while median incomes of families and households are $76,000 and $40,556 respectively.
| Characteristic | Number | Measure |
| Per Capita Income | 1,230 | $38,345 |
| Median Family Income | 358 | $76,000 |
| Mean Family Income | 358 | $91,220 |
| Median Household Income | 592 | $40,556 |
| Mean Household Income | 592 | $76,773 |
| Income Deficit | 358 | $13,501 |
| Wage / Income Gap (%) | 1,230 | 24.48% |
| Wage / Income Gap ($) | 1,230 | 75.52¢ per $1 |
| Gini / Inequality Index | 1,230 | 0.57 |
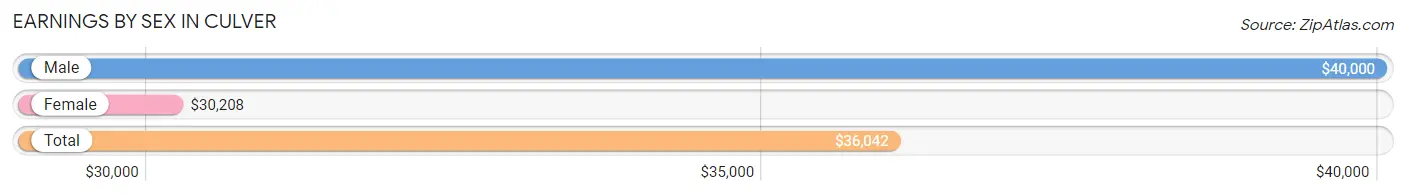
Earnings by Sex in Culver
Average Earnings in Culver are $36,042, $40,000 for men and $30,208 for women, a difference of 24.5%.
| Sex | Number | Average Earnings |
| Male | 306 (57.2%) | $40,000 |
| Female | 229 (42.8%) | $30,208 |
| Total | 535 (100.0%) | $36,042 |
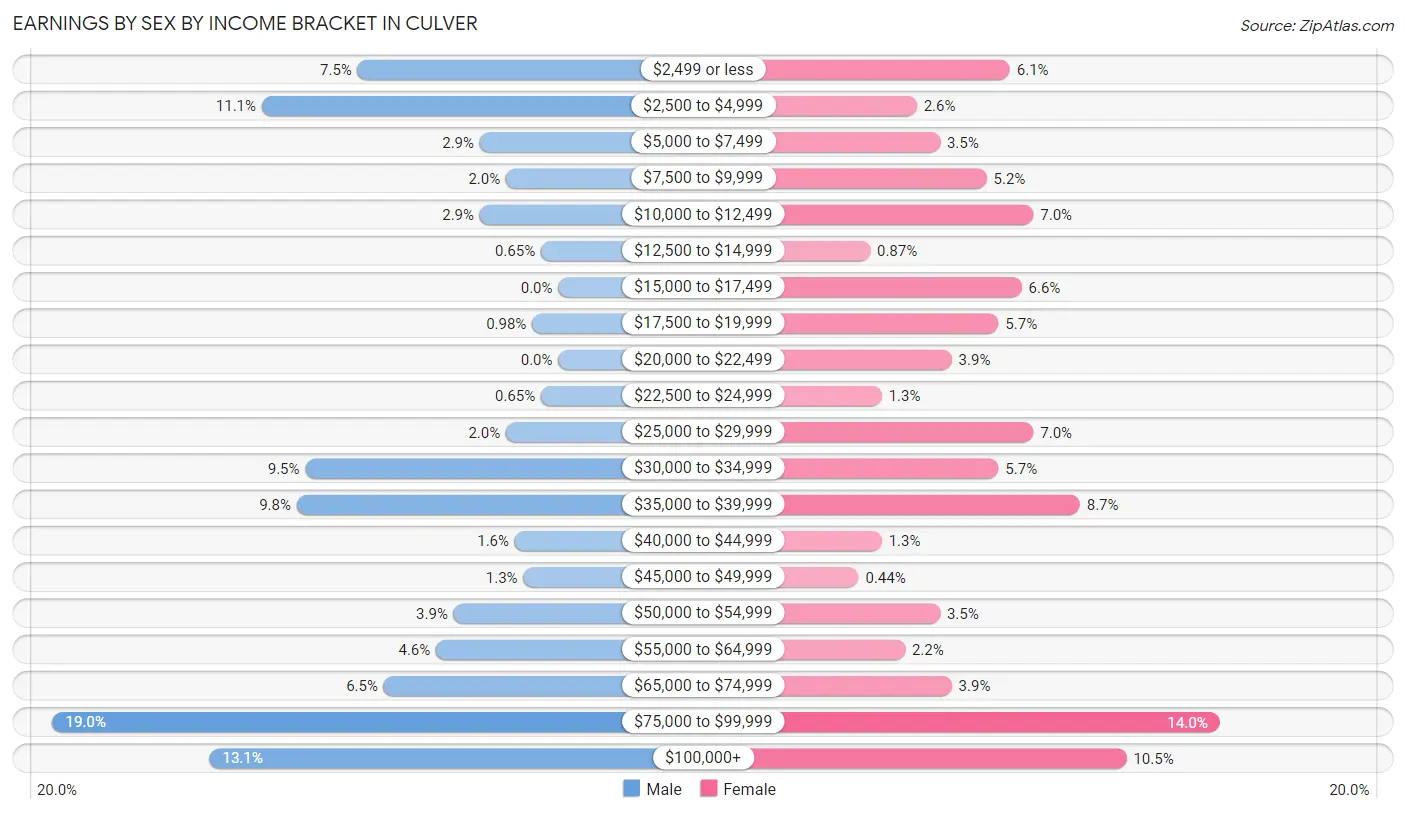
Earnings by Sex by Income Bracket in Culver
The most common earnings brackets in Culver are $75,000 to $99,999 for men (58 | 19.0%) and $75,000 to $99,999 for women (32 | 14.0%).
| Income | Male | Female |
| $2,499 or less | 23 (7.5%) | 14 (6.1%) |
| $2,500 to $4,999 | 34 (11.1%) | 6 (2.6%) |
| $5,000 to $7,499 | 9 (2.9%) | 8 (3.5%) |
| $7,500 to $9,999 | 6 (2.0%) | 12 (5.2%) |
| $10,000 to $12,499 | 9 (2.9%) | 16 (7.0%) |
| $12,500 to $14,999 | 2 (0.6%) | 2 (0.9%) |
| $15,000 to $17,499 | 0 (0.0%) | 15 (6.6%) |
| $17,500 to $19,999 | 3 (1.0%) | 13 (5.7%) |
| $20,000 to $22,499 | 0 (0.0%) | 9 (3.9%) |
| $22,500 to $24,999 | 2 (0.6%) | 3 (1.3%) |
| $25,000 to $29,999 | 6 (2.0%) | 16 (7.0%) |
| $30,000 to $34,999 | 29 (9.5%) | 13 (5.7%) |
| $35,000 to $39,999 | 30 (9.8%) | 20 (8.7%) |
| $40,000 to $44,999 | 5 (1.6%) | 3 (1.3%) |
| $45,000 to $49,999 | 4 (1.3%) | 1 (0.4%) |
| $50,000 to $54,999 | 12 (3.9%) | 8 (3.5%) |
| $55,000 to $64,999 | 14 (4.6%) | 5 (2.2%) |
| $65,000 to $74,999 | 20 (6.5%) | 9 (3.9%) |
| $75,000 to $99,999 | 58 (19.0%) | 32 (14.0%) |
| $100,000+ | 40 (13.1%) | 24 (10.5%) |
| Total | 306 (100.0%) | 229 (100.0%) |
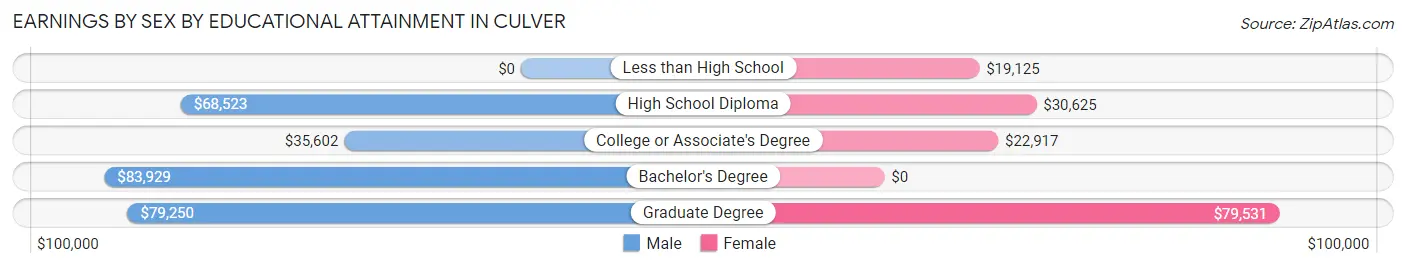
Earnings by Sex by Educational Attainment in Culver
Average earnings in Culver are $54,688 for men and $31,667 for women, a difference of 42.1%. Men with an educational attainment of bachelor's degree enjoy the highest average annual earnings of $83,929, while those with college or associate's degree education earn the least with $35,602. Women with an educational attainment of graduate degree earn the most with the average annual earnings of $79,531, while those with less than high school education have the smallest earnings of $19,125.
| Educational Attainment | Male Income | Female Income |
| Less than High School | - | - |
| High School Diploma | $68,523 | $30,625 |
| College or Associate's Degree | $35,602 | $22,917 |
| Bachelor's Degree | $83,929 | $0 |
| Graduate Degree | $79,250 | $79,531 |
| Total | $54,688 | $31,667 |
Family Income in Culver
Family Income Brackets in Culver
According to the Culver family income data, there are 67 families falling into the less than $10,000 income range, which is the most common income bracket and makes up 18.7% of all families. Conversely, the $10,000 to $14,999 income bracket is the least frequent group with only 9 families (2.5%) belonging to this category.
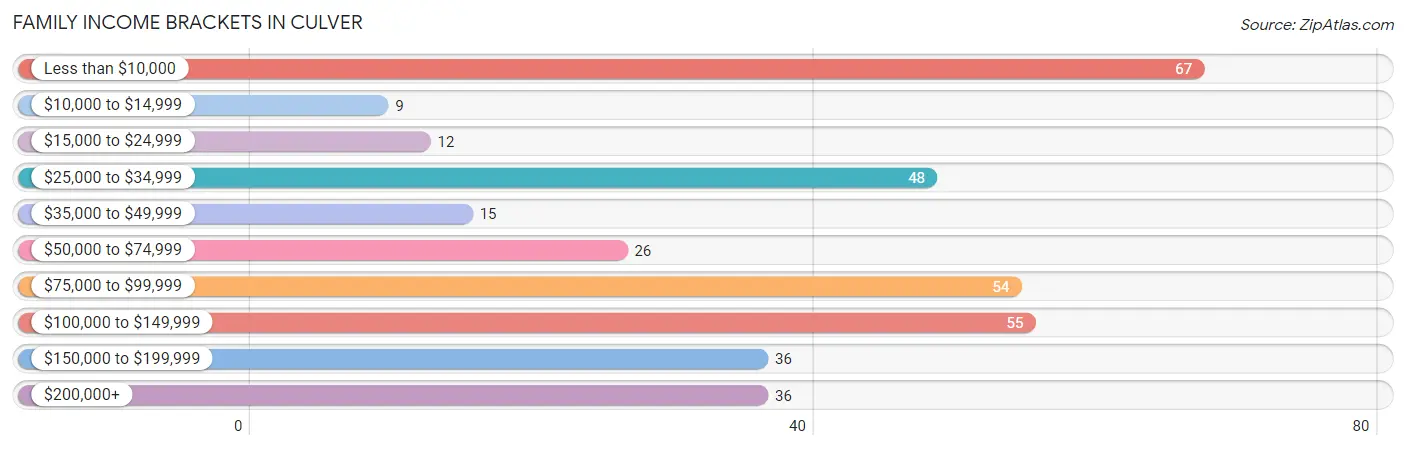
| Income Bracket | # Families | % Families |
| Less than $10,000 | 67 | 18.7% |
| $10,000 to $14,999 | 9 | 2.5% |
| $15,000 to $24,999 | 12 | 3.4% |
| $25,000 to $34,999 | 48 | 13.4% |
| $35,000 to $49,999 | 15 | 4.2% |
| $50,000 to $74,999 | 26 | 7.3% |
| $75,000 to $99,999 | 54 | 15.1% |
| $100,000 to $149,999 | 55 | 15.4% |
| $150,000 to $199,999 | 36 | 10.1% |
| $200,000+ | 36 | 10.1% |
Family Income by Famaliy Size in Culver
3-person families (29 | 8.1%) account for the highest median family income in Culver with $170,250 per family, while 3-person families (29 | 8.1%) have the highest median income of $56,750 per family member.
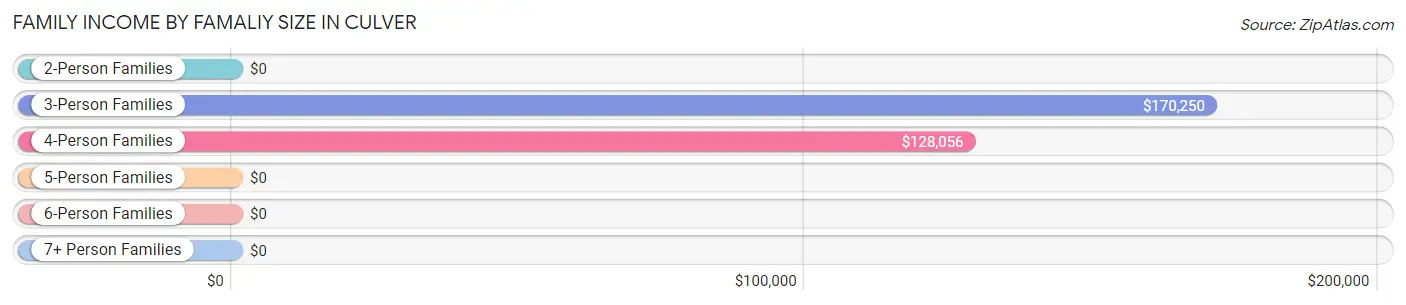
| Income Bracket | # Families | Median Income |
| 2-Person Families | 269 (75.1%) | $0 |
| 3-Person Families | 29 (8.1%) | $170,250 |
| 4-Person Families | 46 (12.9%) | $128,056 |
| 5-Person Families | 5 (1.4%) | $0 |
| 6-Person Families | 2 (0.6%) | $0 |
| 7+ Person Families | 7 (2.0%) | $0 |
| Total | 358 (100.0%) | $76,000 |
Family Income by Number of Earners in Culver
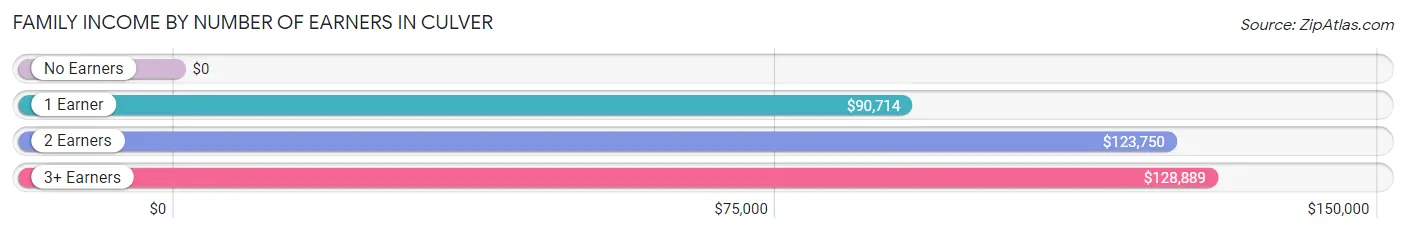
| Number of Earners | # Families | Median Income |
| No Earners | 141 (39.4%) | $0 |
| 1 Earner | 102 (28.5%) | $90,714 |
| 2 Earners | 91 (25.4%) | $123,750 |
| 3+ Earners | 24 (6.7%) | $128,889 |
| Total | 358 (100.0%) | $76,000 |
Household Income in Culver
Household Income Brackets in Culver
With 99 households falling in the category, the less than $10,000 income range is the most frequent in Culver, accounting for 16.7% of all households. In contrast, only 41 households (6.9%) fall into the $200,000+ income bracket, making it the least populous group.
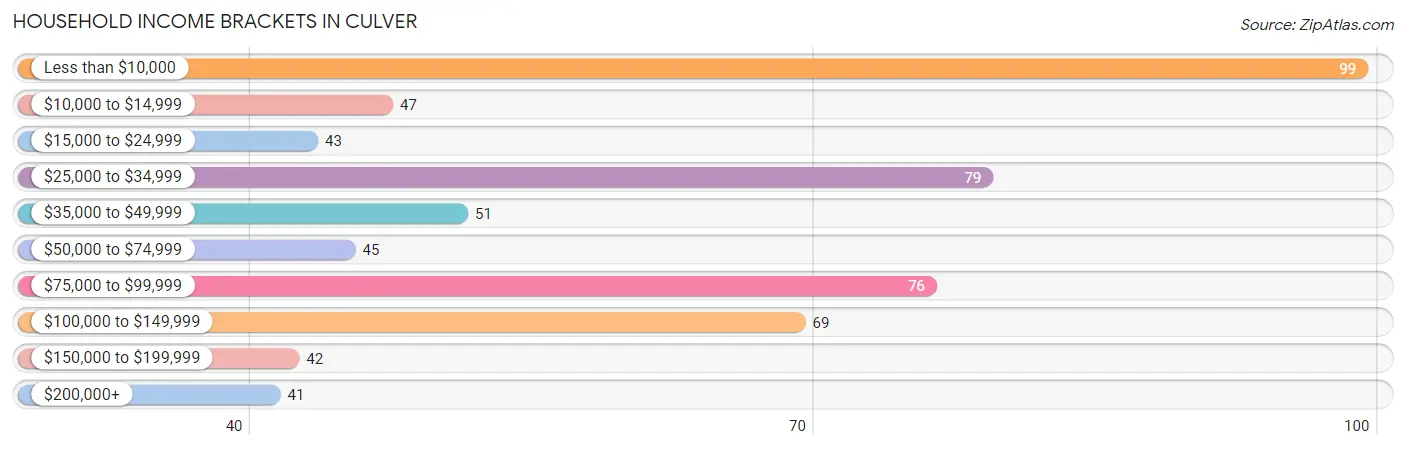
| Income Bracket | # Households | % Households |
| Less than $10,000 | 99 | 16.7% |
| $10,000 to $14,999 | 47 | 7.9% |
| $15,000 to $24,999 | 43 | 7.3% |
| $25,000 to $34,999 | 79 | 13.3% |
| $35,000 to $49,999 | 51 | 8.6% |
| $50,000 to $74,999 | 45 | 7.6% |
| $75,000 to $99,999 | 76 | 12.8% |
| $100,000 to $149,999 | 69 | 11.7% |
| $150,000 to $199,999 | 42 | 7.1% |
| $200,000+ | 41 | 6.9% |
Household Income by Householder Age in Culver
The median household income in Culver is $40,556, with the highest median household income of $94,474 found in the 45 to 64 years age bracket for the primary householder. A total of 226 households (38.2%) fall into this category. Meanwhile, the 15 to 24 years age bracket for the primary householder has the lowest median household income of $0, with 18 households (3.0%) in this group.
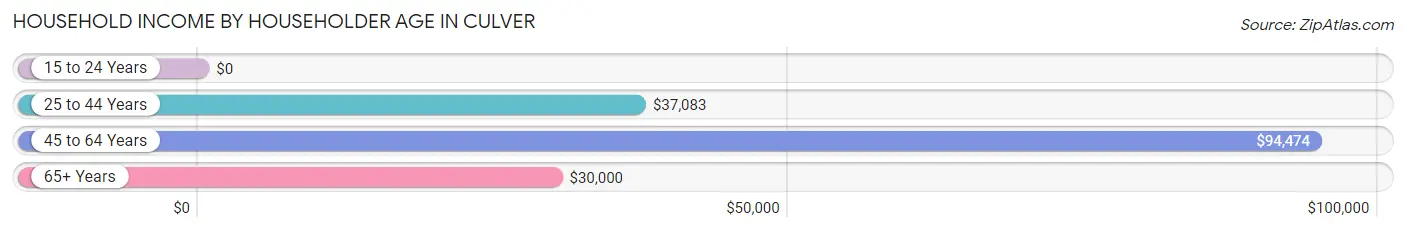
| Income Bracket | # Households | Median Income |
| 15 to 24 Years | 18 (3.0%) | $0 |
| 25 to 44 Years | 112 (18.9%) | $37,083 |
| 45 to 64 Years | 226 (38.2%) | $94,474 |
| 65+ Years | 236 (39.9%) | $30,000 |
| Total | 592 (100.0%) | $40,556 |
Poverty in Culver
Income Below Poverty by Sex and Age in Culver
With 15.4% poverty level for males and 29.8% for females among the residents of Culver, 75 year old and over males and 16 and 17 year old females are the most vulnerable to poverty, with 51 males (42.1%) and 13 females (56.5%) in their respective age groups living below the poverty level.
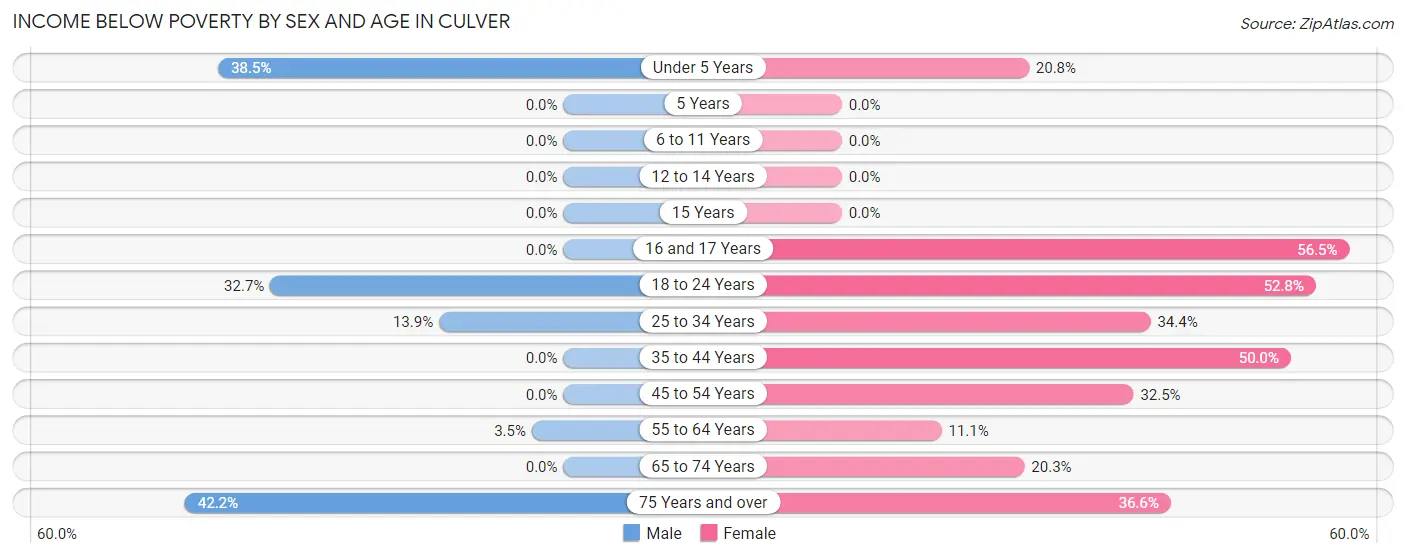
| Age Bracket | Male | Female |
| Under 5 Years | 5 (38.5%) | 5 (20.8%) |
| 5 Years | 0 (0.0%) | 0 (0.0%) |
| 6 to 11 Years | 0 (0.0%) | 0 (0.0%) |
| 12 to 14 Years | 0 (0.0%) | 0 (0.0%) |
| 15 Years | 0 (0.0%) | 0 (0.0%) |
| 16 and 17 Years | 0 (0.0%) | 13 (56.5%) |
| 18 to 24 Years | 16 (32.7%) | 19 (52.8%) |
| 25 to 34 Years | 9 (13.9%) | 11 (34.4%) |
| 35 to 44 Years | 0 (0.0%) | 20 (50.0%) |
| 45 to 54 Years | 0 (0.0%) | 38 (32.5%) |
| 55 to 64 Years | 4 (3.5%) | 12 (11.1%) |
| 65 to 74 Years | 0 (0.0%) | 12 (20.3%) |
| 75 Years and over | 51 (42.1%) | 48 (36.6%) |
| Total | 85 (15.4%) | 178 (29.8%) |
Income Above Poverty by Sex and Age in Culver
According to the poverty statistics in Culver, males aged 5 years and females aged 5 years are the age groups that are most secure financially, with 100.0% of males and 100.0% of females in these age groups living above the poverty line.
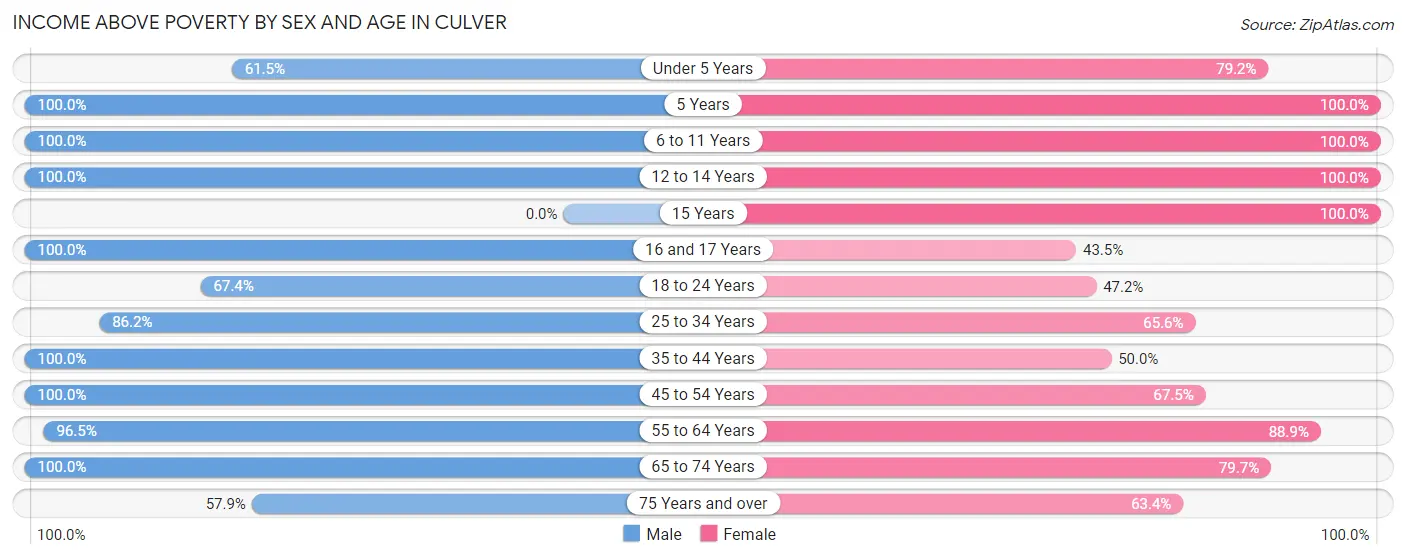
| Age Bracket | Male | Female |
| Under 5 Years | 8 (61.5%) | 19 (79.2%) |
| 5 Years | 5 (100.0%) | 5 (100.0%) |
| 6 to 11 Years | 11 (100.0%) | 6 (100.0%) |
| 12 to 14 Years | 29 (100.0%) | 11 (100.0%) |
| 15 Years | 0 (0.0%) | 6 (100.0%) |
| 16 and 17 Years | 5 (100.0%) | 10 (43.5%) |
| 18 to 24 Years | 33 (67.3%) | 17 (47.2%) |
| 25 to 34 Years | 56 (86.2%) | 21 (65.6%) |
| 35 to 44 Years | 28 (100.0%) | 20 (50.0%) |
| 45 to 54 Years | 49 (100.0%) | 79 (67.5%) |
| 55 to 64 Years | 110 (96.5%) | 96 (88.9%) |
| 65 to 74 Years | 63 (100.0%) | 47 (79.7%) |
| 75 Years and over | 70 (57.9%) | 83 (63.4%) |
| Total | 467 (84.6%) | 420 (70.2%) |
Income Below Poverty Among Married-Couple Families in Culver
The poverty statistics for married-couple families in Culver show that 17.0% or 49 of the total 289 families live below the poverty line. Families with no children have the highest poverty rate of 20.3%, comprising of 46 families. On the other hand, families with 3 or 4 children have the lowest poverty rate of 0.0%, which includes 0 families.
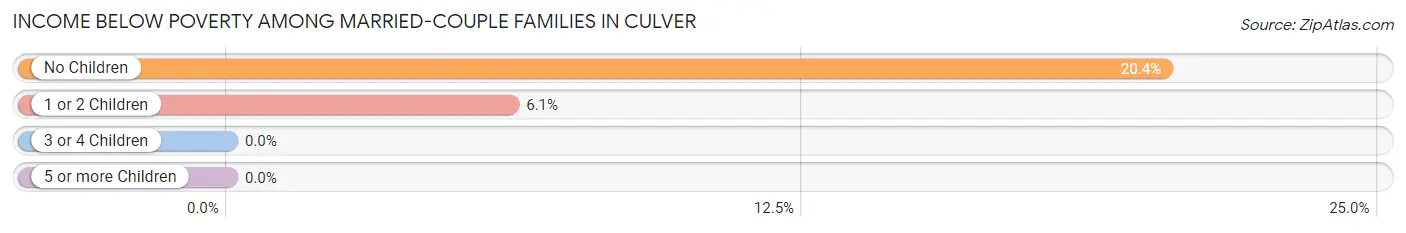
| Children | Above Poverty | Below Poverty |
| No Children | 180 (79.6%) | 46 (20.3%) |
| 1 or 2 Children | 46 (93.9%) | 3 (6.1%) |
| 3 or 4 Children | 7 (100.0%) | 0 (0.0%) |
| 5 or more Children | 7 (100.0%) | 0 (0.0%) |
| Total | 240 (83.0%) | 49 (17.0%) |
Income Below Poverty Among Single-Parent Households in Culver
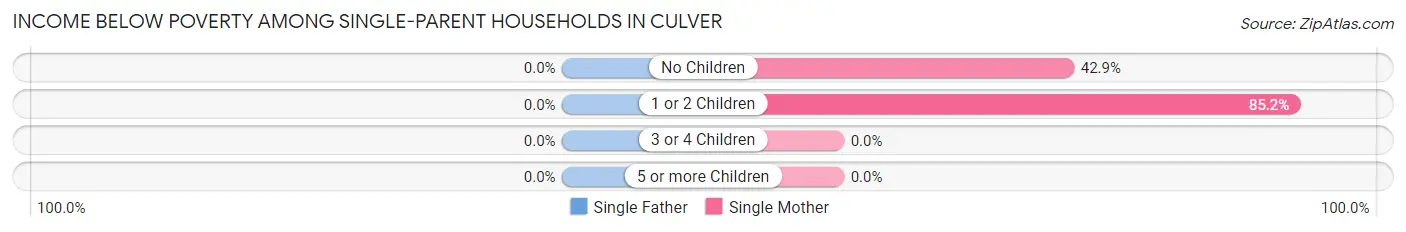
| Children | Single Father | Single Mother |
| No Children | 0 (0.0%) | 15 (42.9%) |
| 1 or 2 Children | 0 (0.0%) | 23 (85.2%) |
| 3 or 4 Children | 0 (0.0%) | 0 (0.0%) |
| 5 or more Children | 0 (0.0%) | 0 (0.0%) |
| Total | 0 (0.0%) | 38 (61.3%) |
Income Below Poverty Among Married-Couple vs Single-Parent Households in Culver
The poverty data for Culver shows that 49 of the married-couple family households (17.0%) and 38 of the single-parent households (55.1%) are living below the poverty level. Within the married-couple family households, those with no children have the highest poverty rate, with 46 households (20.3%) falling below the poverty line. Among the single-parent households, those with 1 or 2 children have the highest poverty rate, with 23 household (74.2%) living below poverty.
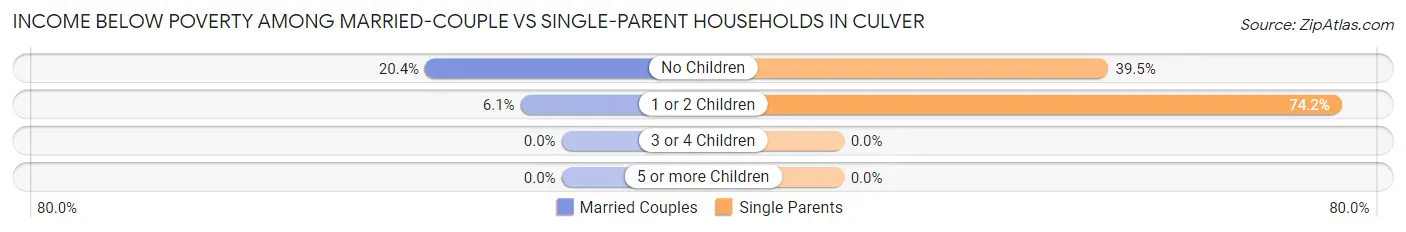
| Children | Married-Couple Families | Single-Parent Households |
| No Children | 46 (20.3%) | 15 (39.5%) |
| 1 or 2 Children | 3 (6.1%) | 23 (74.2%) |
| 3 or 4 Children | 0 (0.0%) | 0 (0.0%) |
| 5 or more Children | 0 (0.0%) | 0 (0.0%) |
| Total | 49 (17.0%) | 38 (55.1%) |
Race in Culver
The most populous races in Culver are White / Caucasian (1,101 | 89.5%), Black / African American (47 | 3.8%), and Two or more Races (36 | 2.9%).
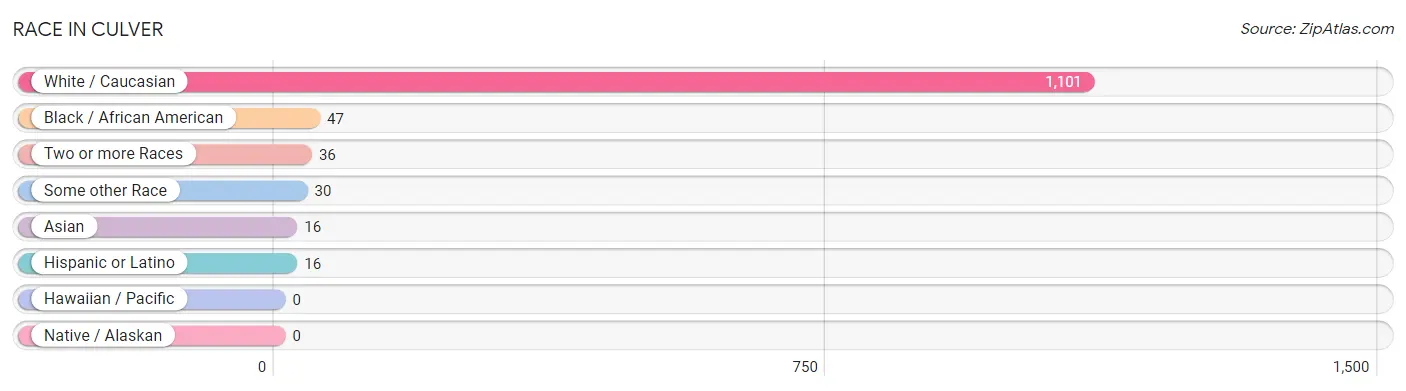
| Race | # Population | % Population |
| Asian | 16 | 1.3% |
| Black / African American | 47 | 3.8% |
| Hawaiian / Pacific | 0 | 0.0% |
| Hispanic or Latino | 16 | 1.3% |
| Native / Alaskan | 0 | 0.0% |
| White / Caucasian | 1,101 | 89.5% |
| Two or more Races | 36 | 2.9% |
| Some other Race | 30 | 2.4% |
| Total | 1,230 | 100.0% |
Ancestry in Culver
The most populous ancestries reported in Culver are German (301 | 24.5%), English (175 | 14.2%), Irish (166 | 13.5%), American (126 | 10.2%), and Polish (59 | 4.8%), together accounting for 67.2% of all Culver residents.
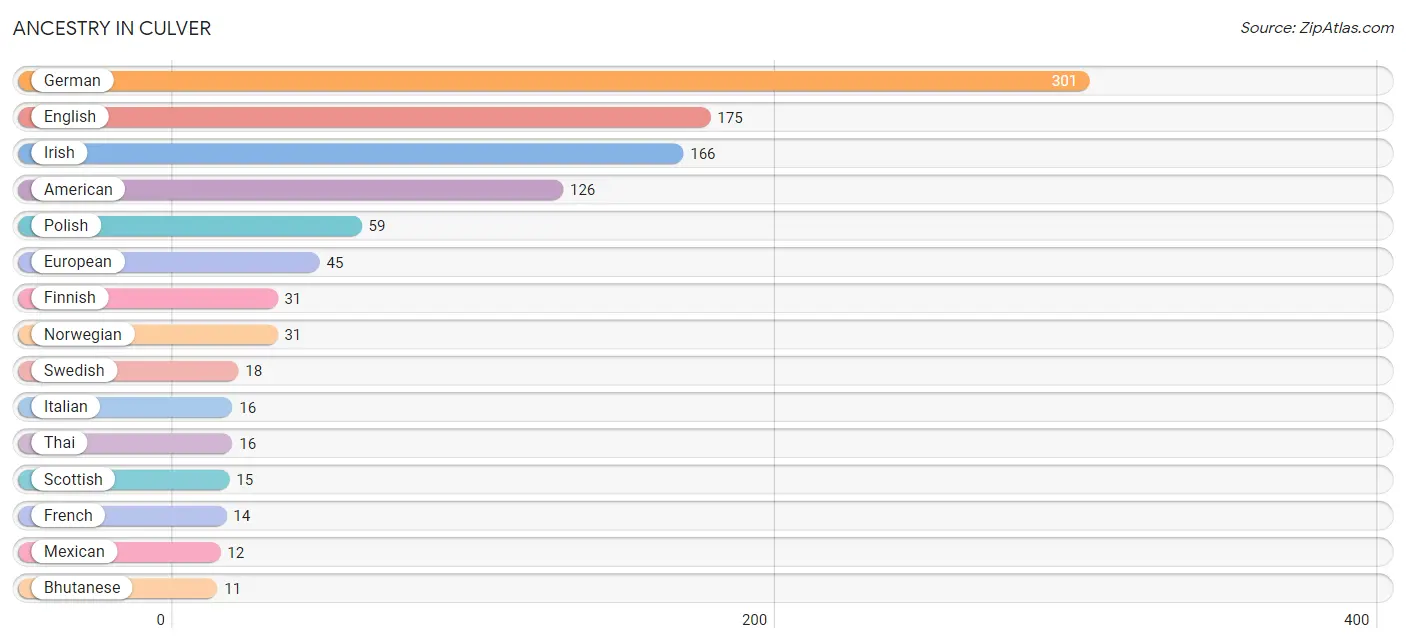
| Ancestry | # Population | % Population |
| American | 126 | 10.2% |
| Bhutanese | 11 | 0.9% |
| Cajun | 4 | 0.3% |
| Czech | 3 | 0.2% |
| Dutch | 4 | 0.3% |
| English | 175 | 14.2% |
| European | 45 | 3.7% |
| Finnish | 31 | 2.5% |
| French | 14 | 1.1% |
| German | 301 | 24.5% |
| Hungarian | 1 | 0.1% |
| Irish | 166 | 13.5% |
| Italian | 16 | 1.3% |
| Mexican | 12 | 1.0% |
| Northern European | 3 | 0.2% |
| Norwegian | 31 | 2.5% |
| Pennsylvania German | 3 | 0.2% |
| Polish | 59 | 4.8% |
| Romanian | 3 | 0.2% |
| Scandinavian | 3 | 0.2% |
| Scotch-Irish | 10 | 0.8% |
| Scottish | 15 | 1.2% |
| Serbian | 4 | 0.3% |
| Slovak | 3 | 0.2% |
| Spanish | 4 | 0.3% |
| Swedish | 18 | 1.5% |
| Swiss | 2 | 0.2% |
| Thai | 16 | 1.3% |
| Ukrainian | 2 | 0.2% |
| Welsh | 4 | 0.3% | View All 30 Rows |
Immigrants in Culver
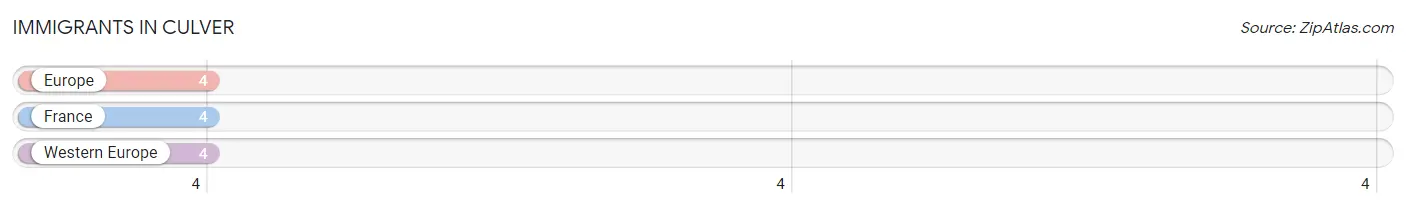
The most numerous immigrant groups reported in Culver came from Europe (4 | 0.3%), France (4 | 0.3%), and Western Europe (4 | 0.3%), together accounting for 1.0% of all Culver residents.
| Immigration Origin | # Population | % Population |
| Europe | 4 | 0.3% |
| France | 4 | 0.3% |
| Western Europe | 4 | 0.3% | View All 3 Rows |
Sex and Age in Culver
Sex and Age in Culver
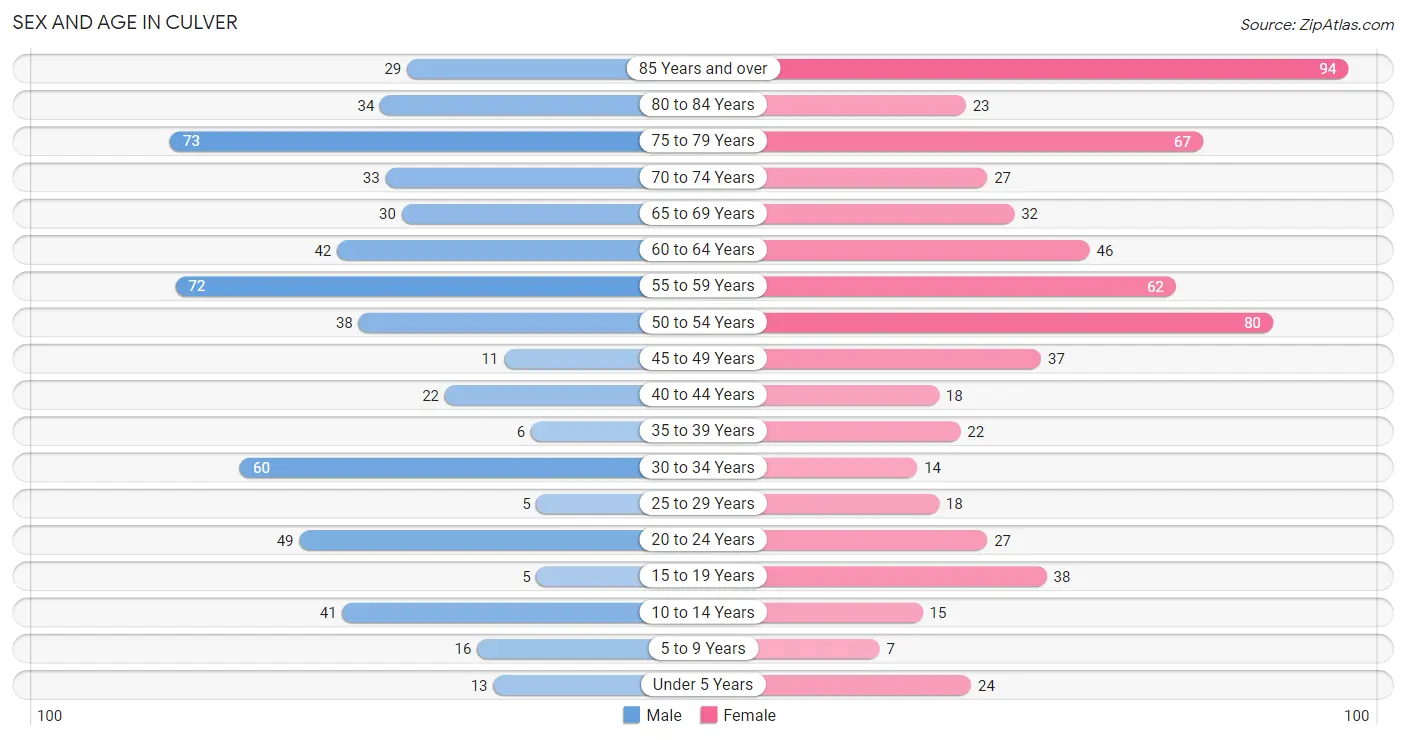
The most populous age groups in Culver are 75 to 79 Years (73 | 12.6%) for men and 85 Years and over (94 | 14.4%) for women.
| Age Bracket | Male | Female |
| Under 5 Years | 13 (2.2%) | 24 (3.7%) |
| 5 to 9 Years | 16 (2.8%) | 7 (1.1%) |
| 10 to 14 Years | 41 (7.1%) | 15 (2.3%) |
| 15 to 19 Years | 5 (0.9%) | 38 (5.8%) |
| 20 to 24 Years | 49 (8.5%) | 27 (4.2%) |
| 25 to 29 Years | 5 (0.9%) | 18 (2.8%) |
| 30 to 34 Years | 60 (10.4%) | 14 (2.1%) |
| 35 to 39 Years | 6 (1.0%) | 22 (3.4%) |
| 40 to 44 Years | 22 (3.8%) | 18 (2.8%) |
| 45 to 49 Years | 11 (1.9%) | 37 (5.7%) |
| 50 to 54 Years | 38 (6.6%) | 80 (12.3%) |
| 55 to 59 Years | 72 (12.4%) | 62 (9.5%) |
| 60 to 64 Years | 42 (7.2%) | 46 (7.1%) |
| 65 to 69 Years | 30 (5.2%) | 32 (4.9%) |
| 70 to 74 Years | 33 (5.7%) | 27 (4.2%) |
| 75 to 79 Years | 73 (12.6%) | 67 (10.3%) |
| 80 to 84 Years | 34 (5.9%) | 23 (3.5%) |
| 85 Years and over | 29 (5.0%) | 94 (14.4%) |
| Total | 579 (100.0%) | 651 (100.0%) |
Families and Households in Culver
Median Family Size in Culver
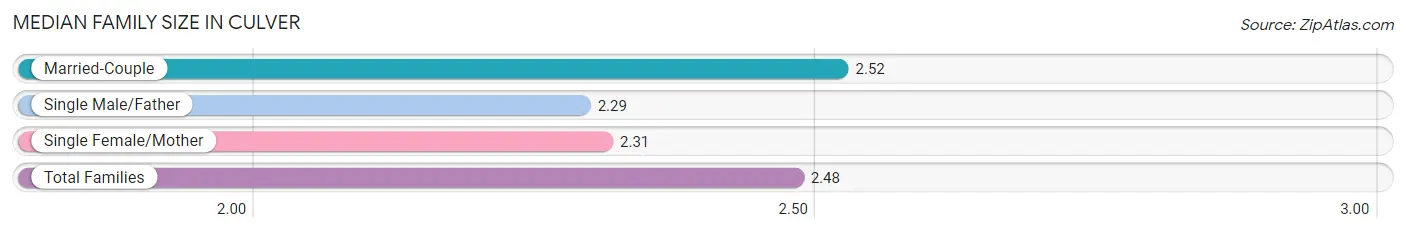
The median family size in Culver is 2.48 persons per family, with married-couple families (289 | 80.7%) accounting for the largest median family size of 2.52 persons per family. On the other hand, single male/father families (7 | 2.0%) represent the smallest median family size with 2.29 persons per family.
| Family Type | # Families | Family Size |
| Married-Couple | 289 (80.7%) | 2.52 |
| Single Male/Father | 7 (2.0%) | 2.29 |
| Single Female/Mother | 62 (17.3%) | 2.31 |
| Total Families | 358 (100.0%) | 2.48 |
Median Household Size in Culver
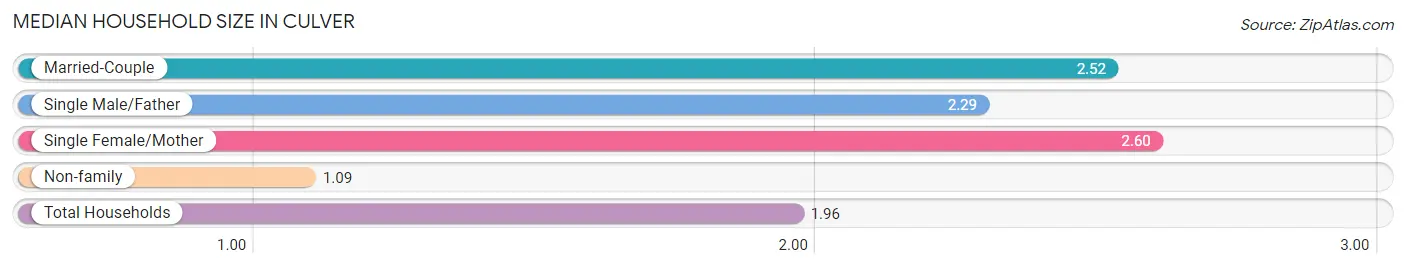
The median household size in Culver is 1.96 persons per household, with single female/mother households (62 | 10.5%) accounting for the largest median household size of 2.6 persons per household. non-family households (234 | 39.5%) represent the smallest median household size with 1.09 persons per household.
| Household Type | # Households | Household Size |
| Married-Couple | 289 (48.8%) | 2.52 |
| Single Male/Father | 7 (1.2%) | 2.29 |
| Single Female/Mother | 62 (10.5%) | 2.60 |
| Non-family | 234 (39.5%) | 1.09 |
| Total Households | 592 (100.0%) | 1.96 |
Household Size by Marriage Status in Culver
Out of a total of 592 households in Culver, 358 (60.5%) are family households, while 234 (39.5%) are nonfamily households. The most numerous type of family households are 2-person households, comprising 264, and the most common type of nonfamily households are 1-person households, comprising 205.
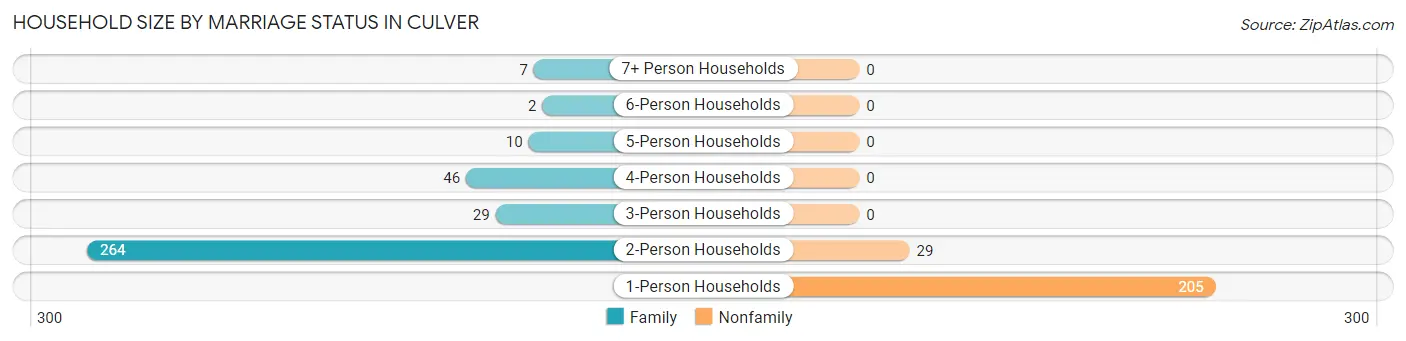
| Household Size | Family Households | Nonfamily Households |
| 1-Person Households | - | 205 (34.6%) |
| 2-Person Households | 264 (44.6%) | 29 (4.9%) |
| 3-Person Households | 29 (4.9%) | 0 (0.0%) |
| 4-Person Households | 46 (7.8%) | 0 (0.0%) |
| 5-Person Households | 10 (1.7%) | 0 (0.0%) |
| 6-Person Households | 2 (0.3%) | 0 (0.0%) |
| 7+ Person Households | 7 (1.2%) | 0 (0.0%) |
| Total | 358 (60.5%) | 234 (39.5%) |
Female Fertility in Culver
Fertility by Age in Culver
Average fertility rate in Culver is 37.0 births per 1,000 women. Women in the age bracket of 20 to 34 years have the highest fertility rate with 119.0 births per 1,000 women. Women in the age bracket of 20 to 34 years acount for 100.0% of all women with births.
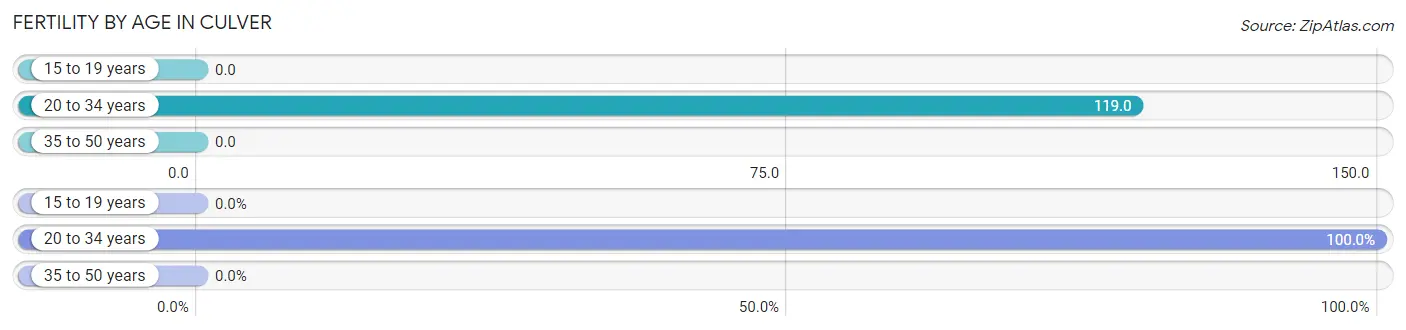
| Age Bracket | Women with Births | Births / 1,000 Women |
| 15 to 19 years | 0 (0.0%) | 0.0 |
| 20 to 34 years | 7 (100.0%) | 119.0 |
| 35 to 50 years | 0 (0.0%) | 0.0 |
| Total | 7 (100.0%) | 37.0 |
Fertility by Age by Marriage Status in Culver
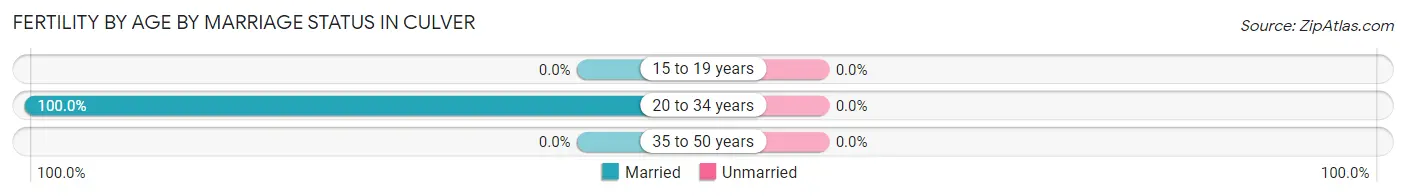
| Age Bracket | Married | Unmarried |
| 15 to 19 years | 0 (0.0%) | 0 (0.0%) |
| 20 to 34 years | 7 (100.0%) | 0 (0.0%) |
| 35 to 50 years | 0 (0.0%) | 0 (0.0%) |
| Total | 7 (100.0%) | 0 (0.0%) |
Fertility by Education in Culver
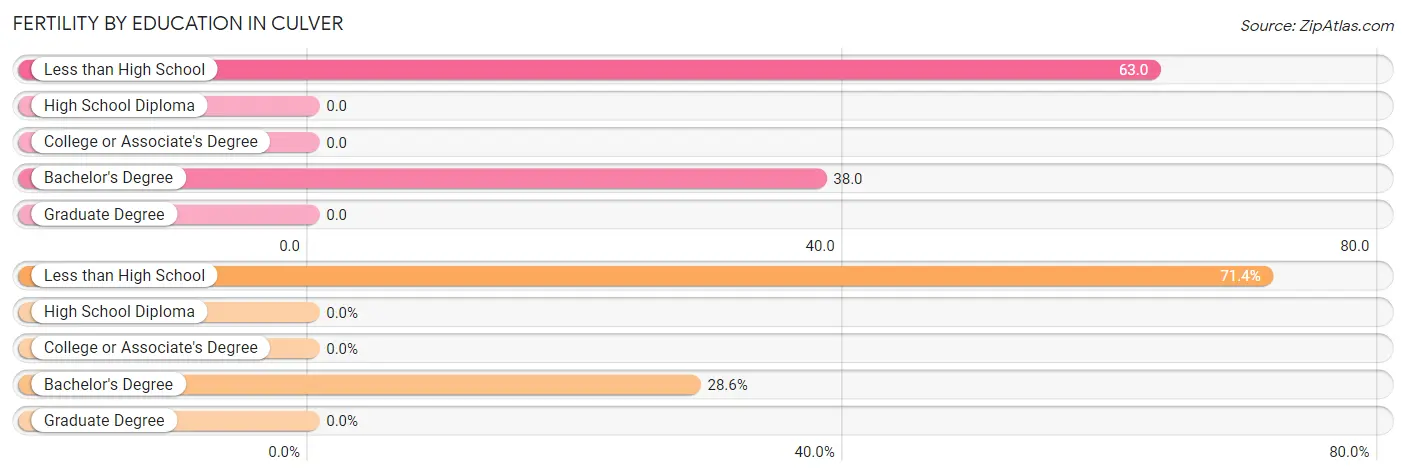
| Educational Attainment | Women with Births | Births / 1,000 Women |
| Less than High School | 5 (71.4%) | 63.0 |
| High School Diploma | 0 (0.0%) | 0.0 |
| College or Associate's Degree | 0 (0.0%) | 0.0 |
| Bachelor's Degree | 2 (28.6%) | 38.0 |
| Graduate Degree | 0 (0.0%) | 0.0 |
| Total | 7 (100.0%) | 37.0 |
Fertility by Education by Marriage Status in Culver
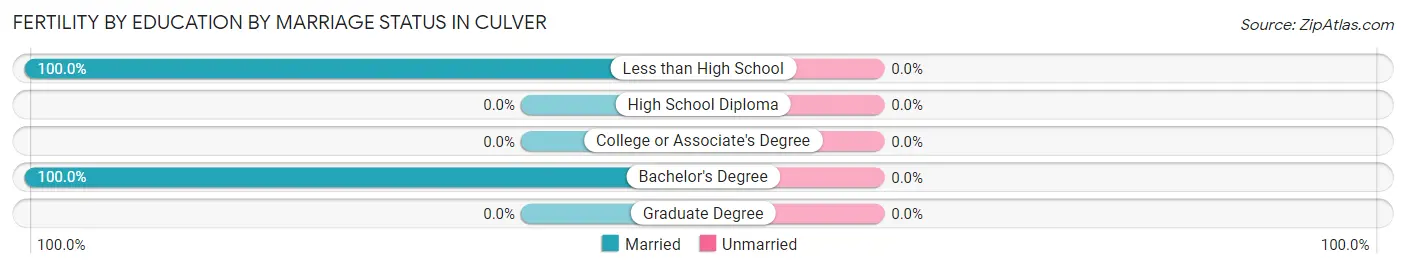
| Educational Attainment | Married | Unmarried |
| Less than High School | 5 (100.0%) | 0 (0.0%) |
| High School Diploma | 0 (0.0%) | 0 (0.0%) |
| College or Associate's Degree | 0 (0.0%) | 0 (0.0%) |
| Bachelor's Degree | 2 (100.0%) | 0 (0.0%) |
| Graduate Degree | 0 (0.0%) | 0 (0.0%) |
| Total | 7 (100.0%) | 0 (0.0%) |
Employment Characteristics in Culver
Employment by Class of Employer in Culver
Among the 459 employed individuals in Culver, private company employees (196 | 42.7%), not-for-profit organizations (110 | 24.0%), and local government employees (58 | 12.6%) make up the most common classes of employment.
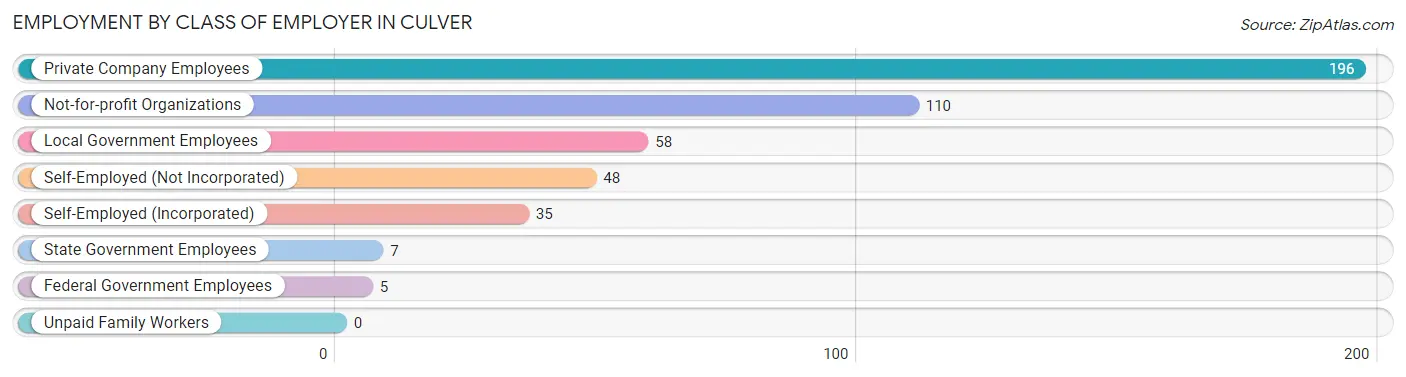
| Employer Class | # Employees | % Employees |
| Private Company Employees | 196 | 42.7% |
| Self-Employed (Incorporated) | 35 | 7.6% |
| Self-Employed (Not Incorporated) | 48 | 10.5% |
| Not-for-profit Organizations | 110 | 24.0% |
| Local Government Employees | 58 | 12.6% |
| State Government Employees | 7 | 1.5% |
| Federal Government Employees | 5 | 1.1% |
| Unpaid Family Workers | 0 | 0.0% |
| Total | 459 | 100.0% |
Employment Status by Age in Culver
According to the labor force statistics for Culver, out of the total population over 16 years of age (1,108), 44.6% or 494 individuals are in the labor force, with 6.9% or 34 of them unemployed. The age group with the highest labor force participation rate is 30 to 34 years, with 91.9% or 68 individuals in the labor force. Within the labor force, the 25 to 29 years age range has the highest percentage of unemployed individuals, with 15.8% or 3 of them being unemployed.
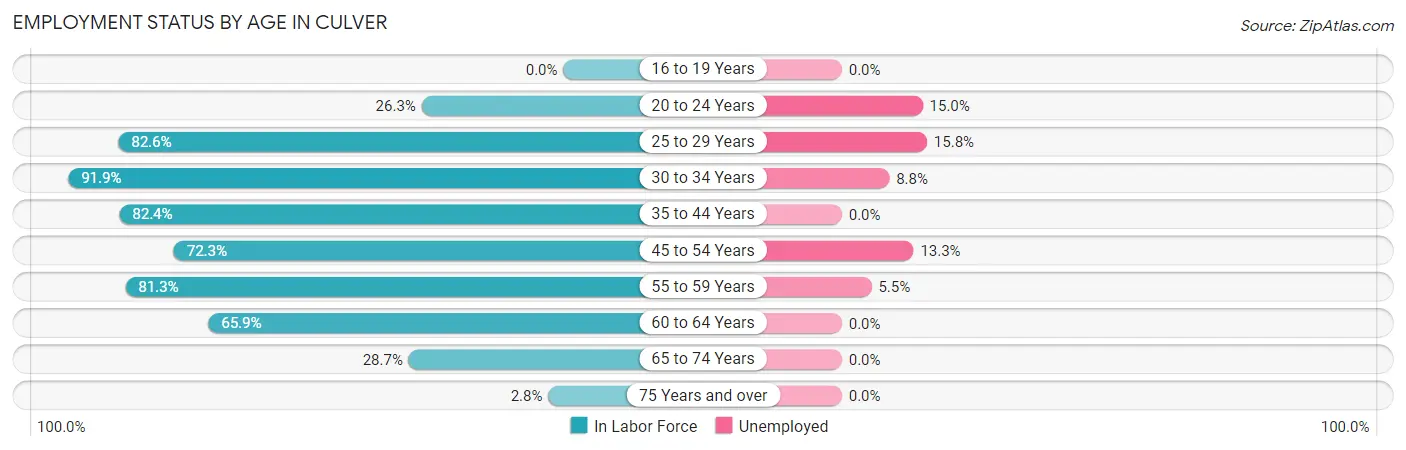
| Age Bracket | In Labor Force | Unemployed |
| 16 to 19 Years | 0 (0.0%) | 0 (0.0%) |
| 20 to 24 Years | 20 (26.3%) | 3 (15.0%) |
| 25 to 29 Years | 19 (82.6%) | 3 (15.8%) |
| 30 to 34 Years | 68 (91.9%) | 6 (8.8%) |
| 35 to 44 Years | 56 (82.4%) | 0 (0.0%) |
| 45 to 54 Years | 120 (72.3%) | 16 (13.3%) |
| 55 to 59 Years | 109 (81.3%) | 6 (5.5%) |
| 60 to 64 Years | 58 (65.9%) | 0 (0.0%) |
| 65 to 74 Years | 35 (28.7%) | 0 (0.0%) |
| 75 Years and over | 9 (2.8%) | 0 (0.0%) |
| Total | 494 (44.6%) | 34 (6.9%) |
Employment Status by Educational Attainment in Culver
According to labor force statistics for Culver, 77.8% of individuals (430) out of the total population between 25 and 64 years of age (553) are in the labor force, with 7.2% or 31 of them being unemployed. The group with the highest labor force participation rate are those with the educational attainment of bachelor's degree or higher, with 90.4% or 225 individuals in the labor force. Within the labor force, individuals with less than high school education have the highest percentage of unemployment, with 17.1% or 6 of them being unemployed.
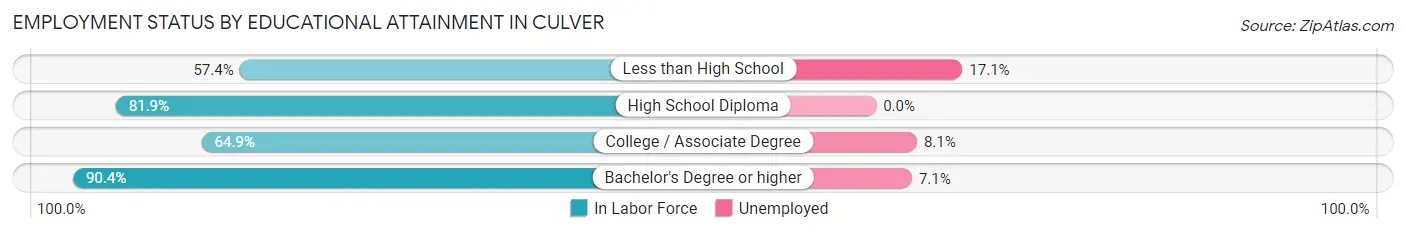
| Educational Attainment | In Labor Force | Unemployed |
| Less than High School | 35 (57.4%) | 10 (17.1%) |
| High School Diploma | 59 (81.9%) | 0 (0.0%) |
| College / Associate Degree | 111 (64.9%) | 14 (8.1%) |
| Bachelor's Degree or higher | 225 (90.4%) | 18 (7.1%) |
| Total | 430 (77.8%) | 40 (7.2%) |
Employment Occupations by Sex in Culver
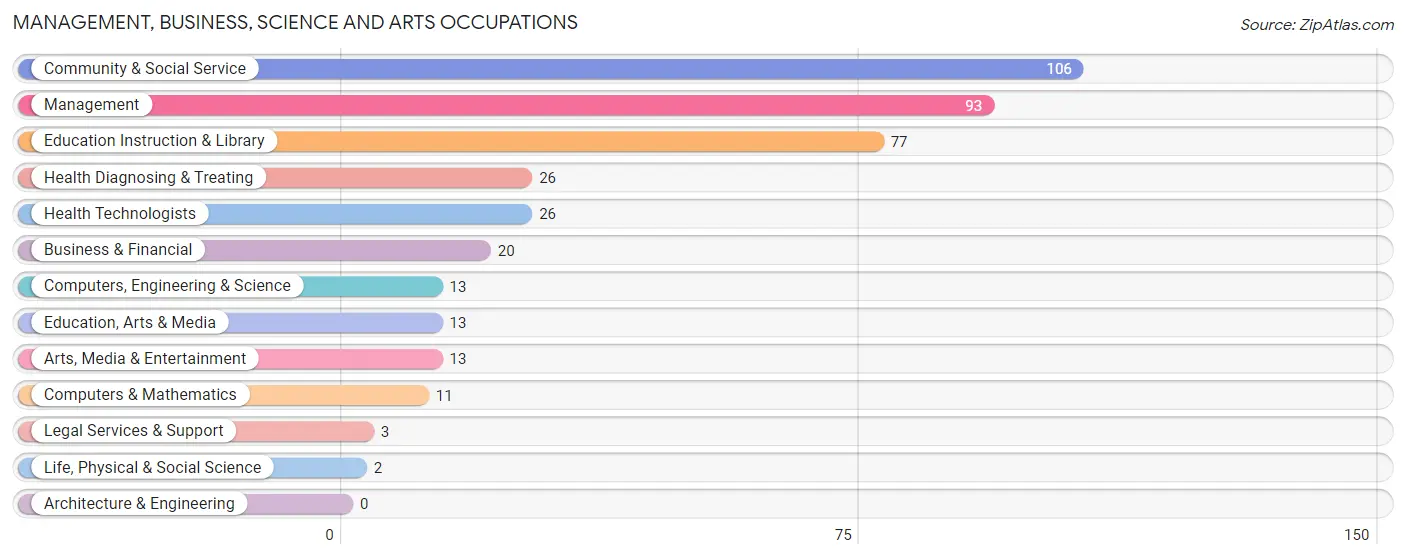
Management, Business, Science and Arts Occupations
The most common Management, Business, Science and Arts occupations in Culver are Community & Social Service (106 | 23.0%), Management (93 | 20.2%), Education Instruction & Library (77 | 16.7%), Health Diagnosing & Treating (26 | 5.7%), and Health Technologists (26 | 5.7%).
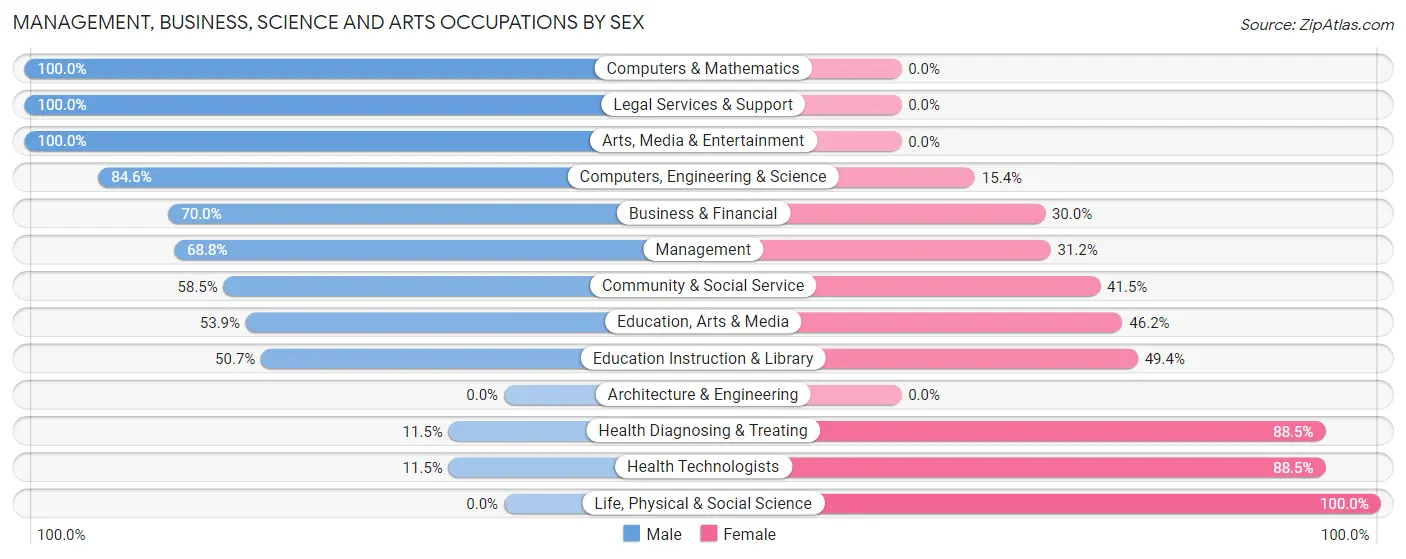
Management, Business, Science and Arts Occupations by Sex
Within the Management, Business, Science and Arts occupations in Culver, the most male-oriented occupations are Computers & Mathematics (100.0%), Legal Services & Support (100.0%), and Arts, Media & Entertainment (100.0%), while the most female-oriented occupations are Life, Physical & Social Science (100.0%), Health Diagnosing & Treating (88.5%), and Health Technologists (88.5%).
| Occupation | Male | Female |
| Management | 64 (68.8%) | 29 (31.2%) |
| Business & Financial | 14 (70.0%) | 6 (30.0%) |
| Computers, Engineering & Science | 11 (84.6%) | 2 (15.4%) |
| Computers & Mathematics | 11 (100.0%) | 0 (0.0%) |
| Architecture & Engineering | 0 (0.0%) | 0 (0.0%) |
| Life, Physical & Social Science | 0 (0.0%) | 2 (100.0%) |
| Community & Social Service | 62 (58.5%) | 44 (41.5%) |
| Education, Arts & Media | 7 (53.8%) | 6 (46.2%) |
| Legal Services & Support | 3 (100.0%) | 0 (0.0%) |
| Education Instruction & Library | 39 (50.6%) | 38 (49.3%) |
| Arts, Media & Entertainment | 13 (100.0%) | 0 (0.0%) |
| Health Diagnosing & Treating | 3 (11.5%) | 23 (88.5%) |
| Health Technologists | 3 (11.5%) | 23 (88.5%) |
| Total (Category) | 154 (59.7%) | 104 (40.3%) |
| Total (Overall) | 259 (56.3%) | 201 (43.7%) |
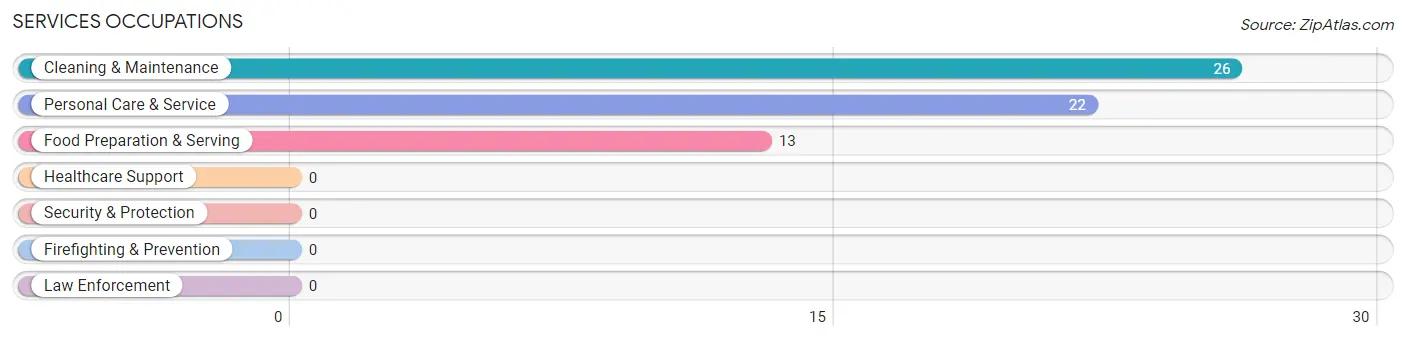
Services Occupations
The most common Services occupations in Culver are Cleaning & Maintenance (26 | 5.7%), Personal Care & Service (22 | 4.8%), and Food Preparation & Serving (13 | 2.8%).
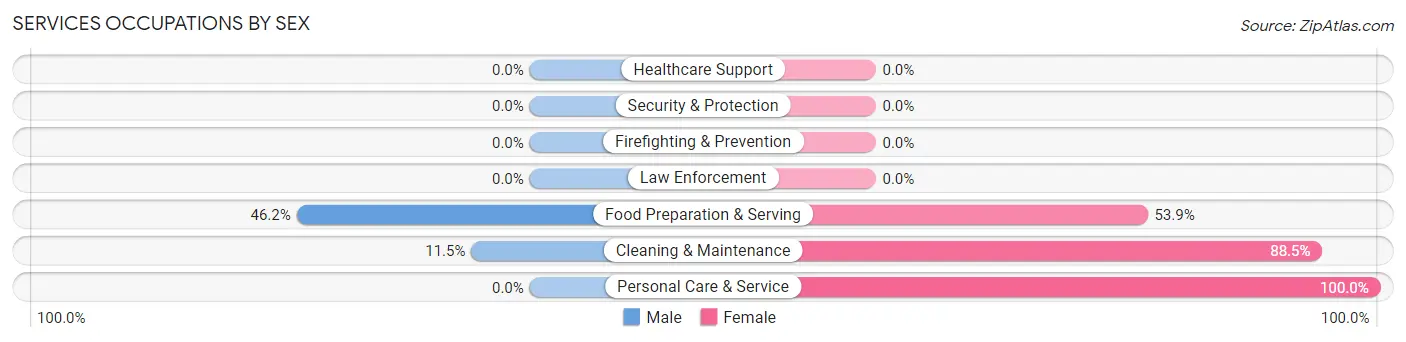
Services Occupations by Sex
Within the Services occupations in Culver, the most male-oriented occupations are Food Preparation & Serving (46.2%), and Cleaning & Maintenance (11.5%), while the most female-oriented occupations are Personal Care & Service (100.0%), Cleaning & Maintenance (88.5%), and Food Preparation & Serving (53.8%).
| Occupation | Male | Female |
| Healthcare Support | 0 (0.0%) | 0 (0.0%) |
| Security & Protection | 0 (0.0%) | 0 (0.0%) |
| Firefighting & Prevention | 0 (0.0%) | 0 (0.0%) |
| Law Enforcement | 0 (0.0%) | 0 (0.0%) |
| Food Preparation & Serving | 6 (46.2%) | 7 (53.8%) |
| Cleaning & Maintenance | 3 (11.5%) | 23 (88.5%) |
| Personal Care & Service | 0 (0.0%) | 22 (100.0%) |
| Total (Category) | 9 (14.7%) | 52 (85.3%) |
| Total (Overall) | 259 (56.3%) | 201 (43.7%) |
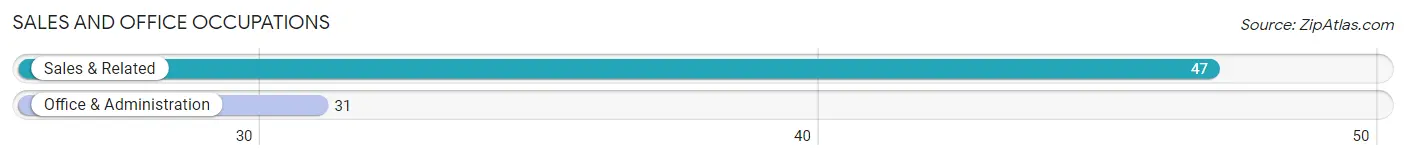
Sales and Office Occupations
The most common Sales and Office occupations in Culver are Sales & Related (47 | 10.2%), and Office & Administration (31 | 6.7%).
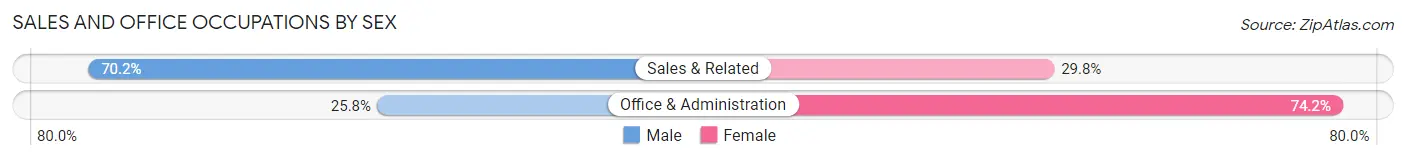
Sales and Office Occupations by Sex
| Occupation | Male | Female |
| Sales & Related | 33 (70.2%) | 14 (29.8%) |
| Office & Administration | 8 (25.8%) | 23 (74.2%) |
| Total (Category) | 41 (52.6%) | 37 (47.4%) |
| Total (Overall) | 259 (56.3%) | 201 (43.7%) |
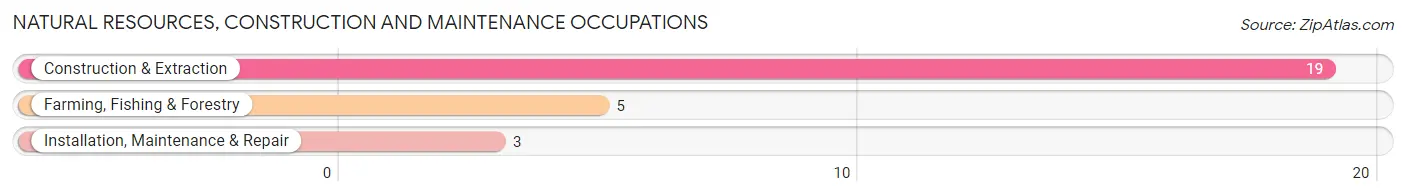
Natural Resources, Construction and Maintenance Occupations
The most common Natural Resources, Construction and Maintenance occupations in Culver are Construction & Extraction (19 | 4.1%), Farming, Fishing & Forestry (5 | 1.1%), and Installation, Maintenance & Repair (3 | 0.6%).
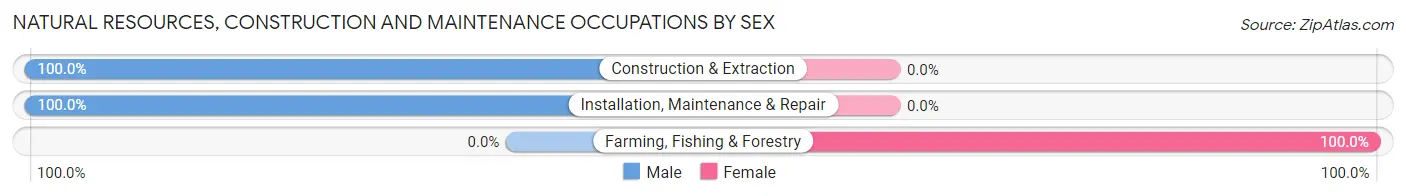
Natural Resources, Construction and Maintenance Occupations by Sex
| Occupation | Male | Female |
| Farming, Fishing & Forestry | 0 (0.0%) | 5 (100.0%) |
| Construction & Extraction | 19 (100.0%) | 0 (0.0%) |
| Installation, Maintenance & Repair | 3 (100.0%) | 0 (0.0%) |
| Total (Category) | 22 (81.5%) | 5 (18.5%) |
| Total (Overall) | 259 (56.3%) | 201 (43.7%) |
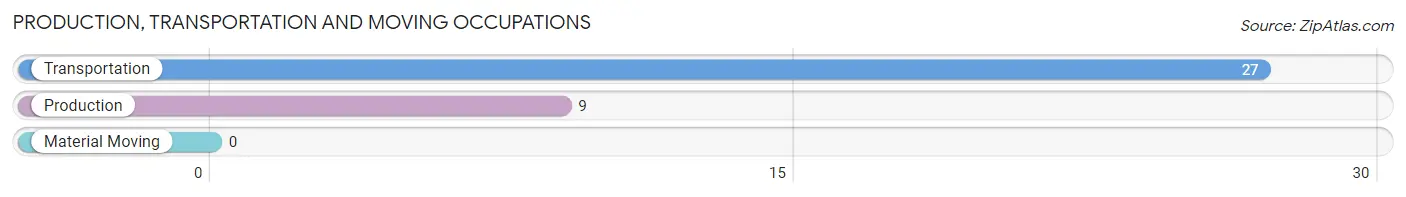
Production, Transportation and Moving Occupations
The most common Production, Transportation and Moving occupations in Culver are Transportation (27 | 5.9%), and Production (9 | 2.0%).
Production, Transportation and Moving Occupations by Sex
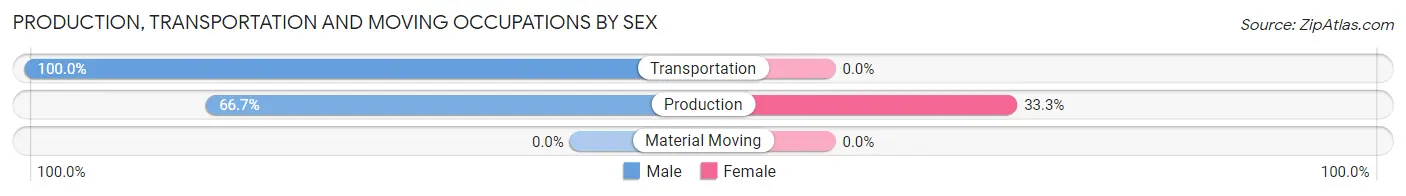
| Occupation | Male | Female |
| Production | 6 (66.7%) | 3 (33.3%) |
| Transportation | 27 (100.0%) | 0 (0.0%) |
| Material Moving | 0 (0.0%) | 0 (0.0%) |
| Total (Category) | 33 (91.7%) | 3 (8.3%) |
| Total (Overall) | 259 (56.3%) | 201 (43.7%) |
Employment Industries by Sex in Culver
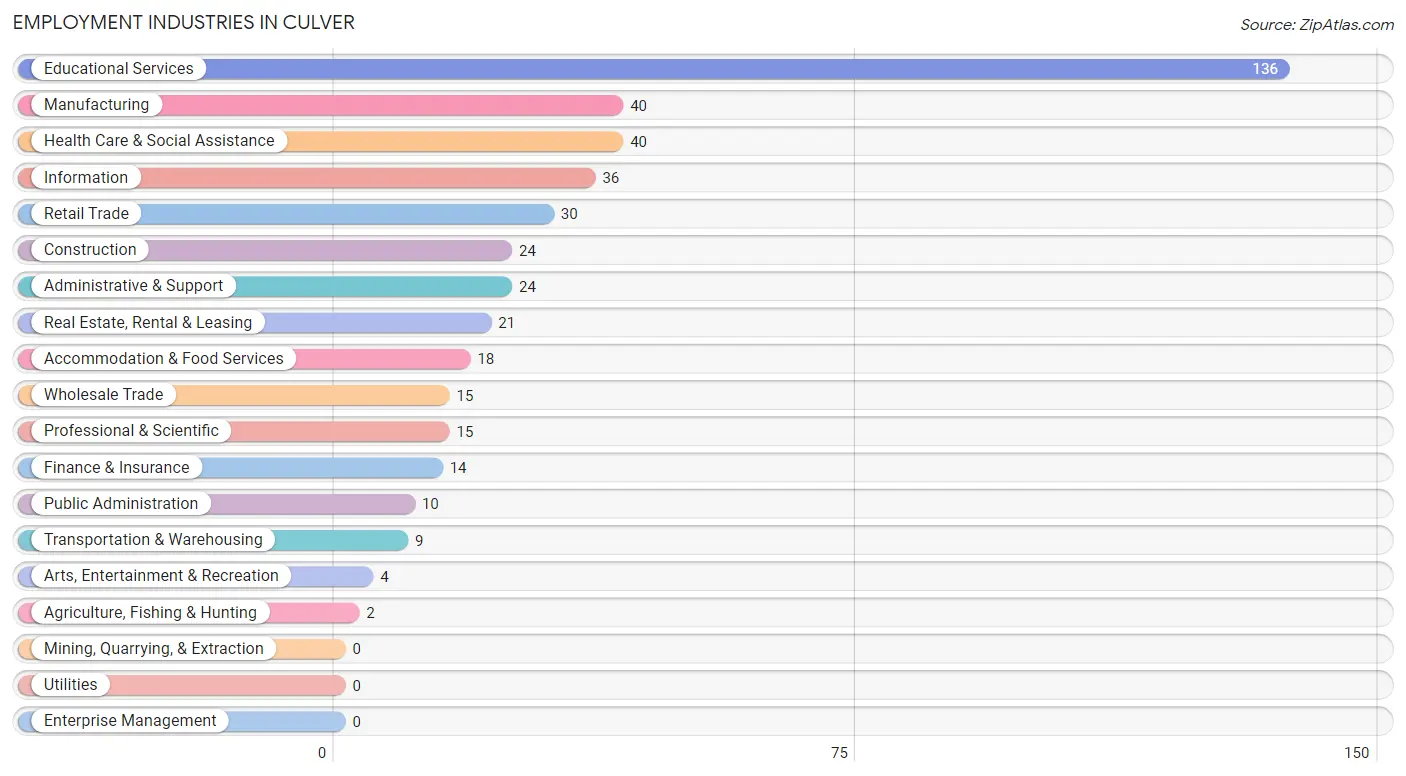
Employment Industries in Culver
The major employment industries in Culver include Educational Services (136 | 29.6%), Manufacturing (40 | 8.7%), Health Care & Social Assistance (40 | 8.7%), Information (36 | 7.8%), and Retail Trade (30 | 6.5%).
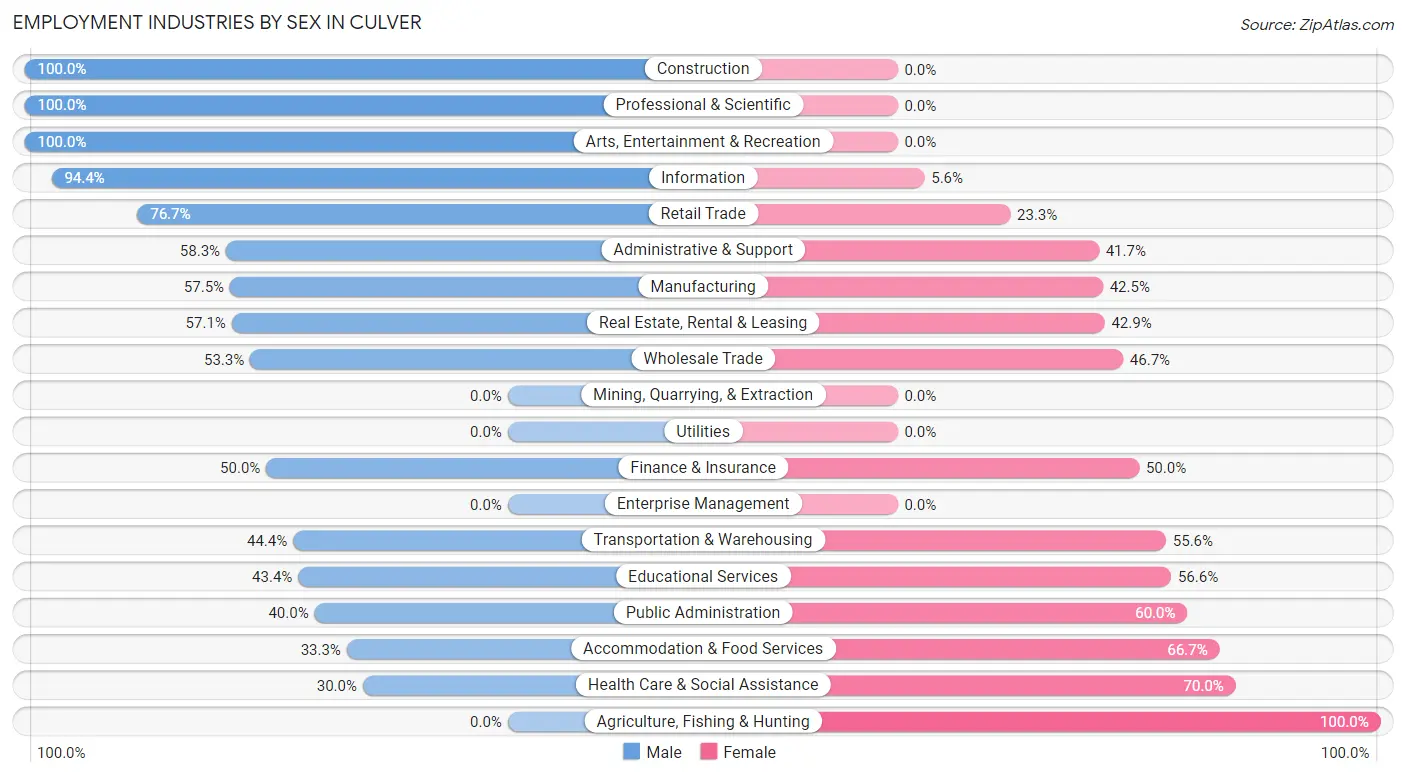
Employment Industries by Sex in Culver
The Culver industries that see more men than women are Construction (100.0%), Professional & Scientific (100.0%), and Arts, Entertainment & Recreation (100.0%), whereas the industries that tend to have a higher number of women are Agriculture, Fishing & Hunting (100.0%), Health Care & Social Assistance (70.0%), and Accommodation & Food Services (66.7%).
| Industry | Male | Female |
| Agriculture, Fishing & Hunting | 0 (0.0%) | 2 (100.0%) |
| Mining, Quarrying, & Extraction | 0 (0.0%) | 0 (0.0%) |
| Construction | 24 (100.0%) | 0 (0.0%) |
| Manufacturing | 23 (57.5%) | 17 (42.5%) |
| Wholesale Trade | 8 (53.3%) | 7 (46.7%) |
| Retail Trade | 23 (76.7%) | 7 (23.3%) |
| Transportation & Warehousing | 4 (44.4%) | 5 (55.6%) |
| Utilities | 0 (0.0%) | 0 (0.0%) |
| Information | 34 (94.4%) | 2 (5.6%) |
| Finance & Insurance | 7 (50.0%) | 7 (50.0%) |
| Real Estate, Rental & Leasing | 12 (57.1%) | 9 (42.9%) |
| Professional & Scientific | 15 (100.0%) | 0 (0.0%) |
| Enterprise Management | 0 (0.0%) | 0 (0.0%) |
| Administrative & Support | 14 (58.3%) | 10 (41.7%) |
| Educational Services | 59 (43.4%) | 77 (56.6%) |
| Health Care & Social Assistance | 12 (30.0%) | 28 (70.0%) |
| Arts, Entertainment & Recreation | 4 (100.0%) | 0 (0.0%) |
| Accommodation & Food Services | 6 (33.3%) | 12 (66.7%) |
| Public Administration | 4 (40.0%) | 6 (60.0%) |
| Total | 259 (56.3%) | 201 (43.7%) |
Education in Culver
School Enrollment in Culver
The most common levels of schooling among the 191 students in Culver are high school (60 | 31.4%), college / undergraduate (48 | 25.1%), and middle school (44 | 23.0%).
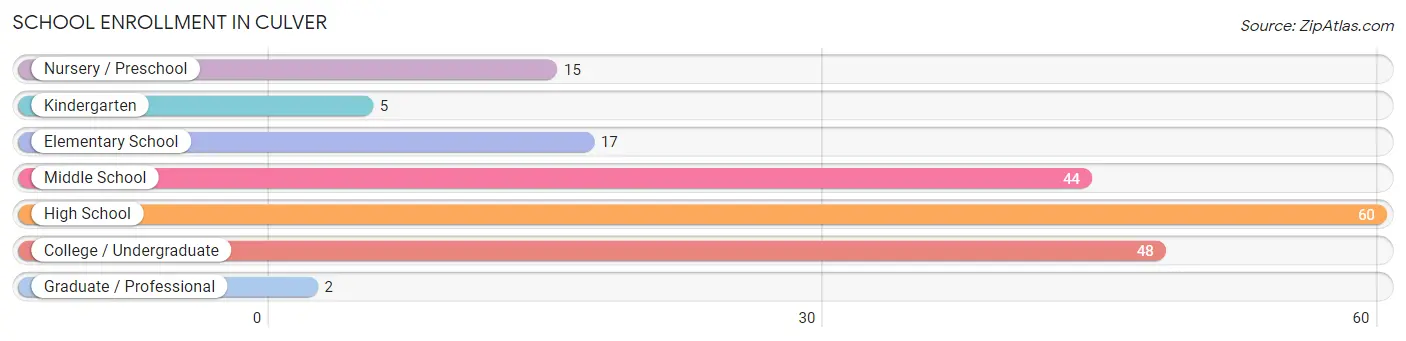
| School Level | # Students | % Students |
| Nursery / Preschool | 15 | 7.9% |
| Kindergarten | 5 | 2.6% |
| Elementary School | 17 | 8.9% |
| Middle School | 44 | 23.0% |
| High School | 60 | 31.4% |
| College / Undergraduate | 48 | 25.1% |
| Graduate / Professional | 2 | 1.1% |
| Total | 191 | 100.0% |
School Enrollment by Age by Funding Source in Culver
Out of a total of 191 students who are enrolled in schools in Culver, 105 (55.0%) attend a private institution, while the remaining 86 (45.0%) are enrolled in public schools. The age group of 18 to 19 year olds has the highest likelihood of being enrolled in private schools, with 9 (100.0% in the age bracket) enrolled. Conversely, the age group of 25 to 34 year olds has the lowest likelihood of being enrolled in a private school, with 6 (100.0% in the age bracket) attending a public institution.
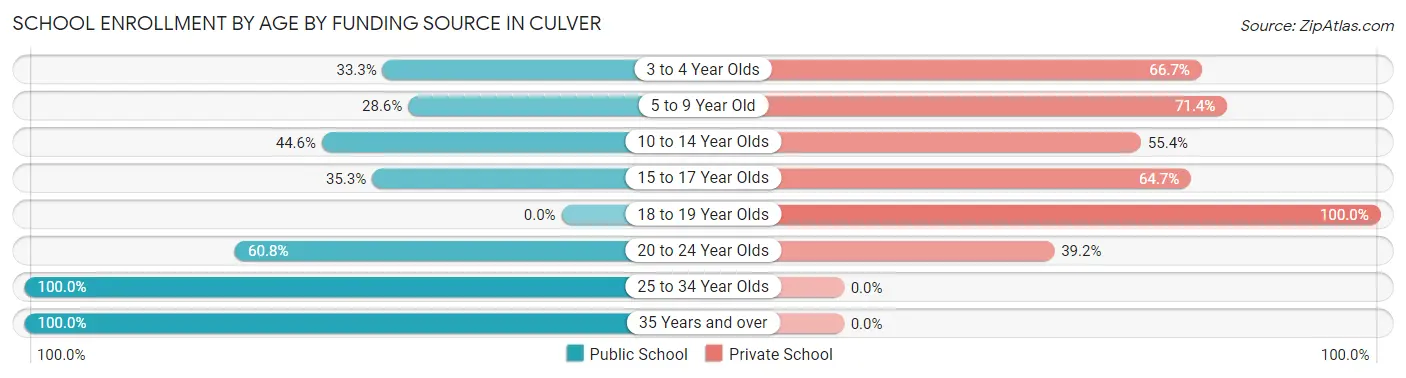
| Age Bracket | Public School | Private School |
| 3 to 4 Year Olds | 4 (33.3%) | 8 (66.7%) |
| 5 to 9 Year Old | 6 (28.6%) | 15 (71.4%) |
| 10 to 14 Year Olds | 25 (44.6%) | 31 (55.4%) |
| 15 to 17 Year Olds | 12 (35.3%) | 22 (64.7%) |
| 18 to 19 Year Olds | 0 (0.0%) | 9 (100.0%) |
| 20 to 24 Year Olds | 31 (60.8%) | 20 (39.2%) |
| 25 to 34 Year Olds | 6 (100.0%) | 0 (0.0%) |
| 35 Years and over | 2 (100.0%) | 0 (0.0%) |
| Total | 86 (45.0%) | 105 (55.0%) |
Educational Attainment by Field of Study in Culver
Education (96 | 21.6%), science & technology (61 | 13.7%), liberal arts & history (45 | 10.1%), business (38 | 8.6%), and literature & languages (38 | 8.6%) are the most common fields of study among 444 individuals in Culver who have obtained a bachelor's degree or higher.
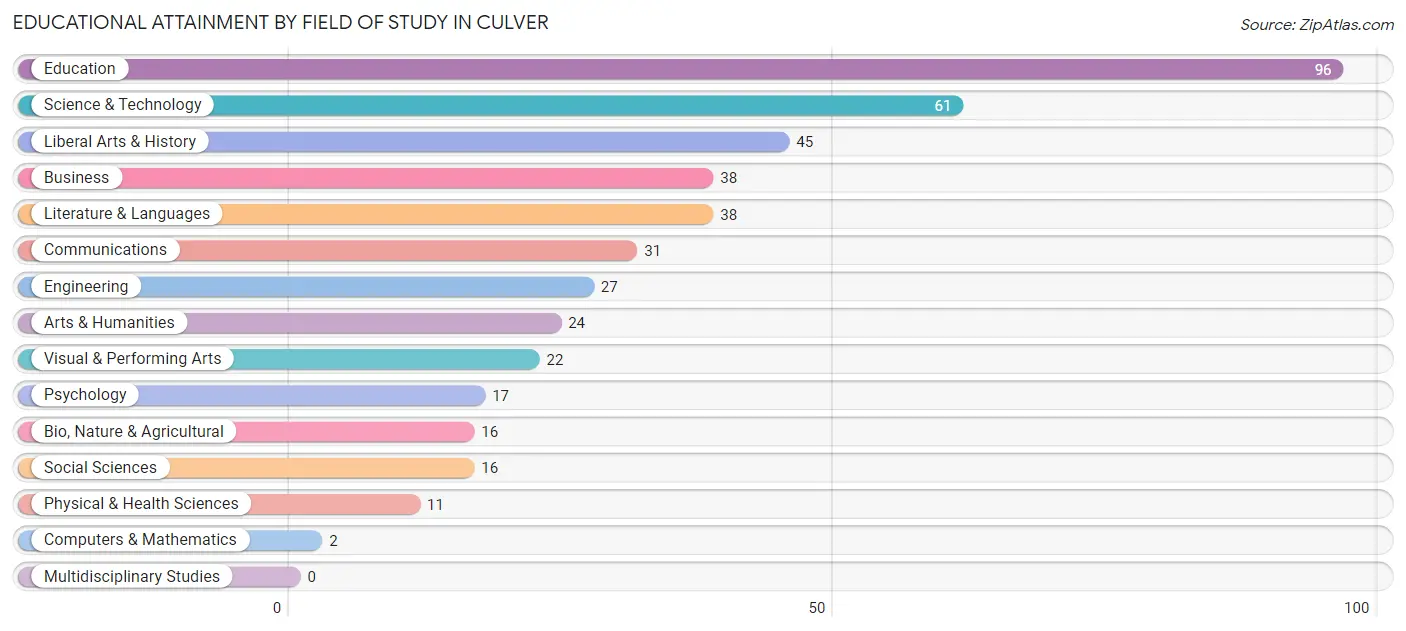
| Field of Study | # Graduates | % Graduates |
| Computers & Mathematics | 2 | 0.4% |
| Bio, Nature & Agricultural | 16 | 3.6% |
| Physical & Health Sciences | 11 | 2.5% |
| Psychology | 17 | 3.8% |
| Social Sciences | 16 | 3.6% |
| Engineering | 27 | 6.1% |
| Multidisciplinary Studies | 0 | 0.0% |
| Science & Technology | 61 | 13.7% |
| Business | 38 | 8.6% |
| Education | 96 | 21.6% |
| Literature & Languages | 38 | 8.6% |
| Liberal Arts & History | 45 | 10.1% |
| Visual & Performing Arts | 22 | 5.0% |
| Communications | 31 | 7.0% |
| Arts & Humanities | 24 | 5.4% |
| Total | 444 | 100.0% |
Transportation & Commute in Culver
Vehicle Availability by Sex in Culver
The most prevalent vehicle ownership categories in Culver are males with 2 vehicles (157, accounting for 60.6%) and females with 2 vehicles (79, making up 78.5%).
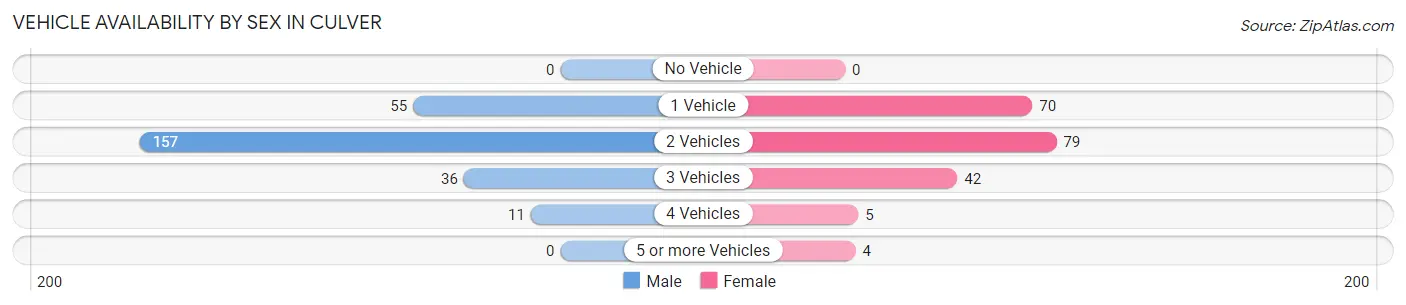
| Vehicles Available | Male | Female |
| No Vehicle | 0 (0.0%) | 0 (0.0%) |
| 1 Vehicle | 55 (21.2%) | 70 (35.0%) |
| 2 Vehicles | 157 (60.6%) | 79 (39.5%) |
| 3 Vehicles | 36 (13.9%) | 42 (21.0%) |
| 4 Vehicles | 11 (4.3%) | 5 (2.5%) |
| 5 or more Vehicles | 0 (0.0%) | 4 (2.0%) |
| Total | 259 (100.0%) | 200 (100.0%) |
Commute Time in Culver
The most frequently occuring commute durations in Culver are 5 to 9 minutes (106 commuters, 27.7%), less than 5 minutes (58 commuters, 15.1%), and 20 to 24 minutes (47 commuters, 12.3%).
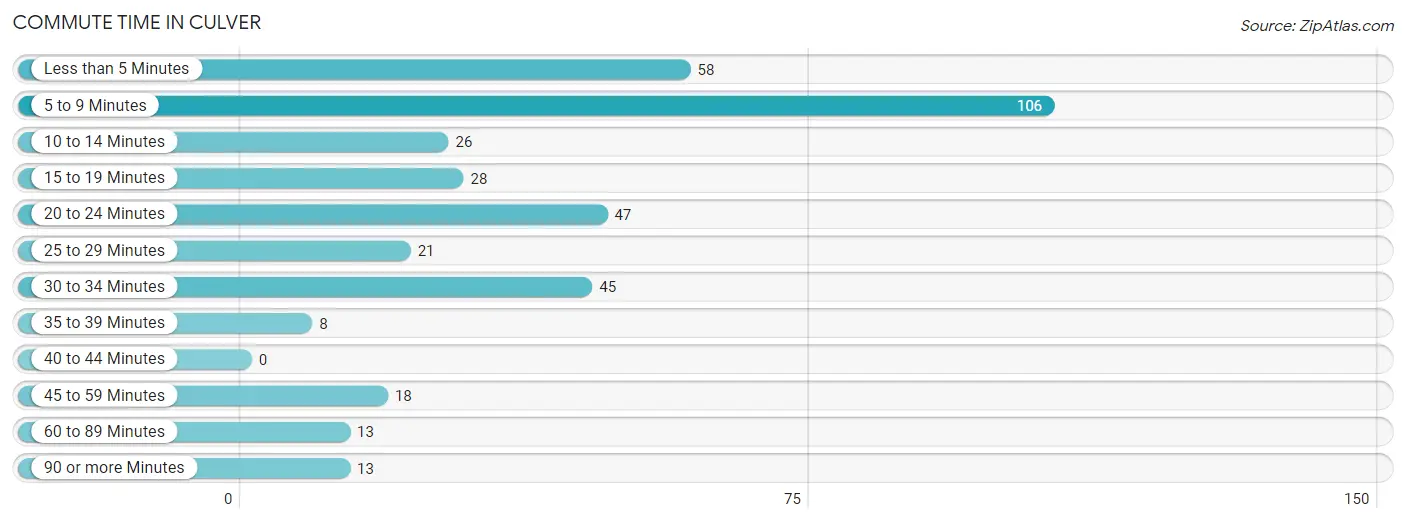
| Commute Time | # Commuters | % Commuters |
| Less than 5 Minutes | 58 | 15.1% |
| 5 to 9 Minutes | 106 | 27.7% |
| 10 to 14 Minutes | 26 | 6.8% |
| 15 to 19 Minutes | 28 | 7.3% |
| 20 to 24 Minutes | 47 | 12.3% |
| 25 to 29 Minutes | 21 | 5.5% |
| 30 to 34 Minutes | 45 | 11.7% |
| 35 to 39 Minutes | 8 | 2.1% |
| 40 to 44 Minutes | 0 | 0.0% |
| 45 to 59 Minutes | 18 | 4.7% |
| 60 to 89 Minutes | 13 | 3.4% |
| 90 or more Minutes | 13 | 3.4% |
Commute Time by Sex in Culver
The most common commute times in Culver are 5 to 9 minutes (55 commuters, 25.4%) for males and 5 to 9 minutes (51 commuters, 30.7%) for females.
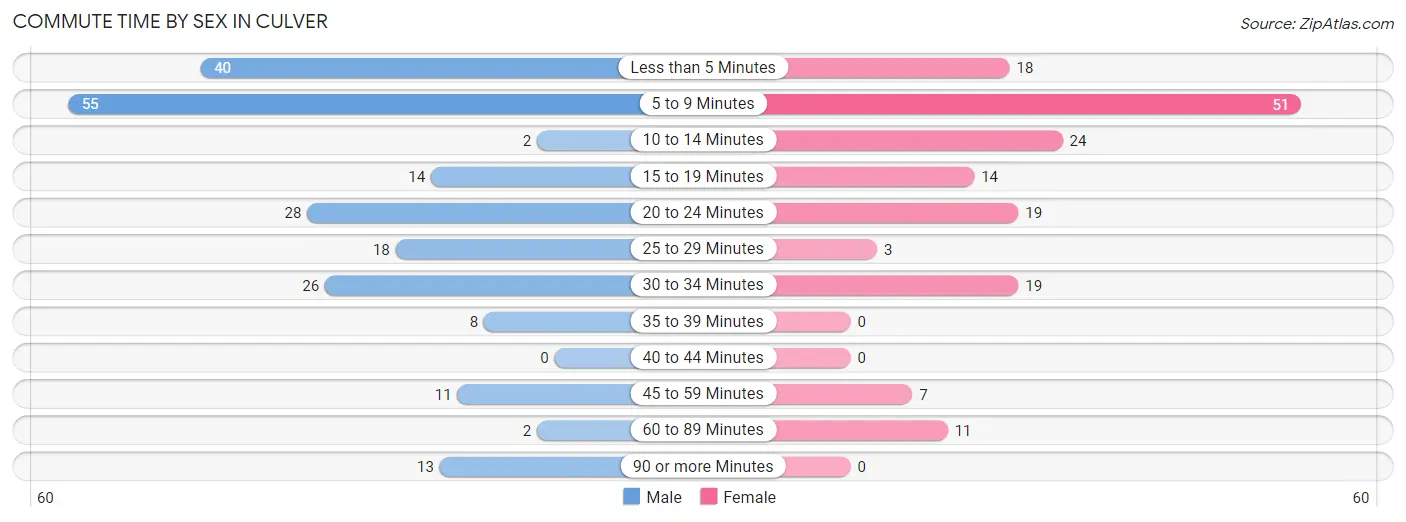
| Commute Time | Male | Female |
| Less than 5 Minutes | 40 (18.4%) | 18 (10.8%) |
| 5 to 9 Minutes | 55 (25.4%) | 51 (30.7%) |
| 10 to 14 Minutes | 2 (0.9%) | 24 (14.5%) |
| 15 to 19 Minutes | 14 (6.5%) | 14 (8.4%) |
| 20 to 24 Minutes | 28 (12.9%) | 19 (11.5%) |
| 25 to 29 Minutes | 18 (8.3%) | 3 (1.8%) |
| 30 to 34 Minutes | 26 (12.0%) | 19 (11.5%) |
| 35 to 39 Minutes | 8 (3.7%) | 0 (0.0%) |
| 40 to 44 Minutes | 0 (0.0%) | 0 (0.0%) |
| 45 to 59 Minutes | 11 (5.1%) | 7 (4.2%) |
| 60 to 89 Minutes | 2 (0.9%) | 11 (6.6%) |
| 90 or more Minutes | 13 (6.0%) | 0 (0.0%) |
Time of Departure to Work by Sex in Culver
The most frequent times of departure to work in Culver are 7:00 AM to 7:29 AM (34, 15.7%) for males and 9:00 AM to 9:59 AM (32, 19.3%) for females.
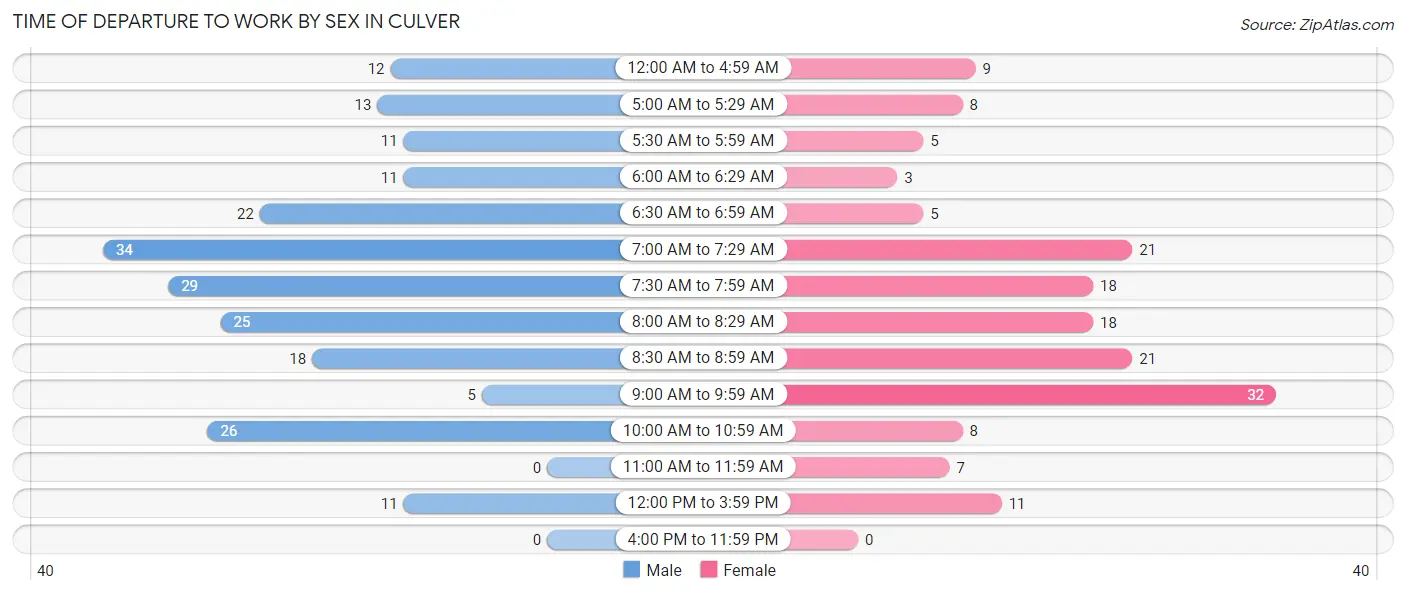
| Time of Departure | Male | Female |
| 12:00 AM to 4:59 AM | 12 (5.5%) | 9 (5.4%) |
| 5:00 AM to 5:29 AM | 13 (6.0%) | 8 (4.8%) |
| 5:30 AM to 5:59 AM | 11 (5.1%) | 5 (3.0%) |
| 6:00 AM to 6:29 AM | 11 (5.1%) | 3 (1.8%) |
| 6:30 AM to 6:59 AM | 22 (10.1%) | 5 (3.0%) |
| 7:00 AM to 7:29 AM | 34 (15.7%) | 21 (12.7%) |
| 7:30 AM to 7:59 AM | 29 (13.4%) | 18 (10.8%) |
| 8:00 AM to 8:29 AM | 25 (11.5%) | 18 (10.8%) |
| 8:30 AM to 8:59 AM | 18 (8.3%) | 21 (12.7%) |
| 9:00 AM to 9:59 AM | 5 (2.3%) | 32 (19.3%) |
| 10:00 AM to 10:59 AM | 26 (12.0%) | 8 (4.8%) |
| 11:00 AM to 11:59 AM | 0 (0.0%) | 7 (4.2%) |
| 12:00 PM to 3:59 PM | 11 (5.1%) | 11 (6.6%) |
| 4:00 PM to 11:59 PM | 0 (0.0%) | 0 (0.0%) |
| Total | 217 (100.0%) | 166 (100.0%) |
Housing Occupancy in Culver
Occupancy by Ownership in Culver
Of the total 592 dwellings in Culver, owner-occupied units account for 424 (71.6%), while renter-occupied units make up 168 (28.4%).
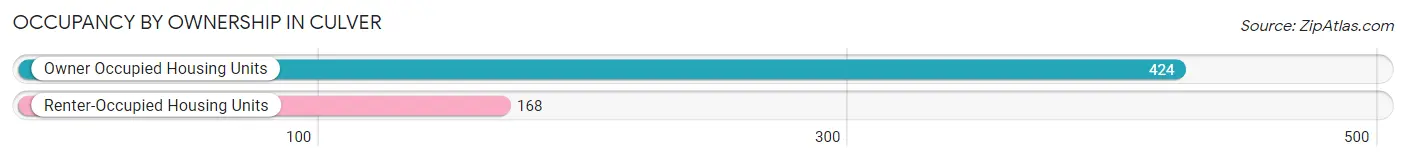
| Occupancy | # Housing Units | % Housing Units |
| Owner Occupied Housing Units | 424 | 71.6% |
| Renter-Occupied Housing Units | 168 | 28.4% |
| Total Occupied Housing Units | 592 | 100.0% |
Occupancy by Household Size in Culver
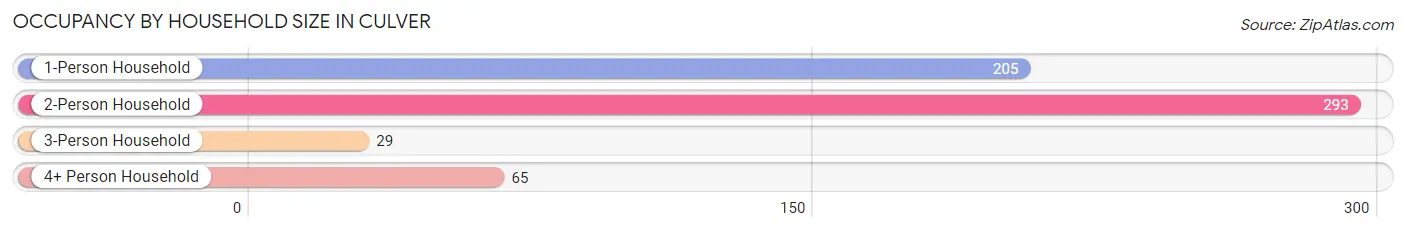
| Household Size | # Housing Units | % Housing Units |
| 1-Person Household | 205 | 34.6% |
| 2-Person Household | 293 | 49.5% |
| 3-Person Household | 29 | 4.9% |
| 4+ Person Household | 65 | 11.0% |
| Total Housing Units | 592 | 100.0% |
Occupancy by Ownership by Household Size in Culver
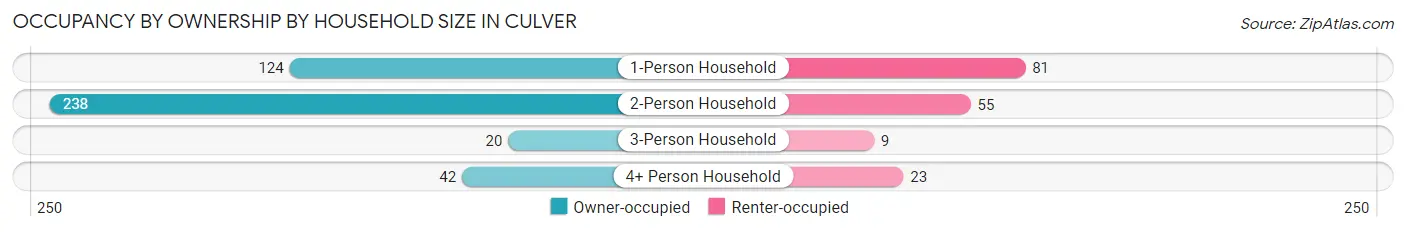
| Household Size | Owner-occupied | Renter-occupied |
| 1-Person Household | 124 (60.5%) | 81 (39.5%) |
| 2-Person Household | 238 (81.2%) | 55 (18.8%) |
| 3-Person Household | 20 (69.0%) | 9 (31.0%) |
| 4+ Person Household | 42 (64.6%) | 23 (35.4%) |
| Total Housing Units | 424 (71.6%) | 168 (28.4%) |
Occupancy by Educational Attainment in Culver
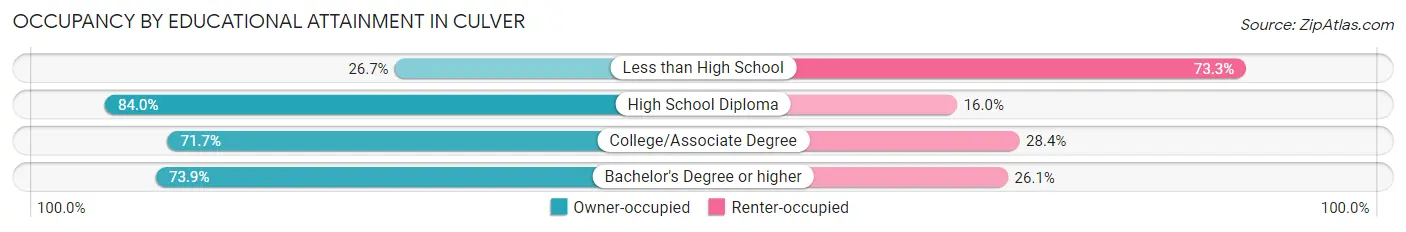
| Household Size | Owner-occupied | Renter-occupied |
| Less than High School | 12 (26.7%) | 33 (73.3%) |
| High School Diploma | 100 (84.0%) | 19 (16.0%) |
| College/Associate Degree | 139 (71.7%) | 55 (28.3%) |
| Bachelor's Degree or higher | 173 (73.9%) | 61 (26.1%) |
Occupancy by Age of Householder in Culver
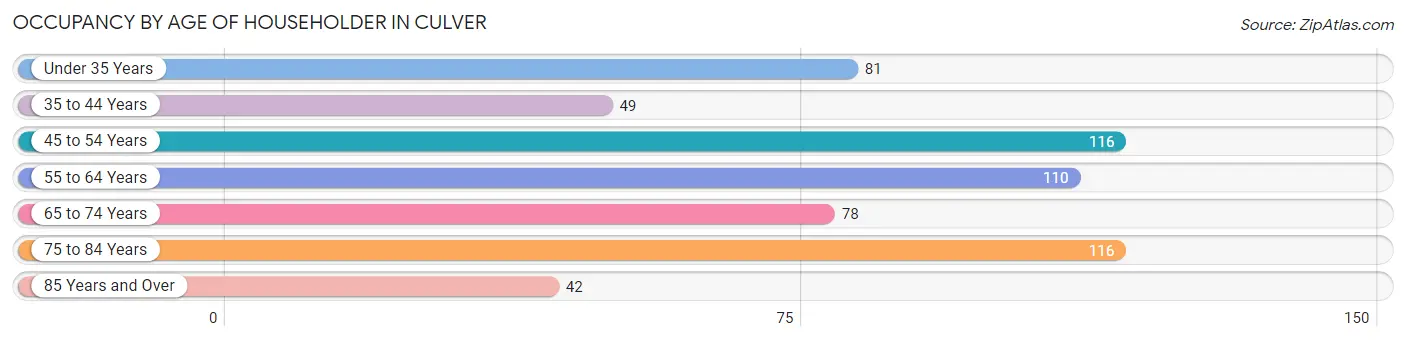
| Age Bracket | # Households | % Households |
| Under 35 Years | 81 | 13.7% |
| 35 to 44 Years | 49 | 8.3% |
| 45 to 54 Years | 116 | 19.6% |
| 55 to 64 Years | 110 | 18.6% |
| 65 to 74 Years | 78 | 13.2% |
| 75 to 84 Years | 116 | 19.6% |
| 85 Years and Over | 42 | 7.1% |
| Total | 592 | 100.0% |
Housing Finances in Culver
Median Income by Occupancy in Culver
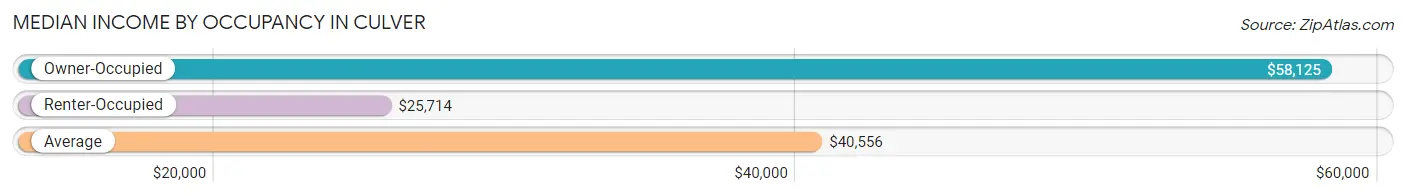
| Occupancy Type | # Households | Median Income |
| Owner-Occupied | 424 (71.6%) | $58,125 |
| Renter-Occupied | 168 (28.4%) | $25,714 |
| Average | 592 (100.0%) | $40,556 |
Occupancy by Householder Income Bracket in Culver
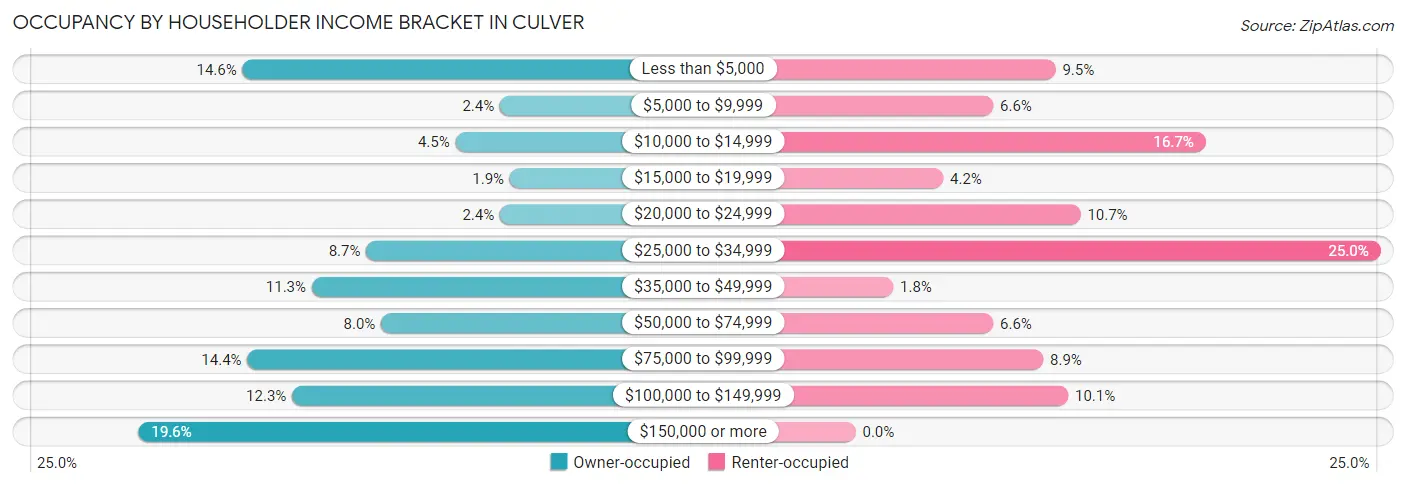
| Income Bracket | Owner-occupied | Renter-occupied |
| Less than $5,000 | 62 (14.6%) | 16 (9.5%) |
| $5,000 to $9,999 | 10 (2.4%) | 11 (6.6%) |
| $10,000 to $14,999 | 19 (4.5%) | 28 (16.7%) |
| $15,000 to $19,999 | 8 (1.9%) | 7 (4.2%) |
| $20,000 to $24,999 | 10 (2.4%) | 18 (10.7%) |
| $25,000 to $34,999 | 37 (8.7%) | 42 (25.0%) |
| $35,000 to $49,999 | 48 (11.3%) | 3 (1.8%) |
| $50,000 to $74,999 | 34 (8.0%) | 11 (6.6%) |
| $75,000 to $99,999 | 61 (14.4%) | 15 (8.9%) |
| $100,000 to $149,999 | 52 (12.3%) | 17 (10.1%) |
| $150,000 or more | 83 (19.6%) | 0 (0.0%) |
| Total | 424 (100.0%) | 168 (100.0%) |
Monthly Housing Cost Tiers in Culver
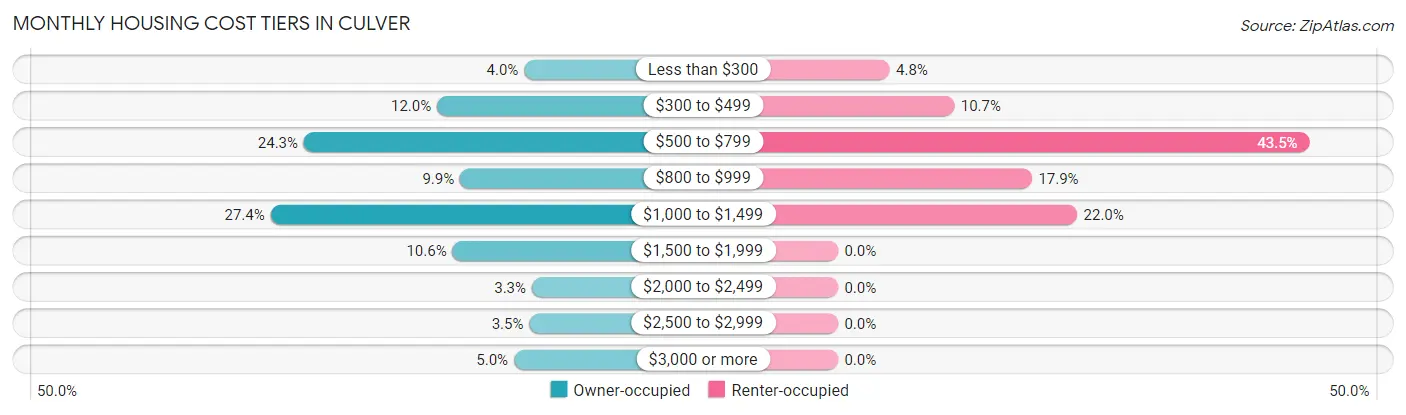
| Monthly Cost | Owner-occupied | Renter-occupied |
| Less than $300 | 17 (4.0%) | 8 (4.8%) |
| $300 to $499 | 51 (12.0%) | 18 (10.7%) |
| $500 to $799 | 103 (24.3%) | 73 (43.4%) |
| $800 to $999 | 42 (9.9%) | 30 (17.9%) |
| $1,000 to $1,499 | 116 (27.4%) | 37 (22.0%) |
| $1,500 to $1,999 | 45 (10.6%) | 0 (0.0%) |
| $2,000 to $2,499 | 14 (3.3%) | 0 (0.0%) |
| $2,500 to $2,999 | 15 (3.5%) | 0 (0.0%) |
| $3,000 or more | 21 (5.0%) | 0 (0.0%) |
| Total | 424 (100.0%) | 168 (100.0%) |
Physical Housing Characteristics in Culver
Housing Structures in Culver
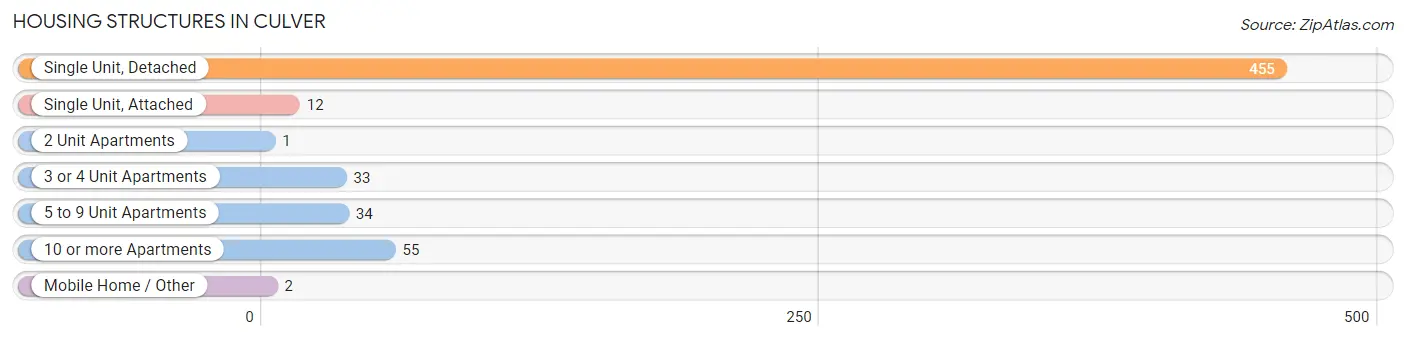
| Structure Type | # Housing Units | % Housing Units |
| Single Unit, Detached | 455 | 76.9% |
| Single Unit, Attached | 12 | 2.0% |
| 2 Unit Apartments | 1 | 0.2% |
| 3 or 4 Unit Apartments | 33 | 5.6% |
| 5 to 9 Unit Apartments | 34 | 5.7% |
| 10 or more Apartments | 55 | 9.3% |
| Mobile Home / Other | 2 | 0.3% |
| Total | 592 | 100.0% |
Housing Structures by Occupancy in Culver
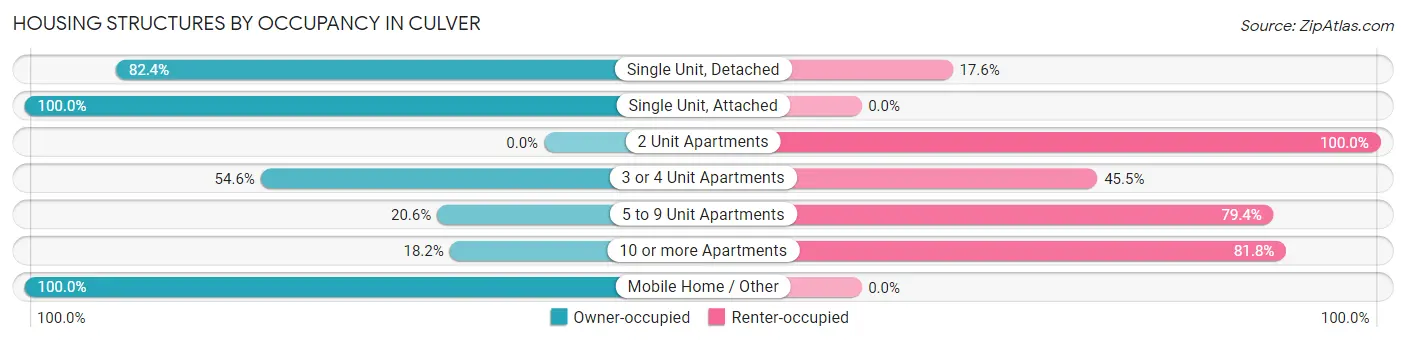
| Structure Type | Owner-occupied | Renter-occupied |
| Single Unit, Detached | 375 (82.4%) | 80 (17.6%) |
| Single Unit, Attached | 12 (100.0%) | 0 (0.0%) |
| 2 Unit Apartments | 0 (0.0%) | 1 (100.0%) |
| 3 or 4 Unit Apartments | 18 (54.5%) | 15 (45.5%) |
| 5 to 9 Unit Apartments | 7 (20.6%) | 27 (79.4%) |
| 10 or more Apartments | 10 (18.2%) | 45 (81.8%) |
| Mobile Home / Other | 2 (100.0%) | 0 (0.0%) |
| Total | 424 (71.6%) | 168 (28.4%) |
Housing Structures by Number of Rooms in Culver
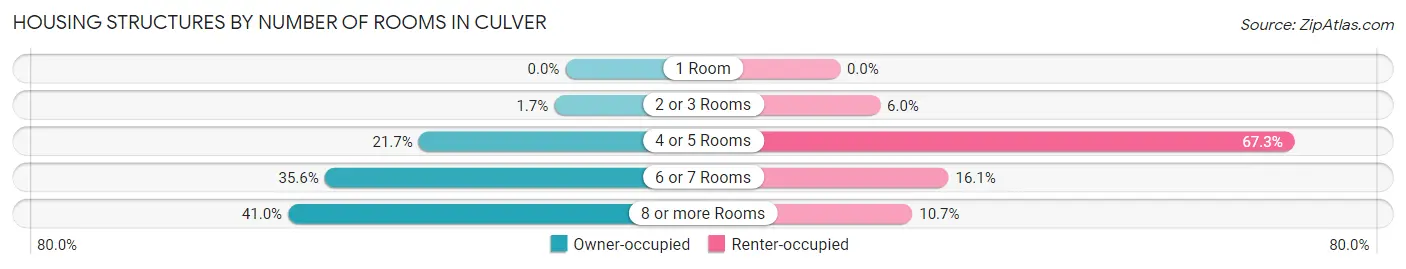
| Number of Rooms | Owner-occupied | Renter-occupied |
| 1 Room | 0 (0.0%) | 0 (0.0%) |
| 2 or 3 Rooms | 7 (1.7%) | 10 (5.9%) |
| 4 or 5 Rooms | 92 (21.7%) | 113 (67.3%) |
| 6 or 7 Rooms | 151 (35.6%) | 27 (16.1%) |
| 8 or more Rooms | 174 (41.0%) | 18 (10.7%) |
| Total | 424 (100.0%) | 168 (100.0%) |
Housing Structure by Heating Type in Culver
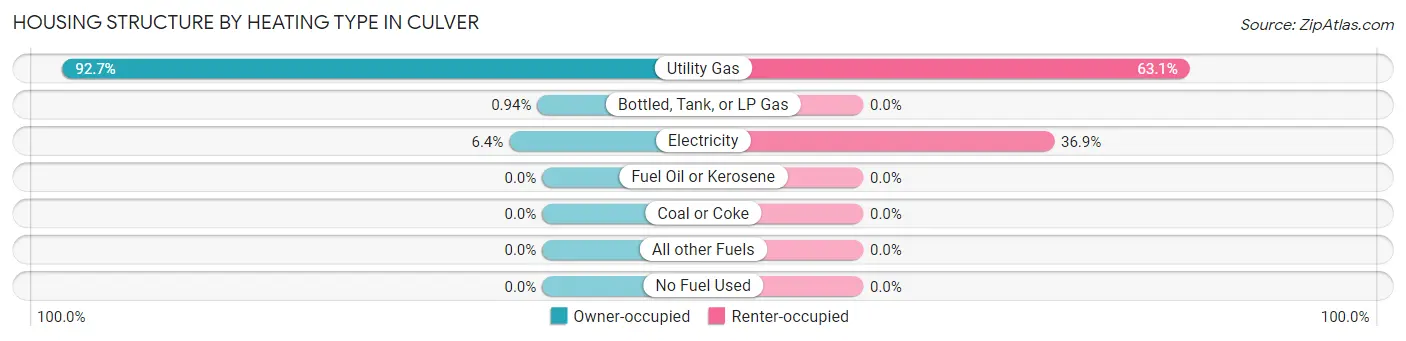
| Heating Type | Owner-occupied | Renter-occupied |
| Utility Gas | 393 (92.7%) | 106 (63.1%) |
| Bottled, Tank, or LP Gas | 4 (0.9%) | 0 (0.0%) |
| Electricity | 27 (6.4%) | 62 (36.9%) |
| Fuel Oil or Kerosene | 0 (0.0%) | 0 (0.0%) |
| Coal or Coke | 0 (0.0%) | 0 (0.0%) |
| All other Fuels | 0 (0.0%) | 0 (0.0%) |
| No Fuel Used | 0 (0.0%) | 0 (0.0%) |
| Total | 424 (100.0%) | 168 (100.0%) |
Household Vehicle Usage in Culver
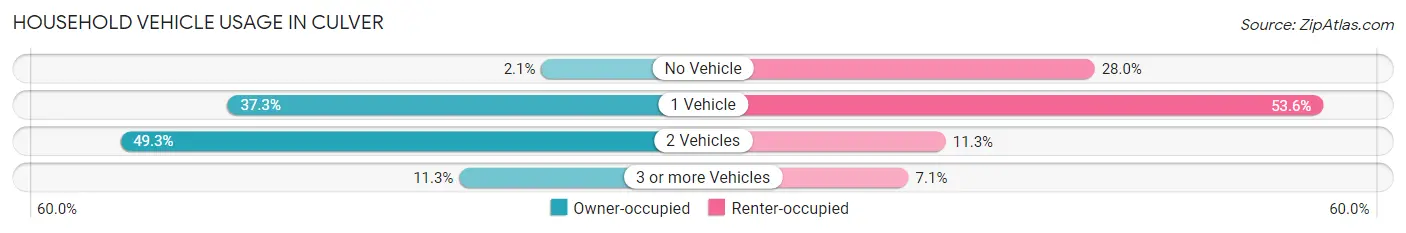
| Vehicles per Household | Owner-occupied | Renter-occupied |
| No Vehicle | 9 (2.1%) | 47 (28.0%) |
| 1 Vehicle | 158 (37.3%) | 90 (53.6%) |
| 2 Vehicles | 209 (49.3%) | 19 (11.3%) |
| 3 or more Vehicles | 48 (11.3%) | 12 (7.1%) |
| Total | 424 (100.0%) | 168 (100.0%) |
Real Estate & Mortgages in Culver
Real Estate and Mortgage Overview in Culver
| Characteristic | Without Mortgage | With Mortgage |
| Housing Units | 164 | 260 |
| Median Property Value | $237,500 | $219,500 |
| Median Household Income | $51,667 | $65 |
| Monthly Housing Costs | $565 | $21 |
| Real Estate Taxes | $1,847 | $0 |
Property Value by Mortgage Status in Culver
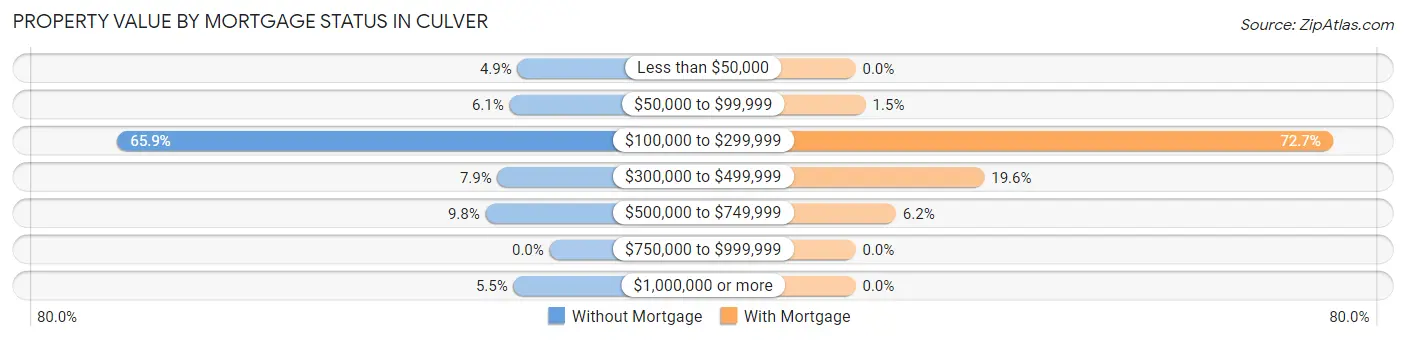
| Property Value | Without Mortgage | With Mortgage |
| Less than $50,000 | 8 (4.9%) | 0 (0.0%) |
| $50,000 to $99,999 | 10 (6.1%) | 4 (1.5%) |
| $100,000 to $299,999 | 108 (65.8%) | 189 (72.7%) |
| $300,000 to $499,999 | 13 (7.9%) | 51 (19.6%) |
| $500,000 to $749,999 | 16 (9.8%) | 16 (6.1%) |
| $750,000 to $999,999 | 0 (0.0%) | 0 (0.0%) |
| $1,000,000 or more | 9 (5.5%) | 0 (0.0%) |
| Total | 164 (100.0%) | 260 (100.0%) |
Household Income by Mortgage Status in Culver
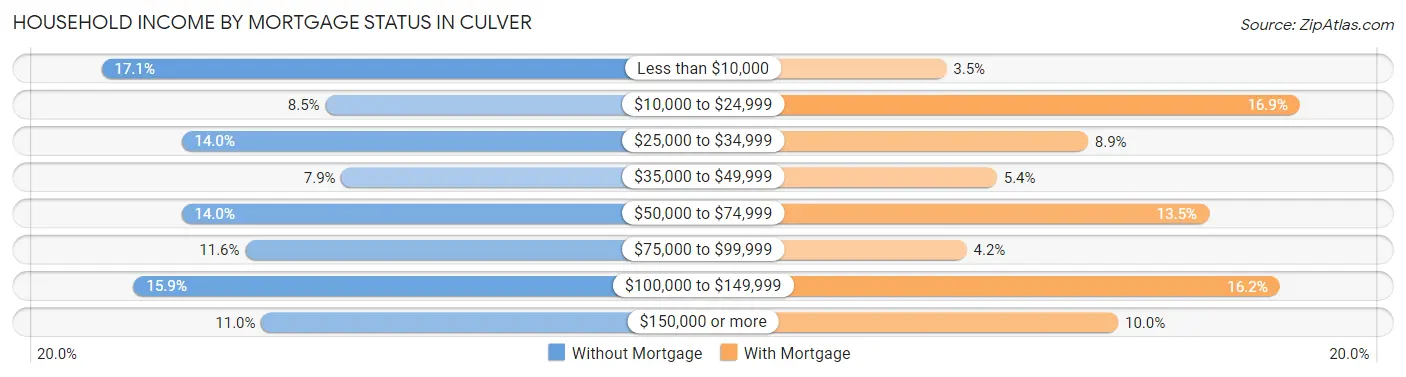
| Household Income | Without Mortgage | With Mortgage |
| Less than $10,000 | 28 (17.1%) | 9 (3.5%) |
| $10,000 to $24,999 | 14 (8.5%) | 44 (16.9%) |
| $25,000 to $34,999 | 23 (14.0%) | 23 (8.8%) |
| $35,000 to $49,999 | 13 (7.9%) | 14 (5.4%) |
| $50,000 to $74,999 | 23 (14.0%) | 35 (13.5%) |
| $75,000 to $99,999 | 19 (11.6%) | 11 (4.2%) |
| $100,000 to $149,999 | 26 (15.9%) | 42 (16.2%) |
| $150,000 or more | 18 (11.0%) | 26 (10.0%) |
| Total | 164 (100.0%) | 260 (100.0%) |
Property Value to Household Income Ratio in Culver
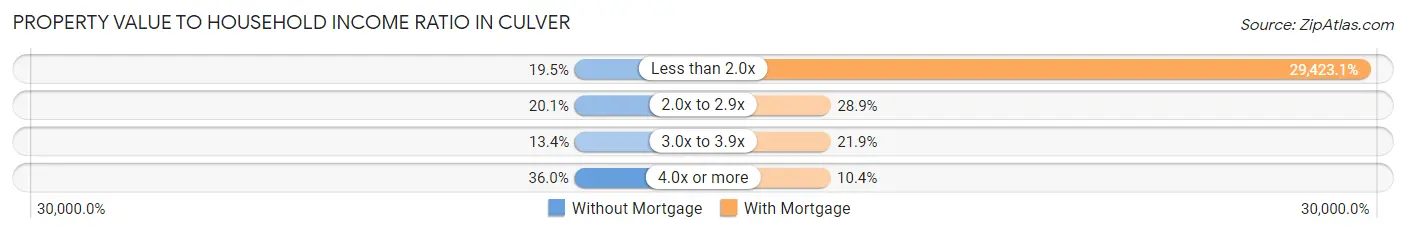
| Value-to-Income Ratio | Without Mortgage | With Mortgage |
| Less than 2.0x | 32 (19.5%) | 76,500 (29,423.1%) |
| 2.0x to 2.9x | 33 (20.1%) | 75 (28.8%) |
| 3.0x to 3.9x | 22 (13.4%) | 57 (21.9%) |
| 4.0x or more | 59 (36.0%) | 27 (10.4%) |
| Total | 164 (100.0%) | 260 (100.0%) |
Real Estate Taxes by Mortgage Status in Culver
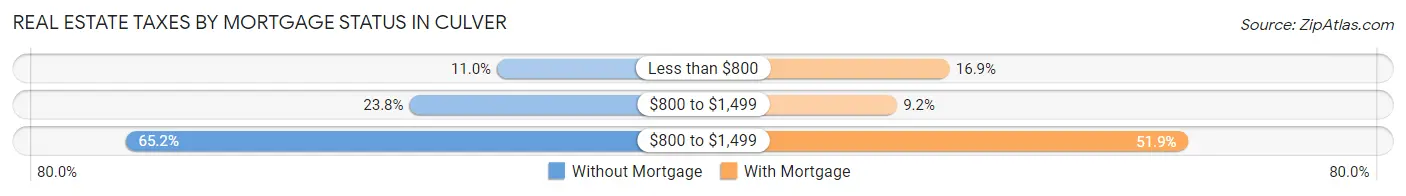
| Property Taxes | Without Mortgage | With Mortgage |
| Less than $800 | 18 (11.0%) | 44 (16.9%) |
| $800 to $1,499 | 39 (23.8%) | 24 (9.2%) |
| $800 to $1,499 | 107 (65.2%) | 135 (51.9%) |
| Total | 164 (100.0%) | 260 (100.0%) |
Health & Disability in Culver
Health Insurance Coverage by Age in Culver
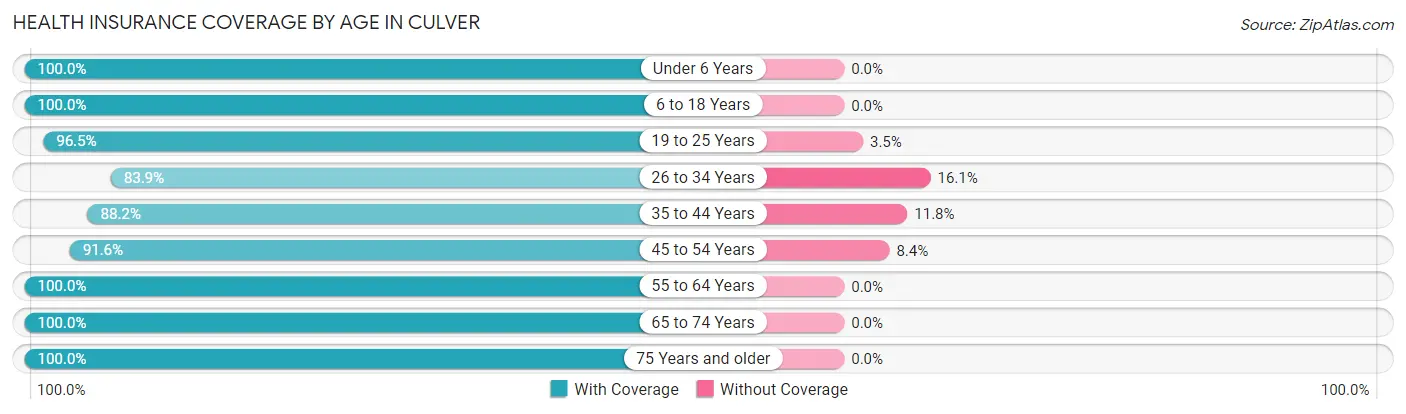
| Age Bracket | With Coverage | Without Coverage |
| Under 6 Years | 47 (100.0%) | 0 (0.0%) |
| 6 to 18 Years | 112 (100.0%) | 0 (0.0%) |
| 19 to 25 Years | 83 (96.5%) | 3 (3.5%) |
| 26 to 34 Years | 73 (83.9%) | 14 (16.1%) |
| 35 to 44 Years | 60 (88.2%) | 8 (11.8%) |
| 45 to 54 Years | 152 (91.6%) | 14 (8.4%) |
| 55 to 64 Years | 222 (100.0%) | 0 (0.0%) |
| 65 to 74 Years | 122 (100.0%) | 0 (0.0%) |
| 75 Years and older | 252 (100.0%) | 0 (0.0%) |
| Total | 1,123 (96.6%) | 39 (3.4%) |
Health Insurance Coverage by Citizenship Status in Culver
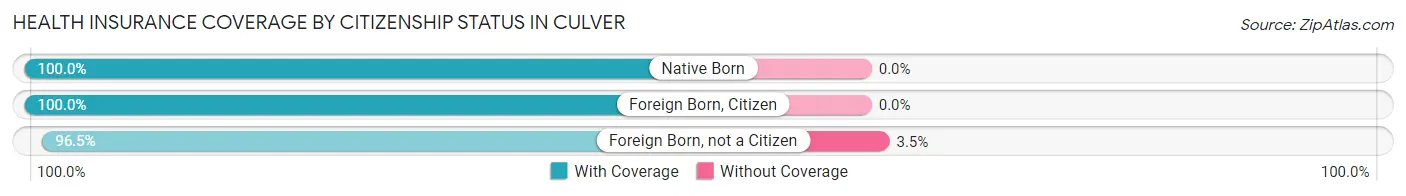
| Citizenship Status | With Coverage | Without Coverage |
| Native Born | 47 (100.0%) | 0 (0.0%) |
| Foreign Born, Citizen | 112 (100.0%) | 0 (0.0%) |
| Foreign Born, not a Citizen | 83 (96.5%) | 3 (3.5%) |
Health Insurance Coverage by Household Income in Culver
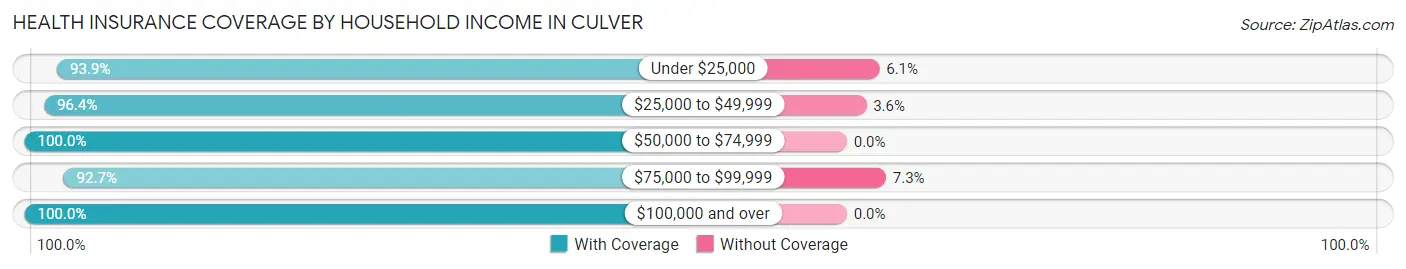
| Household Income | With Coverage | Without Coverage |
| Under $25,000 | 293 (93.9%) | 19 (6.1%) |
| $25,000 to $49,999 | 212 (96.4%) | 8 (3.6%) |
| $50,000 to $74,999 | 90 (100.0%) | 0 (0.0%) |
| $75,000 to $99,999 | 152 (92.7%) | 12 (7.3%) |
| $100,000 and over | 376 (100.0%) | 0 (0.0%) |
Public vs Private Health Insurance Coverage by Age in Culver
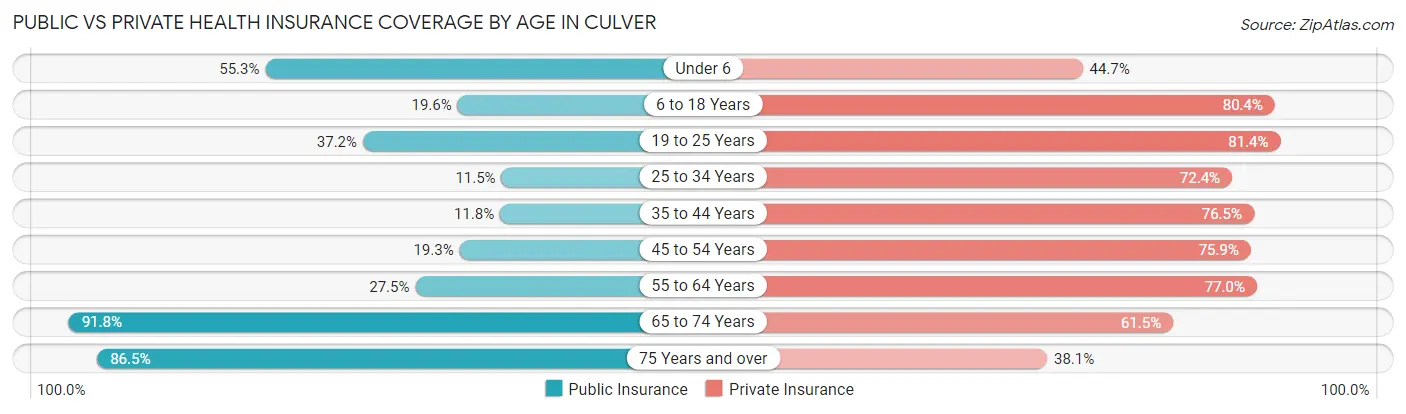
| Age Bracket | Public Insurance | Private Insurance |
| Under 6 | 26 (55.3%) | 21 (44.7%) |
| 6 to 18 Years | 22 (19.6%) | 90 (80.4%) |
| 19 to 25 Years | 32 (37.2%) | 70 (81.4%) |
| 25 to 34 Years | 10 (11.5%) | 63 (72.4%) |
| 35 to 44 Years | 8 (11.8%) | 52 (76.5%) |
| 45 to 54 Years | 32 (19.3%) | 126 (75.9%) |
| 55 to 64 Years | 61 (27.5%) | 171 (77.0%) |
| 65 to 74 Years | 112 (91.8%) | 75 (61.5%) |
| 75 Years and over | 218 (86.5%) | 96 (38.1%) |
| Total | 521 (44.8%) | 764 (65.7%) |
Disability Status by Sex by Age in Culver
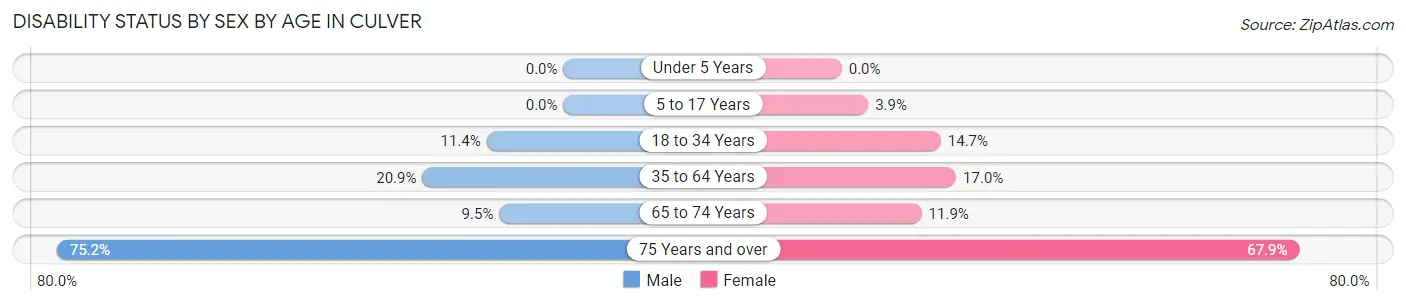
| Age Bracket | Male | Female |
| Under 5 Years | 0 (0.0%) | 0 (0.0%) |
| 5 to 17 Years | 0 (0.0%) | 2 (3.9%) |
| 18 to 34 Years | 13 (11.4%) | 10 (14.7%) |
| 35 to 64 Years | 40 (20.9%) | 45 (17.0%) |
| 65 to 74 Years | 6 (9.5%) | 7 (11.9%) |
| 75 Years and over | 91 (75.2%) | 89 (67.9%) |
Disability Class by Sex by Age in Culver
Disability Class: Hearing Difficulty
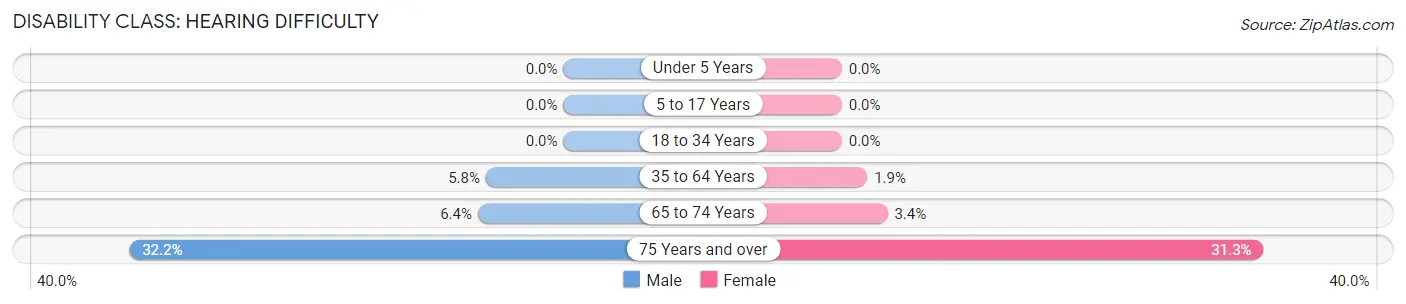
| Age Bracket | Male | Female |
| Under 5 Years | 0 (0.0%) | 0 (0.0%) |
| 5 to 17 Years | 0 (0.0%) | 0 (0.0%) |
| 18 to 34 Years | 0 (0.0%) | 0 (0.0%) |
| 35 to 64 Years | 11 (5.8%) | 5 (1.9%) |
| 65 to 74 Years | 4 (6.4%) | 2 (3.4%) |
| 75 Years and over | 39 (32.2%) | 41 (31.3%) |
Disability Class: Vision Difficulty
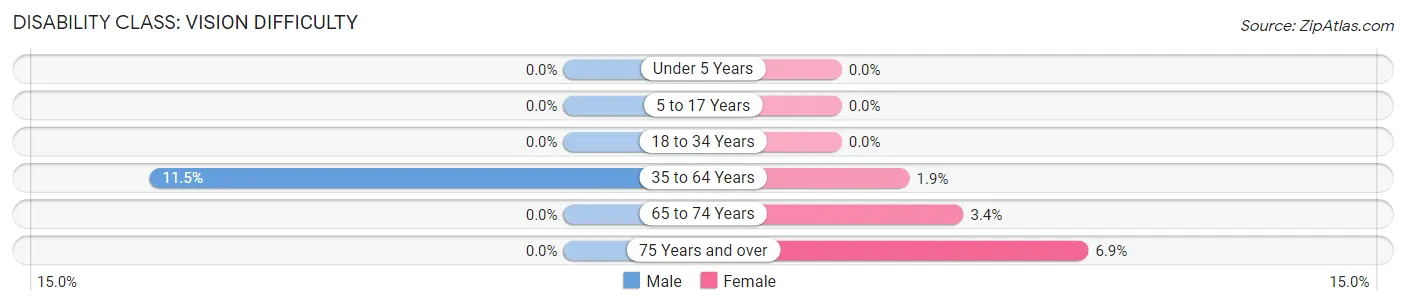
| Age Bracket | Male | Female |
| Under 5 Years | 0 (0.0%) | 0 (0.0%) |
| 5 to 17 Years | 0 (0.0%) | 0 (0.0%) |
| 18 to 34 Years | 0 (0.0%) | 0 (0.0%) |
| 35 to 64 Years | 22 (11.5%) | 5 (1.9%) |
| 65 to 74 Years | 0 (0.0%) | 2 (3.4%) |
| 75 Years and over | 0 (0.0%) | 9 (6.9%) |
Disability Class: Cognitive Difficulty
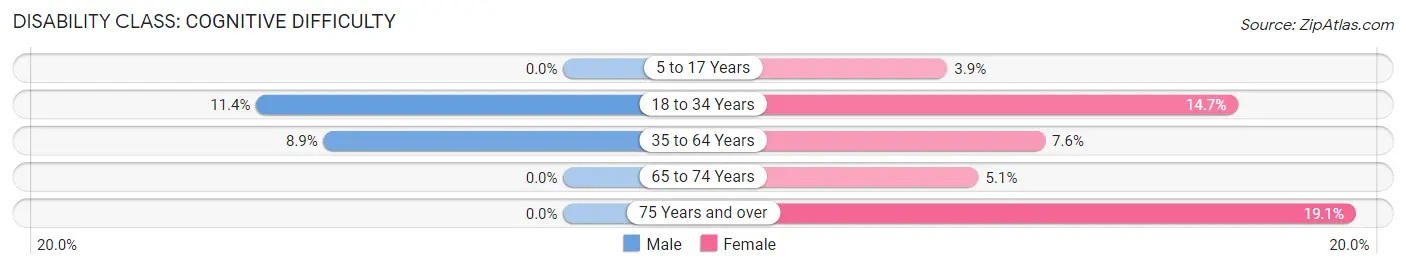
| Age Bracket | Male | Female |
| 5 to 17 Years | 0 (0.0%) | 2 (3.9%) |
| 18 to 34 Years | 13 (11.4%) | 10 (14.7%) |
| 35 to 64 Years | 17 (8.9%) | 20 (7.5%) |
| 65 to 74 Years | 0 (0.0%) | 3 (5.1%) |
| 75 Years and over | 0 (0.0%) | 25 (19.1%) |
Disability Class: Ambulatory Difficulty
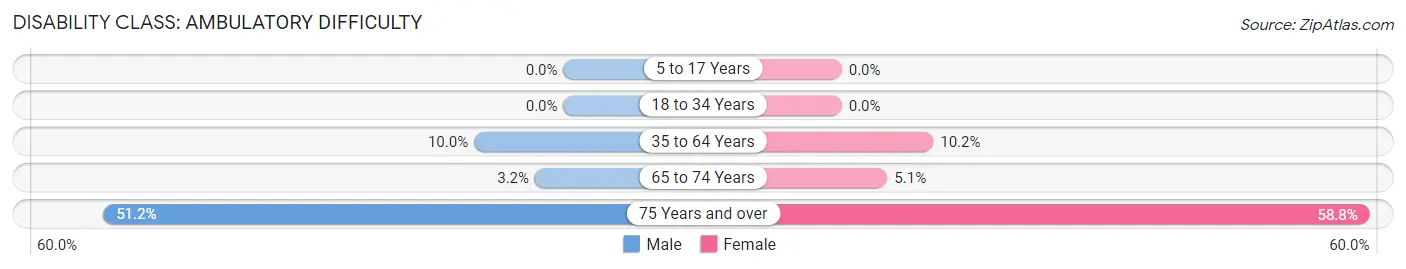
| Age Bracket | Male | Female |
| 5 to 17 Years | 0 (0.0%) | 0 (0.0%) |
| 18 to 34 Years | 0 (0.0%) | 0 (0.0%) |
| 35 to 64 Years | 19 (10.0%) | 27 (10.2%) |
| 65 to 74 Years | 2 (3.2%) | 3 (5.1%) |
| 75 Years and over | 62 (51.2%) | 77 (58.8%) |
Disability Class: Self-Care Difficulty
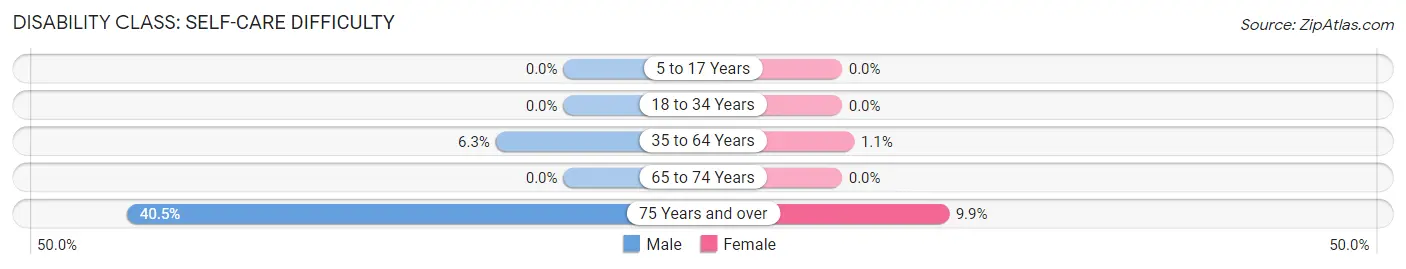
| Age Bracket | Male | Female |
| 5 to 17 Years | 0 (0.0%) | 0 (0.0%) |
| 18 to 34 Years | 0 (0.0%) | 0 (0.0%) |
| 35 to 64 Years | 12 (6.3%) | 3 (1.1%) |
| 65 to 74 Years | 0 (0.0%) | 0 (0.0%) |
| 75 Years and over | 49 (40.5%) | 13 (9.9%) |
Technology Access in Culver
Computing Device Access in Culver
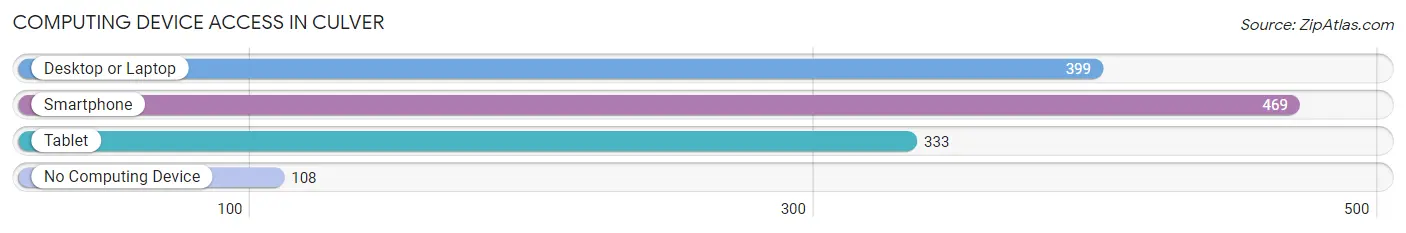
| Device Type | # Households | % Households |
| Desktop or Laptop | 399 | 67.4% |
| Smartphone | 469 | 79.2% |
| Tablet | 333 | 56.2% |
| No Computing Device | 108 | 18.2% |
| Total | 592 | 100.0% |
Internet Access in Culver
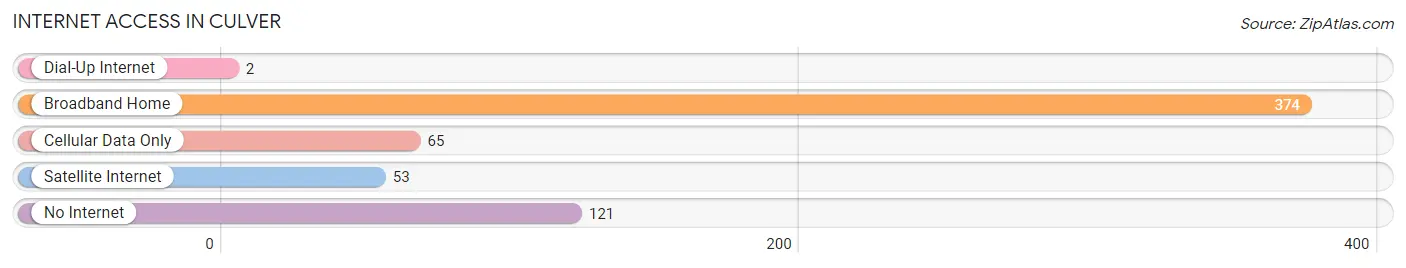
| Internet Type | # Households | % Households |
| Dial-Up Internet | 2 | 0.3% |
| Broadband Home | 374 | 63.2% |
| Cellular Data Only | 65 | 11.0% |
| Satellite Internet | 53 | 8.9% |
| No Internet | 121 | 20.4% |
| Total | 592 | 100.0% |
Culver Summary
Culver is a small town located in Marshall County, Indiana, United States. It is situated on the shores of Lake Maxinkuckee, the second largest natural lake in the state. The town was founded in 1837 by Henry B. Culver, a prominent local businessman. The population of Culver was 1,353 at the 2010 census.
Geography
Culver is located at 41°14′N 86°20′W (41.23, -86.33). According to the 2010 census, the town has a total area of 1.2 square miles (3.1 km2), all land.
History
Culver was founded in 1837 by Henry B. Culver, a prominent local businessman. The town was originally known as Culver's Station, and was a stop on the Michigan Southern Railroad. The town was officially incorporated in 1871.
In the late 19th century, Culver became a popular summer resort destination for wealthy Chicagoans. The town was home to several large resorts, including the Culver Hotel, the Lakeview Hotel, and the Culver Military Academy.
Economy
Culver's economy is largely based on tourism. The town is home to several popular attractions, including the Culver Military Academy, the Culver Marina, and the Maxinkuckee Country Club. The town also has several restaurants, shops, and other businesses catering to tourists.
Demographics
As of the 2010 census, there were 1,353 people, 545 households, and 355 families residing in the town. The population density was 1,097.5 people per square mile (423.2/km2). There were 602 housing units at an average density of 495.8 per square mile (191.3/km2). The racial makeup of the town was 97.2% White, 0.3% African American, 0.2% Native American, 0.2% Asian, 0.2% from other races, and 1.9% from two or more races. Hispanic or Latino of any race were 1.3% of the population.
There were 545 households, out of which 28.2% had children under the age of 18 living with them, 51.3% were married couples living together, 9.7% had a female householder with no husband present, and 34.7% were non-families. 29.3% of all households were made up of individuals, and 12.2% had someone living alone who was 65 years of age or older. The average household size was 2.41 and the average family size was 2.97.
In the town, the population was spread out, with 24.2% under the age of 18, 6.7% from 18 to 24, 25.2% from 25 to 44, 25.2% from 45 to 64, and 18.7% who were 65 years of age or older. The median age was 40 years. For every 100 females, there were 91.2 males. For every 100 females age 18 and over, there were 87.2 males.
The median income for a household in the town was $37,500, and the median income for a family was $45,000. Males had a median income of $31,250 versus $21,250 for females. The per capita income for the town was $18,945. About 5.2% of families and 8.2% of the population were below the poverty line, including 8.3% of those under age 18 and 8.3% of those age 65 or over.
Common Questions
What is Per Capita Income in Culver?
Per Capita income in Culver is $38,345.
What is the Median Family Income in Culver?
Median Family Income in Culver is $76,000.
What is the Median Household income in Culver?
Median Household Income in Culver is $40,556.
What is Income or Wage Gap in Culver?
Income or Wage Gap in Culver is 24.5%.
Women in Culver earn 75.5 cents for every dollar earned by a man.
What is Family Income Deficit in Culver?
Family Income Deficit in Culver is $13,501.
Families that are below poverty line in Culver earn $13,501 less on average than the poverty threshold level.
What is Inequality or Gini Index in Culver?
Inequality or Gini Index in Culver is 0.57.
What is the Total Population of Culver?
Total Population of Culver is 1,230.
What is the Total Male Population of Culver?
Total Male Population of Culver is 579.
What is the Total Female Population of Culver?
Total Female Population of Culver is 651.
What is the Ratio of Males per 100 Females in Culver?
There are 88.94 Males per 100 Females in Culver.
What is the Ratio of Females per 100 Males in Culver?
There are 112.44 Females per 100 Males in Culver.
What is the Median Population Age in Culver?
Median Population Age in Culver is 56.9 Years.
What is the Average Family Size in Culver
Average Family Size in Culver is 2.5 People.
What is the Average Household Size in Culver
Average Household Size in Culver is 2.0 People.
How Large is the Labor Force in Culver?
There are 494 People in the Labor Forcein in Culver.
What is the Percentage of People in the Labor Force in Culver?
44.6% of People are in the Labor Force in Culver.
What is the Unemployment Rate in Culver?
Unemployment Rate in Culver is 6.9%.