Zip Codes with the Highest Percentage of Population Employed in Agriculture, Fishing & Hunting in Columbus, IN
RELATED REPORTS & OPTIONS
Agriculture, Fishing & Hunting
Columbus
Compare Zip Codes
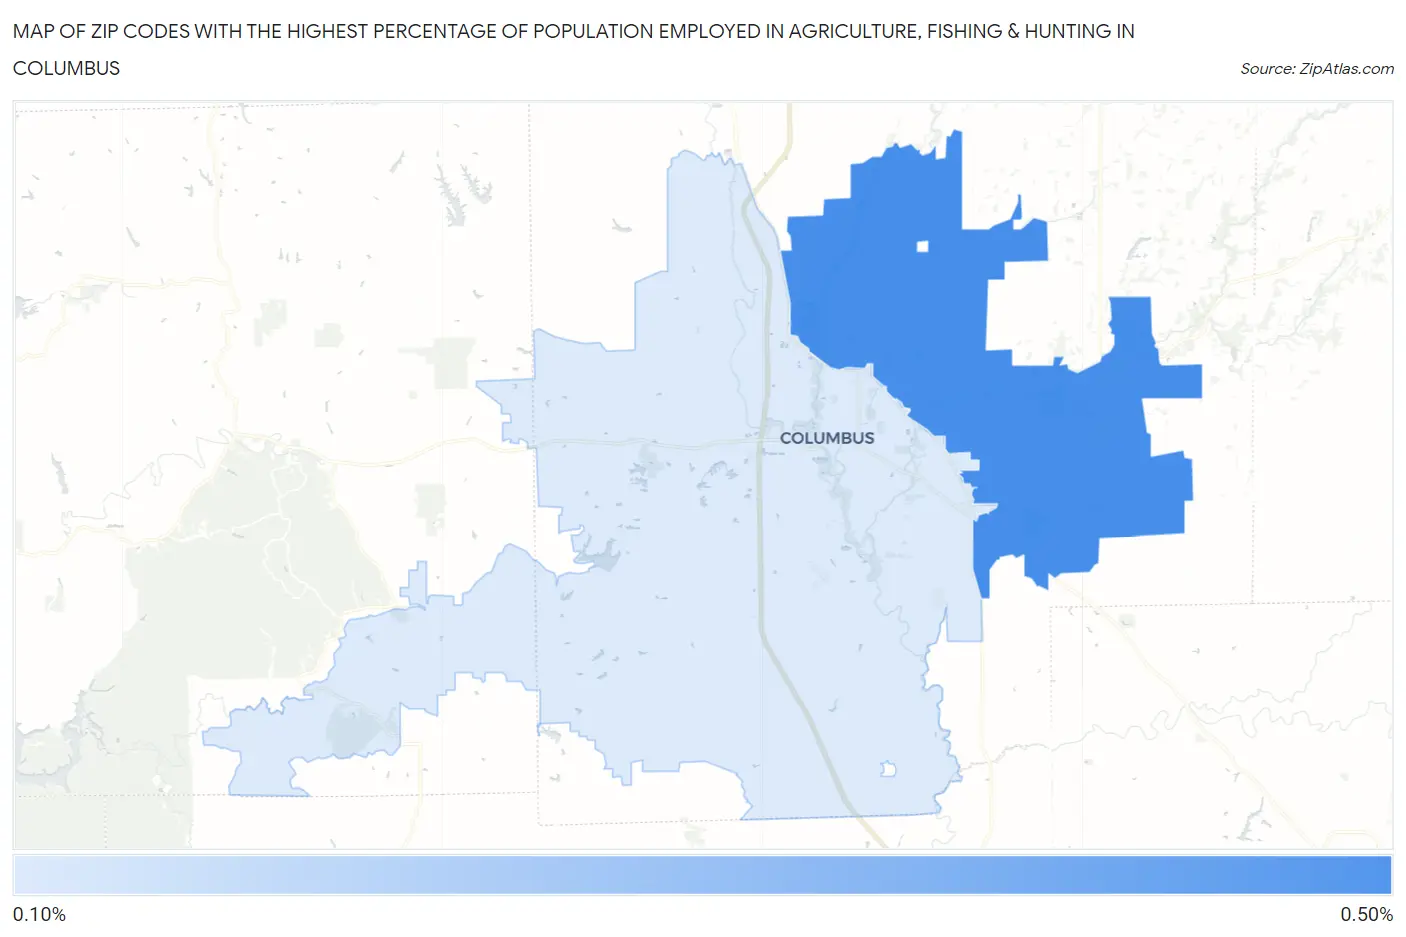
Map of Zip Codes with the Highest Percentage of Population Employed in Agriculture, Fishing & Hunting in Columbus
0.0%
0.50%
Zip Codes with the Highest Percentage of Population Employed in Agriculture, Fishing & Hunting in Columbus, IN
| Zip Code | % Employed | vs State | vs National | |
| 1. | 47203 | 0.44% | 1.1%(-0.616)#484 | 1.2%(-0.758)#19,781 |
| 2. | 47201 | 0.19% | 1.1%(-0.869)#551 | 1.2%(-1.01)#22,495 |
1
Common Questions
What are the Top Zip Codes with the Highest Percentage of Population Employed in Agriculture, Fishing & Hunting in Columbus, IN?
Top Zip Codes with the Highest Percentage of Population Employed in Agriculture, Fishing & Hunting in Columbus, IN are:
What zip code has the Highest Percentage of Population Employed in Agriculture, Fishing & Hunting in Columbus, IN?
47203 has the Highest Percentage of Population Employed in Agriculture, Fishing & Hunting in Columbus, IN with 0.44%.
What is the Percentage of Population Employed in Agriculture, Fishing & Hunting in Indiana?
Percentage of Population Employed in Agriculture, Fishing & Hunting in Indiana is 1.1%.
What is the Percentage of Population Employed in Agriculture, Fishing & Hunting in the United States?
Percentage of Population Employed in Agriculture, Fishing & Hunting in the United States is 1.2%.