Clay City, IN Map & Demographics
Clay City Map
Clay City Overview
$23,852
PER CAPITA INCOME
$69,182
AVG FAMILY INCOME
$56,250
AVG HOUSEHOLD INCOME
21.8%
WAGE / INCOME GAP [ % ]
78.2¢/ $1
WAGE / INCOME GAP [ $ ]
0.38
INEQUALITY / GINI INDEX
1,135
TOTAL POPULATION
617
MALE POPULATION
518
FEMALE POPULATION
119.11
MALES / 100 FEMALES
83.95
FEMALES / 100 MALES
34.6
MEDIAN AGE
3.1
AVG FAMILY SIZE
2.5
AVG HOUSEHOLD SIZE
602
LABOR FORCE [ PEOPLE ]
71.7%
PERCENT IN LABOR FORCE
2.3%
UNEMPLOYMENT RATE
Clay City Zip Codes
Clay City Area Codes
Income in Clay City
Income Overview in Clay City
Per Capita Income in Clay City is $23,852, while median incomes of families and households are $69,182 and $56,250 respectively.
| Characteristic | Number | Measure |
| Per Capita Income | 1,135 | $23,852 |
| Median Family Income | 284 | $69,182 |
| Mean Family Income | 284 | $72,694 |
| Median Household Income | 459 | $56,250 |
| Mean Household Income | 459 | $58,658 |
| Income Deficit | 284 | $0 |
| Wage / Income Gap (%) | 1,135 | 21.81% |
| Wage / Income Gap ($) | 1,135 | 78.19¢ per $1 |
| Gini / Inequality Index | 1,135 | 0.38 |
Earnings by Sex in Clay City
Average Earnings in Clay City are $34,416, $41,597 for men and $32,524 for women, a difference of 21.8%.
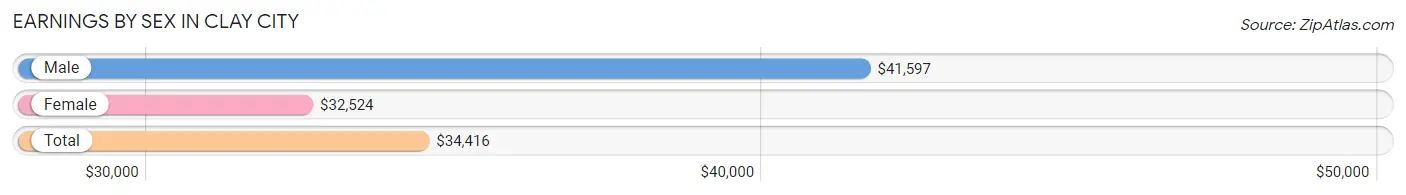
| Sex | Number | Average Earnings |
| Male | 325 (52.8%) | $41,597 |
| Female | 291 (47.2%) | $32,524 |
| Total | 616 (100.0%) | $34,416 |
Earnings by Sex by Income Bracket in Clay City
The most common earnings brackets in Clay City are $30,000 to $34,999 for men (90 | 27.7%) and $30,000 to $34,999 for women (79 | 27.2%).
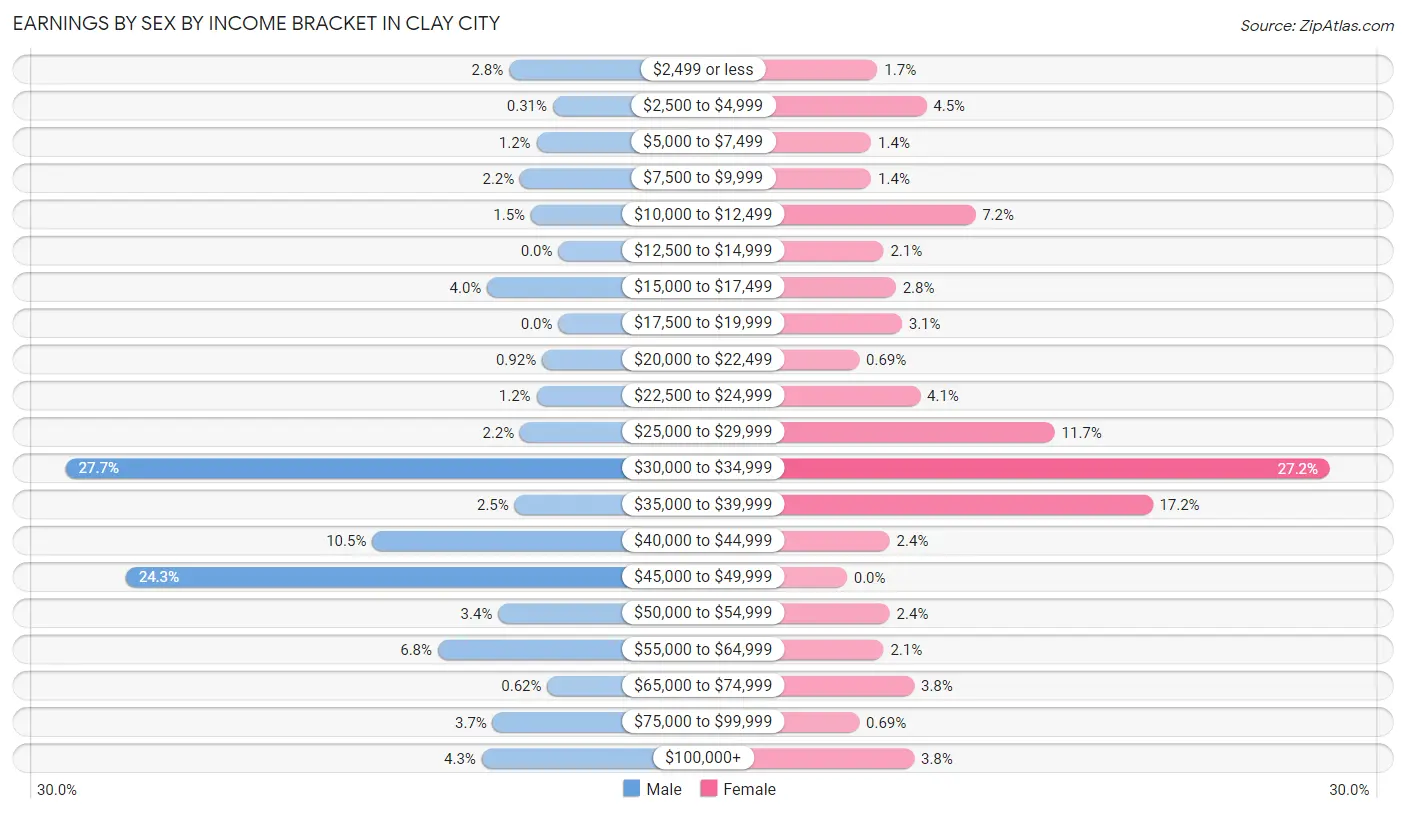
| Income | Male | Female |
| $2,499 or less | 9 (2.8%) | 5 (1.7%) |
| $2,500 to $4,999 | 1 (0.3%) | 13 (4.5%) |
| $5,000 to $7,499 | 4 (1.2%) | 4 (1.4%) |
| $7,500 to $9,999 | 7 (2.1%) | 4 (1.4%) |
| $10,000 to $12,499 | 5 (1.5%) | 21 (7.2%) |
| $12,500 to $14,999 | 0 (0.0%) | 6 (2.1%) |
| $15,000 to $17,499 | 13 (4.0%) | 8 (2.8%) |
| $17,500 to $19,999 | 0 (0.0%) | 9 (3.1%) |
| $20,000 to $22,499 | 3 (0.9%) | 2 (0.7%) |
| $22,500 to $24,999 | 4 (1.2%) | 12 (4.1%) |
| $25,000 to $29,999 | 7 (2.1%) | 34 (11.7%) |
| $30,000 to $34,999 | 90 (27.7%) | 79 (27.2%) |
| $35,000 to $39,999 | 8 (2.5%) | 50 (17.2%) |
| $40,000 to $44,999 | 34 (10.5%) | 7 (2.4%) |
| $45,000 to $49,999 | 79 (24.3%) | 0 (0.0%) |
| $50,000 to $54,999 | 11 (3.4%) | 7 (2.4%) |
| $55,000 to $64,999 | 22 (6.8%) | 6 (2.1%) |
| $65,000 to $74,999 | 2 (0.6%) | 11 (3.8%) |
| $75,000 to $99,999 | 12 (3.7%) | 2 (0.7%) |
| $100,000+ | 14 (4.3%) | 11 (3.8%) |
| Total | 325 (100.0%) | 291 (100.0%) |
Earnings by Sex by Educational Attainment in Clay City
Average earnings in Clay City are $45,018 for men and $33,822 for women, a difference of 24.9%. Men with an educational attainment of college or associate's degree enjoy the highest average annual earnings of $46,176, while those with high school diploma education earn the least with $42,411. Women with an educational attainment of bachelor's degree earn the most with the average annual earnings of $39,070, while those with college or associate's degree education have the smallest earnings of $32,000.
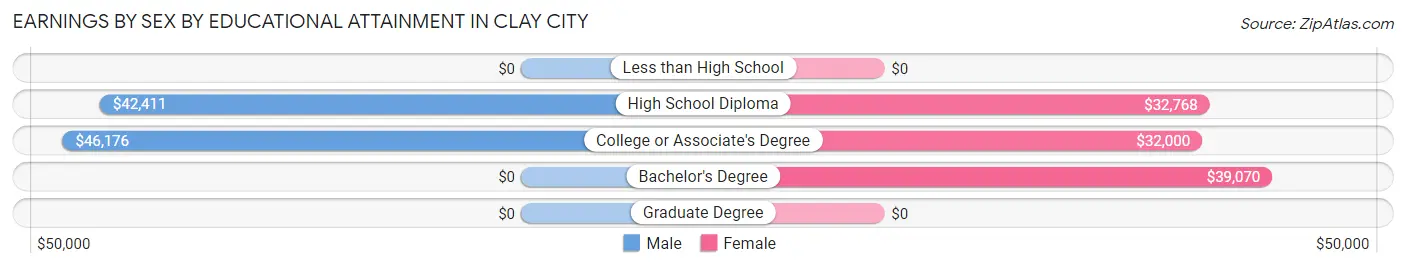
| Educational Attainment | Male Income | Female Income |
| Less than High School | - | - |
| High School Diploma | $42,411 | $32,768 |
| College or Associate's Degree | $46,176 | $32,000 |
| Bachelor's Degree | - | - |
| Graduate Degree | - | - |
| Total | $45,018 | $33,822 |
Family Income in Clay City
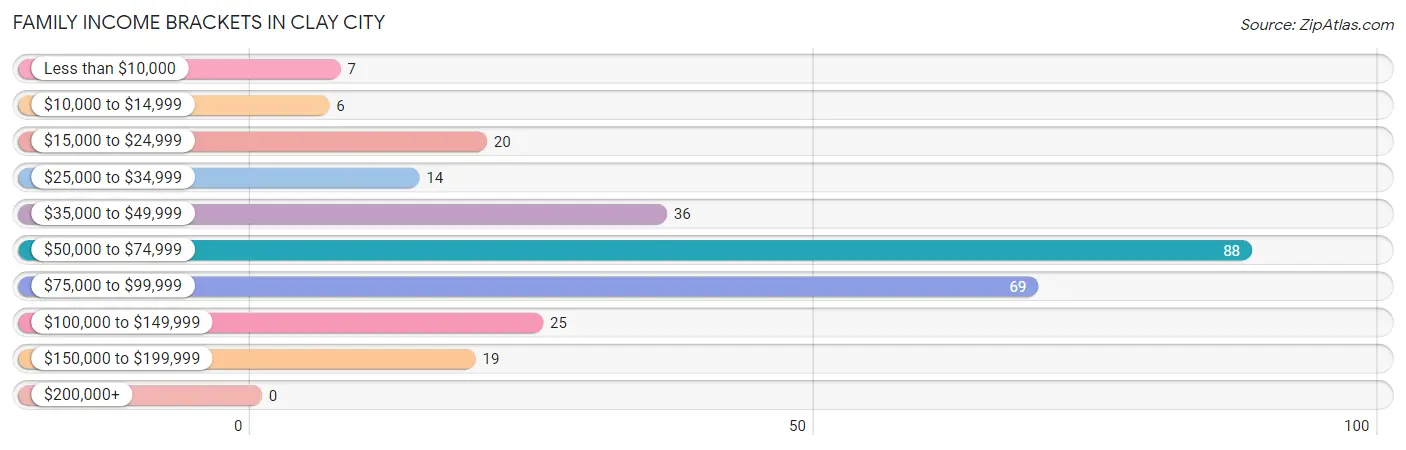
Family Income Brackets in Clay City
According to the Clay City family income data, there are 88 families falling into the $50,000 to $74,999 income range, which is the most common income bracket and makes up 31.0% of all families.
| Income Bracket | # Families | % Families |
| Less than $10,000 | 7 | 2.5% |
| $10,000 to $14,999 | 6 | 2.1% |
| $15,000 to $24,999 | 20 | 7.0% |
| $25,000 to $34,999 | 14 | 4.9% |
| $35,000 to $49,999 | 36 | 12.7% |
| $50,000 to $74,999 | 88 | 31.0% |
| $75,000 to $99,999 | 69 | 24.3% |
| $100,000 to $149,999 | 25 | 8.8% |
| $150,000 to $199,999 | 19 | 6.7% |
| $200,000+ | 0 | 0.0% |
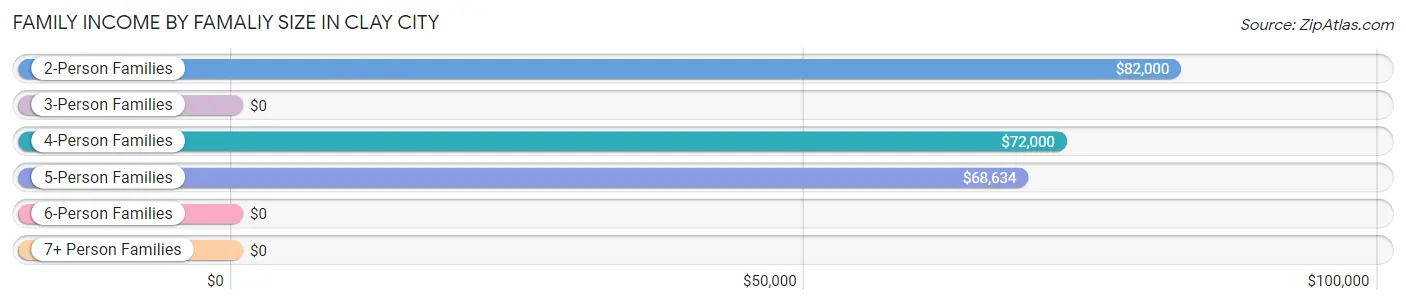
Family Income by Famaliy Size in Clay City
2-person families (150 | 52.8%) account for the highest median family income in Clay City with $82,000 per family, while 2-person families (150 | 52.8%) have the highest median income of $41,000 per family member.
| Income Bracket | # Families | Median Income |
| 2-Person Families | 150 (52.8%) | $82,000 |
| 3-Person Families | 43 (15.1%) | $0 |
| 4-Person Families | 26 (9.1%) | $72,000 |
| 5-Person Families | 65 (22.9%) | $68,634 |
| 6-Person Families | 0 (0.0%) | $0 |
| 7+ Person Families | 0 (0.0%) | $0 |
| Total | 284 (100.0%) | $69,182 |
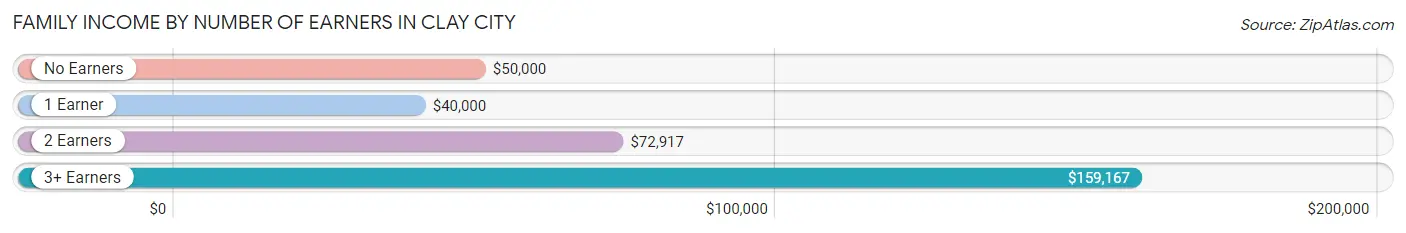
Family Income by Number of Earners in Clay City
The median family income in Clay City is $69,182, with families comprising 3+ earners (14) having the highest median family income of $159,167, while families with 1 earner (80) have the lowest median family income of $40,000, accounting for 4.9% and 28.2% of families, respectively.
| Number of Earners | # Families | Median Income |
| No Earners | 16 (5.6%) | $50,000 |
| 1 Earner | 80 (28.2%) | $40,000 |
| 2 Earners | 174 (61.3%) | $72,917 |
| 3+ Earners | 14 (4.9%) | $159,167 |
| Total | 284 (100.0%) | $69,182 |
Household Income in Clay City
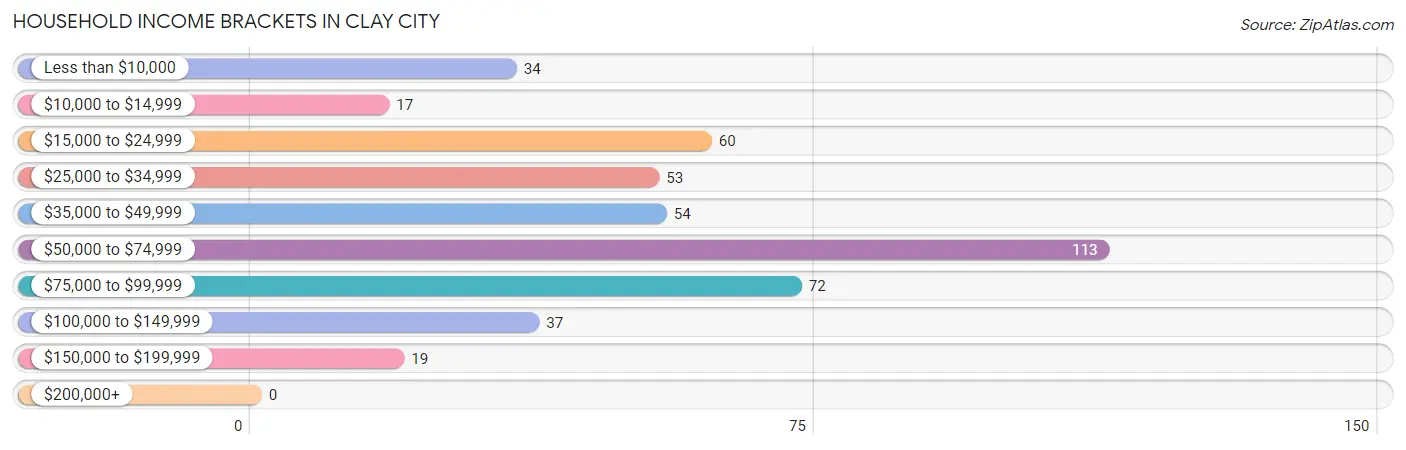
Household Income Brackets in Clay City
With 113 households falling in the category, the $50,000 to $74,999 income range is the most frequent in Clay City, accounting for 24.6% of all households.
| Income Bracket | # Households | % Households |
| Less than $10,000 | 34 | 7.4% |
| $10,000 to $14,999 | 17 | 3.7% |
| $15,000 to $24,999 | 60 | 13.1% |
| $25,000 to $34,999 | 53 | 11.5% |
| $35,000 to $49,999 | 54 | 11.8% |
| $50,000 to $74,999 | 113 | 24.6% |
| $75,000 to $99,999 | 72 | 15.7% |
| $100,000 to $149,999 | 37 | 8.1% |
| $150,000 to $199,999 | 19 | 4.1% |
| $200,000+ | 0 | 0.0% |
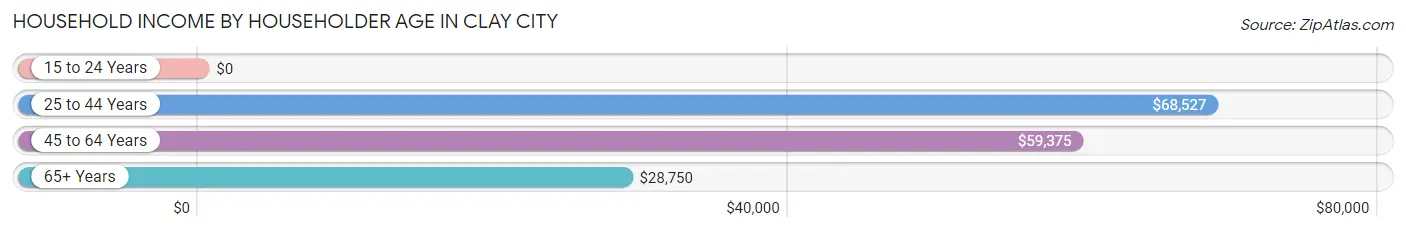
Household Income by Householder Age in Clay City
The median household income in Clay City is $56,250, with the highest median household income of $68,527 found in the 25 to 44 years age bracket for the primary householder. A total of 138 households (30.1%) fall into this category. Meanwhile, the 15 to 24 years age bracket for the primary householder has the lowest median household income of $0, with 41 households (8.9%) in this group.
| Income Bracket | # Households | Median Income |
| 15 to 24 Years | 41 (8.9%) | $0 |
| 25 to 44 Years | 138 (30.1%) | $68,527 |
| 45 to 64 Years | 183 (39.9%) | $59,375 |
| 65+ Years | 97 (21.1%) | $28,750 |
| Total | 459 (100.0%) | $56,250 |
Poverty in Clay City
Income Below Poverty by Sex and Age in Clay City
With 10.0% poverty level for males and 15.1% for females among the residents of Clay City, 65 to 74 year old males and under 5 year old females are the most vulnerable to poverty, with 13 males (40.6%) and 8 females (61.5%) in their respective age groups living below the poverty level.
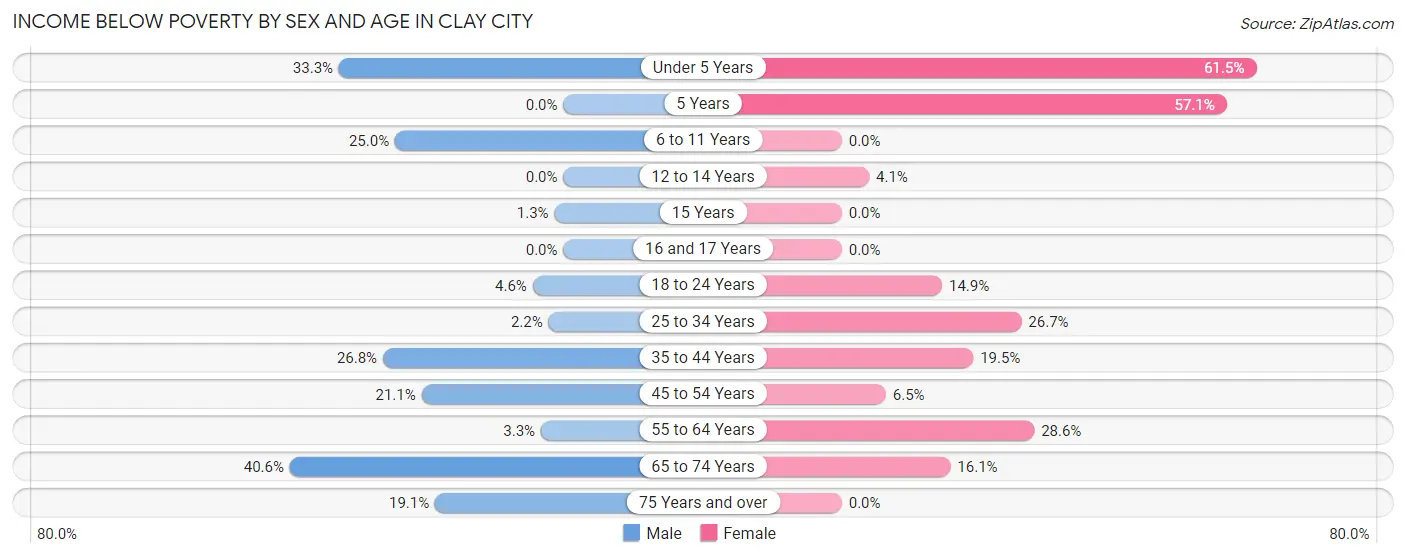
| Age Bracket | Male | Female |
| Under 5 Years | 5 (33.3%) | 8 (61.5%) |
| 5 Years | 0 (0.0%) | 4 (57.1%) |
| 6 to 11 Years | 5 (25.0%) | 0 (0.0%) |
| 12 to 14 Years | 0 (0.0%) | 3 (4.1%) |
| 15 Years | 1 (1.3%) | 0 (0.0%) |
| 16 and 17 Years | 0 (0.0%) | 0 (0.0%) |
| 18 to 24 Years | 3 (4.5%) | 7 (14.9%) |
| 25 to 34 Years | 2 (2.2%) | 20 (26.7%) |
| 35 to 44 Years | 15 (26.8%) | 8 (19.5%) |
| 45 to 54 Years | 8 (21.0%) | 7 (6.5%) |
| 55 to 64 Years | 4 (3.3%) | 16 (28.6%) |
| 65 to 74 Years | 13 (40.6%) | 5 (16.1%) |
| 75 Years and over | 4 (19.1%) | 0 (0.0%) |
| Total | 60 (10.0%) | 78 (15.1%) |
Income Above Poverty by Sex and Age in Clay City
According to the poverty statistics in Clay City, males aged 5 years and females aged 6 to 11 years are the age groups that are most secure financially, with 100.0% of males and 100.0% of females in these age groups living above the poverty line.
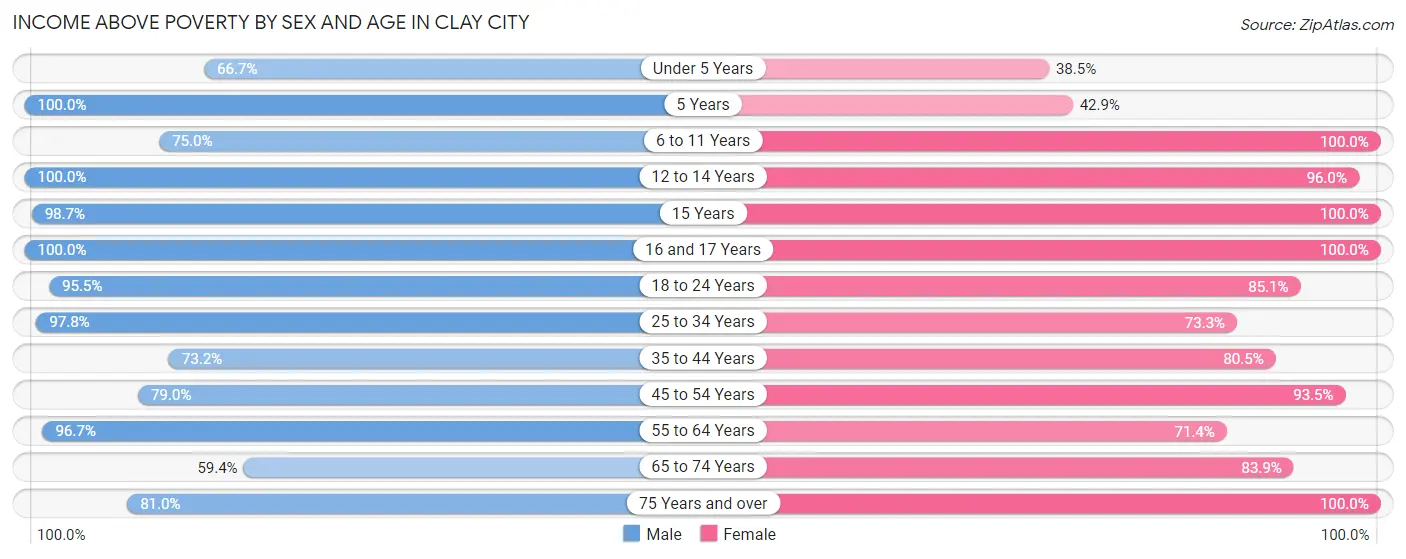
| Age Bracket | Male | Female |
| Under 5 Years | 10 (66.7%) | 5 (38.5%) |
| 5 Years | 1 (100.0%) | 3 (42.9%) |
| 6 to 11 Years | 15 (75.0%) | 14 (100.0%) |
| 12 to 14 Years | 56 (100.0%) | 71 (96.0%) |
| 15 Years | 75 (98.7%) | 4 (100.0%) |
| 16 and 17 Years | 11 (100.0%) | 7 (100.0%) |
| 18 to 24 Years | 63 (95.5%) | 40 (85.1%) |
| 25 to 34 Years | 89 (97.8%) | 55 (73.3%) |
| 35 to 44 Years | 41 (73.2%) | 33 (80.5%) |
| 45 to 54 Years | 30 (78.9%) | 100 (93.5%) |
| 55 to 64 Years | 116 (96.7%) | 40 (71.4%) |
| 65 to 74 Years | 19 (59.4%) | 26 (83.9%) |
| 75 Years and over | 17 (80.9%) | 41 (100.0%) |
| Total | 543 (90.0%) | 439 (84.9%) |
Income Below Poverty Among Married-Couple Families in Clay City
The poverty statistics for married-couple families in Clay City show that 7.9% or 18 of the total 227 families live below the poverty line. Families with 1 or 2 children have the highest poverty rate of 26.7%, comprising of 8 families. On the other hand, families with no children have the lowest poverty rate of 2.3%, which includes 3 families.
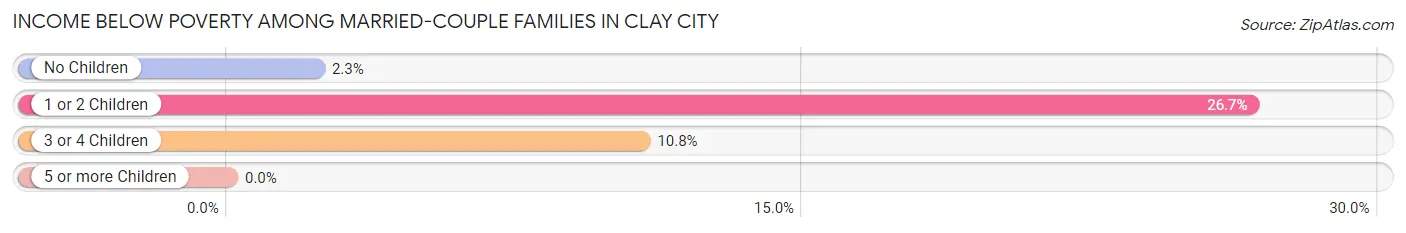
| Children | Above Poverty | Below Poverty |
| No Children | 129 (97.7%) | 3 (2.3%) |
| 1 or 2 Children | 22 (73.3%) | 8 (26.7%) |
| 3 or 4 Children | 58 (89.2%) | 7 (10.8%) |
| 5 or more Children | 0 (0.0%) | 0 (0.0%) |
| Total | 209 (92.1%) | 18 (7.9%) |
Income Below Poverty Among Single-Parent Households in Clay City
According to the poverty data in Clay City, 11.8% or 2 single-father households and 7.5% or 3 single-mother households are living below the poverty line. Among single-father households, those with 1 or 2 children have the highest poverty rate, with 2 households (15.4%) experiencing poverty. Likewise, among single-mother households, those with 1 or 2 children have the highest poverty rate, with 3 households (11.1%) falling below the poverty line.
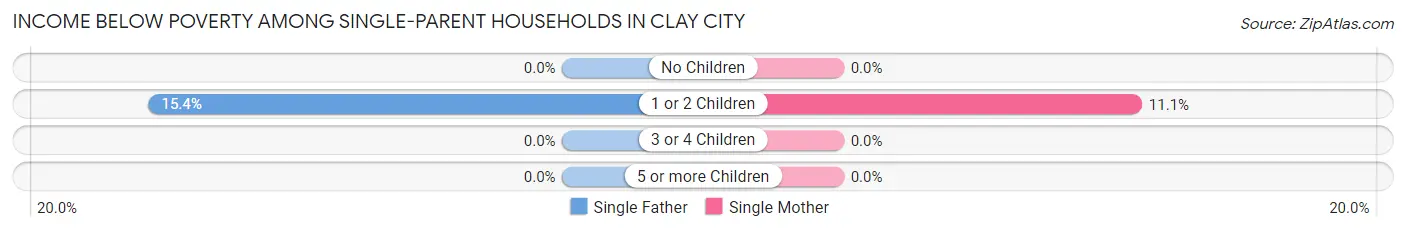
| Children | Single Father | Single Mother |
| No Children | 0 (0.0%) | 0 (0.0%) |
| 1 or 2 Children | 2 (15.4%) | 3 (11.1%) |
| 3 or 4 Children | 0 (0.0%) | 0 (0.0%) |
| 5 or more Children | 0 (0.0%) | 0 (0.0%) |
| Total | 2 (11.8%) | 3 (7.5%) |
Income Below Poverty Among Married-Couple vs Single-Parent Households in Clay City
The poverty data for Clay City shows that 18 of the married-couple family households (7.9%) and 5 of the single-parent households (8.8%) are living below the poverty level. Within the married-couple family households, those with 1 or 2 children have the highest poverty rate, with 8 households (26.7%) falling below the poverty line. Among the single-parent households, those with 1 or 2 children have the highest poverty rate, with 5 household (12.5%) living below poverty.
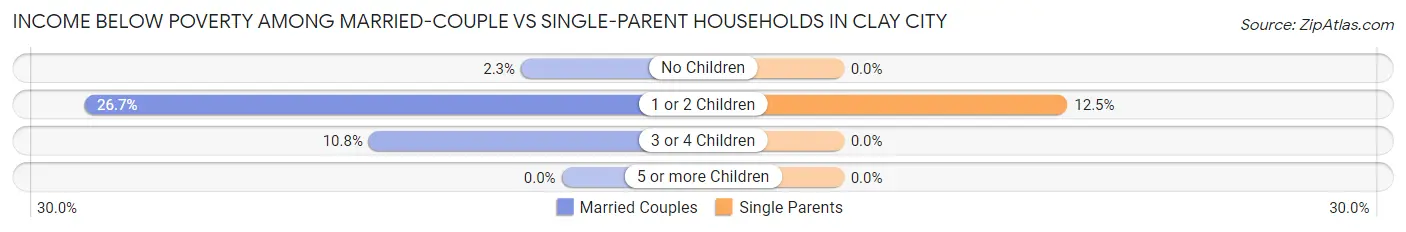
| Children | Married-Couple Families | Single-Parent Households |
| No Children | 3 (2.3%) | 0 (0.0%) |
| 1 or 2 Children | 8 (26.7%) | 5 (12.5%) |
| 3 or 4 Children | 7 (10.8%) | 0 (0.0%) |
| 5 or more Children | 0 (0.0%) | 0 (0.0%) |
| Total | 18 (7.9%) | 5 (8.8%) |
Race in Clay City
The most populous races in Clay City are White / Caucasian (1,084 | 95.5%), Two or more Races (48 | 4.2%), and Hispanic or Latino (6 | 0.5%).
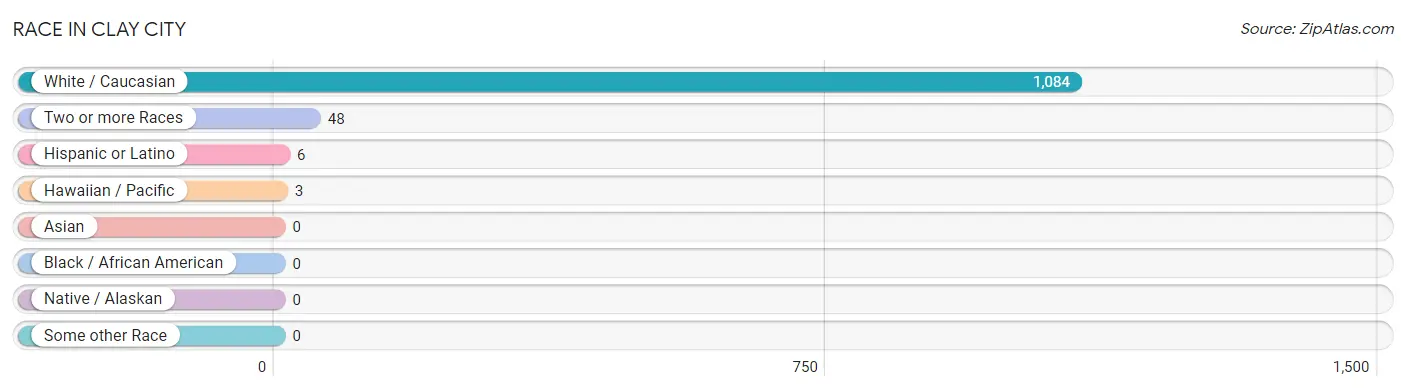
| Race | # Population | % Population |
| Asian | 0 | 0.0% |
| Black / African American | 0 | 0.0% |
| Hawaiian / Pacific | 3 | 0.3% |
| Hispanic or Latino | 6 | 0.5% |
| Native / Alaskan | 0 | 0.0% |
| White / Caucasian | 1,084 | 95.5% |
| Two or more Races | 48 | 4.2% |
| Some other Race | 0 | 0.0% |
| Total | 1,135 | 100.0% |
Ancestry in Clay City
The most populous ancestries reported in Clay City are German (300 | 26.4%), Irish (116 | 10.2%), English (75 | 6.6%), American (74 | 6.5%), and French (68 | 6.0%), together accounting for 55.8% of all Clay City residents.
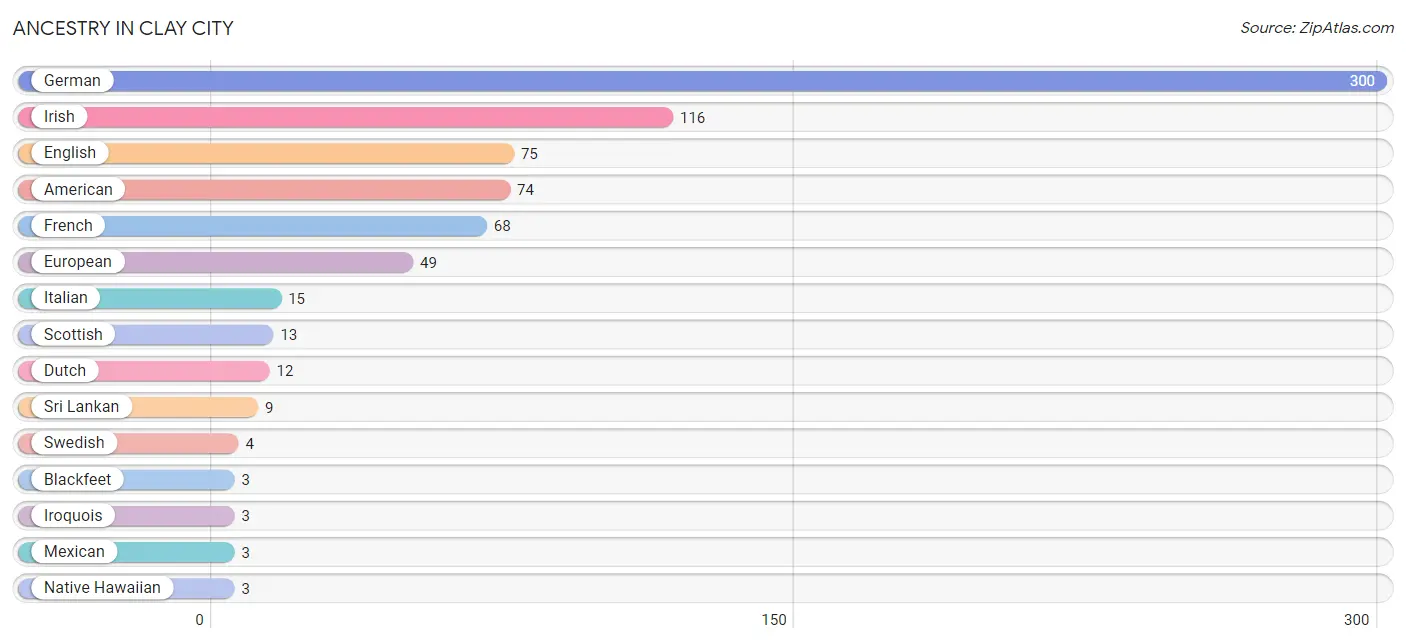
| Ancestry | # Population | % Population |
| American | 74 | 6.5% |
| Apache | 1 | 0.1% |
| Austrian | 1 | 0.1% |
| Blackfeet | 3 | 0.3% |
| British | 2 | 0.2% |
| Cherokee | 1 | 0.1% |
| Dutch | 12 | 1.1% |
| English | 75 | 6.6% |
| European | 49 | 4.3% |
| French | 68 | 6.0% |
| German | 300 | 26.4% |
| Irish | 116 | 10.2% |
| Iroquois | 3 | 0.3% |
| Italian | 15 | 1.3% |
| Mexican | 3 | 0.3% |
| Native Hawaiian | 3 | 0.3% |
| Norwegian | 2 | 0.2% |
| Polish | 1 | 0.1% |
| Scotch-Irish | 2 | 0.2% |
| Scottish | 13 | 1.1% |
| Sri Lankan | 9 | 0.8% |
| Swedish | 4 | 0.4% | View All 22 Rows |
Immigrants in Clay City
The most numerous immigrant groups reported in Clay City came from Europe (3 | 0.3%), Germany (3 | 0.3%), and Western Europe (3 | 0.3%), together accounting for 0.8% of all Clay City residents.
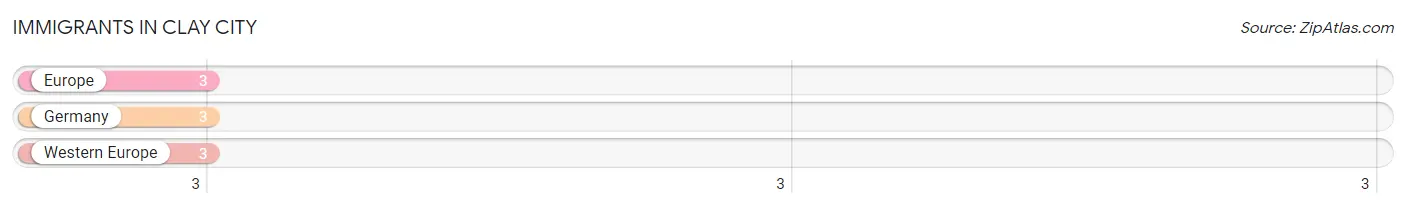
| Immigration Origin | # Population | % Population |
| Europe | 3 | 0.3% |
| Germany | 3 | 0.3% |
| Western Europe | 3 | 0.3% | View All 3 Rows |
Sex and Age in Clay City
Sex and Age in Clay City
The most populous age groups in Clay City are 15 to 19 Years (132 | 21.4%) for men and 50 to 54 Years (81 | 15.6%) for women.
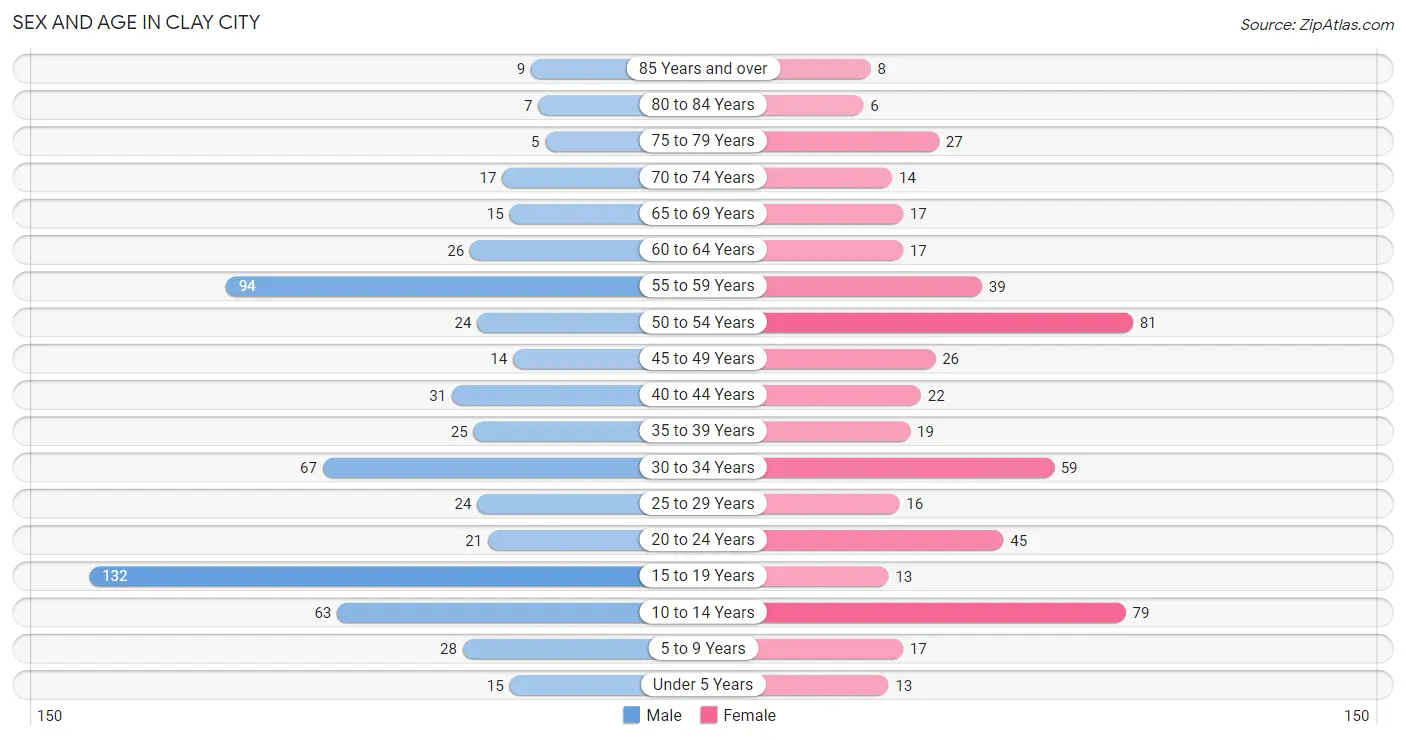
| Age Bracket | Male | Female |
| Under 5 Years | 15 (2.4%) | 13 (2.5%) |
| 5 to 9 Years | 28 (4.5%) | 17 (3.3%) |
| 10 to 14 Years | 63 (10.2%) | 79 (15.2%) |
| 15 to 19 Years | 132 (21.4%) | 13 (2.5%) |
| 20 to 24 Years | 21 (3.4%) | 45 (8.7%) |
| 25 to 29 Years | 24 (3.9%) | 16 (3.1%) |
| 30 to 34 Years | 67 (10.9%) | 59 (11.4%) |
| 35 to 39 Years | 25 (4.1%) | 19 (3.7%) |
| 40 to 44 Years | 31 (5.0%) | 22 (4.3%) |
| 45 to 49 Years | 14 (2.3%) | 26 (5.0%) |
| 50 to 54 Years | 24 (3.9%) | 81 (15.6%) |
| 55 to 59 Years | 94 (15.2%) | 39 (7.5%) |
| 60 to 64 Years | 26 (4.2%) | 17 (3.3%) |
| 65 to 69 Years | 15 (2.4%) | 17 (3.3%) |
| 70 to 74 Years | 17 (2.8%) | 14 (2.7%) |
| 75 to 79 Years | 5 (0.8%) | 27 (5.2%) |
| 80 to 84 Years | 7 (1.1%) | 6 (1.2%) |
| 85 Years and over | 9 (1.5%) | 8 (1.5%) |
| Total | 617 (100.0%) | 518 (100.0%) |
Families and Households in Clay City
Median Family Size in Clay City
The median family size in Clay City is 3.07 persons per family, with married-couple families (227 | 79.9%) accounting for the largest median family size of 3.18 persons per family. On the other hand, single female/mother families (40 | 14.1%) represent the smallest median family size with 2.55 persons per family.
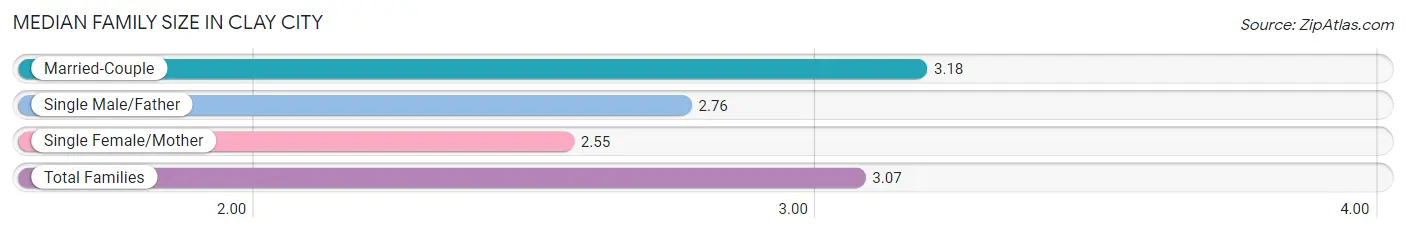
| Family Type | # Families | Family Size |
| Married-Couple | 227 (79.9%) | 3.18 |
| Single Male/Father | 17 (6.0%) | 2.76 |
| Single Female/Mother | 40 (14.1%) | 2.55 |
| Total Families | 284 (100.0%) | 3.07 |
Median Household Size in Clay City
The median household size in Clay City is 2.47 persons per household, with single male/father households (17 | 3.7%) accounting for the largest median household size of 3.41 persons per household. non-family households (175 | 38.1%) represent the smallest median household size with 1.39 persons per household.
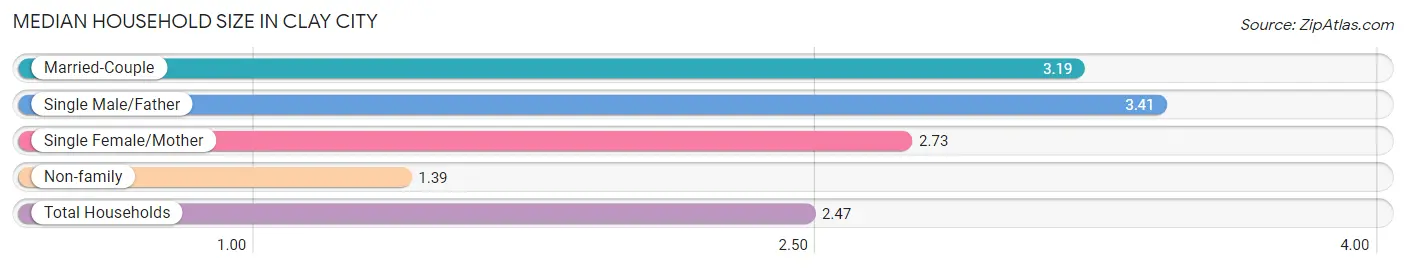
| Household Type | # Households | Household Size |
| Married-Couple | 227 (49.5%) | 3.19 |
| Single Male/Father | 17 (3.7%) | 3.41 |
| Single Female/Mother | 40 (8.7%) | 2.73 |
| Non-family | 175 (38.1%) | 1.39 |
| Total Households | 459 (100.0%) | 2.47 |
Household Size by Marriage Status in Clay City
Out of a total of 459 households in Clay City, 284 (61.9%) are family households, while 175 (38.1%) are nonfamily households. The most numerous type of family households are 2-person households, comprising 142, and the most common type of nonfamily households are 1-person households, comprising 141.
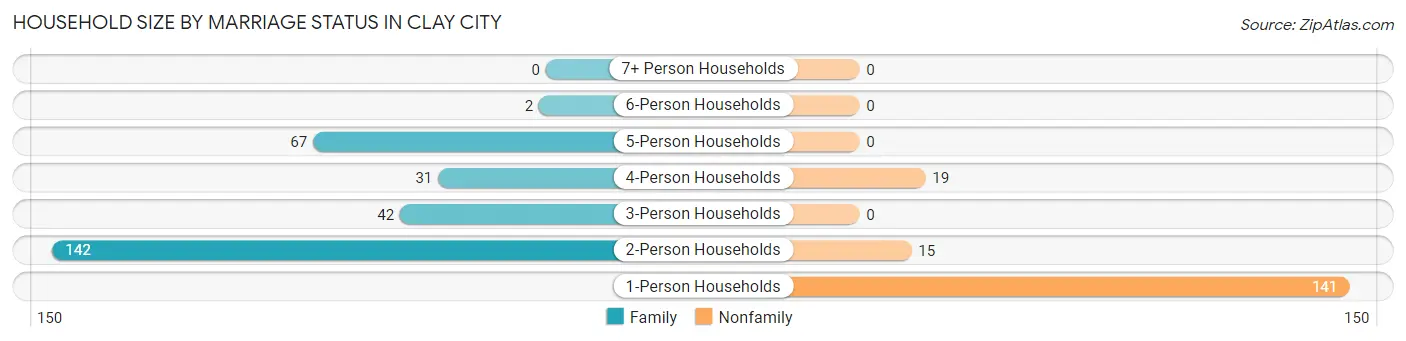
| Household Size | Family Households | Nonfamily Households |
| 1-Person Households | - | 141 (30.7%) |
| 2-Person Households | 142 (30.9%) | 15 (3.3%) |
| 3-Person Households | 42 (9.1%) | 0 (0.0%) |
| 4-Person Households | 31 (6.8%) | 19 (4.1%) |
| 5-Person Households | 67 (14.6%) | 0 (0.0%) |
| 6-Person Households | 2 (0.4%) | 0 (0.0%) |
| 7+ Person Households | 0 (0.0%) | 0 (0.0%) |
| Total | 284 (61.9%) | 175 (38.1%) |
Female Fertility in Clay City
Fertility by Age in Clay City
Average fertility rate in Clay City is 71.0 births per 1,000 women. Women in the age bracket of 20 to 34 years have the highest fertility rate with 142.0 births per 1,000 women. Women in the age bracket of 20 to 34 years acount for 94.4% of all women with births.
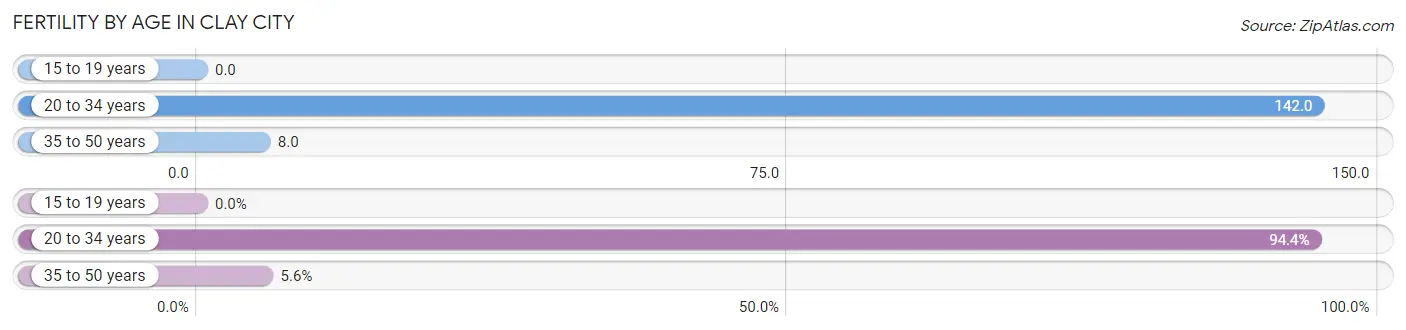
| Age Bracket | Women with Births | Births / 1,000 Women |
| 15 to 19 years | 0 (0.0%) | 0.0 |
| 20 to 34 years | 17 (94.4%) | 142.0 |
| 35 to 50 years | 1 (5.6%) | 8.0 |
| Total | 18 (100.0%) | 71.0 |
Fertility by Age by Marriage Status in Clay City
38.9% of women with births (18) in Clay City are married. The highest percentage of unmarried women with births falls into 20 to 34 years age bracket with 64.7% of them unmarried at the time of birth, while the lowest percentage of unmarried women with births belong to 35 to 50 years age bracket with 0.0% of them unmarried.
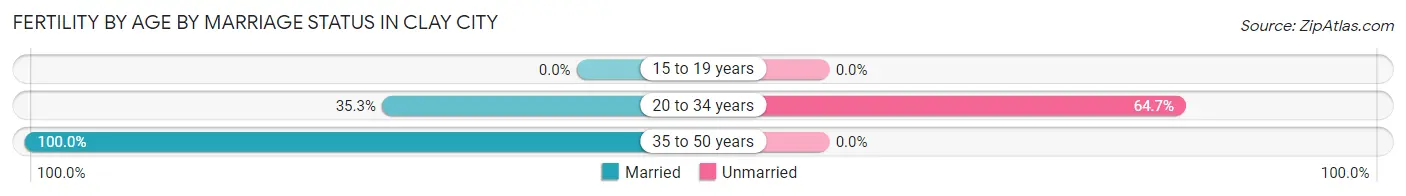
| Age Bracket | Married | Unmarried |
| 15 to 19 years | 0 (0.0%) | 0 (0.0%) |
| 20 to 34 years | 6 (35.3%) | 11 (64.7%) |
| 35 to 50 years | 1 (100.0%) | 0 (0.0%) |
| Total | 7 (38.9%) | 11 (61.1%) |
Fertility by Education in Clay City
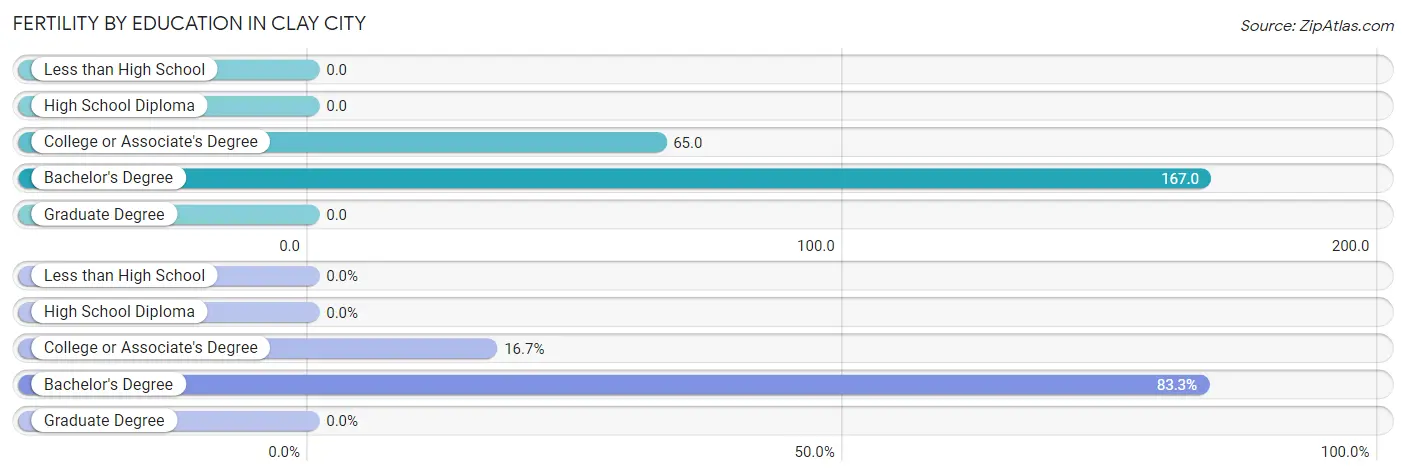
| Educational Attainment | Women with Births | Births / 1,000 Women |
| Less than High School | 0 (0.0%) | 0.0 |
| High School Diploma | 0 (0.0%) | 0.0 |
| College or Associate's Degree | 3 (16.7%) | 65.0 |
| Bachelor's Degree | 15 (83.3%) | 167.0 |
| Graduate Degree | 0 (0.0%) | 0.0 |
| Total | 18 (100.0%) | 71.0 |
Fertility by Education by Marriage Status in Clay City
61.1% of women with births in Clay City are unmarried. Women with the educational attainment of college or associate's degree are most likely to be married with 100.0% of them married at childbirth, while women with the educational attainment of bachelor's degree are least likely to be married with 73.3% of them unmarried at childbirth.
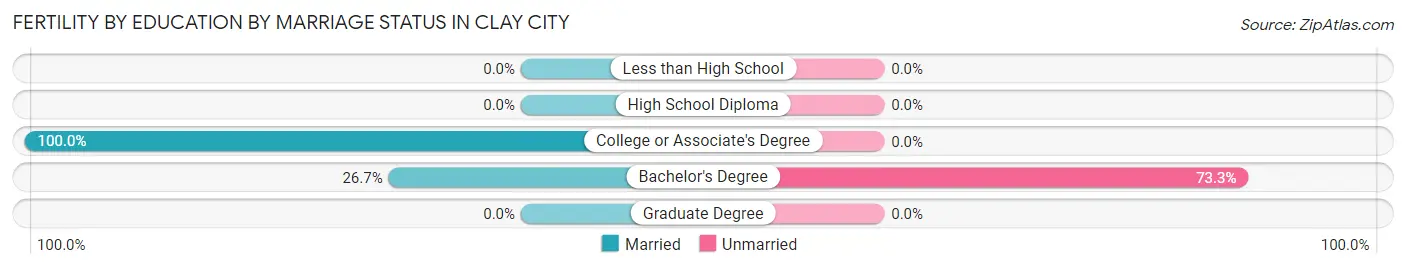
| Educational Attainment | Married | Unmarried |
| Less than High School | 0 (0.0%) | 0 (0.0%) |
| High School Diploma | 0 (0.0%) | 0 (0.0%) |
| College or Associate's Degree | 3 (100.0%) | 0 (0.0%) |
| Bachelor's Degree | 4 (26.7%) | 11 (73.3%) |
| Graduate Degree | 0 (0.0%) | 0 (0.0%) |
| Total | 7 (38.9%) | 11 (61.1%) |
Employment Characteristics in Clay City
Employment by Class of Employer in Clay City
Among the 588 employed individuals in Clay City, private company employees (475 | 80.8%), local government employees (59 | 10.0%), and not-for-profit organizations (31 | 5.3%) make up the most common classes of employment.
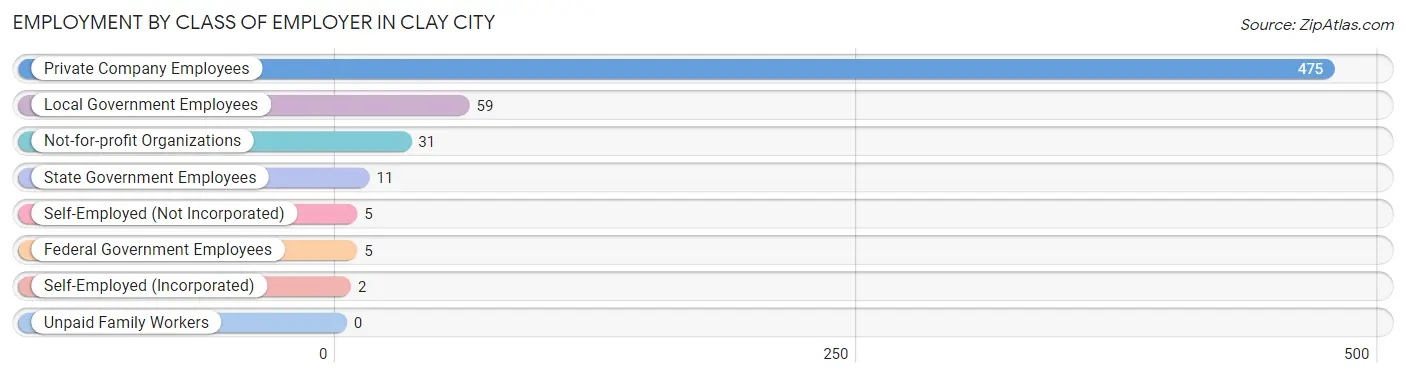
| Employer Class | # Employees | % Employees |
| Private Company Employees | 475 | 80.8% |
| Self-Employed (Incorporated) | 2 | 0.3% |
| Self-Employed (Not Incorporated) | 5 | 0.9% |
| Not-for-profit Organizations | 31 | 5.3% |
| Local Government Employees | 59 | 10.0% |
| State Government Employees | 11 | 1.9% |
| Federal Government Employees | 5 | 0.9% |
| Unpaid Family Workers | 0 | 0.0% |
| Total | 588 | 100.0% |
Employment Status by Age in Clay City
According to the labor force statistics for Clay City, out of the total population over 16 years of age (840), 71.7% or 602 individuals are in the labor force, with 2.3% or 14 of them unemployed. The age group with the highest labor force participation rate is 20 to 24 years, with 95.5% or 63 individuals in the labor force. Within the labor force, the 16 to 19 years age range has the highest percentage of unemployed individuals, with 12.9% or 4 of them being unemployed.
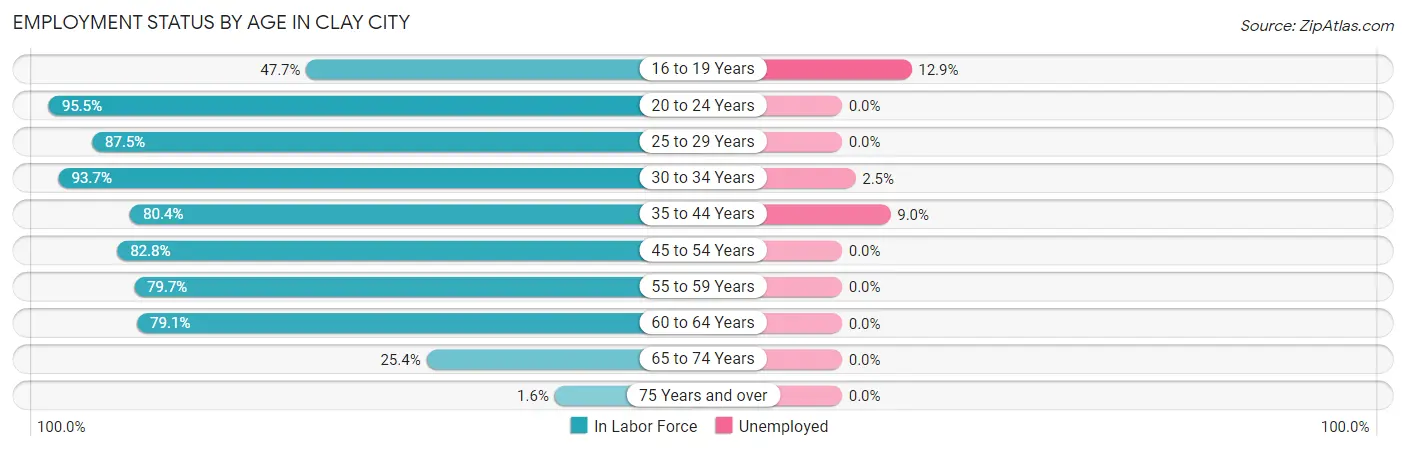
| Age Bracket | In Labor Force | Unemployed |
| 16 to 19 Years | 31 (47.7%) | 4 (12.9%) |
| 20 to 24 Years | 63 (95.5%) | 0 (0.0%) |
| 25 to 29 Years | 35 (87.5%) | 0 (0.0%) |
| 30 to 34 Years | 118 (93.7%) | 3 (2.5%) |
| 35 to 44 Years | 78 (80.4%) | 7 (9.0%) |
| 45 to 54 Years | 120 (82.8%) | 0 (0.0%) |
| 55 to 59 Years | 106 (79.7%) | 0 (0.0%) |
| 60 to 64 Years | 34 (79.1%) | 0 (0.0%) |
| 65 to 74 Years | 16 (25.4%) | 0 (0.0%) |
| 75 Years and over | 1 (1.6%) | 0 (0.0%) |
| Total | 602 (71.7%) | 14 (2.3%) |
Employment Status by Educational Attainment in Clay City
According to labor force statistics for Clay City, 84.1% of individuals (491) out of the total population between 25 and 64 years of age (584) are in the labor force, with 2.0% or 10 of them being unemployed. The group with the highest labor force participation rate are those with the educational attainment of college / associate degree, with 88.4% or 167 individuals in the labor force. Within the labor force, individuals with high school diploma education have the highest percentage of unemployment, with 4.3% or 7 of them being unemployed.
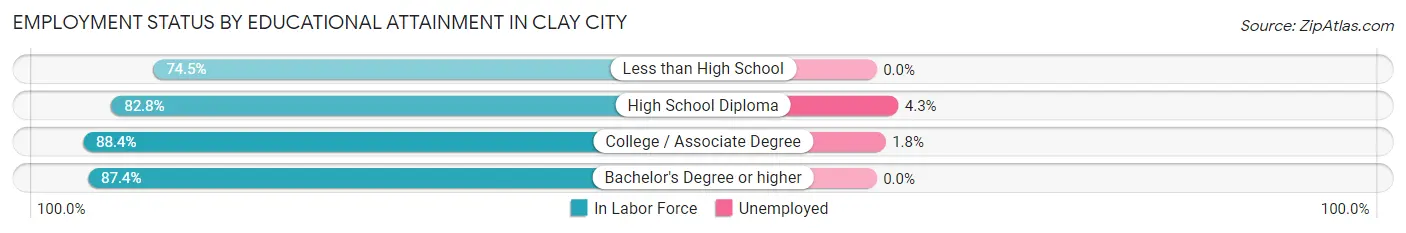
| Educational Attainment | In Labor Force | Unemployed |
| Less than High School | 70 (74.5%) | 0 (0.0%) |
| High School Diploma | 164 (82.8%) | 9 (4.3%) |
| College / Associate Degree | 167 (88.4%) | 3 (1.8%) |
| Bachelor's Degree or higher | 90 (87.4%) | 0 (0.0%) |
| Total | 491 (84.1%) | 12 (2.0%) |
Employment Occupations by Sex in Clay City
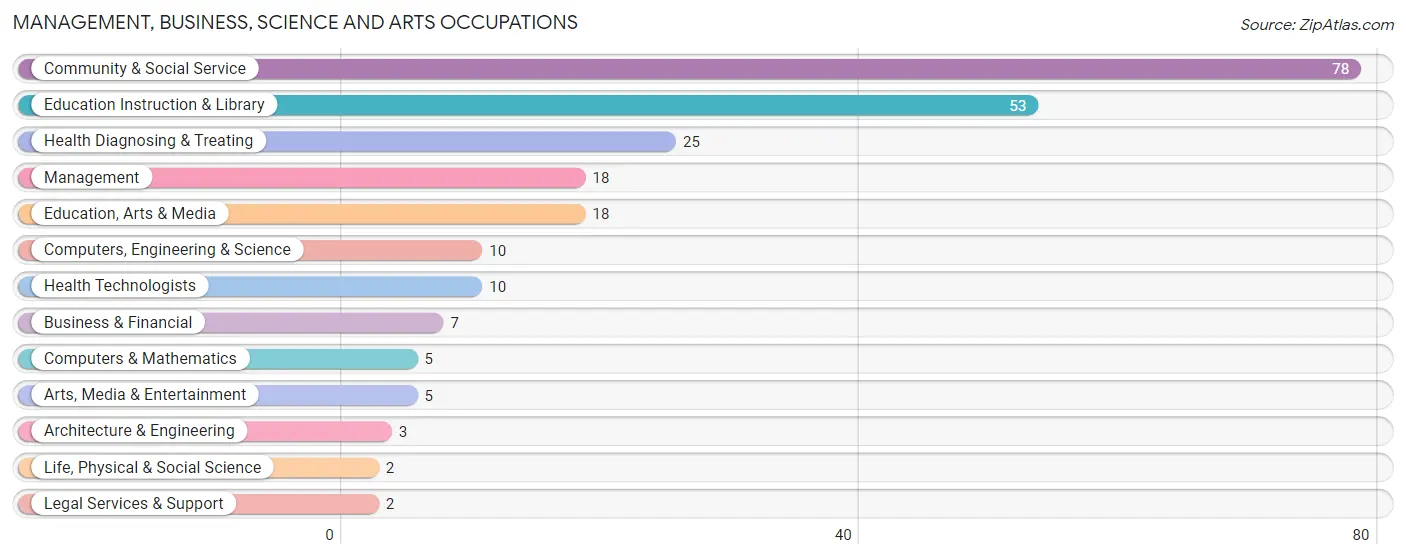
Management, Business, Science and Arts Occupations
The most common Management, Business, Science and Arts occupations in Clay City are Community & Social Service (78 | 13.3%), Education Instruction & Library (53 | 9.0%), Health Diagnosing & Treating (25 | 4.3%), Management (18 | 3.1%), and Education, Arts & Media (18 | 3.1%).
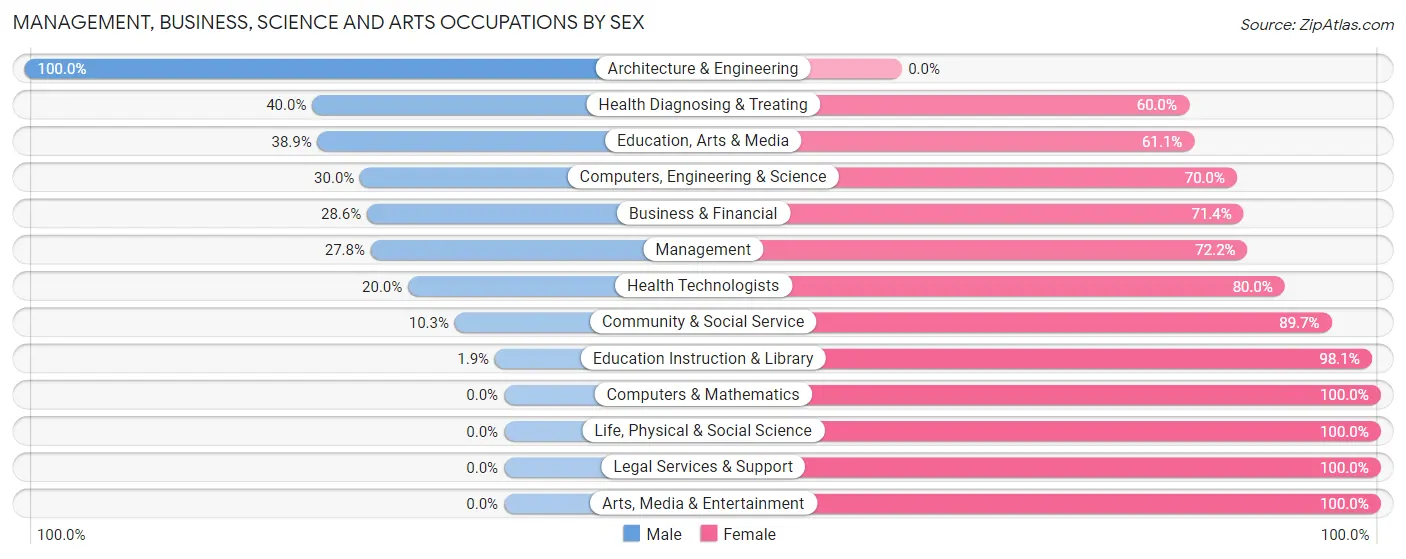
Management, Business, Science and Arts Occupations by Sex
Within the Management, Business, Science and Arts occupations in Clay City, the most male-oriented occupations are Architecture & Engineering (100.0%), Health Diagnosing & Treating (40.0%), and Education, Arts & Media (38.9%), while the most female-oriented occupations are Computers & Mathematics (100.0%), Life, Physical & Social Science (100.0%), and Legal Services & Support (100.0%).
| Occupation | Male | Female |
| Management | 5 (27.8%) | 13 (72.2%) |
| Business & Financial | 2 (28.6%) | 5 (71.4%) |
| Computers, Engineering & Science | 3 (30.0%) | 7 (70.0%) |
| Computers & Mathematics | 0 (0.0%) | 5 (100.0%) |
| Architecture & Engineering | 3 (100.0%) | 0 (0.0%) |
| Life, Physical & Social Science | 0 (0.0%) | 2 (100.0%) |
| Community & Social Service | 8 (10.3%) | 70 (89.7%) |
| Education, Arts & Media | 7 (38.9%) | 11 (61.1%) |
| Legal Services & Support | 0 (0.0%) | 2 (100.0%) |
| Education Instruction & Library | 1 (1.9%) | 52 (98.1%) |
| Arts, Media & Entertainment | 0 (0.0%) | 5 (100.0%) |
| Health Diagnosing & Treating | 10 (40.0%) | 15 (60.0%) |
| Health Technologists | 2 (20.0%) | 8 (80.0%) |
| Total (Category) | 28 (20.3%) | 110 (79.7%) |
| Total (Overall) | 318 (54.1%) | 270 (45.9%) |
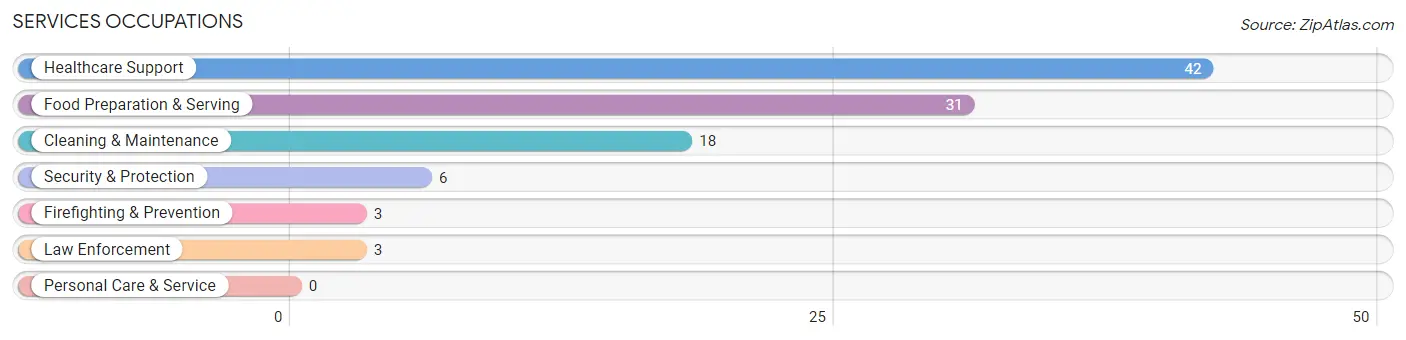
Services Occupations
The most common Services occupations in Clay City are Healthcare Support (42 | 7.1%), Food Preparation & Serving (31 | 5.3%), Cleaning & Maintenance (18 | 3.1%), Security & Protection (6 | 1.0%), and Firefighting & Prevention (3 | 0.5%).
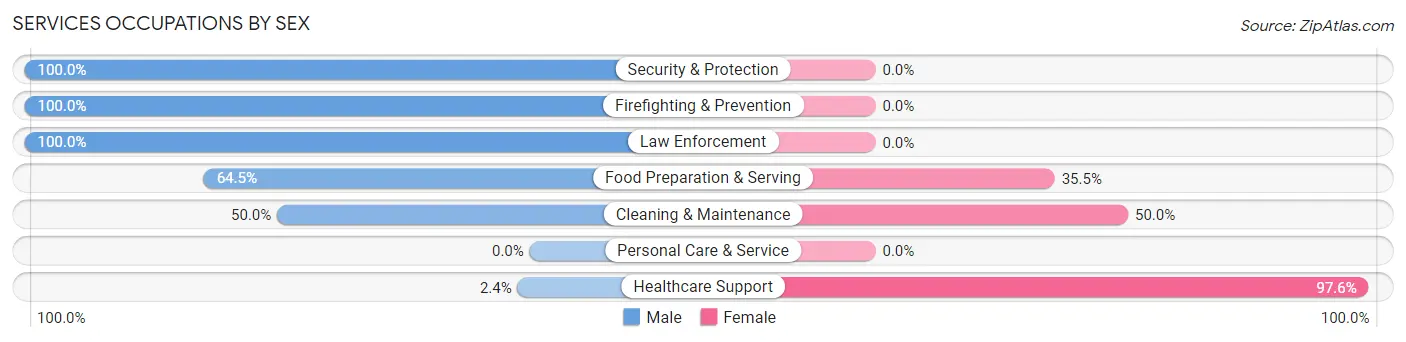
Services Occupations by Sex
Within the Services occupations in Clay City, the most male-oriented occupations are Security & Protection (100.0%), Firefighting & Prevention (100.0%), and Law Enforcement (100.0%), while the most female-oriented occupations are Healthcare Support (97.6%), Cleaning & Maintenance (50.0%), and Food Preparation & Serving (35.5%).
| Occupation | Male | Female |
| Healthcare Support | 1 (2.4%) | 41 (97.6%) |
| Security & Protection | 6 (100.0%) | 0 (0.0%) |
| Firefighting & Prevention | 3 (100.0%) | 0 (0.0%) |
| Law Enforcement | 3 (100.0%) | 0 (0.0%) |
| Food Preparation & Serving | 20 (64.5%) | 11 (35.5%) |
| Cleaning & Maintenance | 9 (50.0%) | 9 (50.0%) |
| Personal Care & Service | 0 (0.0%) | 0 (0.0%) |
| Total (Category) | 36 (37.1%) | 61 (62.9%) |
| Total (Overall) | 318 (54.1%) | 270 (45.9%) |
Sales and Office Occupations
The most common Sales and Office occupations in Clay City are Office & Administration (34 | 5.8%), and Sales & Related (19 | 3.2%).
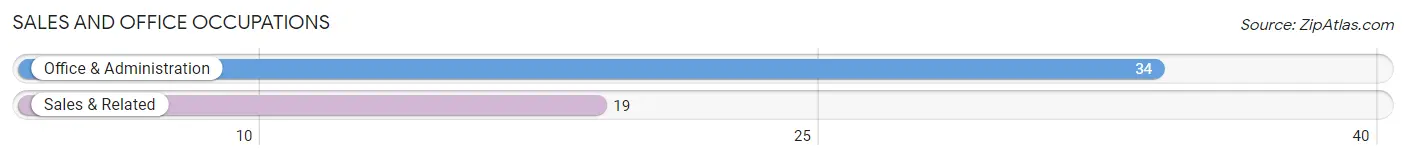
Sales and Office Occupations by Sex

| Occupation | Male | Female |
| Sales & Related | 7 (36.8%) | 12 (63.2%) |
| Office & Administration | 6 (17.6%) | 28 (82.4%) |
| Total (Category) | 13 (24.5%) | 40 (75.5%) |
| Total (Overall) | 318 (54.1%) | 270 (45.9%) |
Natural Resources, Construction and Maintenance Occupations
The most common Natural Resources, Construction and Maintenance occupations in Clay City are Installation, Maintenance & Repair (87 | 14.8%), and Construction & Extraction (28 | 4.8%).
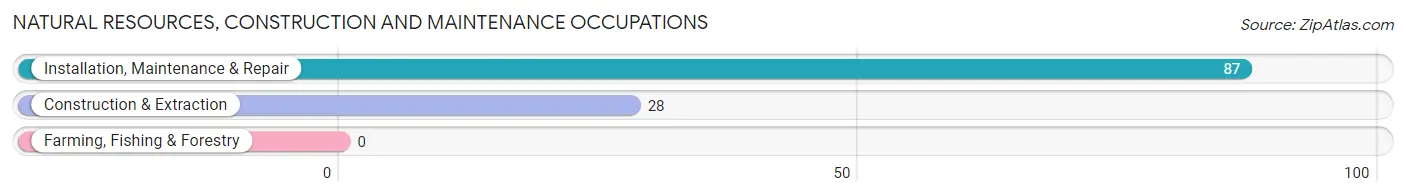
Natural Resources, Construction and Maintenance Occupations by Sex
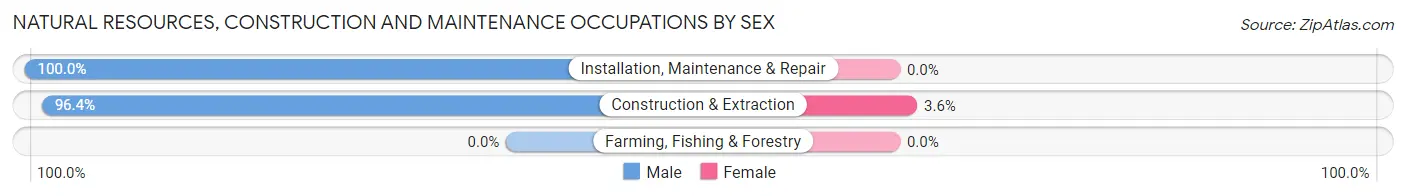
| Occupation | Male | Female |
| Farming, Fishing & Forestry | 0 (0.0%) | 0 (0.0%) |
| Construction & Extraction | 27 (96.4%) | 1 (3.6%) |
| Installation, Maintenance & Repair | 87 (100.0%) | 0 (0.0%) |
| Total (Category) | 114 (99.1%) | 1 (0.9%) |
| Total (Overall) | 318 (54.1%) | 270 (45.9%) |
Production, Transportation and Moving Occupations
The most common Production, Transportation and Moving occupations in Clay City are Transportation (100 | 17.0%), Production (71 | 12.1%), and Material Moving (14 | 2.4%).

Production, Transportation and Moving Occupations by Sex
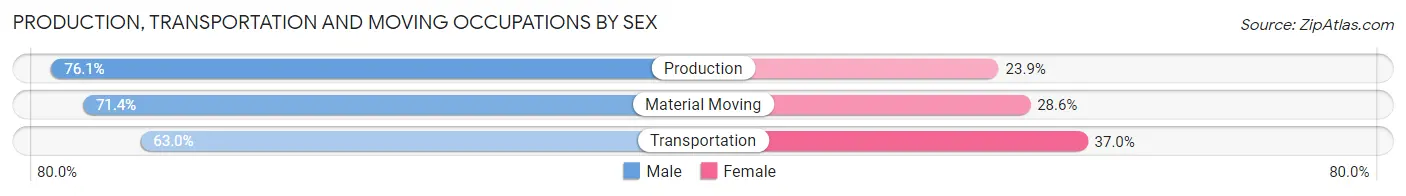
| Occupation | Male | Female |
| Production | 54 (76.1%) | 17 (23.9%) |
| Transportation | 63 (63.0%) | 37 (37.0%) |
| Material Moving | 10 (71.4%) | 4 (28.6%) |
| Total (Category) | 127 (68.6%) | 58 (31.4%) |
| Total (Overall) | 318 (54.1%) | 270 (45.9%) |
Employment Industries by Sex in Clay City
Employment Industries in Clay City
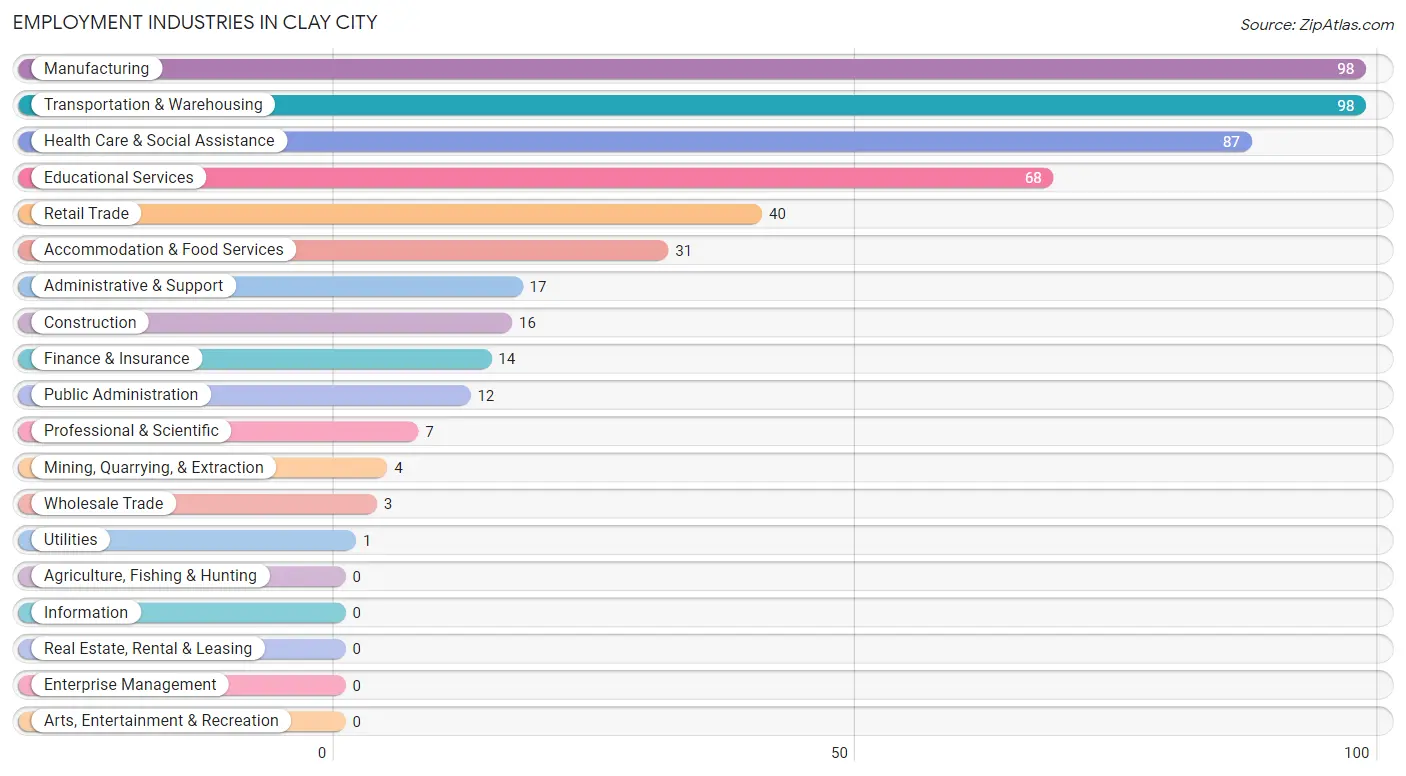
The major employment industries in Clay City include Manufacturing (98 | 16.7%), Transportation & Warehousing (98 | 16.7%), Health Care & Social Assistance (87 | 14.8%), Educational Services (68 | 11.6%), and Retail Trade (40 | 6.8%).
Employment Industries by Sex in Clay City
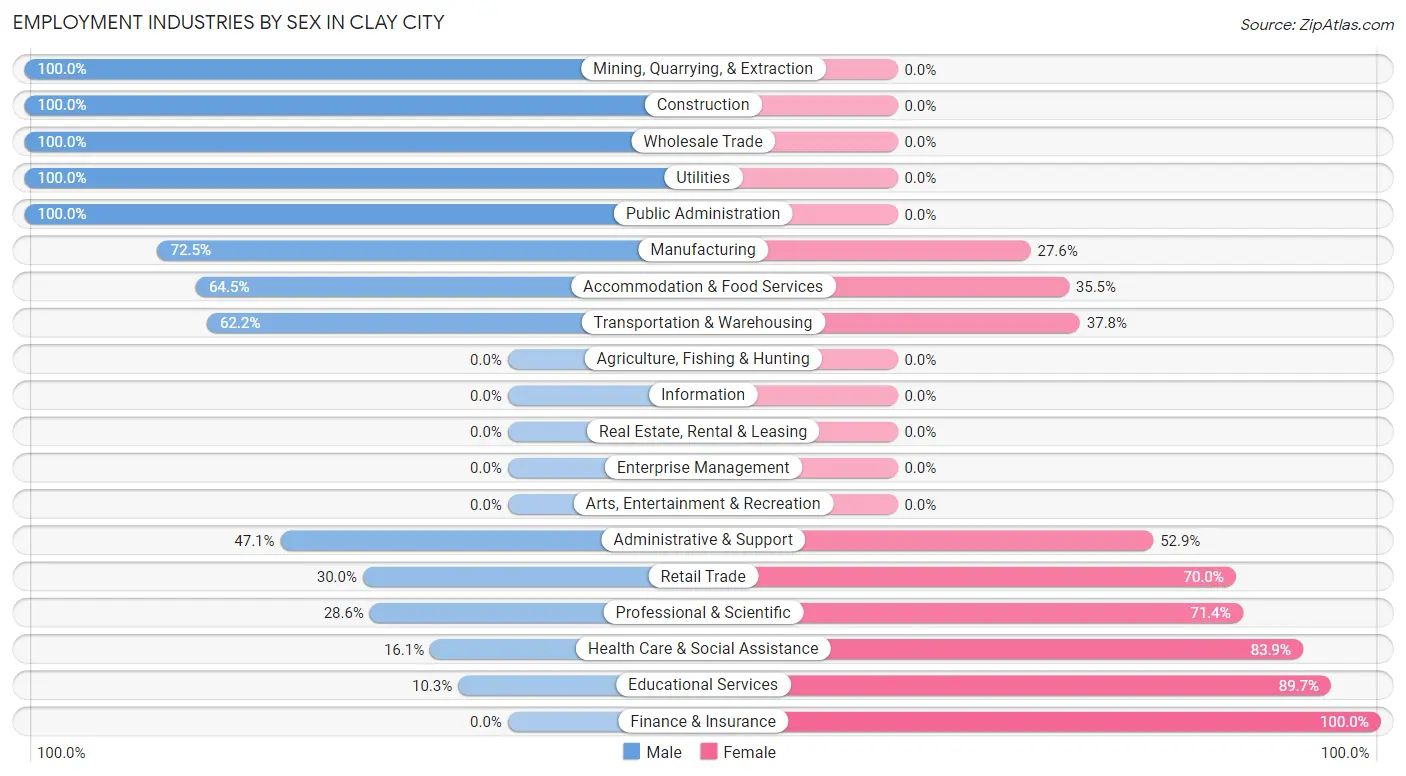
The Clay City industries that see more men than women are Mining, Quarrying, & Extraction (100.0%), Construction (100.0%), and Wholesale Trade (100.0%), whereas the industries that tend to have a higher number of women are Finance & Insurance (100.0%), Educational Services (89.7%), and Health Care & Social Assistance (83.9%).
| Industry | Male | Female |
| Agriculture, Fishing & Hunting | 0 (0.0%) | 0 (0.0%) |
| Mining, Quarrying, & Extraction | 4 (100.0%) | 0 (0.0%) |
| Construction | 16 (100.0%) | 0 (0.0%) |
| Manufacturing | 71 (72.5%) | 27 (27.6%) |
| Wholesale Trade | 3 (100.0%) | 0 (0.0%) |
| Retail Trade | 12 (30.0%) | 28 (70.0%) |
| Transportation & Warehousing | 61 (62.2%) | 37 (37.8%) |
| Utilities | 1 (100.0%) | 0 (0.0%) |
| Information | 0 (0.0%) | 0 (0.0%) |
| Finance & Insurance | 0 (0.0%) | 14 (100.0%) |
| Real Estate, Rental & Leasing | 0 (0.0%) | 0 (0.0%) |
| Professional & Scientific | 2 (28.6%) | 5 (71.4%) |
| Enterprise Management | 0 (0.0%) | 0 (0.0%) |
| Administrative & Support | 8 (47.1%) | 9 (52.9%) |
| Educational Services | 7 (10.3%) | 61 (89.7%) |
| Health Care & Social Assistance | 14 (16.1%) | 73 (83.9%) |
| Arts, Entertainment & Recreation | 0 (0.0%) | 0 (0.0%) |
| Accommodation & Food Services | 20 (64.5%) | 11 (35.5%) |
| Public Administration | 12 (100.0%) | 0 (0.0%) |
| Total | 318 (54.1%) | 270 (45.9%) |
Education in Clay City
School Enrollment in Clay City
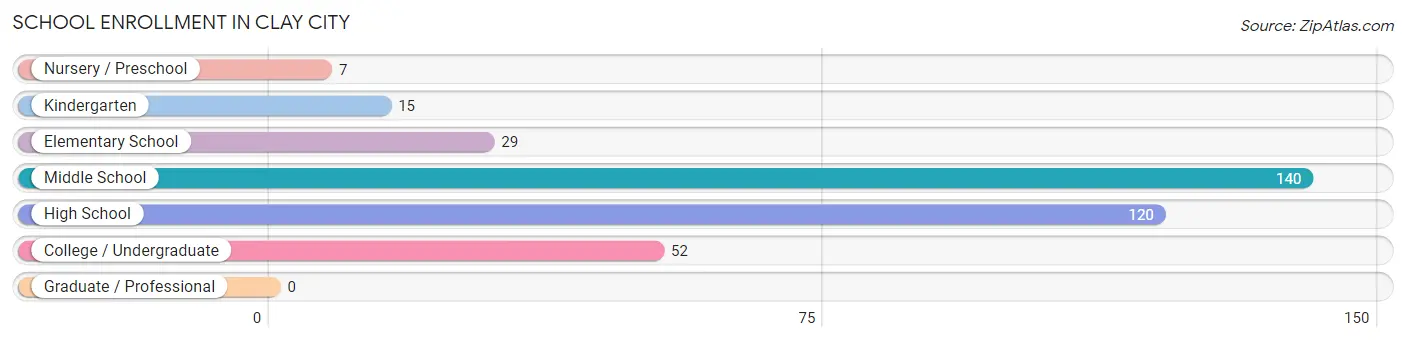
The most common levels of schooling among the 363 students in Clay City are middle school (140 | 38.6%), high school (120 | 33.1%), and college / undergraduate (52 | 14.3%).
| School Level | # Students | % Students |
| Nursery / Preschool | 7 | 1.9% |
| Kindergarten | 15 | 4.1% |
| Elementary School | 29 | 8.0% |
| Middle School | 140 | 38.6% |
| High School | 120 | 33.1% |
| College / Undergraduate | 52 | 14.3% |
| Graduate / Professional | 0 | 0.0% |
| Total | 363 | 100.0% |
School Enrollment by Age by Funding Source in Clay City
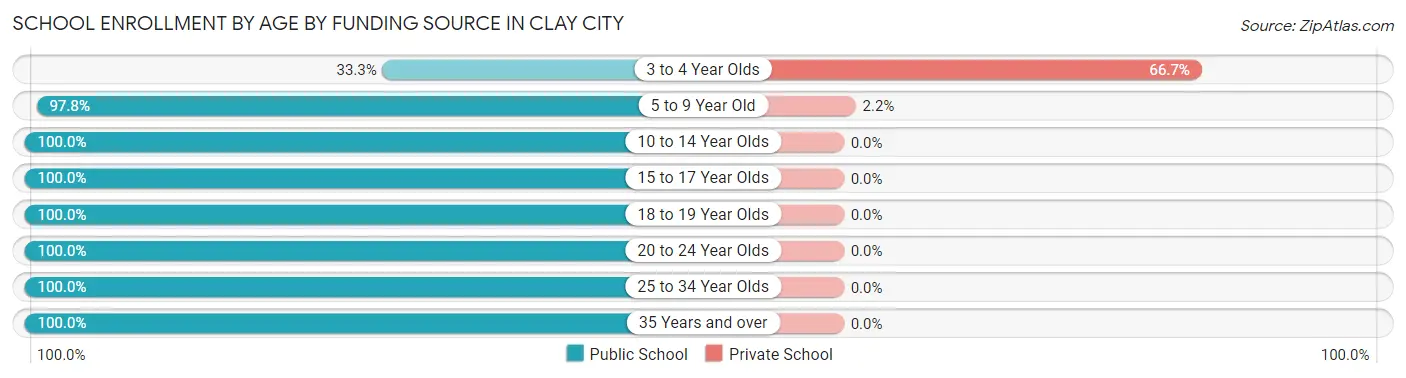
Out of a total of 363 students who are enrolled in schools in Clay City, 5 (1.4%) attend a private institution, while the remaining 358 (98.6%) are enrolled in public schools. The age group of 3 to 4 year olds has the highest likelihood of being enrolled in private schools, with 4 (66.7% in the age bracket) enrolled. Conversely, the age group of 10 to 14 year olds has the lowest likelihood of being enrolled in a private school, with 142 (100.0% in the age bracket) attending a public institution.
| Age Bracket | Public School | Private School |
| 3 to 4 Year Olds | 2 (33.3%) | 4 (66.7%) |
| 5 to 9 Year Old | 44 (97.8%) | 1 (2.2%) |
| 10 to 14 Year Olds | 142 (100.0%) | 0 (0.0%) |
| 15 to 17 Year Olds | 98 (100.0%) | 0 (0.0%) |
| 18 to 19 Year Olds | 33 (100.0%) | 0 (0.0%) |
| 20 to 24 Year Olds | 16 (100.0%) | 0 (0.0%) |
| 25 to 34 Year Olds | 14 (100.0%) | 0 (0.0%) |
| 35 Years and over | 9 (100.0%) | 0 (0.0%) |
| Total | 358 (98.6%) | 5 (1.4%) |
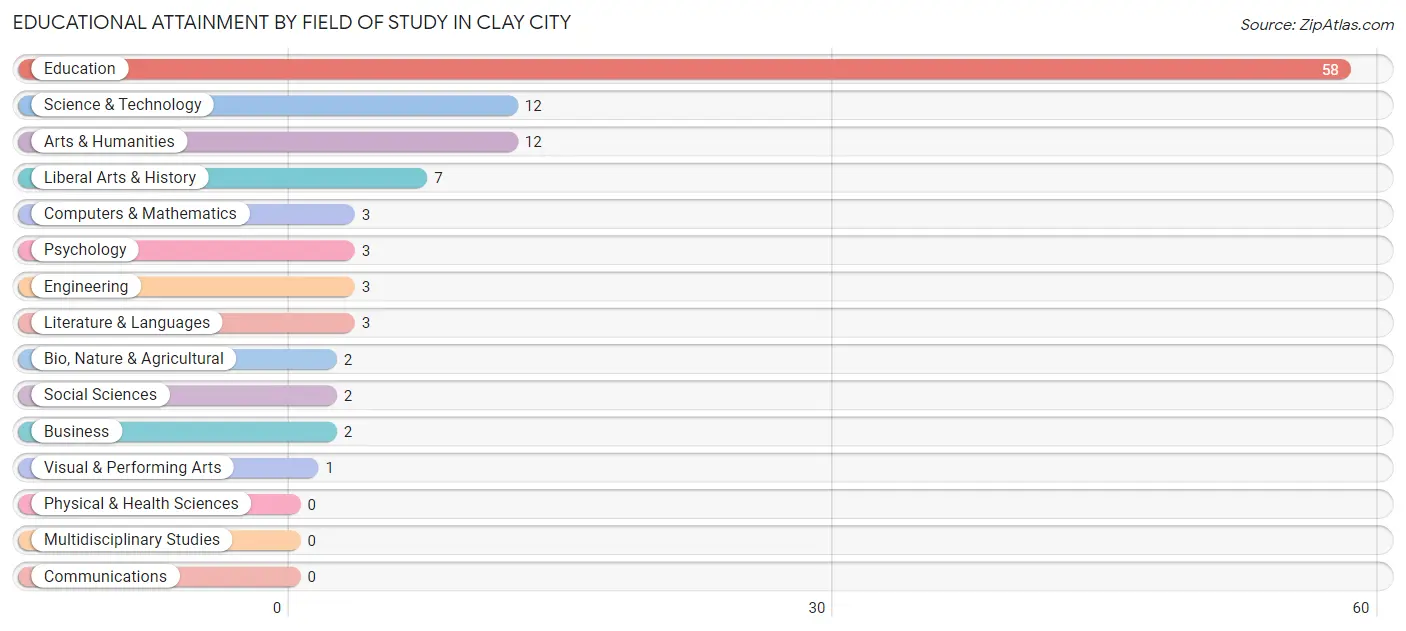
Educational Attainment by Field of Study in Clay City
Education (58 | 53.7%), science & technology (12 | 11.1%), arts & humanities (12 | 11.1%), liberal arts & history (7 | 6.5%), and computers & mathematics (3 | 2.8%) are the most common fields of study among 108 individuals in Clay City who have obtained a bachelor's degree or higher.
| Field of Study | # Graduates | % Graduates |
| Computers & Mathematics | 3 | 2.8% |
| Bio, Nature & Agricultural | 2 | 1.8% |
| Physical & Health Sciences | 0 | 0.0% |
| Psychology | 3 | 2.8% |
| Social Sciences | 2 | 1.8% |
| Engineering | 3 | 2.8% |
| Multidisciplinary Studies | 0 | 0.0% |
| Science & Technology | 12 | 11.1% |
| Business | 2 | 1.8% |
| Education | 58 | 53.7% |
| Literature & Languages | 3 | 2.8% |
| Liberal Arts & History | 7 | 6.5% |
| Visual & Performing Arts | 1 | 0.9% |
| Communications | 0 | 0.0% |
| Arts & Humanities | 12 | 11.1% |
| Total | 108 | 100.0% |
Transportation & Commute in Clay City
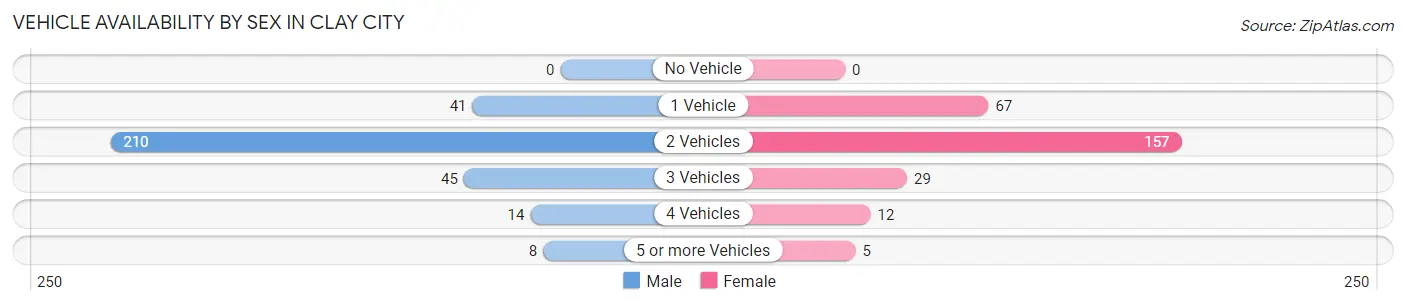
Vehicle Availability by Sex in Clay City
The most prevalent vehicle ownership categories in Clay City are males with 2 vehicles (210, accounting for 66.0%) and females with 2 vehicles (157, making up 77.8%).
| Vehicles Available | Male | Female |
| No Vehicle | 0 (0.0%) | 0 (0.0%) |
| 1 Vehicle | 41 (12.9%) | 67 (24.8%) |
| 2 Vehicles | 210 (66.0%) | 157 (58.2%) |
| 3 Vehicles | 45 (14.1%) | 29 (10.7%) |
| 4 Vehicles | 14 (4.4%) | 12 (4.4%) |
| 5 or more Vehicles | 8 (2.5%) | 5 (1.8%) |
| Total | 318 (100.0%) | 270 (100.0%) |
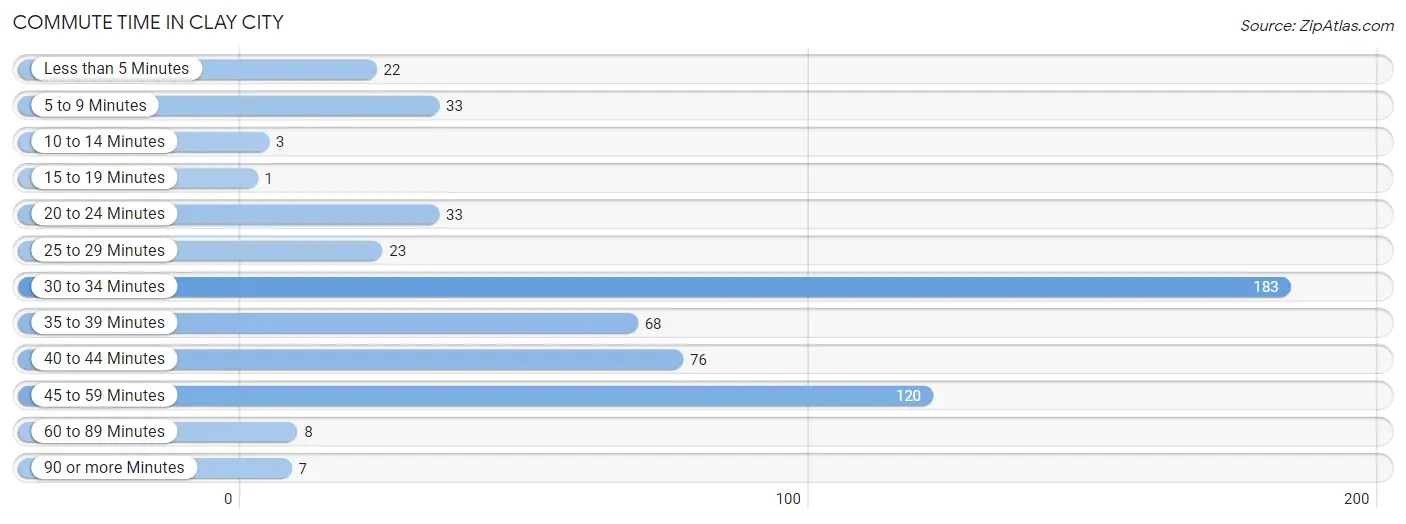
Commute Time in Clay City
The most frequently occuring commute durations in Clay City are 30 to 34 minutes (183 commuters, 31.7%), 45 to 59 minutes (120 commuters, 20.8%), and 40 to 44 minutes (76 commuters, 13.2%).
| Commute Time | # Commuters | % Commuters |
| Less than 5 Minutes | 22 | 3.8% |
| 5 to 9 Minutes | 33 | 5.7% |
| 10 to 14 Minutes | 3 | 0.5% |
| 15 to 19 Minutes | 1 | 0.2% |
| 20 to 24 Minutes | 33 | 5.7% |
| 25 to 29 Minutes | 23 | 4.0% |
| 30 to 34 Minutes | 183 | 31.7% |
| 35 to 39 Minutes | 68 | 11.8% |
| 40 to 44 Minutes | 76 | 13.2% |
| 45 to 59 Minutes | 120 | 20.8% |
| 60 to 89 Minutes | 8 | 1.4% |
| 90 or more Minutes | 7 | 1.2% |
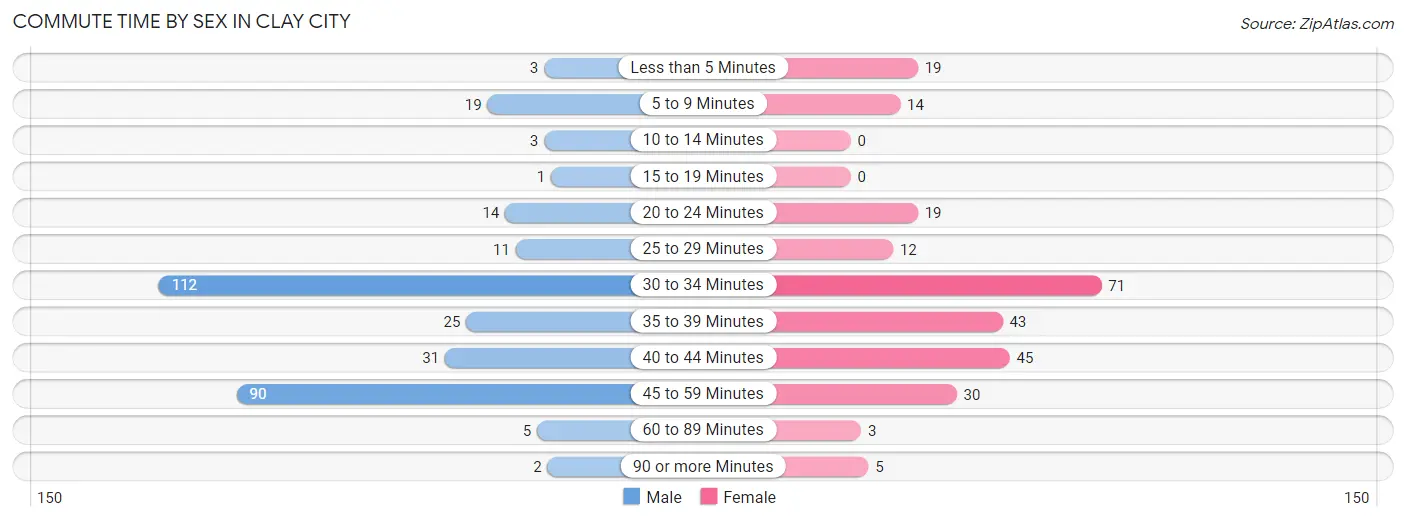
Commute Time by Sex in Clay City
The most common commute times in Clay City are 30 to 34 minutes (112 commuters, 35.4%) for males and 30 to 34 minutes (71 commuters, 27.2%) for females.
| Commute Time | Male | Female |
| Less than 5 Minutes | 3 (0.9%) | 19 (7.3%) |
| 5 to 9 Minutes | 19 (6.0%) | 14 (5.4%) |
| 10 to 14 Minutes | 3 (0.9%) | 0 (0.0%) |
| 15 to 19 Minutes | 1 (0.3%) | 0 (0.0%) |
| 20 to 24 Minutes | 14 (4.4%) | 19 (7.3%) |
| 25 to 29 Minutes | 11 (3.5%) | 12 (4.6%) |
| 30 to 34 Minutes | 112 (35.4%) | 71 (27.2%) |
| 35 to 39 Minutes | 25 (7.9%) | 43 (16.5%) |
| 40 to 44 Minutes | 31 (9.8%) | 45 (17.2%) |
| 45 to 59 Minutes | 90 (28.5%) | 30 (11.5%) |
| 60 to 89 Minutes | 5 (1.6%) | 3 (1.1%) |
| 90 or more Minutes | 2 (0.6%) | 5 (1.9%) |
Time of Departure to Work by Sex in Clay City
The most frequent times of departure to work in Clay City are 6:00 AM to 6:29 AM (101, 32.0%) for males and 7:00 AM to 7:29 AM (107, 41.0%) for females.
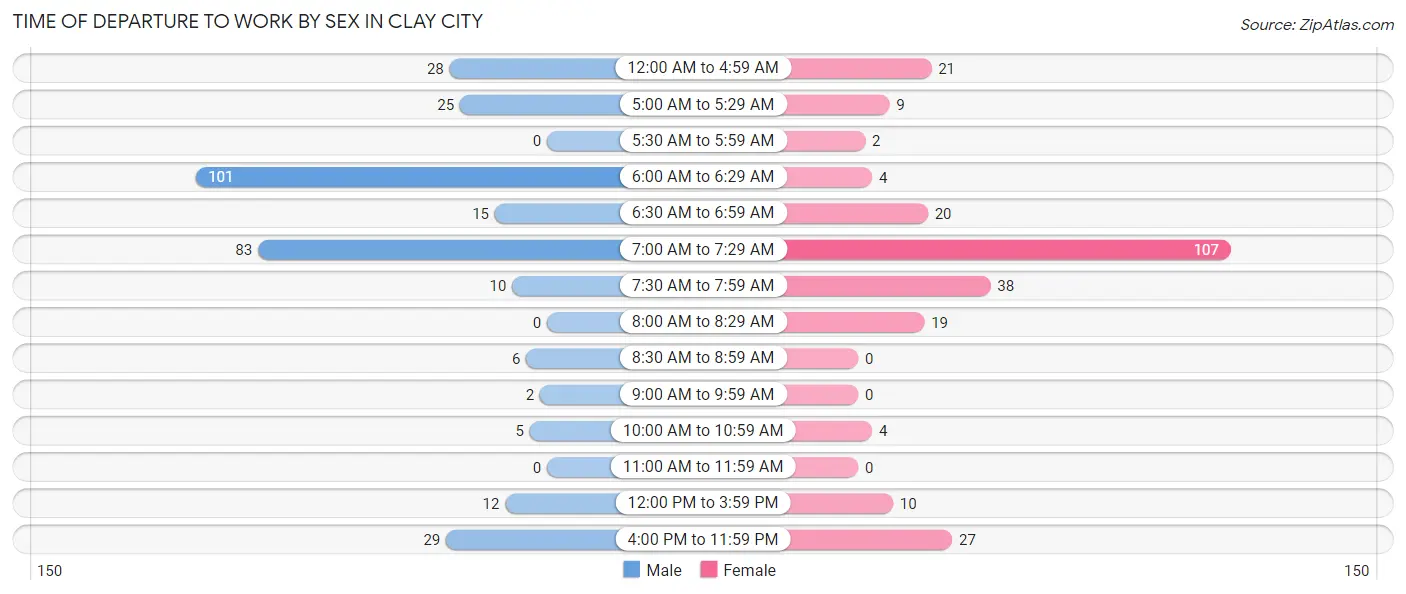
| Time of Departure | Male | Female |
| 12:00 AM to 4:59 AM | 28 (8.9%) | 21 (8.1%) |
| 5:00 AM to 5:29 AM | 25 (7.9%) | 9 (3.5%) |
| 5:30 AM to 5:59 AM | 0 (0.0%) | 2 (0.8%) |
| 6:00 AM to 6:29 AM | 101 (32.0%) | 4 (1.5%) |
| 6:30 AM to 6:59 AM | 15 (4.8%) | 20 (7.7%) |
| 7:00 AM to 7:29 AM | 83 (26.3%) | 107 (41.0%) |
| 7:30 AM to 7:59 AM | 10 (3.2%) | 38 (14.6%) |
| 8:00 AM to 8:29 AM | 0 (0.0%) | 19 (7.3%) |
| 8:30 AM to 8:59 AM | 6 (1.9%) | 0 (0.0%) |
| 9:00 AM to 9:59 AM | 2 (0.6%) | 0 (0.0%) |
| 10:00 AM to 10:59 AM | 5 (1.6%) | 4 (1.5%) |
| 11:00 AM to 11:59 AM | 0 (0.0%) | 0 (0.0%) |
| 12:00 PM to 3:59 PM | 12 (3.8%) | 10 (3.8%) |
| 4:00 PM to 11:59 PM | 29 (9.2%) | 27 (10.3%) |
| Total | 316 (100.0%) | 261 (100.0%) |
Housing Occupancy in Clay City
Occupancy by Ownership in Clay City
Of the total 459 dwellings in Clay City, owner-occupied units account for 289 (63.0%), while renter-occupied units make up 170 (37.0%).
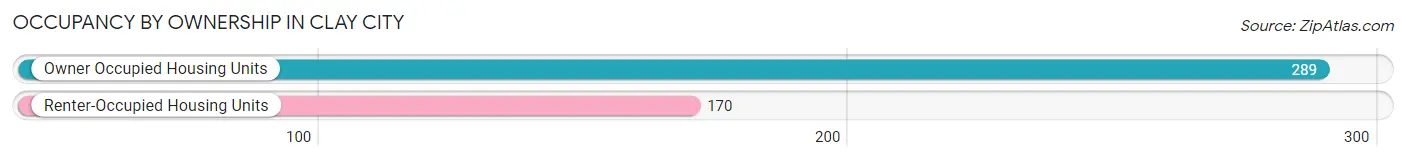
| Occupancy | # Housing Units | % Housing Units |
| Owner Occupied Housing Units | 289 | 63.0% |
| Renter-Occupied Housing Units | 170 | 37.0% |
| Total Occupied Housing Units | 459 | 100.0% |
Occupancy by Household Size in Clay City
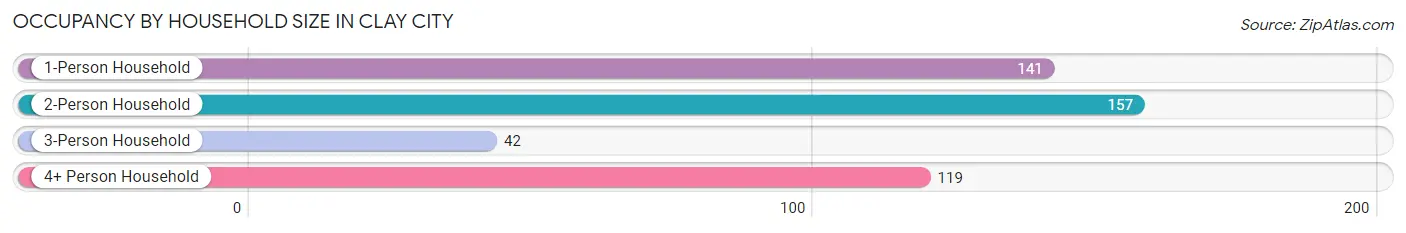
| Household Size | # Housing Units | % Housing Units |
| 1-Person Household | 141 | 30.7% |
| 2-Person Household | 157 | 34.2% |
| 3-Person Household | 42 | 9.1% |
| 4+ Person Household | 119 | 25.9% |
| Total Housing Units | 459 | 100.0% |
Occupancy by Ownership by Household Size in Clay City
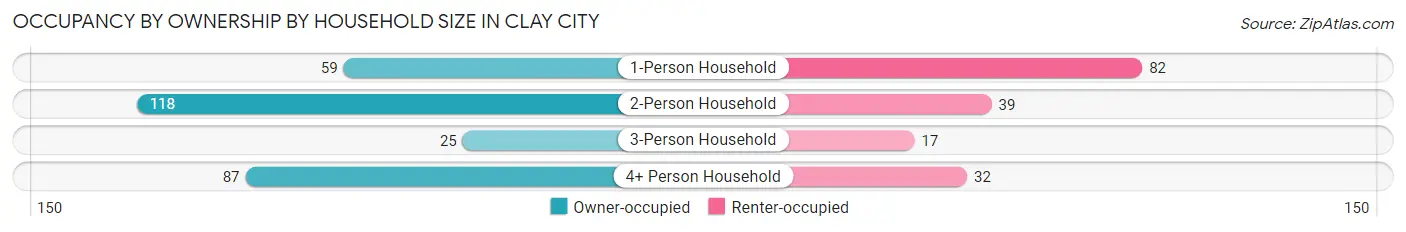
| Household Size | Owner-occupied | Renter-occupied |
| 1-Person Household | 59 (41.8%) | 82 (58.2%) |
| 2-Person Household | 118 (75.2%) | 39 (24.8%) |
| 3-Person Household | 25 (59.5%) | 17 (40.5%) |
| 4+ Person Household | 87 (73.1%) | 32 (26.9%) |
| Total Housing Units | 289 (63.0%) | 170 (37.0%) |
Occupancy by Educational Attainment in Clay City
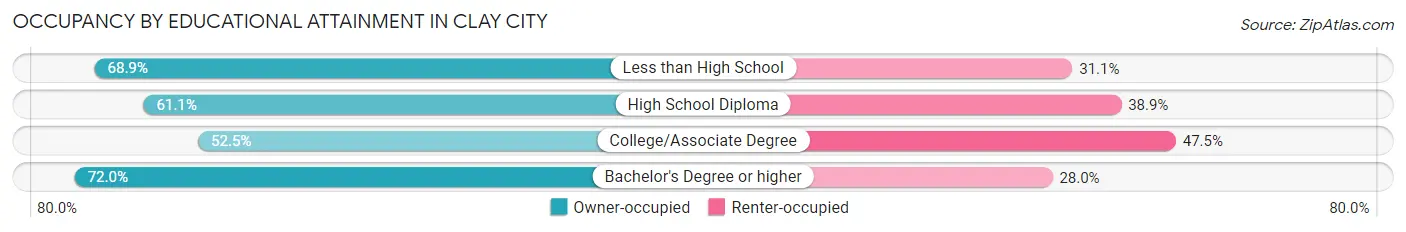
| Household Size | Owner-occupied | Renter-occupied |
| Less than High School | 62 (68.9%) | 28 (31.1%) |
| High School Diploma | 107 (61.1%) | 68 (38.9%) |
| College/Associate Degree | 53 (52.5%) | 48 (47.5%) |
| Bachelor's Degree or higher | 67 (72.0%) | 26 (28.0%) |
Occupancy by Age of Householder in Clay City
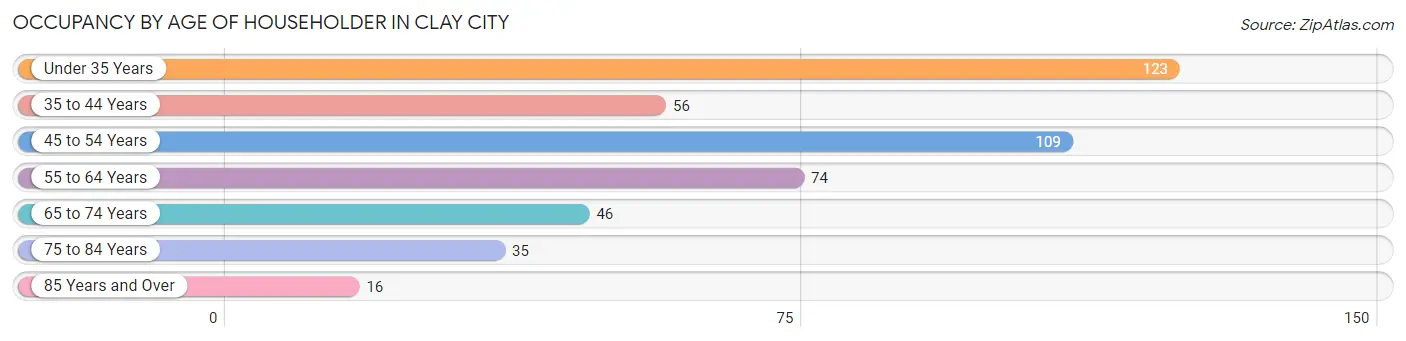
| Age Bracket | # Households | % Households |
| Under 35 Years | 123 | 26.8% |
| 35 to 44 Years | 56 | 12.2% |
| 45 to 54 Years | 109 | 23.7% |
| 55 to 64 Years | 74 | 16.1% |
| 65 to 74 Years | 46 | 10.0% |
| 75 to 84 Years | 35 | 7.6% |
| 85 Years and Over | 16 | 3.5% |
| Total | 459 | 100.0% |
Housing Finances in Clay City
Median Income by Occupancy in Clay City
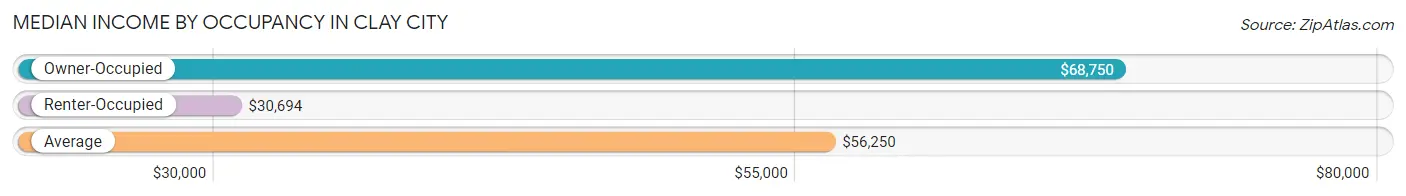
| Occupancy Type | # Households | Median Income |
| Owner-Occupied | 289 (63.0%) | $68,750 |
| Renter-Occupied | 170 (37.0%) | $30,694 |
| Average | 459 (100.0%) | $56,250 |
Occupancy by Householder Income Bracket in Clay City
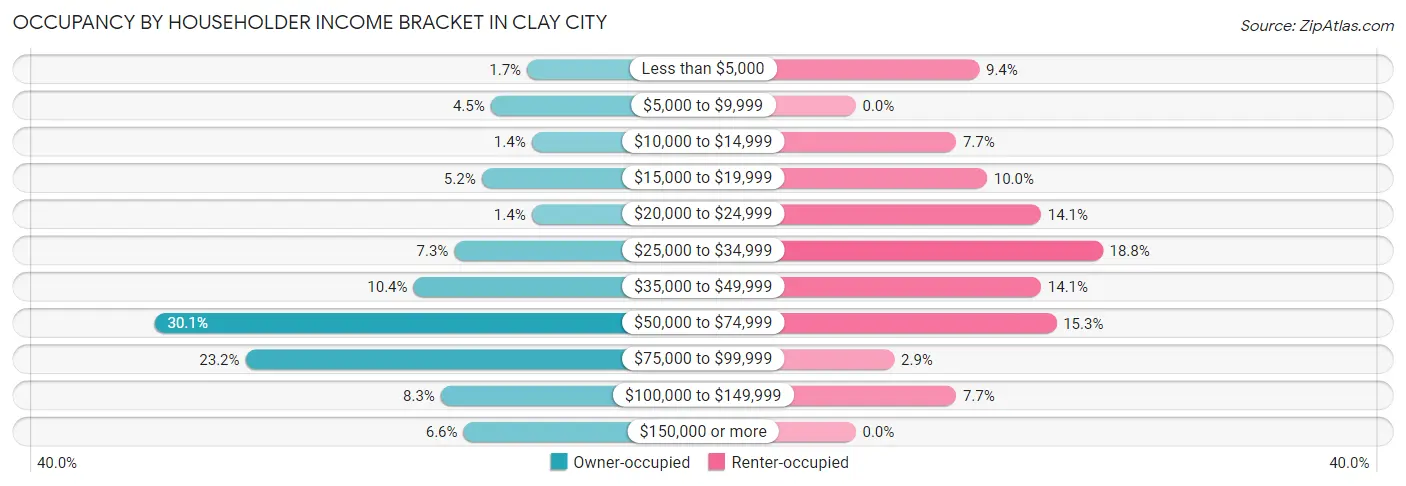
| Income Bracket | Owner-occupied | Renter-occupied |
| Less than $5,000 | 5 (1.7%) | 16 (9.4%) |
| $5,000 to $9,999 | 13 (4.5%) | 0 (0.0%) |
| $10,000 to $14,999 | 4 (1.4%) | 13 (7.6%) |
| $15,000 to $19,999 | 15 (5.2%) | 17 (10.0%) |
| $20,000 to $24,999 | 4 (1.4%) | 24 (14.1%) |
| $25,000 to $34,999 | 21 (7.3%) | 32 (18.8%) |
| $35,000 to $49,999 | 30 (10.4%) | 24 (14.1%) |
| $50,000 to $74,999 | 87 (30.1%) | 26 (15.3%) |
| $75,000 to $99,999 | 67 (23.2%) | 5 (2.9%) |
| $100,000 to $149,999 | 24 (8.3%) | 13 (7.6%) |
| $150,000 or more | 19 (6.6%) | 0 (0.0%) |
| Total | 289 (100.0%) | 170 (100.0%) |
Monthly Housing Cost Tiers in Clay City
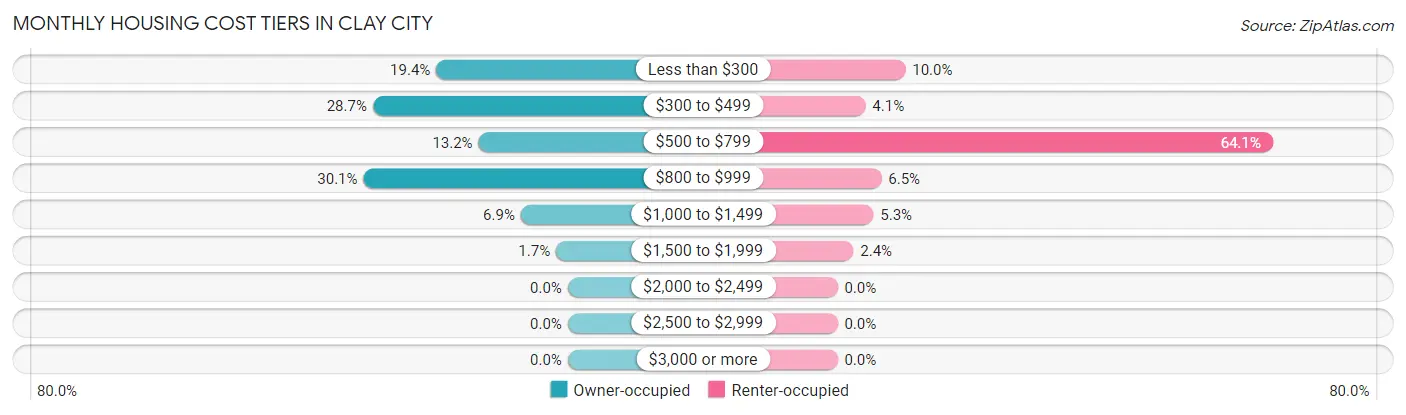
| Monthly Cost | Owner-occupied | Renter-occupied |
| Less than $300 | 56 (19.4%) | 17 (10.0%) |
| $300 to $499 | 83 (28.7%) | 7 (4.1%) |
| $500 to $799 | 38 (13.2%) | 109 (64.1%) |
| $800 to $999 | 87 (30.1%) | 11 (6.5%) |
| $1,000 to $1,499 | 20 (6.9%) | 9 (5.3%) |
| $1,500 to $1,999 | 5 (1.7%) | 4 (2.4%) |
| $2,000 to $2,499 | 0 (0.0%) | 0 (0.0%) |
| $2,500 to $2,999 | 0 (0.0%) | 0 (0.0%) |
| $3,000 or more | 0 (0.0%) | 0 (0.0%) |
| Total | 289 (100.0%) | 170 (100.0%) |
Physical Housing Characteristics in Clay City
Housing Structures in Clay City
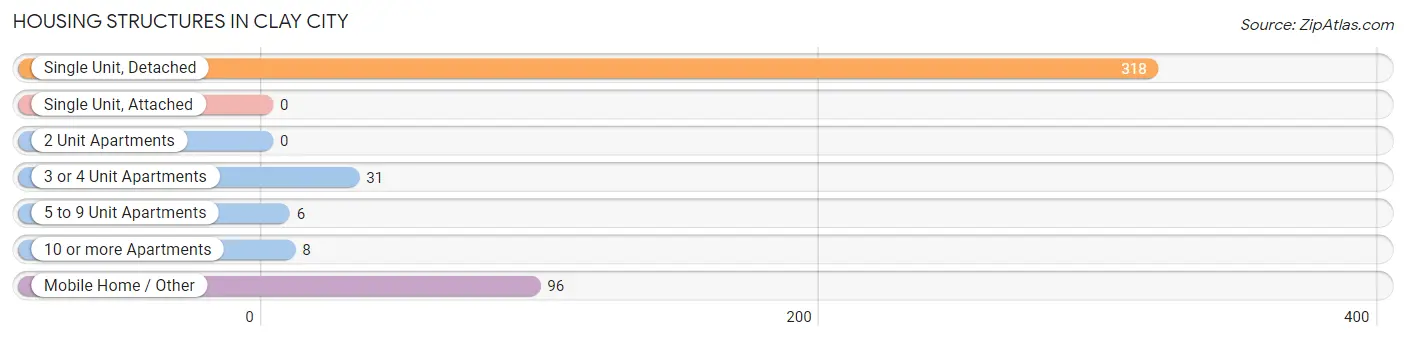
| Structure Type | # Housing Units | % Housing Units |
| Single Unit, Detached | 318 | 69.3% |
| Single Unit, Attached | 0 | 0.0% |
| 2 Unit Apartments | 0 | 0.0% |
| 3 or 4 Unit Apartments | 31 | 6.8% |
| 5 to 9 Unit Apartments | 6 | 1.3% |
| 10 or more Apartments | 8 | 1.7% |
| Mobile Home / Other | 96 | 20.9% |
| Total | 459 | 100.0% |
Housing Structures by Occupancy in Clay City
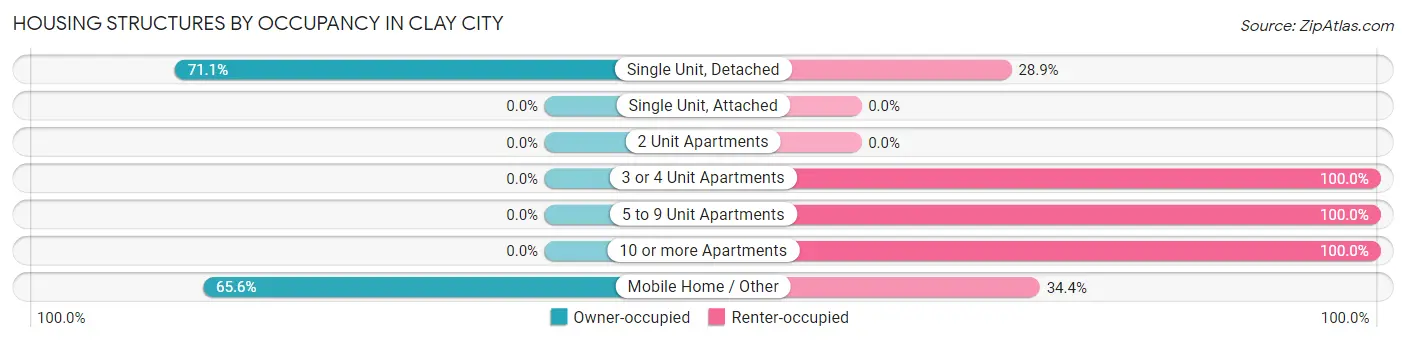
| Structure Type | Owner-occupied | Renter-occupied |
| Single Unit, Detached | 226 (71.1%) | 92 (28.9%) |
| Single Unit, Attached | 0 (0.0%) | 0 (0.0%) |
| 2 Unit Apartments | 0 (0.0%) | 0 (0.0%) |
| 3 or 4 Unit Apartments | 0 (0.0%) | 31 (100.0%) |
| 5 to 9 Unit Apartments | 0 (0.0%) | 6 (100.0%) |
| 10 or more Apartments | 0 (0.0%) | 8 (100.0%) |
| Mobile Home / Other | 63 (65.6%) | 33 (34.4%) |
| Total | 289 (63.0%) | 170 (37.0%) |
Housing Structures by Number of Rooms in Clay City
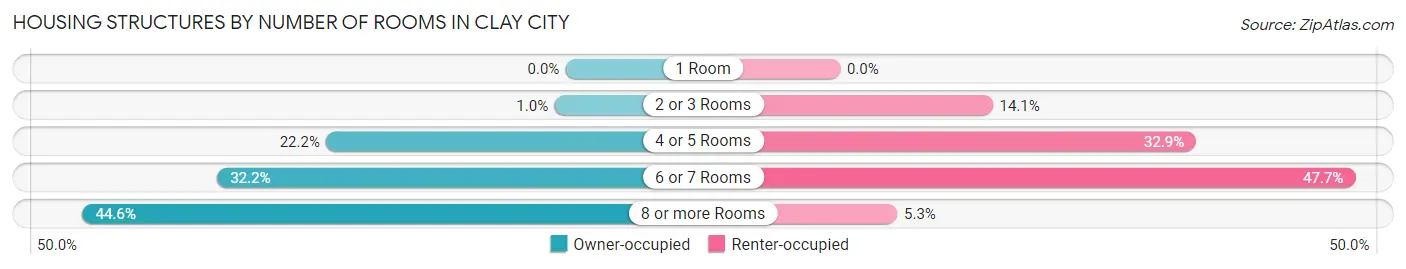
| Number of Rooms | Owner-occupied | Renter-occupied |
| 1 Room | 0 (0.0%) | 0 (0.0%) |
| 2 or 3 Rooms | 3 (1.0%) | 24 (14.1%) |
| 4 or 5 Rooms | 64 (22.2%) | 56 (32.9%) |
| 6 or 7 Rooms | 93 (32.2%) | 81 (47.6%) |
| 8 or more Rooms | 129 (44.6%) | 9 (5.3%) |
| Total | 289 (100.0%) | 170 (100.0%) |
Housing Structure by Heating Type in Clay City
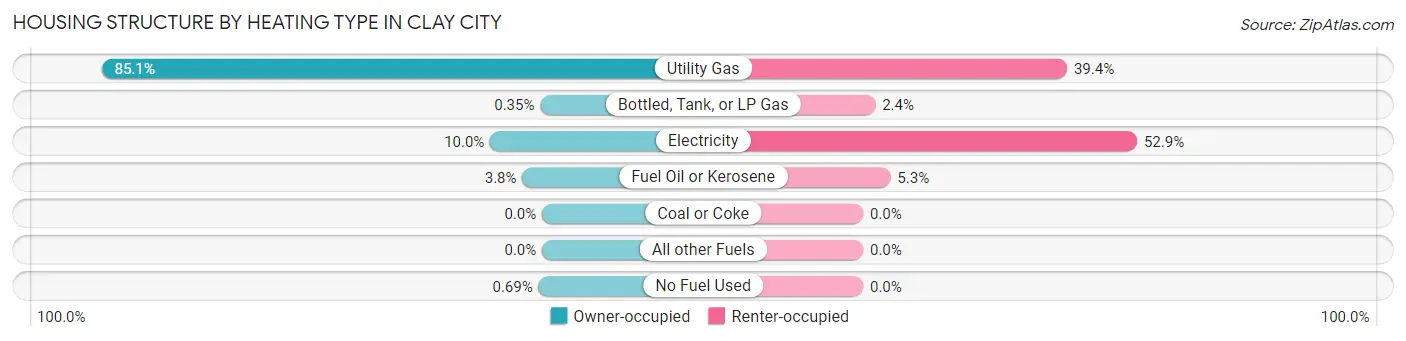
| Heating Type | Owner-occupied | Renter-occupied |
| Utility Gas | 246 (85.1%) | 67 (39.4%) |
| Bottled, Tank, or LP Gas | 1 (0.4%) | 4 (2.4%) |
| Electricity | 29 (10.0%) | 90 (52.9%) |
| Fuel Oil or Kerosene | 11 (3.8%) | 9 (5.3%) |
| Coal or Coke | 0 (0.0%) | 0 (0.0%) |
| All other Fuels | 0 (0.0%) | 0 (0.0%) |
| No Fuel Used | 2 (0.7%) | 0 (0.0%) |
| Total | 289 (100.0%) | 170 (100.0%) |
Household Vehicle Usage in Clay City
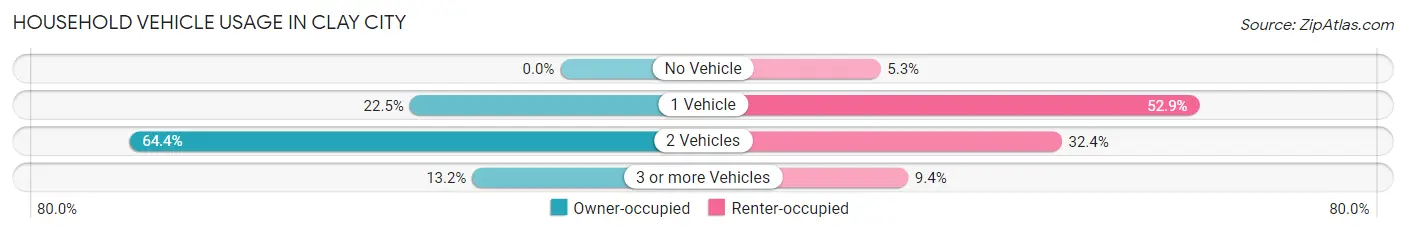
| Vehicles per Household | Owner-occupied | Renter-occupied |
| No Vehicle | 0 (0.0%) | 9 (5.3%) |
| 1 Vehicle | 65 (22.5%) | 90 (52.9%) |
| 2 Vehicles | 186 (64.4%) | 55 (32.4%) |
| 3 or more Vehicles | 38 (13.2%) | 16 (9.4%) |
| Total | 289 (100.0%) | 170 (100.0%) |
Real Estate & Mortgages in Clay City
Real Estate and Mortgage Overview in Clay City
| Characteristic | Without Mortgage | With Mortgage |
| Housing Units | 141 | 148 |
| Median Property Value | $79,100 | $85,400 |
| Median Household Income | $82,083 | $14 |
| Monthly Housing Costs | $383 | $0 |
| Real Estate Taxes | $331 | $12 |
Property Value by Mortgage Status in Clay City
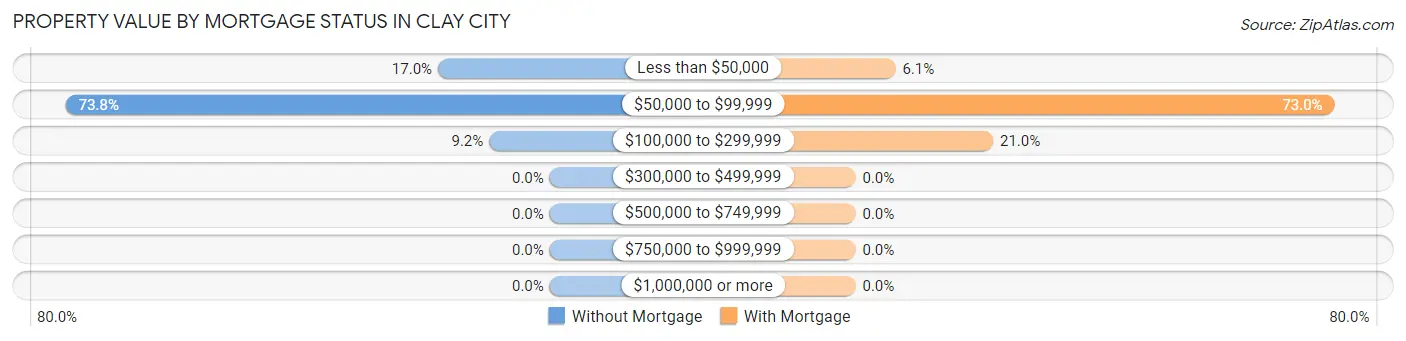
| Property Value | Without Mortgage | With Mortgage |
| Less than $50,000 | 24 (17.0%) | 9 (6.1%) |
| $50,000 to $99,999 | 104 (73.8%) | 108 (73.0%) |
| $100,000 to $299,999 | 13 (9.2%) | 31 (20.9%) |
| $300,000 to $499,999 | 0 (0.0%) | 0 (0.0%) |
| $500,000 to $749,999 | 0 (0.0%) | 0 (0.0%) |
| $750,000 to $999,999 | 0 (0.0%) | 0 (0.0%) |
| $1,000,000 or more | 0 (0.0%) | 0 (0.0%) |
| Total | 141 (100.0%) | 148 (100.0%) |
Household Income by Mortgage Status in Clay City
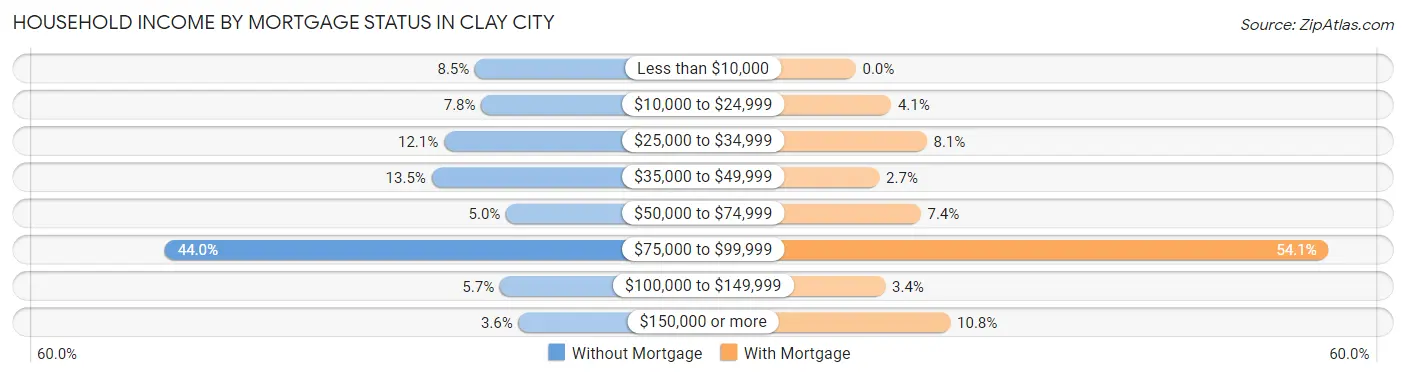
| Household Income | Without Mortgage | With Mortgage |
| Less than $10,000 | 12 (8.5%) | 0 (0.0%) |
| $10,000 to $24,999 | 11 (7.8%) | 6 (4.1%) |
| $25,000 to $34,999 | 17 (12.1%) | 12 (8.1%) |
| $35,000 to $49,999 | 19 (13.5%) | 4 (2.7%) |
| $50,000 to $74,999 | 7 (5.0%) | 11 (7.4%) |
| $75,000 to $99,999 | 62 (44.0%) | 80 (54.0%) |
| $100,000 to $149,999 | 8 (5.7%) | 5 (3.4%) |
| $150,000 or more | 5 (3.5%) | 16 (10.8%) |
| Total | 141 (100.0%) | 148 (100.0%) |
Property Value to Household Income Ratio in Clay City
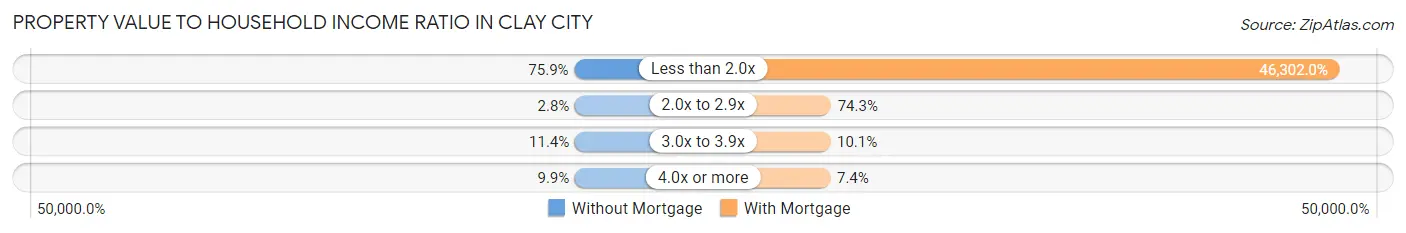
| Value-to-Income Ratio | Without Mortgage | With Mortgage |
| Less than 2.0x | 107 (75.9%) | 68,527 (46,302.0%) |
| 2.0x to 2.9x | 4 (2.8%) | 110 (74.3%) |
| 3.0x to 3.9x | 16 (11.4%) | 15 (10.1%) |
| 4.0x or more | 14 (9.9%) | 11 (7.4%) |
| Total | 141 (100.0%) | 148 (100.0%) |
Real Estate Taxes by Mortgage Status in Clay City
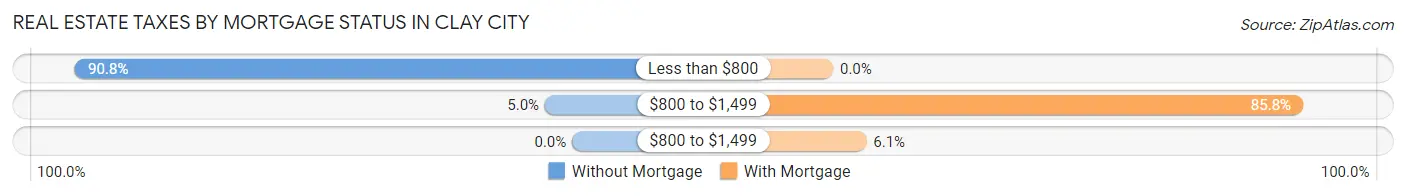
| Property Taxes | Without Mortgage | With Mortgage |
| Less than $800 | 128 (90.8%) | 0 (0.0%) |
| $800 to $1,499 | 7 (5.0%) | 127 (85.8%) |
| $800 to $1,499 | 0 (0.0%) | 9 (6.1%) |
| Total | 141 (100.0%) | 148 (100.0%) |
Health & Disability in Clay City
Health Insurance Coverage by Age in Clay City
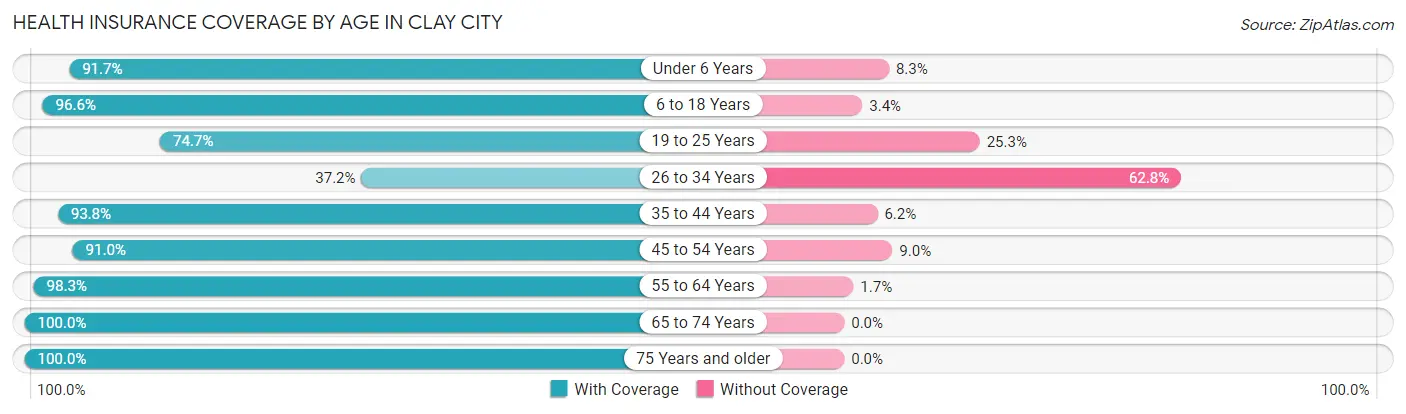
| Age Bracket | With Coverage | Without Coverage |
| Under 6 Years | 33 (91.7%) | 3 (8.3%) |
| 6 to 18 Years | 287 (96.6%) | 10 (3.4%) |
| 19 to 25 Years | 71 (74.7%) | 24 (25.3%) |
| 26 to 34 Years | 61 (37.2%) | 103 (62.8%) |
| 35 to 44 Years | 91 (93.8%) | 6 (6.2%) |
| 45 to 54 Years | 132 (91.0%) | 13 (9.0%) |
| 55 to 64 Years | 173 (98.3%) | 3 (1.7%) |
| 65 to 74 Years | 63 (100.0%) | 0 (0.0%) |
| 75 Years and older | 62 (100.0%) | 0 (0.0%) |
| Total | 973 (85.7%) | 162 (14.3%) |
Health Insurance Coverage by Citizenship Status in Clay City
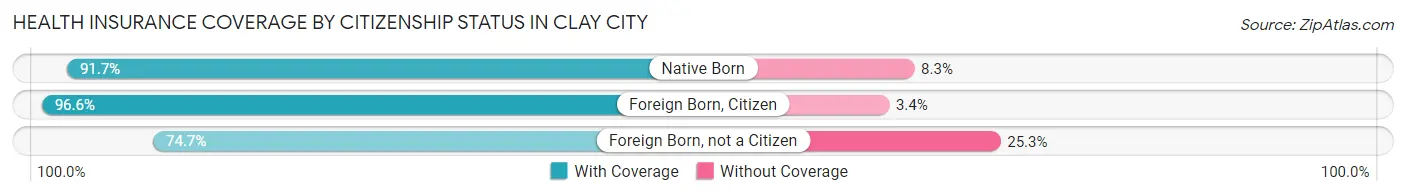
| Citizenship Status | With Coverage | Without Coverage |
| Native Born | 33 (91.7%) | 3 (8.3%) |
| Foreign Born, Citizen | 287 (96.6%) | 10 (3.4%) |
| Foreign Born, not a Citizen | 71 (74.7%) | 24 (25.3%) |
Health Insurance Coverage by Household Income in Clay City
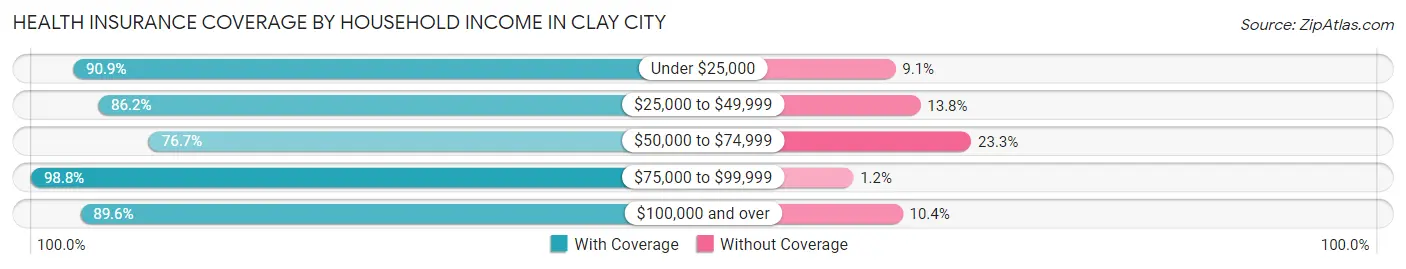
| Household Income | With Coverage | Without Coverage |
| Under $25,000 | 150 (90.9%) | 15 (9.1%) |
| $25,000 to $49,999 | 169 (86.2%) | 27 (13.8%) |
| $50,000 to $74,999 | 326 (76.7%) | 99 (23.3%) |
| $75,000 to $99,999 | 165 (98.8%) | 2 (1.2%) |
| $100,000 and over | 163 (89.6%) | 19 (10.4%) |
Public vs Private Health Insurance Coverage by Age in Clay City
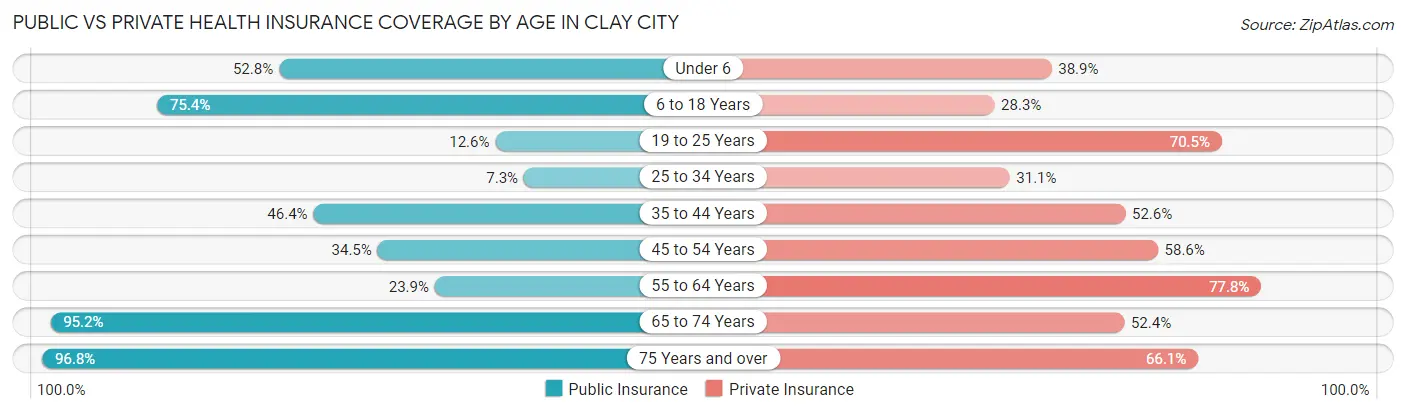
| Age Bracket | Public Insurance | Private Insurance |
| Under 6 | 19 (52.8%) | 14 (38.9%) |
| 6 to 18 Years | 224 (75.4%) | 84 (28.3%) |
| 19 to 25 Years | 12 (12.6%) | 67 (70.5%) |
| 25 to 34 Years | 12 (7.3%) | 51 (31.1%) |
| 35 to 44 Years | 45 (46.4%) | 51 (52.6%) |
| 45 to 54 Years | 50 (34.5%) | 85 (58.6%) |
| 55 to 64 Years | 42 (23.9%) | 137 (77.8%) |
| 65 to 74 Years | 60 (95.2%) | 33 (52.4%) |
| 75 Years and over | 60 (96.8%) | 41 (66.1%) |
| Total | 524 (46.2%) | 563 (49.6%) |
Disability Status by Sex by Age in Clay City
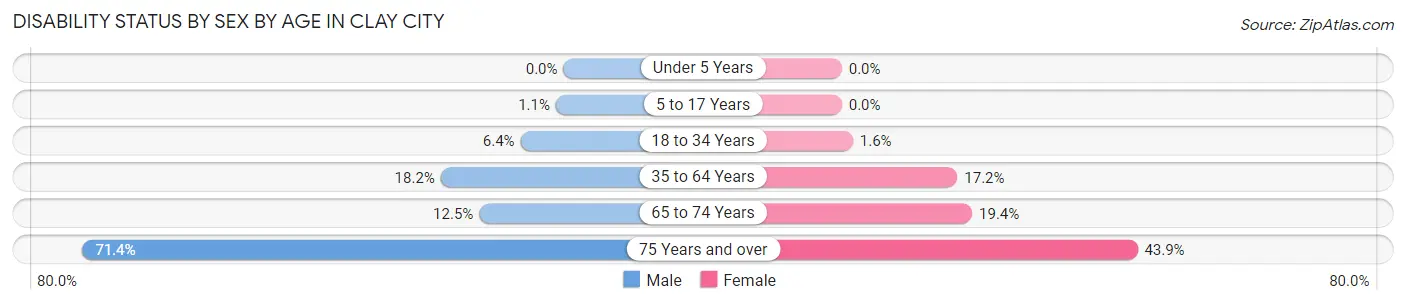
| Age Bracket | Male | Female |
| Under 5 Years | 0 (0.0%) | 0 (0.0%) |
| 5 to 17 Years | 2 (1.1%) | 0 (0.0%) |
| 18 to 34 Years | 10 (6.4%) | 2 (1.6%) |
| 35 to 64 Years | 39 (18.2%) | 35 (17.2%) |
| 65 to 74 Years | 4 (12.5%) | 6 (19.4%) |
| 75 Years and over | 15 (71.4%) | 18 (43.9%) |
Disability Class by Sex by Age in Clay City
Disability Class: Hearing Difficulty
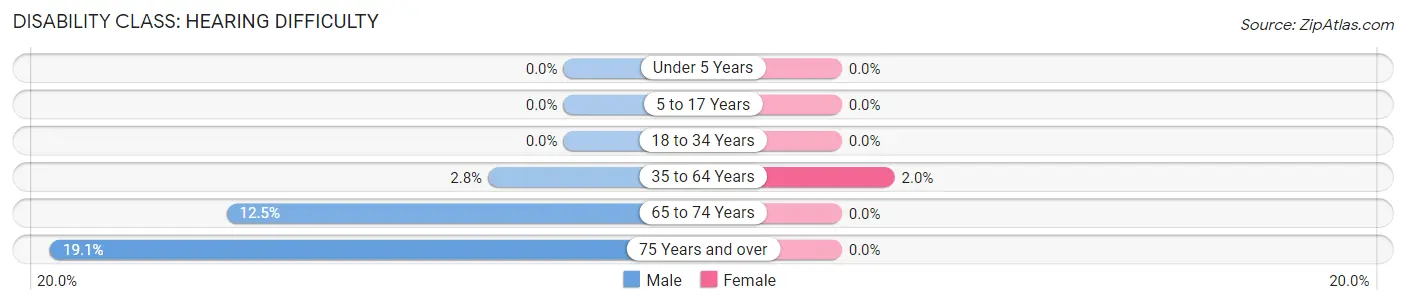
| Age Bracket | Male | Female |
| Under 5 Years | 0 (0.0%) | 0 (0.0%) |
| 5 to 17 Years | 0 (0.0%) | 0 (0.0%) |
| 18 to 34 Years | 0 (0.0%) | 0 (0.0%) |
| 35 to 64 Years | 6 (2.8%) | 4 (2.0%) |
| 65 to 74 Years | 4 (12.5%) | 0 (0.0%) |
| 75 Years and over | 4 (19.1%) | 0 (0.0%) |
Disability Class: Vision Difficulty
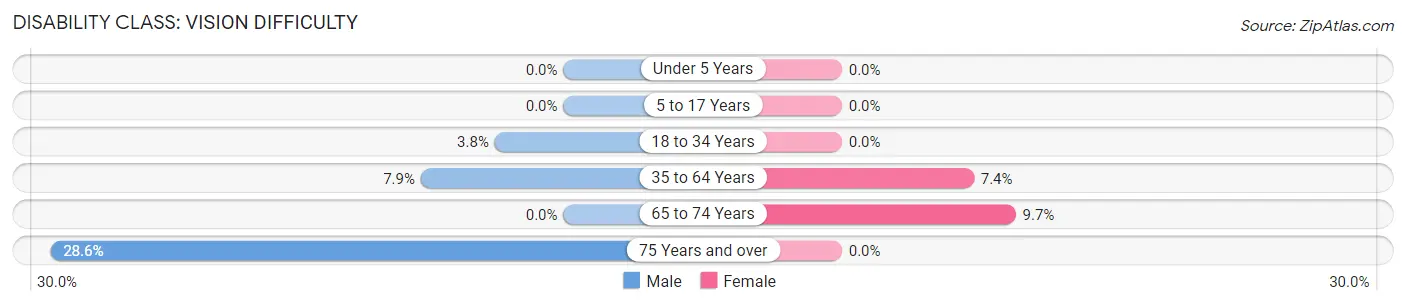
| Age Bracket | Male | Female |
| Under 5 Years | 0 (0.0%) | 0 (0.0%) |
| 5 to 17 Years | 0 (0.0%) | 0 (0.0%) |
| 18 to 34 Years | 6 (3.8%) | 0 (0.0%) |
| 35 to 64 Years | 17 (7.9%) | 15 (7.3%) |
| 65 to 74 Years | 0 (0.0%) | 3 (9.7%) |
| 75 Years and over | 6 (28.6%) | 0 (0.0%) |
Disability Class: Cognitive Difficulty
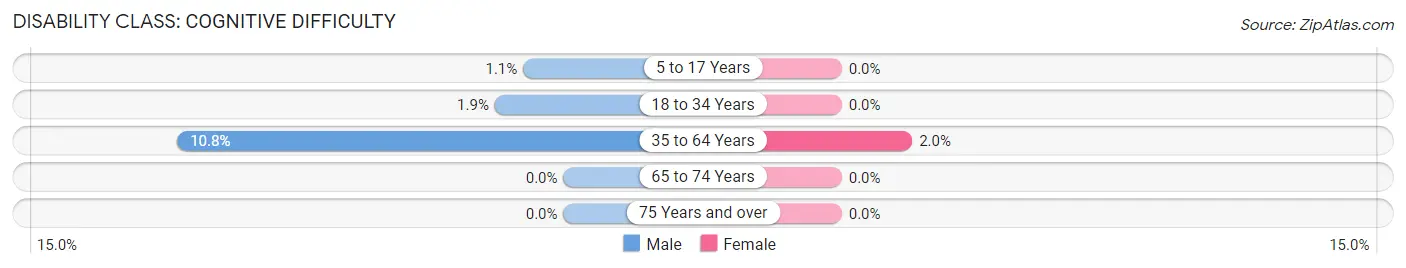
| Age Bracket | Male | Female |
| 5 to 17 Years | 2 (1.1%) | 0 (0.0%) |
| 18 to 34 Years | 3 (1.9%) | 0 (0.0%) |
| 35 to 64 Years | 23 (10.7%) | 4 (2.0%) |
| 65 to 74 Years | 0 (0.0%) | 0 (0.0%) |
| 75 Years and over | 0 (0.0%) | 0 (0.0%) |
Disability Class: Ambulatory Difficulty
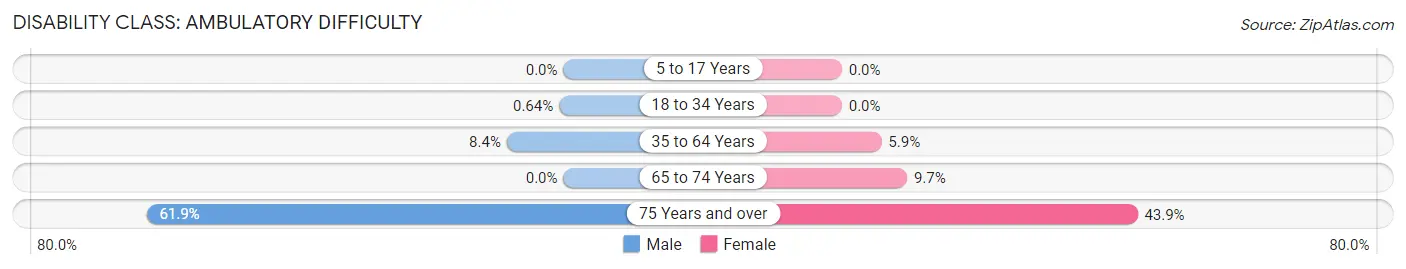
| Age Bracket | Male | Female |
| 5 to 17 Years | 0 (0.0%) | 0 (0.0%) |
| 18 to 34 Years | 1 (0.6%) | 0 (0.0%) |
| 35 to 64 Years | 18 (8.4%) | 12 (5.9%) |
| 65 to 74 Years | 0 (0.0%) | 3 (9.7%) |
| 75 Years and over | 13 (61.9%) | 18 (43.9%) |
Disability Class: Self-Care Difficulty
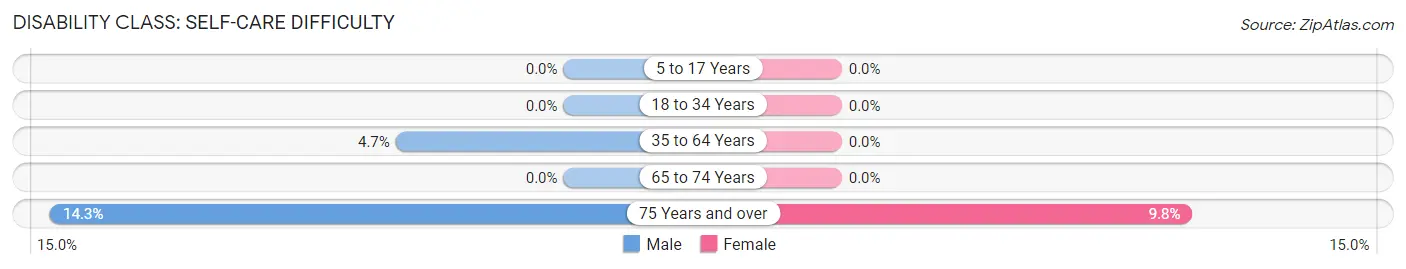
| Age Bracket | Male | Female |
| 5 to 17 Years | 0 (0.0%) | 0 (0.0%) |
| 18 to 34 Years | 0 (0.0%) | 0 (0.0%) |
| 35 to 64 Years | 10 (4.7%) | 0 (0.0%) |
| 65 to 74 Years | 0 (0.0%) | 0 (0.0%) |
| 75 Years and over | 3 (14.3%) | 4 (9.8%) |
Technology Access in Clay City
Computing Device Access in Clay City
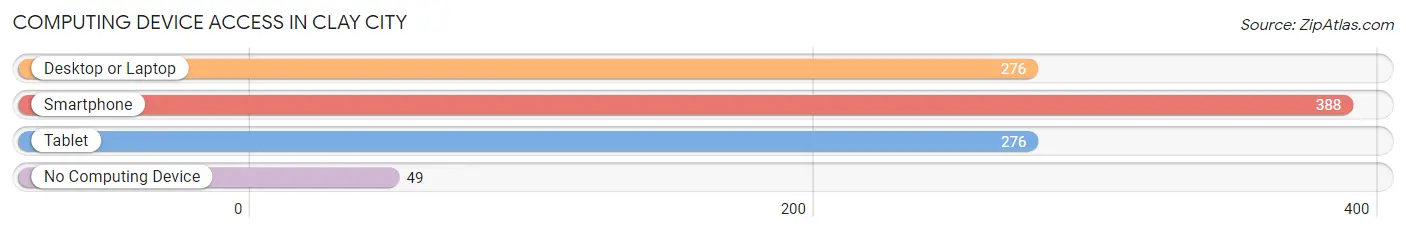
| Device Type | # Households | % Households |
| Desktop or Laptop | 276 | 60.1% |
| Smartphone | 388 | 84.5% |
| Tablet | 276 | 60.1% |
| No Computing Device | 49 | 10.7% |
| Total | 459 | 100.0% |
Internet Access in Clay City
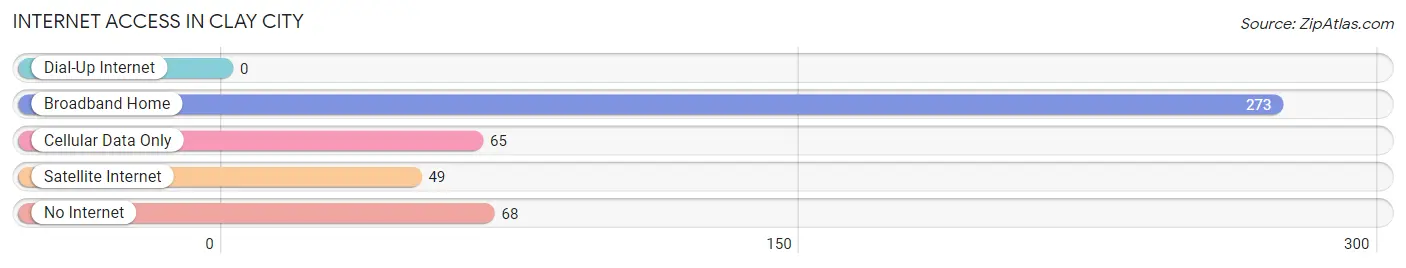
| Internet Type | # Households | % Households |
| Dial-Up Internet | 0 | 0.0% |
| Broadband Home | 273 | 59.5% |
| Cellular Data Only | 65 | 14.2% |
| Satellite Internet | 49 | 10.7% |
| No Internet | 68 | 14.8% |
| Total | 459 | 100.0% |
Clay City Summary
Clay City is a small town located in Clay County, Indiana, United States. It is situated in the Wabash Valley region of the state, approximately 40 miles south of Terre Haute. The town was founded in 1871 and has a population of 1,072 as of the 2010 census.
History
Clay City was founded in 1871 by a group of settlers from Clay County, Indiana. The town was named after the county, which was named after Henry Clay, a prominent statesman from Kentucky. The town was originally a farming community, but it soon developed into a small industrial center. The first industry in the town was a sawmill, which was built in 1872. This was followed by a grist mill, a brickyard, and a furniture factory.
In the late 19th century, Clay City was a thriving community with a population of over 1,000 people. The town had several churches, a bank, a newspaper, and a variety of stores and businesses. The town also had a railroad station, which connected it to the larger cities of Terre Haute and Indianapolis.
In the early 20th century, Clay City experienced a period of decline. The sawmill and grist mill closed, and the furniture factory moved away. The population of the town decreased, and by the 1950s, it had fallen to just over 500 people.
Geography
Clay City is located in the Wabash Valley region of Indiana. It is situated in the eastern part of Clay County, approximately 40 miles south of Terre Haute. The town is situated on the banks of the Wabash River, which flows through the county.
The town is surrounded by rolling hills and farmland. The climate is humid continental, with hot summers and cold winters. The average annual temperature is around 50 degrees Fahrenheit.
Economy
Clay City’s economy is largely based on agriculture and manufacturing. The town is home to several small businesses, including a feed mill, a lumber yard, and a grain elevator. The town also has a few restaurants and retail stores.
The town is also home to a few light manufacturing companies, including a plastics factory and a metal fabrication plant. The town is served by the Clay City-Brazil-Terre Haute Railroad, which connects it to the larger cities of Terre Haute and Indianapolis.
Demographics
As of the 2010 census, Clay City had a population of 1,072. The racial makeup of the town was 97.3% White, 0.7% African American, 0.2% Native American, 0.2% Asian, and 1.6% from other races. The median household income was $37,500, and the median family income was $45,000.
The town has a high rate of poverty, with 24.3% of the population living below the poverty line. The town also has a high rate of unemployment, with 8.3% of the population unemployed. The town has a low rate of educational attainment, with only 15.3% of the population having a bachelor’s degree or higher.
Conclusion
Clay City is a small town located in Clay County, Indiana. It was founded in 1871 and has a population of 1,072 as of the 2010 census. The town’s economy is largely based on agriculture and manufacturing, and it is served by the Clay City-Brazil-Terre Haute Railroad. The town has a high rate of poverty and unemployment, and a low rate of educational attainment.
Common Questions
What is Per Capita Income in Clay City?
Per Capita income in Clay City is $23,852.
What is the Median Family Income in Clay City?
Median Family Income in Clay City is $69,182.
What is the Median Household income in Clay City?
Median Household Income in Clay City is $56,250.
What is Income or Wage Gap in Clay City?
Income or Wage Gap in Clay City is 21.8%.
Women in Clay City earn 78.2 cents for every dollar earned by a man.
What is Inequality or Gini Index in Clay City?
Inequality or Gini Index in Clay City is 0.38.
What is the Total Population of Clay City?
Total Population of Clay City is 1,135.
What is the Total Male Population of Clay City?
Total Male Population of Clay City is 617.
What is the Total Female Population of Clay City?
Total Female Population of Clay City is 518.
What is the Ratio of Males per 100 Females in Clay City?
There are 119.11 Males per 100 Females in Clay City.
What is the Ratio of Females per 100 Males in Clay City?
There are 83.95 Females per 100 Males in Clay City.
What is the Median Population Age in Clay City?
Median Population Age in Clay City is 34.6 Years.
What is the Average Family Size in Clay City
Average Family Size in Clay City is 3.1 People.
What is the Average Household Size in Clay City
Average Household Size in Clay City is 2.5 People.
How Large is the Labor Force in Clay City?
There are 602 People in the Labor Forcein in Clay City.
What is the Percentage of People in the Labor Force in Clay City?
71.7% of People are in the Labor Force in Clay City.
What is the Unemployment Rate in Clay City?
Unemployment Rate in Clay City is 2.3%.