Clarksville, IN Map & Demographics
Clarksville Map
Clarksville Overview
$29,793
PER CAPITA INCOME
$73,844
AVG FAMILY INCOME
$53,620
AVG HOUSEHOLD INCOME
15.2%
WAGE / INCOME GAP [ % ]
84.8¢/ $1
WAGE / INCOME GAP [ $ ]
$7,770
FAMILY INCOME DEFICIT
0.42
INEQUALITY / GINI INDEX
22,087
TOTAL POPULATION
10,790
MALE POPULATION
11,297
FEMALE POPULATION
95.51
MALES / 100 FEMALES
104.70
FEMALES / 100 MALES
37.7
MEDIAN AGE
3.3
AVG FAMILY SIZE
2.4
AVG HOUSEHOLD SIZE
12,002
LABOR FORCE [ PEOPLE ]
66.0%
PERCENT IN LABOR FORCE
4.4%
UNEMPLOYMENT RATE
Clarksville Zip Codes
Clarksville Area Codes
Income in Clarksville
Income Overview in Clarksville
Per Capita Income in Clarksville is $29,793, while median incomes of families and households are $73,844 and $53,620 respectively.
| Characteristic | Number | Measure |
| Per Capita Income | 22,087 | $29,793 |
| Median Family Income | 4,851 | $73,844 |
| Mean Family Income | 4,851 | $90,520 |
| Median Household Income | 8,981 | $53,620 |
| Mean Household Income | 8,981 | $70,444 |
| Income Deficit | 4,851 | $7,770 |
| Wage / Income Gap (%) | 22,087 | 15.23% |
| Wage / Income Gap ($) | 22,087 | 84.77¢ per $1 |
| Gini / Inequality Index | 22,087 | 0.42 |
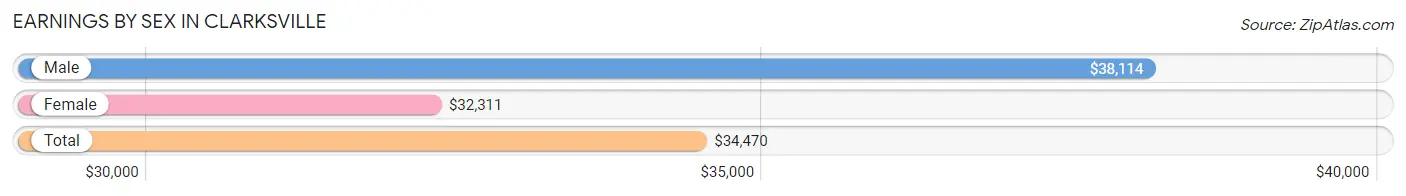
Earnings by Sex in Clarksville
Average Earnings in Clarksville are $34,470, $38,114 for men and $32,311 for women, a difference of 15.2%.
| Sex | Number | Average Earnings |
| Male | 6,451 (52.6%) | $38,114 |
| Female | 5,807 (47.4%) | $32,311 |
| Total | 12,258 (100.0%) | $34,470 |
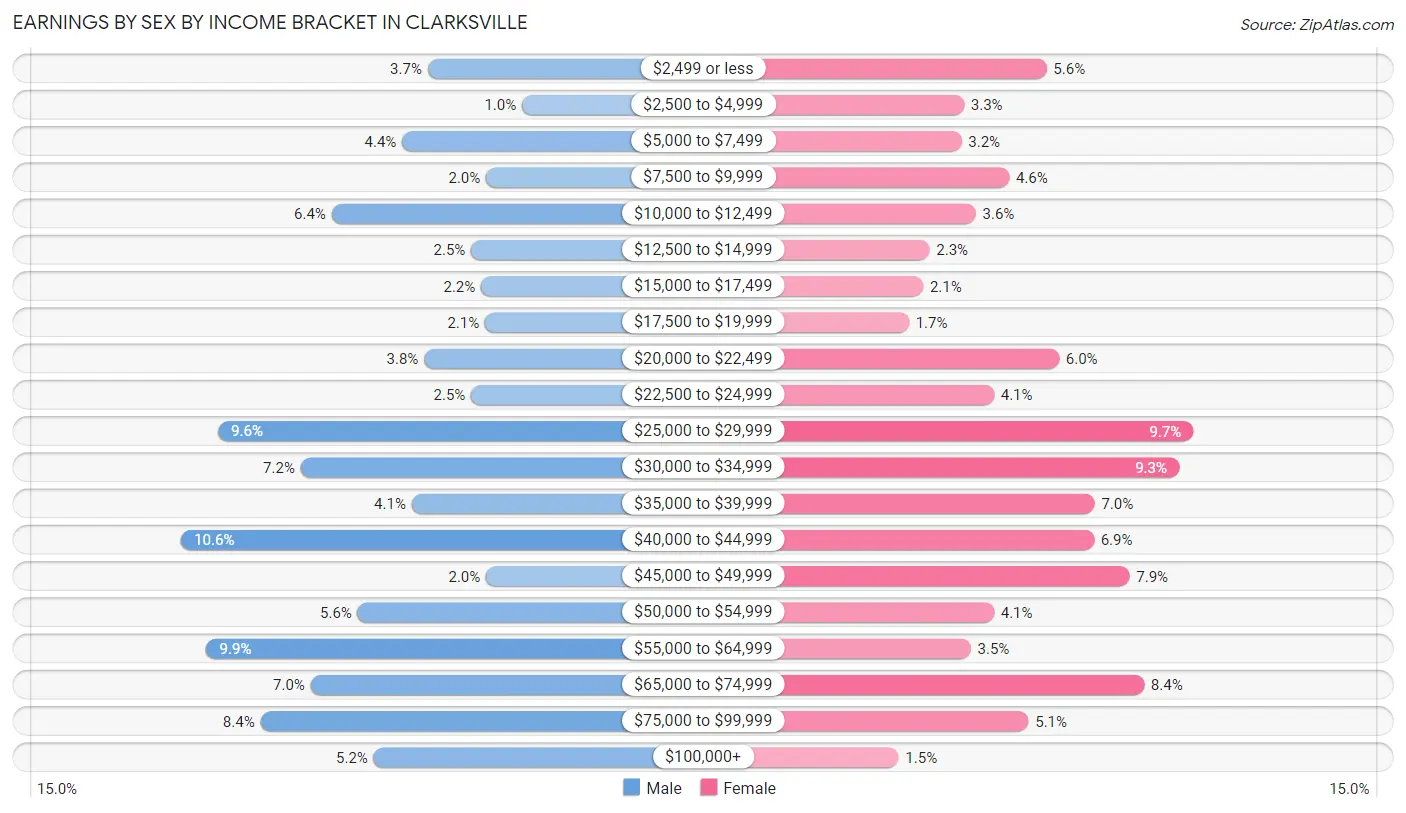
Earnings by Sex by Income Bracket in Clarksville
The most common earnings brackets in Clarksville are $40,000 to $44,999 for men (684 | 10.6%) and $25,000 to $29,999 for women (565 | 9.7%).
| Income | Male | Female |
| $2,499 or less | 237 (3.7%) | 326 (5.6%) |
| $2,500 to $4,999 | 66 (1.0%) | 191 (3.3%) |
| $5,000 to $7,499 | 283 (4.4%) | 187 (3.2%) |
| $7,500 to $9,999 | 131 (2.0%) | 265 (4.6%) |
| $10,000 to $12,499 | 411 (6.4%) | 210 (3.6%) |
| $12,500 to $14,999 | 158 (2.5%) | 135 (2.3%) |
| $15,000 to $17,499 | 140 (2.2%) | 124 (2.1%) |
| $17,500 to $19,999 | 133 (2.1%) | 101 (1.7%) |
| $20,000 to $22,499 | 243 (3.8%) | 346 (6.0%) |
| $22,500 to $24,999 | 158 (2.5%) | 240 (4.1%) |
| $25,000 to $29,999 | 617 (9.6%) | 565 (9.7%) |
| $30,000 to $34,999 | 467 (7.2%) | 542 (9.3%) |
| $35,000 to $39,999 | 266 (4.1%) | 404 (7.0%) |
| $40,000 to $44,999 | 684 (10.6%) | 403 (6.9%) |
| $45,000 to $49,999 | 131 (2.0%) | 461 (7.9%) |
| $50,000 to $54,999 | 364 (5.6%) | 240 (4.1%) |
| $55,000 to $64,999 | 638 (9.9%) | 202 (3.5%) |
| $65,000 to $74,999 | 449 (7.0%) | 485 (8.4%) |
| $75,000 to $99,999 | 540 (8.4%) | 296 (5.1%) |
| $100,000+ | 335 (5.2%) | 84 (1.5%) |
| Total | 6,451 (100.0%) | 5,807 (100.0%) |
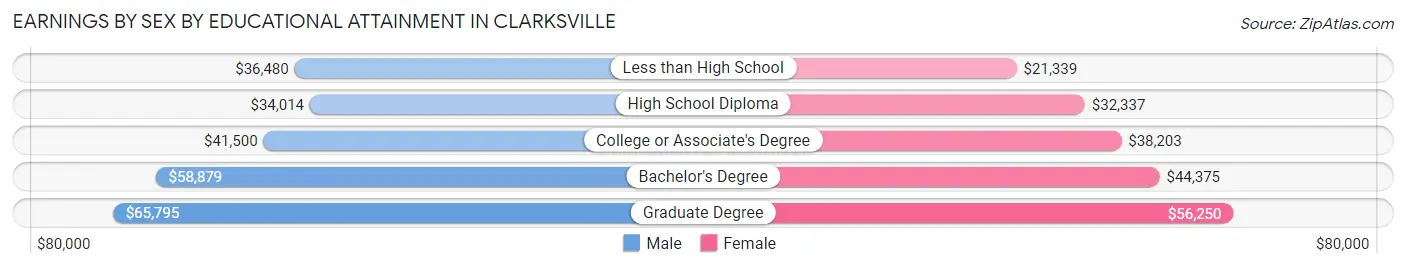
Earnings by Sex by Educational Attainment in Clarksville
Average earnings in Clarksville are $41,629 for men and $37,832 for women, a difference of 9.1%. Men with an educational attainment of graduate degree enjoy the highest average annual earnings of $65,795, while those with high school diploma education earn the least with $34,014. Women with an educational attainment of graduate degree earn the most with the average annual earnings of $56,250, while those with less than high school education have the smallest earnings of $21,339.
| Educational Attainment | Male Income | Female Income |
| Less than High School | $36,480 | $21,339 |
| High School Diploma | $34,014 | $32,337 |
| College or Associate's Degree | $41,500 | $38,203 |
| Bachelor's Degree | $58,879 | $44,375 |
| Graduate Degree | $65,795 | $56,250 |
| Total | $41,629 | $37,832 |
Family Income in Clarksville
Family Income Brackets in Clarksville
According to the Clarksville family income data, there are 990 families falling into the $100,000 to $149,999 income range, which is the most common income bracket and makes up 20.4% of all families. Conversely, the less than $10,000 income bracket is the least frequent group with only 82 families (1.7%) belonging to this category.
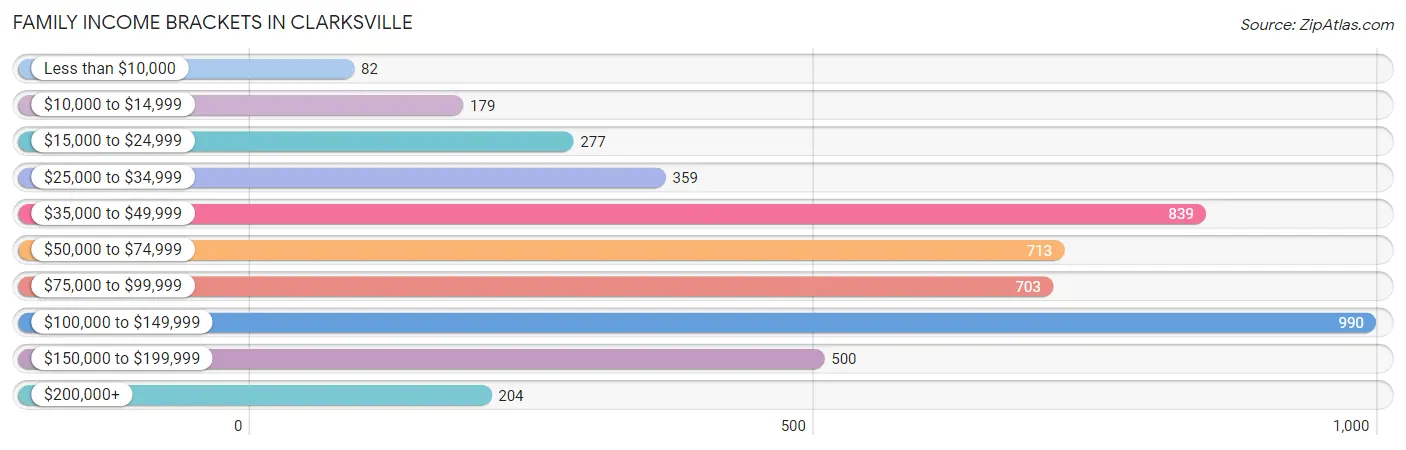
| Income Bracket | # Families | % Families |
| Less than $10,000 | 82 | 1.7% |
| $10,000 to $14,999 | 179 | 3.7% |
| $15,000 to $24,999 | 277 | 5.7% |
| $25,000 to $34,999 | 359 | 7.4% |
| $35,000 to $49,999 | 839 | 17.3% |
| $50,000 to $74,999 | 713 | 14.7% |
| $75,000 to $99,999 | 703 | 14.5% |
| $100,000 to $149,999 | 990 | 20.4% |
| $150,000 to $199,999 | 500 | 10.3% |
| $200,000+ | 204 | 4.2% |
Family Income by Famaliy Size in Clarksville
6-person families (138 | 2.8%) account for the highest median family income in Clarksville with $110,250 per family, while 2-person families (2,019 | 41.6%) have the highest median income of $33,740 per family member.
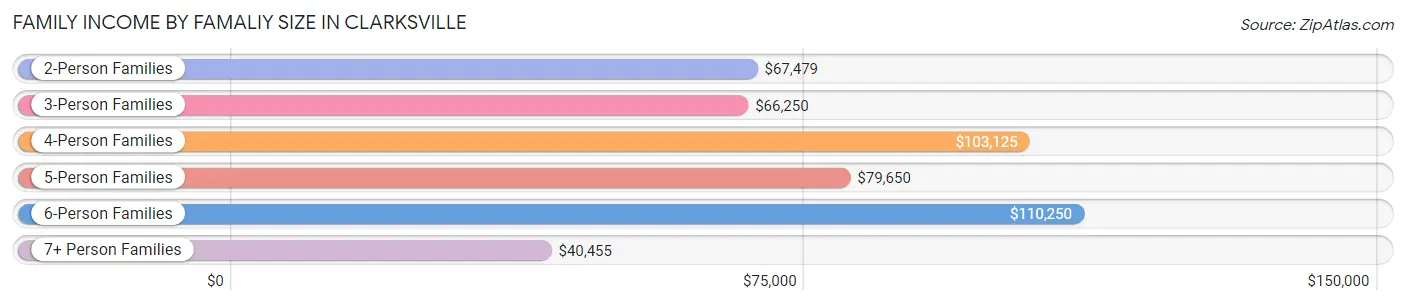
| Income Bracket | # Families | Median Income |
| 2-Person Families | 2,019 (41.6%) | $67,479 |
| 3-Person Families | 1,047 (21.6%) | $66,250 |
| 4-Person Families | 1,139 (23.5%) | $103,125 |
| 5-Person Families | 460 (9.5%) | $79,650 |
| 6-Person Families | 138 (2.8%) | $110,250 |
| 7+ Person Families | 48 (1.0%) | $40,455 |
| Total | 4,851 (100.0%) | $73,844 |
Family Income by Number of Earners in Clarksville
The median family income in Clarksville is $73,844, with families comprising 3+ earners (869) having the highest median family income of $130,625, while families with no earners (693) have the lowest median family income of $37,138, accounting for 17.9% and 14.3% of families, respectively.
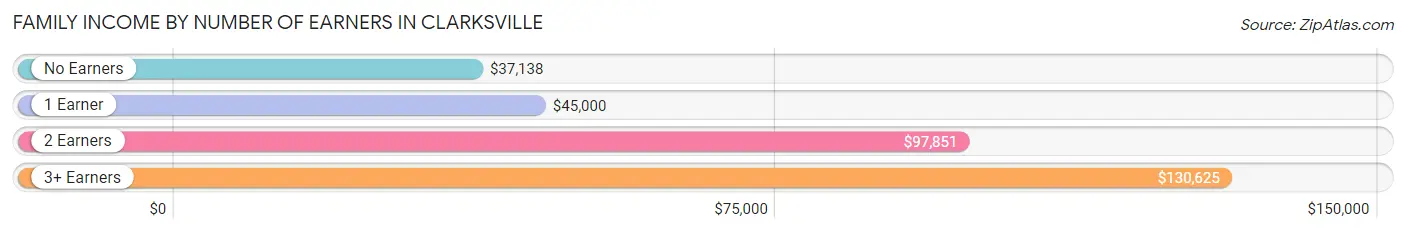
| Number of Earners | # Families | Median Income |
| No Earners | 693 (14.3%) | $37,138 |
| 1 Earner | 1,404 (28.9%) | $45,000 |
| 2 Earners | 1,885 (38.9%) | $97,851 |
| 3+ Earners | 869 (17.9%) | $130,625 |
| Total | 4,851 (100.0%) | $73,844 |
Household Income in Clarksville
Household Income Brackets in Clarksville
With 1,904 households falling in the category, the $50,000 to $74,999 income range is the most frequent in Clarksville, accounting for 21.2% of all households. In contrast, only 207 households (2.3%) fall into the $200,000+ income bracket, making it the least populous group.
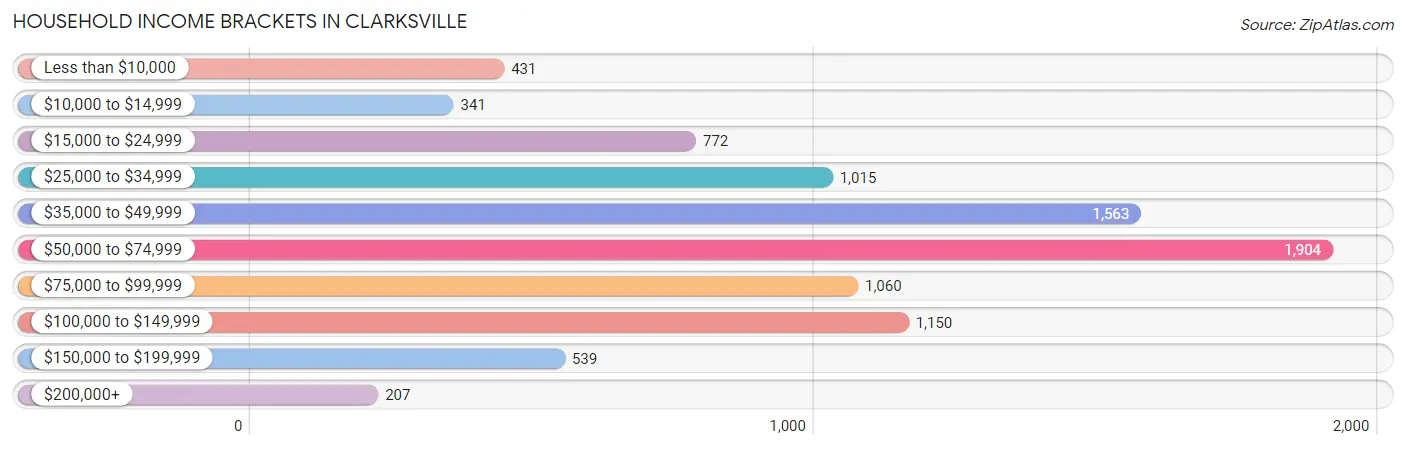
| Income Bracket | # Households | % Households |
| Less than $10,000 | 431 | 4.8% |
| $10,000 to $14,999 | 341 | 3.8% |
| $15,000 to $24,999 | 772 | 8.6% |
| $25,000 to $34,999 | 1,015 | 11.3% |
| $35,000 to $49,999 | 1,563 | 17.4% |
| $50,000 to $74,999 | 1,904 | 21.2% |
| $75,000 to $99,999 | 1,060 | 11.8% |
| $100,000 to $149,999 | 1,150 | 12.8% |
| $150,000 to $199,999 | 539 | 6.0% |
| $200,000+ | 207 | 2.3% |
Household Income by Householder Age in Clarksville
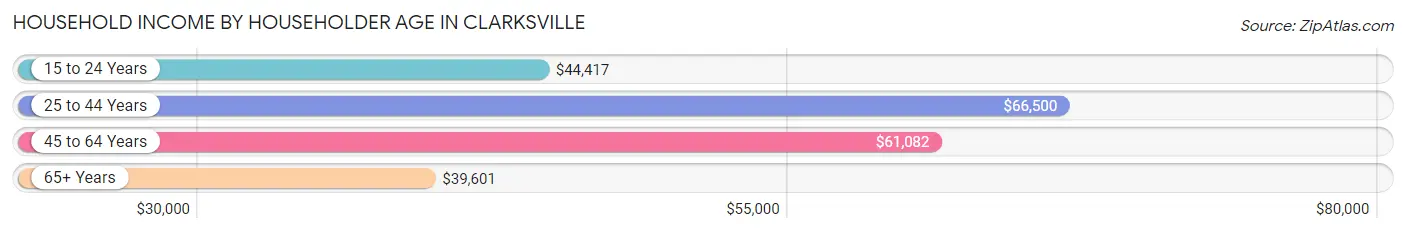
The median household income in Clarksville is $53,620, with the highest median household income of $66,500 found in the 25 to 44 years age bracket for the primary householder. A total of 3,356 households (37.4%) fall into this category. Meanwhile, the 65+ years age bracket for the primary householder has the lowest median household income of $39,601, with 2,152 households (24.0%) in this group.
| Income Bracket | # Households | Median Income |
| 15 to 24 Years | 505 (5.6%) | $44,417 |
| 25 to 44 Years | 3,356 (37.4%) | $66,500 |
| 45 to 64 Years | 2,968 (33.1%) | $61,082 |
| 65+ Years | 2,152 (24.0%) | $39,601 |
| Total | 8,981 (100.0%) | $53,620 |
Poverty in Clarksville
Income Below Poverty by Sex and Age in Clarksville
With 14.1% poverty level for males and 14.7% for females among the residents of Clarksville, 5 year old males and 15 year old females are the most vulnerable to poverty, with 15 males (53.6%) and 47 females (41.2%) in their respective age groups living below the poverty level.
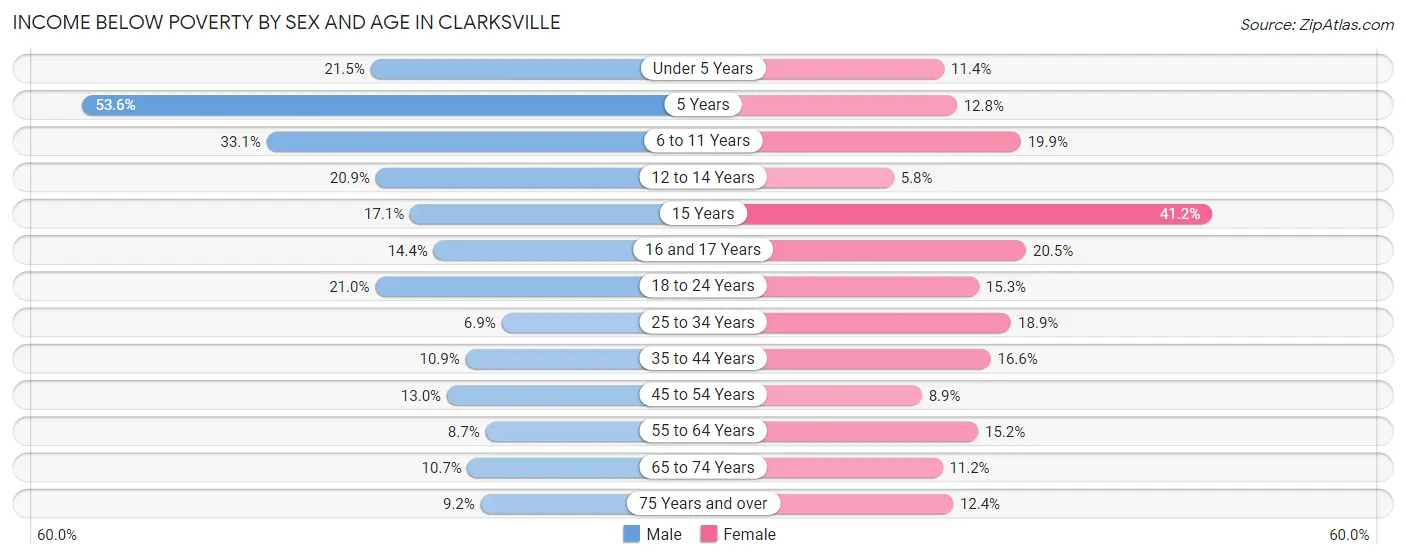
| Age Bracket | Male | Female |
| Under 5 Years | 137 (21.5%) | 74 (11.4%) |
| 5 Years | 15 (53.6%) | 16 (12.8%) |
| 6 to 11 Years | 235 (33.1%) | 109 (19.9%) |
| 12 to 14 Years | 89 (20.9%) | 22 (5.8%) |
| 15 Years | 42 (17.1%) | 47 (41.2%) |
| 16 and 17 Years | 53 (14.4%) | 55 (20.5%) |
| 18 to 24 Years | 243 (20.9%) | 177 (15.3%) |
| 25 to 34 Years | 130 (6.9%) | 334 (18.9%) |
| 35 to 44 Years | 172 (10.9%) | 210 (16.6%) |
| 45 to 54 Years | 173 (13.0%) | 106 (8.9%) |
| 55 to 64 Years | 91 (8.7%) | 229 (15.2%) |
| 65 to 74 Years | 86 (10.7%) | 120 (11.2%) |
| 75 Years and over | 44 (9.2%) | 116 (12.4%) |
| Total | 1,510 (14.1%) | 1,615 (14.7%) |
Income Above Poverty by Sex and Age in Clarksville
According to the poverty statistics in Clarksville, males aged 25 to 34 years and females aged 12 to 14 years are the age groups that are most secure financially, with 93.1% of males and 94.2% of females in these age groups living above the poverty line.
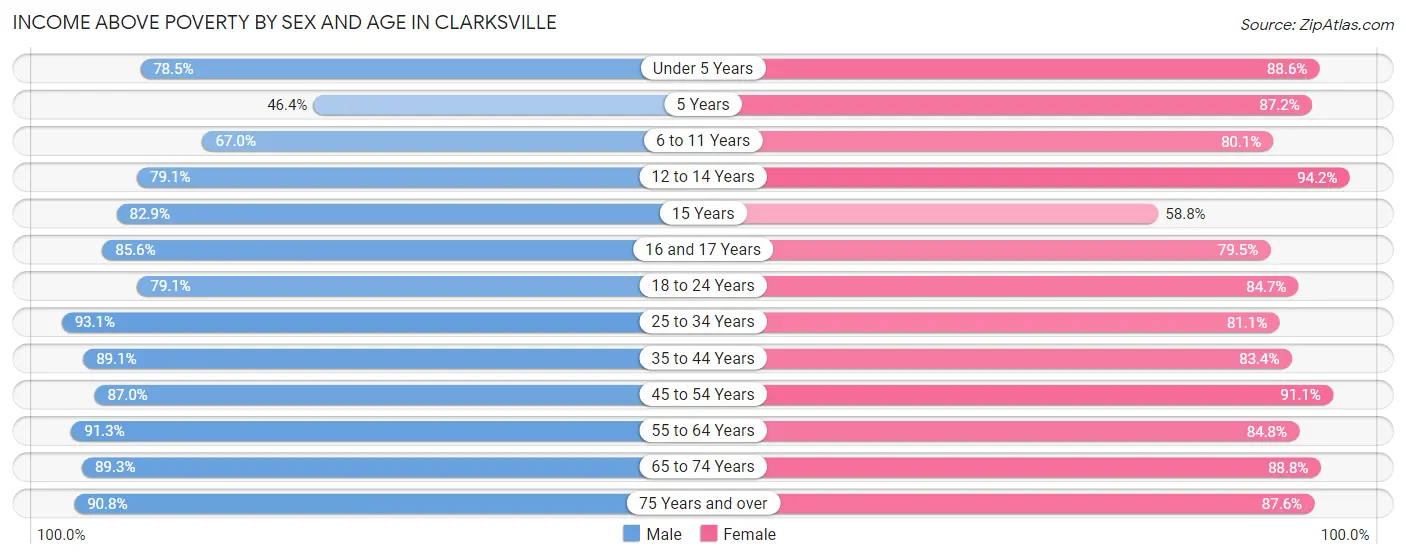
| Age Bracket | Male | Female |
| Under 5 Years | 501 (78.5%) | 575 (88.6%) |
| 5 Years | 13 (46.4%) | 109 (87.2%) |
| 6 to 11 Years | 476 (66.9%) | 438 (80.1%) |
| 12 to 14 Years | 337 (79.1%) | 358 (94.2%) |
| 15 Years | 204 (82.9%) | 67 (58.8%) |
| 16 and 17 Years | 314 (85.6%) | 213 (79.5%) |
| 18 to 24 Years | 917 (79.0%) | 982 (84.7%) |
| 25 to 34 Years | 1,757 (93.1%) | 1,437 (81.1%) |
| 35 to 44 Years | 1,407 (89.1%) | 1,057 (83.4%) |
| 45 to 54 Years | 1,161 (87.0%) | 1,085 (91.1%) |
| 55 to 64 Years | 958 (91.3%) | 1,281 (84.8%) |
| 65 to 74 Years | 721 (89.3%) | 950 (88.8%) |
| 75 Years and over | 433 (90.8%) | 821 (87.6%) |
| Total | 9,199 (85.9%) | 9,373 (85.3%) |
Income Below Poverty Among Married-Couple Families in Clarksville
The poverty statistics for married-couple families in Clarksville show that 7.9% or 232 of the total 2,940 families live below the poverty line. Families with 5 or more children have the highest poverty rate of 91.3%, comprising of 42 families. On the other hand, families with no children have the lowest poverty rate of 3.3%, which includes 54 families.
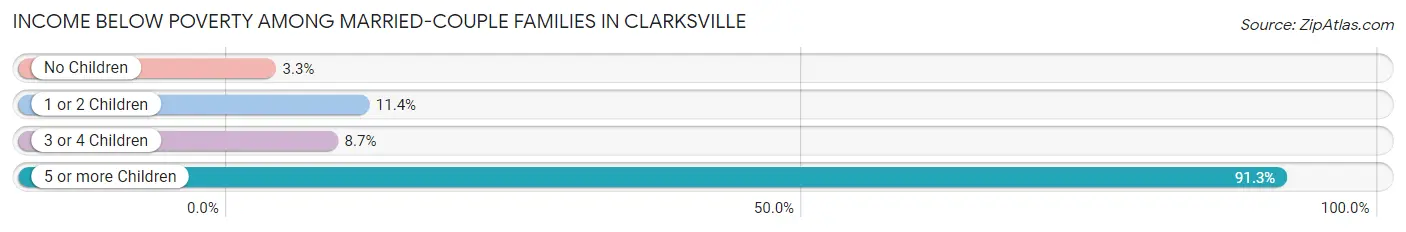
| Children | Above Poverty | Below Poverty |
| No Children | 1,599 (96.7%) | 54 (3.3%) |
| 1 or 2 Children | 926 (88.6%) | 119 (11.4%) |
| 3 or 4 Children | 179 (91.3%) | 17 (8.7%) |
| 5 or more Children | 4 (8.7%) | 42 (91.3%) |
| Total | 2,708 (92.1%) | 232 (7.9%) |
Income Below Poverty Among Single-Parent Households in Clarksville
According to the poverty data in Clarksville, 10.3% or 89 single-father households and 24.8% or 261 single-mother households are living below the poverty line. Among single-father households, those with 1 or 2 children have the highest poverty rate, with 71 households (19.2%) experiencing poverty. Likewise, among single-mother households, those with 5 or more children have the highest poverty rate, with 5 households (100.0%) falling below the poverty line.
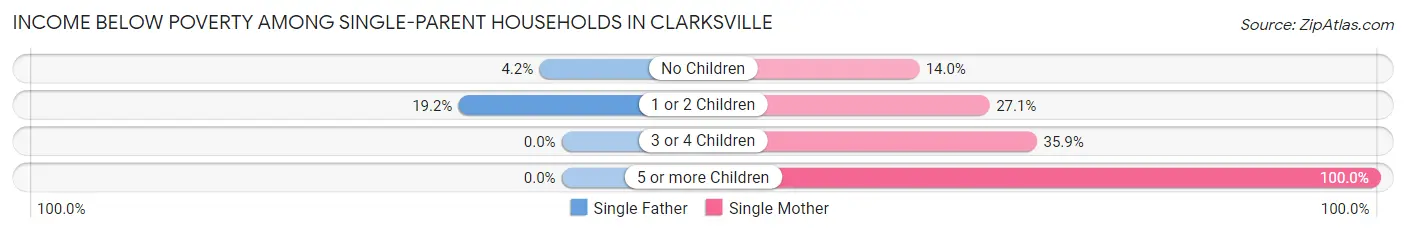
| Children | Single Father | Single Mother |
| No Children | 18 (4.2%) | 51 (14.0%) |
| 1 or 2 Children | 71 (19.2%) | 122 (27.1%) |
| 3 or 4 Children | 0 (0.0%) | 83 (35.9%) |
| 5 or more Children | 0 (0.0%) | 5 (100.0%) |
| Total | 89 (10.3%) | 261 (24.8%) |
Income Below Poverty Among Married-Couple vs Single-Parent Households in Clarksville
The poverty data for Clarksville shows that 232 of the married-couple family households (7.9%) and 350 of the single-parent households (18.3%) are living below the poverty level. Within the married-couple family households, those with 5 or more children have the highest poverty rate, with 42 households (91.3%) falling below the poverty line. Among the single-parent households, those with 5 or more children have the highest poverty rate, with 5 household (100.0%) living below poverty.
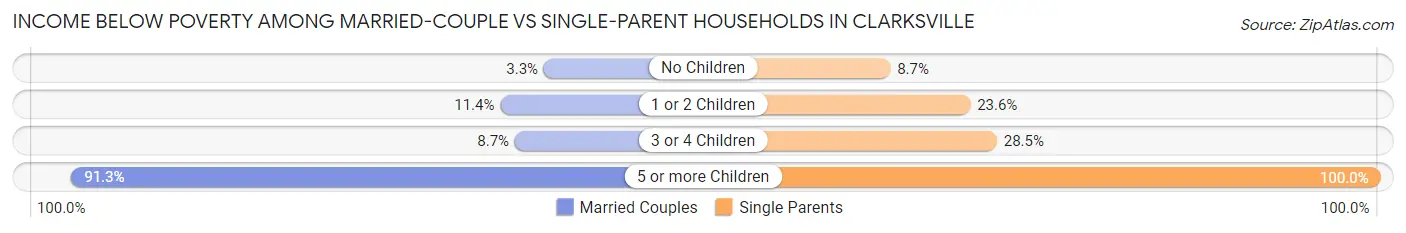
| Children | Married-Couple Families | Single-Parent Households |
| No Children | 54 (3.3%) | 69 (8.7%) |
| 1 or 2 Children | 119 (11.4%) | 193 (23.6%) |
| 3 or 4 Children | 17 (8.7%) | 83 (28.5%) |
| 5 or more Children | 42 (91.3%) | 5 (100.0%) |
| Total | 232 (7.9%) | 350 (18.3%) |
Race in Clarksville
The most populous races in Clarksville are White / Caucasian (18,551 | 84.0%), Hispanic or Latino (3,147 | 14.2%), and Black / African American (1,496 | 6.8%).
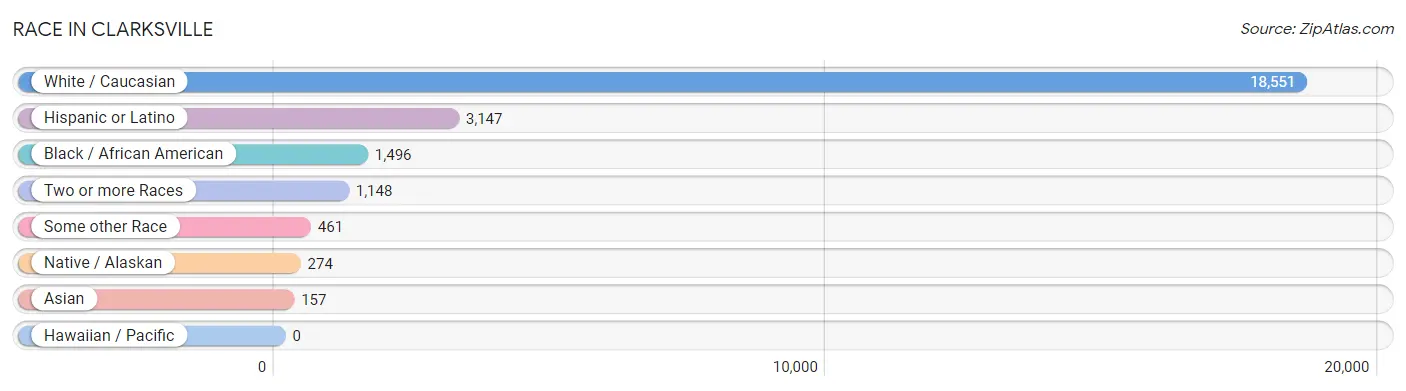
| Race | # Population | % Population |
| Asian | 157 | 0.7% |
| Black / African American | 1,496 | 6.8% |
| Hawaiian / Pacific | 0 | 0.0% |
| Hispanic or Latino | 3,147 | 14.2% |
| Native / Alaskan | 274 | 1.2% |
| White / Caucasian | 18,551 | 84.0% |
| Two or more Races | 1,148 | 5.2% |
| Some other Race | 461 | 2.1% |
| Total | 22,087 | 100.0% |
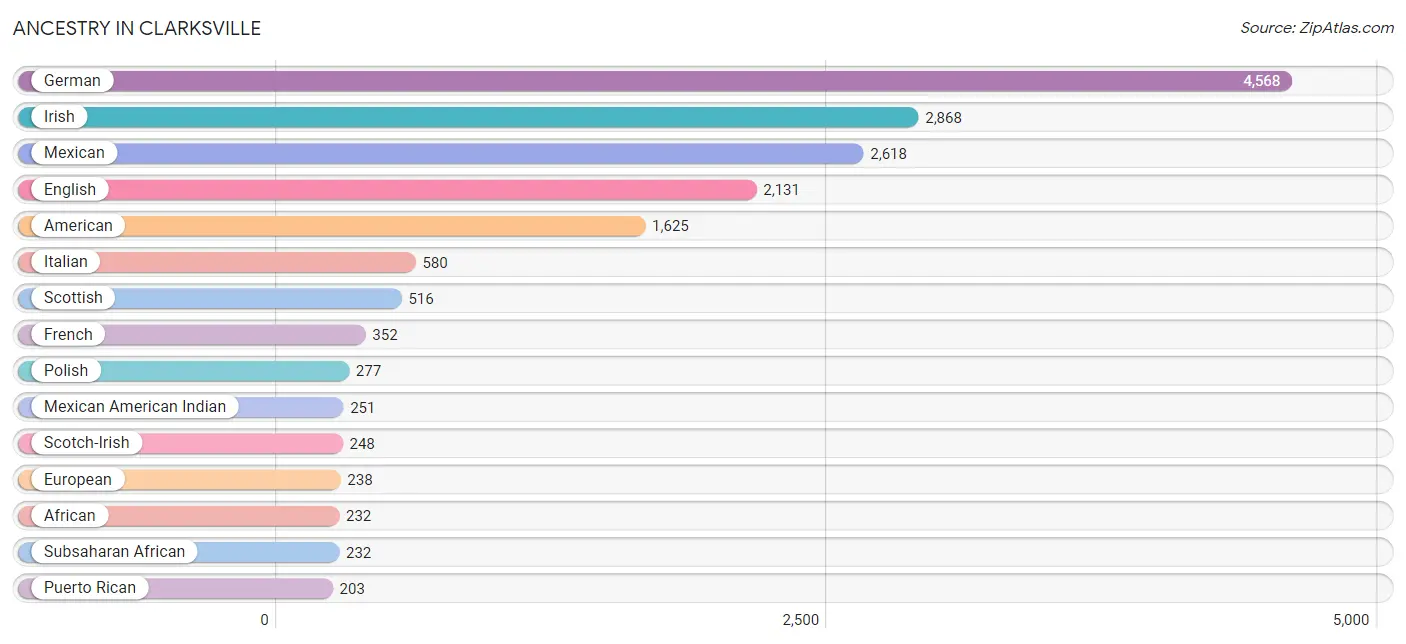
Ancestry in Clarksville
The most populous ancestries reported in Clarksville are German (4,568 | 20.7%), Irish (2,868 | 13.0%), Mexican (2,618 | 11.8%), English (2,131 | 9.7%), and American (1,625 | 7.4%), together accounting for 62.5% of all Clarksville residents.
| Ancestry | # Population | % Population |
| African | 232 | 1.1% |
| American | 1,625 | 7.4% |
| Arab | 9 | 0.0% |
| Armenian | 26 | 0.1% |
| Austrian | 67 | 0.3% |
| Belgian | 20 | 0.1% |
| Bhutanese | 1 | 0.0% |
| British | 126 | 0.6% |
| Central American | 154 | 0.7% |
| Central American Indian | 18 | 0.1% |
| Cherokee | 53 | 0.2% |
| Cuban | 74 | 0.3% |
| Czech | 41 | 0.2% |
| Czechoslovakian | 13 | 0.1% |
| Dutch | 107 | 0.5% |
| Dutch West Indian | 30 | 0.1% |
| Eastern European | 38 | 0.2% |
| Ecuadorian | 37 | 0.2% |
| English | 2,131 | 9.7% |
| European | 238 | 1.1% |
| Finnish | 8 | 0.0% |
| French | 352 | 1.6% |
| French Canadian | 7 | 0.0% |
| German | 4,568 | 20.7% |
| Greek | 33 | 0.2% |
| Guamanian / Chamorro | 11 | 0.1% |
| Honduran | 134 | 0.6% |
| Hungarian | 33 | 0.2% |
| Indian (Asian) | 8 | 0.0% |
| Iranian | 13 | 0.1% |
| Irish | 2,868 | 13.0% |
| Italian | 580 | 2.6% |
| Japanese | 29 | 0.1% |
| Korean | 40 | 0.2% |
| Lebanese | 9 | 0.0% |
| Mexican | 2,618 | 11.8% |
| Mexican American Indian | 251 | 1.1% |
| Native Hawaiian | 7 | 0.0% |
| Northern European | 8 | 0.0% |
| Norwegian | 125 | 0.6% |
| Polish | 277 | 1.3% |
| Puerto Rican | 203 | 0.9% |
| Romanian | 52 | 0.2% |
| Russian | 36 | 0.2% |
| Salvadoran | 20 | 0.1% |
| Scandinavian | 48 | 0.2% |
| Scotch-Irish | 248 | 1.1% |
| Scottish | 516 | 2.3% |
| Serbian | 12 | 0.1% |
| South American | 37 | 0.2% |
| Spaniard | 21 | 0.1% |
| Sri Lankan | 99 | 0.4% |
| Subsaharan African | 232 | 1.1% |
| Swedish | 40 | 0.2% |
| Swiss | 36 | 0.2% |
| Thai | 22 | 0.1% |
| Ukrainian | 13 | 0.1% |
| Welsh | 173 | 0.8% | View All 58 Rows |
Immigrants in Clarksville
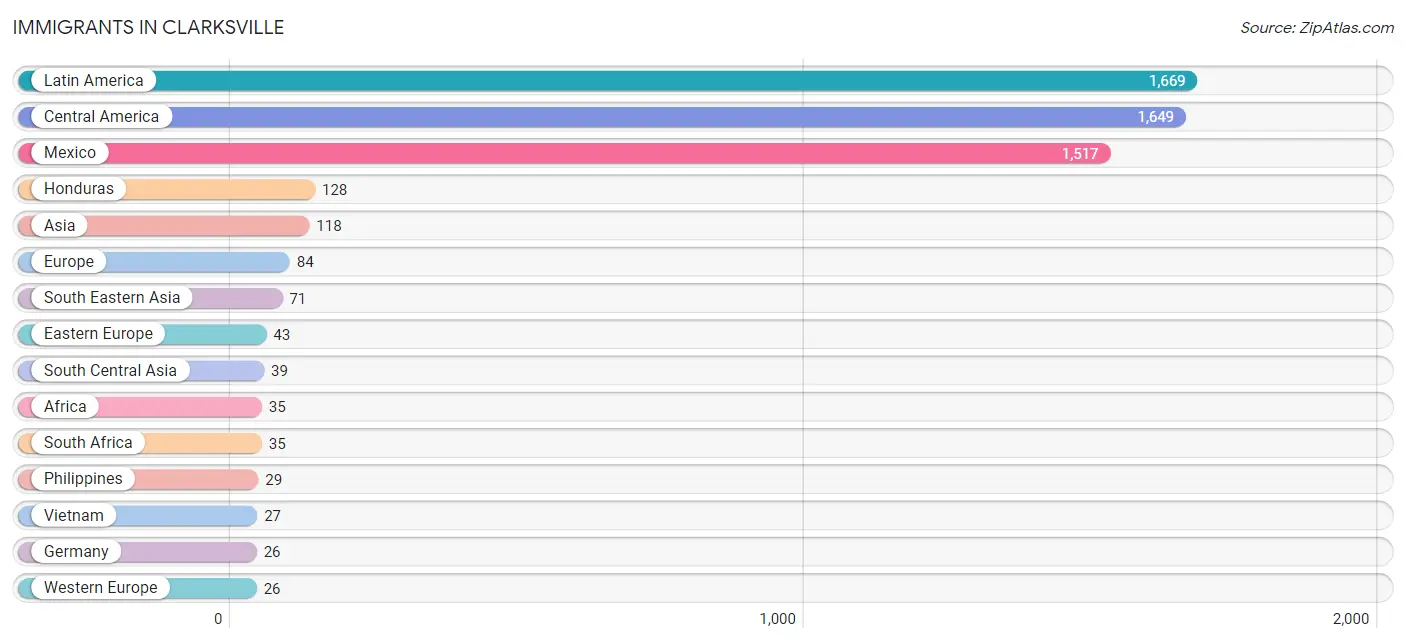
The most numerous immigrant groups reported in Clarksville came from Latin America (1,669 | 7.6%), Central America (1,649 | 7.5%), Mexico (1,517 | 6.9%), Honduras (128 | 0.6%), and Asia (118 | 0.5%), together accounting for 23.0% of all Clarksville residents.
| Immigration Origin | # Population | % Population |
| Africa | 35 | 0.2% |
| Asia | 118 | 0.5% |
| Cambodia | 9 | 0.0% |
| Caribbean | 9 | 0.0% |
| Central America | 1,649 | 7.5% |
| China | 8 | 0.0% |
| Cuba | 9 | 0.0% |
| Eastern Asia | 8 | 0.0% |
| Eastern Europe | 43 | 0.2% |
| Ecuador | 8 | 0.0% |
| El Salvador | 4 | 0.0% |
| England | 9 | 0.0% |
| Europe | 84 | 0.4% |
| Germany | 26 | 0.1% |
| Guyana | 3 | 0.0% |
| Honduras | 128 | 0.6% |
| India | 6 | 0.0% |
| Indonesia | 6 | 0.0% |
| Iran | 13 | 0.1% |
| Italy | 6 | 0.0% |
| Latin America | 1,669 | 7.6% |
| Mexico | 1,517 | 6.9% |
| Northern Europe | 9 | 0.0% |
| Pakistan | 20 | 0.1% |
| Philippines | 29 | 0.1% |
| Romania | 22 | 0.1% |
| Russia | 8 | 0.0% |
| South Africa | 35 | 0.2% |
| South America | 11 | 0.1% |
| South Central Asia | 39 | 0.2% |
| South Eastern Asia | 71 | 0.3% |
| Southern Europe | 6 | 0.0% |
| Ukraine | 13 | 0.1% |
| Vietnam | 27 | 0.1% |
| Western Europe | 26 | 0.1% | View All 35 Rows |
Sex and Age in Clarksville
Sex and Age in Clarksville
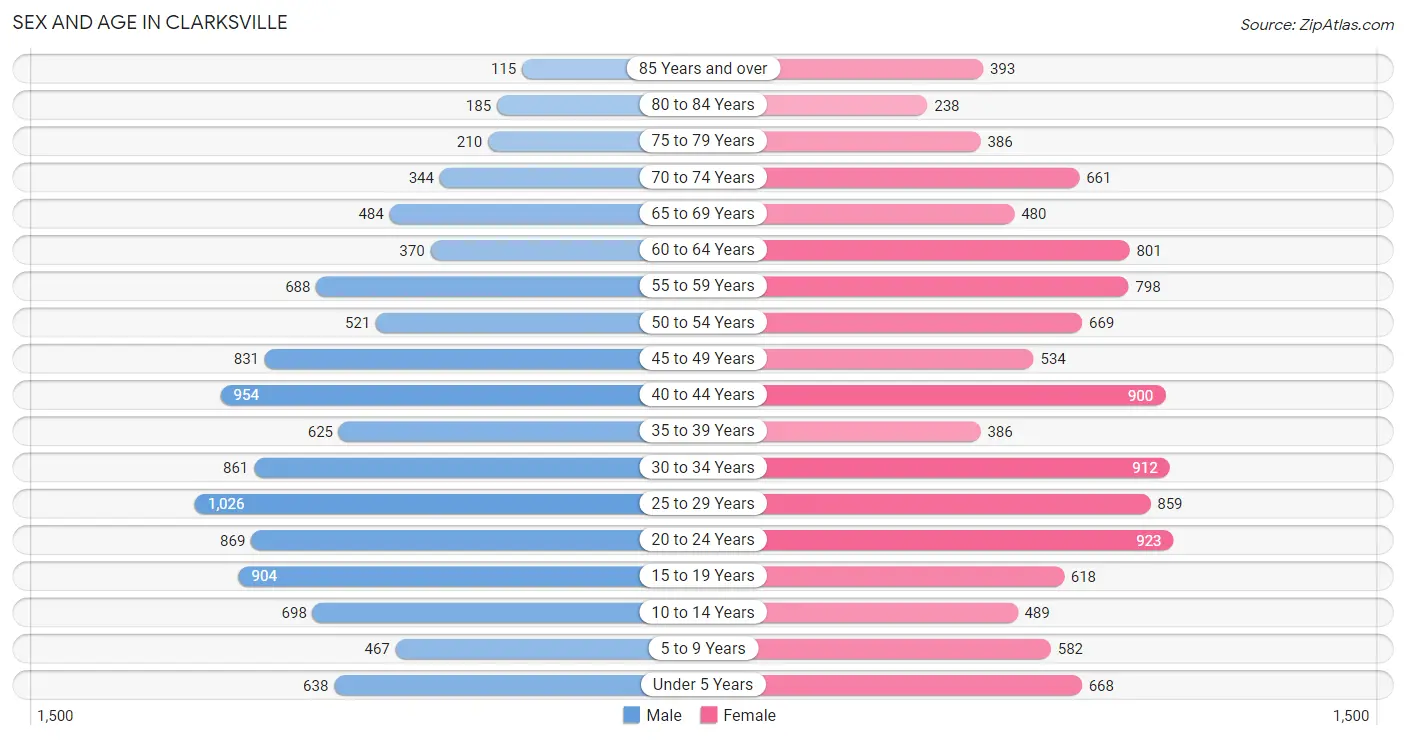
The most populous age groups in Clarksville are 25 to 29 Years (1,026 | 9.5%) for men and 20 to 24 Years (923 | 8.2%) for women.
| Age Bracket | Male | Female |
| Under 5 Years | 638 (5.9%) | 668 (5.9%) |
| 5 to 9 Years | 467 (4.3%) | 582 (5.1%) |
| 10 to 14 Years | 698 (6.5%) | 489 (4.3%) |
| 15 to 19 Years | 904 (8.4%) | 618 (5.5%) |
| 20 to 24 Years | 869 (8.1%) | 923 (8.2%) |
| 25 to 29 Years | 1,026 (9.5%) | 859 (7.6%) |
| 30 to 34 Years | 861 (8.0%) | 912 (8.1%) |
| 35 to 39 Years | 625 (5.8%) | 386 (3.4%) |
| 40 to 44 Years | 954 (8.8%) | 900 (8.0%) |
| 45 to 49 Years | 831 (7.7%) | 534 (4.7%) |
| 50 to 54 Years | 521 (4.8%) | 669 (5.9%) |
| 55 to 59 Years | 688 (6.4%) | 798 (7.1%) |
| 60 to 64 Years | 370 (3.4%) | 801 (7.1%) |
| 65 to 69 Years | 484 (4.5%) | 480 (4.3%) |
| 70 to 74 Years | 344 (3.2%) | 661 (5.9%) |
| 75 to 79 Years | 210 (1.9%) | 386 (3.4%) |
| 80 to 84 Years | 185 (1.7%) | 238 (2.1%) |
| 85 Years and over | 115 (1.1%) | 393 (3.5%) |
| Total | 10,790 (100.0%) | 11,297 (100.0%) |
Families and Households in Clarksville
Median Family Size in Clarksville
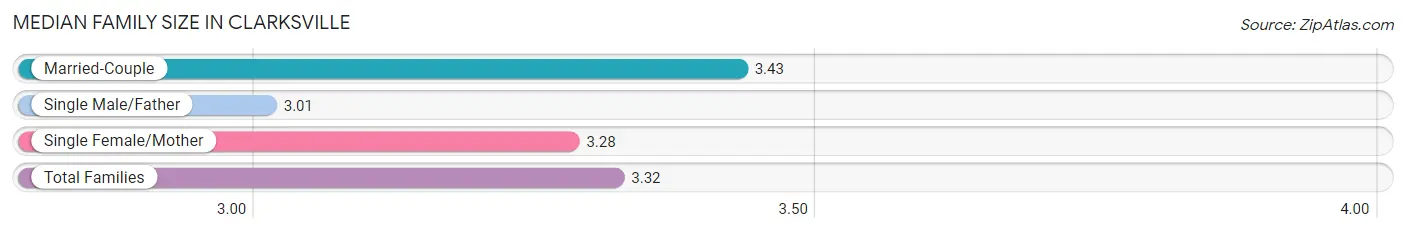
The median family size in Clarksville is 3.32 persons per family, with married-couple families (2,940 | 60.6%) accounting for the largest median family size of 3.43 persons per family. On the other hand, single male/father families (860 | 17.7%) represent the smallest median family size with 3.01 persons per family.
| Family Type | # Families | Family Size |
| Married-Couple | 2,940 (60.6%) | 3.43 |
| Single Male/Father | 860 (17.7%) | 3.01 |
| Single Female/Mother | 1,051 (21.7%) | 3.28 |
| Total Families | 4,851 (100.0%) | 3.32 |
Median Household Size in Clarksville
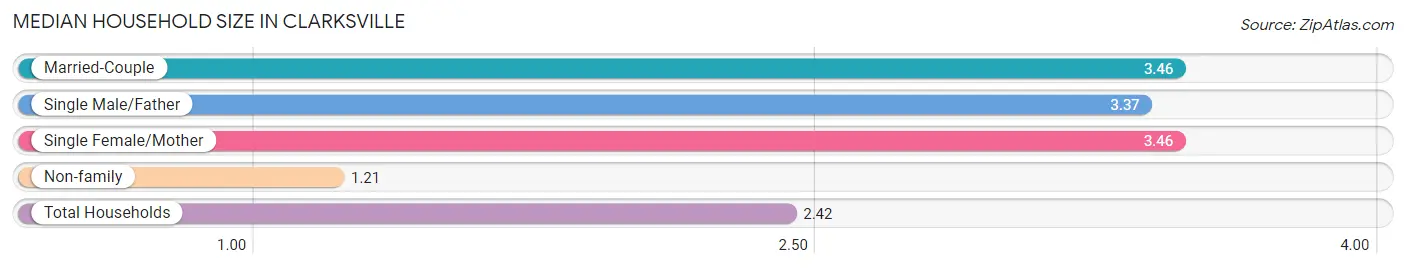
The median household size in Clarksville is 2.42 persons per household, with married-couple households (2,940 | 32.7%) accounting for the largest median household size of 3.46 persons per household. non-family households (4,130 | 46.0%) represent the smallest median household size with 1.21 persons per household.
| Household Type | # Households | Household Size |
| Married-Couple | 2,940 (32.7%) | 3.46 |
| Single Male/Father | 860 (9.6%) | 3.37 |
| Single Female/Mother | 1,051 (11.7%) | 3.46 |
| Non-family | 4,130 (46.0%) | 1.21 |
| Total Households | 8,981 (100.0%) | 2.42 |
Household Size by Marriage Status in Clarksville
Out of a total of 8,981 households in Clarksville, 4,851 (54.0%) are family households, while 4,130 (46.0%) are nonfamily households. The most numerous type of family households are 2-person households, comprising 1,824, and the most common type of nonfamily households are 1-person households, comprising 3,413.
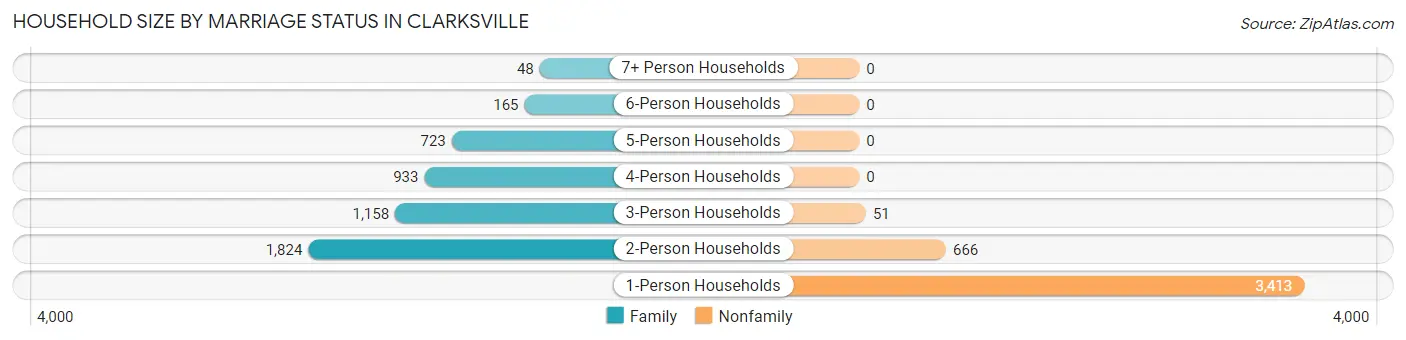
| Household Size | Family Households | Nonfamily Households |
| 1-Person Households | - | 3,413 (38.0%) |
| 2-Person Households | 1,824 (20.3%) | 666 (7.4%) |
| 3-Person Households | 1,158 (12.9%) | 51 (0.6%) |
| 4-Person Households | 933 (10.4%) | 0 (0.0%) |
| 5-Person Households | 723 (8.1%) | 0 (0.0%) |
| 6-Person Households | 165 (1.8%) | 0 (0.0%) |
| 7+ Person Households | 48 (0.5%) | 0 (0.0%) |
| Total | 4,851 (54.0%) | 4,130 (46.0%) |
Female Fertility in Clarksville
Fertility by Age in Clarksville
Average fertility rate in Clarksville is 63.0 births per 1,000 women. Women in the age bracket of 20 to 34 years have the highest fertility rate with 125.0 births per 1,000 women. Women in the age bracket of 20 to 34 years acount for 100.0% of all women with births.
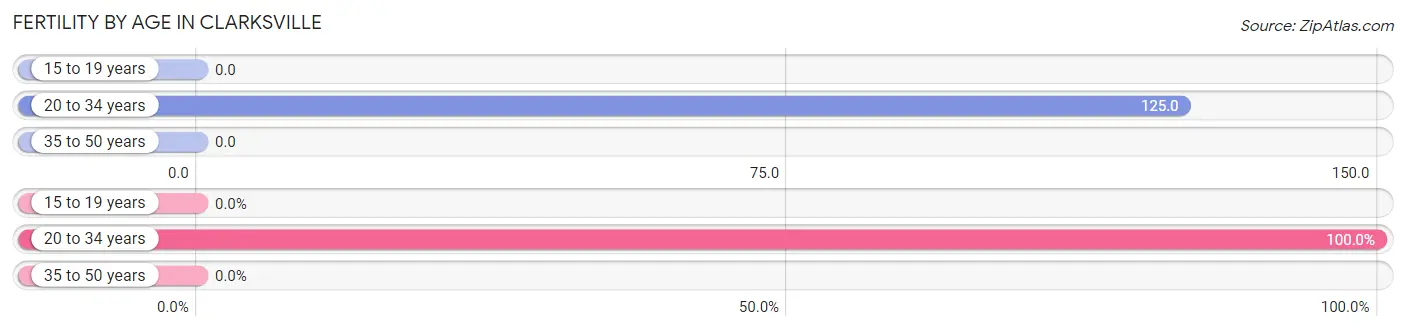
| Age Bracket | Women with Births | Births / 1,000 Women |
| 15 to 19 years | 0 (0.0%) | 0.0 |
| 20 to 34 years | 338 (100.0%) | 125.0 |
| 35 to 50 years | 0 (0.0%) | 0.0 |
| Total | 338 (100.0%) | 63.0 |
Fertility by Age by Marriage Status in Clarksville
21.0% of women with births (338) in Clarksville are married. The highest percentage of unmarried women with births falls into 20 to 34 years age bracket with 79.0% of them unmarried at the time of birth, while the lowest percentage of unmarried women with births belong to 20 to 34 years age bracket with 79.0% of them unmarried.
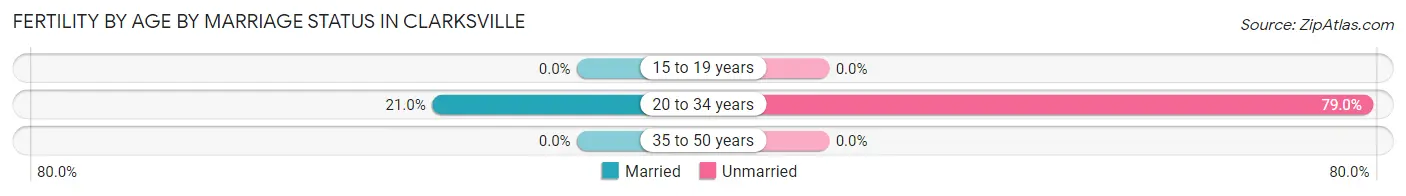
| Age Bracket | Married | Unmarried |
| 15 to 19 years | 0 (0.0%) | 0 (0.0%) |
| 20 to 34 years | 71 (21.0%) | 267 (79.0%) |
| 35 to 50 years | 0 (0.0%) | 0 (0.0%) |
| Total | 71 (21.0%) | 267 (79.0%) |
Fertility by Education in Clarksville
Average fertility rate in Clarksville is 63.0 births per 1,000 women. Women with the education attainment of high school diploma have the highest fertility rate of 138.0 births per 1,000 women, while women with the education attainment of less than high school have the lowest fertility at 17.0 births per 1,000 women. Women with the education attainment of high school diploma represent 68.0% of all women with births.
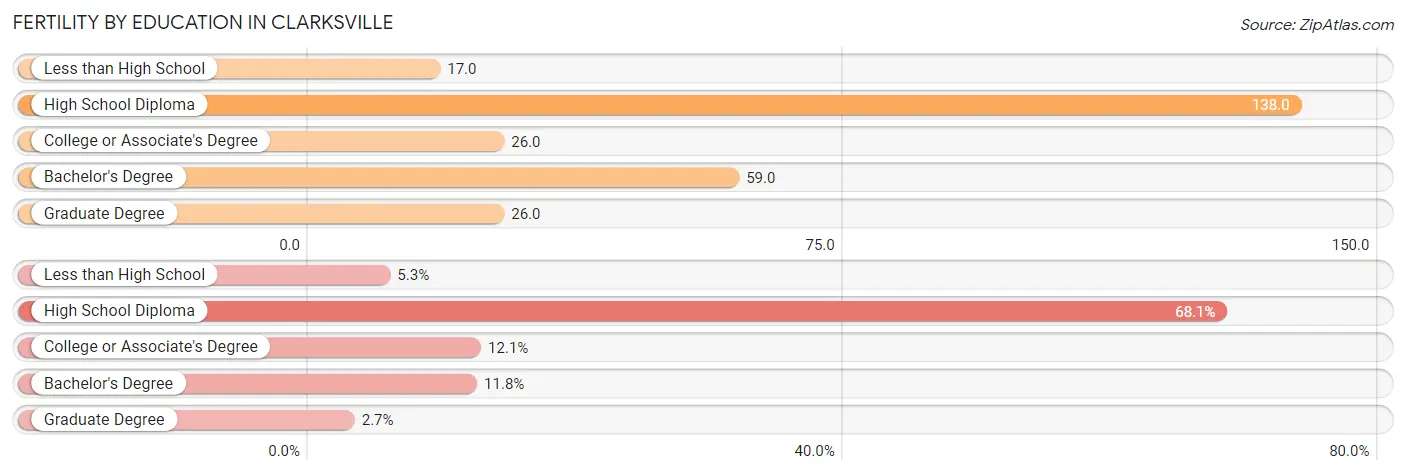
| Educational Attainment | Women with Births | Births / 1,000 Women |
| Less than High School | 18 (5.3%) | 17.0 |
| High School Diploma | 230 (68.0%) | 138.0 |
| College or Associate's Degree | 41 (12.1%) | 26.0 |
| Bachelor's Degree | 40 (11.8%) | 59.0 |
| Graduate Degree | 9 (2.7%) | 26.0 |
| Total | 338 (100.0%) | 63.0 |
Fertility by Education by Marriage Status in Clarksville
79.0% of women with births in Clarksville are unmarried. Women with the educational attainment of graduate degree are most likely to be married with 100.0% of them married at childbirth, while women with the educational attainment of less than high school are least likely to be married with 100.0% of them unmarried at childbirth.
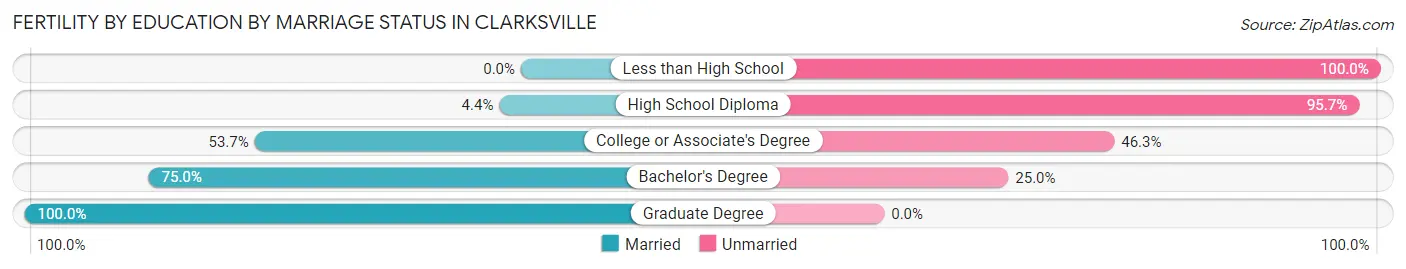
| Educational Attainment | Married | Unmarried |
| Less than High School | 0 (0.0%) | 18 (100.0%) |
| High School Diploma | 10 (4.3%) | 220 (95.7%) |
| College or Associate's Degree | 22 (53.7%) | 19 (46.3%) |
| Bachelor's Degree | 30 (75.0%) | 10 (25.0%) |
| Graduate Degree | 9 (100.0%) | 0 (0.0%) |
| Total | 71 (21.0%) | 267 (79.0%) |
Employment Characteristics in Clarksville
Employment by Class of Employer in Clarksville
Among the 11,241 employed individuals in Clarksville, private company employees (8,820 | 78.5%), not-for-profit organizations (767 | 6.8%), and federal government employees (608 | 5.4%) make up the most common classes of employment.
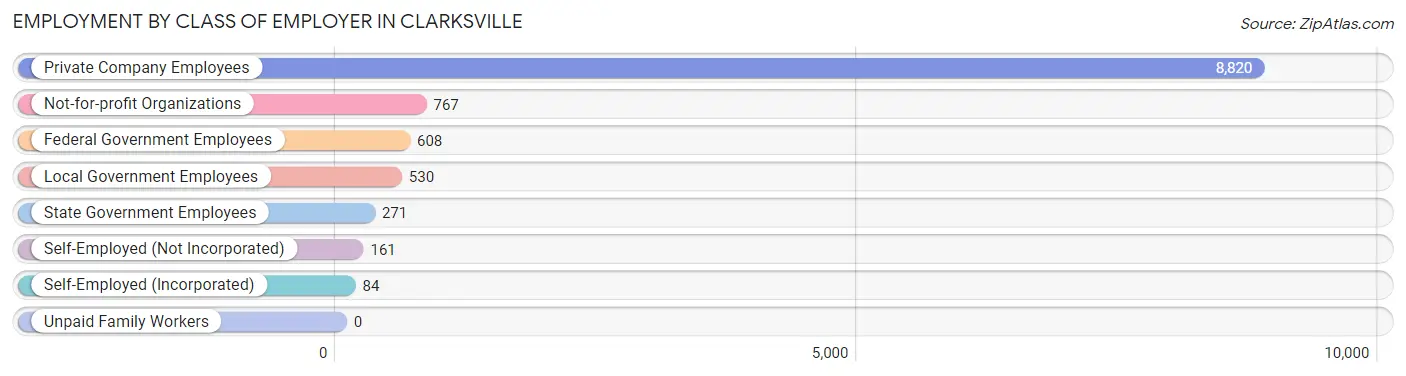
| Employer Class | # Employees | % Employees |
| Private Company Employees | 8,820 | 78.5% |
| Self-Employed (Incorporated) | 84 | 0.7% |
| Self-Employed (Not Incorporated) | 161 | 1.4% |
| Not-for-profit Organizations | 767 | 6.8% |
| Local Government Employees | 530 | 4.7% |
| State Government Employees | 271 | 2.4% |
| Federal Government Employees | 608 | 5.4% |
| Unpaid Family Workers | 0 | 0.0% |
| Total | 11,241 | 100.0% |
Employment Status by Age in Clarksville
According to the labor force statistics for Clarksville, out of the total population over 16 years of age (18,185), 66.0% or 12,002 individuals are in the labor force, with 4.4% or 528 of them unemployed. The age group with the highest labor force participation rate is 25 to 29 years, with 88.8% or 1,674 individuals in the labor force. Within the labor force, the 30 to 34 years age range has the highest percentage of unemployed individuals, with 8.8% or 126 of them being unemployed.
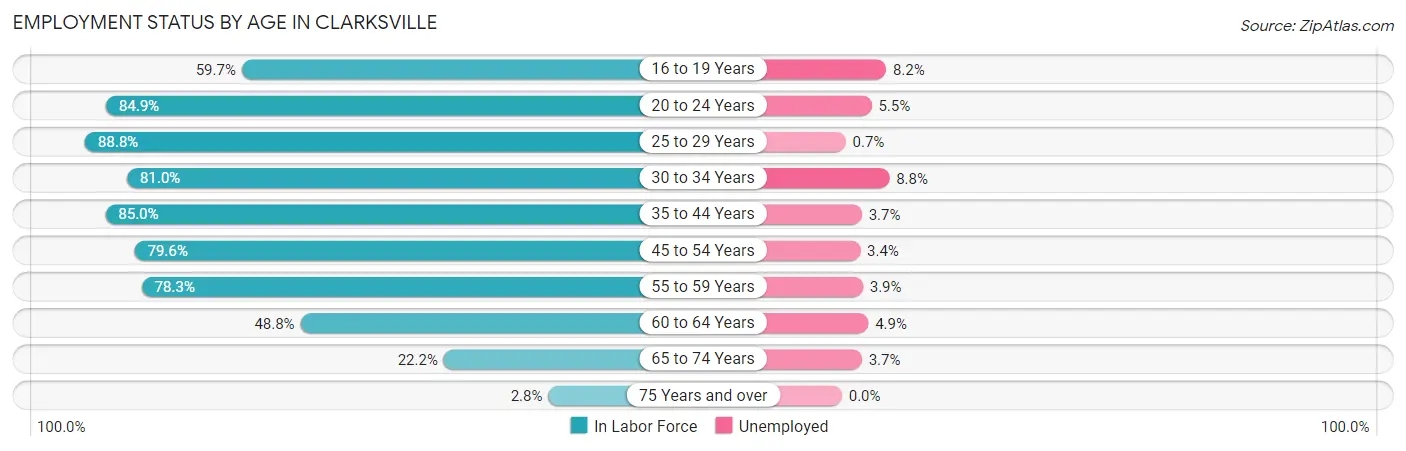
| Age Bracket | In Labor Force | Unemployed |
| 16 to 19 Years | 694 (59.7%) | 57 (8.2%) |
| 20 to 24 Years | 1,521 (84.9%) | 84 (5.5%) |
| 25 to 29 Years | 1,674 (88.8%) | 12 (0.7%) |
| 30 to 34 Years | 1,436 (81.0%) | 126 (8.8%) |
| 35 to 44 Years | 2,435 (85.0%) | 90 (3.7%) |
| 45 to 54 Years | 2,034 (79.6%) | 69 (3.4%) |
| 55 to 59 Years | 1,164 (78.3%) | 45 (3.9%) |
| 60 to 64 Years | 571 (48.8%) | 28 (4.9%) |
| 65 to 74 Years | 437 (22.2%) | 16 (3.7%) |
| 75 Years and over | 43 (2.8%) | 0 (0.0%) |
| Total | 12,002 (66.0%) | 528 (4.4%) |
Employment Status by Educational Attainment in Clarksville
According to labor force statistics for Clarksville, 79.4% of individuals (9,318) out of the total population between 25 and 64 years of age (11,735) are in the labor force, with 4.0% or 373 of them being unemployed. The group with the highest labor force participation rate are those with the educational attainment of bachelor's degree or higher, with 89.4% or 2,267 individuals in the labor force. Within the labor force, individuals with high school diploma education have the highest percentage of unemployment, with 8.4% or 228 of them being unemployed.
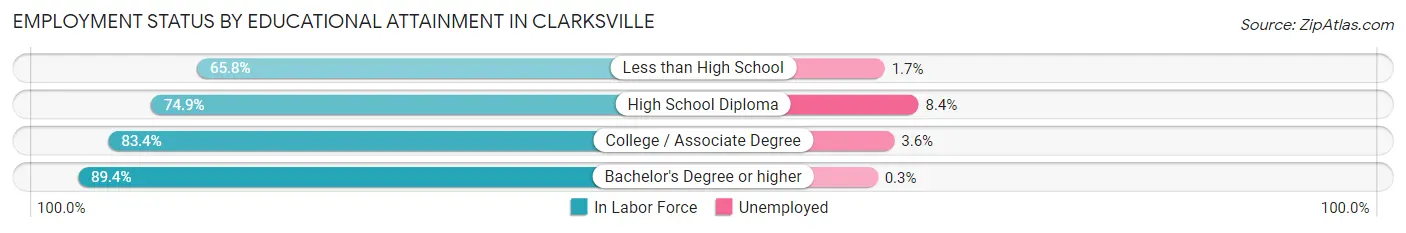
| Educational Attainment | In Labor Force | Unemployed |
| Less than High School | 1,192 (65.8%) | 31 (1.7%) |
| High School Diploma | 2,714 (74.9%) | 304 (8.4%) |
| College / Associate Degree | 3,139 (83.4%) | 136 (3.6%) |
| Bachelor's Degree or higher | 2,267 (89.4%) | 8 (0.3%) |
| Total | 9,318 (79.4%) | 469 (4.0%) |
Employment Occupations by Sex in Clarksville
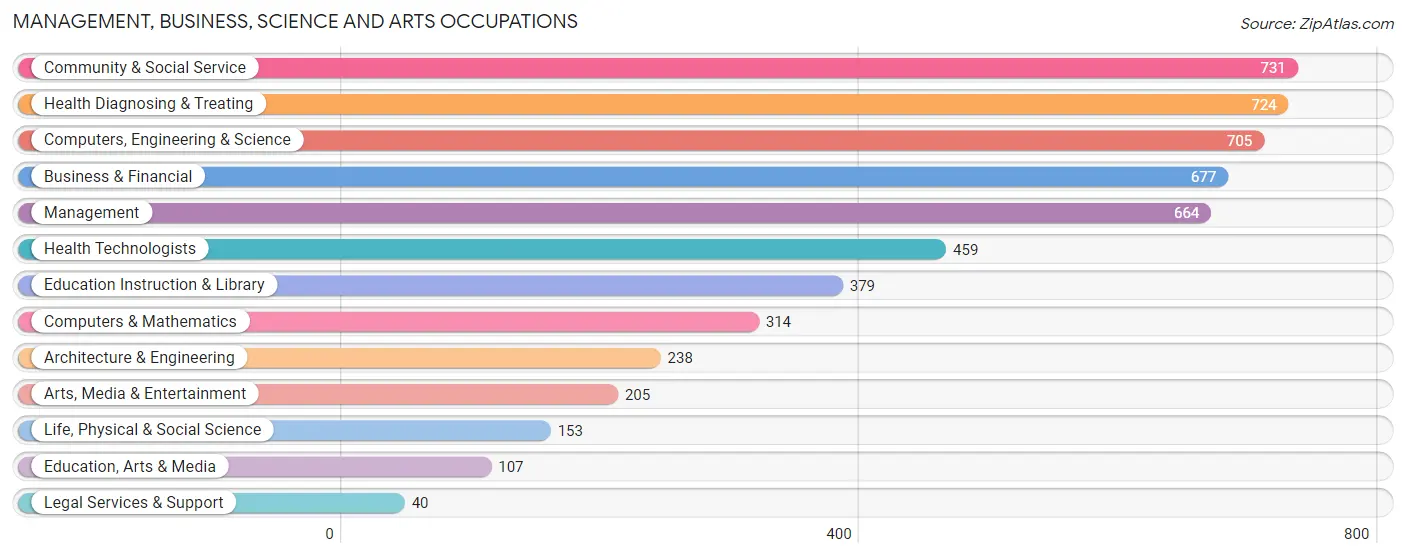
Management, Business, Science and Arts Occupations
The most common Management, Business, Science and Arts occupations in Clarksville are Community & Social Service (731 | 6.4%), Health Diagnosing & Treating (724 | 6.3%), Computers, Engineering & Science (705 | 6.1%), Business & Financial (677 | 5.9%), and Management (664 | 5.8%).
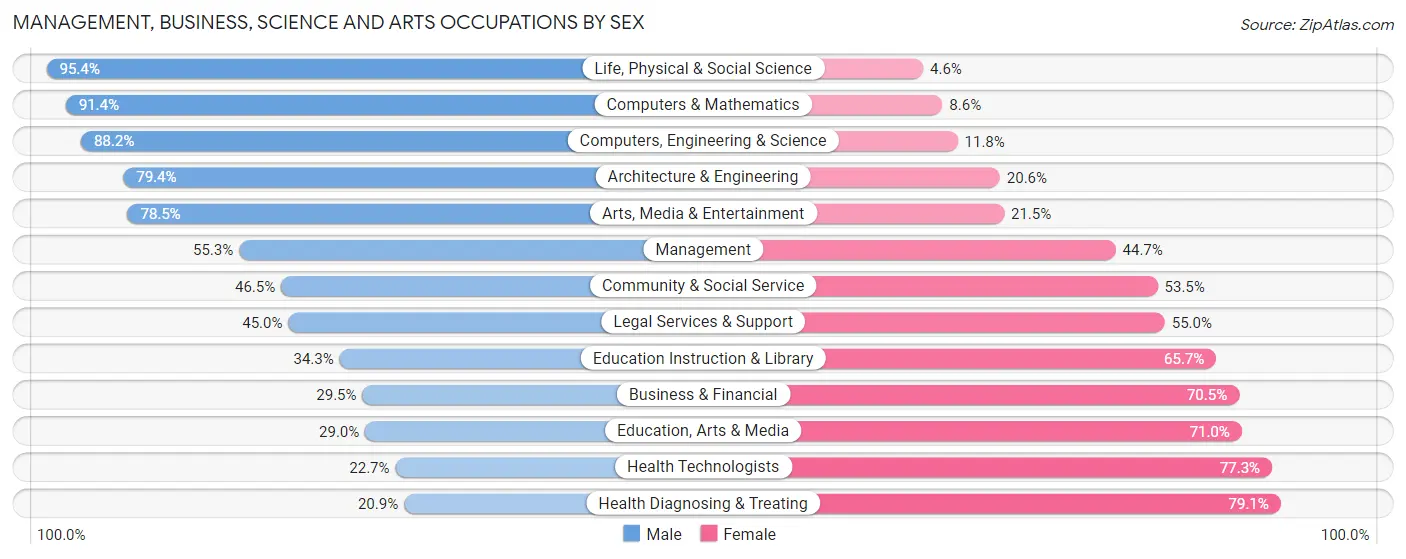
Management, Business, Science and Arts Occupations by Sex
Within the Management, Business, Science and Arts occupations in Clarksville, the most male-oriented occupations are Life, Physical & Social Science (95.4%), Computers & Mathematics (91.4%), and Computers, Engineering & Science (88.2%), while the most female-oriented occupations are Health Diagnosing & Treating (79.1%), Health Technologists (77.3%), and Education, Arts & Media (71.0%).
| Occupation | Male | Female |
| Management | 367 (55.3%) | 297 (44.7%) |
| Business & Financial | 200 (29.5%) | 477 (70.5%) |
| Computers, Engineering & Science | 622 (88.2%) | 83 (11.8%) |
| Computers & Mathematics | 287 (91.4%) | 27 (8.6%) |
| Architecture & Engineering | 189 (79.4%) | 49 (20.6%) |
| Life, Physical & Social Science | 146 (95.4%) | 7 (4.6%) |
| Community & Social Service | 340 (46.5%) | 391 (53.5%) |
| Education, Arts & Media | 31 (29.0%) | 76 (71.0%) |
| Legal Services & Support | 18 (45.0%) | 22 (55.0%) |
| Education Instruction & Library | 130 (34.3%) | 249 (65.7%) |
| Arts, Media & Entertainment | 161 (78.5%) | 44 (21.5%) |
| Health Diagnosing & Treating | 151 (20.9%) | 573 (79.1%) |
| Health Technologists | 104 (22.7%) | 355 (77.3%) |
| Total (Category) | 1,680 (48.0%) | 1,821 (52.0%) |
| Total (Overall) | 6,152 (53.6%) | 5,332 (46.4%) |
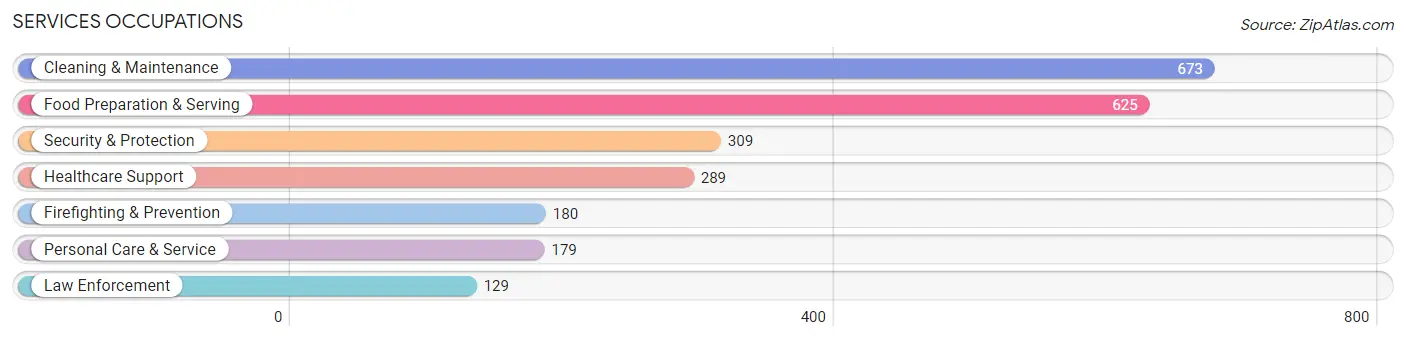
Services Occupations
The most common Services occupations in Clarksville are Cleaning & Maintenance (673 | 5.9%), Food Preparation & Serving (625 | 5.4%), Security & Protection (309 | 2.7%), Healthcare Support (289 | 2.5%), and Firefighting & Prevention (180 | 1.6%).
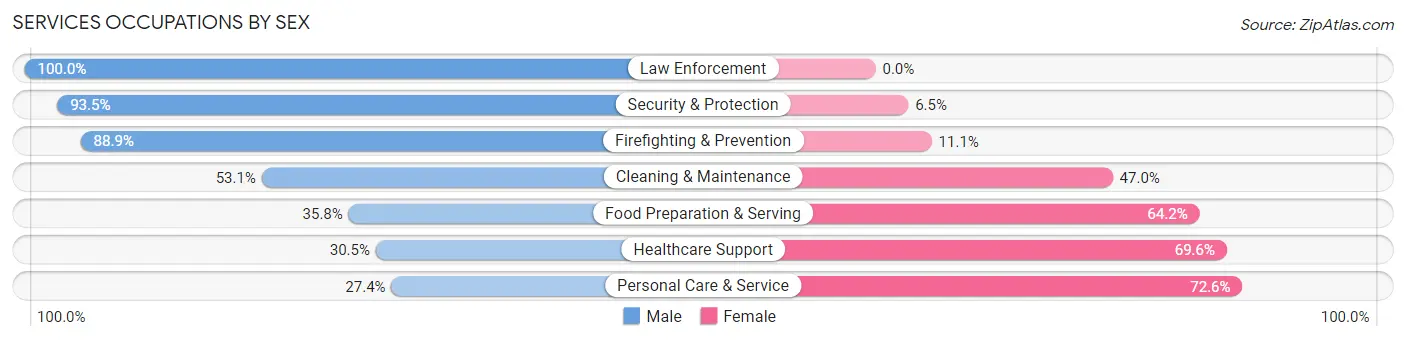
Services Occupations by Sex
Within the Services occupations in Clarksville, the most male-oriented occupations are Law Enforcement (100.0%), Security & Protection (93.5%), and Firefighting & Prevention (88.9%), while the most female-oriented occupations are Personal Care & Service (72.6%), Healthcare Support (69.6%), and Food Preparation & Serving (64.2%).
| Occupation | Male | Female |
| Healthcare Support | 88 (30.4%) | 201 (69.6%) |
| Security & Protection | 289 (93.5%) | 20 (6.5%) |
| Firefighting & Prevention | 160 (88.9%) | 20 (11.1%) |
| Law Enforcement | 129 (100.0%) | 0 (0.0%) |
| Food Preparation & Serving | 224 (35.8%) | 401 (64.2%) |
| Cleaning & Maintenance | 357 (53.0%) | 316 (46.9%) |
| Personal Care & Service | 49 (27.4%) | 130 (72.6%) |
| Total (Category) | 1,007 (48.5%) | 1,068 (51.5%) |
| Total (Overall) | 6,152 (53.6%) | 5,332 (46.4%) |
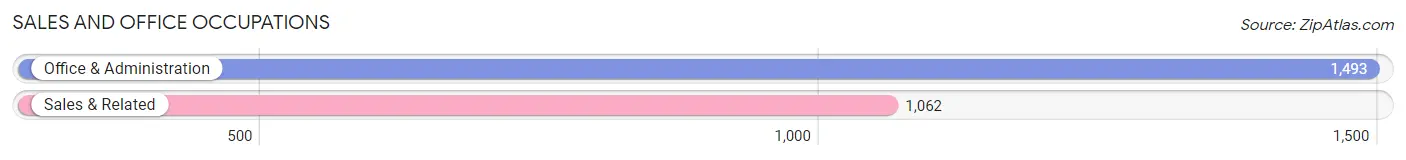
Sales and Office Occupations
The most common Sales and Office occupations in Clarksville are Office & Administration (1,493 | 13.0%), and Sales & Related (1,062 | 9.2%).
Sales and Office Occupations by Sex
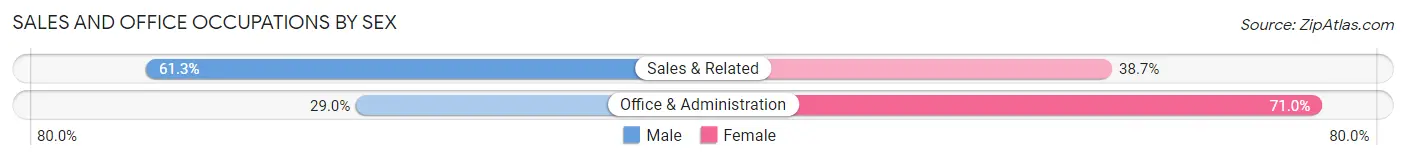
| Occupation | Male | Female |
| Sales & Related | 651 (61.3%) | 411 (38.7%) |
| Office & Administration | 433 (29.0%) | 1,060 (71.0%) |
| Total (Category) | 1,084 (42.4%) | 1,471 (57.6%) |
| Total (Overall) | 6,152 (53.6%) | 5,332 (46.4%) |
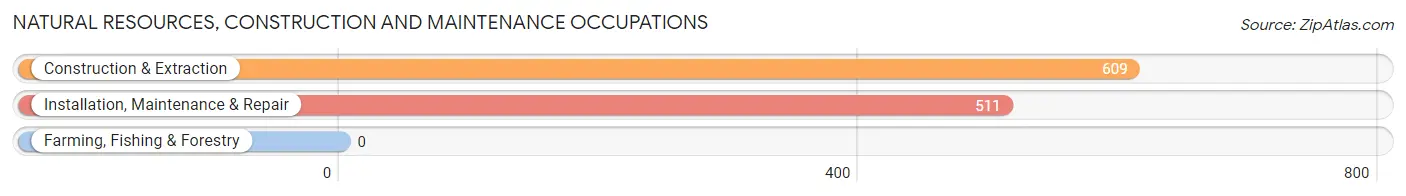
Natural Resources, Construction and Maintenance Occupations
The most common Natural Resources, Construction and Maintenance occupations in Clarksville are Construction & Extraction (609 | 5.3%), and Installation, Maintenance & Repair (511 | 4.4%).
Natural Resources, Construction and Maintenance Occupations by Sex
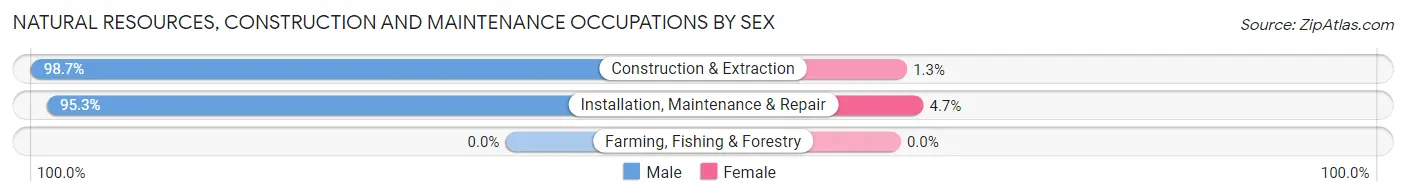
| Occupation | Male | Female |
| Farming, Fishing & Forestry | 0 (0.0%) | 0 (0.0%) |
| Construction & Extraction | 601 (98.7%) | 8 (1.3%) |
| Installation, Maintenance & Repair | 487 (95.3%) | 24 (4.7%) |
| Total (Category) | 1,088 (97.1%) | 32 (2.9%) |
| Total (Overall) | 6,152 (53.6%) | 5,332 (46.4%) |
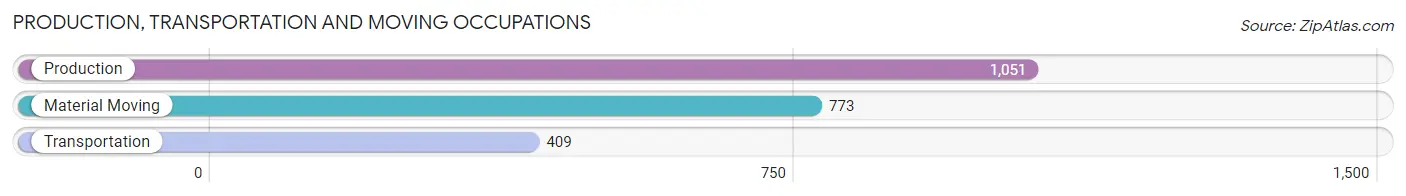
Production, Transportation and Moving Occupations
The most common Production, Transportation and Moving occupations in Clarksville are Production (1,051 | 9.1%), Material Moving (773 | 6.7%), and Transportation (409 | 3.6%).
Production, Transportation and Moving Occupations by Sex
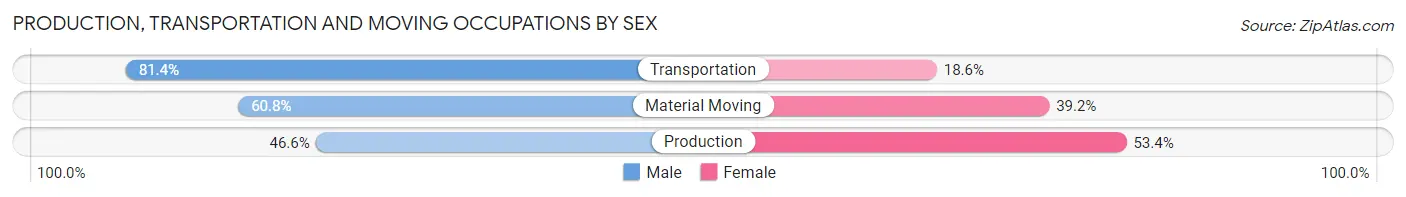
| Occupation | Male | Female |
| Production | 490 (46.6%) | 561 (53.4%) |
| Transportation | 333 (81.4%) | 76 (18.6%) |
| Material Moving | 470 (60.8%) | 303 (39.2%) |
| Total (Category) | 1,293 (57.9%) | 940 (42.1%) |
| Total (Overall) | 6,152 (53.6%) | 5,332 (46.4%) |
Employment Industries by Sex in Clarksville
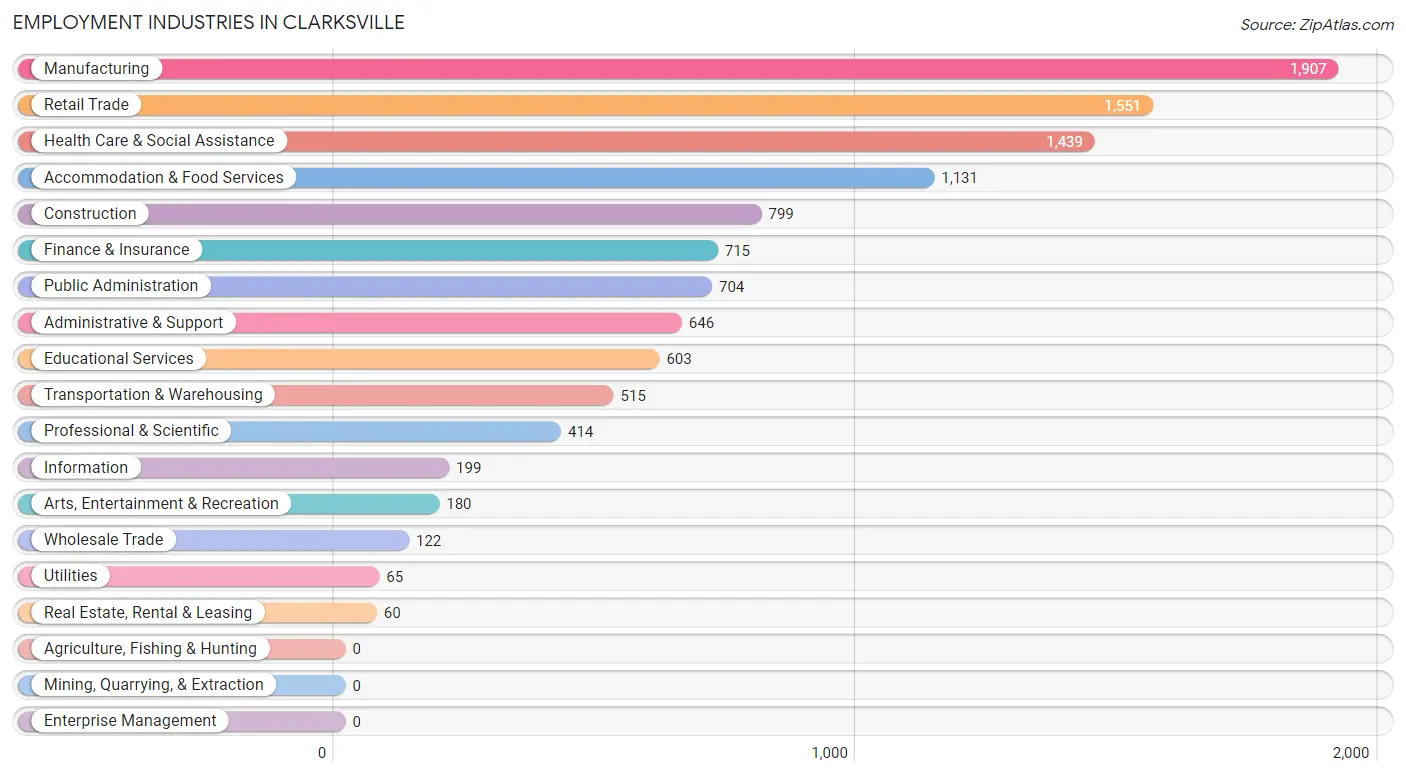
Employment Industries in Clarksville
The major employment industries in Clarksville include Manufacturing (1,907 | 16.6%), Retail Trade (1,551 | 13.5%), Health Care & Social Assistance (1,439 | 12.5%), Accommodation & Food Services (1,131 | 9.9%), and Construction (799 | 7.0%).
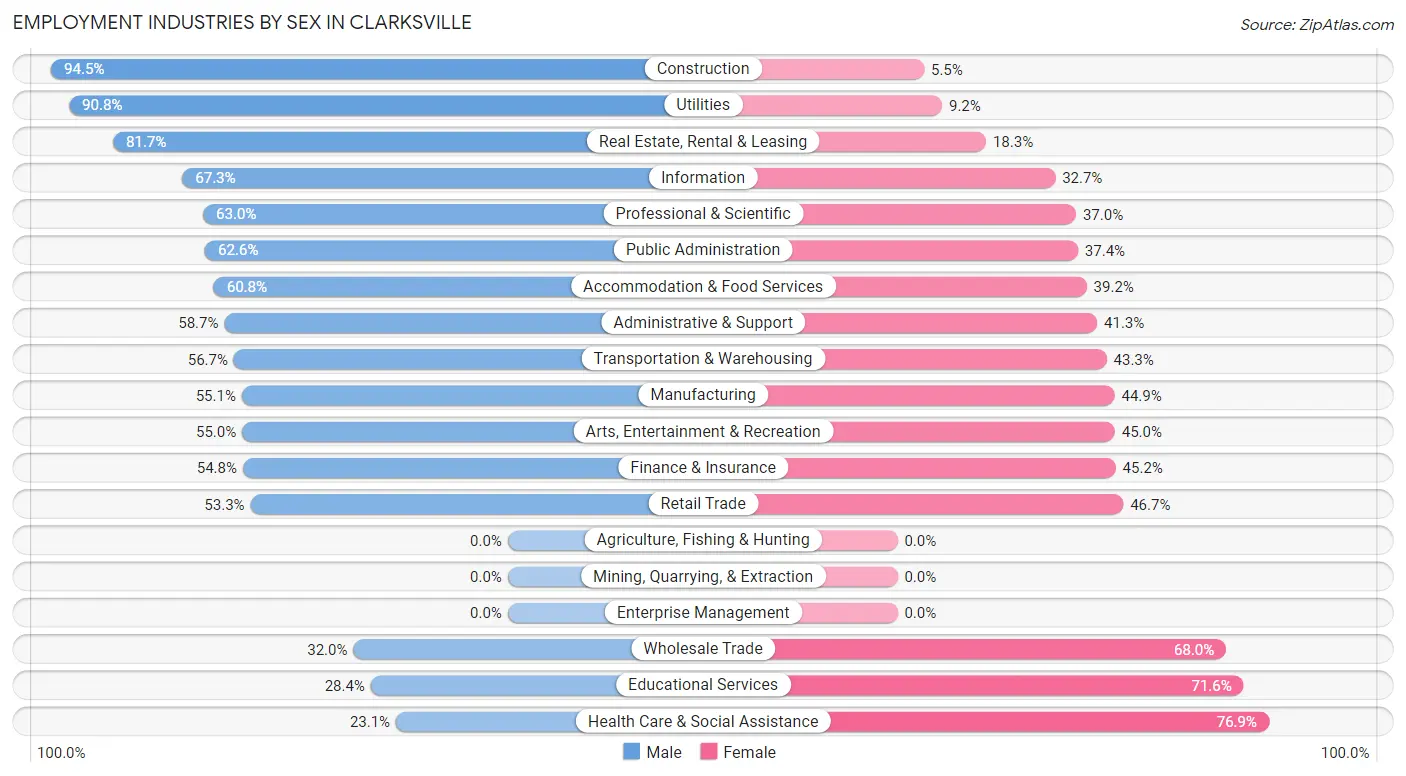
Employment Industries by Sex in Clarksville
The Clarksville industries that see more men than women are Construction (94.5%), Utilities (90.8%), and Real Estate, Rental & Leasing (81.7%), whereas the industries that tend to have a higher number of women are Health Care & Social Assistance (76.9%), Educational Services (71.6%), and Wholesale Trade (68.0%).
| Industry | Male | Female |
| Agriculture, Fishing & Hunting | 0 (0.0%) | 0 (0.0%) |
| Mining, Quarrying, & Extraction | 0 (0.0%) | 0 (0.0%) |
| Construction | 755 (94.5%) | 44 (5.5%) |
| Manufacturing | 1,050 (55.1%) | 857 (44.9%) |
| Wholesale Trade | 39 (32.0%) | 83 (68.0%) |
| Retail Trade | 826 (53.3%) | 725 (46.7%) |
| Transportation & Warehousing | 292 (56.7%) | 223 (43.3%) |
| Utilities | 59 (90.8%) | 6 (9.2%) |
| Information | 134 (67.3%) | 65 (32.7%) |
| Finance & Insurance | 392 (54.8%) | 323 (45.2%) |
| Real Estate, Rental & Leasing | 49 (81.7%) | 11 (18.3%) |
| Professional & Scientific | 261 (63.0%) | 153 (37.0%) |
| Enterprise Management | 0 (0.0%) | 0 (0.0%) |
| Administrative & Support | 379 (58.7%) | 267 (41.3%) |
| Educational Services | 171 (28.4%) | 432 (71.6%) |
| Health Care & Social Assistance | 333 (23.1%) | 1,106 (76.9%) |
| Arts, Entertainment & Recreation | 99 (55.0%) | 81 (45.0%) |
| Accommodation & Food Services | 688 (60.8%) | 443 (39.2%) |
| Public Administration | 441 (62.6%) | 263 (37.4%) |
| Total | 6,152 (53.6%) | 5,332 (46.4%) |
Education in Clarksville
School Enrollment in Clarksville
The most common levels of schooling among the 4,540 students in Clarksville are high school (1,232 | 27.1%), middle school (1,028 | 22.6%), and college / undergraduate (1,015 | 22.4%).
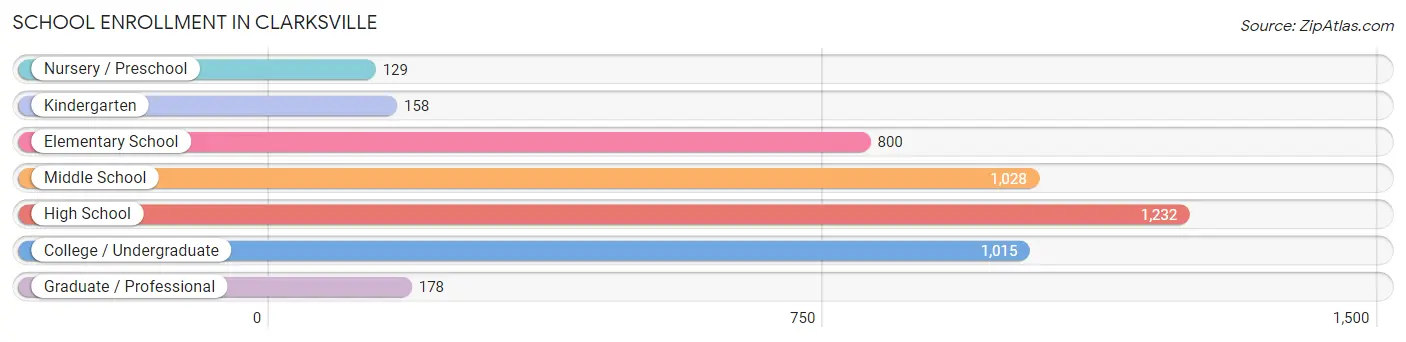
| School Level | # Students | % Students |
| Nursery / Preschool | 129 | 2.8% |
| Kindergarten | 158 | 3.5% |
| Elementary School | 800 | 17.6% |
| Middle School | 1,028 | 22.6% |
| High School | 1,232 | 27.1% |
| College / Undergraduate | 1,015 | 22.4% |
| Graduate / Professional | 178 | 3.9% |
| Total | 4,540 | 100.0% |
School Enrollment by Age by Funding Source in Clarksville
Out of a total of 4,540 students who are enrolled in schools in Clarksville, 690 (15.2%) attend a private institution, while the remaining 3,850 (84.8%) are enrolled in public schools. The age group of 18 to 19 year olds has the highest likelihood of being enrolled in private schools, with 210 (54.7% in the age bracket) enrolled. Conversely, the age group of 20 to 24 year olds has the lowest likelihood of being enrolled in a private school, with 289 (93.8% in the age bracket) attending a public institution.
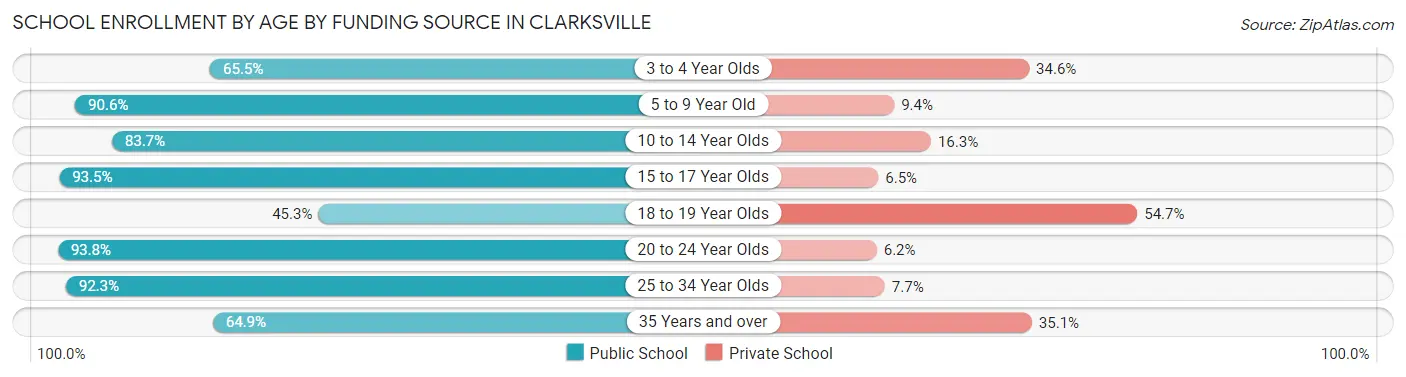
| Age Bracket | Public School | Private School |
| 3 to 4 Year Olds | 36 (65.4%) | 19 (34.5%) |
| 5 to 9 Year Old | 875 (90.6%) | 91 (9.4%) |
| 10 to 14 Year Olds | 994 (83.7%) | 193 (16.3%) |
| 15 to 17 Year Olds | 927 (93.5%) | 64 (6.5%) |
| 18 to 19 Year Olds | 174 (45.3%) | 210 (54.7%) |
| 20 to 24 Year Olds | 289 (93.8%) | 19 (6.2%) |
| 25 to 34 Year Olds | 457 (92.3%) | 38 (7.7%) |
| 35 Years and over | 100 (64.9%) | 54 (35.1%) |
| Total | 3,850 (84.8%) | 690 (15.2%) |
Educational Attainment by Field of Study in Clarksville
Business (739 | 22.0%), education (538 | 16.0%), science & technology (300 | 8.9%), computers & mathematics (242 | 7.2%), and communications (222 | 6.6%) are the most common fields of study among 3,357 individuals in Clarksville who have obtained a bachelor's degree or higher.
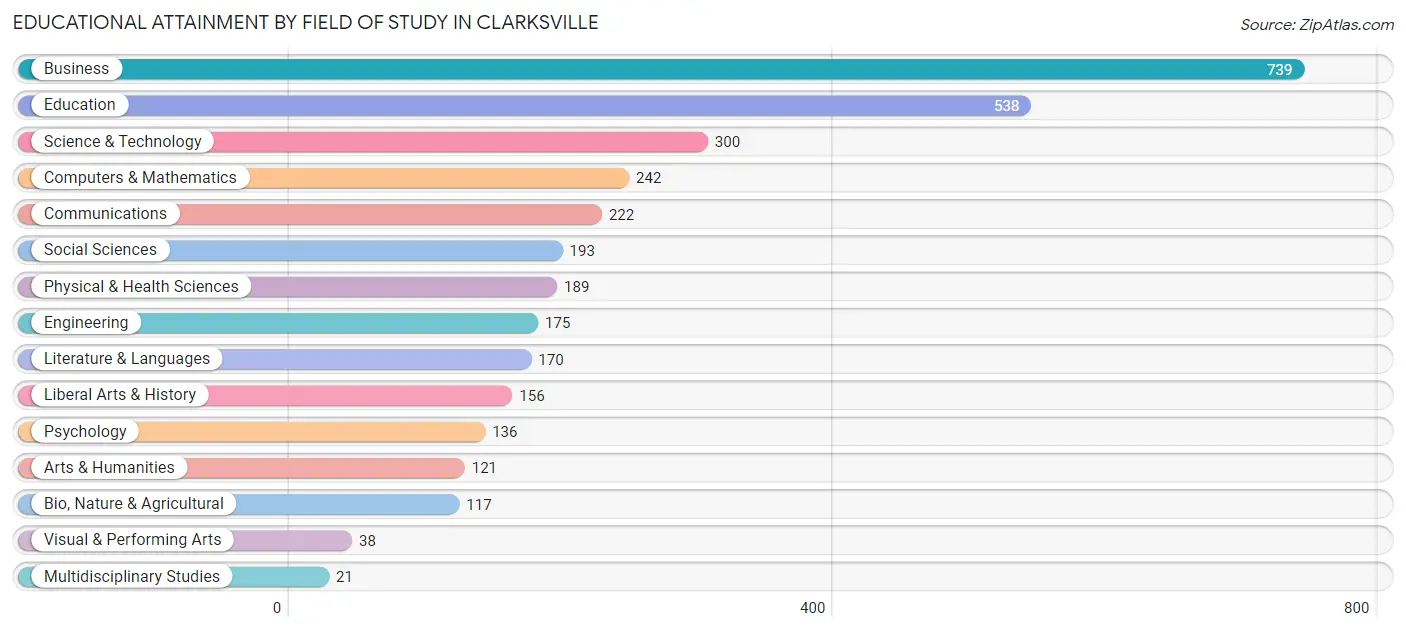
| Field of Study | # Graduates | % Graduates |
| Computers & Mathematics | 242 | 7.2% |
| Bio, Nature & Agricultural | 117 | 3.5% |
| Physical & Health Sciences | 189 | 5.6% |
| Psychology | 136 | 4.1% |
| Social Sciences | 193 | 5.8% |
| Engineering | 175 | 5.2% |
| Multidisciplinary Studies | 21 | 0.6% |
| Science & Technology | 300 | 8.9% |
| Business | 739 | 22.0% |
| Education | 538 | 16.0% |
| Literature & Languages | 170 | 5.1% |
| Liberal Arts & History | 156 | 4.6% |
| Visual & Performing Arts | 38 | 1.1% |
| Communications | 222 | 6.6% |
| Arts & Humanities | 121 | 3.6% |
| Total | 3,357 | 100.0% |
Transportation & Commute in Clarksville
Vehicle Availability by Sex in Clarksville
The most prevalent vehicle ownership categories in Clarksville are males with 2 vehicles (2,369, accounting for 39.2%) and females with 2 vehicles (2,018, making up 45.7%).
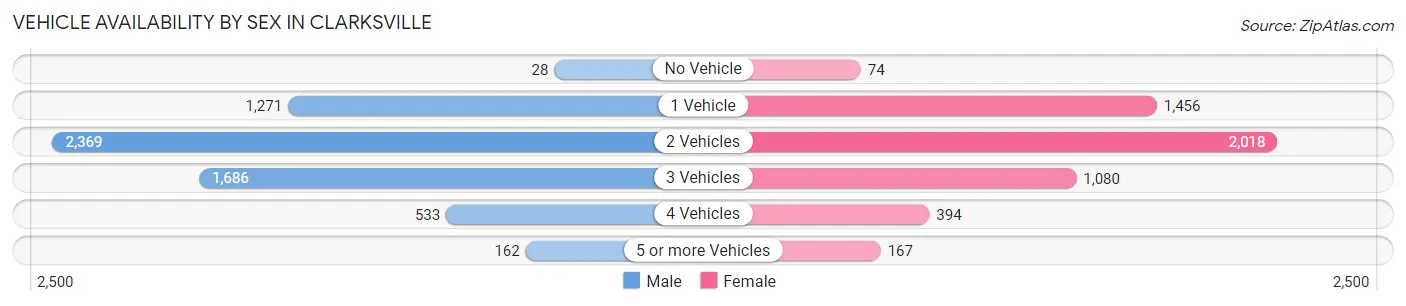
| Vehicles Available | Male | Female |
| No Vehicle | 28 (0.5%) | 74 (1.4%) |
| 1 Vehicle | 1,271 (21.0%) | 1,456 (28.1%) |
| 2 Vehicles | 2,369 (39.2%) | 2,018 (38.9%) |
| 3 Vehicles | 1,686 (27.9%) | 1,080 (20.8%) |
| 4 Vehicles | 533 (8.8%) | 394 (7.6%) |
| 5 or more Vehicles | 162 (2.7%) | 167 (3.2%) |
| Total | 6,049 (100.0%) | 5,189 (100.0%) |
Commute Time in Clarksville
The most frequently occuring commute durations in Clarksville are 15 to 19 minutes (2,530 commuters, 24.4%), 20 to 24 minutes (2,101 commuters, 20.3%), and 10 to 14 minutes (1,716 commuters, 16.5%).
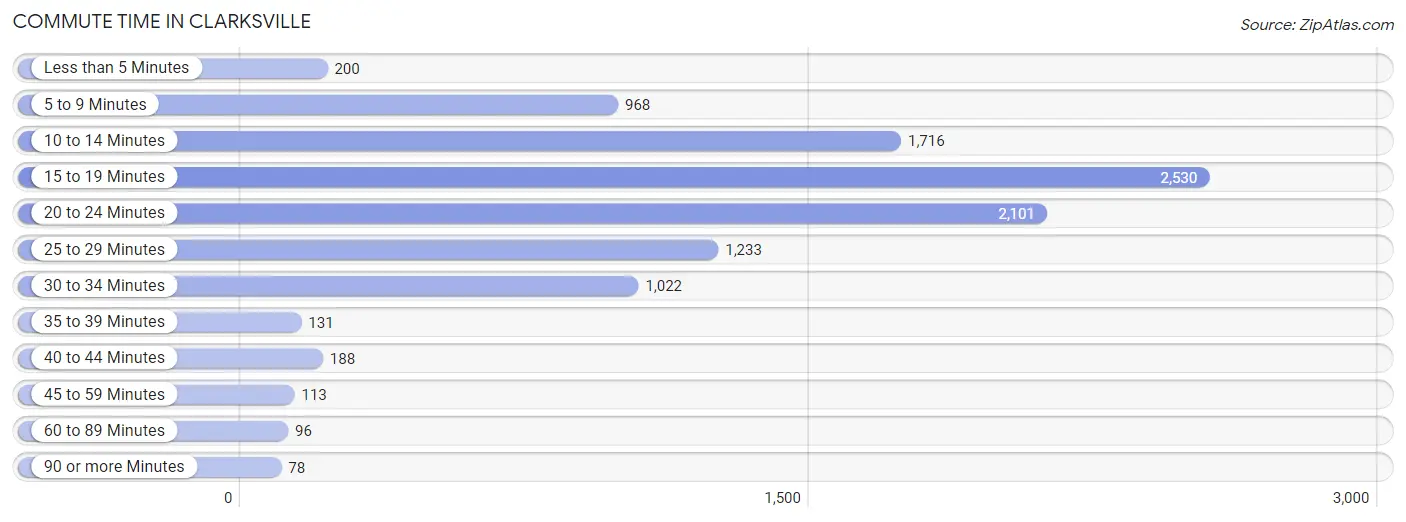
| Commute Time | # Commuters | % Commuters |
| Less than 5 Minutes | 200 | 1.9% |
| 5 to 9 Minutes | 968 | 9.3% |
| 10 to 14 Minutes | 1,716 | 16.5% |
| 15 to 19 Minutes | 2,530 | 24.4% |
| 20 to 24 Minutes | 2,101 | 20.3% |
| 25 to 29 Minutes | 1,233 | 11.9% |
| 30 to 34 Minutes | 1,022 | 9.9% |
| 35 to 39 Minutes | 131 | 1.3% |
| 40 to 44 Minutes | 188 | 1.8% |
| 45 to 59 Minutes | 113 | 1.1% |
| 60 to 89 Minutes | 96 | 0.9% |
| 90 or more Minutes | 78 | 0.7% |
Commute Time by Sex in Clarksville
The most common commute times in Clarksville are 20 to 24 minutes (1,331 commuters, 23.1%) for males and 15 to 19 minutes (1,340 commuters, 29.1%) for females.
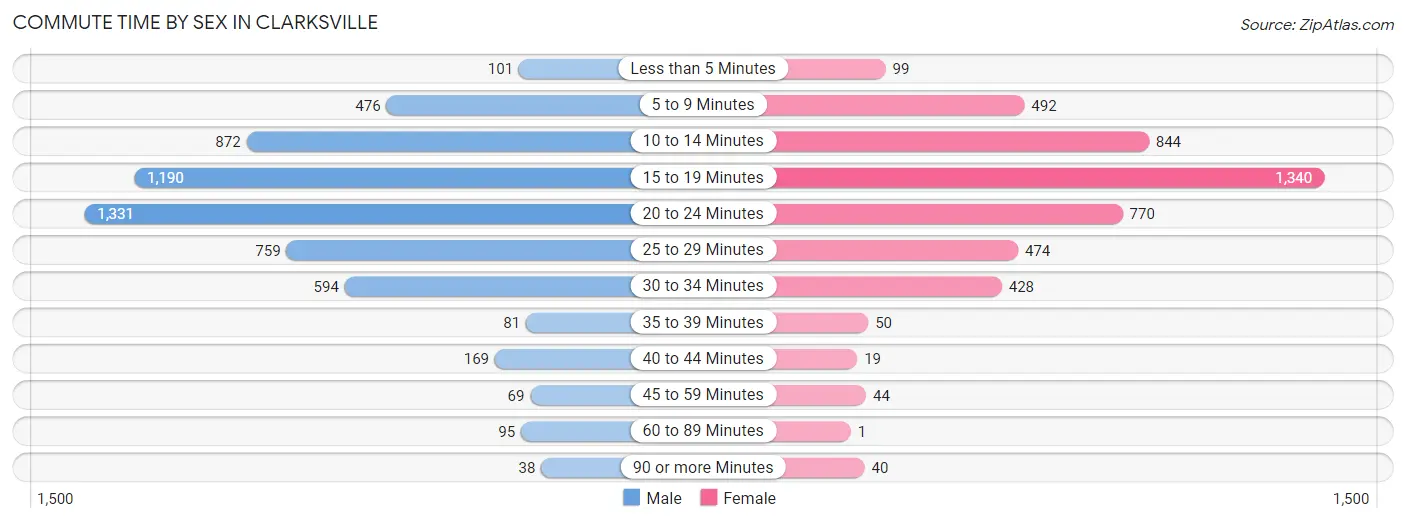
| Commute Time | Male | Female |
| Less than 5 Minutes | 101 (1.8%) | 99 (2.1%) |
| 5 to 9 Minutes | 476 (8.2%) | 492 (10.7%) |
| 10 to 14 Minutes | 872 (15.1%) | 844 (18.3%) |
| 15 to 19 Minutes | 1,190 (20.6%) | 1,340 (29.1%) |
| 20 to 24 Minutes | 1,331 (23.1%) | 770 (16.7%) |
| 25 to 29 Minutes | 759 (13.1%) | 474 (10.3%) |
| 30 to 34 Minutes | 594 (10.3%) | 428 (9.3%) |
| 35 to 39 Minutes | 81 (1.4%) | 50 (1.1%) |
| 40 to 44 Minutes | 169 (2.9%) | 19 (0.4%) |
| 45 to 59 Minutes | 69 (1.2%) | 44 (1.0%) |
| 60 to 89 Minutes | 95 (1.7%) | 1 (0.0%) |
| 90 or more Minutes | 38 (0.7%) | 40 (0.9%) |
Time of Departure to Work by Sex in Clarksville
The most frequent times of departure to work in Clarksville are 4:00 PM to 11:59 PM (930, 16.1%) for males and 7:30 AM to 7:59 AM (698, 15.2%) for females.
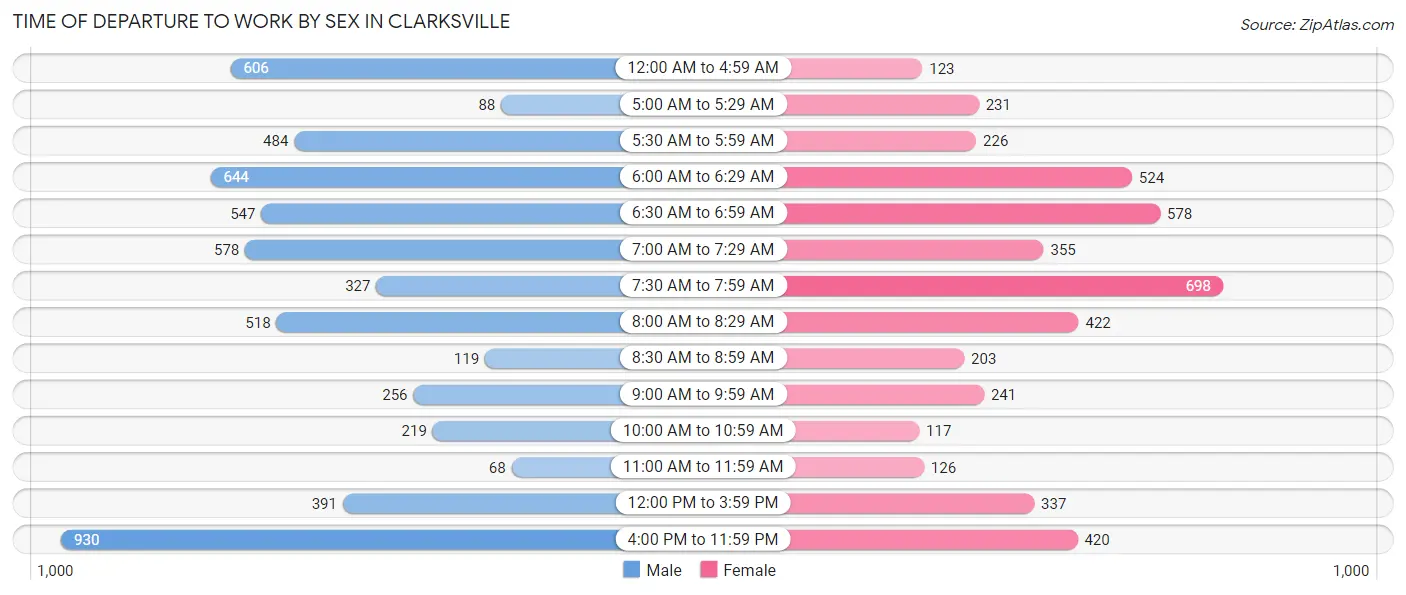
| Time of Departure | Male | Female |
| 12:00 AM to 4:59 AM | 606 (10.5%) | 123 (2.7%) |
| 5:00 AM to 5:29 AM | 88 (1.5%) | 231 (5.0%) |
| 5:30 AM to 5:59 AM | 484 (8.4%) | 226 (4.9%) |
| 6:00 AM to 6:29 AM | 644 (11.2%) | 524 (11.4%) |
| 6:30 AM to 6:59 AM | 547 (9.5%) | 578 (12.6%) |
| 7:00 AM to 7:29 AM | 578 (10.0%) | 355 (7.7%) |
| 7:30 AM to 7:59 AM | 327 (5.7%) | 698 (15.2%) |
| 8:00 AM to 8:29 AM | 518 (9.0%) | 422 (9.2%) |
| 8:30 AM to 8:59 AM | 119 (2.1%) | 203 (4.4%) |
| 9:00 AM to 9:59 AM | 256 (4.4%) | 241 (5.2%) |
| 10:00 AM to 10:59 AM | 219 (3.8%) | 117 (2.5%) |
| 11:00 AM to 11:59 AM | 68 (1.2%) | 126 (2.7%) |
| 12:00 PM to 3:59 PM | 391 (6.8%) | 337 (7.3%) |
| 4:00 PM to 11:59 PM | 930 (16.1%) | 420 (9.1%) |
| Total | 5,775 (100.0%) | 4,601 (100.0%) |
Housing Occupancy in Clarksville
Occupancy by Ownership in Clarksville
Of the total 8,981 dwellings in Clarksville, owner-occupied units account for 5,374 (59.8%), while renter-occupied units make up 3,607 (40.2%).
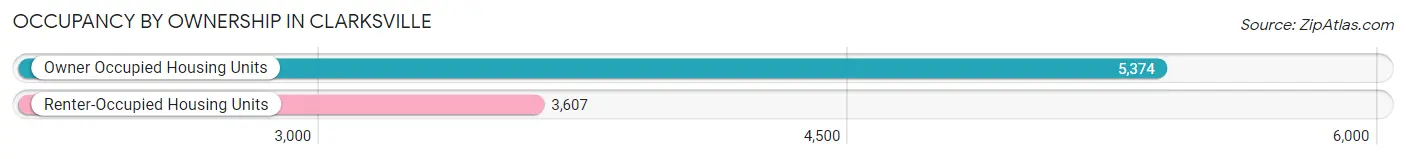
| Occupancy | # Housing Units | % Housing Units |
| Owner Occupied Housing Units | 5,374 | 59.8% |
| Renter-Occupied Housing Units | 3,607 | 40.2% |
| Total Occupied Housing Units | 8,981 | 100.0% |
Occupancy by Household Size in Clarksville
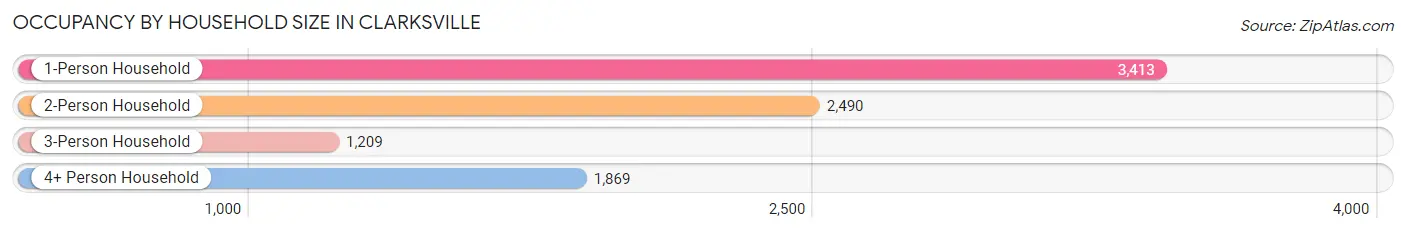
| Household Size | # Housing Units | % Housing Units |
| 1-Person Household | 3,413 | 38.0% |
| 2-Person Household | 2,490 | 27.7% |
| 3-Person Household | 1,209 | 13.5% |
| 4+ Person Household | 1,869 | 20.8% |
| Total Housing Units | 8,981 | 100.0% |
Occupancy by Ownership by Household Size in Clarksville
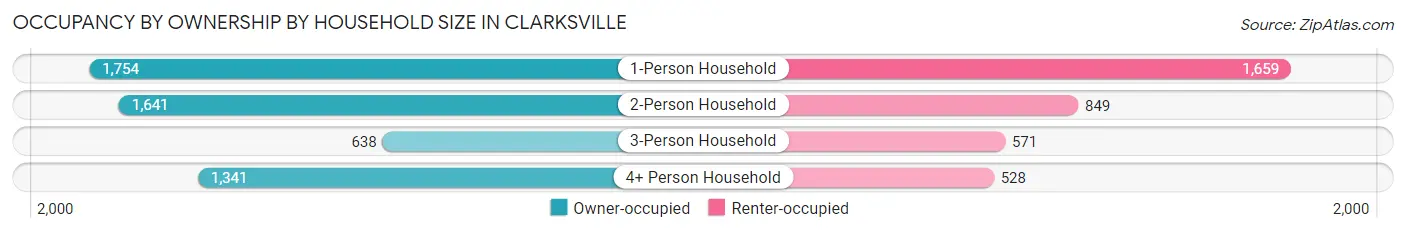
| Household Size | Owner-occupied | Renter-occupied |
| 1-Person Household | 1,754 (51.4%) | 1,659 (48.6%) |
| 2-Person Household | 1,641 (65.9%) | 849 (34.1%) |
| 3-Person Household | 638 (52.8%) | 571 (47.2%) |
| 4+ Person Household | 1,341 (71.8%) | 528 (28.2%) |
| Total Housing Units | 5,374 (59.8%) | 3,607 (40.2%) |
Occupancy by Educational Attainment in Clarksville
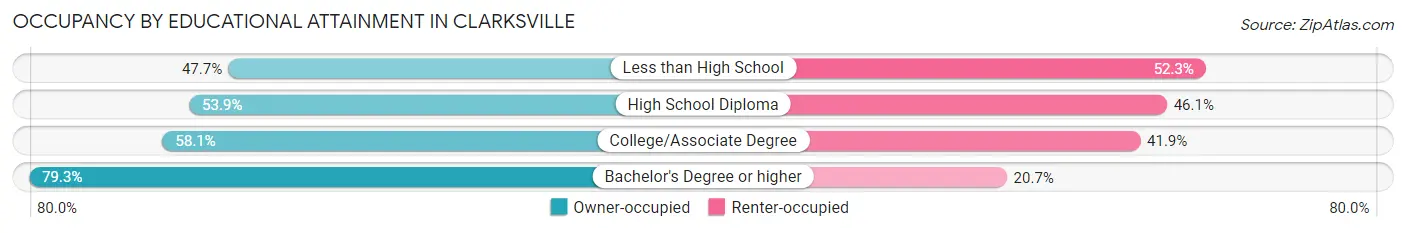
| Household Size | Owner-occupied | Renter-occupied |
| Less than High School | 559 (47.7%) | 612 (52.3%) |
| High School Diploma | 1,558 (53.9%) | 1,332 (46.1%) |
| College/Associate Degree | 1,771 (58.1%) | 1,275 (41.9%) |
| Bachelor's Degree or higher | 1,486 (79.3%) | 388 (20.7%) |
Occupancy by Age of Householder in Clarksville
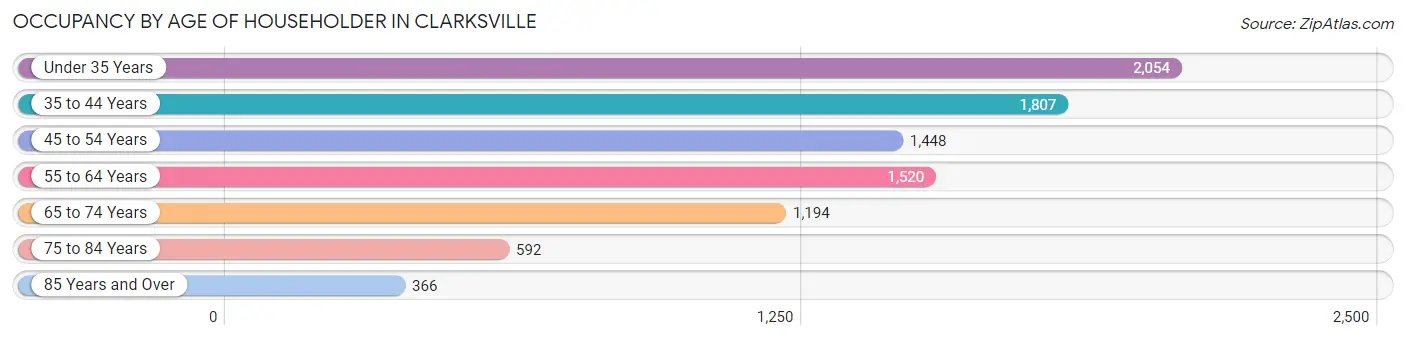
| Age Bracket | # Households | % Households |
| Under 35 Years | 2,054 | 22.9% |
| 35 to 44 Years | 1,807 | 20.1% |
| 45 to 54 Years | 1,448 | 16.1% |
| 55 to 64 Years | 1,520 | 16.9% |
| 65 to 74 Years | 1,194 | 13.3% |
| 75 to 84 Years | 592 | 6.6% |
| 85 Years and Over | 366 | 4.1% |
| Total | 8,981 | 100.0% |
Housing Finances in Clarksville
Median Income by Occupancy in Clarksville
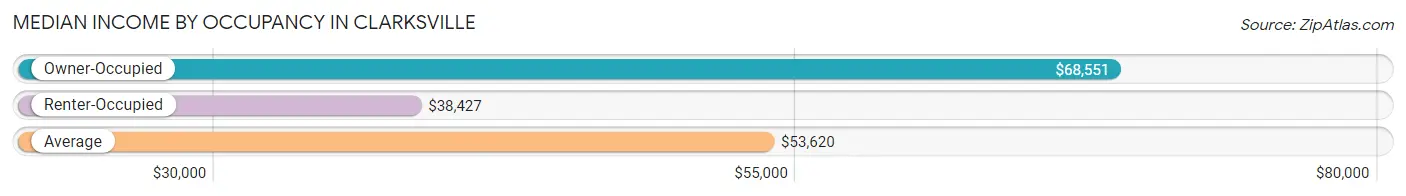
| Occupancy Type | # Households | Median Income |
| Owner-Occupied | 5,374 (59.8%) | $68,551 |
| Renter-Occupied | 3,607 (40.2%) | $38,427 |
| Average | 8,981 (100.0%) | $53,620 |
Occupancy by Householder Income Bracket in Clarksville
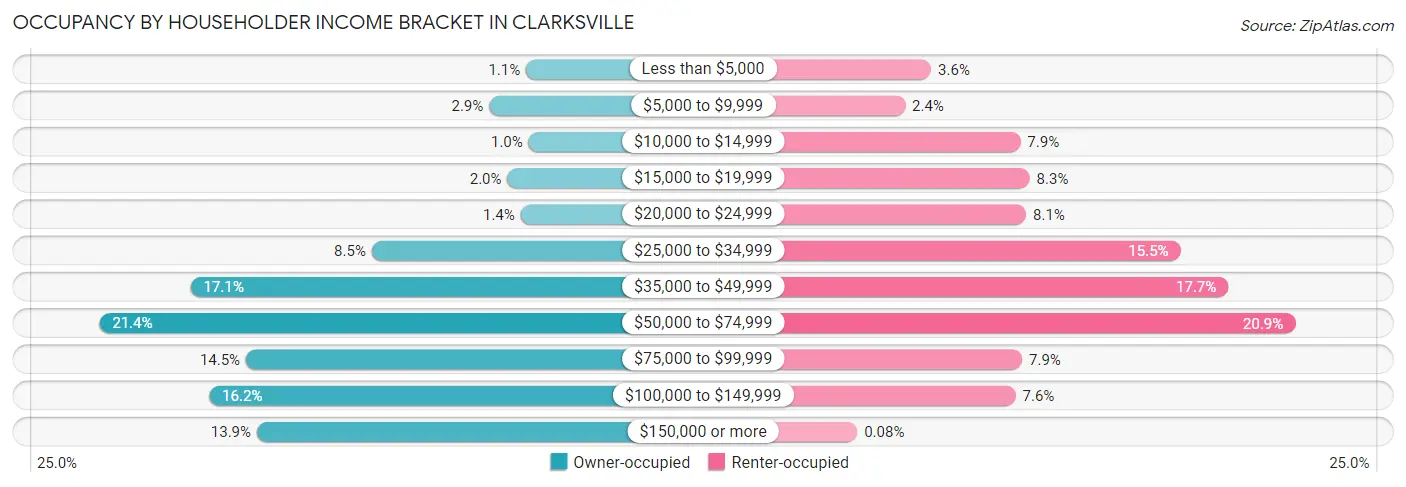
| Income Bracket | Owner-occupied | Renter-occupied |
| Less than $5,000 | 60 (1.1%) | 130 (3.6%) |
| $5,000 to $9,999 | 155 (2.9%) | 85 (2.4%) |
| $10,000 to $14,999 | 54 (1.0%) | 283 (7.9%) |
| $15,000 to $19,999 | 108 (2.0%) | 299 (8.3%) |
| $20,000 to $24,999 | 74 (1.4%) | 293 (8.1%) |
| $25,000 to $34,999 | 455 (8.5%) | 558 (15.5%) |
| $35,000 to $49,999 | 919 (17.1%) | 640 (17.7%) |
| $50,000 to $74,999 | 1,152 (21.4%) | 755 (20.9%) |
| $75,000 to $99,999 | 777 (14.5%) | 286 (7.9%) |
| $100,000 to $149,999 | 871 (16.2%) | 275 (7.6%) |
| $150,000 or more | 749 (13.9%) | 3 (0.1%) |
| Total | 5,374 (100.0%) | 3,607 (100.0%) |
Monthly Housing Cost Tiers in Clarksville
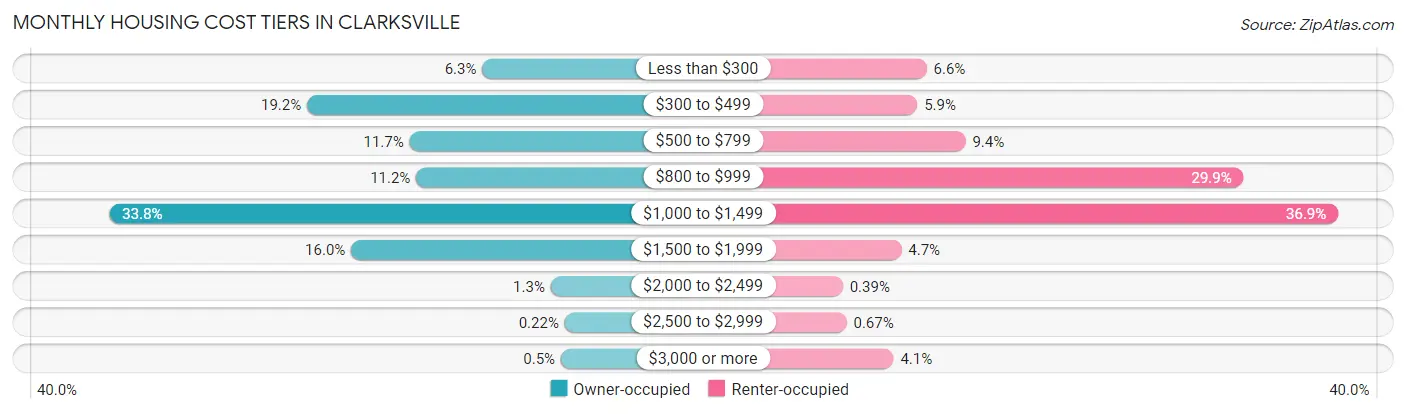
| Monthly Cost | Owner-occupied | Renter-occupied |
| Less than $300 | 338 (6.3%) | 237 (6.6%) |
| $300 to $499 | 1,032 (19.2%) | 212 (5.9%) |
| $500 to $799 | 626 (11.7%) | 340 (9.4%) |
| $800 to $999 | 600 (11.2%) | 1,079 (29.9%) |
| $1,000 to $1,499 | 1,815 (33.8%) | 1,330 (36.9%) |
| $1,500 to $1,999 | 857 (16.0%) | 170 (4.7%) |
| $2,000 to $2,499 | 67 (1.3%) | 14 (0.4%) |
| $2,500 to $2,999 | 12 (0.2%) | 24 (0.7%) |
| $3,000 or more | 27 (0.5%) | 149 (4.1%) |
| Total | 5,374 (100.0%) | 3,607 (100.0%) |
Physical Housing Characteristics in Clarksville
Housing Structures in Clarksville
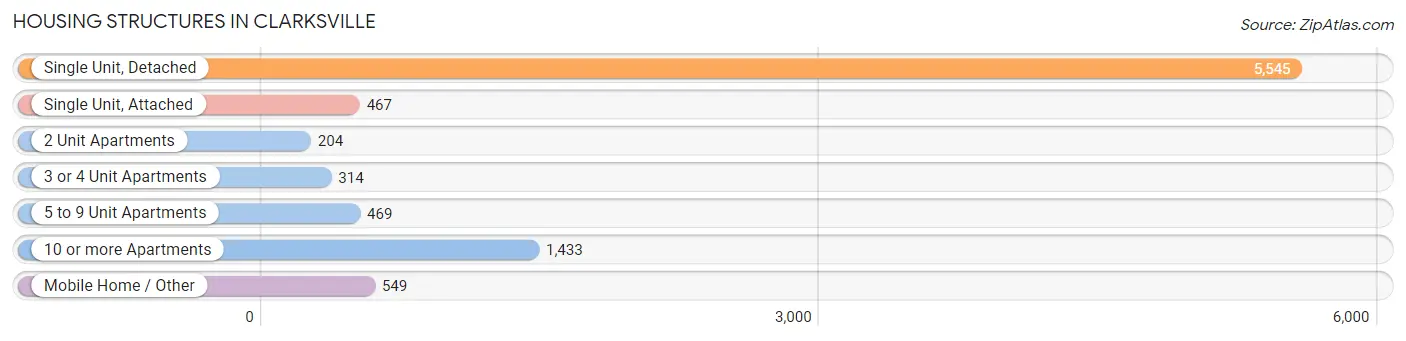
| Structure Type | # Housing Units | % Housing Units |
| Single Unit, Detached | 5,545 | 61.7% |
| Single Unit, Attached | 467 | 5.2% |
| 2 Unit Apartments | 204 | 2.3% |
| 3 or 4 Unit Apartments | 314 | 3.5% |
| 5 to 9 Unit Apartments | 469 | 5.2% |
| 10 or more Apartments | 1,433 | 16.0% |
| Mobile Home / Other | 549 | 6.1% |
| Total | 8,981 | 100.0% |
Housing Structures by Occupancy in Clarksville
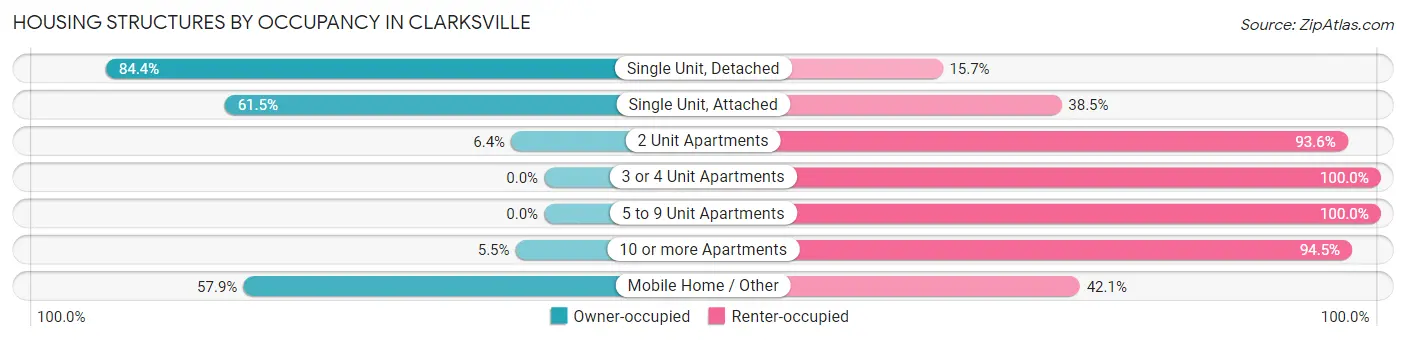
| Structure Type | Owner-occupied | Renter-occupied |
| Single Unit, Detached | 4,677 (84.4%) | 868 (15.7%) |
| Single Unit, Attached | 287 (61.5%) | 180 (38.5%) |
| 2 Unit Apartments | 13 (6.4%) | 191 (93.6%) |
| 3 or 4 Unit Apartments | 0 (0.0%) | 314 (100.0%) |
| 5 to 9 Unit Apartments | 0 (0.0%) | 469 (100.0%) |
| 10 or more Apartments | 79 (5.5%) | 1,354 (94.5%) |
| Mobile Home / Other | 318 (57.9%) | 231 (42.1%) |
| Total | 5,374 (59.8%) | 3,607 (40.2%) |
Housing Structures by Number of Rooms in Clarksville
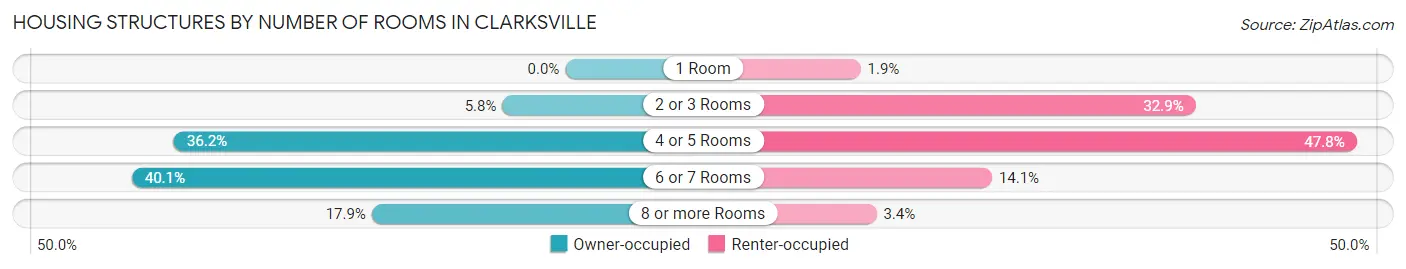
| Number of Rooms | Owner-occupied | Renter-occupied |
| 1 Room | 0 (0.0%) | 69 (1.9%) |
| 2 or 3 Rooms | 313 (5.8%) | 1,186 (32.9%) |
| 4 or 5 Rooms | 1,945 (36.2%) | 1,723 (47.8%) |
| 6 or 7 Rooms | 2,154 (40.1%) | 507 (14.1%) |
| 8 or more Rooms | 962 (17.9%) | 122 (3.4%) |
| Total | 5,374 (100.0%) | 3,607 (100.0%) |
Housing Structure by Heating Type in Clarksville
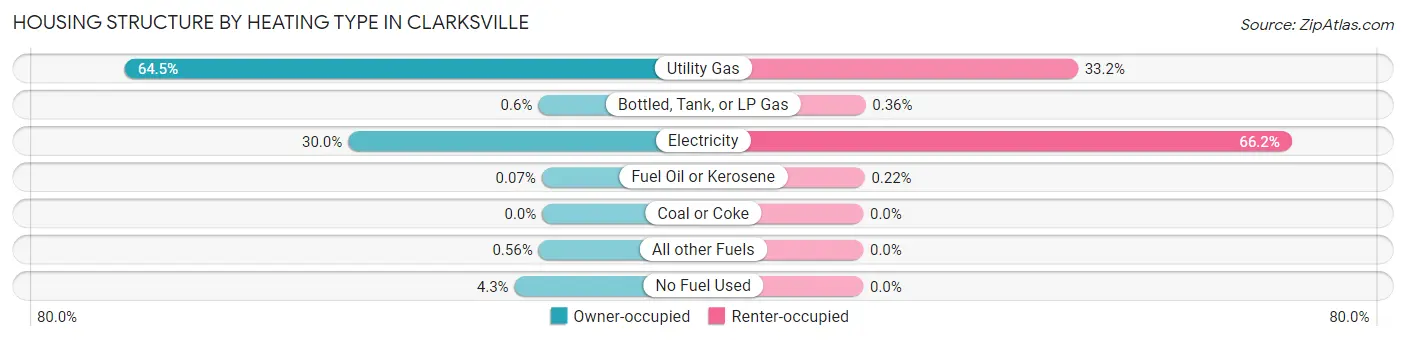
| Heating Type | Owner-occupied | Renter-occupied |
| Utility Gas | 3,466 (64.5%) | 1,197 (33.2%) |
| Bottled, Tank, or LP Gas | 32 (0.6%) | 13 (0.4%) |
| Electricity | 1,612 (30.0%) | 2,389 (66.2%) |
| Fuel Oil or Kerosene | 4 (0.1%) | 8 (0.2%) |
| Coal or Coke | 0 (0.0%) | 0 (0.0%) |
| All other Fuels | 30 (0.6%) | 0 (0.0%) |
| No Fuel Used | 230 (4.3%) | 0 (0.0%) |
| Total | 5,374 (100.0%) | 3,607 (100.0%) |
Household Vehicle Usage in Clarksville
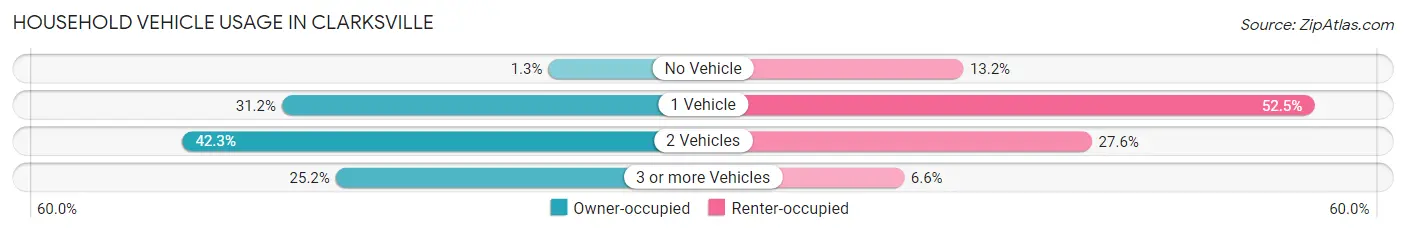
| Vehicles per Household | Owner-occupied | Renter-occupied |
| No Vehicle | 72 (1.3%) | 477 (13.2%) |
| 1 Vehicle | 1,676 (31.2%) | 1,895 (52.5%) |
| 2 Vehicles | 2,274 (42.3%) | 997 (27.6%) |
| 3 or more Vehicles | 1,352 (25.2%) | 238 (6.6%) |
| Total | 5,374 (100.0%) | 3,607 (100.0%) |
Real Estate & Mortgages in Clarksville
Real Estate and Mortgage Overview in Clarksville
| Characteristic | Without Mortgage | With Mortgage |
| Housing Units | 1,795 | 3,579 |
| Median Property Value | $131,200 | $176,300 |
| Median Household Income | $49,784 | $628 |
| Monthly Housing Costs | $407 | $27 |
| Real Estate Taxes | $897 | $105 |
Property Value by Mortgage Status in Clarksville
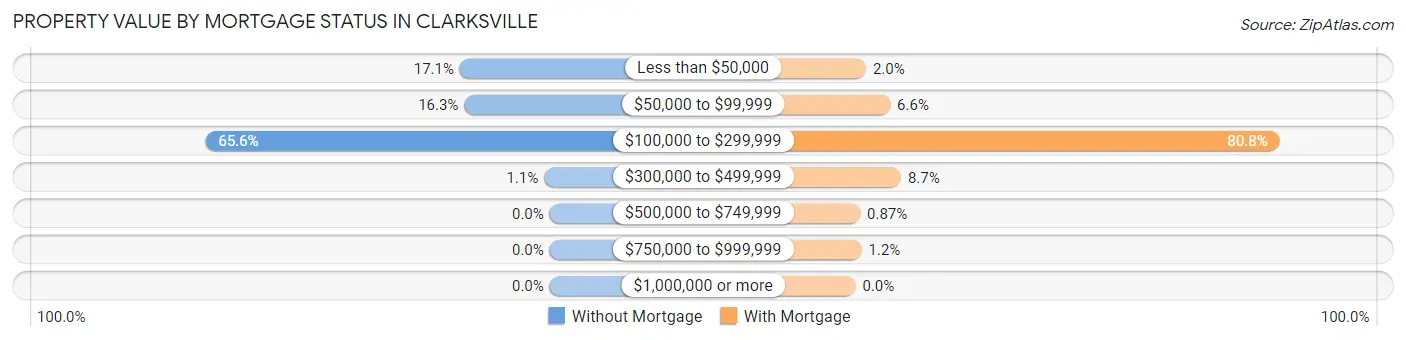
| Property Value | Without Mortgage | With Mortgage |
| Less than $50,000 | 307 (17.1%) | 71 (2.0%) |
| $50,000 to $99,999 | 292 (16.3%) | 236 (6.6%) |
| $100,000 to $299,999 | 1,177 (65.6%) | 2,890 (80.7%) |
| $300,000 to $499,999 | 19 (1.1%) | 310 (8.7%) |
| $500,000 to $749,999 | 0 (0.0%) | 31 (0.9%) |
| $750,000 to $999,999 | 0 (0.0%) | 41 (1.1%) |
| $1,000,000 or more | 0 (0.0%) | 0 (0.0%) |
| Total | 1,795 (100.0%) | 3,579 (100.0%) |
Household Income by Mortgage Status in Clarksville
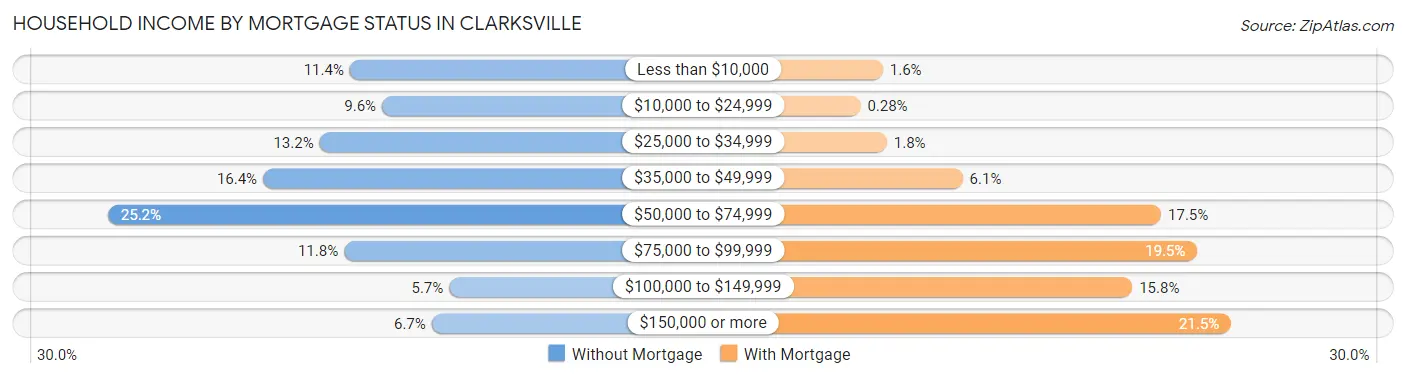
| Household Income | Without Mortgage | With Mortgage |
| Less than $10,000 | 205 (11.4%) | 56 (1.6%) |
| $10,000 to $24,999 | 172 (9.6%) | 10 (0.3%) |
| $25,000 to $34,999 | 236 (13.2%) | 64 (1.8%) |
| $35,000 to $49,999 | 294 (16.4%) | 219 (6.1%) |
| $50,000 to $74,999 | 453 (25.2%) | 625 (17.5%) |
| $75,000 to $99,999 | 211 (11.7%) | 699 (19.5%) |
| $100,000 to $149,999 | 103 (5.7%) | 566 (15.8%) |
| $150,000 or more | 121 (6.7%) | 768 (21.5%) |
| Total | 1,795 (100.0%) | 3,579 (100.0%) |
Property Value to Household Income Ratio in Clarksville
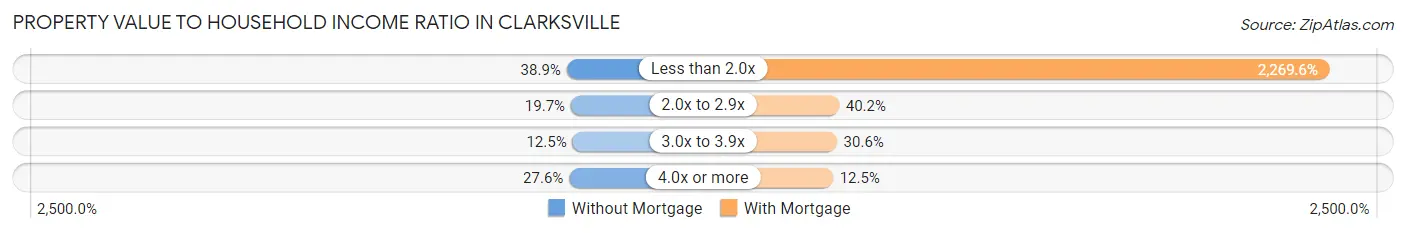
| Value-to-Income Ratio | Without Mortgage | With Mortgage |
| Less than 2.0x | 699 (38.9%) | 81,228 (2,269.6%) |
| 2.0x to 2.9x | 353 (19.7%) | 1,439 (40.2%) |
| 3.0x to 3.9x | 224 (12.5%) | 1,095 (30.6%) |
| 4.0x or more | 495 (27.6%) | 448 (12.5%) |
| Total | 1,795 (100.0%) | 3,579 (100.0%) |
Real Estate Taxes by Mortgage Status in Clarksville
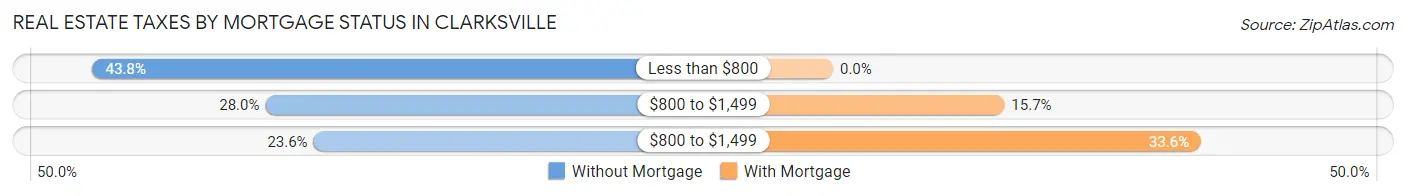
| Property Taxes | Without Mortgage | With Mortgage |
| Less than $800 | 786 (43.8%) | 0 (0.0%) |
| $800 to $1,499 | 503 (28.0%) | 560 (15.7%) |
| $800 to $1,499 | 424 (23.6%) | 1,203 (33.6%) |
| Total | 1,795 (100.0%) | 3,579 (100.0%) |
Health & Disability in Clarksville
Health Insurance Coverage by Age in Clarksville
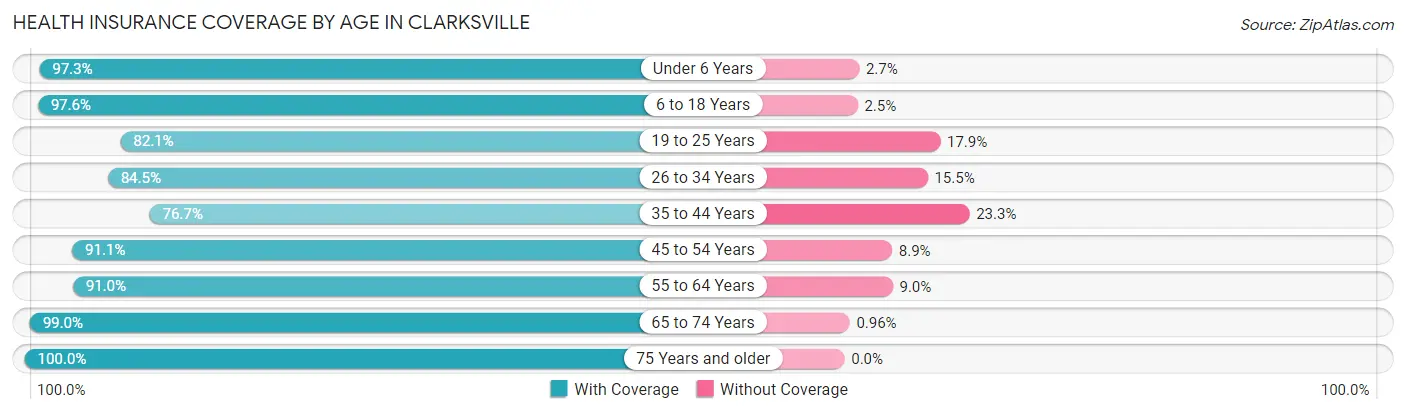
| Age Bracket | With Coverage | Without Coverage |
| Under 6 Years | 1,419 (97.3%) | 40 (2.7%) |
| 6 to 18 Years | 3,185 (97.6%) | 80 (2.5%) |
| 19 to 25 Years | 2,208 (82.1%) | 480 (17.9%) |
| 26 to 34 Years | 2,621 (84.5%) | 481 (15.5%) |
| 35 to 44 Years | 2,183 (76.7%) | 663 (23.3%) |
| 45 to 54 Years | 2,301 (91.1%) | 224 (8.9%) |
| 55 to 64 Years | 2,329 (91.0%) | 230 (9.0%) |
| 65 to 74 Years | 1,859 (99.0%) | 18 (1.0%) |
| 75 Years and older | 1,414 (100.0%) | 0 (0.0%) |
| Total | 19,519 (89.8%) | 2,216 (10.2%) |
Health Insurance Coverage by Citizenship Status in Clarksville
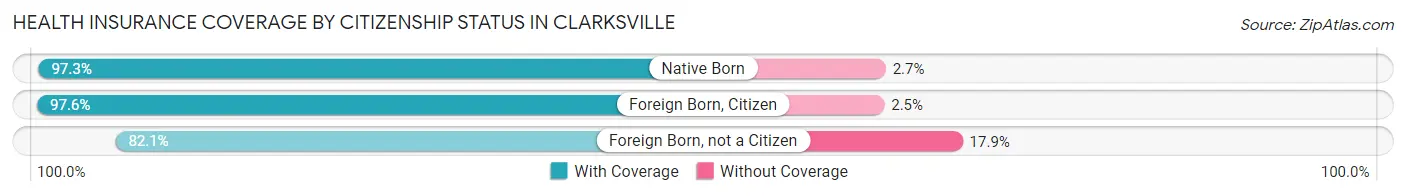
| Citizenship Status | With Coverage | Without Coverage |
| Native Born | 1,419 (97.3%) | 40 (2.7%) |
| Foreign Born, Citizen | 3,185 (97.6%) | 80 (2.5%) |
| Foreign Born, not a Citizen | 2,208 (82.1%) | 480 (17.9%) |
Health Insurance Coverage by Household Income in Clarksville
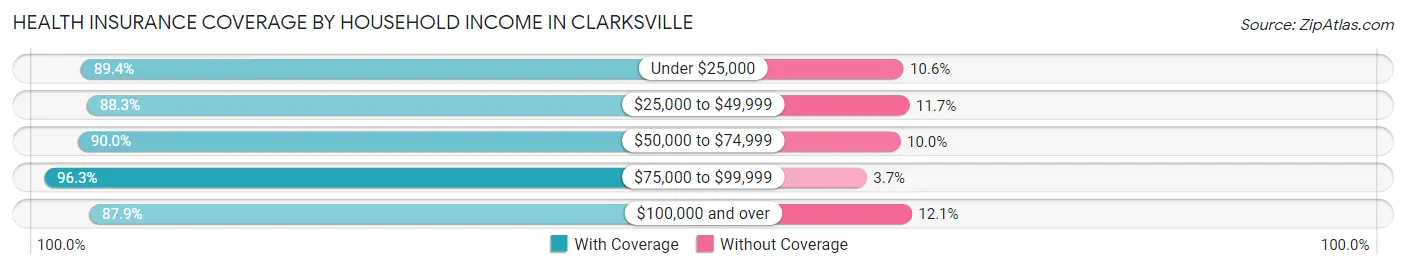
| Household Income | With Coverage | Without Coverage |
| Under $25,000 | 2,288 (89.4%) | 270 (10.6%) |
| $25,000 to $49,999 | 4,622 (88.3%) | 610 (11.7%) |
| $50,000 to $74,999 | 3,861 (90.0%) | 428 (10.0%) |
| $75,000 to $99,999 | 2,994 (96.3%) | 114 (3.7%) |
| $100,000 and over | 5,745 (87.9%) | 791 (12.1%) |
Public vs Private Health Insurance Coverage by Age in Clarksville
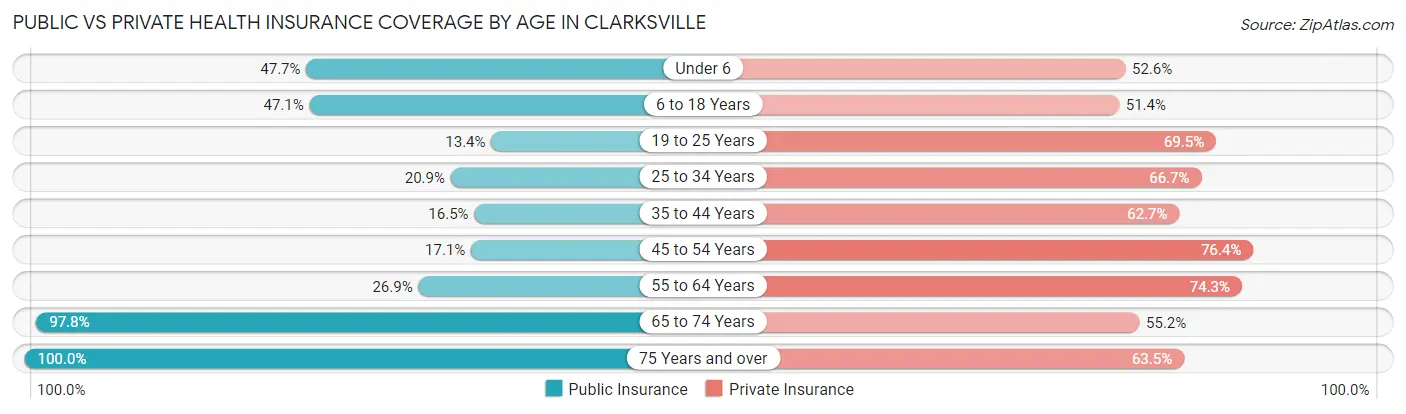
| Age Bracket | Public Insurance | Private Insurance |
| Under 6 | 696 (47.7%) | 767 (52.6%) |
| 6 to 18 Years | 1,538 (47.1%) | 1,679 (51.4%) |
| 19 to 25 Years | 359 (13.4%) | 1,867 (69.5%) |
| 25 to 34 Years | 648 (20.9%) | 2,070 (66.7%) |
| 35 to 44 Years | 470 (16.5%) | 1,783 (62.6%) |
| 45 to 54 Years | 432 (17.1%) | 1,928 (76.4%) |
| 55 to 64 Years | 688 (26.9%) | 1,900 (74.3%) |
| 65 to 74 Years | 1,836 (97.8%) | 1,036 (55.2%) |
| 75 Years and over | 1,414 (100.0%) | 898 (63.5%) |
| Total | 8,081 (37.2%) | 13,928 (64.1%) |
Disability Status by Sex by Age in Clarksville
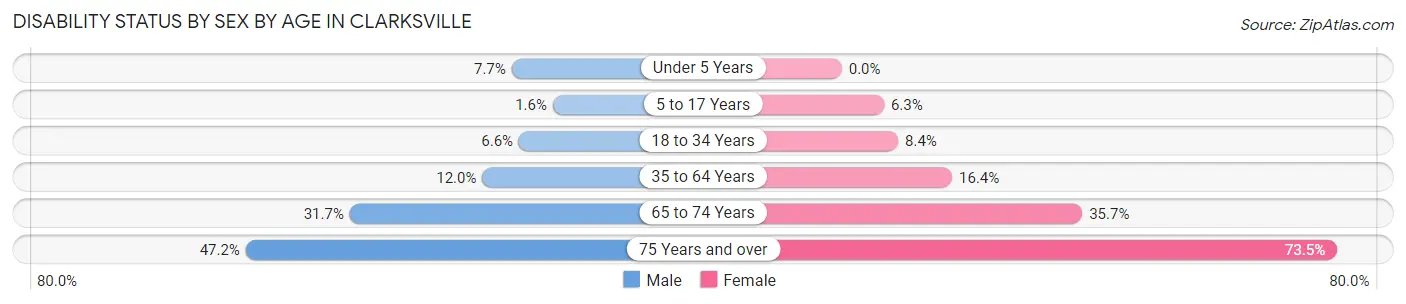
| Age Bracket | Male | Female |
| Under 5 Years | 49 (7.7%) | 0 (0.0%) |
| 5 to 17 Years | 28 (1.6%) | 91 (6.3%) |
| 18 to 34 Years | 201 (6.6%) | 245 (8.4%) |
| 35 to 64 Years | 477 (12.0%) | 650 (16.4%) |
| 65 to 74 Years | 256 (31.7%) | 382 (35.7%) |
| 75 Years and over | 225 (47.2%) | 689 (73.5%) |
Disability Class by Sex by Age in Clarksville
Disability Class: Hearing Difficulty
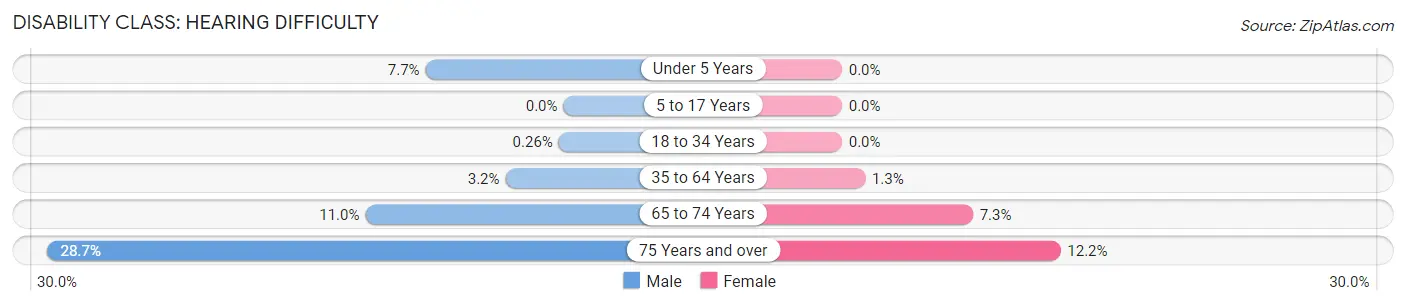
| Age Bracket | Male | Female |
| Under 5 Years | 49 (7.7%) | 0 (0.0%) |
| 5 to 17 Years | 0 (0.0%) | 0 (0.0%) |
| 18 to 34 Years | 8 (0.3%) | 0 (0.0%) |
| 35 to 64 Years | 128 (3.2%) | 51 (1.3%) |
| 65 to 74 Years | 89 (11.0%) | 78 (7.3%) |
| 75 Years and over | 137 (28.7%) | 114 (12.2%) |
Disability Class: Vision Difficulty
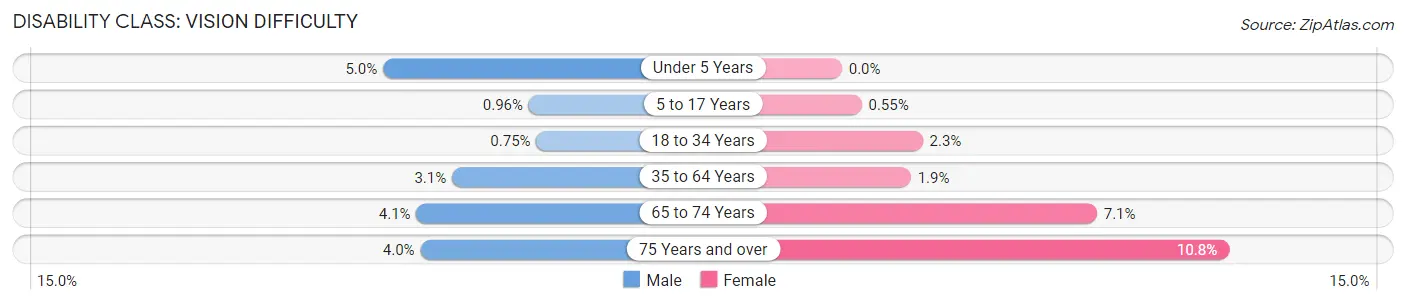
| Age Bracket | Male | Female |
| Under 5 Years | 32 (5.0%) | 0 (0.0%) |
| 5 to 17 Years | 17 (1.0%) | 8 (0.5%) |
| 18 to 34 Years | 23 (0.7%) | 66 (2.2%) |
| 35 to 64 Years | 123 (3.1%) | 76 (1.9%) |
| 65 to 74 Years | 33 (4.1%) | 76 (7.1%) |
| 75 Years and over | 19 (4.0%) | 101 (10.8%) |
Disability Class: Cognitive Difficulty
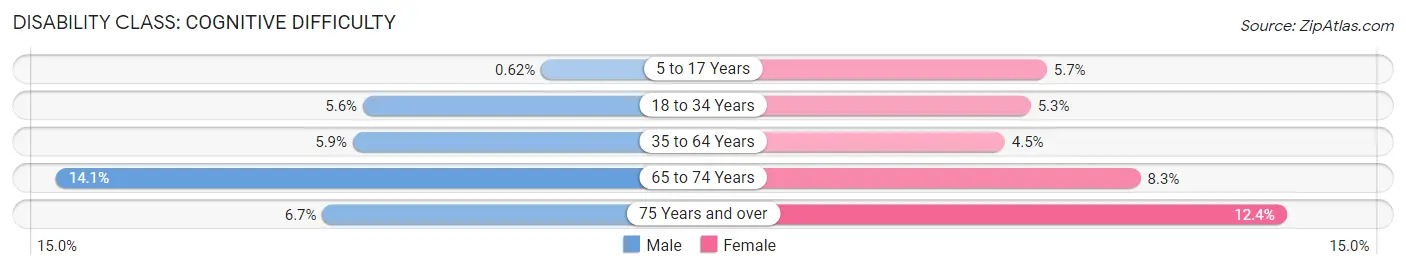
| Age Bracket | Male | Female |
| 5 to 17 Years | 11 (0.6%) | 83 (5.7%) |
| 18 to 34 Years | 170 (5.6%) | 154 (5.3%) |
| 35 to 64 Years | 232 (5.9%) | 180 (4.5%) |
| 65 to 74 Years | 114 (14.1%) | 89 (8.3%) |
| 75 Years and over | 32 (6.7%) | 116 (12.4%) |
Disability Class: Ambulatory Difficulty
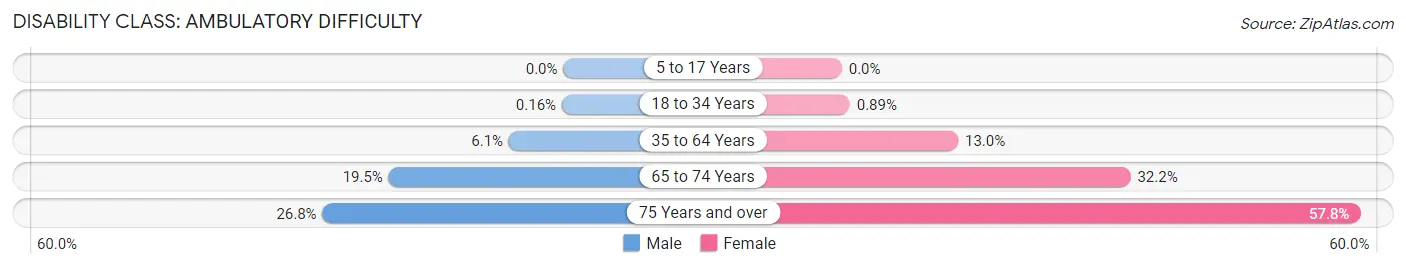
| Age Bracket | Male | Female |
| 5 to 17 Years | 0 (0.0%) | 0 (0.0%) |
| 18 to 34 Years | 5 (0.2%) | 26 (0.9%) |
| 35 to 64 Years | 240 (6.1%) | 514 (13.0%) |
| 65 to 74 Years | 157 (19.5%) | 344 (32.2%) |
| 75 Years and over | 128 (26.8%) | 542 (57.8%) |
Disability Class: Self-Care Difficulty
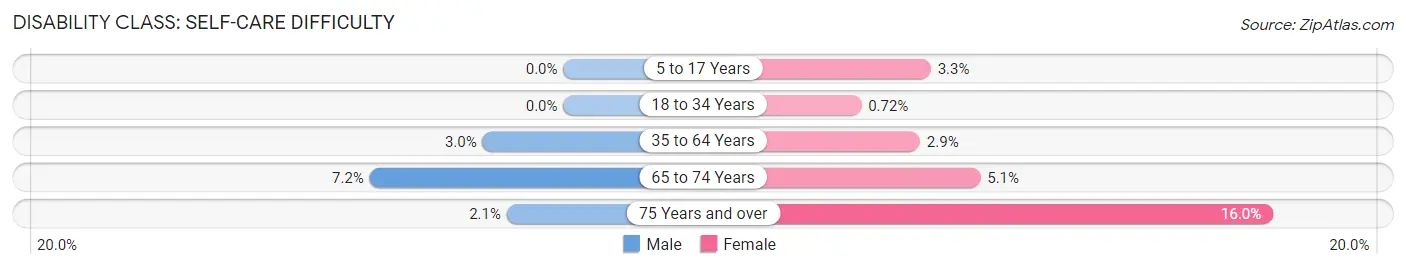
| Age Bracket | Male | Female |
| 5 to 17 Years | 0 (0.0%) | 48 (3.3%) |
| 18 to 34 Years | 0 (0.0%) | 21 (0.7%) |
| 35 to 64 Years | 119 (3.0%) | 115 (2.9%) |
| 65 to 74 Years | 58 (7.2%) | 55 (5.1%) |
| 75 Years and over | 10 (2.1%) | 150 (16.0%) |
Technology Access in Clarksville
Computing Device Access in Clarksville
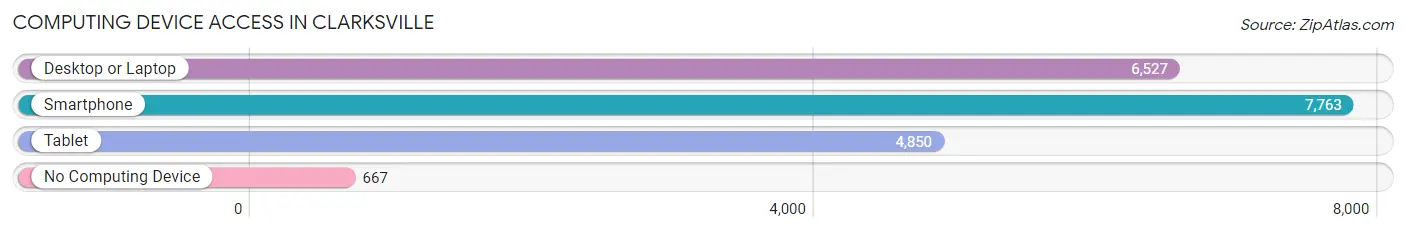
| Device Type | # Households | % Households |
| Desktop or Laptop | 6,527 | 72.7% |
| Smartphone | 7,763 | 86.4% |
| Tablet | 4,850 | 54.0% |
| No Computing Device | 667 | 7.4% |
| Total | 8,981 | 100.0% |
Internet Access in Clarksville
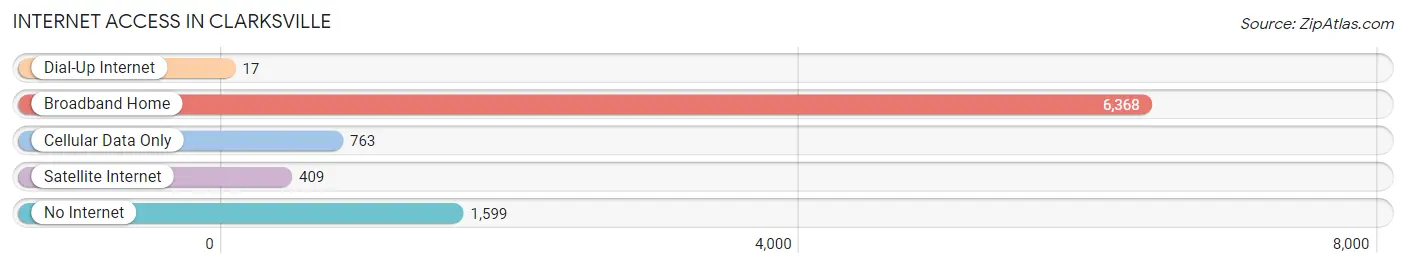
| Internet Type | # Households | % Households |
| Dial-Up Internet | 17 | 0.2% |
| Broadband Home | 6,368 | 70.9% |
| Cellular Data Only | 763 | 8.5% |
| Satellite Internet | 409 | 4.5% |
| No Internet | 1,599 | 17.8% |
| Total | 8,981 | 100.0% |
Clarksville Summary
Clarksville, Indiana is a city located in Clark County, Indiana, United States. It is situated along the Ohio River, directly across from Louisville, Kentucky. The city is the county seat of Clark County and is part of the Louisville metropolitan area. As of the 2010 census, the city had a population of 21,724, making it the 10th largest city in Indiana.
History
Clarksville was founded in 1783 by George Rogers Clark, a Revolutionary War hero. The city was named after him and was the first American settlement in the Northwest Territory. The city was incorporated in 1802 and has since grown to become the largest city in Clark County.
In the early 19th century, Clarksville was a major port on the Ohio River and was a major center for the slave trade. The city was also a major stop on the Underground Railroad. During the Civil War, the city was the site of several battles, including the Battle of Clarksville in 1862.
Geography
Clarksville is located at 38°19'N 85°50'W (38.3167, -85.8333). According to the United States Census Bureau, the city has a total area of 16.2 square miles (41.8 km2), of which 15.9 square miles (41.2 km2) is land and 0.3 square miles (0.8 km2) is water.
Economy
Clarksville is a major economic center in the region. The city is home to several large employers, including the River Ridge Commerce Center, a large industrial park. The city is also home to several major retail centers, including the Green Tree Mall and the Clarksville Towne Center.
The city is also home to several major educational institutions, including the University of Southern Indiana, Ivy Tech Community College, and Indiana University Southeast.
Demographics
As of the 2010 census, there were 21,724 people, 8,845 households, and 5,717 families residing in the city. The population density was 1,364.2 people per square mile (526.7/km2). There were 9,717 housing units at an average density of 609.3 per square mile (235.2/km2). The racial makeup of the city was 79.2% White, 15.3% African American, 0.3% Native American, 1.7% Asian, 0.1% Pacific Islander, 1.2% from other races, and 2.4% from two or more races. Hispanic or Latino of any race were 3.7% of the population.
There were 8,845 households, out of which 30.2% had children under the age of 18 living with them, 44.2% were married couples living together, 15.3% had a female householder with no husband present, and 36.2% were non-families. 30.2% of all households were made up of individuals, and 9.7% had someone living alone who was 65 years of age or older. The average household size was 2.41 and the average family size was 3.00.
In the city, the population was spread out, with 24.2% under the age of 18, 9.2% from 18 to 24, 30.2% from 25 to 44, 23.2% from 45 to 64, and 13.2% who were 65 years of age or older. The median age was 36 years. For every 100 females, there were 91.2 males. For every 100 females age 18 and over, there were 87.2 males.
The median income for a household in the city was $41,945, and the median income for a family was $51,890. Males had a median income of $37,845 versus $27,890 for females. The per capita income for the city was $21,890. About 8.2% of families and 10.7% of the population were below the poverty line, including 15.2% of those under age 18 and 8.2% of those age 65 or over.
Common Questions
What is Per Capita Income in Clarksville?
Per Capita income in Clarksville is $29,793.
What is the Median Family Income in Clarksville?
Median Family Income in Clarksville is $73,844.
What is the Median Household income in Clarksville?
Median Household Income in Clarksville is $53,620.
What is Income or Wage Gap in Clarksville?
Income or Wage Gap in Clarksville is 15.2%.
Women in Clarksville earn 84.8 cents for every dollar earned by a man.
What is Family Income Deficit in Clarksville?
Family Income Deficit in Clarksville is $7,770.
Families that are below poverty line in Clarksville earn $7,770 less on average than the poverty threshold level.
What is Inequality or Gini Index in Clarksville?
Inequality or Gini Index in Clarksville is 0.42.
What is the Total Population of Clarksville?
Total Population of Clarksville is 22,087.
What is the Total Male Population of Clarksville?
Total Male Population of Clarksville is 10,790.
What is the Total Female Population of Clarksville?
Total Female Population of Clarksville is 11,297.
What is the Ratio of Males per 100 Females in Clarksville?
There are 95.51 Males per 100 Females in Clarksville.
What is the Ratio of Females per 100 Males in Clarksville?
There are 104.70 Females per 100 Males in Clarksville.
What is the Median Population Age in Clarksville?
Median Population Age in Clarksville is 37.7 Years.
What is the Average Family Size in Clarksville
Average Family Size in Clarksville is 3.3 People.
What is the Average Household Size in Clarksville
Average Household Size in Clarksville is 2.4 People.
How Large is the Labor Force in Clarksville?
There are 12,002 People in the Labor Forcein in Clarksville.
What is the Percentage of People in the Labor Force in Clarksville?
66.0% of People are in the Labor Force in Clarksville.
What is the Unemployment Rate in Clarksville?
Unemployment Rate in Clarksville is 4.4%.