Buffalo, IN Map & Demographics
Buffalo Map
Buffalo Overview
$45,844
PER CAPITA INCOME
$122,847
AVG FAMILY INCOME
$120,333
AVG HOUSEHOLD INCOME
40.3%
WAGE / INCOME GAP [ % ]
59.7¢/ $1
WAGE / INCOME GAP [ $ ]
0.20
INEQUALITY / GINI INDEX
776
TOTAL POPULATION
480
MALE POPULATION
296
FEMALE POPULATION
162.16
MALES / 100 FEMALES
61.67
FEMALES / 100 MALES
54.8
MEDIAN AGE
2.5
AVG FAMILY SIZE
2.5
AVG HOUSEHOLD SIZE
553
LABOR FORCE [ PEOPLE ]
72.8%
PERCENT IN LABOR FORCE
Income in Buffalo
Income Overview in Buffalo
Per Capita Income in Buffalo is $45,844, while median incomes of families and households are $122,847 and $120,333 respectively.
| Characteristic | Number | Measure |
| Per Capita Income | 776 | $45,844 |
| Median Family Income | 279 | $122,847 |
| Mean Family Income | 279 | $111,520 |
| Median Household Income | 310 | $120,333 |
| Mean Household Income | 310 | $111,672 |
| Income Deficit | 279 | $0 |
| Wage / Income Gap (%) | 776 | 40.25% |
| Wage / Income Gap ($) | 776 | 59.75¢ per $1 |
| Gini / Inequality Index | 776 | 0.20 |
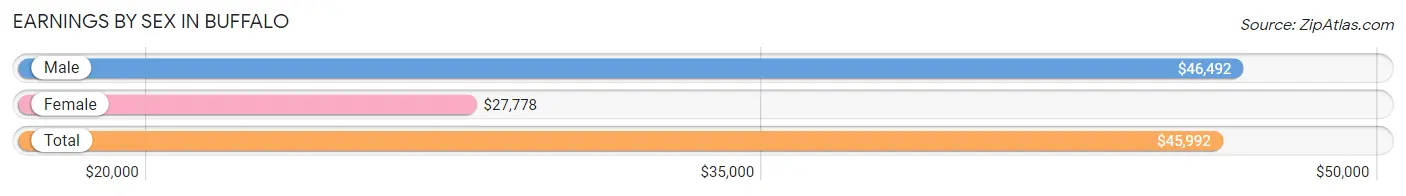
Earnings by Sex in Buffalo
Average Earnings in Buffalo are $45,992, $46,492 for men and $27,778 for women, a difference of 40.3%.
| Sex | Number | Average Earnings |
| Male | 411 (74.3%) | $46,492 |
| Female | 142 (25.7%) | $27,778 |
| Total | 553 (100.0%) | $45,992 |
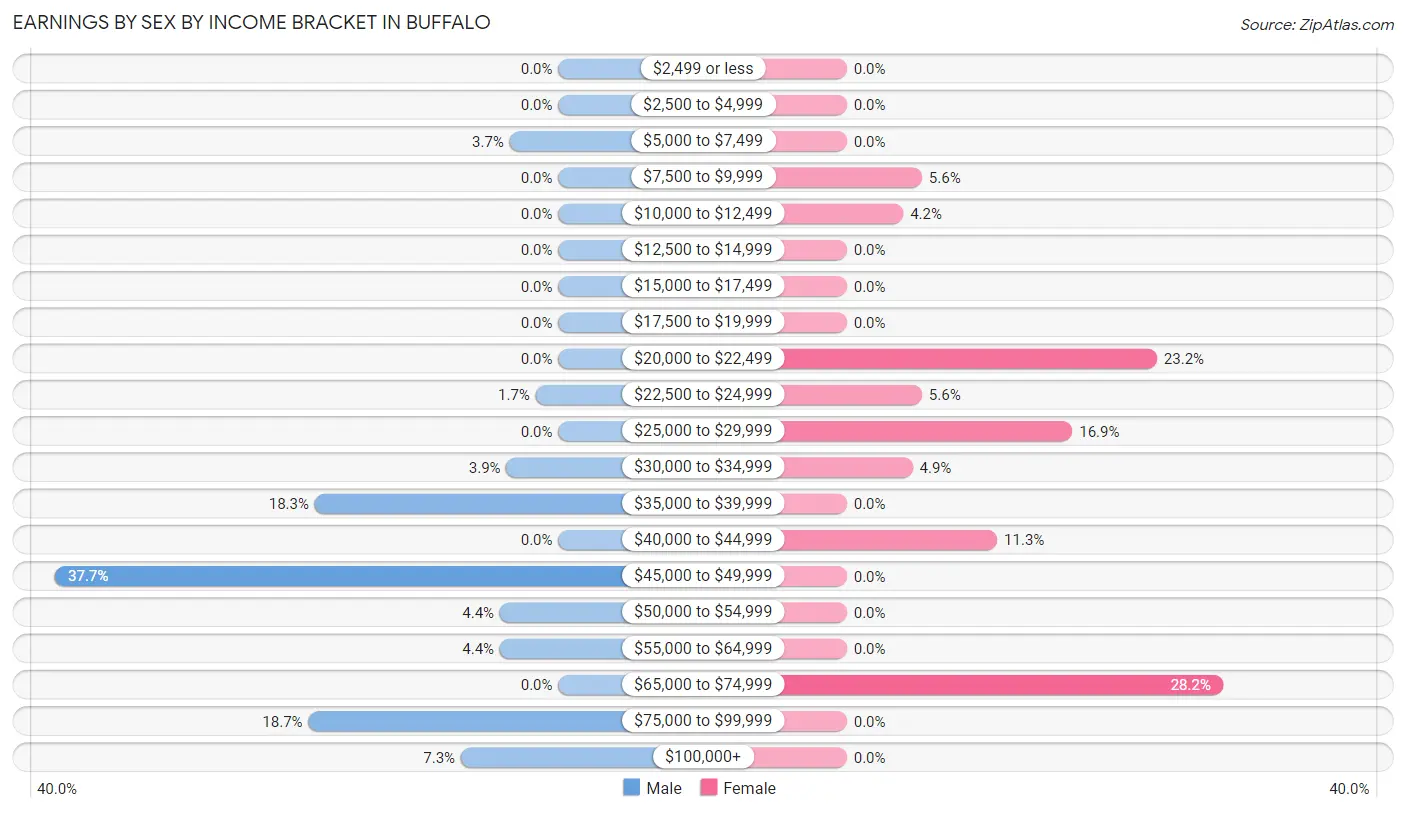
Earnings by Sex by Income Bracket in Buffalo
The most common earnings brackets in Buffalo are $45,000 to $49,999 for men (155 | 37.7%) and $65,000 to $74,999 for women (40 | 28.2%).
| Income | Male | Female |
| $2,499 or less | 0 (0.0%) | 0 (0.0%) |
| $2,500 to $4,999 | 0 (0.0%) | 0 (0.0%) |
| $5,000 to $7,499 | 15 (3.6%) | 0 (0.0%) |
| $7,500 to $9,999 | 0 (0.0%) | 8 (5.6%) |
| $10,000 to $12,499 | 0 (0.0%) | 6 (4.2%) |
| $12,500 to $14,999 | 0 (0.0%) | 0 (0.0%) |
| $15,000 to $17,499 | 0 (0.0%) | 0 (0.0%) |
| $17,500 to $19,999 | 0 (0.0%) | 0 (0.0%) |
| $20,000 to $22,499 | 0 (0.0%) | 33 (23.2%) |
| $22,500 to $24,999 | 7 (1.7%) | 8 (5.6%) |
| $25,000 to $29,999 | 0 (0.0%) | 24 (16.9%) |
| $30,000 to $34,999 | 16 (3.9%) | 7 (4.9%) |
| $35,000 to $39,999 | 75 (18.2%) | 0 (0.0%) |
| $40,000 to $44,999 | 0 (0.0%) | 16 (11.3%) |
| $45,000 to $49,999 | 155 (37.7%) | 0 (0.0%) |
| $50,000 to $54,999 | 18 (4.4%) | 0 (0.0%) |
| $55,000 to $64,999 | 18 (4.4%) | 0 (0.0%) |
| $65,000 to $74,999 | 0 (0.0%) | 40 (28.2%) |
| $75,000 to $99,999 | 77 (18.7%) | 0 (0.0%) |
| $100,000+ | 30 (7.3%) | 0 (0.0%) |
| Total | 411 (100.0%) | 142 (100.0%) |
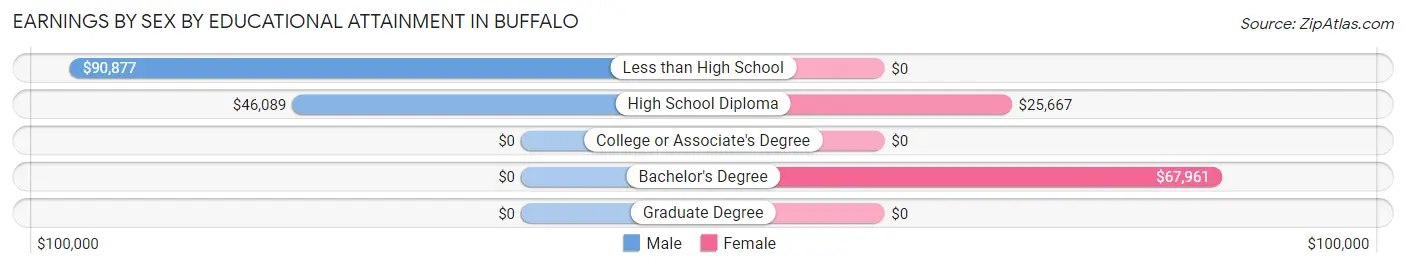
Earnings by Sex by Educational Attainment in Buffalo
Average earnings in Buffalo are $47,153 for men and $25,917 for women, a difference of 45.0%. Men with an educational attainment of less than high school enjoy the highest average annual earnings of $90,877, while those with high school diploma education earn the least with $46,089. Women with an educational attainment of bachelor's degree earn the most with the average annual earnings of $67,961, while those with high school diploma education have the smallest earnings of $25,667.
| Educational Attainment | Male Income | Female Income |
| Less than High School | $90,877 | $0 |
| High School Diploma | $46,089 | $25,667 |
| College or Associate's Degree | - | - |
| Bachelor's Degree | - | - |
| Graduate Degree | - | - |
| Total | $47,153 | $25,917 |
Family Income in Buffalo
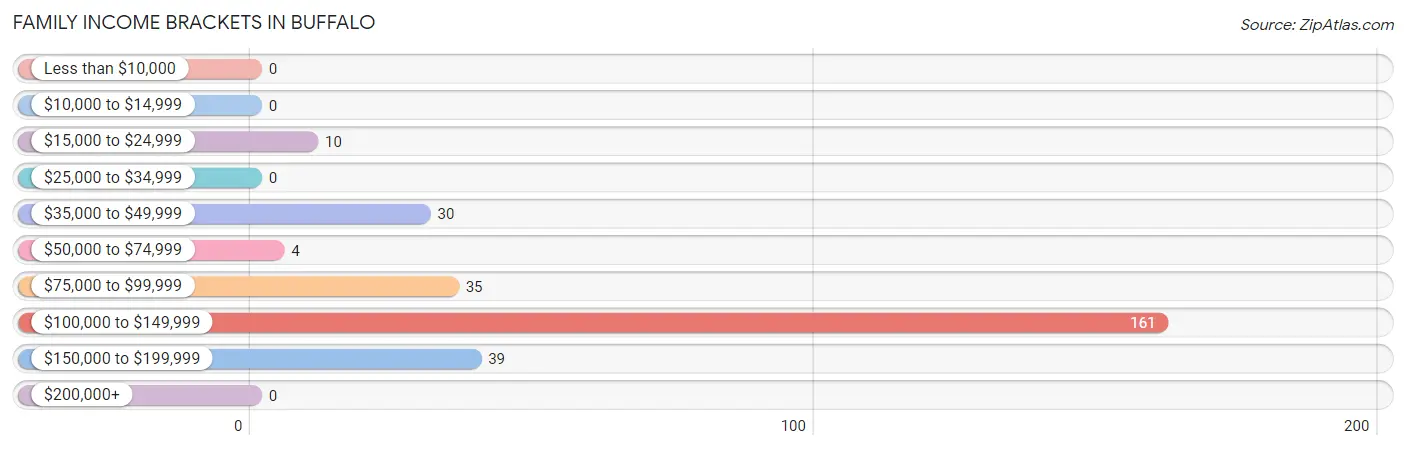
Family Income Brackets in Buffalo
According to the Buffalo family income data, there are 161 families falling into the $100,000 to $149,999 income range, which is the most common income bracket and makes up 57.7% of all families.
| Income Bracket | # Families | % Families |
| Less than $10,000 | 0 | 0.0% |
| $10,000 to $14,999 | 0 | 0.0% |
| $15,000 to $24,999 | 10 | 3.6% |
| $25,000 to $34,999 | 0 | 0.0% |
| $35,000 to $49,999 | 30 | 10.8% |
| $50,000 to $74,999 | 4 | 1.4% |
| $75,000 to $99,999 | 35 | 12.5% |
| $100,000 to $149,999 | 161 | 57.7% |
| $150,000 to $199,999 | 39 | 14.0% |
| $200,000+ | 0 | 0.0% |
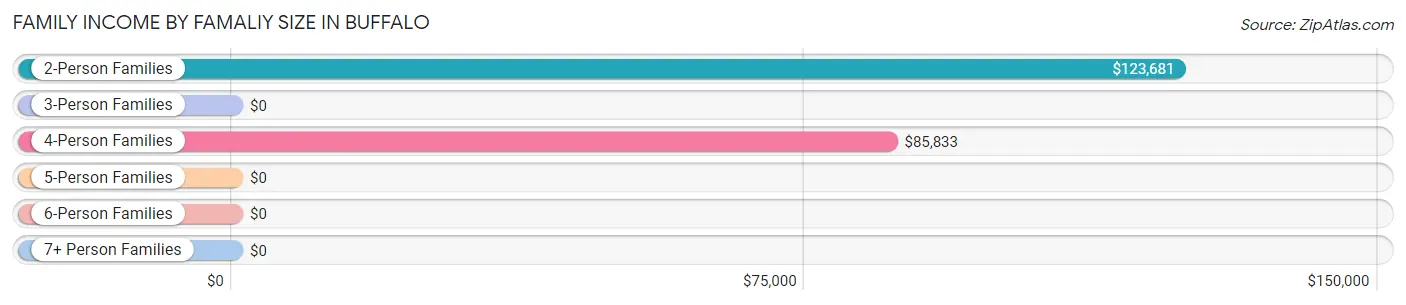
Family Income by Famaliy Size in Buffalo
2-person families (251 | 90.0%) account for the highest median family income in Buffalo with $123,681 per family, while 2-person families (251 | 90.0%) have the highest median income of $61,840 per family member.
| Income Bracket | # Families | Median Income |
| 2-Person Families | 251 (90.0%) | $123,681 |
| 3-Person Families | 0 (0.0%) | $0 |
| 4-Person Families | 20 (7.2%) | $85,833 |
| 5-Person Families | 8 (2.9%) | $0 |
| 6-Person Families | 0 (0.0%) | $0 |
| 7+ Person Families | 0 (0.0%) | $0 |
| Total | 279 (100.0%) | $122,847 |
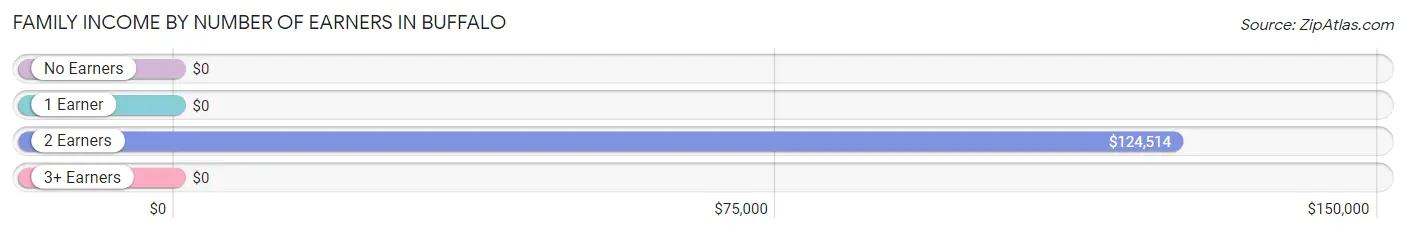
Family Income by Number of Earners in Buffalo
| Number of Earners | # Families | Median Income |
| No Earners | 23 (8.2%) | $0 |
| 1 Earner | 68 (24.4%) | $0 |
| 2 Earners | 177 (63.4%) | $124,514 |
| 3+ Earners | 11 (3.9%) | $0 |
| Total | 279 (100.0%) | $122,847 |
Household Income in Buffalo
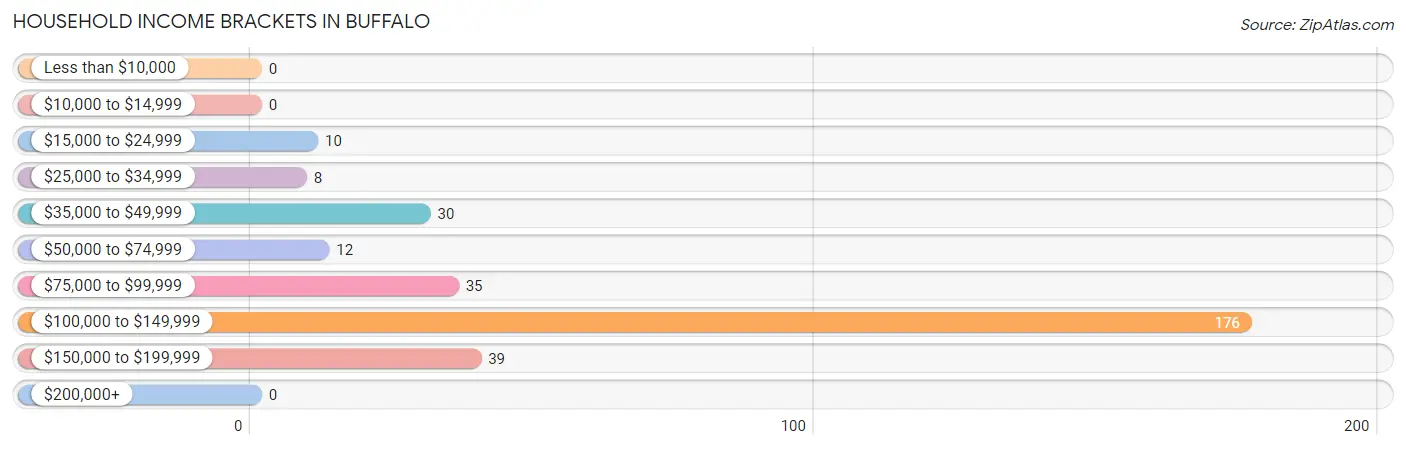
Household Income Brackets in Buffalo
With 176 households falling in the category, the $100,000 to $149,999 income range is the most frequent in Buffalo, accounting for 56.8% of all households.
| Income Bracket | # Households | % Households |
| Less than $10,000 | 0 | 0.0% |
| $10,000 to $14,999 | 0 | 0.0% |
| $15,000 to $24,999 | 10 | 3.2% |
| $25,000 to $34,999 | 8 | 2.6% |
| $35,000 to $49,999 | 30 | 9.7% |
| $50,000 to $74,999 | 12 | 3.9% |
| $75,000 to $99,999 | 35 | 11.3% |
| $100,000 to $149,999 | 176 | 56.8% |
| $150,000 to $199,999 | 39 | 12.6% |
| $200,000+ | 0 | 0.0% |
Household Income by Householder Age in Buffalo
The median household income in Buffalo is $120,333, with the highest median household income of $147,857 found in the 45 to 64 years age bracket for the primary householder. A total of 192 households (61.9%) fall into this category. Meanwhile, the 15 to 24 years age bracket for the primary householder has the lowest median household income of $0, with 50 households (16.1%) in this group.
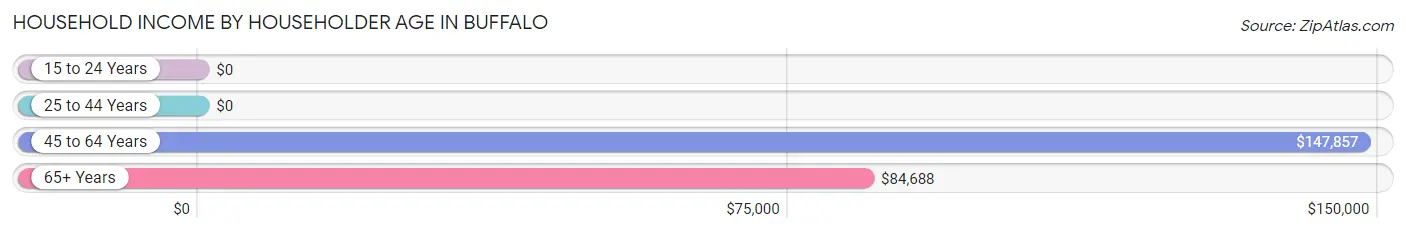
| Income Bracket | # Households | Median Income |
| 15 to 24 Years | 50 (16.1%) | $0 |
| 25 to 44 Years | 18 (5.8%) | $0 |
| 45 to 64 Years | 192 (61.9%) | $147,857 |
| 65+ Years | 50 (16.1%) | $84,688 |
| Total | 310 (100.0%) | $120,333 |
Poverty in Buffalo
Income Below Poverty by Sex and Age in Buffalo
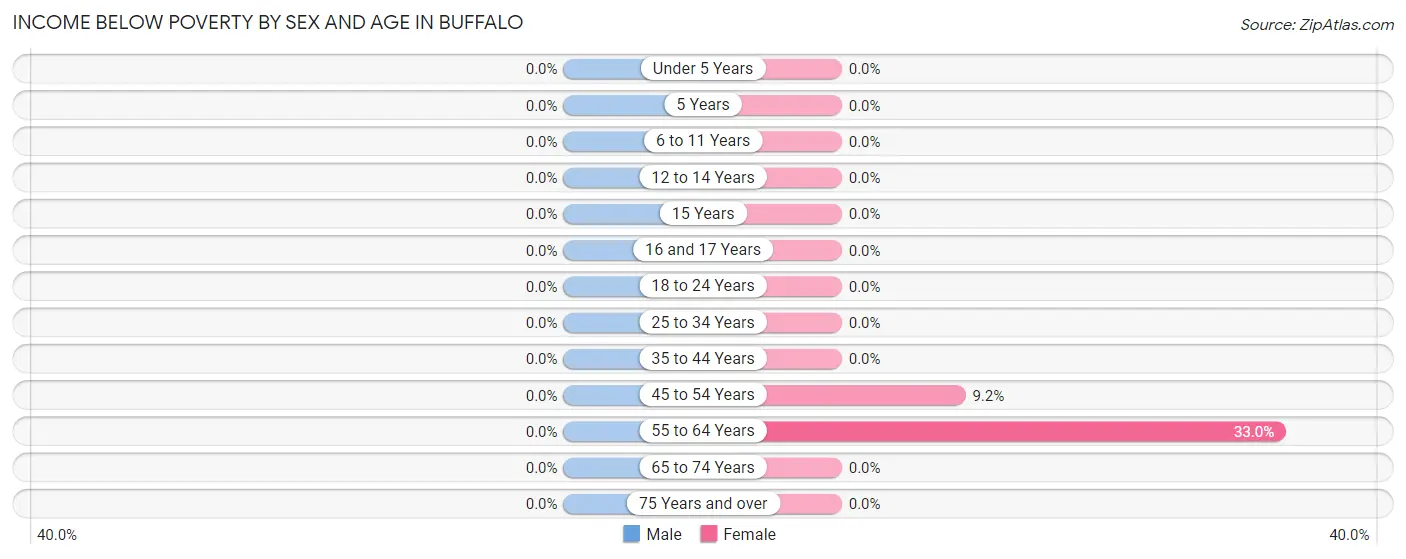
| Age Bracket | Male | Female |
| Under 5 Years | 0 (0.0%) | 0 (0.0%) |
| 5 Years | 0 (0.0%) | 0 (0.0%) |
| 6 to 11 Years | 0 (0.0%) | 0 (0.0%) |
| 12 to 14 Years | 0 (0.0%) | 0 (0.0%) |
| 15 Years | 0 (0.0%) | 0 (0.0%) |
| 16 and 17 Years | 0 (0.0%) | 0 (0.0%) |
| 18 to 24 Years | 0 (0.0%) | 0 (0.0%) |
| 25 to 34 Years | 0 (0.0%) | 0 (0.0%) |
| 35 to 44 Years | 0 (0.0%) | 0 (0.0%) |
| 45 to 54 Years | 0 (0.0%) | 9 (9.2%) |
| 55 to 64 Years | 0 (0.0%) | 31 (33.0%) |
| 65 to 74 Years | 0 (0.0%) | 0 (0.0%) |
| 75 Years and over | 0 (0.0%) | 0 (0.0%) |
| Total | 0 (0.0%) | 40 (13.5%) |
Income Above Poverty by Sex and Age in Buffalo
According to the poverty statistics in Buffalo, males aged 6 to 11 years and females aged 5 years are the age groups that are most secure financially, with 100.0% of males and 100.0% of females in these age groups living above the poverty line.
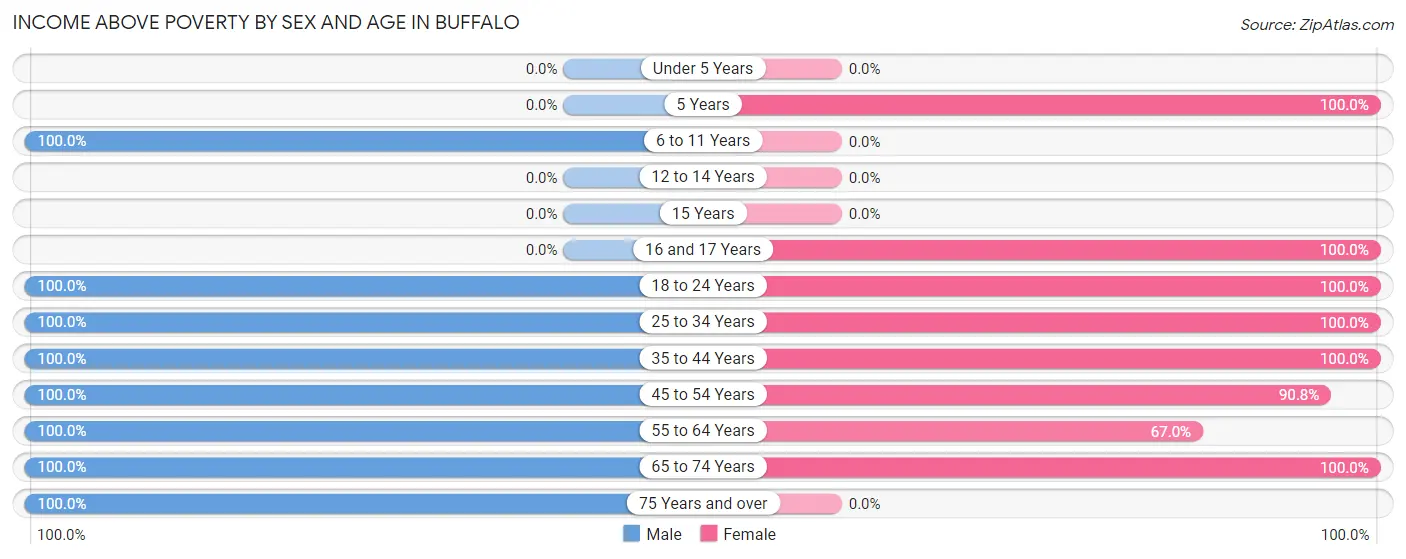
| Age Bracket | Male | Female |
| Under 5 Years | 0 (0.0%) | 0 (0.0%) |
| 5 Years | 0 (0.0%) | 7 (100.0%) |
| 6 to 11 Years | 9 (100.0%) | 0 (0.0%) |
| 12 to 14 Years | 0 (0.0%) | 0 (0.0%) |
| 15 Years | 0 (0.0%) | 0 (0.0%) |
| 16 and 17 Years | 0 (0.0%) | 11 (100.0%) |
| 18 to 24 Years | 82 (100.0%) | 21 (100.0%) |
| 25 to 34 Years | 15 (100.0%) | 30 (100.0%) |
| 35 to 44 Years | 3 (100.0%) | 7 (100.0%) |
| 45 to 54 Years | 144 (100.0%) | 89 (90.8%) |
| 55 to 64 Years | 175 (100.0%) | 63 (67.0%) |
| 65 to 74 Years | 42 (100.0%) | 28 (100.0%) |
| 75 Years and over | 10 (100.0%) | 0 (0.0%) |
| Total | 480 (100.0%) | 256 (86.5%) |
Income Below Poverty Among Married-Couple Families in Buffalo
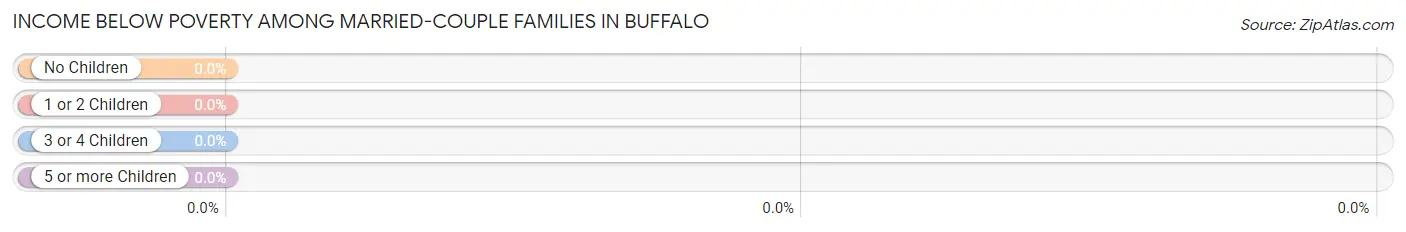
| Children | Above Poverty | Below Poverty |
| No Children | 177 (100.0%) | 0 (0.0%) |
| 1 or 2 Children | 8 (100.0%) | 0 (0.0%) |
| 3 or 4 Children | 0 (0.0%) | 0 (0.0%) |
| 5 or more Children | 0 (0.0%) | 0 (0.0%) |
| Total | 185 (100.0%) | 0 (0.0%) |
Income Below Poverty Among Single-Parent Households in Buffalo
| Children | Single Father | Single Mother |
| No Children | 0 (0.0%) | 0 (0.0%) |
| 1 or 2 Children | 0 (0.0%) | 0 (0.0%) |
| 3 or 4 Children | 0 (0.0%) | 0 (0.0%) |
| 5 or more Children | 0 (0.0%) | 0 (0.0%) |
| Total | 0 (0.0%) | 0 (0.0%) |
Income Below Poverty Among Married-Couple vs Single-Parent Households in Buffalo
| Children | Married-Couple Families | Single-Parent Households |
| No Children | 0 (0.0%) | 0 (0.0%) |
| 1 or 2 Children | 0 (0.0%) | 0 (0.0%) |
| 3 or 4 Children | 0 (0.0%) | 0 (0.0%) |
| 5 or more Children | 0 (0.0%) | 0 (0.0%) |
| Total | 0 (0.0%) | 0 (0.0%) |
Race in Buffalo
The most populous races in Buffalo are White / Caucasian (753 | 97.0%), Two or more Races (23 | 3.0%), and Hispanic or Latino (10 | 1.3%).
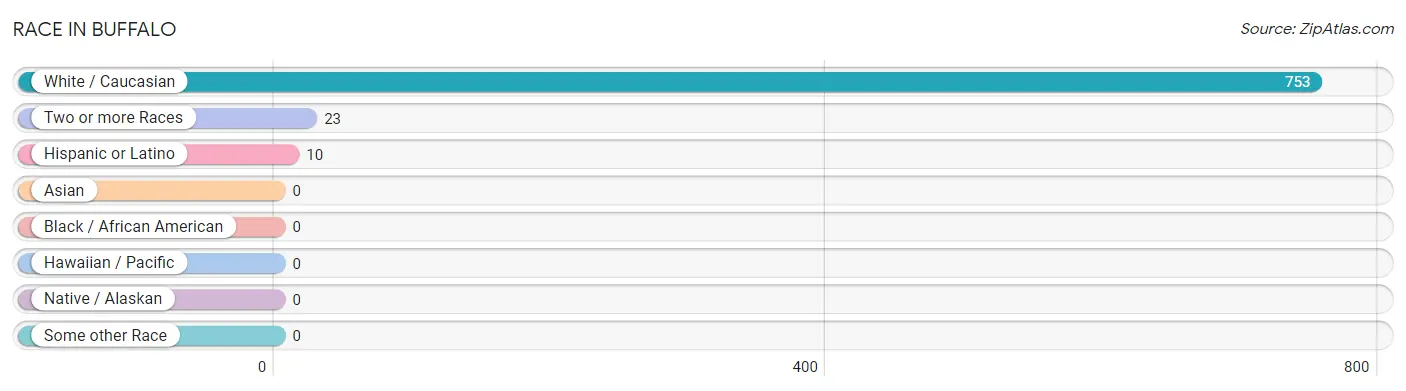
| Race | # Population | % Population |
| Asian | 0 | 0.0% |
| Black / African American | 0 | 0.0% |
| Hawaiian / Pacific | 0 | 0.0% |
| Hispanic or Latino | 10 | 1.3% |
| Native / Alaskan | 0 | 0.0% |
| White / Caucasian | 753 | 97.0% |
| Two or more Races | 23 | 3.0% |
| Some other Race | 0 | 0.0% |
| Total | 776 | 100.0% |
Ancestry in Buffalo
The most populous ancestries reported in Buffalo are Irish (267 | 34.4%), German (133 | 17.1%), Dutch (37 | 4.8%), English (25 | 3.2%), and Cherokee (23 | 3.0%), together accounting for 62.5% of all Buffalo residents.
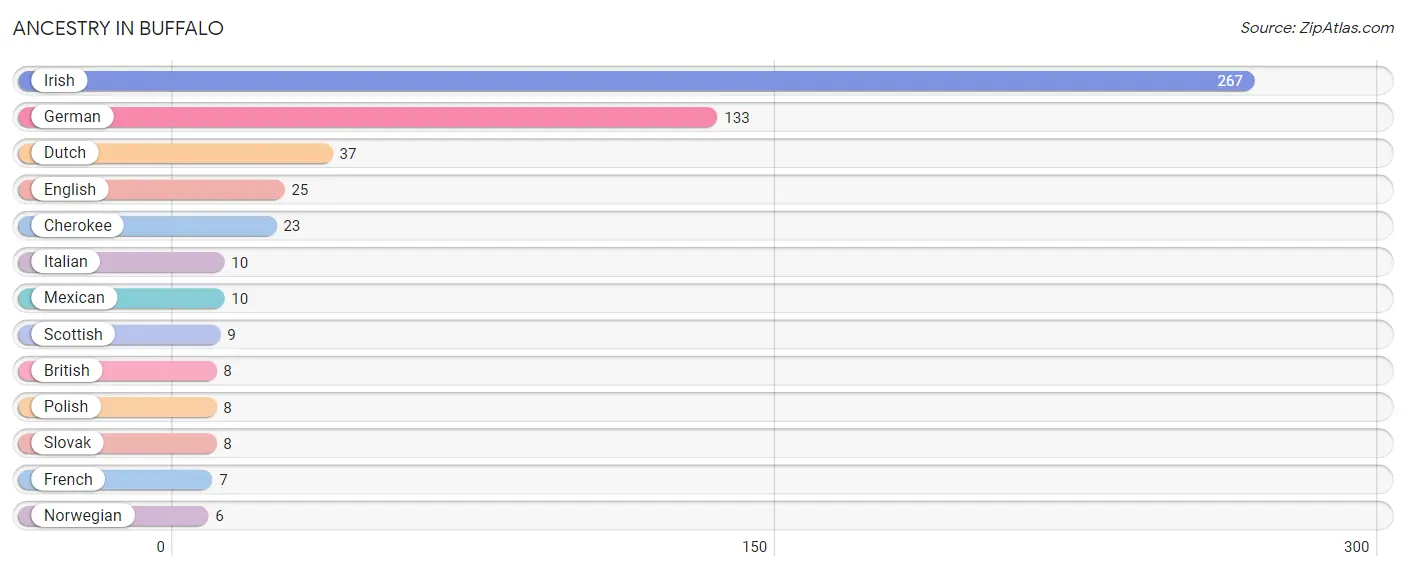
| Ancestry | # Population | % Population |
| British | 8 | 1.0% |
| Cherokee | 23 | 3.0% |
| Dutch | 37 | 4.8% |
| English | 25 | 3.2% |
| French | 7 | 0.9% |
| German | 133 | 17.1% |
| Irish | 267 | 34.4% |
| Italian | 10 | 1.3% |
| Mexican | 10 | 1.3% |
| Norwegian | 6 | 0.8% |
| Polish | 8 | 1.0% |
| Scottish | 9 | 1.2% |
| Slovak | 8 | 1.0% | View All 13 Rows |
Immigrants in Buffalo

| Immigration Origin | # Population | % Population | View All 0 Rows |
Sex and Age in Buffalo
Sex and Age in Buffalo
The most populous age groups in Buffalo are 55 to 59 Years (165 | 34.4%) for men and 60 to 64 Years (83 | 28.0%) for women.
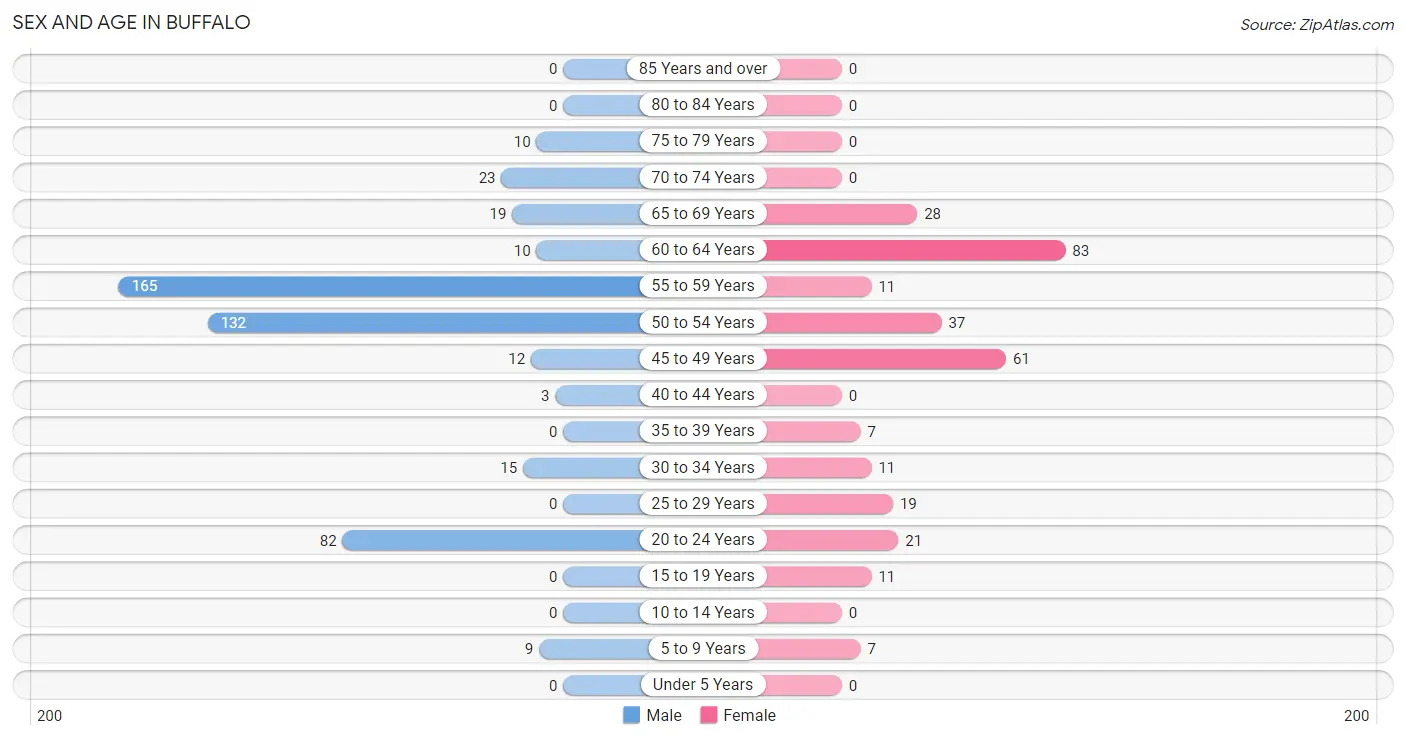
| Age Bracket | Male | Female |
| Under 5 Years | 0 (0.0%) | 0 (0.0%) |
| 5 to 9 Years | 9 (1.9%) | 7 (2.4%) |
| 10 to 14 Years | 0 (0.0%) | 0 (0.0%) |
| 15 to 19 Years | 0 (0.0%) | 11 (3.7%) |
| 20 to 24 Years | 82 (17.1%) | 21 (7.1%) |
| 25 to 29 Years | 0 (0.0%) | 19 (6.4%) |
| 30 to 34 Years | 15 (3.1%) | 11 (3.7%) |
| 35 to 39 Years | 0 (0.0%) | 7 (2.4%) |
| 40 to 44 Years | 3 (0.6%) | 0 (0.0%) |
| 45 to 49 Years | 12 (2.5%) | 61 (20.6%) |
| 50 to 54 Years | 132 (27.5%) | 37 (12.5%) |
| 55 to 59 Years | 165 (34.4%) | 11 (3.7%) |
| 60 to 64 Years | 10 (2.1%) | 83 (28.0%) |
| 65 to 69 Years | 19 (4.0%) | 28 (9.5%) |
| 70 to 74 Years | 23 (4.8%) | 0 (0.0%) |
| 75 to 79 Years | 10 (2.1%) | 0 (0.0%) |
| 80 to 84 Years | 0 (0.0%) | 0 (0.0%) |
| 85 Years and over | 0 (0.0%) | 0 (0.0%) |
| Total | 480 (100.0%) | 296 (100.0%) |
Families and Households in Buffalo
Median Family Size in Buffalo
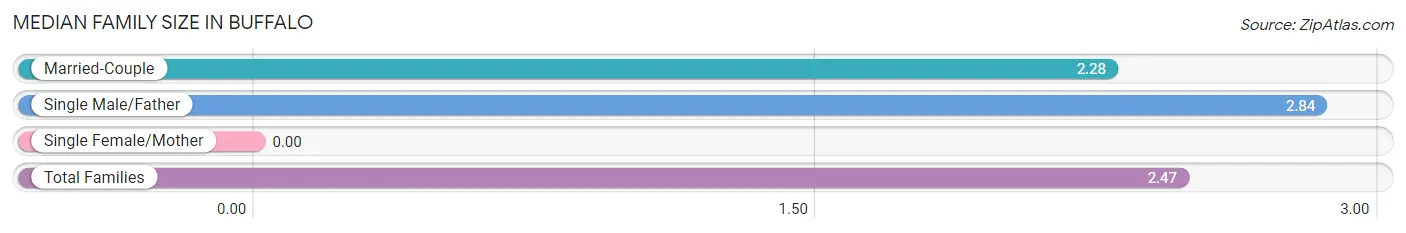
| Family Type | # Families | Family Size |
| Married-Couple | 185 (66.3%) | 2.28 |
| Single Male/Father | 94 (33.7%) | 2.84 |
| Single Female/Mother | 0 (0.0%) | - |
| Total Families | 279 (100.0%) | 2.47 |
Median Household Size in Buffalo
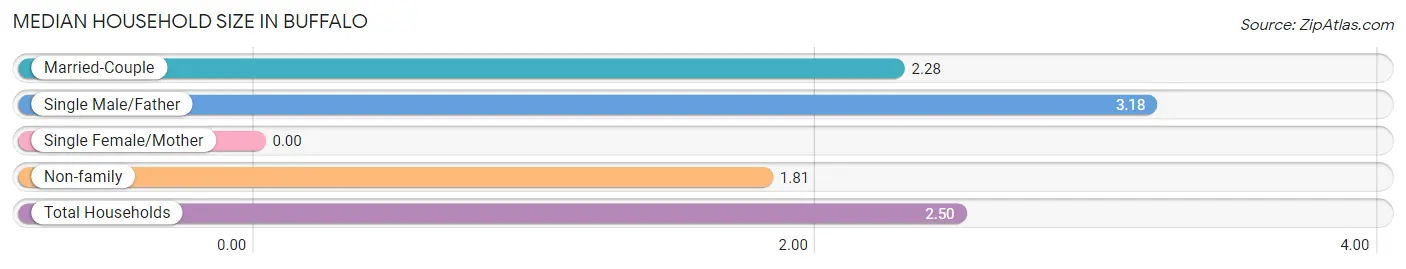
| Household Type | # Households | Household Size |
| Married-Couple | 185 (59.7%) | 2.28 |
| Single Male/Father | 94 (30.3%) | 3.18 |
| Single Female/Mother | 0 (0.0%) | - |
| Non-family | 31 (10.0%) | 1.81 |
| Total Households | 310 (100.0%) | 2.50 |
Household Size by Marriage Status in Buffalo
Out of a total of 310 households in Buffalo, 279 (90.0%) are family households, while 31 (10.0%) are nonfamily households. The most numerous type of family households are 2-person households, comprising 174, and the most common type of nonfamily households are 2-person households, comprising 23.
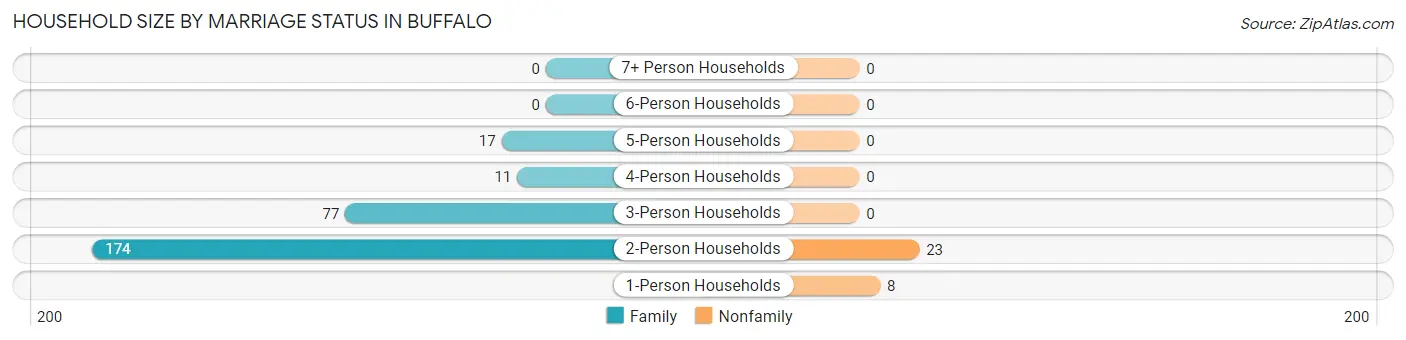
| Household Size | Family Households | Nonfamily Households |
| 1-Person Households | - | 8 (2.6%) |
| 2-Person Households | 174 (56.1%) | 23 (7.4%) |
| 3-Person Households | 77 (24.8%) | 0 (0.0%) |
| 4-Person Households | 11 (3.5%) | 0 (0.0%) |
| 5-Person Households | 17 (5.5%) | 0 (0.0%) |
| 6-Person Households | 0 (0.0%) | 0 (0.0%) |
| 7+ Person Households | 0 (0.0%) | 0 (0.0%) |
| Total | 279 (90.0%) | 31 (10.0%) |
Female Fertility in Buffalo
Fertility by Age in Buffalo
| Age Bracket | Women with Births | Births / 1,000 Women |
| 15 to 19 years | 0 (0.0%) | 0.0 |
| 20 to 34 years | 0 (0.0%) | 0.0 |
| 35 to 50 years | 0 (0.0%) | 0.0 |
| Total | 0 (0.0%) | 0.0 |
Fertility by Age by Marriage Status in Buffalo
| Age Bracket | Married | Unmarried |
| 15 to 19 years | 0 (0.0%) | 0 (0.0%) |
| 20 to 34 years | 0 (0.0%) | 0 (0.0%) |
| 35 to 50 years | 0 (0.0%) | 0 (0.0%) |
| Total | 0 (0.0%) | 0 (0.0%) |
Fertility by Education in Buffalo
| Educational Attainment | Women with Births | Births / 1,000 Women |
| Less than High School | 0 (0.0%) | 0.0 |
| High School Diploma | 0 (0.0%) | 0.0 |
| College or Associate's Degree | 0 (0.0%) | 0.0 |
| Bachelor's Degree | 0 (0.0%) | 0.0 |
| Graduate Degree | 0 (0.0%) | 0.0 |
| Total | 0 (0.0%) | 0.0 |
Fertility by Education by Marriage Status in Buffalo
| Educational Attainment | Married | Unmarried |
| Less than High School | 0 (0.0%) | 0 (0.0%) |
| High School Diploma | 0 (0.0%) | 0 (0.0%) |
| College or Associate's Degree | 0 (0.0%) | 0 (0.0%) |
| Bachelor's Degree | 0 (0.0%) | 0 (0.0%) |
| Graduate Degree | 0 (0.0%) | 0 (0.0%) |
| Total | 0 (0.0%) | 0 (0.0%) |
Employment Characteristics in Buffalo
Employment by Class of Employer in Buffalo
Among the 545 employed individuals in Buffalo, private company employees (422 | 77.4%), self-employed (not incorporated) (95 | 17.4%), and not-for-profit organizations (14 | 2.6%) make up the most common classes of employment.
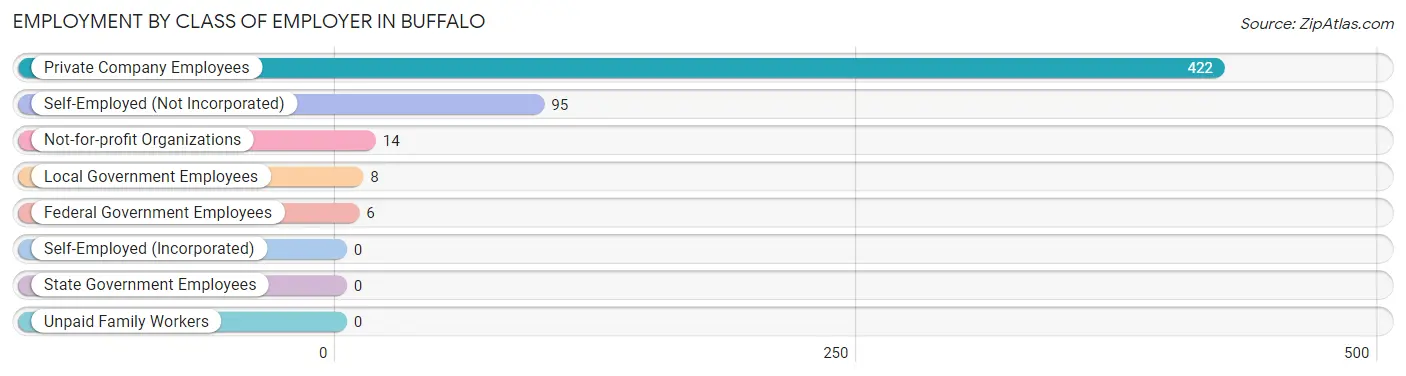
| Employer Class | # Employees | % Employees |
| Private Company Employees | 422 | 77.4% |
| Self-Employed (Incorporated) | 0 | 0.0% |
| Self-Employed (Not Incorporated) | 95 | 17.4% |
| Not-for-profit Organizations | 14 | 2.6% |
| Local Government Employees | 8 | 1.5% |
| State Government Employees | 0 | 0.0% |
| Federal Government Employees | 6 | 1.1% |
| Unpaid Family Workers | 0 | 0.0% |
| Total | 545 | 100.0% |
Employment Status by Age in Buffalo
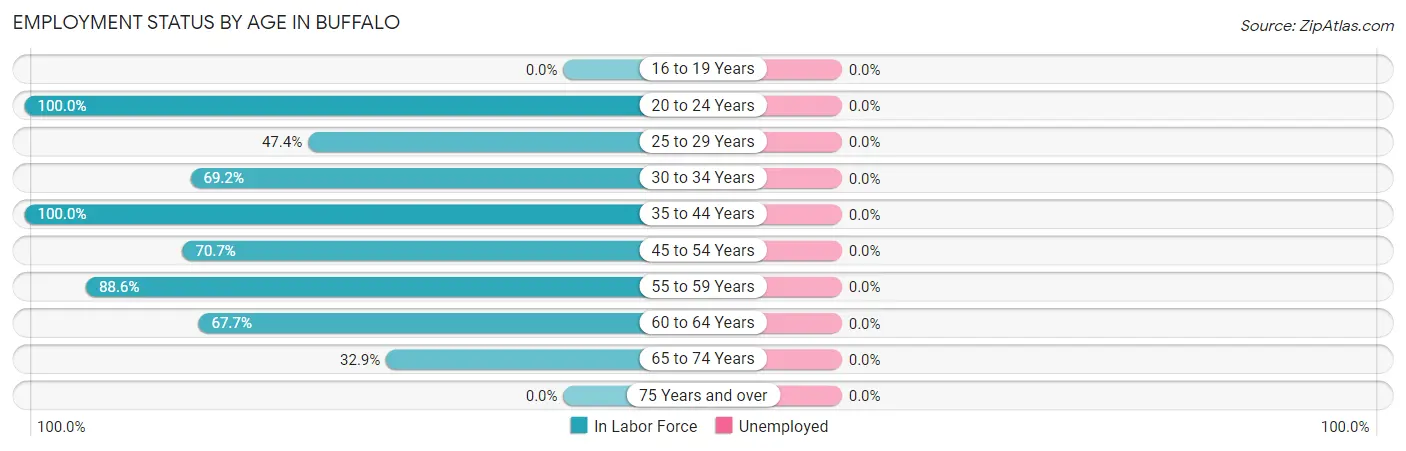
| Age Bracket | In Labor Force | Unemployed |
| 16 to 19 Years | 0 (0.0%) | 0 (0.0%) |
| 20 to 24 Years | 103 (100.0%) | 0 (0.0%) |
| 25 to 29 Years | 9 (47.4%) | 0 (0.0%) |
| 30 to 34 Years | 18 (69.2%) | 0 (0.0%) |
| 35 to 44 Years | 10 (100.0%) | 0 (0.0%) |
| 45 to 54 Years | 171 (70.7%) | 0 (0.0%) |
| 55 to 59 Years | 156 (88.6%) | 0 (0.0%) |
| 60 to 64 Years | 63 (67.7%) | 0 (0.0%) |
| 65 to 74 Years | 23 (32.9%) | 0 (0.0%) |
| 75 Years and over | 0 (0.0%) | 0 (0.0%) |
| Total | 553 (72.8%) | 0 (0.0%) |
Employment Status by Educational Attainment in Buffalo
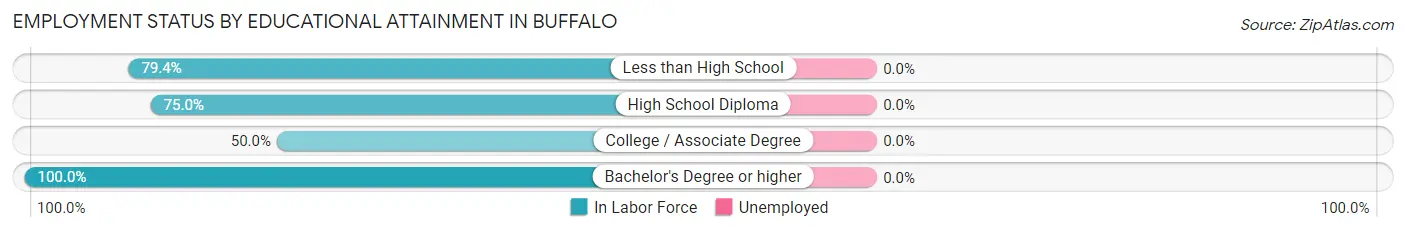
| Educational Attainment | In Labor Force | Unemployed |
| Less than High School | 112 (79.4%) | 0 (0.0%) |
| High School Diploma | 222 (75.0%) | 0 (0.0%) |
| College / Associate Degree | 36 (50.0%) | 0 (0.0%) |
| Bachelor's Degree or higher | 57 (100.0%) | 0 (0.0%) |
| Total | 427 (75.4%) | 0 (0.0%) |
Employment Occupations by Sex in Buffalo
Management, Business, Science and Arts Occupations
The most common Management, Business, Science and Arts occupations in Buffalo are Management (59 | 10.7%), Health Diagnosing & Treating (21 | 3.8%), Business & Financial (19 | 3.4%), Community & Social Service (14 | 2.5%), and Education Instruction & Library (14 | 2.5%).
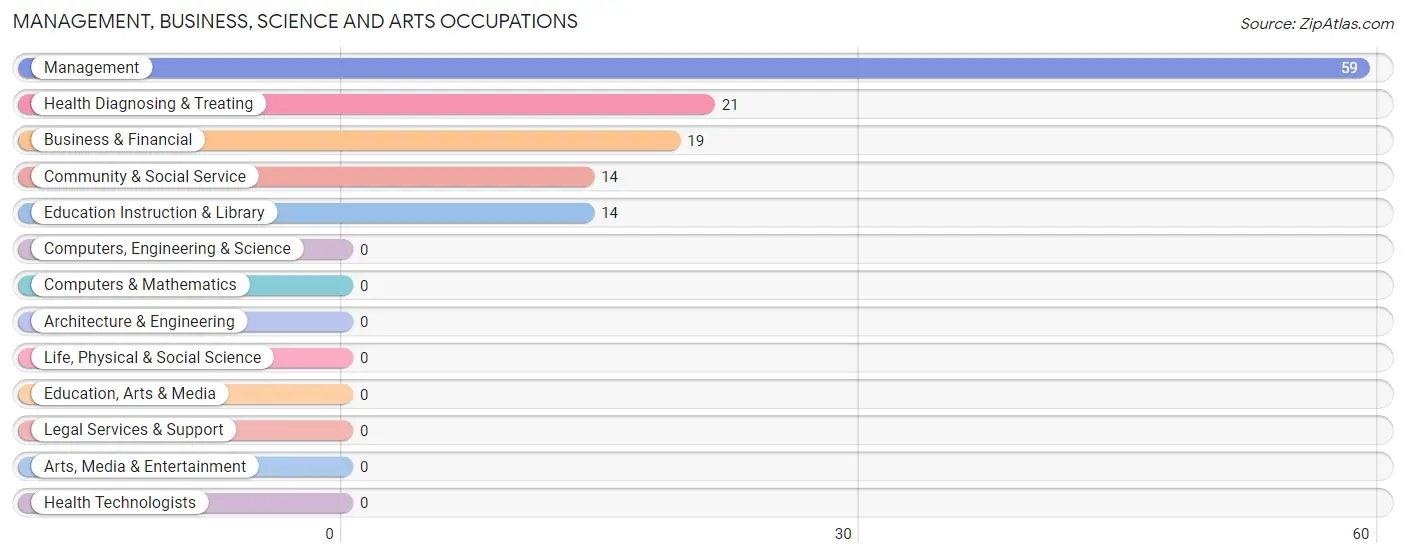
Management, Business, Science and Arts Occupations by Sex
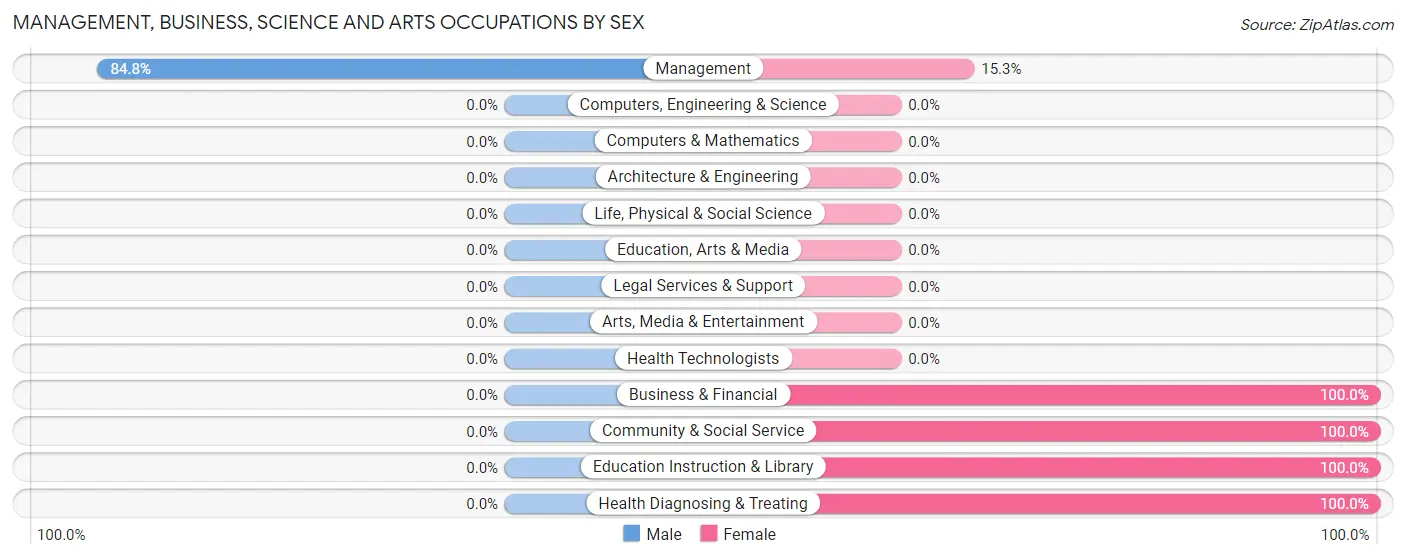
| Occupation | Male | Female |
| Management | 50 (84.8%) | 9 (15.2%) |
| Business & Financial | 0 (0.0%) | 19 (100.0%) |
| Computers, Engineering & Science | 0 (0.0%) | 0 (0.0%) |
| Computers & Mathematics | 0 (0.0%) | 0 (0.0%) |
| Architecture & Engineering | 0 (0.0%) | 0 (0.0%) |
| Life, Physical & Social Science | 0 (0.0%) | 0 (0.0%) |
| Community & Social Service | 0 (0.0%) | 14 (100.0%) |
| Education, Arts & Media | 0 (0.0%) | 0 (0.0%) |
| Legal Services & Support | 0 (0.0%) | 0 (0.0%) |
| Education Instruction & Library | 0 (0.0%) | 14 (100.0%) |
| Arts, Media & Entertainment | 0 (0.0%) | 0 (0.0%) |
| Health Diagnosing & Treating | 0 (0.0%) | 21 (100.0%) |
| Health Technologists | 0 (0.0%) | 0 (0.0%) |
| Total (Category) | 50 (44.3%) | 63 (55.7%) |
| Total (Overall) | 411 (74.3%) | 142 (25.7%) |
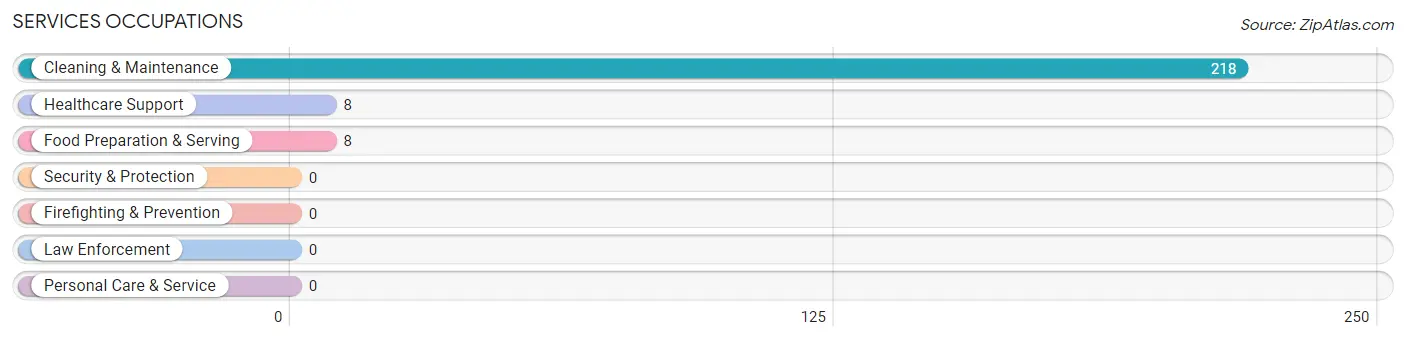
Services Occupations
The most common Services occupations in Buffalo are Cleaning & Maintenance (218 | 39.4%), Healthcare Support (8 | 1.5%), and Food Preparation & Serving (8 | 1.5%).
Services Occupations by Sex
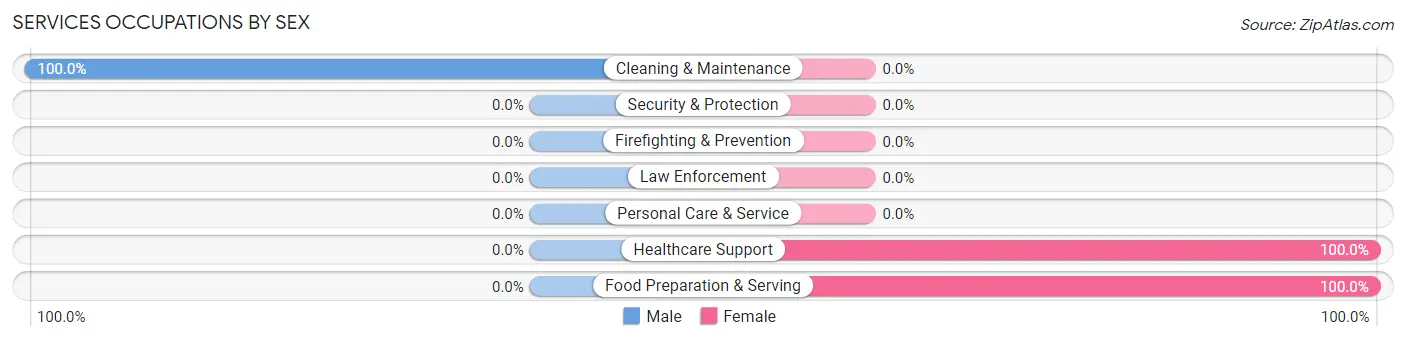
| Occupation | Male | Female |
| Healthcare Support | 0 (0.0%) | 8 (100.0%) |
| Security & Protection | 0 (0.0%) | 0 (0.0%) |
| Firefighting & Prevention | 0 (0.0%) | 0 (0.0%) |
| Law Enforcement | 0 (0.0%) | 0 (0.0%) |
| Food Preparation & Serving | 0 (0.0%) | 8 (100.0%) |
| Cleaning & Maintenance | 218 (100.0%) | 0 (0.0%) |
| Personal Care & Service | 0 (0.0%) | 0 (0.0%) |
| Total (Category) | 218 (93.2%) | 16 (6.8%) |
| Total (Overall) | 411 (74.3%) | 142 (25.7%) |
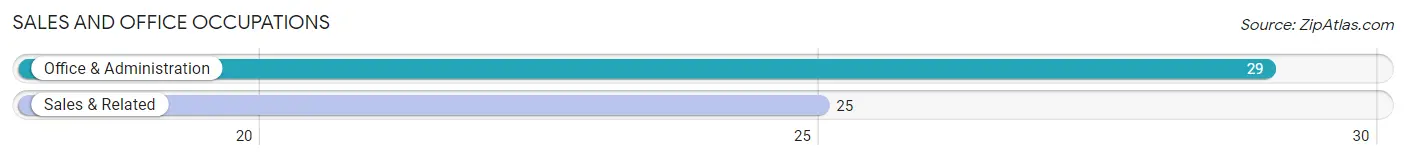
Sales and Office Occupations
The most common Sales and Office occupations in Buffalo are Office & Administration (29 | 5.2%), and Sales & Related (25 | 4.5%).
Sales and Office Occupations by Sex

| Occupation | Male | Female |
| Sales & Related | 25 (100.0%) | 0 (0.0%) |
| Office & Administration | 6 (20.7%) | 23 (79.3%) |
| Total (Category) | 31 (57.4%) | 23 (42.6%) |
| Total (Overall) | 411 (74.3%) | 142 (25.7%) |
Natural Resources, Construction and Maintenance Occupations

Natural Resources, Construction and Maintenance Occupations by Sex
| Occupation | Male | Female |
| Farming, Fishing & Forestry | 0 (0.0%) | 0 (0.0%) |
| Construction & Extraction | 0 (0.0%) | 0 (0.0%) |
| Installation, Maintenance & Repair | 0 (0.0%) | 0 (0.0%) |
| Total (Category) | 0 (0.0%) | 0 (0.0%) |
| Total (Overall) | 411 (74.3%) | 142 (25.7%) |
Production, Transportation and Moving Occupations
The most common Production, Transportation and Moving occupations in Buffalo are Production (103 | 18.6%), Transportation (27 | 4.9%), and Material Moving (22 | 4.0%).
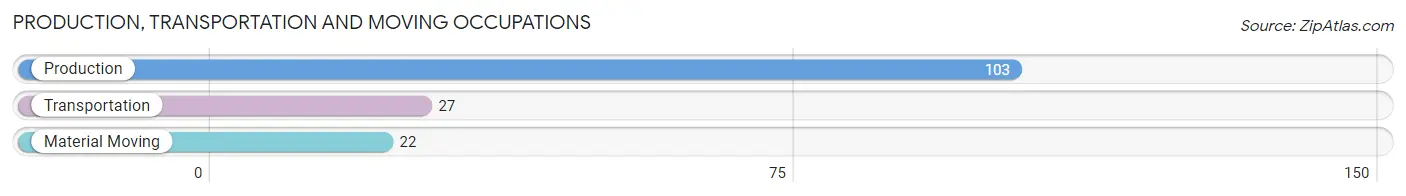
Production, Transportation and Moving Occupations by Sex
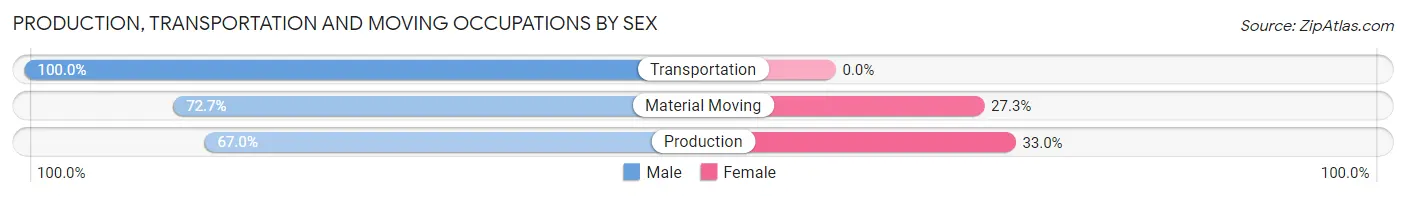
| Occupation | Male | Female |
| Production | 69 (67.0%) | 34 (33.0%) |
| Transportation | 27 (100.0%) | 0 (0.0%) |
| Material Moving | 16 (72.7%) | 6 (27.3%) |
| Total (Category) | 112 (73.7%) | 40 (26.3%) |
| Total (Overall) | 411 (74.3%) | 142 (25.7%) |
Employment Industries by Sex in Buffalo
Employment Industries in Buffalo
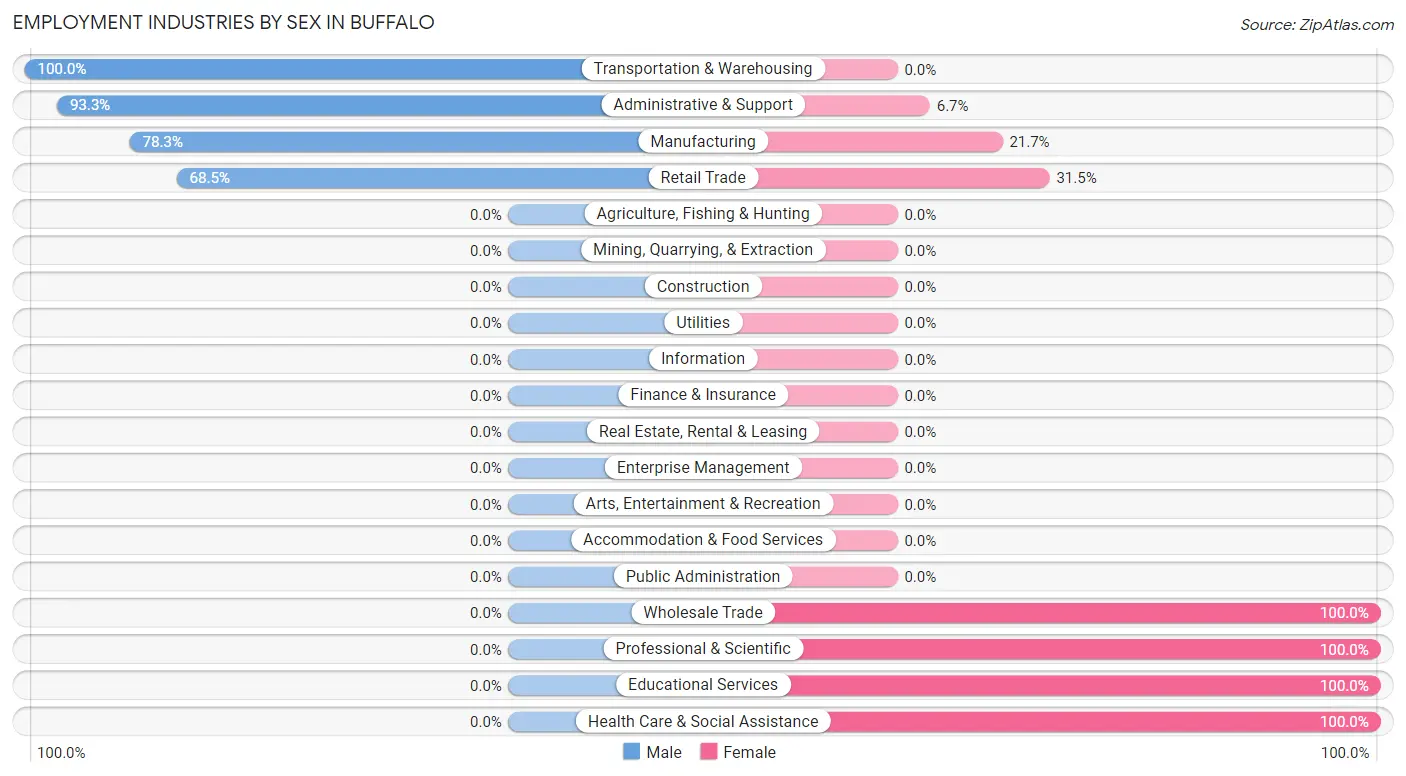
The major employment industries in Buffalo include Administrative & Support (224 | 40.5%), Manufacturing (184 | 33.3%), Retail Trade (54 | 9.8%), Health Care & Social Assistance (22 | 4.0%), and Wholesale Trade (21 | 3.8%).
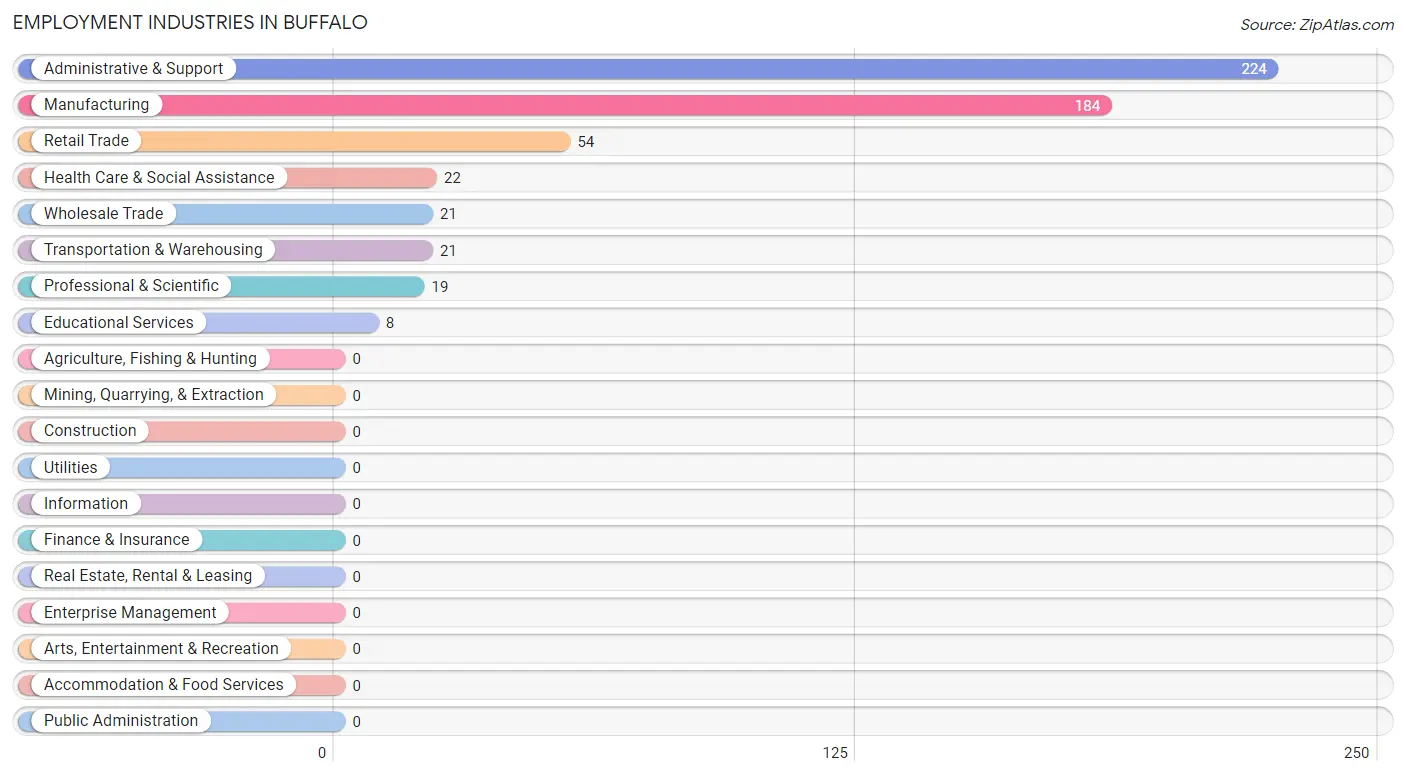
Employment Industries by Sex in Buffalo
The Buffalo industries that see more men than women are Transportation & Warehousing (100.0%), Administrative & Support (93.3%), and Manufacturing (78.3%), whereas the industries that tend to have a higher number of women are Wholesale Trade (100.0%), Professional & Scientific (100.0%), and Educational Services (100.0%).
| Industry | Male | Female |
| Agriculture, Fishing & Hunting | 0 (0.0%) | 0 (0.0%) |
| Mining, Quarrying, & Extraction | 0 (0.0%) | 0 (0.0%) |
| Construction | 0 (0.0%) | 0 (0.0%) |
| Manufacturing | 144 (78.3%) | 40 (21.7%) |
| Wholesale Trade | 0 (0.0%) | 21 (100.0%) |
| Retail Trade | 37 (68.5%) | 17 (31.5%) |
| Transportation & Warehousing | 21 (100.0%) | 0 (0.0%) |
| Utilities | 0 (0.0%) | 0 (0.0%) |
| Information | 0 (0.0%) | 0 (0.0%) |
| Finance & Insurance | 0 (0.0%) | 0 (0.0%) |
| Real Estate, Rental & Leasing | 0 (0.0%) | 0 (0.0%) |
| Professional & Scientific | 0 (0.0%) | 19 (100.0%) |
| Enterprise Management | 0 (0.0%) | 0 (0.0%) |
| Administrative & Support | 209 (93.3%) | 15 (6.7%) |
| Educational Services | 0 (0.0%) | 8 (100.0%) |
| Health Care & Social Assistance | 0 (0.0%) | 22 (100.0%) |
| Arts, Entertainment & Recreation | 0 (0.0%) | 0 (0.0%) |
| Accommodation & Food Services | 0 (0.0%) | 0 (0.0%) |
| Public Administration | 0 (0.0%) | 0 (0.0%) |
| Total | 411 (74.3%) | 142 (25.7%) |
Education in Buffalo
School Enrollment in Buffalo
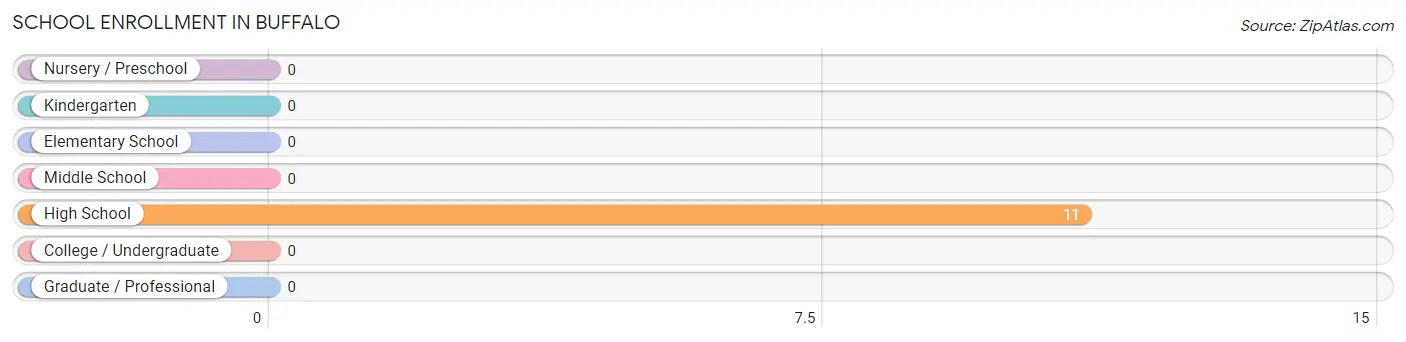
| School Level | # Students | % Students |
| Nursery / Preschool | 0 | 0.0% |
| Kindergarten | 0 | 0.0% |
| Elementary School | 0 | 0.0% |
| Middle School | 0 | 0.0% |
| High School | 11 | 100.0% |
| College / Undergraduate | 0 | 0.0% |
| Graduate / Professional | 0 | 0.0% |
| Total | 11 | 100.0% |
School Enrollment by Age by Funding Source in Buffalo
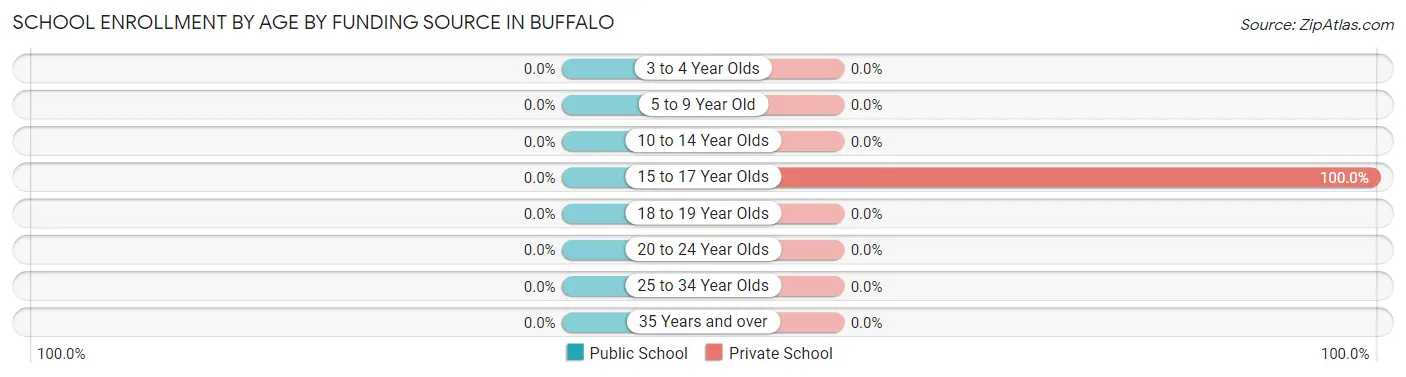
| Age Bracket | Public School | Private School |
| 3 to 4 Year Olds | 0 (0.0%) | 0 (0.0%) |
| 5 to 9 Year Old | 0 (0.0%) | 0 (0.0%) |
| 10 to 14 Year Olds | 0 (0.0%) | 0 (0.0%) |
| 15 to 17 Year Olds | 0 (0.0%) | 11 (100.0%) |
| 18 to 19 Year Olds | 0 (0.0%) | 0 (0.0%) |
| 20 to 24 Year Olds | 0 (0.0%) | 0 (0.0%) |
| 25 to 34 Year Olds | 0 (0.0%) | 0 (0.0%) |
| 35 Years and over | 0 (0.0%) | 0 (0.0%) |
| Total | 0 (0.0%) | 11 (100.0%) |
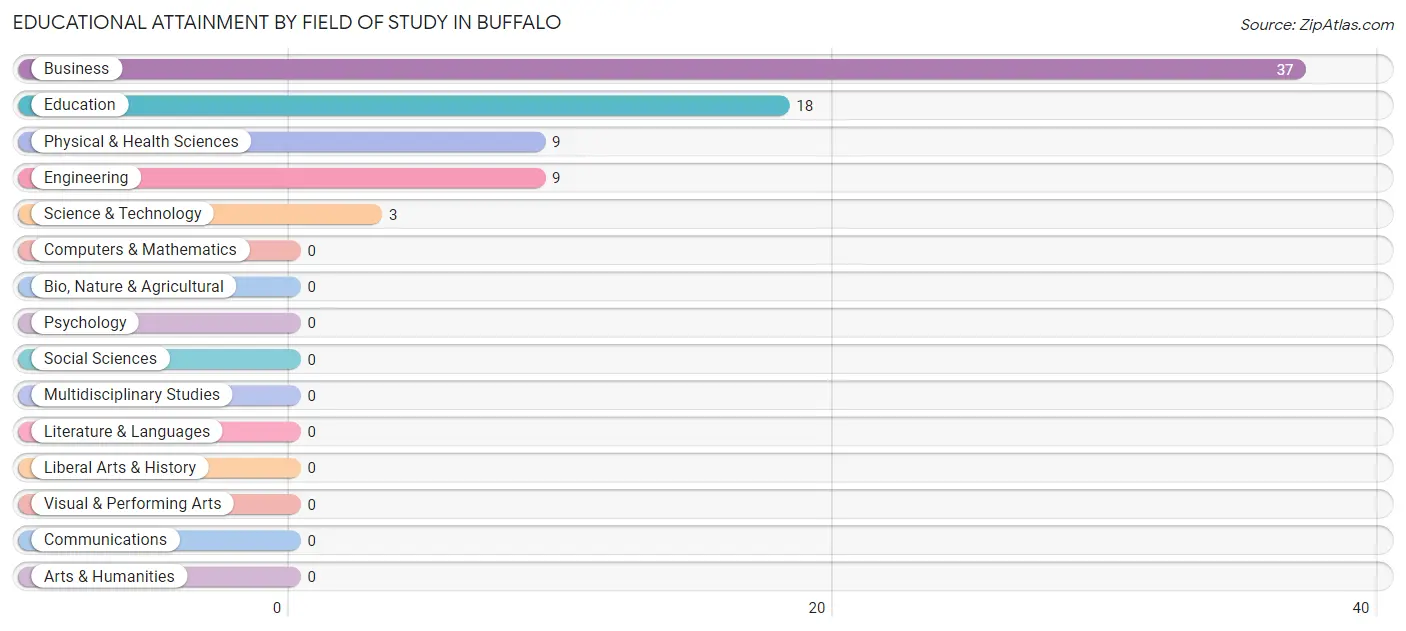
Educational Attainment by Field of Study in Buffalo
Business (37 | 48.7%), education (18 | 23.7%), physical & health sciences (9 | 11.8%), engineering (9 | 11.8%), and science & technology (3 | 4.0%) are the most common fields of study among 76 individuals in Buffalo who have obtained a bachelor's degree or higher.
| Field of Study | # Graduates | % Graduates |
| Computers & Mathematics | 0 | 0.0% |
| Bio, Nature & Agricultural | 0 | 0.0% |
| Physical & Health Sciences | 9 | 11.8% |
| Psychology | 0 | 0.0% |
| Social Sciences | 0 | 0.0% |
| Engineering | 9 | 11.8% |
| Multidisciplinary Studies | 0 | 0.0% |
| Science & Technology | 3 | 4.0% |
| Business | 37 | 48.7% |
| Education | 18 | 23.7% |
| Literature & Languages | 0 | 0.0% |
| Liberal Arts & History | 0 | 0.0% |
| Visual & Performing Arts | 0 | 0.0% |
| Communications | 0 | 0.0% |
| Arts & Humanities | 0 | 0.0% |
| Total | 76 | 100.0% |
Transportation & Commute in Buffalo
Vehicle Availability by Sex in Buffalo
The most prevalent vehicle ownership categories in Buffalo are males with 5 or more vehicles (262, accounting for 63.7%) and females with 5 or more vehicles (17, making up 195.5%).
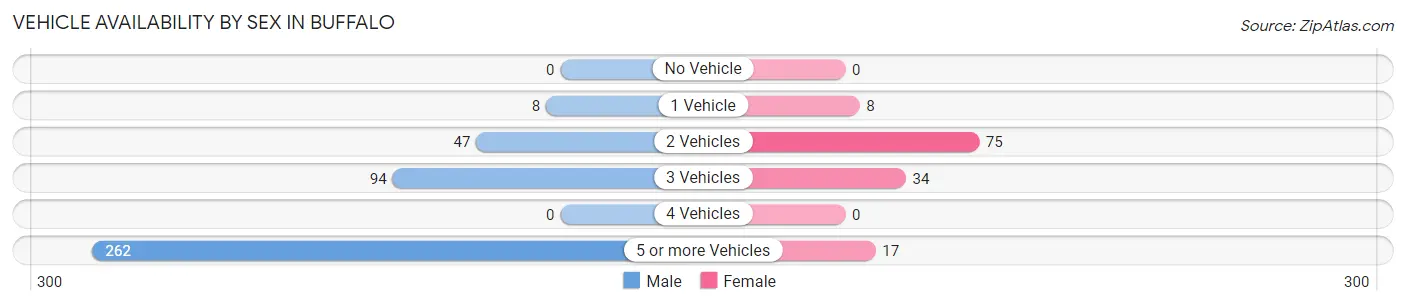
| Vehicles Available | Male | Female |
| No Vehicle | 0 (0.0%) | 0 (0.0%) |
| 1 Vehicle | 8 (1.9%) | 8 (6.0%) |
| 2 Vehicles | 47 (11.4%) | 75 (56.0%) |
| 3 Vehicles | 94 (22.9%) | 34 (25.4%) |
| 4 Vehicles | 0 (0.0%) | 0 (0.0%) |
| 5 or more Vehicles | 262 (63.7%) | 17 (12.7%) |
| Total | 411 (100.0%) | 134 (100.0%) |
Commute Time in Buffalo
The most frequently occuring commute durations in Buffalo are 20 to 24 minutes (278 commuters, 53.6%), 25 to 29 minutes (94 commuters, 18.1%), and 60 to 89 minutes (37 commuters, 7.1%).
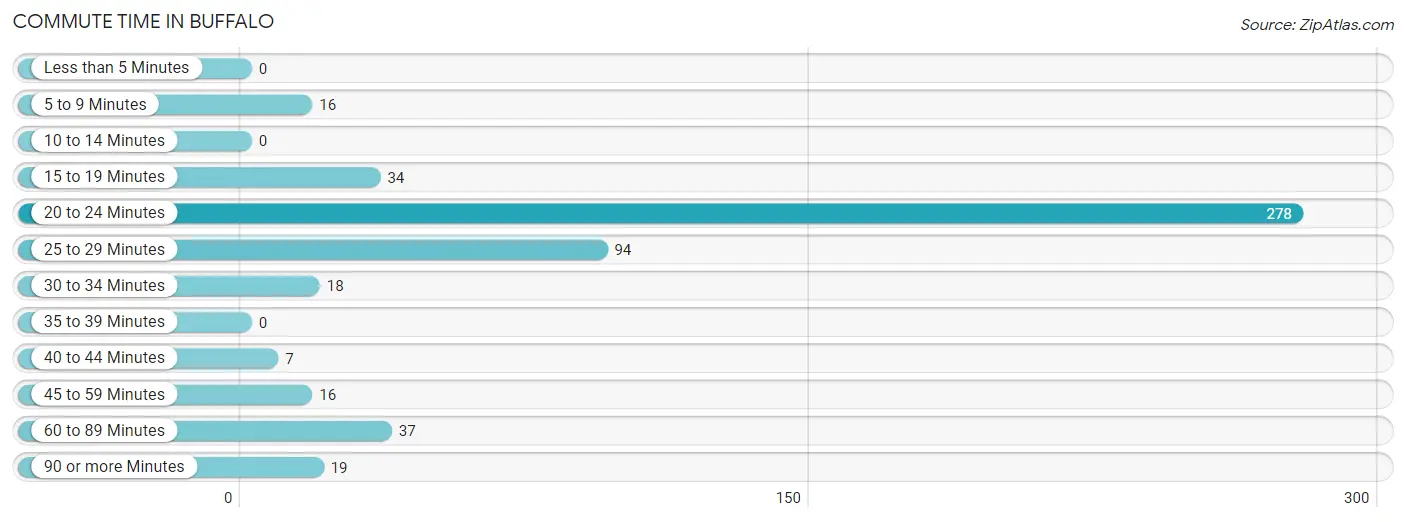
| Commute Time | # Commuters | % Commuters |
| Less than 5 Minutes | 0 | 0.0% |
| 5 to 9 Minutes | 16 | 3.1% |
| 10 to 14 Minutes | 0 | 0.0% |
| 15 to 19 Minutes | 34 | 6.6% |
| 20 to 24 Minutes | 278 | 53.6% |
| 25 to 29 Minutes | 94 | 18.1% |
| 30 to 34 Minutes | 18 | 3.5% |
| 35 to 39 Minutes | 0 | 0.0% |
| 40 to 44 Minutes | 7 | 1.3% |
| 45 to 59 Minutes | 16 | 3.1% |
| 60 to 89 Minutes | 37 | 7.1% |
| 90 or more Minutes | 19 | 3.7% |
Commute Time by Sex in Buffalo
The most common commute times in Buffalo are 20 to 24 minutes (224 commuters, 57.0%) for males and 20 to 24 minutes (54 commuters, 42.9%) for females.
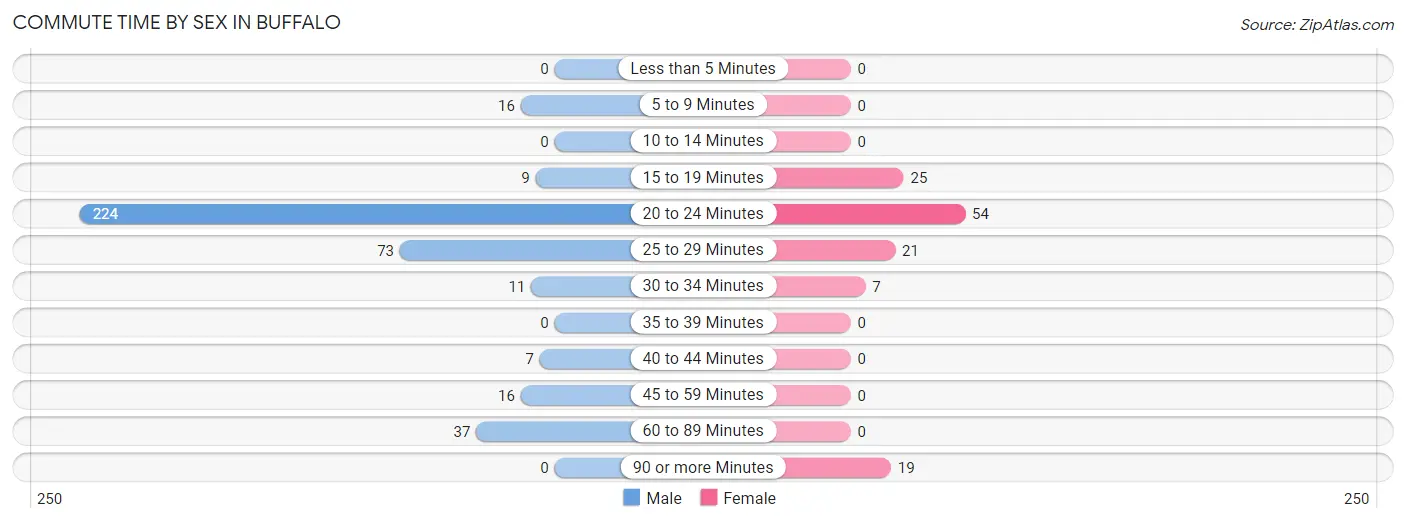
| Commute Time | Male | Female |
| Less than 5 Minutes | 0 (0.0%) | 0 (0.0%) |
| 5 to 9 Minutes | 16 (4.1%) | 0 (0.0%) |
| 10 to 14 Minutes | 0 (0.0%) | 0 (0.0%) |
| 15 to 19 Minutes | 9 (2.3%) | 25 (19.8%) |
| 20 to 24 Minutes | 224 (57.0%) | 54 (42.9%) |
| 25 to 29 Minutes | 73 (18.6%) | 21 (16.7%) |
| 30 to 34 Minutes | 11 (2.8%) | 7 (5.6%) |
| 35 to 39 Minutes | 0 (0.0%) | 0 (0.0%) |
| 40 to 44 Minutes | 7 (1.8%) | 0 (0.0%) |
| 45 to 59 Minutes | 16 (4.1%) | 0 (0.0%) |
| 60 to 89 Minutes | 37 (9.4%) | 0 (0.0%) |
| 90 or more Minutes | 0 (0.0%) | 19 (15.1%) |
Time of Departure to Work by Sex in Buffalo
The most frequent times of departure to work in Buffalo are 7:00 AM to 7:29 AM (232, 59.0%) for males and 12:00 AM to 4:59 AM (35, 27.8%) for females.
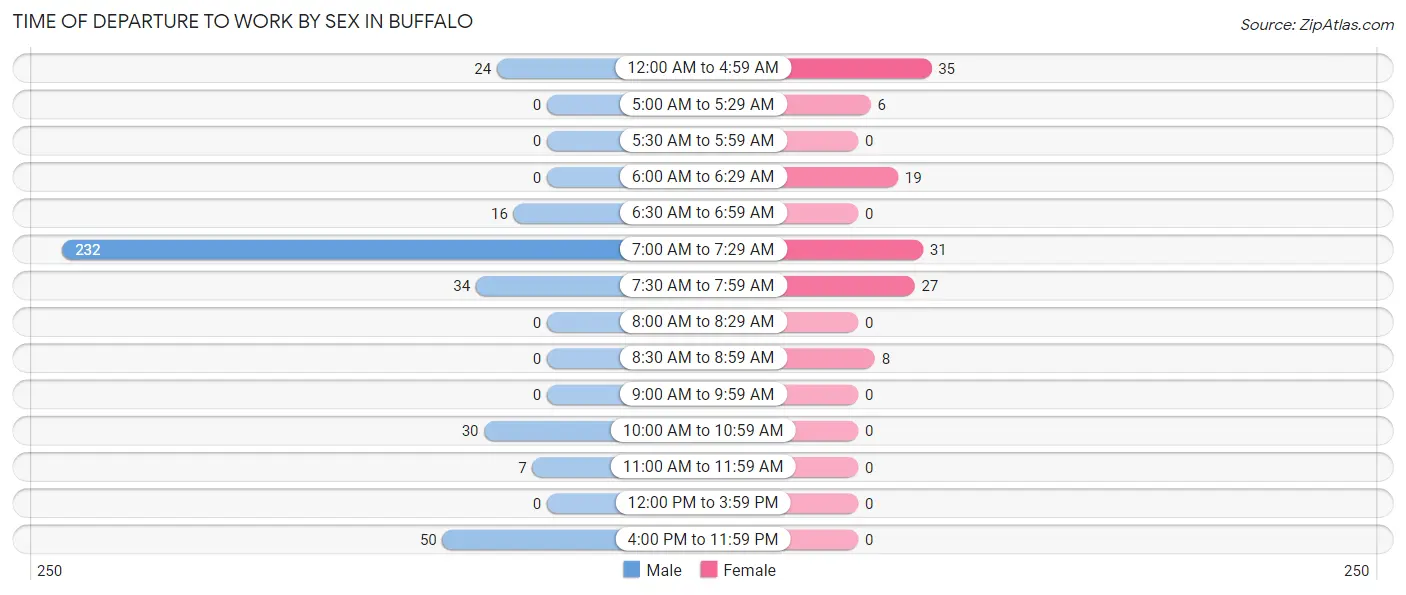
| Time of Departure | Male | Female |
| 12:00 AM to 4:59 AM | 24 (6.1%) | 35 (27.8%) |
| 5:00 AM to 5:29 AM | 0 (0.0%) | 6 (4.8%) |
| 5:30 AM to 5:59 AM | 0 (0.0%) | 0 (0.0%) |
| 6:00 AM to 6:29 AM | 0 (0.0%) | 19 (15.1%) |
| 6:30 AM to 6:59 AM | 16 (4.1%) | 0 (0.0%) |
| 7:00 AM to 7:29 AM | 232 (59.0%) | 31 (24.6%) |
| 7:30 AM to 7:59 AM | 34 (8.6%) | 27 (21.4%) |
| 8:00 AM to 8:29 AM | 0 (0.0%) | 0 (0.0%) |
| 8:30 AM to 8:59 AM | 0 (0.0%) | 8 (6.4%) |
| 9:00 AM to 9:59 AM | 0 (0.0%) | 0 (0.0%) |
| 10:00 AM to 10:59 AM | 30 (7.6%) | 0 (0.0%) |
| 11:00 AM to 11:59 AM | 7 (1.8%) | 0 (0.0%) |
| 12:00 PM to 3:59 PM | 0 (0.0%) | 0 (0.0%) |
| 4:00 PM to 11:59 PM | 50 (12.7%) | 0 (0.0%) |
| Total | 393 (100.0%) | 126 (100.0%) |
Housing Occupancy in Buffalo
Occupancy by Ownership in Buffalo
Of the total 310 dwellings in Buffalo, owner-occupied units account for 300 (96.8%), while renter-occupied units make up 10 (3.2%).
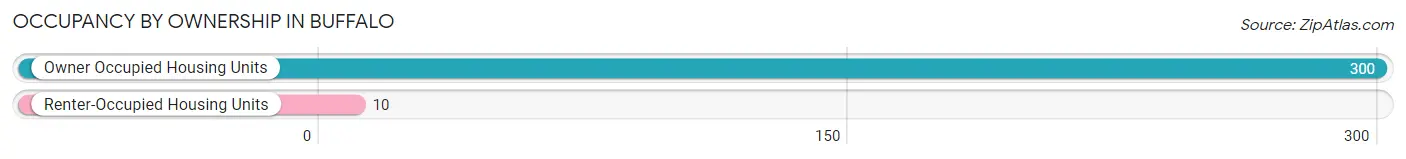
| Occupancy | # Housing Units | % Housing Units |
| Owner Occupied Housing Units | 300 | 96.8% |
| Renter-Occupied Housing Units | 10 | 3.2% |
| Total Occupied Housing Units | 310 | 100.0% |
Occupancy by Household Size in Buffalo
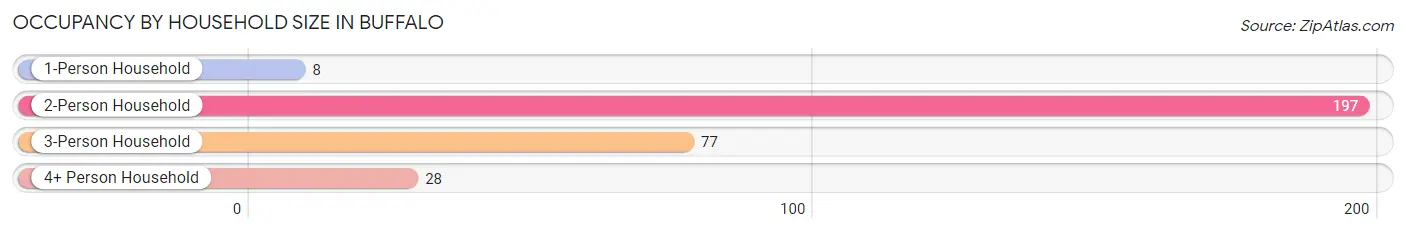
| Household Size | # Housing Units | % Housing Units |
| 1-Person Household | 8 | 2.6% |
| 2-Person Household | 197 | 63.5% |
| 3-Person Household | 77 | 24.8% |
| 4+ Person Household | 28 | 9.0% |
| Total Housing Units | 310 | 100.0% |
Occupancy by Ownership by Household Size in Buffalo
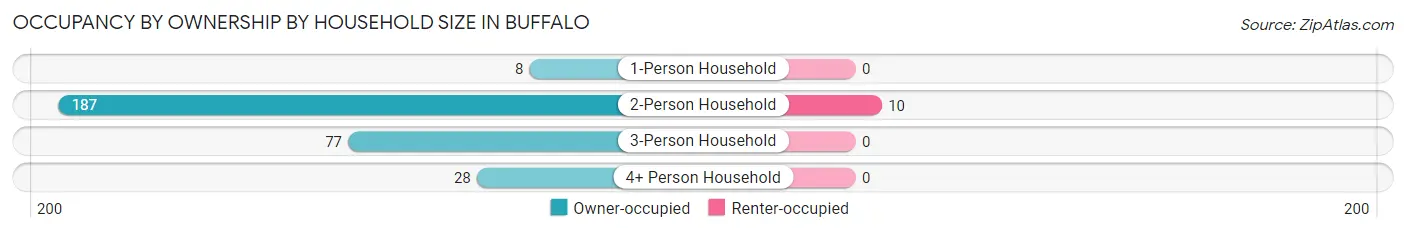
| Household Size | Owner-occupied | Renter-occupied |
| 1-Person Household | 8 (100.0%) | 0 (0.0%) |
| 2-Person Household | 187 (94.9%) | 10 (5.1%) |
| 3-Person Household | 77 (100.0%) | 0 (0.0%) |
| 4+ Person Household | 28 (100.0%) | 0 (0.0%) |
| Total Housing Units | 300 (96.8%) | 10 (3.2%) |
Occupancy by Educational Attainment in Buffalo
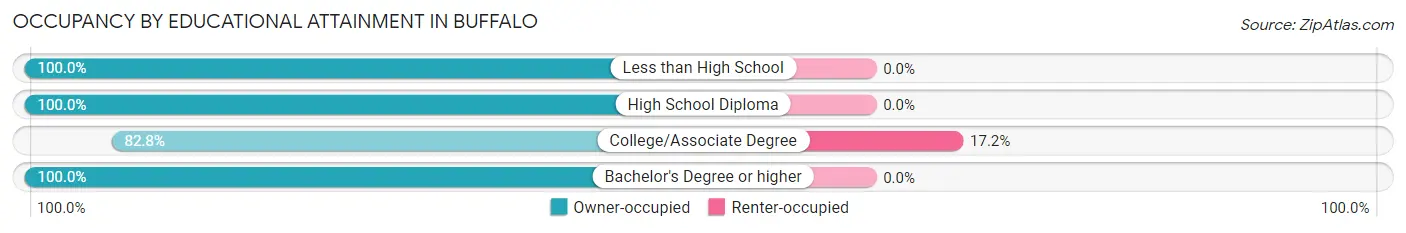
| Household Size | Owner-occupied | Renter-occupied |
| Less than High School | 120 (100.0%) | 0 (0.0%) |
| High School Diploma | 105 (100.0%) | 0 (0.0%) |
| College/Associate Degree | 48 (82.8%) | 10 (17.2%) |
| Bachelor's Degree or higher | 27 (100.0%) | 0 (0.0%) |
Occupancy by Age of Householder in Buffalo
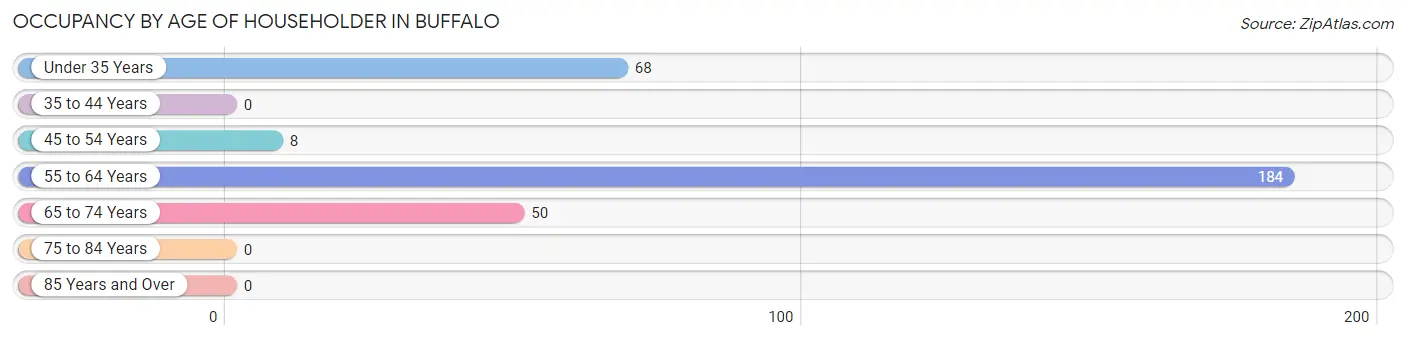
| Age Bracket | # Households | % Households |
| Under 35 Years | 68 | 21.9% |
| 35 to 44 Years | 0 | 0.0% |
| 45 to 54 Years | 8 | 2.6% |
| 55 to 64 Years | 184 | 59.4% |
| 65 to 74 Years | 50 | 16.1% |
| 75 to 84 Years | 0 | 0.0% |
| 85 Years and Over | 0 | 0.0% |
| Total | 310 | 100.0% |
Housing Finances in Buffalo
Median Income by Occupancy in Buffalo
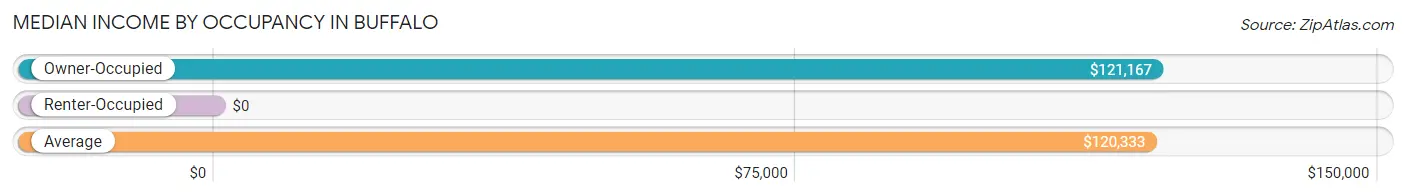
| Occupancy Type | # Households | Median Income |
| Owner-Occupied | 300 (96.8%) | $121,167 |
| Renter-Occupied | 10 (3.2%) | $0 |
| Average | 310 (100.0%) | $120,333 |
Occupancy by Householder Income Bracket in Buffalo
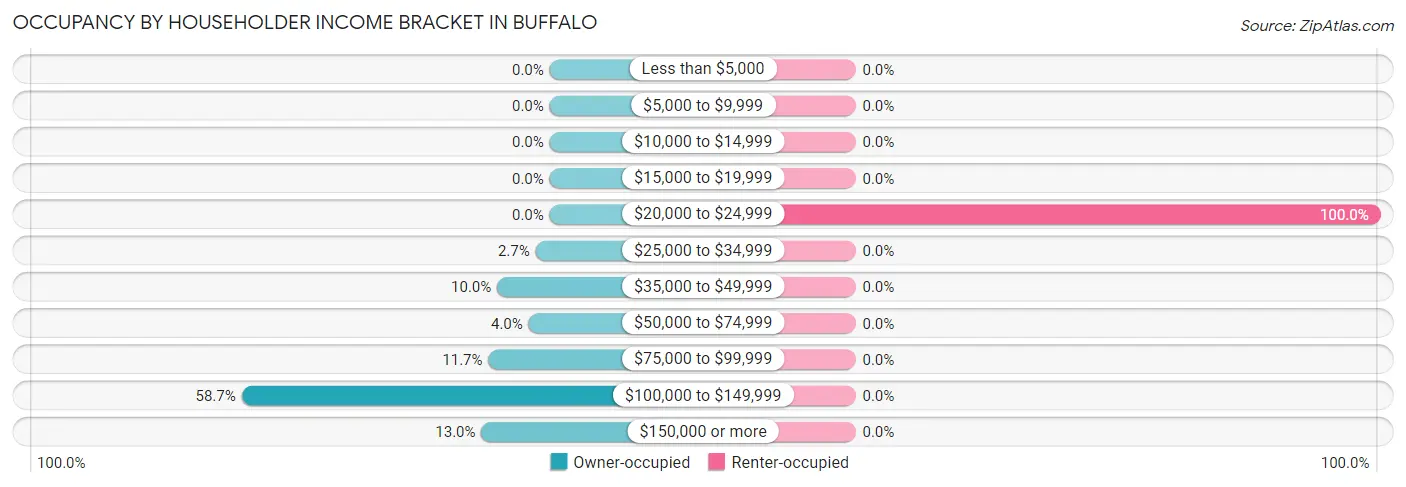
| Income Bracket | Owner-occupied | Renter-occupied |
| Less than $5,000 | 0 (0.0%) | 0 (0.0%) |
| $5,000 to $9,999 | 0 (0.0%) | 0 (0.0%) |
| $10,000 to $14,999 | 0 (0.0%) | 0 (0.0%) |
| $15,000 to $19,999 | 0 (0.0%) | 0 (0.0%) |
| $20,000 to $24,999 | 0 (0.0%) | 10 (100.0%) |
| $25,000 to $34,999 | 8 (2.7%) | 0 (0.0%) |
| $35,000 to $49,999 | 30 (10.0%) | 0 (0.0%) |
| $50,000 to $74,999 | 12 (4.0%) | 0 (0.0%) |
| $75,000 to $99,999 | 35 (11.7%) | 0 (0.0%) |
| $100,000 to $149,999 | 176 (58.7%) | 0 (0.0%) |
| $150,000 or more | 39 (13.0%) | 0 (0.0%) |
| Total | 300 (100.0%) | 10 (100.0%) |
Monthly Housing Cost Tiers in Buffalo
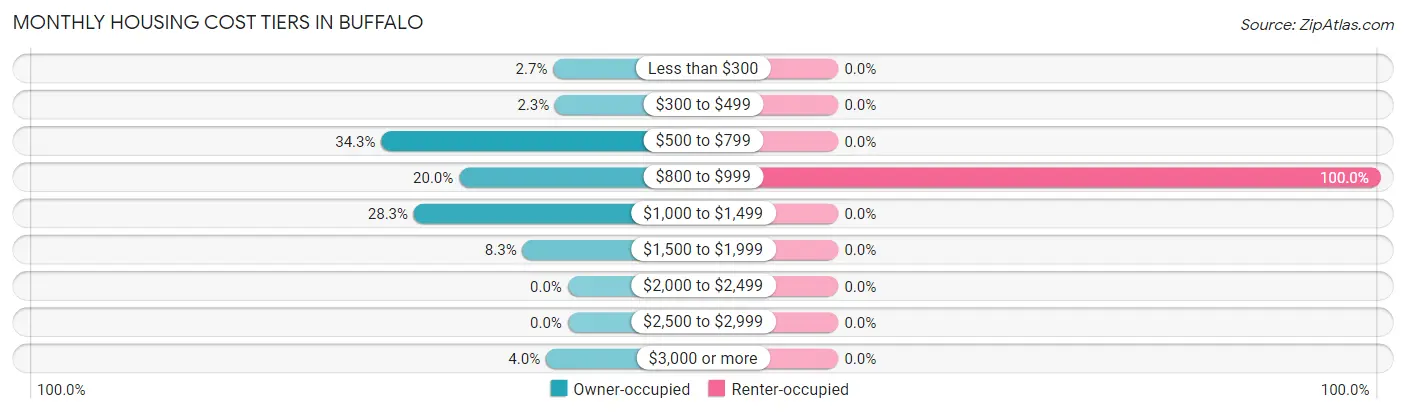
| Monthly Cost | Owner-occupied | Renter-occupied |
| Less than $300 | 8 (2.7%) | 0 (0.0%) |
| $300 to $499 | 7 (2.3%) | 0 (0.0%) |
| $500 to $799 | 103 (34.3%) | 0 (0.0%) |
| $800 to $999 | 60 (20.0%) | 10 (100.0%) |
| $1,000 to $1,499 | 85 (28.3%) | 0 (0.0%) |
| $1,500 to $1,999 | 25 (8.3%) | 0 (0.0%) |
| $2,000 to $2,499 | 0 (0.0%) | 0 (0.0%) |
| $2,500 to $2,999 | 0 (0.0%) | 0 (0.0%) |
| $3,000 or more | 12 (4.0%) | 0 (0.0%) |
| Total | 300 (100.0%) | 10 (100.0%) |
Physical Housing Characteristics in Buffalo
Housing Structures in Buffalo
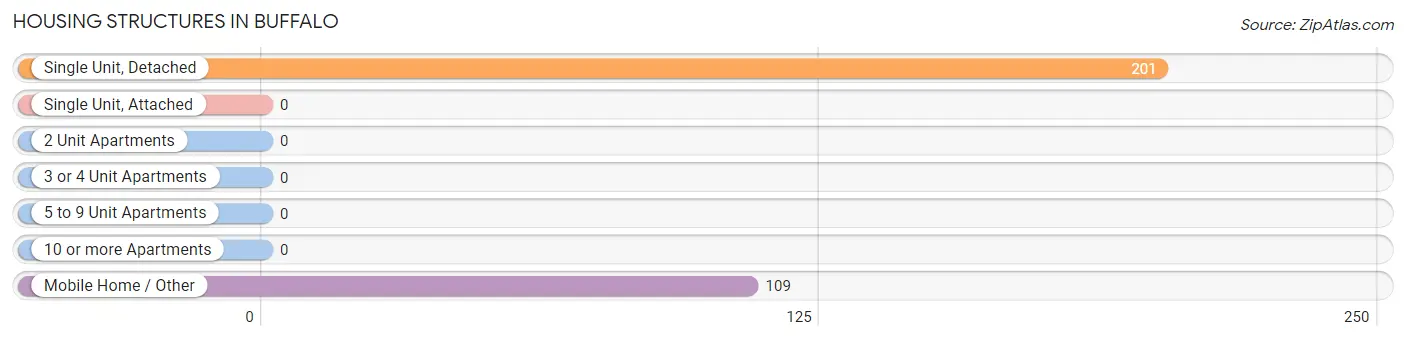
| Structure Type | # Housing Units | % Housing Units |
| Single Unit, Detached | 201 | 64.8% |
| Single Unit, Attached | 0 | 0.0% |
| 2 Unit Apartments | 0 | 0.0% |
| 3 or 4 Unit Apartments | 0 | 0.0% |
| 5 to 9 Unit Apartments | 0 | 0.0% |
| 10 or more Apartments | 0 | 0.0% |
| Mobile Home / Other | 109 | 35.2% |
| Total | 310 | 100.0% |
Housing Structures by Occupancy in Buffalo
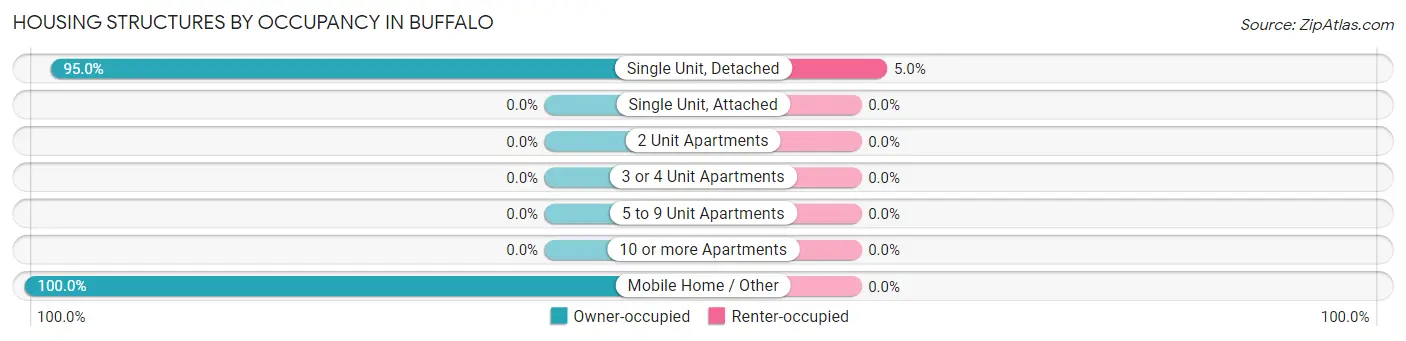
| Structure Type | Owner-occupied | Renter-occupied |
| Single Unit, Detached | 191 (95.0%) | 10 (5.0%) |
| Single Unit, Attached | 0 (0.0%) | 0 (0.0%) |
| 2 Unit Apartments | 0 (0.0%) | 0 (0.0%) |
| 3 or 4 Unit Apartments | 0 (0.0%) | 0 (0.0%) |
| 5 to 9 Unit Apartments | 0 (0.0%) | 0 (0.0%) |
| 10 or more Apartments | 0 (0.0%) | 0 (0.0%) |
| Mobile Home / Other | 109 (100.0%) | 0 (0.0%) |
| Total | 300 (96.8%) | 10 (3.2%) |
Housing Structures by Number of Rooms in Buffalo
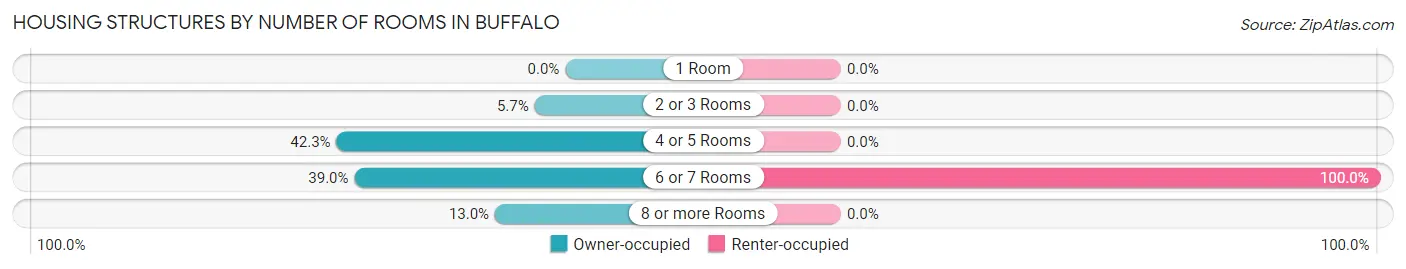
| Number of Rooms | Owner-occupied | Renter-occupied |
| 1 Room | 0 (0.0%) | 0 (0.0%) |
| 2 or 3 Rooms | 17 (5.7%) | 0 (0.0%) |
| 4 or 5 Rooms | 127 (42.3%) | 0 (0.0%) |
| 6 or 7 Rooms | 117 (39.0%) | 10 (100.0%) |
| 8 or more Rooms | 39 (13.0%) | 0 (0.0%) |
| Total | 300 (100.0%) | 10 (100.0%) |
Housing Structure by Heating Type in Buffalo
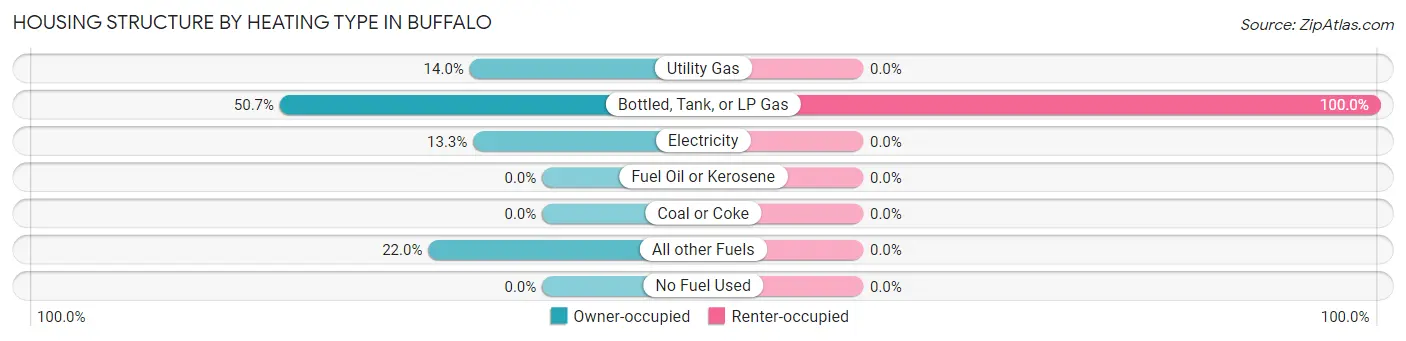
| Heating Type | Owner-occupied | Renter-occupied |
| Utility Gas | 42 (14.0%) | 0 (0.0%) |
| Bottled, Tank, or LP Gas | 152 (50.7%) | 10 (100.0%) |
| Electricity | 40 (13.3%) | 0 (0.0%) |
| Fuel Oil or Kerosene | 0 (0.0%) | 0 (0.0%) |
| Coal or Coke | 0 (0.0%) | 0 (0.0%) |
| All other Fuels | 66 (22.0%) | 0 (0.0%) |
| No Fuel Used | 0 (0.0%) | 0 (0.0%) |
| Total | 300 (100.0%) | 10 (100.0%) |
Household Vehicle Usage in Buffalo
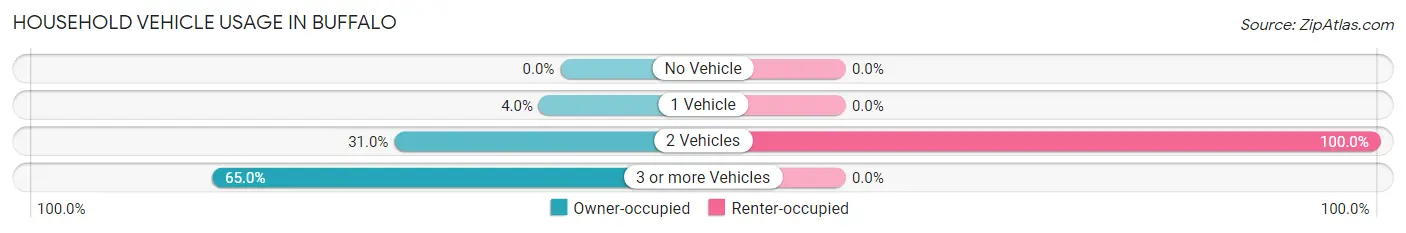
| Vehicles per Household | Owner-occupied | Renter-occupied |
| No Vehicle | 0 (0.0%) | 0 (0.0%) |
| 1 Vehicle | 12 (4.0%) | 0 (0.0%) |
| 2 Vehicles | 93 (31.0%) | 10 (100.0%) |
| 3 or more Vehicles | 195 (65.0%) | 0 (0.0%) |
| Total | 300 (100.0%) | 10 (100.0%) |
Real Estate & Mortgages in Buffalo
Real Estate and Mortgage Overview in Buffalo
| Characteristic | Without Mortgage | With Mortgage |
| Housing Units | 64 | 236 |
| Median Property Value | - | - |
| Median Household Income | $81,563 | $39 |
| Monthly Housing Costs | - | - |
| Real Estate Taxes | - | - |
Property Value by Mortgage Status in Buffalo
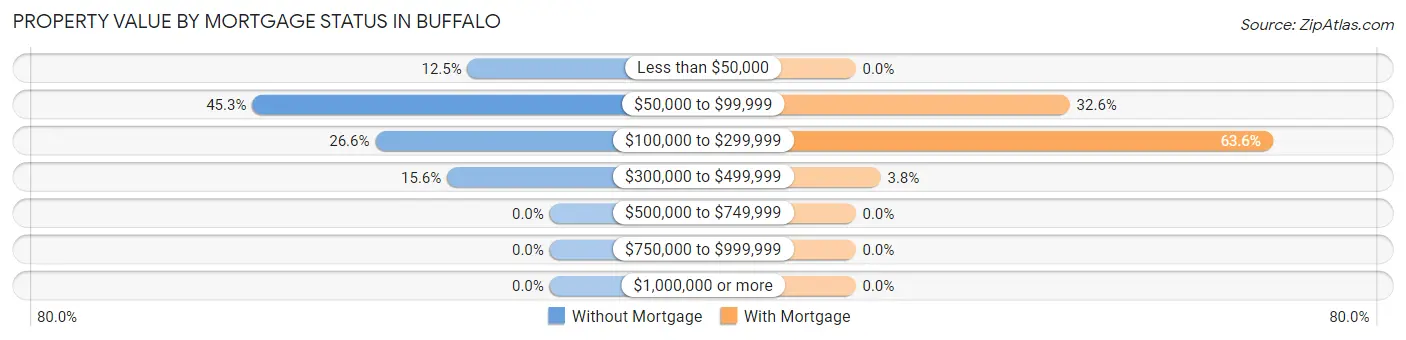
| Property Value | Without Mortgage | With Mortgage |
| Less than $50,000 | 8 (12.5%) | 0 (0.0%) |
| $50,000 to $99,999 | 29 (45.3%) | 77 (32.6%) |
| $100,000 to $299,999 | 17 (26.6%) | 150 (63.6%) |
| $300,000 to $499,999 | 10 (15.6%) | 9 (3.8%) |
| $500,000 to $749,999 | 0 (0.0%) | 0 (0.0%) |
| $750,000 to $999,999 | 0 (0.0%) | 0 (0.0%) |
| $1,000,000 or more | 0 (0.0%) | 0 (0.0%) |
| Total | 64 (100.0%) | 236 (100.0%) |
Household Income by Mortgage Status in Buffalo
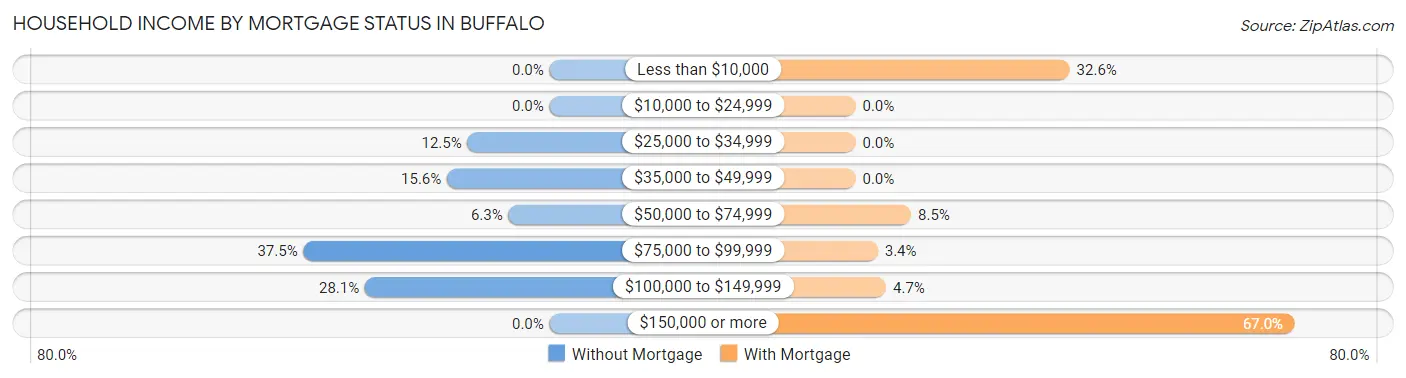
| Household Income | Without Mortgage | With Mortgage |
| Less than $10,000 | 0 (0.0%) | 77 (32.6%) |
| $10,000 to $24,999 | 0 (0.0%) | 0 (0.0%) |
| $25,000 to $34,999 | 8 (12.5%) | 0 (0.0%) |
| $35,000 to $49,999 | 10 (15.6%) | 0 (0.0%) |
| $50,000 to $74,999 | 4 (6.2%) | 20 (8.5%) |
| $75,000 to $99,999 | 24 (37.5%) | 8 (3.4%) |
| $100,000 to $149,999 | 18 (28.1%) | 11 (4.7%) |
| $150,000 or more | 0 (0.0%) | 158 (66.9%) |
| Total | 64 (100.0%) | 236 (100.0%) |
Property Value to Household Income Ratio in Buffalo
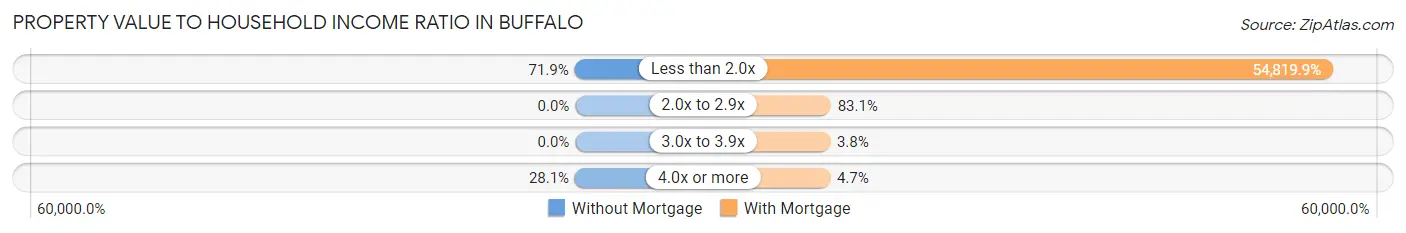
| Value-to-Income Ratio | Without Mortgage | With Mortgage |
| Less than 2.0x | 46 (71.9%) | 129,375 (54,819.9%) |
| 2.0x to 2.9x | 0 (0.0%) | 196 (83.1%) |
| 3.0x to 3.9x | 0 (0.0%) | 9 (3.8%) |
| 4.0x or more | 18 (28.1%) | 11 (4.7%) |
| Total | 64 (100.0%) | 236 (100.0%) |
Real Estate Taxes by Mortgage Status in Buffalo
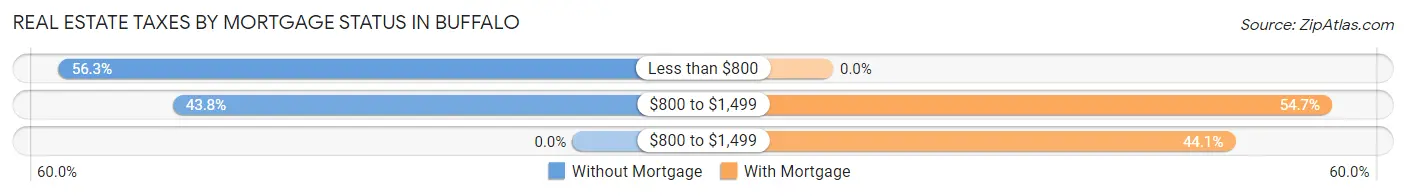
| Property Taxes | Without Mortgage | With Mortgage |
| Less than $800 | 36 (56.2%) | 0 (0.0%) |
| $800 to $1,499 | 28 (43.8%) | 129 (54.7%) |
| $800 to $1,499 | 0 (0.0%) | 104 (44.1%) |
| Total | 64 (100.0%) | 236 (100.0%) |
Health & Disability in Buffalo
Health Insurance Coverage by Age in Buffalo
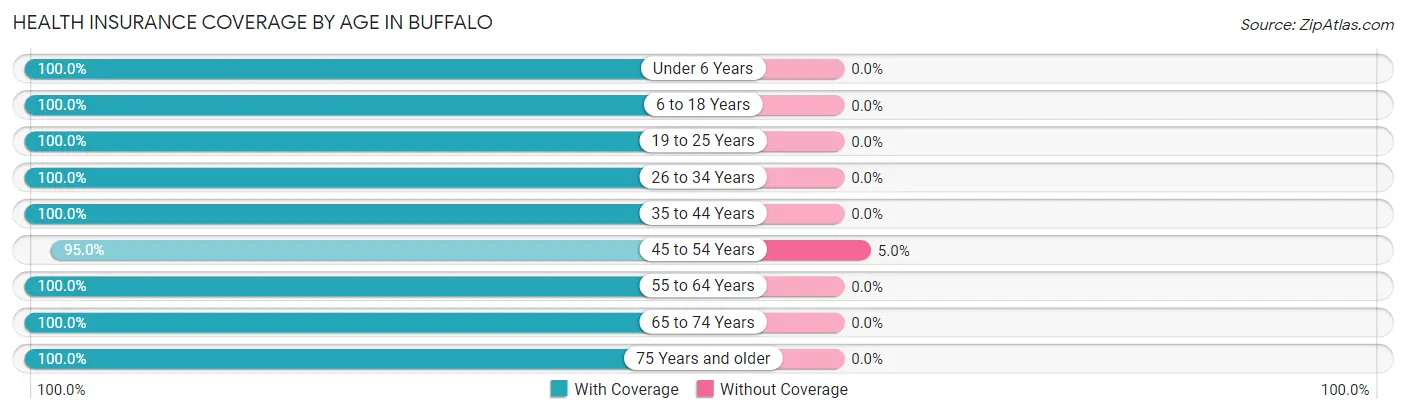
| Age Bracket | With Coverage | Without Coverage |
| Under 6 Years | 7 (100.0%) | 0 (0.0%) |
| 6 to 18 Years | 20 (100.0%) | 0 (0.0%) |
| 19 to 25 Years | 112 (100.0%) | 0 (0.0%) |
| 26 to 34 Years | 36 (100.0%) | 0 (0.0%) |
| 35 to 44 Years | 10 (100.0%) | 0 (0.0%) |
| 45 to 54 Years | 230 (95.0%) | 12 (5.0%) |
| 55 to 64 Years | 269 (100.0%) | 0 (0.0%) |
| 65 to 74 Years | 70 (100.0%) | 0 (0.0%) |
| 75 Years and older | 10 (100.0%) | 0 (0.0%) |
| Total | 764 (98.5%) | 12 (1.5%) |
Health Insurance Coverage by Citizenship Status in Buffalo
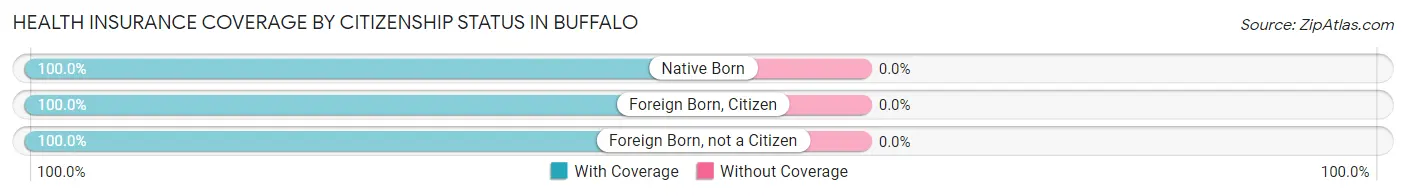
| Citizenship Status | With Coverage | Without Coverage |
| Native Born | 7 (100.0%) | 0 (0.0%) |
| Foreign Born, Citizen | 20 (100.0%) | 0 (0.0%) |
| Foreign Born, not a Citizen | 112 (100.0%) | 0 (0.0%) |
Health Insurance Coverage by Household Income in Buffalo
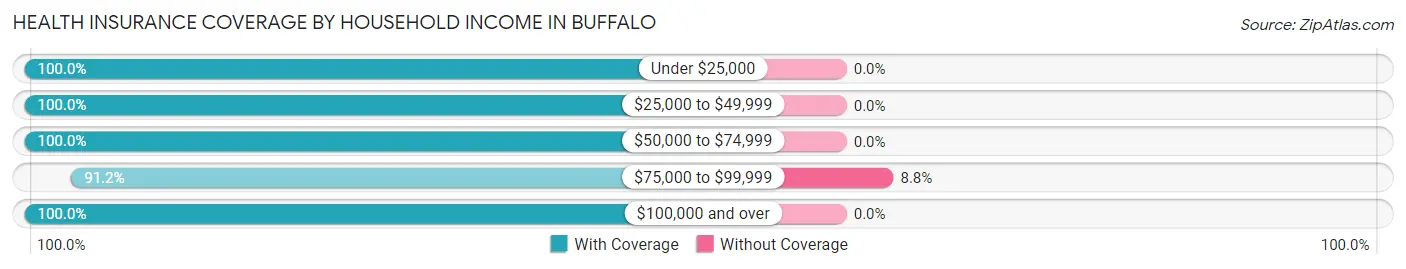
| Household Income | With Coverage | Without Coverage |
| Under $25,000 | 17 (100.0%) | 0 (0.0%) |
| $25,000 to $49,999 | 77 (100.0%) | 0 (0.0%) |
| $50,000 to $74,999 | 15 (100.0%) | 0 (0.0%) |
| $75,000 to $99,999 | 125 (91.2%) | 12 (8.8%) |
| $100,000 and over | 530 (100.0%) | 0 (0.0%) |
Public vs Private Health Insurance Coverage by Age in Buffalo
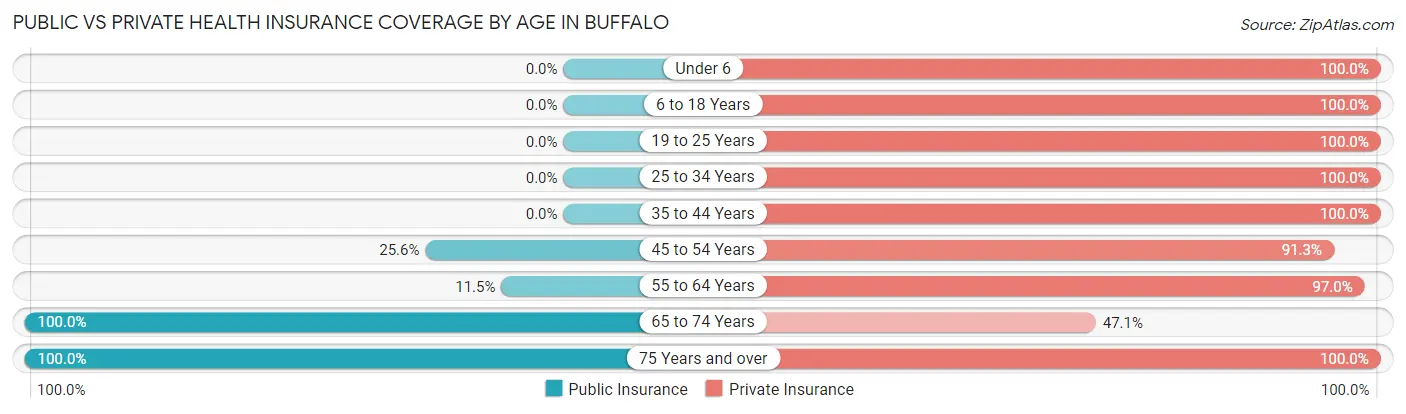
| Age Bracket | Public Insurance | Private Insurance |
| Under 6 | 0 (0.0%) | 7 (100.0%) |
| 6 to 18 Years | 0 (0.0%) | 20 (100.0%) |
| 19 to 25 Years | 0 (0.0%) | 112 (100.0%) |
| 25 to 34 Years | 0 (0.0%) | 36 (100.0%) |
| 35 to 44 Years | 0 (0.0%) | 10 (100.0%) |
| 45 to 54 Years | 62 (25.6%) | 221 (91.3%) |
| 55 to 64 Years | 31 (11.5%) | 261 (97.0%) |
| 65 to 74 Years | 70 (100.0%) | 33 (47.1%) |
| 75 Years and over | 10 (100.0%) | 10 (100.0%) |
| Total | 173 (22.3%) | 710 (91.5%) |
Disability Status by Sex by Age in Buffalo
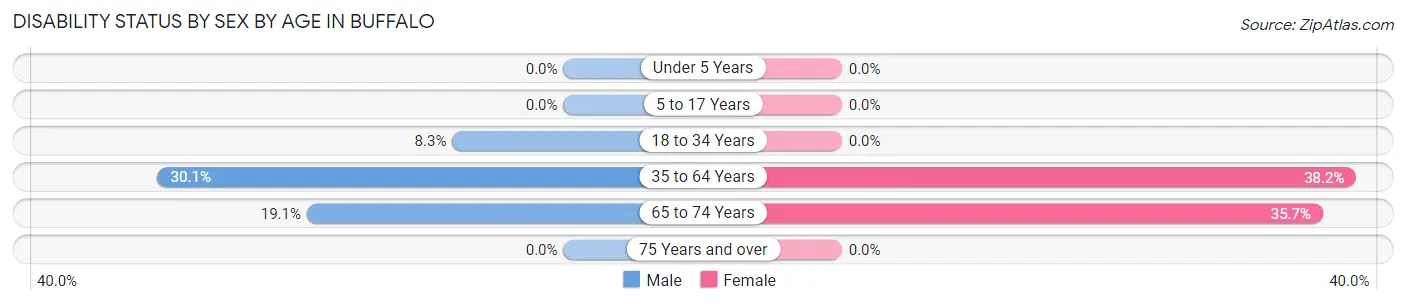
| Age Bracket | Male | Female |
| Under 5 Years | 0 (0.0%) | 0 (0.0%) |
| 5 to 17 Years | 0 (0.0%) | 0 (0.0%) |
| 18 to 34 Years | 8 (8.3%) | 0 (0.0%) |
| 35 to 64 Years | 97 (30.1%) | 76 (38.2%) |
| 65 to 74 Years | 8 (19.1%) | 10 (35.7%) |
| 75 Years and over | 0 (0.0%) | 0 (0.0%) |
Disability Class by Sex by Age in Buffalo
Disability Class: Hearing Difficulty
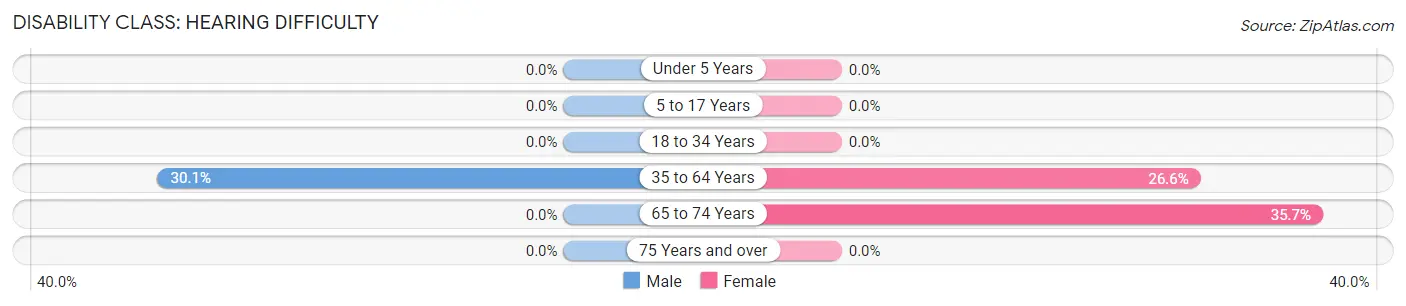
| Age Bracket | Male | Female |
| Under 5 Years | 0 (0.0%) | 0 (0.0%) |
| 5 to 17 Years | 0 (0.0%) | 0 (0.0%) |
| 18 to 34 Years | 0 (0.0%) | 0 (0.0%) |
| 35 to 64 Years | 97 (30.1%) | 53 (26.6%) |
| 65 to 74 Years | 0 (0.0%) | 10 (35.7%) |
| 75 Years and over | 0 (0.0%) | 0 (0.0%) |
Disability Class: Vision Difficulty
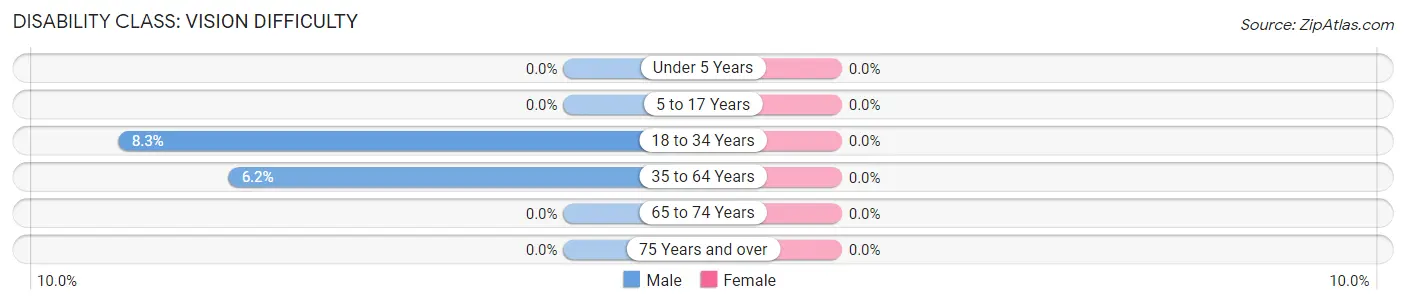
| Age Bracket | Male | Female |
| Under 5 Years | 0 (0.0%) | 0 (0.0%) |
| 5 to 17 Years | 0 (0.0%) | 0 (0.0%) |
| 18 to 34 Years | 8 (8.3%) | 0 (0.0%) |
| 35 to 64 Years | 20 (6.2%) | 0 (0.0%) |
| 65 to 74 Years | 0 (0.0%) | 0 (0.0%) |
| 75 Years and over | 0 (0.0%) | 0 (0.0%) |
Disability Class: Cognitive Difficulty
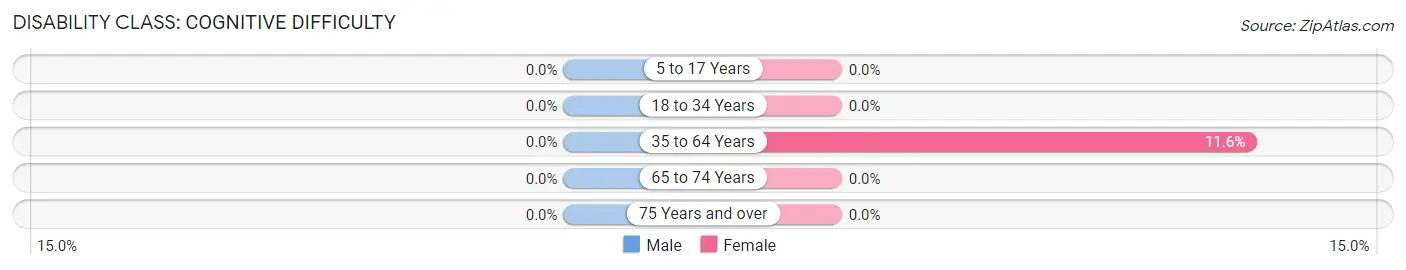
| Age Bracket | Male | Female |
| 5 to 17 Years | 0 (0.0%) | 0 (0.0%) |
| 18 to 34 Years | 0 (0.0%) | 0 (0.0%) |
| 35 to 64 Years | 0 (0.0%) | 23 (11.6%) |
| 65 to 74 Years | 0 (0.0%) | 0 (0.0%) |
| 75 Years and over | 0 (0.0%) | 0 (0.0%) |
Disability Class: Ambulatory Difficulty
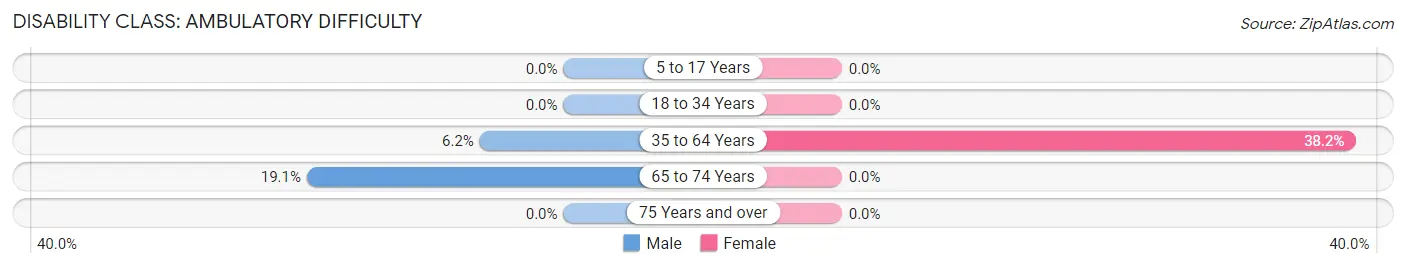
| Age Bracket | Male | Female |
| 5 to 17 Years | 0 (0.0%) | 0 (0.0%) |
| 18 to 34 Years | 0 (0.0%) | 0 (0.0%) |
| 35 to 64 Years | 20 (6.2%) | 76 (38.2%) |
| 65 to 74 Years | 8 (19.1%) | 0 (0.0%) |
| 75 Years and over | 0 (0.0%) | 0 (0.0%) |
Disability Class: Self-Care Difficulty
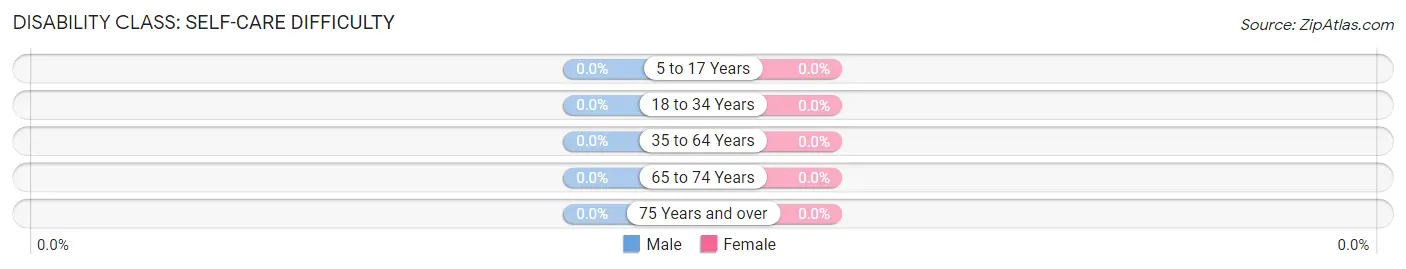
| Age Bracket | Male | Female |
| 5 to 17 Years | 0 (0.0%) | 0 (0.0%) |
| 18 to 34 Years | 0 (0.0%) | 0 (0.0%) |
| 35 to 64 Years | 0 (0.0%) | 0 (0.0%) |
| 65 to 74 Years | 0 (0.0%) | 0 (0.0%) |
| 75 Years and over | 0 (0.0%) | 0 (0.0%) |
Technology Access in Buffalo
Computing Device Access in Buffalo
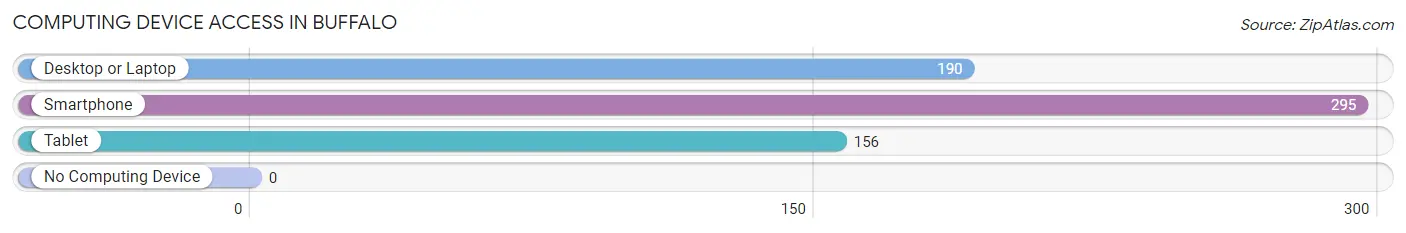
| Device Type | # Households | % Households |
| Desktop or Laptop | 190 | 61.3% |
| Smartphone | 295 | 95.2% |
| Tablet | 156 | 50.3% |
| No Computing Device | 0 | 0.0% |
| Total | 310 | 100.0% |
Internet Access in Buffalo
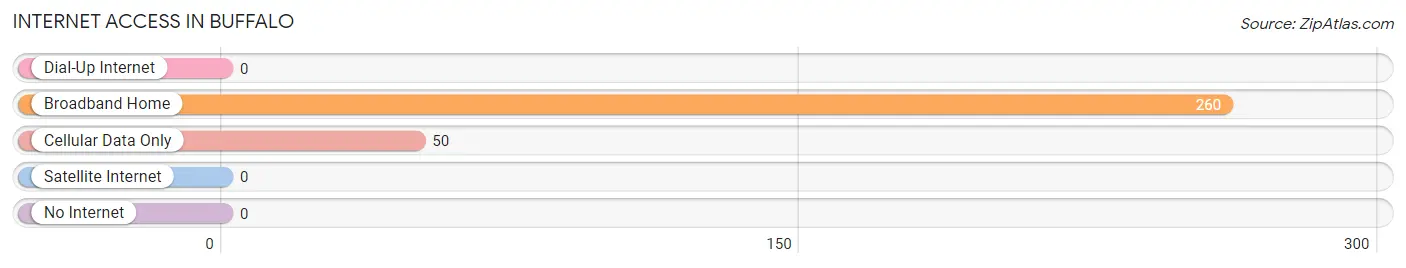
| Internet Type | # Households | % Households |
| Dial-Up Internet | 0 | 0.0% |
| Broadband Home | 260 | 83.9% |
| Cellular Data Only | 50 | 16.1% |
| Satellite Internet | 0 | 0.0% |
| No Internet | 0 | 0.0% |
| Total | 310 | 100.0% |
Buffalo Summary
Buffalo, Indiana is a small town located in White County, Indiana. It is situated in the northwest corner of the state, about 30 miles south of South Bend and about 40 miles north of Indianapolis. The town was founded in 1836 and has a population of approximately 1,000 people.
Geography
Buffalo is located in the Tippecanoe River Valley, which is part of the Wabash Valley. The town is situated on the banks of the Tippecanoe River, which is a tributary of the Wabash River. The town is surrounded by rolling hills and farmland, and is located in a rural area. The town is located in the Central Time Zone.
Economy
The economy of Buffalo is largely based on agriculture. The town is home to several farms, which produce corn, soybeans, wheat, and other crops. The town also has a few small businesses, including a grocery store, a hardware store, and a few restaurants.
Demographics
As of the 2010 census, the population of Buffalo was 1,000 people. The racial makeup of the town was 97.2% White, 0.7% African American, 0.3% Native American, 0.2% Asian, 0.1% Pacific Islander, 0.2% from other races, and 1.3% from two or more races. Hispanic or Latino of any race were 0.7% of the population.
The median income for a household in Buffalo was $37,500, and the median income for a family was $41,250. The per capita income for the town was $17,845. About 11.2% of families and 13.2% of the population were below the poverty line, including 16.7% of those under age 18 and 8.3% of those age 65 or over.
History
Buffalo was founded in 1836 by a group of settlers from Ohio. The town was named after Buffalo Creek, which runs through the area. The town was originally a farming community, and the first post office was established in 1837.
In the late 19th century, the town began to grow and develop. The first school was built in 1876, and the first church was built in 1877. The town also had a newspaper, a bank, and a hotel.
In the early 20th century, the town continued to grow and develop. The first telephone service was established in 1910, and the first electric service was established in 1912. The town also had a movie theater, a library, and a hospital.
In the late 20th century, the town began to decline. Many of the businesses closed, and the population began to decline. The town is now a quiet, rural community.
Common Questions
What is Per Capita Income in Buffalo?
Per Capita income in Buffalo is $45,844.
What is the Median Family Income in Buffalo?
Median Family Income in Buffalo is $122,847.
What is the Median Household income in Buffalo?
Median Household Income in Buffalo is $120,333.
What is Income or Wage Gap in Buffalo?
Income or Wage Gap in Buffalo is 40.3%.
Women in Buffalo earn 59.7 cents for every dollar earned by a man.
What is Inequality or Gini Index in Buffalo?
Inequality or Gini Index in Buffalo is 0.20.
What is the Total Population of Buffalo?
Total Population of Buffalo is 776.
What is the Total Male Population of Buffalo?
Total Male Population of Buffalo is 480.
What is the Total Female Population of Buffalo?
Total Female Population of Buffalo is 296.
What is the Ratio of Males per 100 Females in Buffalo?
There are 162.16 Males per 100 Females in Buffalo.
What is the Ratio of Females per 100 Males in Buffalo?
There are 61.67 Females per 100 Males in Buffalo.
What is the Median Population Age in Buffalo?
Median Population Age in Buffalo is 54.8 Years.
What is the Average Family Size in Buffalo
Average Family Size in Buffalo is 2.5 People.
What is the Average Household Size in Buffalo
Average Household Size in Buffalo is 2.5 People.
How Large is the Labor Force in Buffalo?
There are 553 People in the Labor Forcein in Buffalo.
What is the Percentage of People in the Labor Force in Buffalo?
72.8% of People are in the Labor Force in Buffalo.