Bristol, IN Map & Demographics
Bristol Map
Bristol Overview
$29,811
PER CAPITA INCOME
$82,625
AVG FAMILY INCOME
$75,046
AVG HOUSEHOLD INCOME
17.5%
WAGE / INCOME GAP [ % ]
82.5¢/ $1
WAGE / INCOME GAP [ $ ]
0.38
INEQUALITY / GINI INDEX
1,862
TOTAL POPULATION
1,039
MALE POPULATION
823
FEMALE POPULATION
126.25
MALES / 100 FEMALES
79.21
FEMALES / 100 MALES
30.1
MEDIAN AGE
3.8
AVG FAMILY SIZE
2.9
AVG HOUSEHOLD SIZE
927
LABOR FORCE [ PEOPLE ]
65.3%
PERCENT IN LABOR FORCE
0.3%
UNEMPLOYMENT RATE
Bristol Zip Codes
Bristol Area Codes
Income in Bristol
Income Overview in Bristol
Per Capita Income in Bristol is $29,811, while median incomes of families and households are $82,625 and $75,046 respectively.
| Characteristic | Number | Measure |
| Per Capita Income | 1,862 | $29,811 |
| Median Family Income | 391 | $82,625 |
| Mean Family Income | 391 | $99,294 |
| Median Household Income | 637 | $75,046 |
| Mean Household Income | 637 | $81,497 |
| Income Deficit | 391 | $0 |
| Wage / Income Gap (%) | 1,862 | 17.54% |
| Wage / Income Gap ($) | 1,862 | 82.46¢ per $1 |
| Gini / Inequality Index | 1,862 | 0.38 |
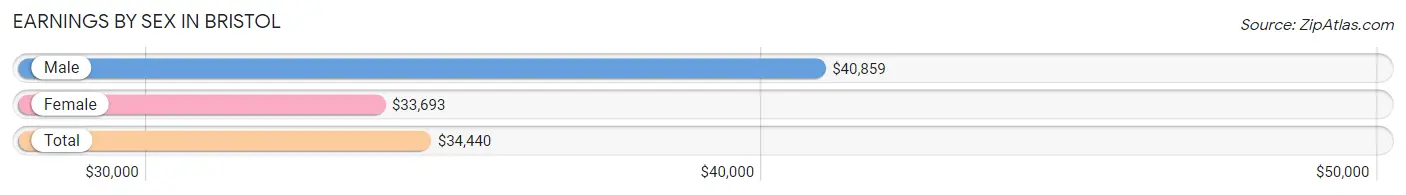
Earnings by Sex in Bristol
Average Earnings in Bristol are $34,440, $40,859 for men and $33,693 for women, a difference of 17.5%.
| Sex | Number | Average Earnings |
| Male | 651 (66.6%) | $40,859 |
| Female | 327 (33.4%) | $33,693 |
| Total | 978 (100.0%) | $34,440 |
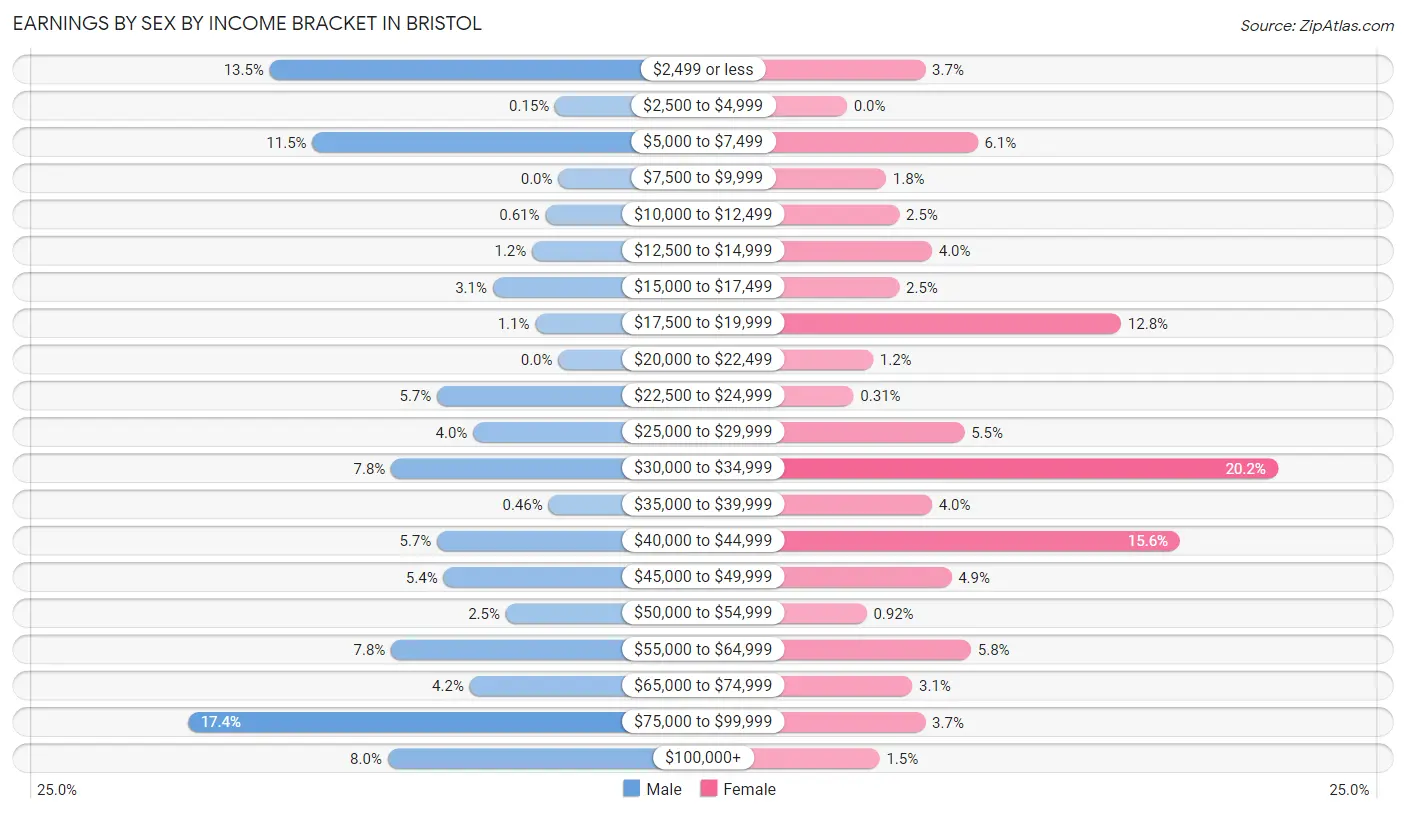
Earnings by Sex by Income Bracket in Bristol
The most common earnings brackets in Bristol are $75,000 to $99,999 for men (113 | 17.4%) and $30,000 to $34,999 for women (66 | 20.2%).
| Income | Male | Female |
| $2,499 or less | 88 (13.5%) | 12 (3.7%) |
| $2,500 to $4,999 | 1 (0.2%) | 0 (0.0%) |
| $5,000 to $7,499 | 75 (11.5%) | 20 (6.1%) |
| $7,500 to $9,999 | 0 (0.0%) | 6 (1.8%) |
| $10,000 to $12,499 | 4 (0.6%) | 8 (2.5%) |
| $12,500 to $14,999 | 8 (1.2%) | 13 (4.0%) |
| $15,000 to $17,499 | 20 (3.1%) | 8 (2.5%) |
| $17,500 to $19,999 | 7 (1.1%) | 42 (12.8%) |
| $20,000 to $22,499 | 0 (0.0%) | 4 (1.2%) |
| $22,500 to $24,999 | 37 (5.7%) | 1 (0.3%) |
| $25,000 to $29,999 | 26 (4.0%) | 18 (5.5%) |
| $30,000 to $34,999 | 51 (7.8%) | 66 (20.2%) |
| $35,000 to $39,999 | 3 (0.5%) | 13 (4.0%) |
| $40,000 to $44,999 | 37 (5.7%) | 51 (15.6%) |
| $45,000 to $49,999 | 35 (5.4%) | 16 (4.9%) |
| $50,000 to $54,999 | 16 (2.5%) | 3 (0.9%) |
| $55,000 to $64,999 | 51 (7.8%) | 19 (5.8%) |
| $65,000 to $74,999 | 27 (4.2%) | 10 (3.1%) |
| $75,000 to $99,999 | 113 (17.4%) | 12 (3.7%) |
| $100,000+ | 52 (8.0%) | 5 (1.5%) |
| Total | 651 (100.0%) | 327 (100.0%) |
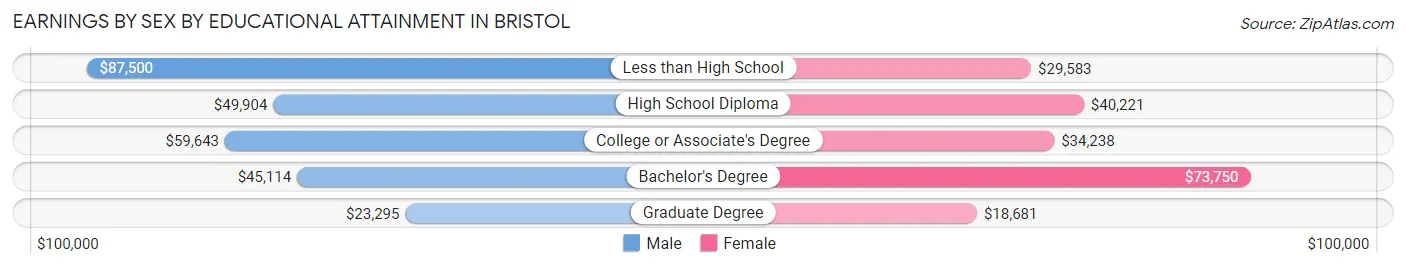
Earnings by Sex by Educational Attainment in Bristol
Average earnings in Bristol are $49,453 for men and $34,098 for women, a difference of 31.0%. Men with an educational attainment of less than high school enjoy the highest average annual earnings of $87,500, while those with graduate degree education earn the least with $23,295. Women with an educational attainment of bachelor's degree earn the most with the average annual earnings of $73,750, while those with graduate degree education have the smallest earnings of $18,681.
| Educational Attainment | Male Income | Female Income |
| Less than High School | $87,500 | $29,583 |
| High School Diploma | $49,904 | $40,221 |
| College or Associate's Degree | $59,643 | $34,238 |
| Bachelor's Degree | $45,114 | $73,750 |
| Graduate Degree | $23,295 | $18,681 |
| Total | $49,453 | $34,098 |
Family Income in Bristol
Family Income Brackets in Bristol
According to the Bristol family income data, there are 96 families falling into the $75,000 to $99,999 income range, which is the most common income bracket and makes up 24.5% of all families.
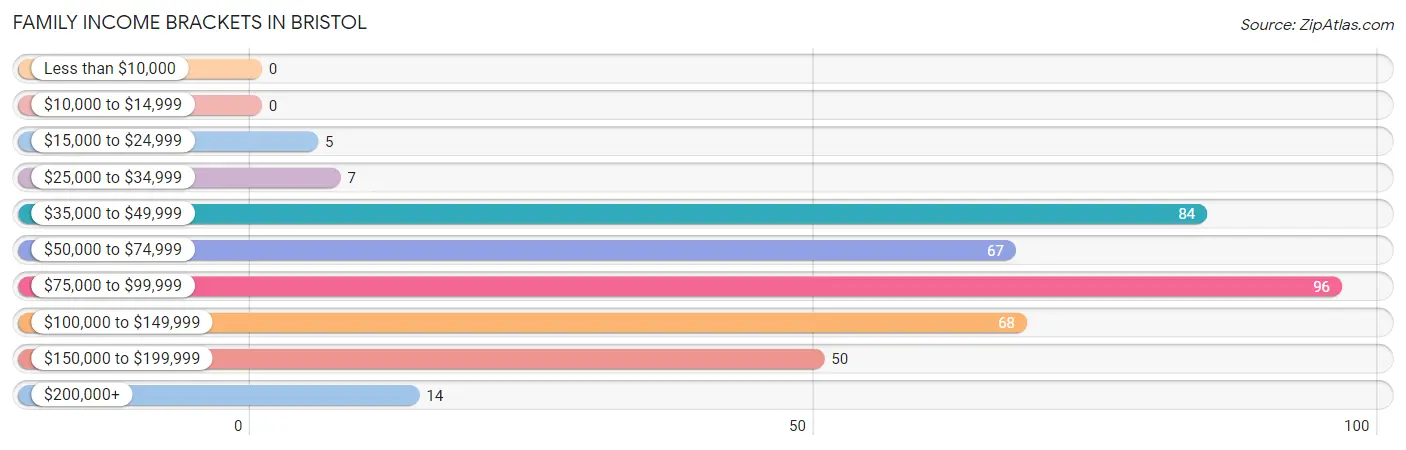
| Income Bracket | # Families | % Families |
| Less than $10,000 | 0 | 0.0% |
| $10,000 to $14,999 | 0 | 0.0% |
| $15,000 to $24,999 | 5 | 1.3% |
| $25,000 to $34,999 | 7 | 1.8% |
| $35,000 to $49,999 | 84 | 21.5% |
| $50,000 to $74,999 | 67 | 17.1% |
| $75,000 to $99,999 | 96 | 24.6% |
| $100,000 to $149,999 | 68 | 17.4% |
| $150,000 to $199,999 | 50 | 12.8% |
| $200,000+ | 14 | 3.6% |
Family Income by Famaliy Size in Bristol
6-person families (32 | 8.2%) account for the highest median family income in Bristol with $198,000 per family, while 2-person families (183 | 46.8%) have the highest median income of $44,375 per family member.
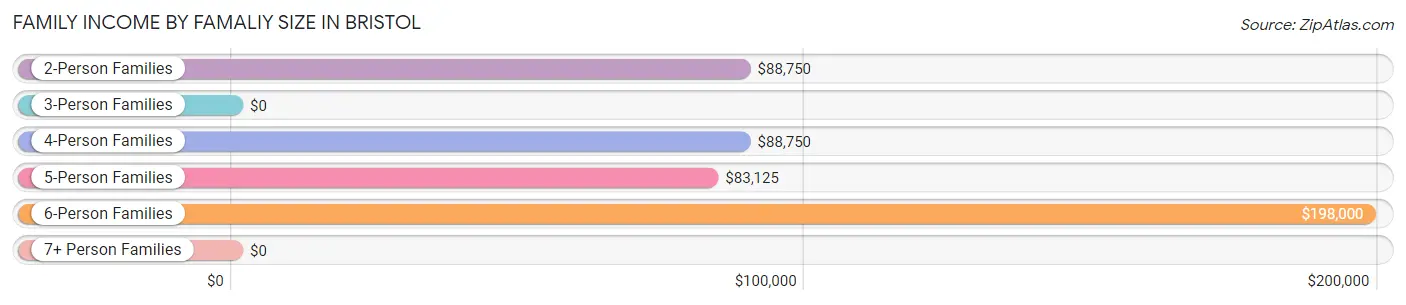
| Income Bracket | # Families | Median Income |
| 2-Person Families | 183 (46.8%) | $88,750 |
| 3-Person Families | 100 (25.6%) | $0 |
| 4-Person Families | 55 (14.1%) | $88,750 |
| 5-Person Families | 17 (4.3%) | $83,125 |
| 6-Person Families | 32 (8.2%) | $198,000 |
| 7+ Person Families | 4 (1.0%) | $0 |
| Total | 391 (100.0%) | $82,625 |
Family Income by Number of Earners in Bristol
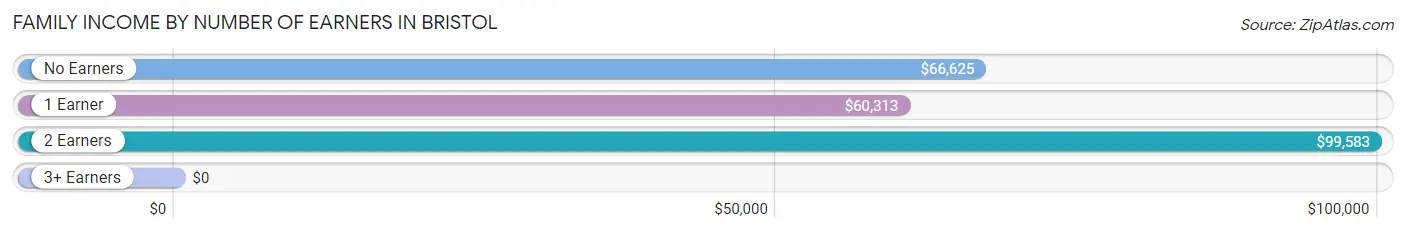
| Number of Earners | # Families | Median Income |
| No Earners | 67 (17.1%) | $66,625 |
| 1 Earner | 101 (25.8%) | $60,313 |
| 2 Earners | 164 (41.9%) | $99,583 |
| 3+ Earners | 59 (15.1%) | $0 |
| Total | 391 (100.0%) | $82,625 |
Household Income in Bristol
Household Income Brackets in Bristol
With 158 households falling in the category, the $75,000 to $99,999 income range is the most frequent in Bristol, accounting for 24.8% of all households. In contrast, only 11 households (1.7%) fall into the less than $10,000 income bracket, making it the least populous group.
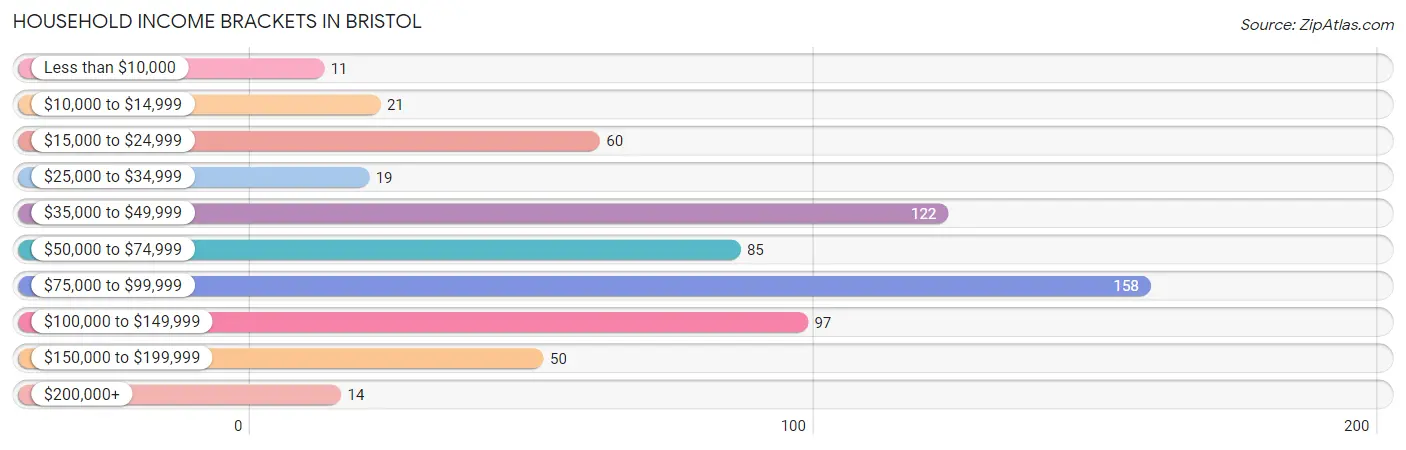
| Income Bracket | # Households | % Households |
| Less than $10,000 | 11 | 1.7% |
| $10,000 to $14,999 | 21 | 3.3% |
| $15,000 to $24,999 | 60 | 9.4% |
| $25,000 to $34,999 | 19 | 3.0% |
| $35,000 to $49,999 | 122 | 19.2% |
| $50,000 to $74,999 | 85 | 13.3% |
| $75,000 to $99,999 | 158 | 24.8% |
| $100,000 to $149,999 | 97 | 15.2% |
| $150,000 to $199,999 | 50 | 7.8% |
| $200,000+ | 14 | 2.2% |
Household Income by Householder Age in Bristol
The median household income in Bristol is $75,046, with the highest median household income of $84,219 found in the 45 to 64 years age bracket for the primary householder. A total of 195 households (30.6%) fall into this category. Meanwhile, the 65+ years age bracket for the primary householder has the lowest median household income of $46,417, with 233 households (36.6%) in this group.
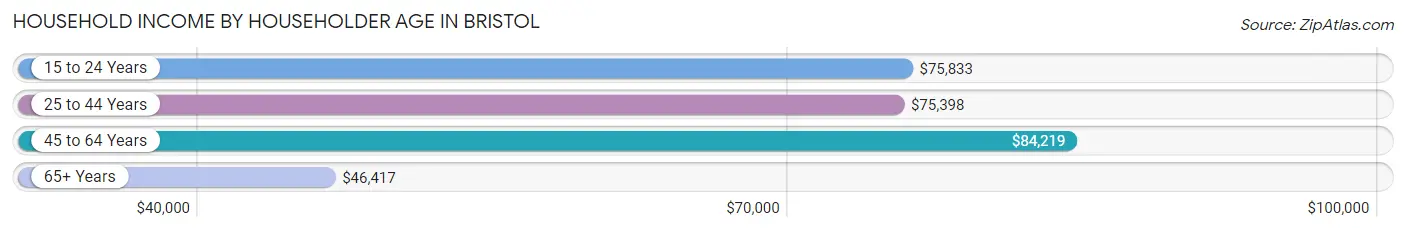
| Income Bracket | # Households | Median Income |
| 15 to 24 Years | 18 (2.8%) | $75,833 |
| 25 to 44 Years | 191 (30.0%) | $75,398 |
| 45 to 64 Years | 195 (30.6%) | $84,219 |
| 65+ Years | 233 (36.6%) | $46,417 |
| Total | 637 (100.0%) | $75,046 |
Poverty in Bristol
Income Below Poverty by Sex and Age in Bristol
With 0.6% poverty level for males and 6.0% for females among the residents of Bristol, 55 to 64 year old males and 55 to 64 year old females are the most vulnerable to poverty, with 2 males (2.7%) and 11 females (15.9%) in their respective age groups living below the poverty level.
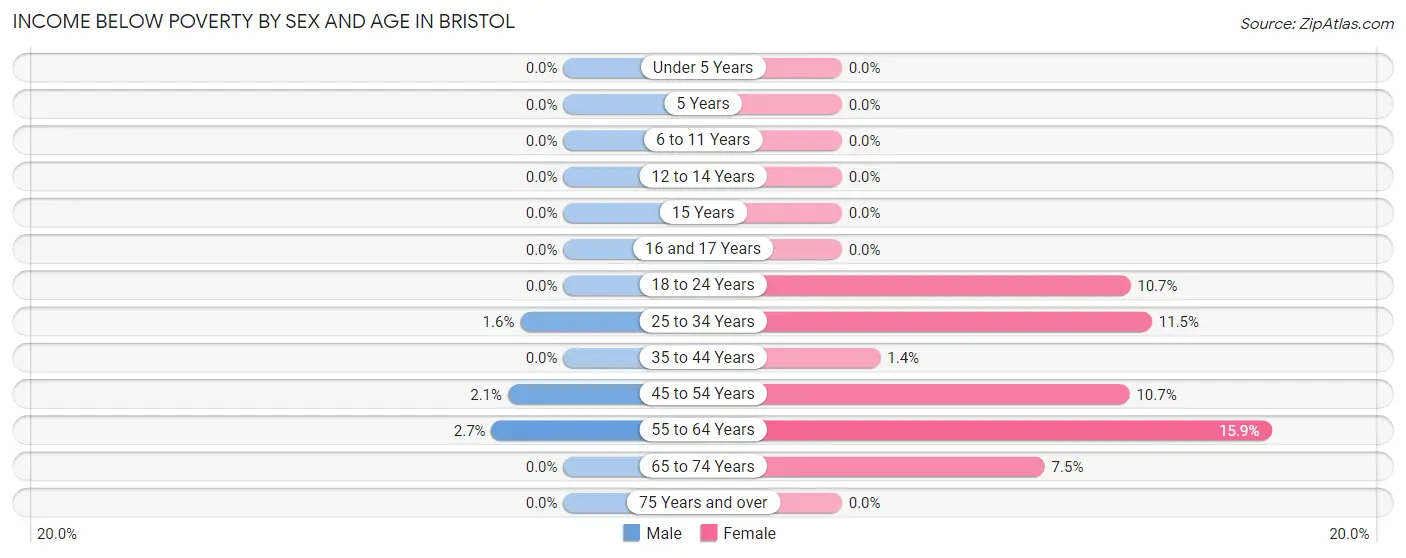
| Age Bracket | Male | Female |
| Under 5 Years | 0 (0.0%) | 0 (0.0%) |
| 5 Years | 0 (0.0%) | 0 (0.0%) |
| 6 to 11 Years | 0 (0.0%) | 0 (0.0%) |
| 12 to 14 Years | 0 (0.0%) | 0 (0.0%) |
| 15 Years | 0 (0.0%) | 0 (0.0%) |
| 16 and 17 Years | 0 (0.0%) | 0 (0.0%) |
| 18 to 24 Years | 0 (0.0%) | 3 (10.7%) |
| 25 to 34 Years | 2 (1.6%) | 16 (11.5%) |
| 35 to 44 Years | 0 (0.0%) | 1 (1.4%) |
| 45 to 54 Years | 2 (2.1%) | 11 (10.7%) |
| 55 to 64 Years | 2 (2.7%) | 11 (15.9%) |
| 65 to 74 Years | 0 (0.0%) | 7 (7.5%) |
| 75 Years and over | 0 (0.0%) | 0 (0.0%) |
| Total | 6 (0.6%) | 49 (6.0%) |
Income Above Poverty by Sex and Age in Bristol
According to the poverty statistics in Bristol, males aged under 5 years and females aged under 5 years are the age groups that are most secure financially, with 100.0% of males and 100.0% of females in these age groups living above the poverty line.
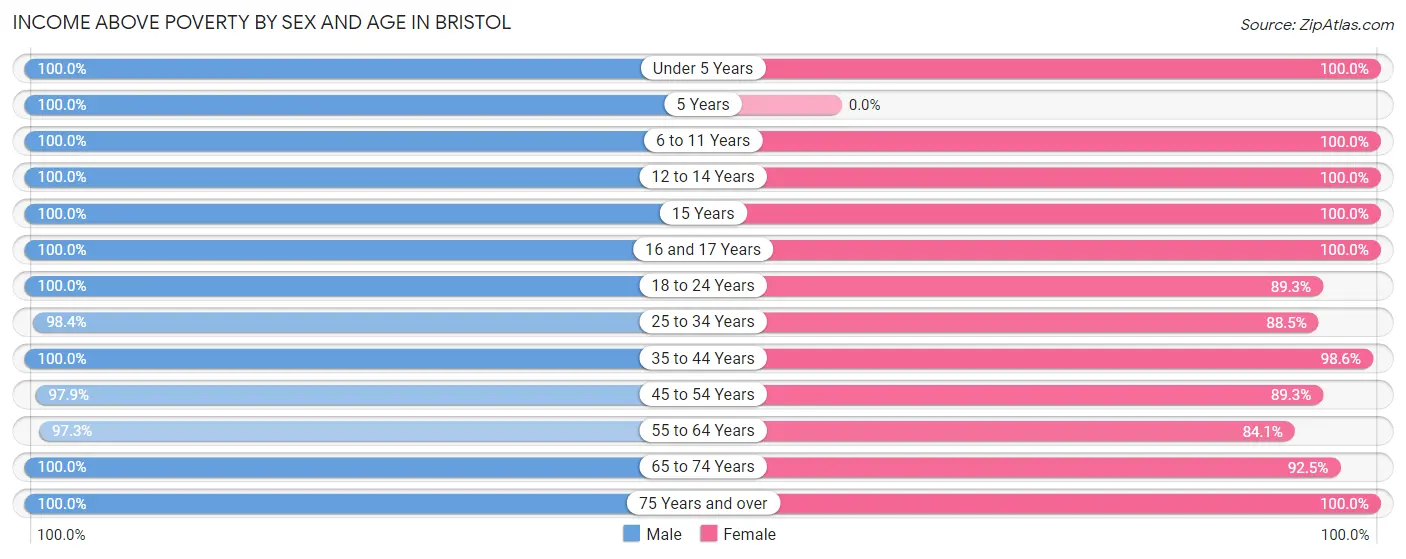
| Age Bracket | Male | Female |
| Under 5 Years | 158 (100.0%) | 44 (100.0%) |
| 5 Years | 3 (100.0%) | 0 (0.0%) |
| 6 to 11 Years | 45 (100.0%) | 103 (100.0%) |
| 12 to 14 Years | 18 (100.0%) | 42 (100.0%) |
| 15 Years | 6 (100.0%) | 11 (100.0%) |
| 16 and 17 Years | 17 (100.0%) | 27 (100.0%) |
| 18 to 24 Years | 261 (100.0%) | 25 (89.3%) |
| 25 to 34 Years | 123 (98.4%) | 123 (88.5%) |
| 35 to 44 Years | 53 (100.0%) | 69 (98.6%) |
| 45 to 54 Years | 95 (97.9%) | 92 (89.3%) |
| 55 to 64 Years | 73 (97.3%) | 58 (84.1%) |
| 65 to 74 Years | 107 (100.0%) | 86 (92.5%) |
| 75 Years and over | 66 (100.0%) | 90 (100.0%) |
| Total | 1,025 (99.4%) | 770 (94.0%) |
Income Below Poverty Among Married-Couple Families in Bristol
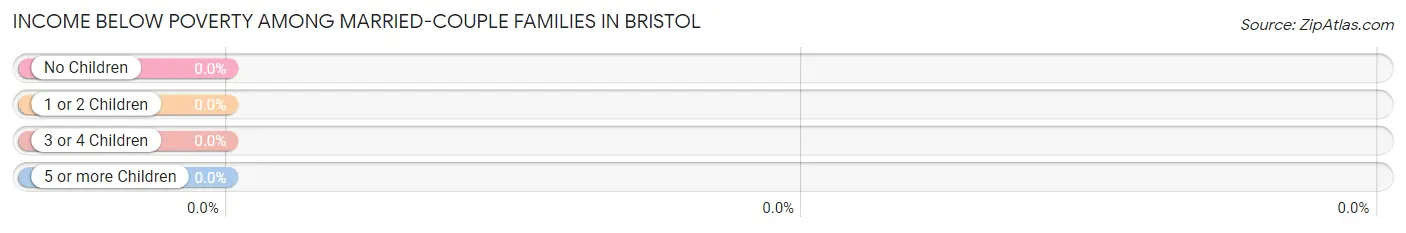
| Children | Above Poverty | Below Poverty |
| No Children | 182 (100.0%) | 0 (0.0%) |
| 1 or 2 Children | 70 (100.0%) | 0 (0.0%) |
| 3 or 4 Children | 36 (100.0%) | 0 (0.0%) |
| 5 or more Children | 4 (100.0%) | 0 (0.0%) |
| Total | 292 (100.0%) | 0 (0.0%) |
Income Below Poverty Among Single-Parent Households in Bristol
| Children | Single Father | Single Mother |
| No Children | 0 (0.0%) | 0 (0.0%) |
| 1 or 2 Children | 0 (0.0%) | 0 (0.0%) |
| 3 or 4 Children | 0 (0.0%) | 0 (0.0%) |
| 5 or more Children | 0 (0.0%) | 0 (0.0%) |
| Total | 0 (0.0%) | 0 (0.0%) |
Income Below Poverty Among Married-Couple vs Single-Parent Households in Bristol
| Children | Married-Couple Families | Single-Parent Households |
| No Children | 0 (0.0%) | 0 (0.0%) |
| 1 or 2 Children | 0 (0.0%) | 0 (0.0%) |
| 3 or 4 Children | 0 (0.0%) | 0 (0.0%) |
| 5 or more Children | 0 (0.0%) | 0 (0.0%) |
| Total | 0 (0.0%) | 0 (0.0%) |
Race in Bristol
The most populous races in Bristol are White / Caucasian (1,556 | 83.6%), Hispanic or Latino (359 | 19.3%), and Two or more Races (212 | 11.4%).

| Race | # Population | % Population |
| Asian | 18 | 1.0% |
| Black / African American | 38 | 2.0% |
| Hawaiian / Pacific | 0 | 0.0% |
| Hispanic or Latino | 359 | 19.3% |
| Native / Alaskan | 0 | 0.0% |
| White / Caucasian | 1,556 | 83.6% |
| Two or more Races | 212 | 11.4% |
| Some other Race | 38 | 2.0% |
| Total | 1,862 | 100.0% |
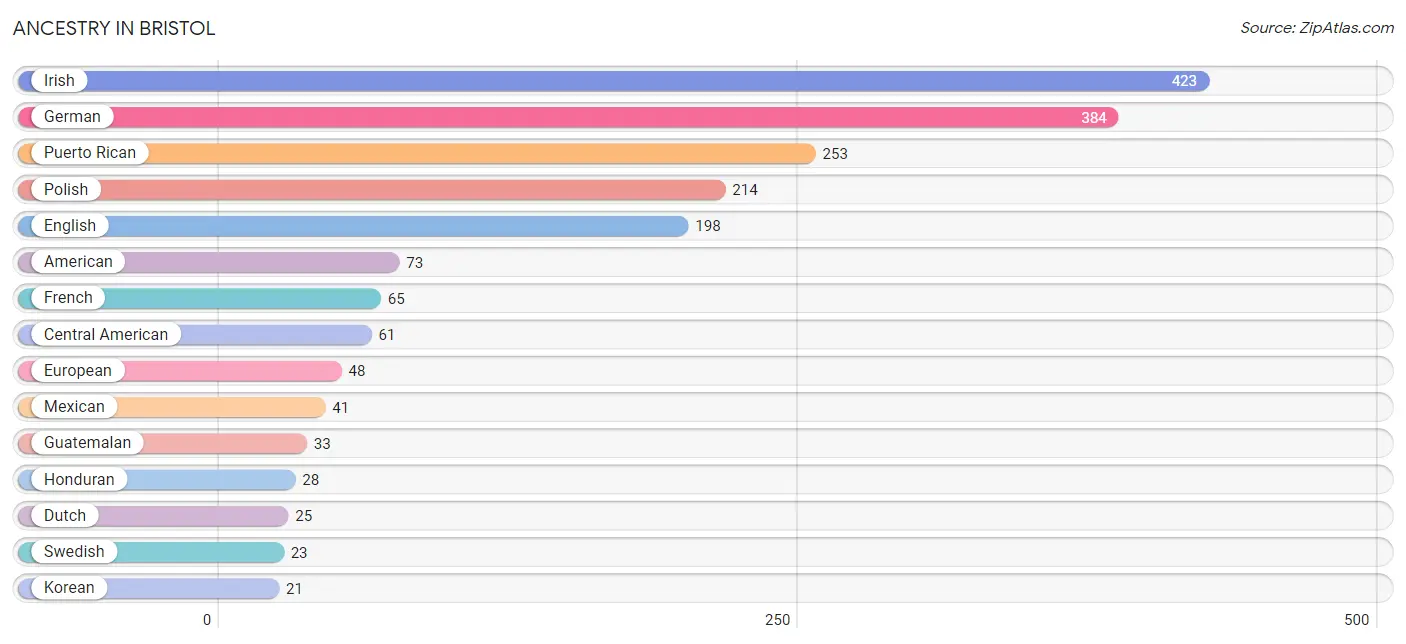
Ancestry in Bristol
The most populous ancestries reported in Bristol are Irish (423 | 22.7%), German (384 | 20.6%), Puerto Rican (253 | 13.6%), Polish (214 | 11.5%), and English (198 | 10.6%), together accounting for 79.0% of all Bristol residents.
| Ancestry | # Population | % Population |
| African | 4 | 0.2% |
| American | 73 | 3.9% |
| Arab | 4 | 0.2% |
| Austrian | 3 | 0.2% |
| Bhutanese | 2 | 0.1% |
| Blackfeet | 6 | 0.3% |
| Central American | 61 | 3.3% |
| Cherokee | 1 | 0.1% |
| Colombian | 4 | 0.2% |
| Danish | 3 | 0.2% |
| Dutch | 25 | 1.3% |
| English | 198 | 10.6% |
| European | 48 | 2.6% |
| Finnish | 3 | 0.2% |
| French | 65 | 3.5% |
| French Canadian | 7 | 0.4% |
| German | 384 | 20.6% |
| Guatemalan | 33 | 1.8% |
| Honduran | 28 | 1.5% |
| Irish | 423 | 22.7% |
| Italian | 17 | 0.9% |
| Korean | 21 | 1.1% |
| Lithuanian | 4 | 0.2% |
| Mexican | 41 | 2.2% |
| Norwegian | 3 | 0.2% |
| Pennsylvania German | 10 | 0.5% |
| Polish | 214 | 11.5% |
| Potawatomi | 1 | 0.1% |
| Puerto Rican | 253 | 13.6% |
| Romanian | 3 | 0.2% |
| Russian | 5 | 0.3% |
| Scotch-Irish | 20 | 1.1% |
| Scottish | 14 | 0.7% |
| South American | 4 | 0.2% |
| Subsaharan African | 4 | 0.2% |
| Swedish | 23 | 1.2% |
| Swiss | 11 | 0.6% |
| Syrian | 4 | 0.2% |
| Welsh | 12 | 0.6% | View All 39 Rows |
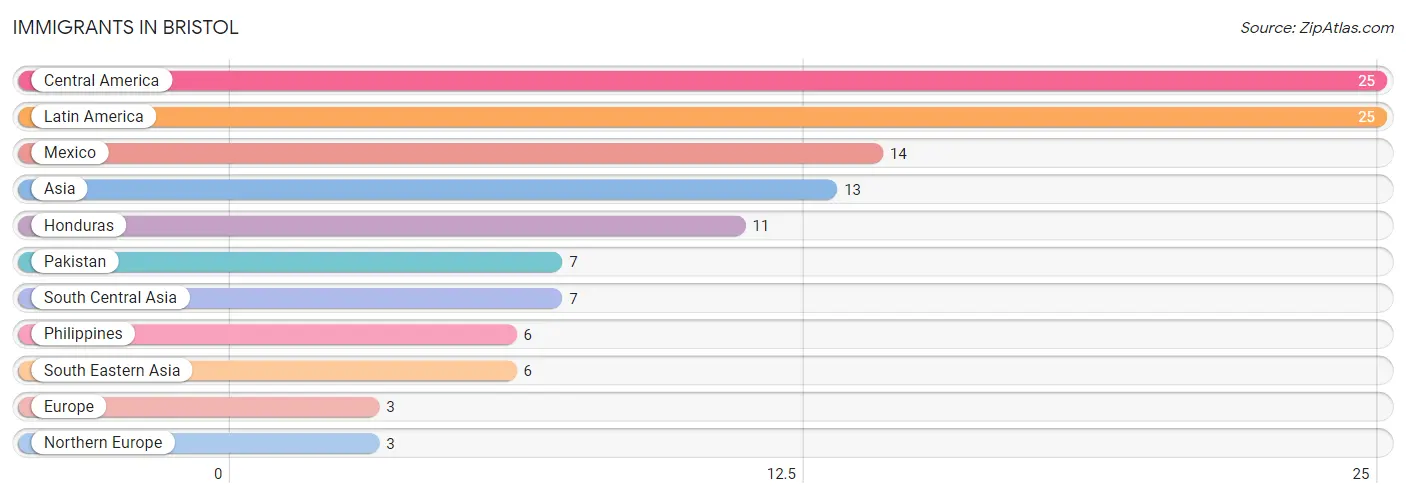
Immigrants in Bristol
The most numerous immigrant groups reported in Bristol came from Central America (25 | 1.3%), Latin America (25 | 1.3%), Mexico (14 | 0.7%), Asia (13 | 0.7%), and Honduras (11 | 0.6%), together accounting for 4.7% of all Bristol residents.
| Immigration Origin | # Population | % Population |
| Asia | 13 | 0.7% |
| Central America | 25 | 1.3% |
| Europe | 3 | 0.2% |
| Honduras | 11 | 0.6% |
| Latin America | 25 | 1.3% |
| Mexico | 14 | 0.7% |
| Northern Europe | 3 | 0.2% |
| Pakistan | 7 | 0.4% |
| Philippines | 6 | 0.3% |
| South Central Asia | 7 | 0.4% |
| South Eastern Asia | 6 | 0.3% | View All 11 Rows |
Sex and Age in Bristol
Sex and Age in Bristol
The most populous age groups in Bristol are 20 to 24 Years (173 | 16.7%) for men and 10 to 14 Years (115 | 14.0%) for women.
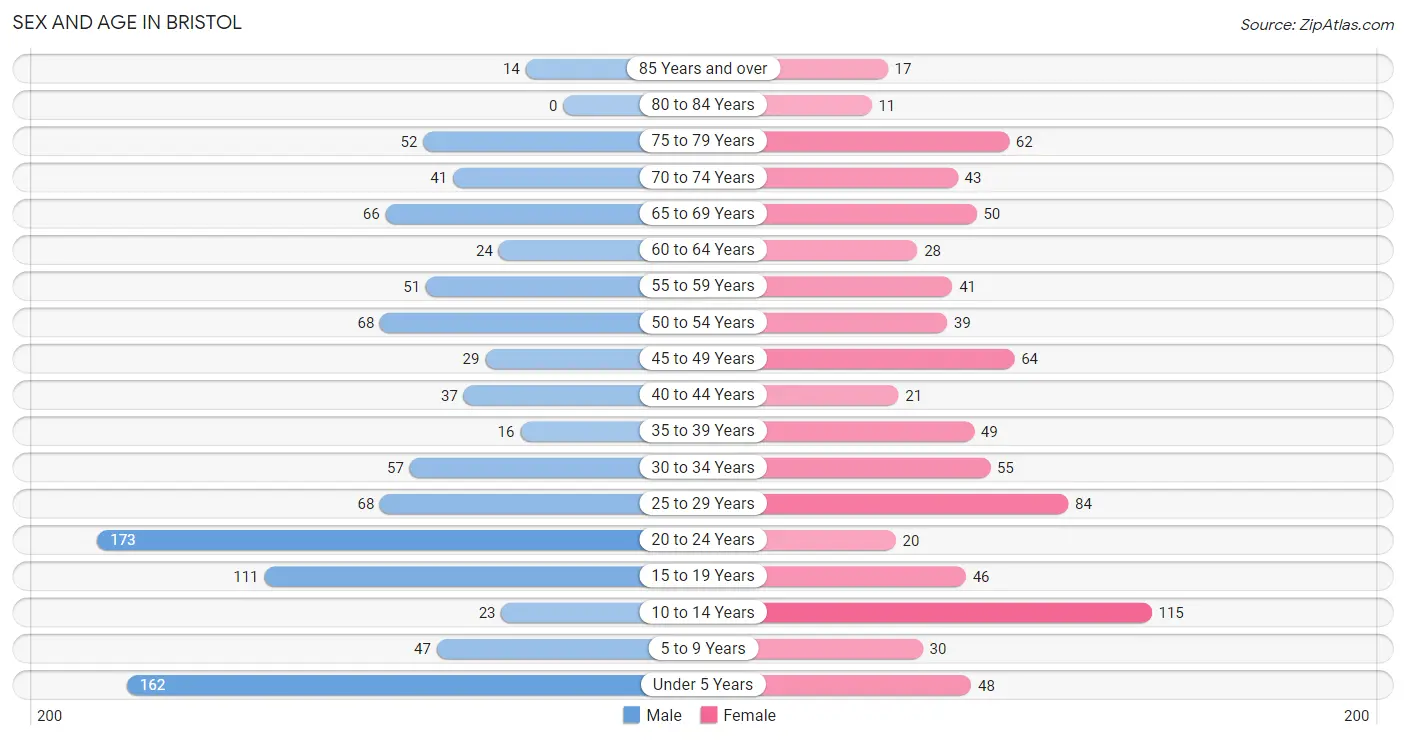
| Age Bracket | Male | Female |
| Under 5 Years | 162 (15.6%) | 48 (5.8%) |
| 5 to 9 Years | 47 (4.5%) | 30 (3.6%) |
| 10 to 14 Years | 23 (2.2%) | 115 (14.0%) |
| 15 to 19 Years | 111 (10.7%) | 46 (5.6%) |
| 20 to 24 Years | 173 (16.7%) | 20 (2.4%) |
| 25 to 29 Years | 68 (6.5%) | 84 (10.2%) |
| 30 to 34 Years | 57 (5.5%) | 55 (6.7%) |
| 35 to 39 Years | 16 (1.5%) | 49 (5.9%) |
| 40 to 44 Years | 37 (3.6%) | 21 (2.5%) |
| 45 to 49 Years | 29 (2.8%) | 64 (7.8%) |
| 50 to 54 Years | 68 (6.5%) | 39 (4.7%) |
| 55 to 59 Years | 51 (4.9%) | 41 (5.0%) |
| 60 to 64 Years | 24 (2.3%) | 28 (3.4%) |
| 65 to 69 Years | 66 (6.4%) | 50 (6.1%) |
| 70 to 74 Years | 41 (4.0%) | 43 (5.2%) |
| 75 to 79 Years | 52 (5.0%) | 62 (7.5%) |
| 80 to 84 Years | 0 (0.0%) | 11 (1.3%) |
| 85 Years and over | 14 (1.3%) | 17 (2.1%) |
| Total | 1,039 (100.0%) | 823 (100.0%) |
Families and Households in Bristol
Median Family Size in Bristol
The median family size in Bristol is 3.79 persons per family, with single female/mother families (69 | 17.6%) accounting for the largest median family size of 4.58 persons per family. On the other hand, married-couple families (292 | 74.7%) represent the smallest median family size with 3.53 persons per family.
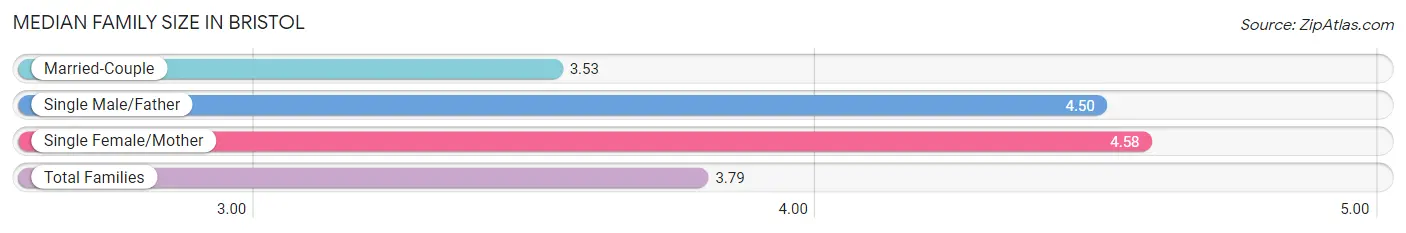
| Family Type | # Families | Family Size |
| Married-Couple | 292 (74.7%) | 3.53 |
| Single Male/Father | 30 (7.7%) | 4.50 |
| Single Female/Mother | 69 (17.6%) | 4.58 |
| Total Families | 391 (100.0%) | 3.79 |
Median Household Size in Bristol
The median household size in Bristol is 2.91 persons per household, with single male/father households (30 | 4.7%) accounting for the largest median household size of 5.43 persons per household. non-family households (246 | 38.6%) represent the smallest median household size with 1.20 persons per household.
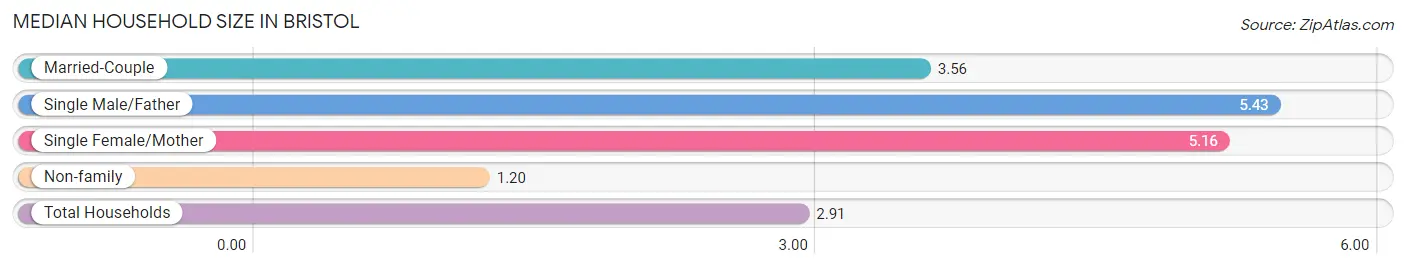
| Household Type | # Households | Household Size |
| Married-Couple | 292 (45.8%) | 3.56 |
| Single Male/Father | 30 (4.7%) | 5.43 |
| Single Female/Mother | 69 (10.8%) | 5.16 |
| Non-family | 246 (38.6%) | 1.20 |
| Total Households | 637 (100.0%) | 2.91 |
Household Size by Marriage Status in Bristol
Out of a total of 637 households in Bristol, 391 (61.4%) are family households, while 246 (38.6%) are nonfamily households. The most numerous type of family households are 2-person households, comprising 178, and the most common type of nonfamily households are 1-person households, comprising 212.
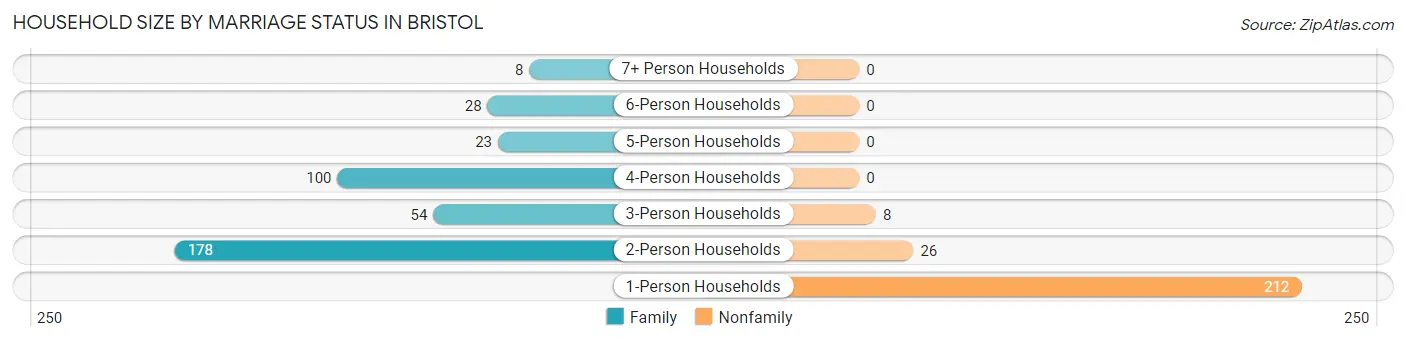
| Household Size | Family Households | Nonfamily Households |
| 1-Person Households | - | 212 (33.3%) |
| 2-Person Households | 178 (27.9%) | 26 (4.1%) |
| 3-Person Households | 54 (8.5%) | 8 (1.3%) |
| 4-Person Households | 100 (15.7%) | 0 (0.0%) |
| 5-Person Households | 23 (3.6%) | 0 (0.0%) |
| 6-Person Households | 28 (4.4%) | 0 (0.0%) |
| 7+ Person Households | 8 (1.3%) | 0 (0.0%) |
| Total | 391 (61.4%) | 246 (38.6%) |
Female Fertility in Bristol
Fertility by Age in Bristol
Average fertility rate in Bristol is 138.0 births per 1,000 women. Women in the age bracket of 20 to 34 years have the highest fertility rate with 277.0 births per 1,000 women. Women in the age bracket of 20 to 34 years acount for 93.6% of all women with births.
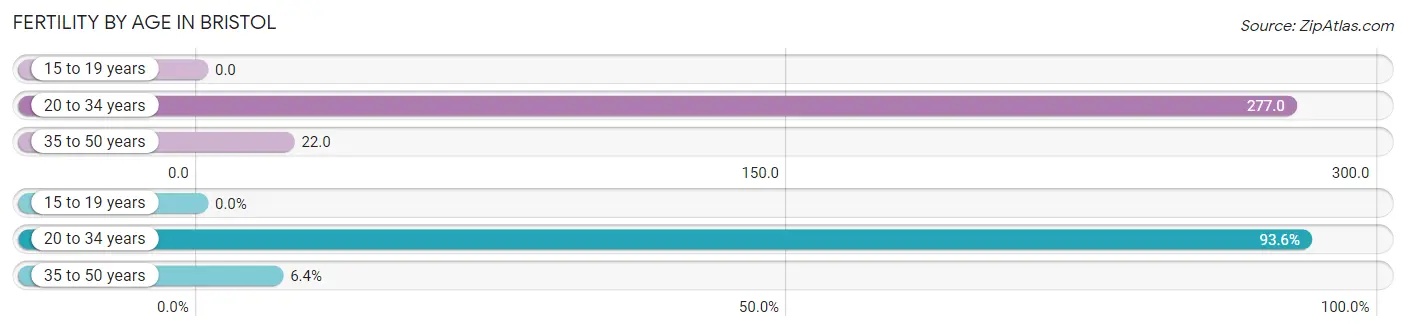
| Age Bracket | Women with Births | Births / 1,000 Women |
| 15 to 19 years | 0 (0.0%) | 0.0 |
| 20 to 34 years | 44 (93.6%) | 277.0 |
| 35 to 50 years | 3 (6.4%) | 22.0 |
| Total | 47 (100.0%) | 138.0 |
Fertility by Age by Marriage Status in Bristol
42.6% of women with births (47) in Bristol are married. The highest percentage of unmarried women with births falls into 35 to 50 years age bracket with 100.0% of them unmarried at the time of birth, while the lowest percentage of unmarried women with births belong to 20 to 34 years age bracket with 54.5% of them unmarried.
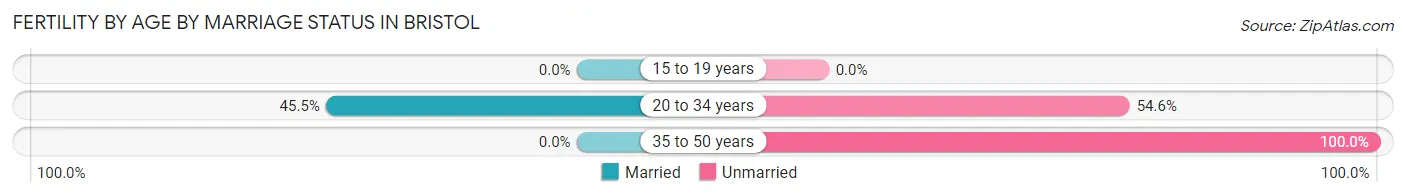
| Age Bracket | Married | Unmarried |
| 15 to 19 years | 0 (0.0%) | 0 (0.0%) |
| 20 to 34 years | 20 (45.5%) | 24 (54.5%) |
| 35 to 50 years | 0 (0.0%) | 3 (100.0%) |
| Total | 20 (42.5%) | 27 (57.5%) |
Fertility by Education in Bristol
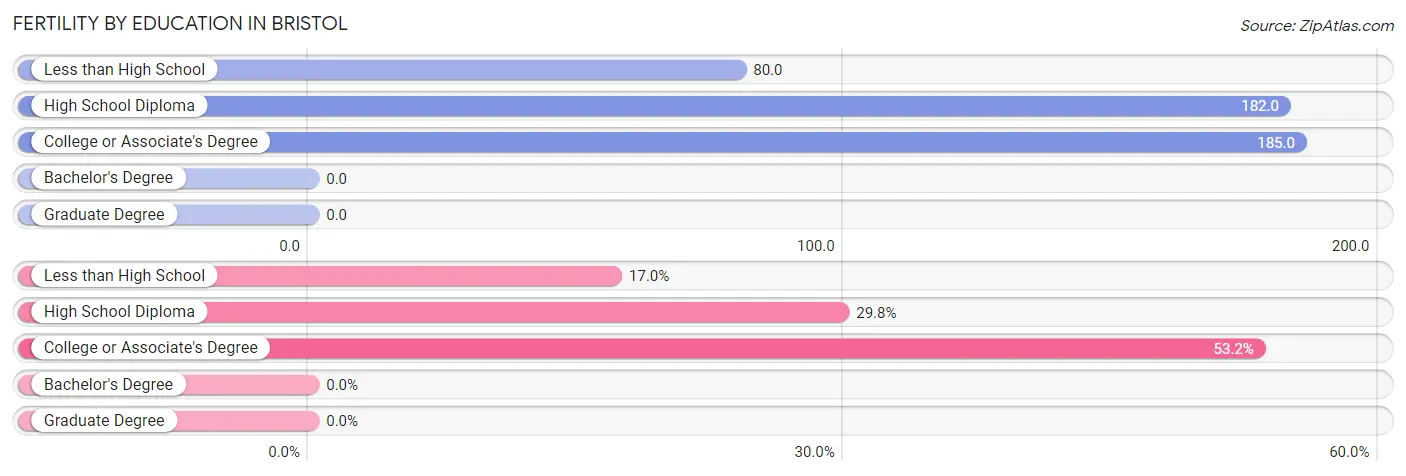
| Educational Attainment | Women with Births | Births / 1,000 Women |
| Less than High School | 8 (17.0%) | 80.0 |
| High School Diploma | 14 (29.8%) | 182.0 |
| College or Associate's Degree | 25 (53.2%) | 185.0 |
| Bachelor's Degree | 0 (0.0%) | 0.0 |
| Graduate Degree | 0 (0.0%) | 0.0 |
| Total | 47 (100.0%) | 138.0 |
Fertility by Education by Marriage Status in Bristol
57.5% of women with births in Bristol are unmarried. Women with the educational attainment of college or associate's degree are most likely to be married with 80.0% of them married at childbirth, while women with the educational attainment of less than high school are least likely to be married with 100.0% of them unmarried at childbirth.
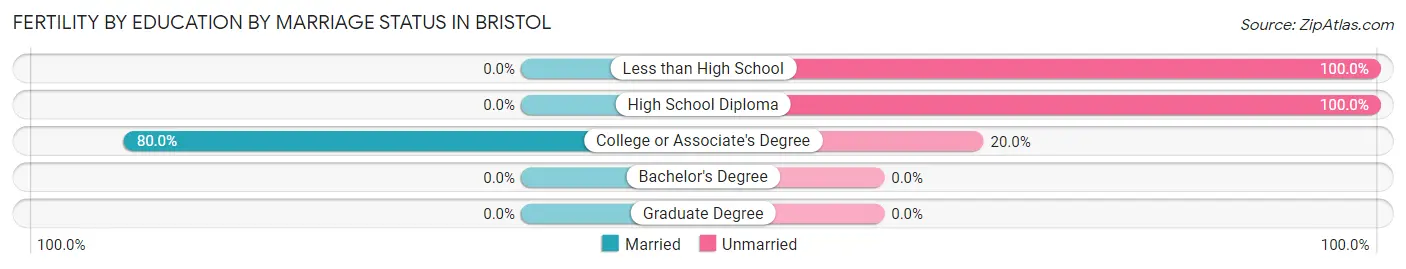
| Educational Attainment | Married | Unmarried |
| Less than High School | 0 (0.0%) | 8 (100.0%) |
| High School Diploma | 0 (0.0%) | 14 (100.0%) |
| College or Associate's Degree | 20 (80.0%) | 5 (20.0%) |
| Bachelor's Degree | 0 (0.0%) | 0 (0.0%) |
| Graduate Degree | 0 (0.0%) | 0 (0.0%) |
| Total | 20 (42.5%) | 27 (57.5%) |
Employment Characteristics in Bristol
Employment by Class of Employer in Bristol
Among the 917 employed individuals in Bristol, private company employees (757 | 82.6%), not-for-profit organizations (57 | 6.2%), and local government employees (45 | 4.9%) make up the most common classes of employment.
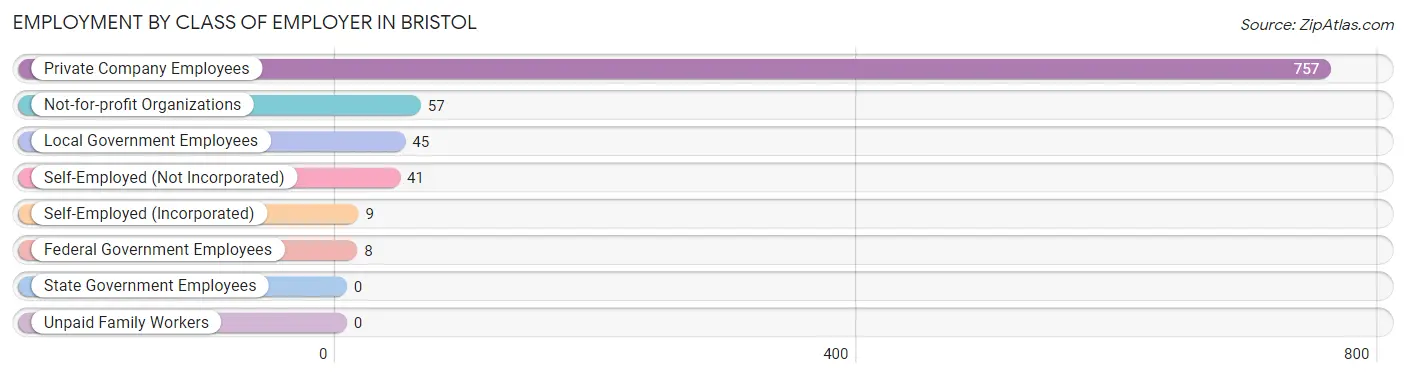
| Employer Class | # Employees | % Employees |
| Private Company Employees | 757 | 82.6% |
| Self-Employed (Incorporated) | 9 | 1.0% |
| Self-Employed (Not Incorporated) | 41 | 4.5% |
| Not-for-profit Organizations | 57 | 6.2% |
| Local Government Employees | 45 | 4.9% |
| State Government Employees | 0 | 0.0% |
| Federal Government Employees | 8 | 0.9% |
| Unpaid Family Workers | 0 | 0.0% |
| Total | 917 | 100.0% |
Employment Status by Age in Bristol
According to the labor force statistics for Bristol, out of the total population over 16 years of age (1,420), 65.3% or 927 individuals are in the labor force, with 0.3% or 3 of them unemployed. The age group with the highest labor force participation rate is 20 to 24 years, with 97.9% or 189 individuals in the labor force. Within the labor force, the 20 to 24 years age range has the highest percentage of unemployed individuals, with 1.6% or 3 of them being unemployed.
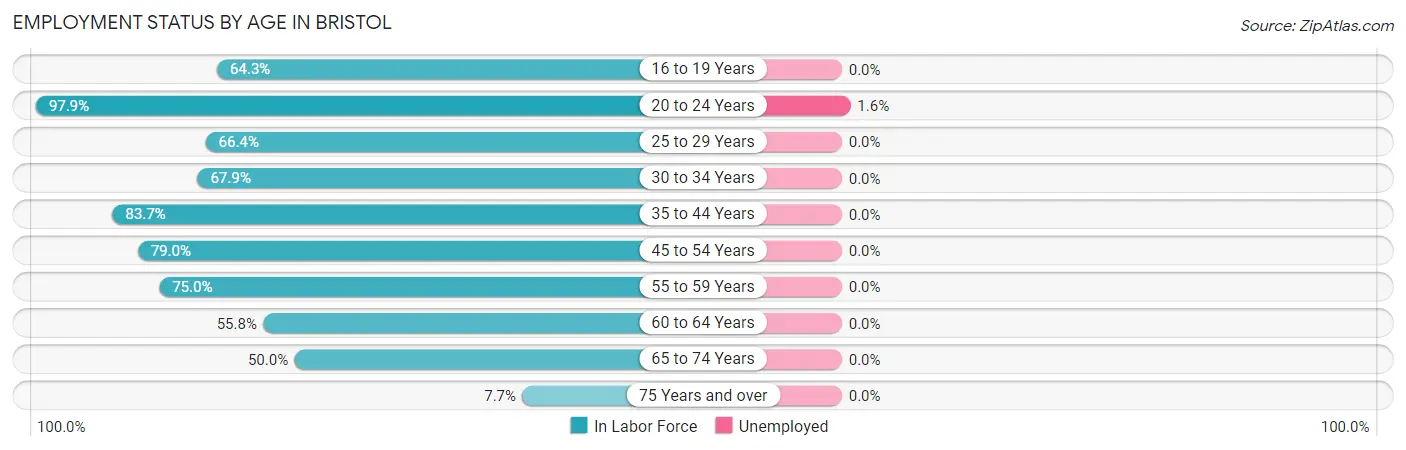
| Age Bracket | In Labor Force | Unemployed |
| 16 to 19 Years | 90 (64.3%) | 0 (0.0%) |
| 20 to 24 Years | 189 (97.9%) | 3 (1.6%) |
| 25 to 29 Years | 101 (66.4%) | 0 (0.0%) |
| 30 to 34 Years | 76 (67.9%) | 0 (0.0%) |
| 35 to 44 Years | 103 (83.7%) | 0 (0.0%) |
| 45 to 54 Years | 158 (79.0%) | 0 (0.0%) |
| 55 to 59 Years | 69 (75.0%) | 0 (0.0%) |
| 60 to 64 Years | 29 (55.8%) | 0 (0.0%) |
| 65 to 74 Years | 100 (50.0%) | 0 (0.0%) |
| 75 Years and over | 12 (7.7%) | 0 (0.0%) |
| Total | 927 (65.3%) | 3 (0.3%) |
Employment Status by Educational Attainment in Bristol
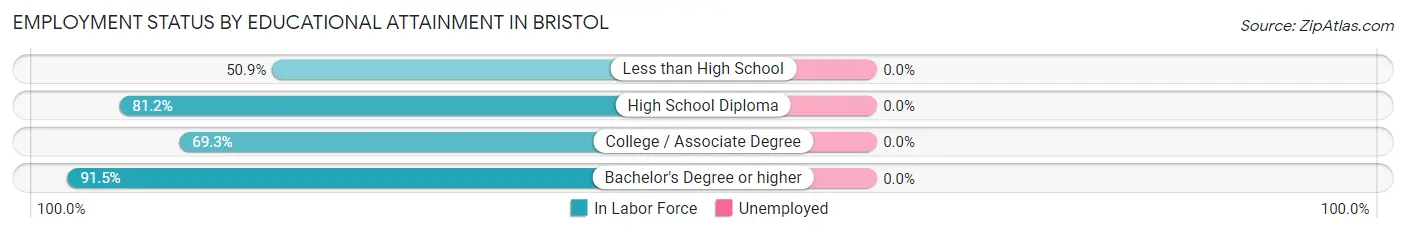
| Educational Attainment | In Labor Force | Unemployed |
| Less than High School | 54 (50.9%) | 0 (0.0%) |
| High School Diploma | 225 (81.2%) | 0 (0.0%) |
| College / Associate Degree | 192 (69.3%) | 0 (0.0%) |
| Bachelor's Degree or higher | 65 (91.5%) | 0 (0.0%) |
| Total | 536 (73.3%) | 0 (0.0%) |
Employment Occupations by Sex in Bristol
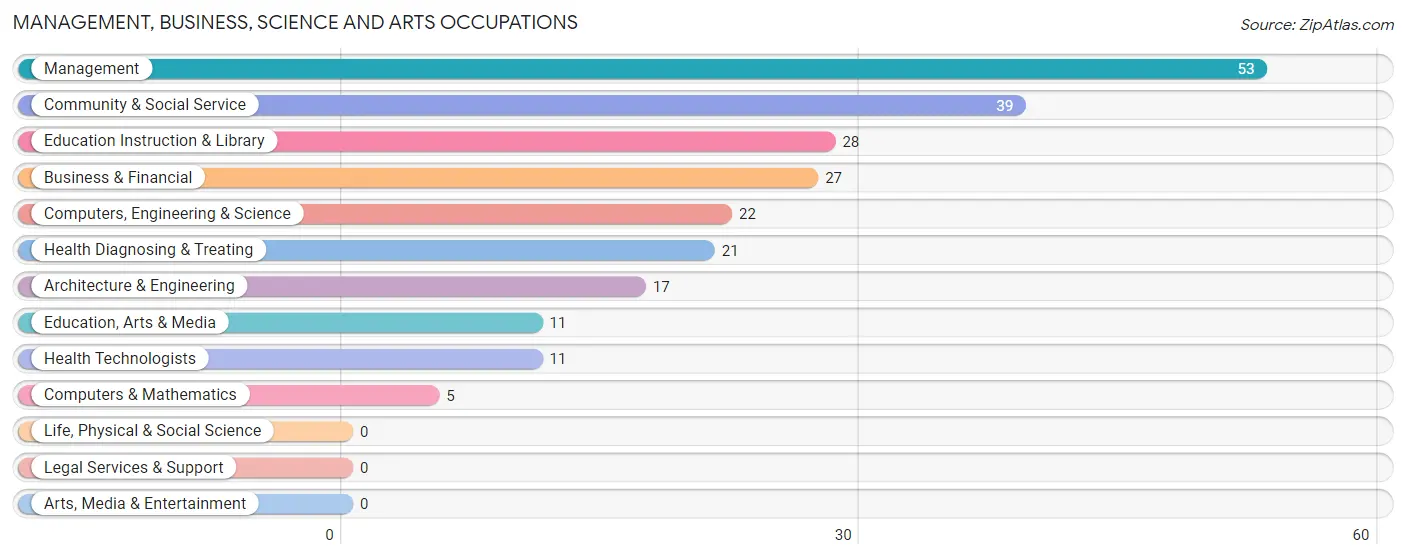
Management, Business, Science and Arts Occupations
The most common Management, Business, Science and Arts occupations in Bristol are Management (53 | 5.7%), Community & Social Service (39 | 4.2%), Education Instruction & Library (28 | 3.0%), Business & Financial (27 | 2.9%), and Computers, Engineering & Science (22 | 2.4%).
Management, Business, Science and Arts Occupations by Sex
Within the Management, Business, Science and Arts occupations in Bristol, the most male-oriented occupations are Computers & Mathematics (100.0%), Health Diagnosing & Treating (85.7%), and Health Technologists (72.7%), while the most female-oriented occupations are Business & Financial (100.0%), Education Instruction & Library (78.6%), and Community & Social Service (71.8%).
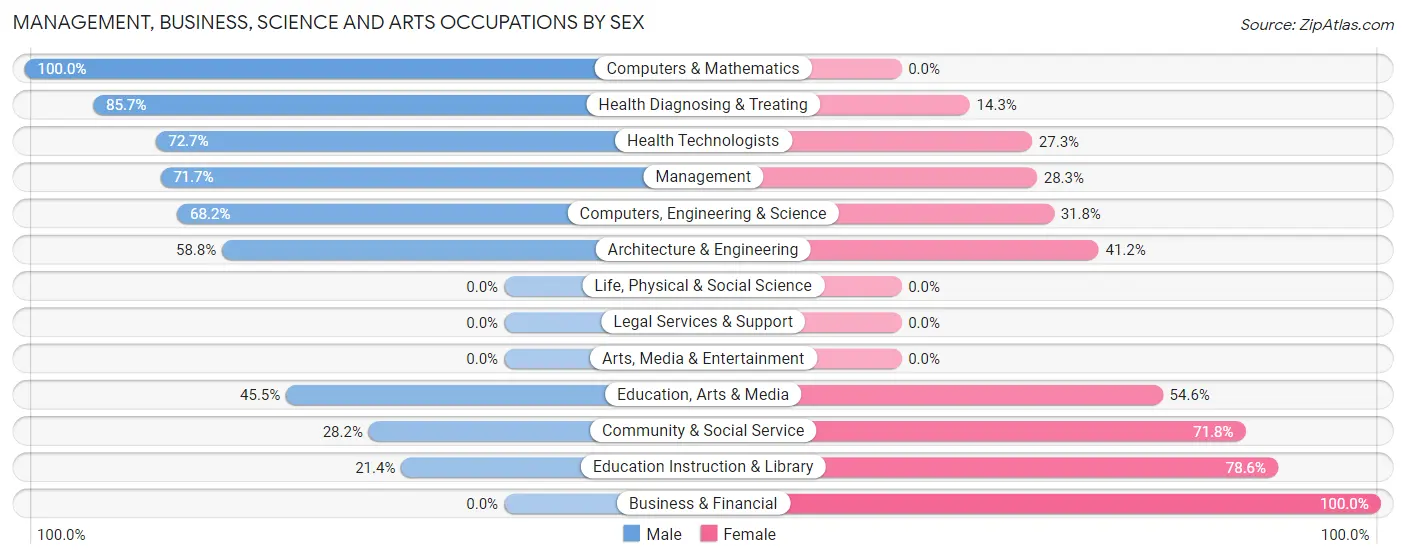
| Occupation | Male | Female |
| Management | 38 (71.7%) | 15 (28.3%) |
| Business & Financial | 0 (0.0%) | 27 (100.0%) |
| Computers, Engineering & Science | 15 (68.2%) | 7 (31.8%) |
| Computers & Mathematics | 5 (100.0%) | 0 (0.0%) |
| Architecture & Engineering | 10 (58.8%) | 7 (41.2%) |
| Life, Physical & Social Science | 0 (0.0%) | 0 (0.0%) |
| Community & Social Service | 11 (28.2%) | 28 (71.8%) |
| Education, Arts & Media | 5 (45.5%) | 6 (54.5%) |
| Legal Services & Support | 0 (0.0%) | 0 (0.0%) |
| Education Instruction & Library | 6 (21.4%) | 22 (78.6%) |
| Arts, Media & Entertainment | 0 (0.0%) | 0 (0.0%) |
| Health Diagnosing & Treating | 18 (85.7%) | 3 (14.3%) |
| Health Technologists | 8 (72.7%) | 3 (27.3%) |
| Total (Category) | 82 (50.6%) | 80 (49.4%) |
| Total (Overall) | 636 (68.8%) | 288 (31.2%) |
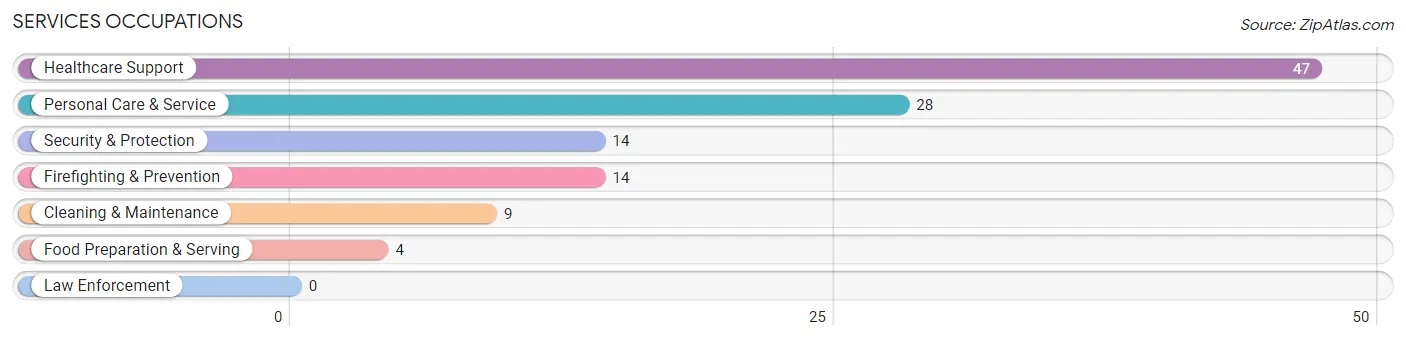
Services Occupations
The most common Services occupations in Bristol are Healthcare Support (47 | 5.1%), Personal Care & Service (28 | 3.0%), Security & Protection (14 | 1.5%), Firefighting & Prevention (14 | 1.5%), and Cleaning & Maintenance (9 | 1.0%).
Services Occupations by Sex
Within the Services occupations in Bristol, the most male-oriented occupations are Cleaning & Maintenance (33.3%), and Personal Care & Service (14.3%), while the most female-oriented occupations are Healthcare Support (100.0%), Security & Protection (100.0%), and Firefighting & Prevention (100.0%).
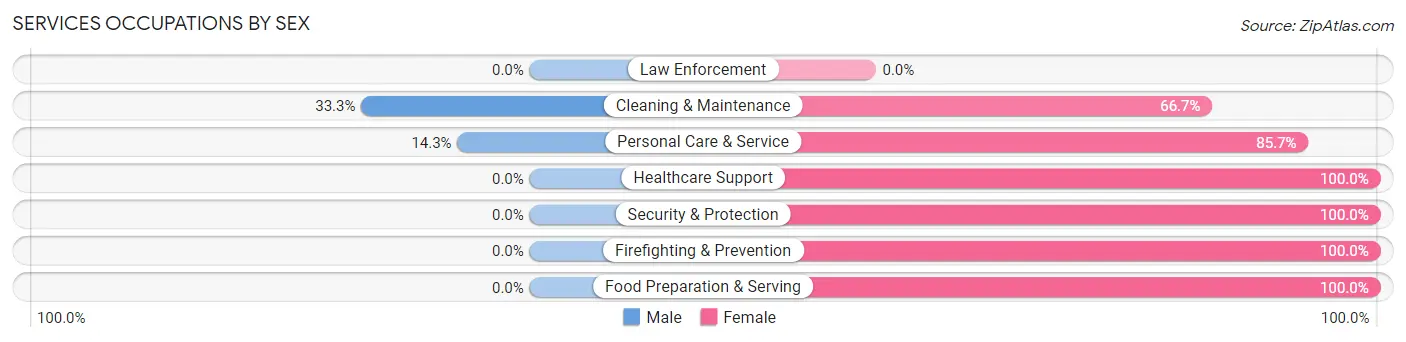
| Occupation | Male | Female |
| Healthcare Support | 0 (0.0%) | 47 (100.0%) |
| Security & Protection | 0 (0.0%) | 14 (100.0%) |
| Firefighting & Prevention | 0 (0.0%) | 14 (100.0%) |
| Law Enforcement | 0 (0.0%) | 0 (0.0%) |
| Food Preparation & Serving | 0 (0.0%) | 4 (100.0%) |
| Cleaning & Maintenance | 3 (33.3%) | 6 (66.7%) |
| Personal Care & Service | 4 (14.3%) | 24 (85.7%) |
| Total (Category) | 7 (6.9%) | 95 (93.1%) |
| Total (Overall) | 636 (68.8%) | 288 (31.2%) |
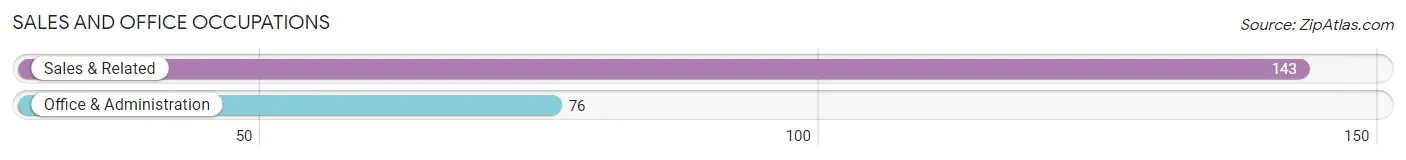
Sales and Office Occupations
The most common Sales and Office occupations in Bristol are Sales & Related (143 | 15.5%), and Office & Administration (76 | 8.2%).
Sales and Office Occupations by Sex
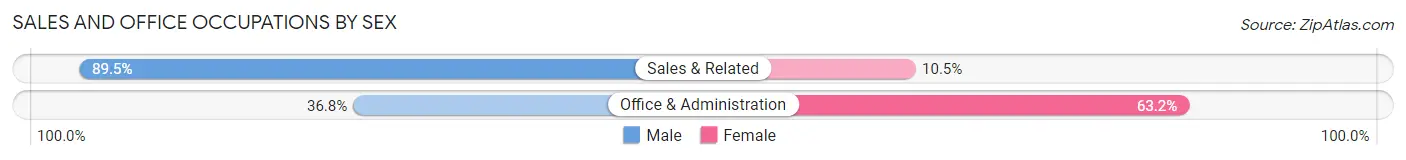
| Occupation | Male | Female |
| Sales & Related | 128 (89.5%) | 15 (10.5%) |
| Office & Administration | 28 (36.8%) | 48 (63.2%) |
| Total (Category) | 156 (71.2%) | 63 (28.8%) |
| Total (Overall) | 636 (68.8%) | 288 (31.2%) |
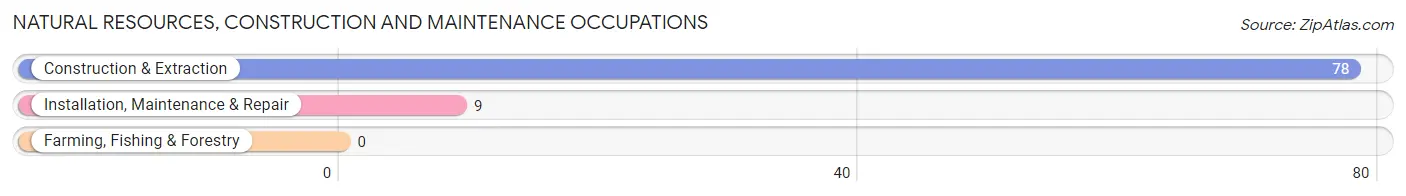
Natural Resources, Construction and Maintenance Occupations
The most common Natural Resources, Construction and Maintenance occupations in Bristol are Construction & Extraction (78 | 8.4%), and Installation, Maintenance & Repair (9 | 1.0%).
Natural Resources, Construction and Maintenance Occupations by Sex
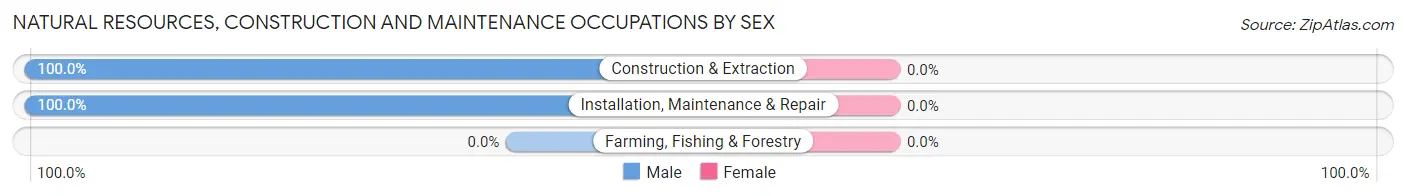
| Occupation | Male | Female |
| Farming, Fishing & Forestry | 0 (0.0%) | 0 (0.0%) |
| Construction & Extraction | 78 (100.0%) | 0 (0.0%) |
| Installation, Maintenance & Repair | 9 (100.0%) | 0 (0.0%) |
| Total (Category) | 87 (100.0%) | 0 (0.0%) |
| Total (Overall) | 636 (68.8%) | 288 (31.2%) |
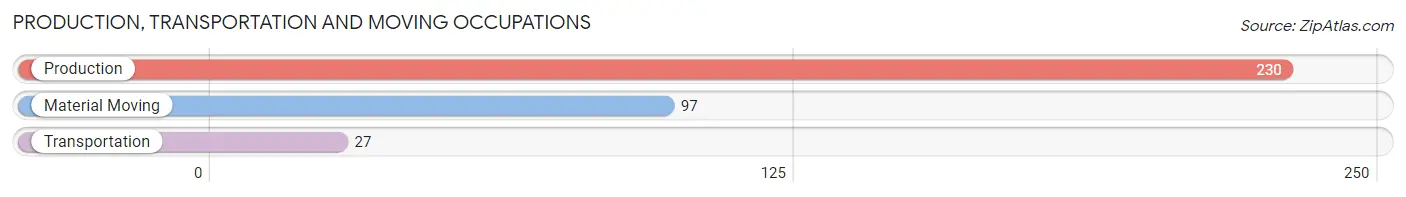
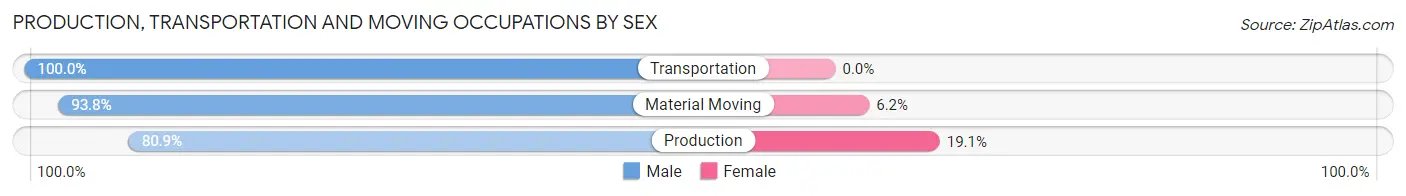
Production, Transportation and Moving Occupations
The most common Production, Transportation and Moving occupations in Bristol are Production (230 | 24.9%), Material Moving (97 | 10.5%), and Transportation (27 | 2.9%).
Production, Transportation and Moving Occupations by Sex
| Occupation | Male | Female |
| Production | 186 (80.9%) | 44 (19.1%) |
| Transportation | 27 (100.0%) | 0 (0.0%) |
| Material Moving | 91 (93.8%) | 6 (6.2%) |
| Total (Category) | 304 (85.9%) | 50 (14.1%) |
| Total (Overall) | 636 (68.8%) | 288 (31.2%) |
Employment Industries by Sex in Bristol
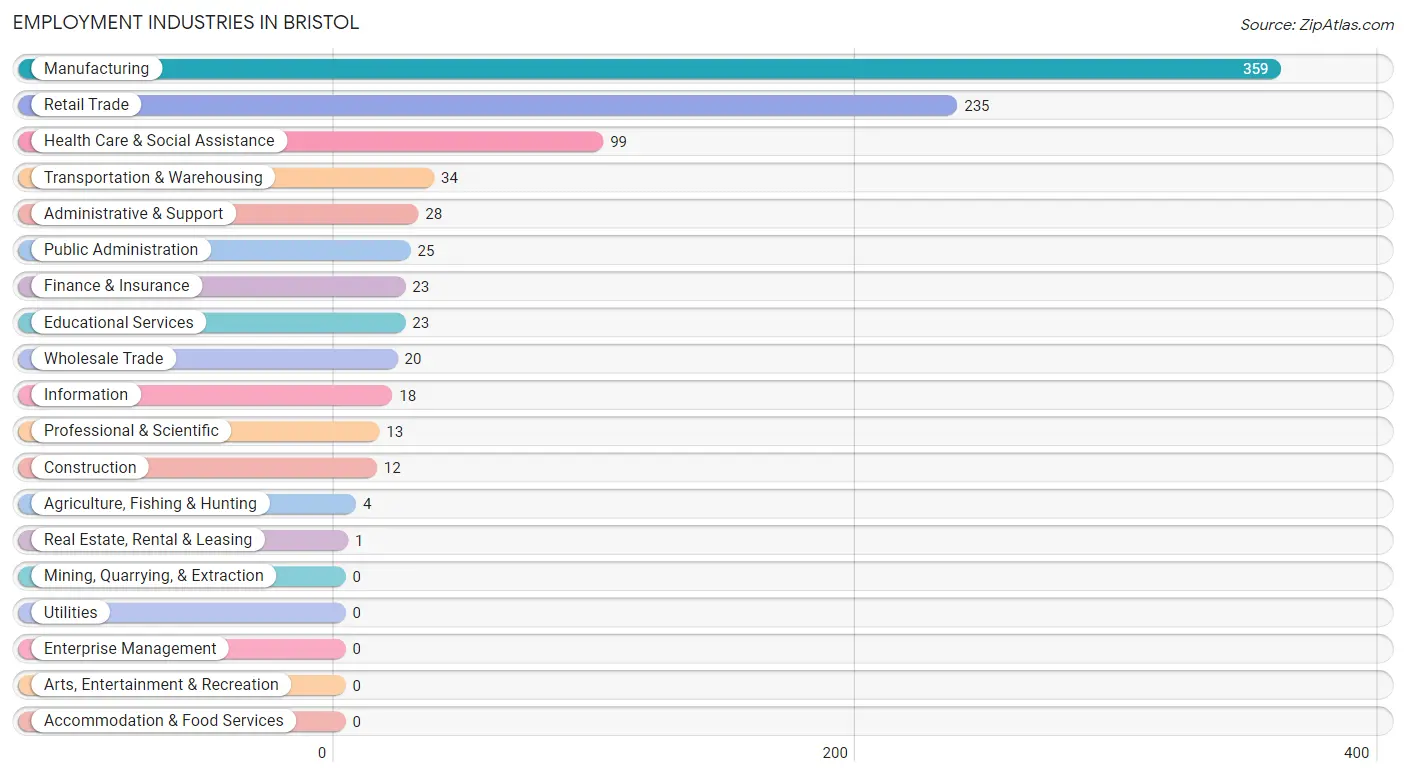
Employment Industries in Bristol
The major employment industries in Bristol include Manufacturing (359 | 38.9%), Retail Trade (235 | 25.4%), Health Care & Social Assistance (99 | 10.7%), Transportation & Warehousing (34 | 3.7%), and Administrative & Support (28 | 3.0%).
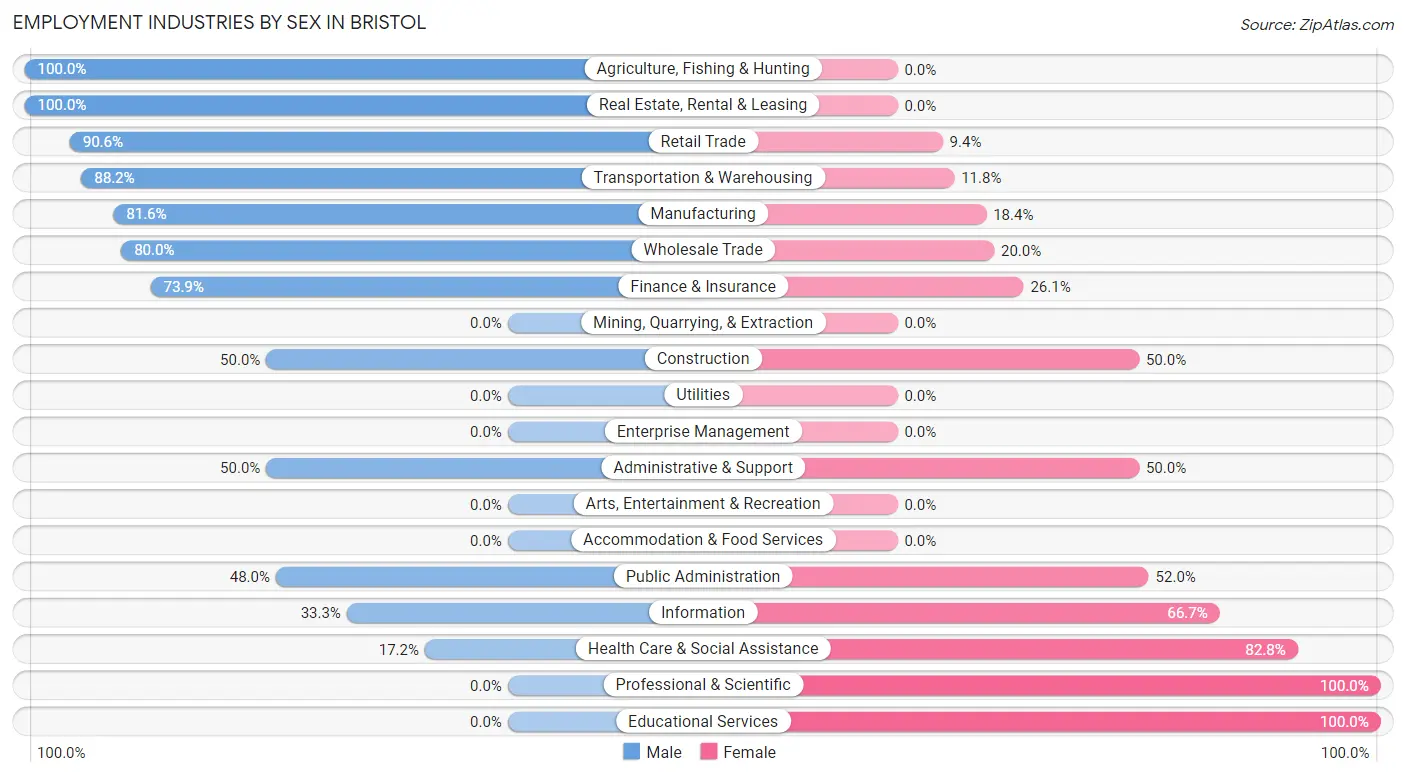
Employment Industries by Sex in Bristol
The Bristol industries that see more men than women are Agriculture, Fishing & Hunting (100.0%), Real Estate, Rental & Leasing (100.0%), and Retail Trade (90.6%), whereas the industries that tend to have a higher number of women are Professional & Scientific (100.0%), Educational Services (100.0%), and Health Care & Social Assistance (82.8%).
| Industry | Male | Female |
| Agriculture, Fishing & Hunting | 4 (100.0%) | 0 (0.0%) |
| Mining, Quarrying, & Extraction | 0 (0.0%) | 0 (0.0%) |
| Construction | 6 (50.0%) | 6 (50.0%) |
| Manufacturing | 293 (81.6%) | 66 (18.4%) |
| Wholesale Trade | 16 (80.0%) | 4 (20.0%) |
| Retail Trade | 213 (90.6%) | 22 (9.4%) |
| Transportation & Warehousing | 30 (88.2%) | 4 (11.8%) |
| Utilities | 0 (0.0%) | 0 (0.0%) |
| Information | 6 (33.3%) | 12 (66.7%) |
| Finance & Insurance | 17 (73.9%) | 6 (26.1%) |
| Real Estate, Rental & Leasing | 1 (100.0%) | 0 (0.0%) |
| Professional & Scientific | 0 (0.0%) | 13 (100.0%) |
| Enterprise Management | 0 (0.0%) | 0 (0.0%) |
| Administrative & Support | 14 (50.0%) | 14 (50.0%) |
| Educational Services | 0 (0.0%) | 23 (100.0%) |
| Health Care & Social Assistance | 17 (17.2%) | 82 (82.8%) |
| Arts, Entertainment & Recreation | 0 (0.0%) | 0 (0.0%) |
| Accommodation & Food Services | 0 (0.0%) | 0 (0.0%) |
| Public Administration | 12 (48.0%) | 13 (52.0%) |
| Total | 636 (68.8%) | 288 (31.2%) |
Education in Bristol
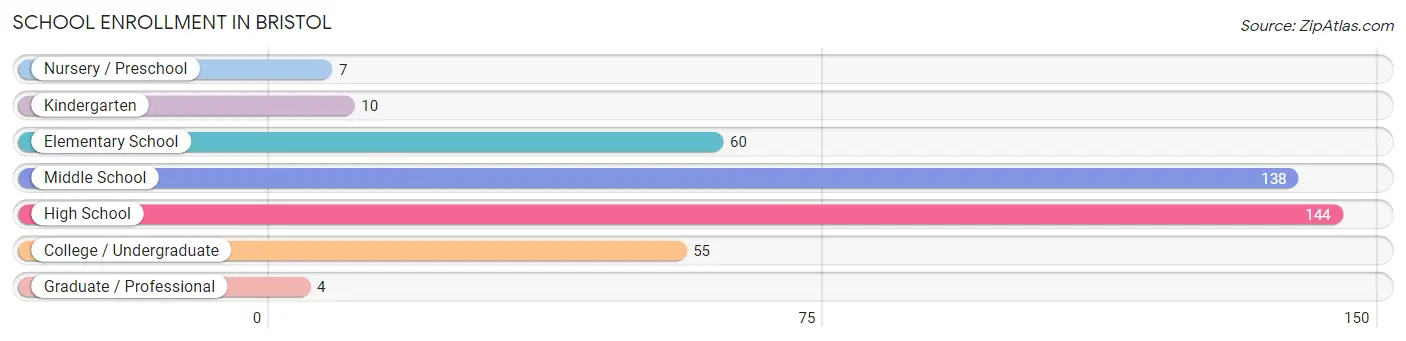
School Enrollment in Bristol
The most common levels of schooling among the 418 students in Bristol are high school (144 | 34.4%), middle school (138 | 33.0%), and elementary school (60 | 14.3%).
| School Level | # Students | % Students |
| Nursery / Preschool | 7 | 1.7% |
| Kindergarten | 10 | 2.4% |
| Elementary School | 60 | 14.3% |
| Middle School | 138 | 33.0% |
| High School | 144 | 34.4% |
| College / Undergraduate | 55 | 13.2% |
| Graduate / Professional | 4 | 1.0% |
| Total | 418 | 100.0% |
School Enrollment by Age by Funding Source in Bristol
Out of a total of 418 students who are enrolled in schools in Bristol, 13 (3.1%) attend a private institution, while the remaining 405 (96.9%) are enrolled in public schools. The age group of 5 to 9 year old has the highest likelihood of being enrolled in private schools, with 7 (9.1% in the age bracket) enrolled. Conversely, the age group of 20 to 24 year olds has the lowest likelihood of being enrolled in a private school, with 12 (100.0% in the age bracket) attending a public institution.
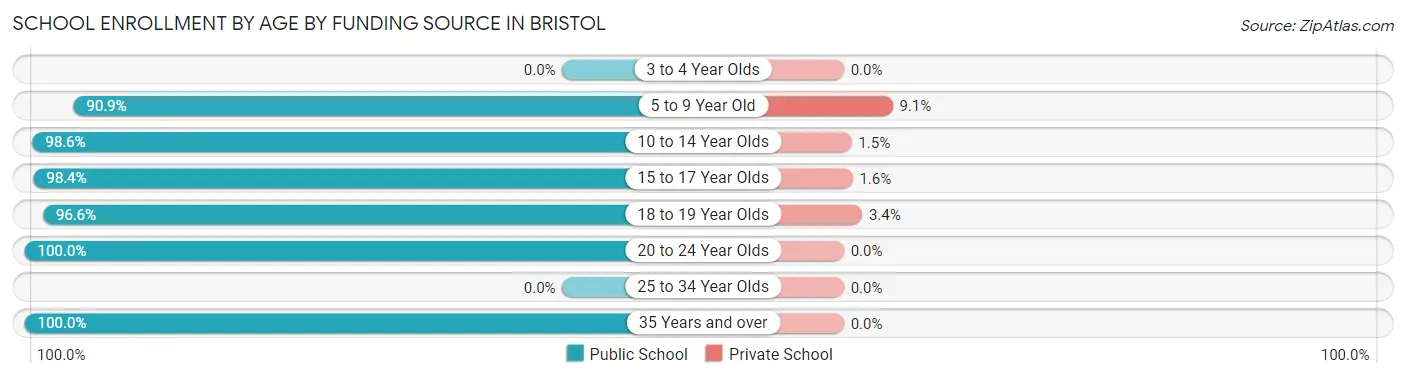
| Age Bracket | Public School | Private School |
| 3 to 4 Year Olds | 0 (0.0%) | 0 (0.0%) |
| 5 to 9 Year Old | 70 (90.9%) | 7 (9.1%) |
| 10 to 14 Year Olds | 136 (98.6%) | 2 (1.5%) |
| 15 to 17 Year Olds | 60 (98.4%) | 1 (1.6%) |
| 18 to 19 Year Olds | 85 (96.6%) | 3 (3.4%) |
| 20 to 24 Year Olds | 12 (100.0%) | 0 (0.0%) |
| 25 to 34 Year Olds | 0 (0.0%) | 0 (0.0%) |
| 35 Years and over | 42 (100.0%) | 0 (0.0%) |
| Total | 405 (96.9%) | 13 (3.1%) |
Educational Attainment by Field of Study in Bristol
Education (47 | 17.2%), business (46 | 16.8%), science & technology (29 | 10.6%), literature & languages (25 | 9.1%), and social sciences (23 | 8.4%) are the most common fields of study among 274 individuals in Bristol who have obtained a bachelor's degree or higher.
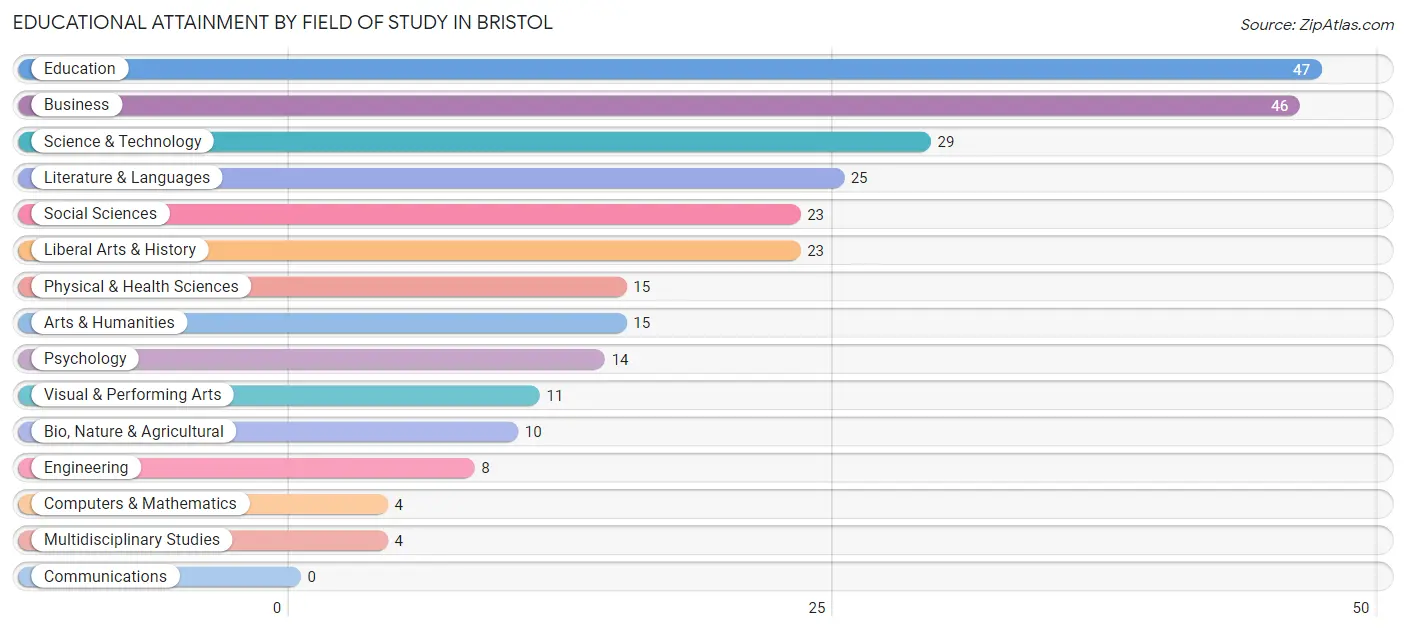
| Field of Study | # Graduates | % Graduates |
| Computers & Mathematics | 4 | 1.5% |
| Bio, Nature & Agricultural | 10 | 3.6% |
| Physical & Health Sciences | 15 | 5.5% |
| Psychology | 14 | 5.1% |
| Social Sciences | 23 | 8.4% |
| Engineering | 8 | 2.9% |
| Multidisciplinary Studies | 4 | 1.5% |
| Science & Technology | 29 | 10.6% |
| Business | 46 | 16.8% |
| Education | 47 | 17.2% |
| Literature & Languages | 25 | 9.1% |
| Liberal Arts & History | 23 | 8.4% |
| Visual & Performing Arts | 11 | 4.0% |
| Communications | 0 | 0.0% |
| Arts & Humanities | 15 | 5.5% |
| Total | 274 | 100.0% |
Transportation & Commute in Bristol
Vehicle Availability by Sex in Bristol
The most prevalent vehicle ownership categories in Bristol are males with 4 vehicles (213, accounting for 33.7%) and females with 4 vehicles (61, making up 75.0%).
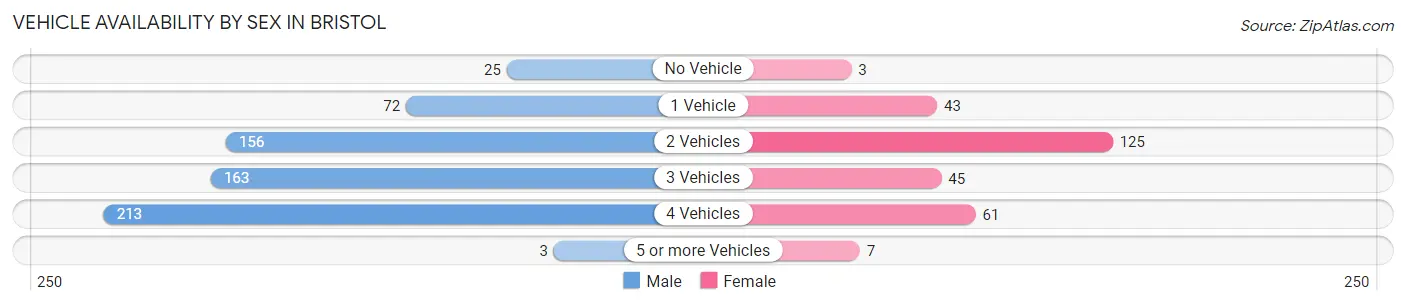
| Vehicles Available | Male | Female |
| No Vehicle | 25 (4.0%) | 3 (1.1%) |
| 1 Vehicle | 72 (11.4%) | 43 (15.1%) |
| 2 Vehicles | 156 (24.7%) | 125 (44.0%) |
| 3 Vehicles | 163 (25.8%) | 45 (15.9%) |
| 4 Vehicles | 213 (33.7%) | 61 (21.5%) |
| 5 or more Vehicles | 3 (0.5%) | 7 (2.5%) |
| Total | 632 (100.0%) | 284 (100.0%) |
Commute Time in Bristol
The most frequently occuring commute durations in Bristol are 15 to 19 minutes (287 commuters, 32.3%), 25 to 29 minutes (153 commuters, 17.2%), and 20 to 24 minutes (116 commuters, 13.1%).
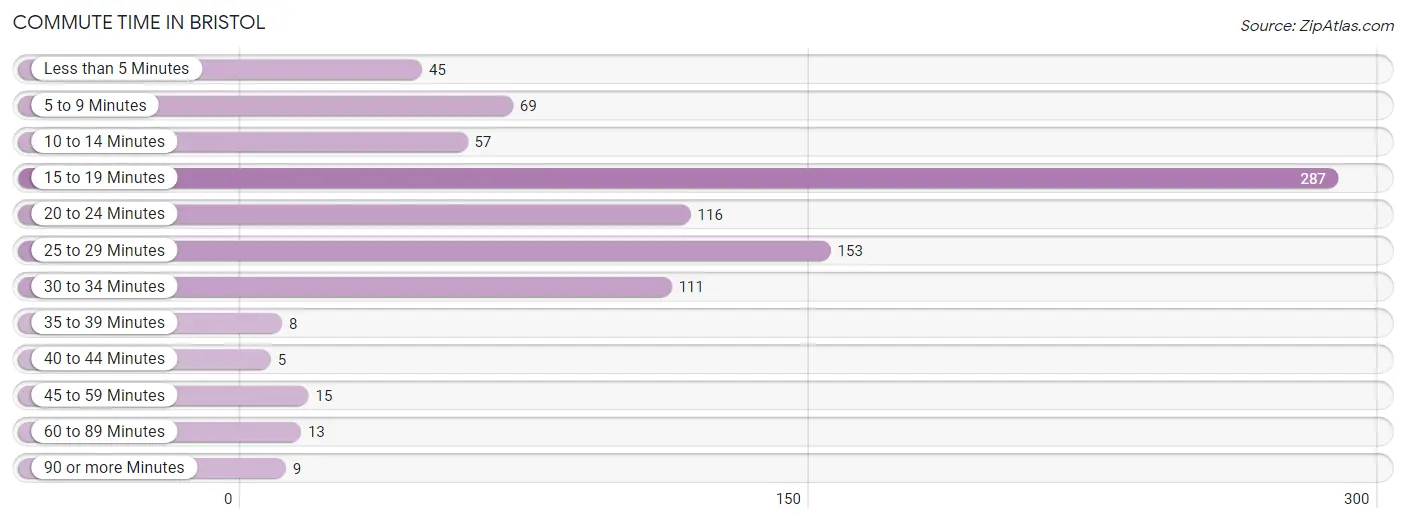
| Commute Time | # Commuters | % Commuters |
| Less than 5 Minutes | 45 | 5.1% |
| 5 to 9 Minutes | 69 | 7.8% |
| 10 to 14 Minutes | 57 | 6.4% |
| 15 to 19 Minutes | 287 | 32.3% |
| 20 to 24 Minutes | 116 | 13.1% |
| 25 to 29 Minutes | 153 | 17.2% |
| 30 to 34 Minutes | 111 | 12.5% |
| 35 to 39 Minutes | 8 | 0.9% |
| 40 to 44 Minutes | 5 | 0.6% |
| 45 to 59 Minutes | 15 | 1.7% |
| 60 to 89 Minutes | 13 | 1.5% |
| 90 or more Minutes | 9 | 1.0% |
Commute Time by Sex in Bristol
The most common commute times in Bristol are 15 to 19 minutes (254 commuters, 40.6%) for males and 30 to 34 minutes (67 commuters, 25.6%) for females.
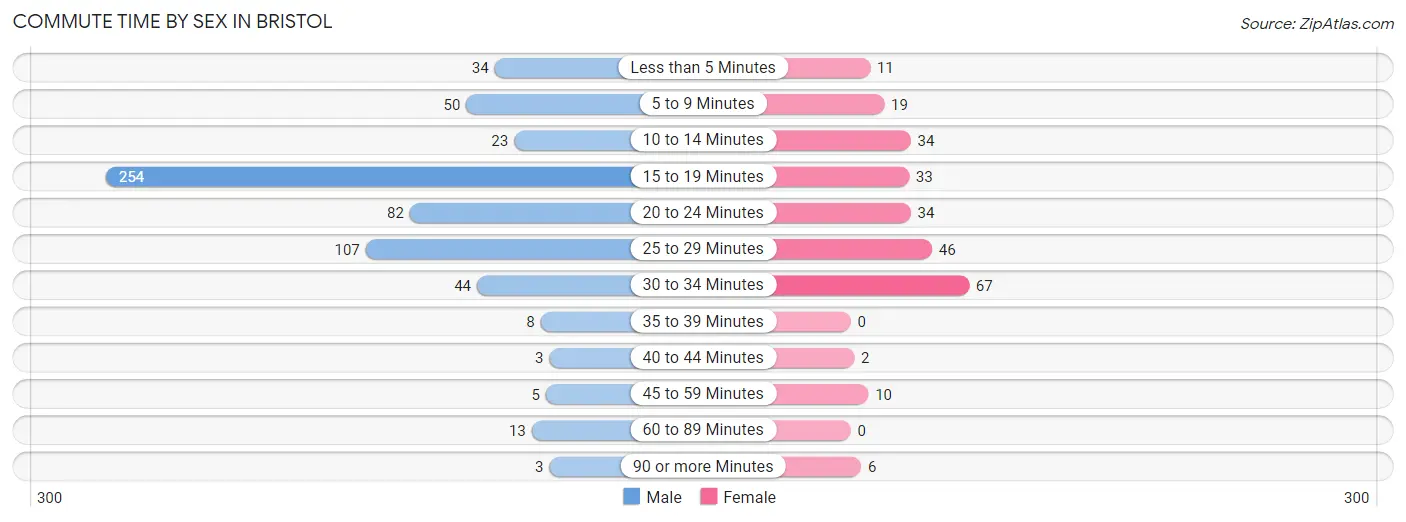
| Commute Time | Male | Female |
| Less than 5 Minutes | 34 (5.4%) | 11 (4.2%) |
| 5 to 9 Minutes | 50 (8.0%) | 19 (7.2%) |
| 10 to 14 Minutes | 23 (3.7%) | 34 (13.0%) |
| 15 to 19 Minutes | 254 (40.6%) | 33 (12.6%) |
| 20 to 24 Minutes | 82 (13.1%) | 34 (13.0%) |
| 25 to 29 Minutes | 107 (17.1%) | 46 (17.6%) |
| 30 to 34 Minutes | 44 (7.0%) | 67 (25.6%) |
| 35 to 39 Minutes | 8 (1.3%) | 0 (0.0%) |
| 40 to 44 Minutes | 3 (0.5%) | 2 (0.8%) |
| 45 to 59 Minutes | 5 (0.8%) | 10 (3.8%) |
| 60 to 89 Minutes | 13 (2.1%) | 0 (0.0%) |
| 90 or more Minutes | 3 (0.5%) | 6 (2.3%) |
Time of Departure to Work by Sex in Bristol
The most frequent times of departure to work in Bristol are 12:00 AM to 4:59 AM (134, 21.4%) for males and 5:30 AM to 5:59 AM (52, 19.9%) for females.
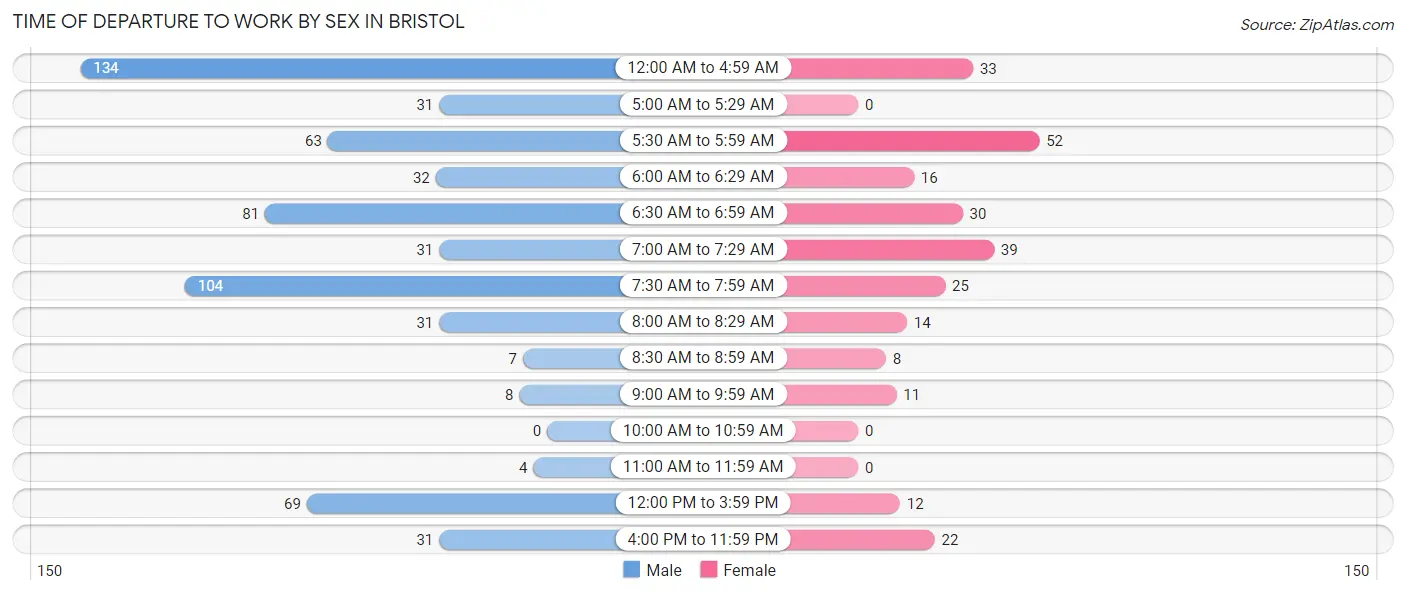
| Time of Departure | Male | Female |
| 12:00 AM to 4:59 AM | 134 (21.4%) | 33 (12.6%) |
| 5:00 AM to 5:29 AM | 31 (5.0%) | 0 (0.0%) |
| 5:30 AM to 5:59 AM | 63 (10.1%) | 52 (19.9%) |
| 6:00 AM to 6:29 AM | 32 (5.1%) | 16 (6.1%) |
| 6:30 AM to 6:59 AM | 81 (12.9%) | 30 (11.5%) |
| 7:00 AM to 7:29 AM | 31 (5.0%) | 39 (14.9%) |
| 7:30 AM to 7:59 AM | 104 (16.6%) | 25 (9.5%) |
| 8:00 AM to 8:29 AM | 31 (5.0%) | 14 (5.3%) |
| 8:30 AM to 8:59 AM | 7 (1.1%) | 8 (3.0%) |
| 9:00 AM to 9:59 AM | 8 (1.3%) | 11 (4.2%) |
| 10:00 AM to 10:59 AM | 0 (0.0%) | 0 (0.0%) |
| 11:00 AM to 11:59 AM | 4 (0.6%) | 0 (0.0%) |
| 12:00 PM to 3:59 PM | 69 (11.0%) | 12 (4.6%) |
| 4:00 PM to 11:59 PM | 31 (5.0%) | 22 (8.4%) |
| Total | 626 (100.0%) | 262 (100.0%) |
Housing Occupancy in Bristol
Occupancy by Ownership in Bristol
Of the total 637 dwellings in Bristol, owner-occupied units account for 469 (73.6%), while renter-occupied units make up 168 (26.4%).
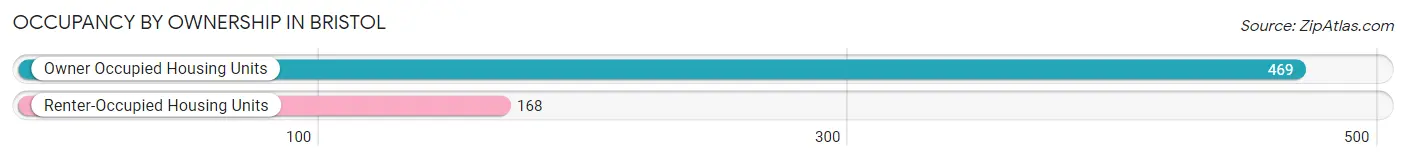
| Occupancy | # Housing Units | % Housing Units |
| Owner Occupied Housing Units | 469 | 73.6% |
| Renter-Occupied Housing Units | 168 | 26.4% |
| Total Occupied Housing Units | 637 | 100.0% |
Occupancy by Household Size in Bristol
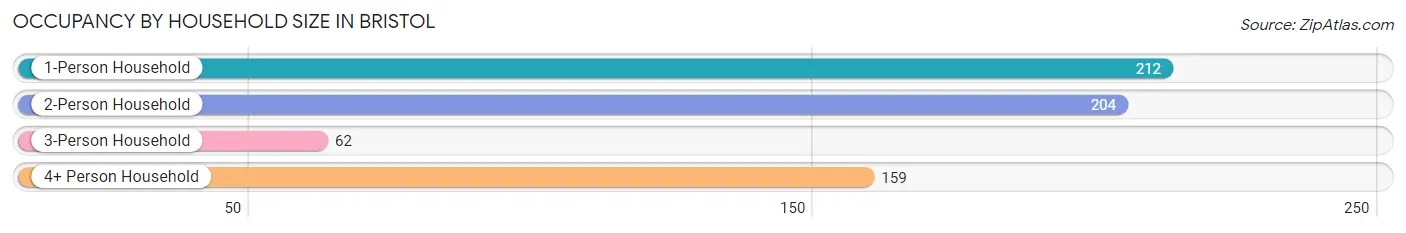
| Household Size | # Housing Units | % Housing Units |
| 1-Person Household | 212 | 33.3% |
| 2-Person Household | 204 | 32.0% |
| 3-Person Household | 62 | 9.7% |
| 4+ Person Household | 159 | 25.0% |
| Total Housing Units | 637 | 100.0% |
Occupancy by Ownership by Household Size in Bristol
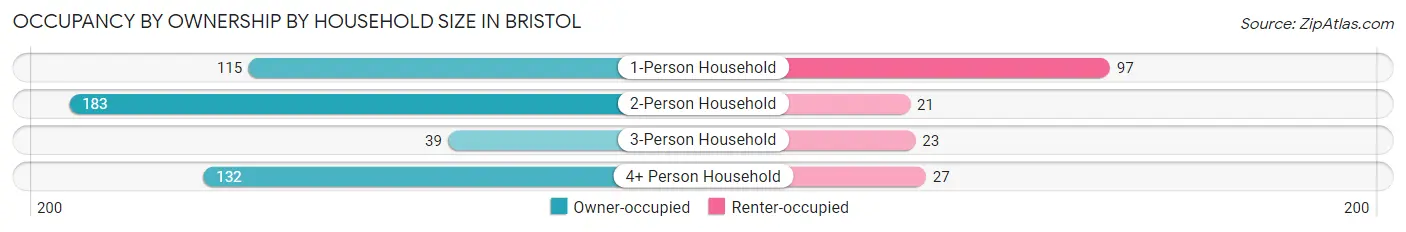
| Household Size | Owner-occupied | Renter-occupied |
| 1-Person Household | 115 (54.2%) | 97 (45.8%) |
| 2-Person Household | 183 (89.7%) | 21 (10.3%) |
| 3-Person Household | 39 (62.9%) | 23 (37.1%) |
| 4+ Person Household | 132 (83.0%) | 27 (17.0%) |
| Total Housing Units | 469 (73.6%) | 168 (26.4%) |
Occupancy by Educational Attainment in Bristol
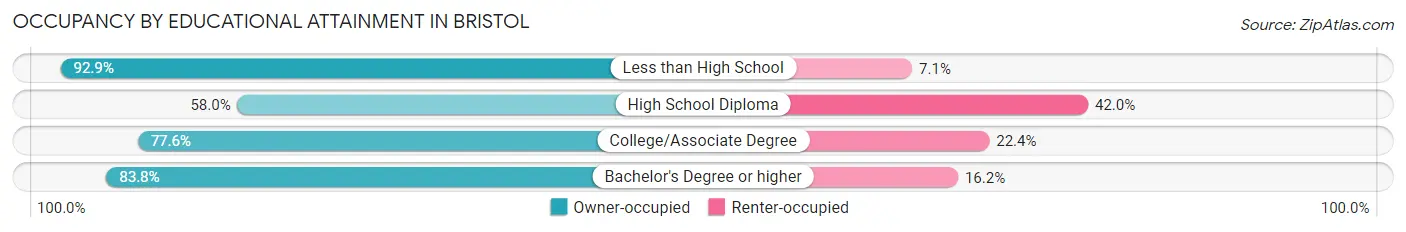
| Household Size | Owner-occupied | Renter-occupied |
| Less than High School | 52 (92.9%) | 4 (7.1%) |
| High School Diploma | 127 (58.0%) | 92 (42.0%) |
| College/Associate Degree | 166 (77.6%) | 48 (22.4%) |
| Bachelor's Degree or higher | 124 (83.8%) | 24 (16.2%) |
Occupancy by Age of Householder in Bristol
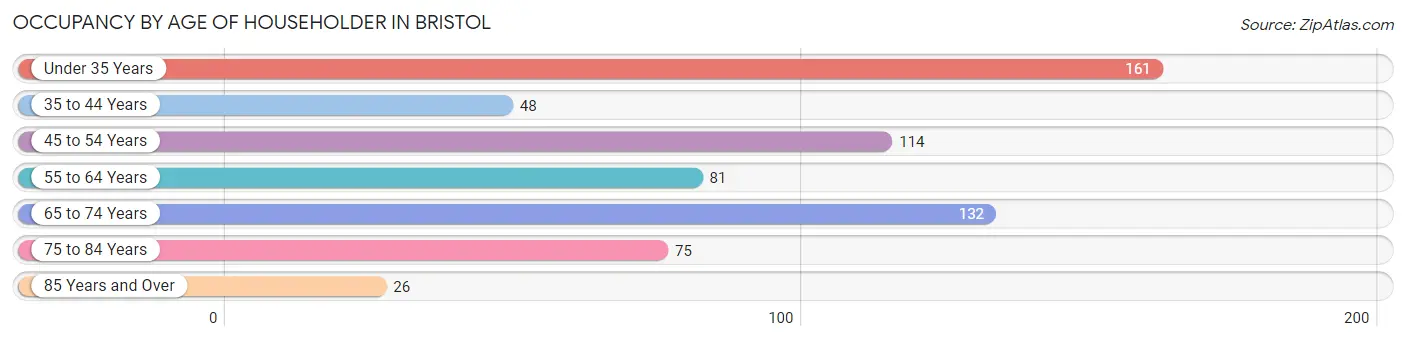
| Age Bracket | # Households | % Households |
| Under 35 Years | 161 | 25.3% |
| 35 to 44 Years | 48 | 7.5% |
| 45 to 54 Years | 114 | 17.9% |
| 55 to 64 Years | 81 | 12.7% |
| 65 to 74 Years | 132 | 20.7% |
| 75 to 84 Years | 75 | 11.8% |
| 85 Years and Over | 26 | 4.1% |
| Total | 637 | 100.0% |
Housing Finances in Bristol
Median Income by Occupancy in Bristol
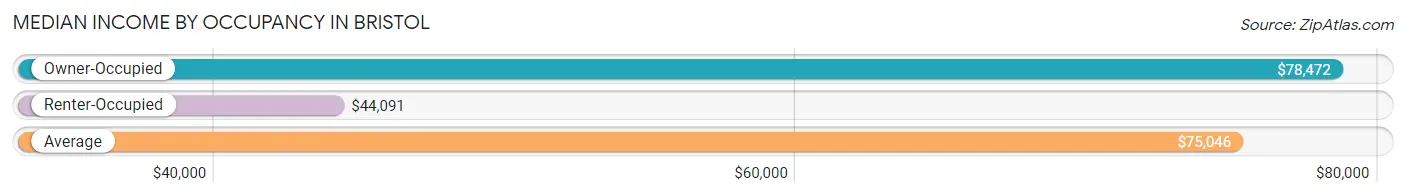
| Occupancy Type | # Households | Median Income |
| Owner-Occupied | 469 (73.6%) | $78,472 |
| Renter-Occupied | 168 (26.4%) | $44,091 |
| Average | 637 (100.0%) | $75,046 |
Occupancy by Householder Income Bracket in Bristol
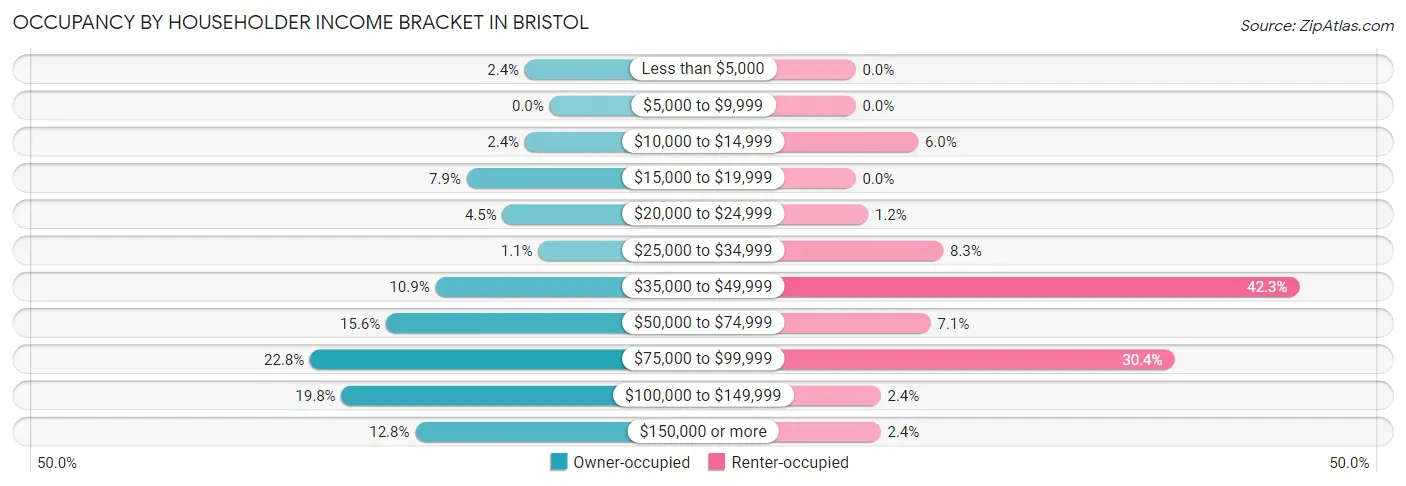
| Income Bracket | Owner-occupied | Renter-occupied |
| Less than $5,000 | 11 (2.4%) | 0 (0.0%) |
| $5,000 to $9,999 | 0 (0.0%) | 0 (0.0%) |
| $10,000 to $14,999 | 11 (2.4%) | 10 (5.9%) |
| $15,000 to $19,999 | 37 (7.9%) | 0 (0.0%) |
| $20,000 to $24,999 | 21 (4.5%) | 2 (1.2%) |
| $25,000 to $34,999 | 5 (1.1%) | 14 (8.3%) |
| $35,000 to $49,999 | 51 (10.9%) | 71 (42.3%) |
| $50,000 to $74,999 | 73 (15.6%) | 12 (7.1%) |
| $75,000 to $99,999 | 107 (22.8%) | 51 (30.4%) |
| $100,000 to $149,999 | 93 (19.8%) | 4 (2.4%) |
| $150,000 or more | 60 (12.8%) | 4 (2.4%) |
| Total | 469 (100.0%) | 168 (100.0%) |
Monthly Housing Cost Tiers in Bristol
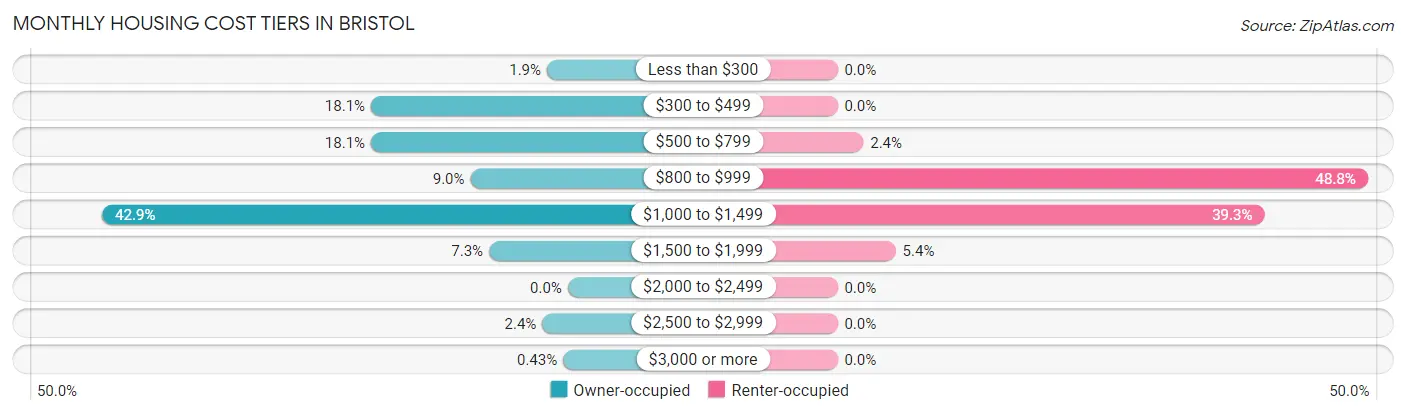
| Monthly Cost | Owner-occupied | Renter-occupied |
| Less than $300 | 9 (1.9%) | 0 (0.0%) |
| $300 to $499 | 85 (18.1%) | 0 (0.0%) |
| $500 to $799 | 85 (18.1%) | 4 (2.4%) |
| $800 to $999 | 42 (9.0%) | 82 (48.8%) |
| $1,000 to $1,499 | 201 (42.9%) | 66 (39.3%) |
| $1,500 to $1,999 | 34 (7.2%) | 9 (5.4%) |
| $2,000 to $2,499 | 0 (0.0%) | 0 (0.0%) |
| $2,500 to $2,999 | 11 (2.4%) | 0 (0.0%) |
| $3,000 or more | 2 (0.4%) | 0 (0.0%) |
| Total | 469 (100.0%) | 168 (100.0%) |
Physical Housing Characteristics in Bristol
Housing Structures in Bristol
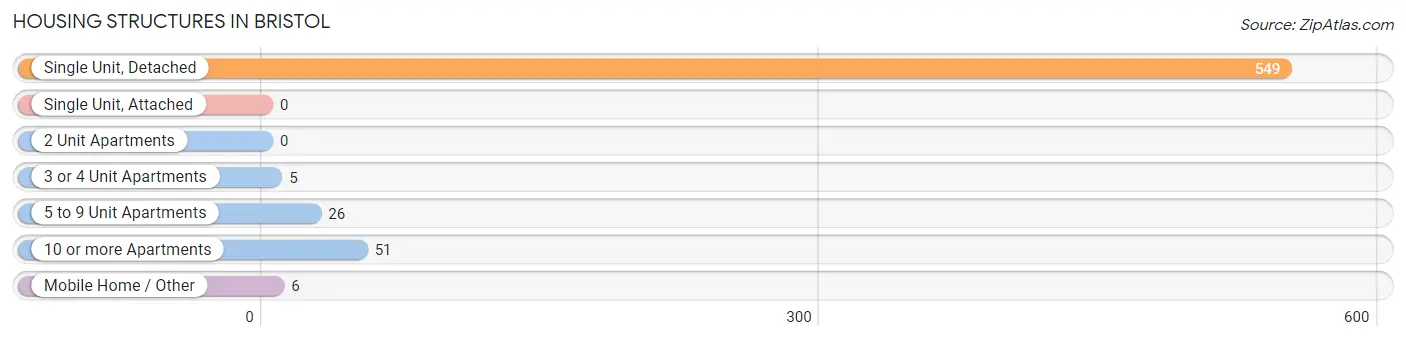
| Structure Type | # Housing Units | % Housing Units |
| Single Unit, Detached | 549 | 86.2% |
| Single Unit, Attached | 0 | 0.0% |
| 2 Unit Apartments | 0 | 0.0% |
| 3 or 4 Unit Apartments | 5 | 0.8% |
| 5 to 9 Unit Apartments | 26 | 4.1% |
| 10 or more Apartments | 51 | 8.0% |
| Mobile Home / Other | 6 | 0.9% |
| Total | 637 | 100.0% |
Housing Structures by Occupancy in Bristol
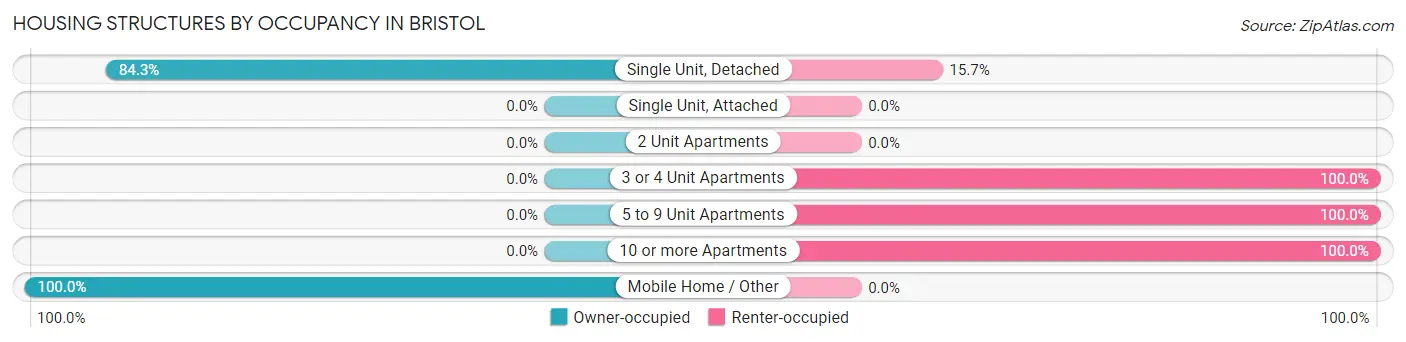
| Structure Type | Owner-occupied | Renter-occupied |
| Single Unit, Detached | 463 (84.3%) | 86 (15.7%) |
| Single Unit, Attached | 0 (0.0%) | 0 (0.0%) |
| 2 Unit Apartments | 0 (0.0%) | 0 (0.0%) |
| 3 or 4 Unit Apartments | 0 (0.0%) | 5 (100.0%) |
| 5 to 9 Unit Apartments | 0 (0.0%) | 26 (100.0%) |
| 10 or more Apartments | 0 (0.0%) | 51 (100.0%) |
| Mobile Home / Other | 6 (100.0%) | 0 (0.0%) |
| Total | 469 (73.6%) | 168 (26.4%) |
Housing Structures by Number of Rooms in Bristol
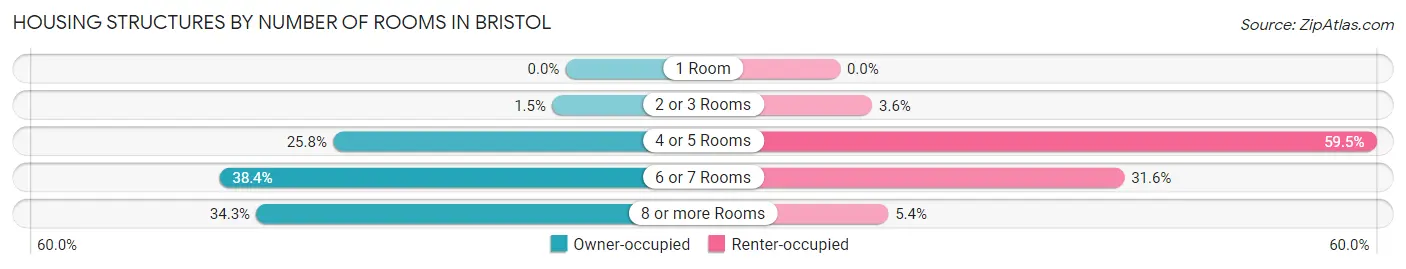
| Number of Rooms | Owner-occupied | Renter-occupied |
| 1 Room | 0 (0.0%) | 0 (0.0%) |
| 2 or 3 Rooms | 7 (1.5%) | 6 (3.6%) |
| 4 or 5 Rooms | 121 (25.8%) | 100 (59.5%) |
| 6 or 7 Rooms | 180 (38.4%) | 53 (31.6%) |
| 8 or more Rooms | 161 (34.3%) | 9 (5.4%) |
| Total | 469 (100.0%) | 168 (100.0%) |
Housing Structure by Heating Type in Bristol
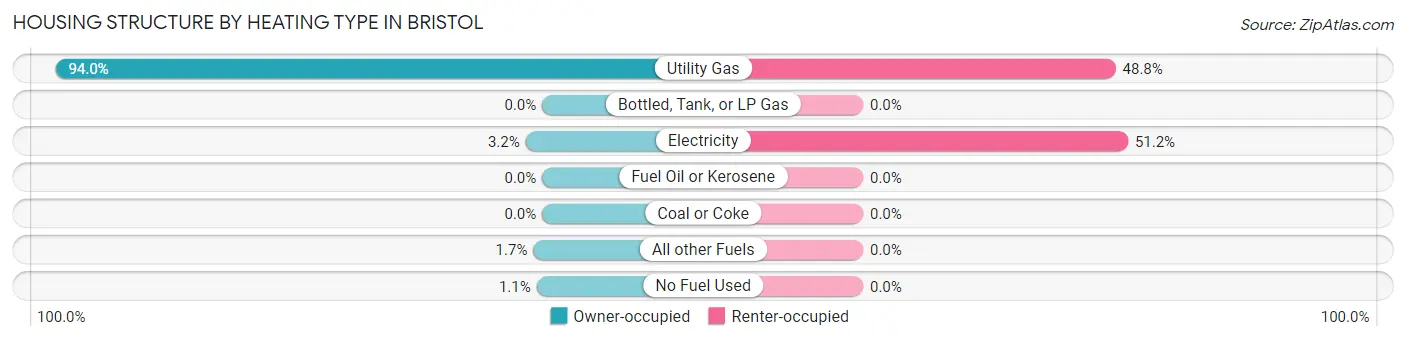
| Heating Type | Owner-occupied | Renter-occupied |
| Utility Gas | 441 (94.0%) | 82 (48.8%) |
| Bottled, Tank, or LP Gas | 0 (0.0%) | 0 (0.0%) |
| Electricity | 15 (3.2%) | 86 (51.2%) |
| Fuel Oil or Kerosene | 0 (0.0%) | 0 (0.0%) |
| Coal or Coke | 0 (0.0%) | 0 (0.0%) |
| All other Fuels | 8 (1.7%) | 0 (0.0%) |
| No Fuel Used | 5 (1.1%) | 0 (0.0%) |
| Total | 469 (100.0%) | 168 (100.0%) |
Household Vehicle Usage in Bristol
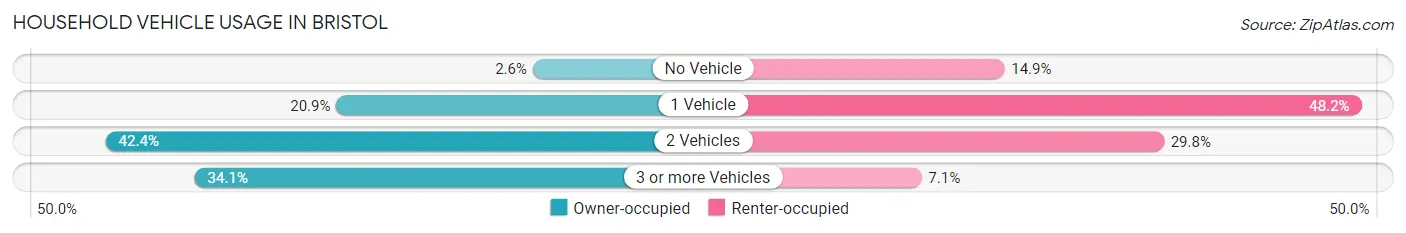
| Vehicles per Household | Owner-occupied | Renter-occupied |
| No Vehicle | 12 (2.6%) | 25 (14.9%) |
| 1 Vehicle | 98 (20.9%) | 81 (48.2%) |
| 2 Vehicles | 199 (42.4%) | 50 (29.8%) |
| 3 or more Vehicles | 160 (34.1%) | 12 (7.1%) |
| Total | 469 (100.0%) | 168 (100.0%) |
Real Estate & Mortgages in Bristol
Real Estate and Mortgage Overview in Bristol
| Characteristic | Without Mortgage | With Mortgage |
| Housing Units | 140 | 329 |
| Median Property Value | $208,000 | $176,500 |
| Median Household Income | $60,769 | $40 |
| Monthly Housing Costs | $530 | $2 |
| Real Estate Taxes | $1,883 | $3 |
Property Value by Mortgage Status in Bristol
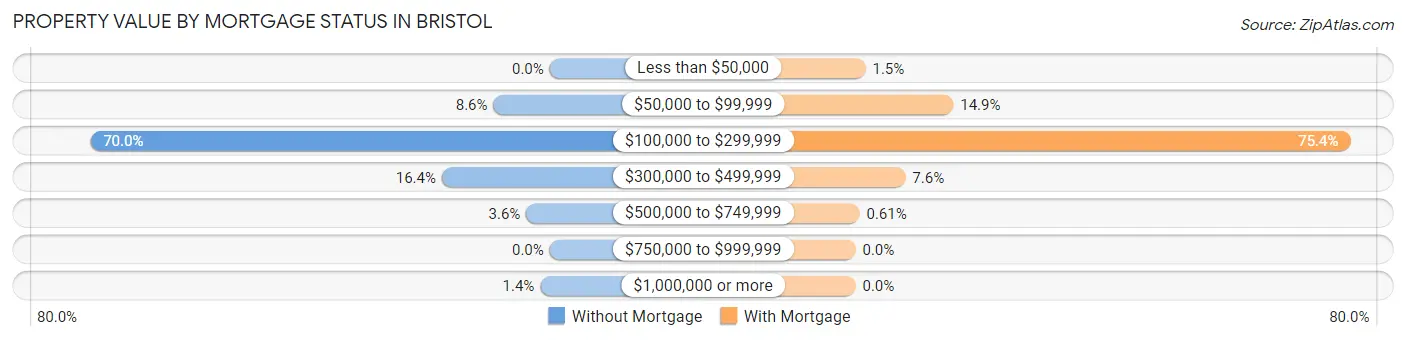
| Property Value | Without Mortgage | With Mortgage |
| Less than $50,000 | 0 (0.0%) | 5 (1.5%) |
| $50,000 to $99,999 | 12 (8.6%) | 49 (14.9%) |
| $100,000 to $299,999 | 98 (70.0%) | 248 (75.4%) |
| $300,000 to $499,999 | 23 (16.4%) | 25 (7.6%) |
| $500,000 to $749,999 | 5 (3.6%) | 2 (0.6%) |
| $750,000 to $999,999 | 0 (0.0%) | 0 (0.0%) |
| $1,000,000 or more | 2 (1.4%) | 0 (0.0%) |
| Total | 140 (100.0%) | 329 (100.0%) |
Household Income by Mortgage Status in Bristol
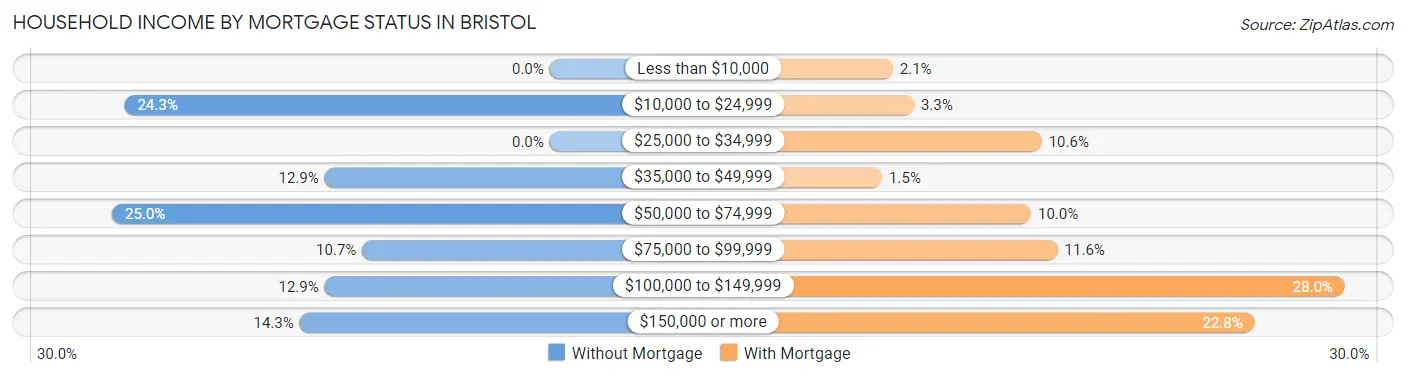
| Household Income | Without Mortgage | With Mortgage |
| Less than $10,000 | 0 (0.0%) | 7 (2.1%) |
| $10,000 to $24,999 | 34 (24.3%) | 11 (3.3%) |
| $25,000 to $34,999 | 0 (0.0%) | 35 (10.6%) |
| $35,000 to $49,999 | 18 (12.9%) | 5 (1.5%) |
| $50,000 to $74,999 | 35 (25.0%) | 33 (10.0%) |
| $75,000 to $99,999 | 15 (10.7%) | 38 (11.6%) |
| $100,000 to $149,999 | 18 (12.9%) | 92 (28.0%) |
| $150,000 or more | 20 (14.3%) | 75 (22.8%) |
| Total | 140 (100.0%) | 329 (100.0%) |
Property Value to Household Income Ratio in Bristol
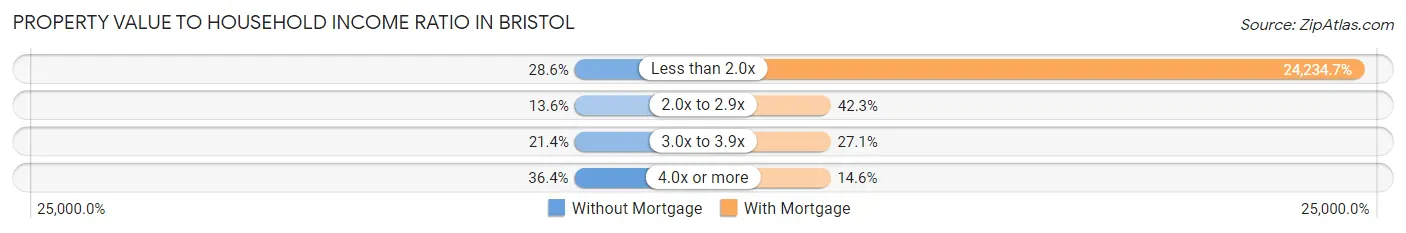
| Value-to-Income Ratio | Without Mortgage | With Mortgage |
| Less than 2.0x | 40 (28.6%) | 79,732 (24,234.6%) |
| 2.0x to 2.9x | 19 (13.6%) | 139 (42.2%) |
| 3.0x to 3.9x | 30 (21.4%) | 89 (27.1%) |
| 4.0x or more | 51 (36.4%) | 48 (14.6%) |
| Total | 140 (100.0%) | 329 (100.0%) |
Real Estate Taxes by Mortgage Status in Bristol
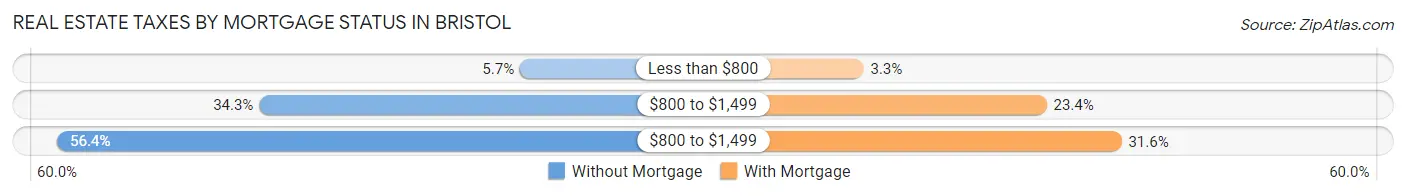
| Property Taxes | Without Mortgage | With Mortgage |
| Less than $800 | 8 (5.7%) | 11 (3.3%) |
| $800 to $1,499 | 48 (34.3%) | 77 (23.4%) |
| $800 to $1,499 | 79 (56.4%) | 104 (31.6%) |
| Total | 140 (100.0%) | 329 (100.0%) |
Health & Disability in Bristol
Health Insurance Coverage by Age in Bristol
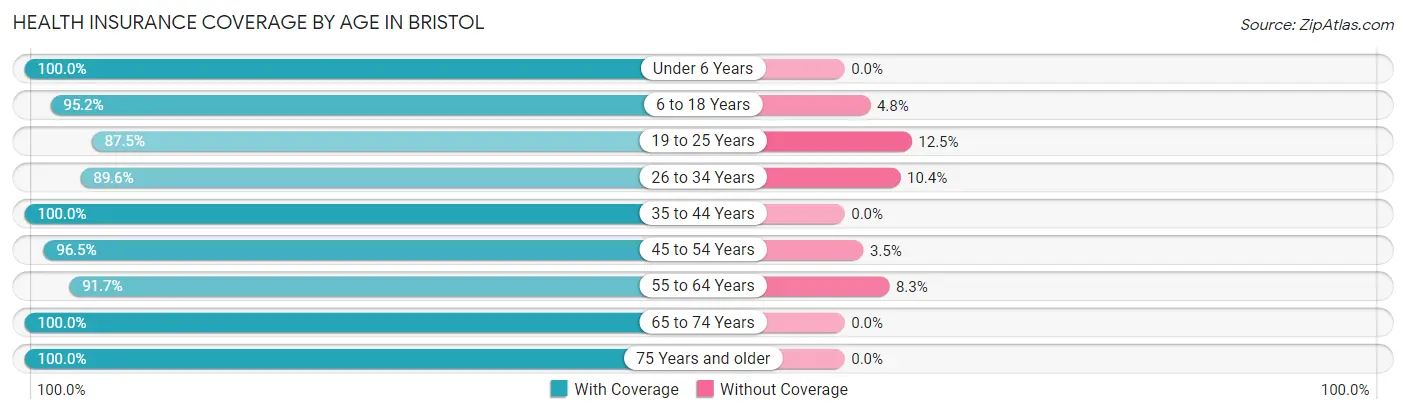
| Age Bracket | With Coverage | Without Coverage |
| Under 6 Years | 213 (100.0%) | 0 (0.0%) |
| 6 to 18 Years | 338 (95.2%) | 17 (4.8%) |
| 19 to 25 Years | 210 (87.5%) | 30 (12.5%) |
| 26 to 34 Years | 207 (89.6%) | 24 (10.4%) |
| 35 to 44 Years | 123 (100.0%) | 0 (0.0%) |
| 45 to 54 Years | 193 (96.5%) | 7 (3.5%) |
| 55 to 64 Years | 132 (91.7%) | 12 (8.3%) |
| 65 to 74 Years | 200 (100.0%) | 0 (0.0%) |
| 75 Years and older | 156 (100.0%) | 0 (0.0%) |
| Total | 1,772 (95.2%) | 90 (4.8%) |
Health Insurance Coverage by Citizenship Status in Bristol
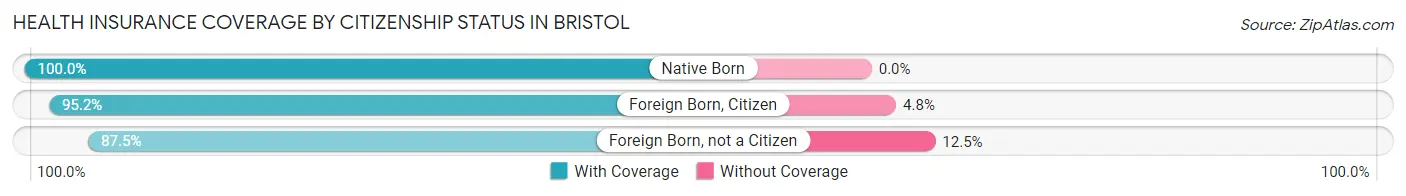
| Citizenship Status | With Coverage | Without Coverage |
| Native Born | 213 (100.0%) | 0 (0.0%) |
| Foreign Born, Citizen | 338 (95.2%) | 17 (4.8%) |
| Foreign Born, not a Citizen | 210 (87.5%) | 30 (12.5%) |
Health Insurance Coverage by Household Income in Bristol
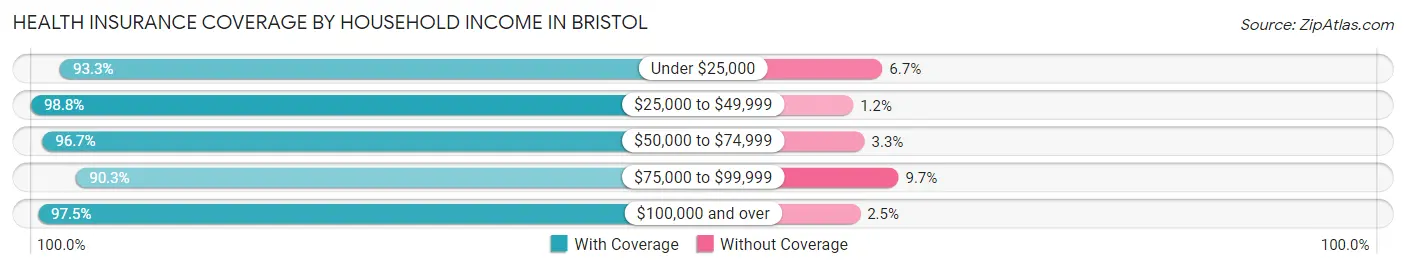
| Household Income | With Coverage | Without Coverage |
| Under $25,000 | 98 (93.3%) | 7 (6.7%) |
| $25,000 to $49,999 | 246 (98.8%) | 3 (1.2%) |
| $50,000 to $74,999 | 261 (96.7%) | 9 (3.3%) |
| $75,000 to $99,999 | 503 (90.3%) | 54 (9.7%) |
| $100,000 and over | 657 (97.5%) | 17 (2.5%) |
Public vs Private Health Insurance Coverage by Age in Bristol
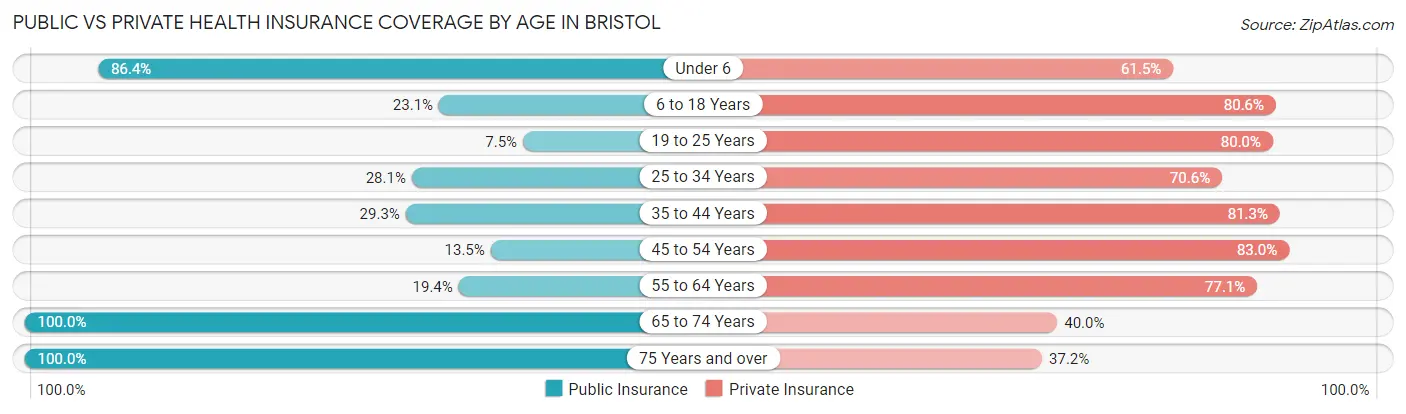
| Age Bracket | Public Insurance | Private Insurance |
| Under 6 | 184 (86.4%) | 131 (61.5%) |
| 6 to 18 Years | 82 (23.1%) | 286 (80.6%) |
| 19 to 25 Years | 18 (7.5%) | 192 (80.0%) |
| 25 to 34 Years | 65 (28.1%) | 163 (70.6%) |
| 35 to 44 Years | 36 (29.3%) | 100 (81.3%) |
| 45 to 54 Years | 27 (13.5%) | 166 (83.0%) |
| 55 to 64 Years | 28 (19.4%) | 111 (77.1%) |
| 65 to 74 Years | 200 (100.0%) | 80 (40.0%) |
| 75 Years and over | 156 (100.0%) | 58 (37.2%) |
| Total | 796 (42.7%) | 1,287 (69.1%) |
Disability Status by Sex by Age in Bristol
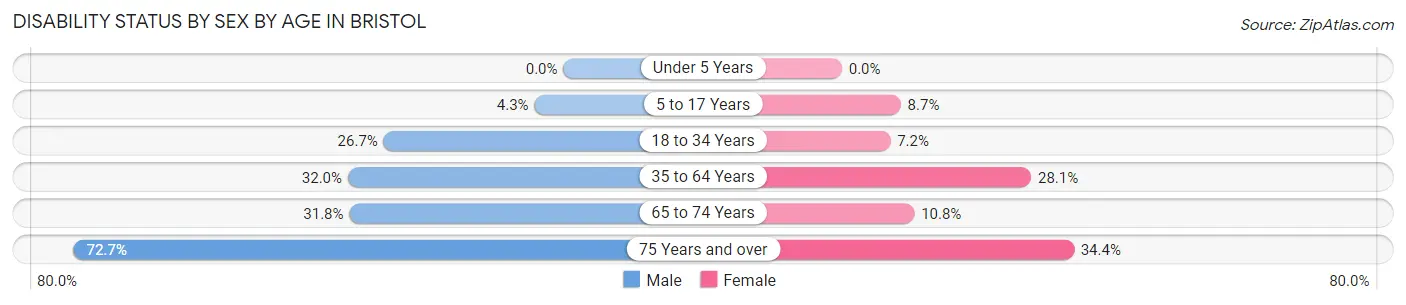
| Age Bracket | Male | Female |
| Under 5 Years | 0 (0.0%) | 0 (0.0%) |
| 5 to 17 Years | 4 (4.3%) | 16 (8.7%) |
| 18 to 34 Years | 103 (26.7%) | 12 (7.2%) |
| 35 to 64 Years | 72 (32.0%) | 68 (28.1%) |
| 65 to 74 Years | 34 (31.8%) | 10 (10.7%) |
| 75 Years and over | 48 (72.7%) | 31 (34.4%) |
Disability Class by Sex by Age in Bristol
Disability Class: Hearing Difficulty
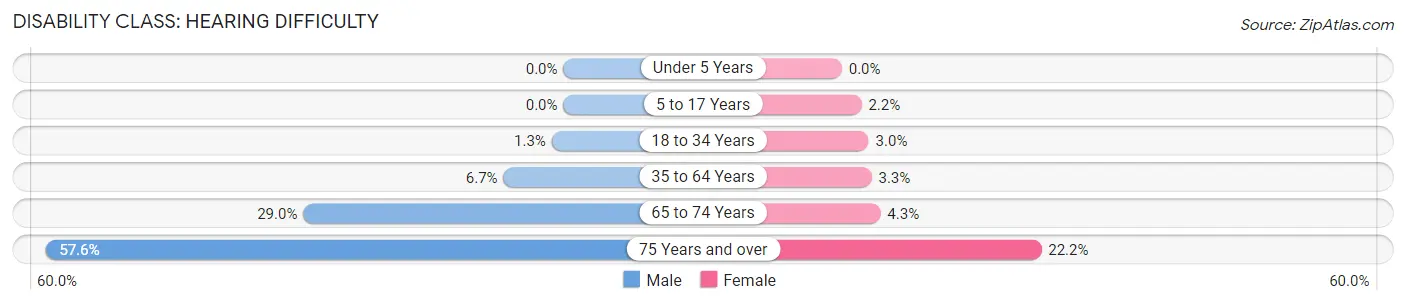
| Age Bracket | Male | Female |
| Under 5 Years | 0 (0.0%) | 0 (0.0%) |
| 5 to 17 Years | 0 (0.0%) | 4 (2.2%) |
| 18 to 34 Years | 5 (1.3%) | 5 (3.0%) |
| 35 to 64 Years | 15 (6.7%) | 8 (3.3%) |
| 65 to 74 Years | 31 (29.0%) | 4 (4.3%) |
| 75 Years and over | 38 (57.6%) | 20 (22.2%) |
Disability Class: Vision Difficulty
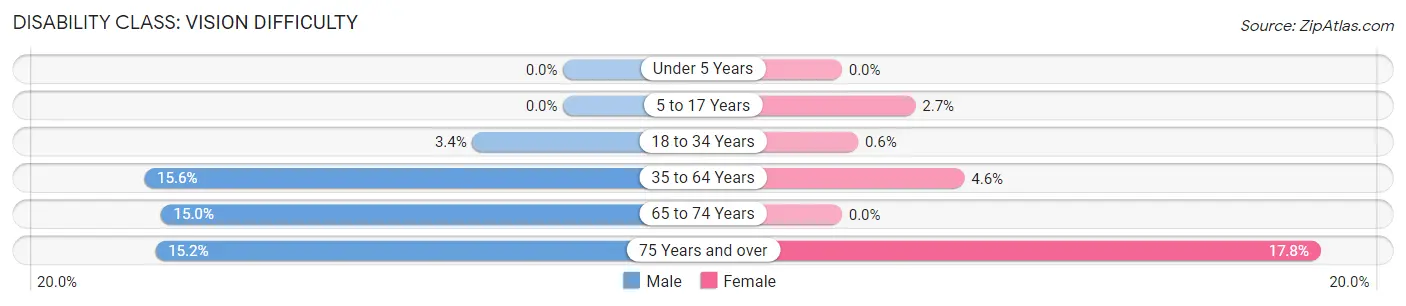
| Age Bracket | Male | Female |
| Under 5 Years | 0 (0.0%) | 0 (0.0%) |
| 5 to 17 Years | 0 (0.0%) | 5 (2.7%) |
| 18 to 34 Years | 13 (3.4%) | 1 (0.6%) |
| 35 to 64 Years | 35 (15.6%) | 11 (4.5%) |
| 65 to 74 Years | 16 (14.9%) | 0 (0.0%) |
| 75 Years and over | 10 (15.1%) | 16 (17.8%) |
Disability Class: Cognitive Difficulty
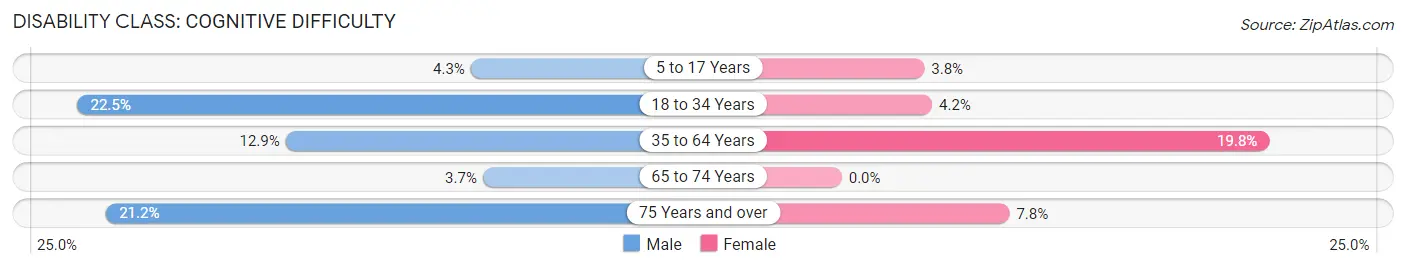
| Age Bracket | Male | Female |
| 5 to 17 Years | 4 (4.3%) | 7 (3.8%) |
| 18 to 34 Years | 87 (22.5%) | 7 (4.2%) |
| 35 to 64 Years | 29 (12.9%) | 48 (19.8%) |
| 65 to 74 Years | 4 (3.7%) | 0 (0.0%) |
| 75 Years and over | 14 (21.2%) | 7 (7.8%) |
Disability Class: Ambulatory Difficulty
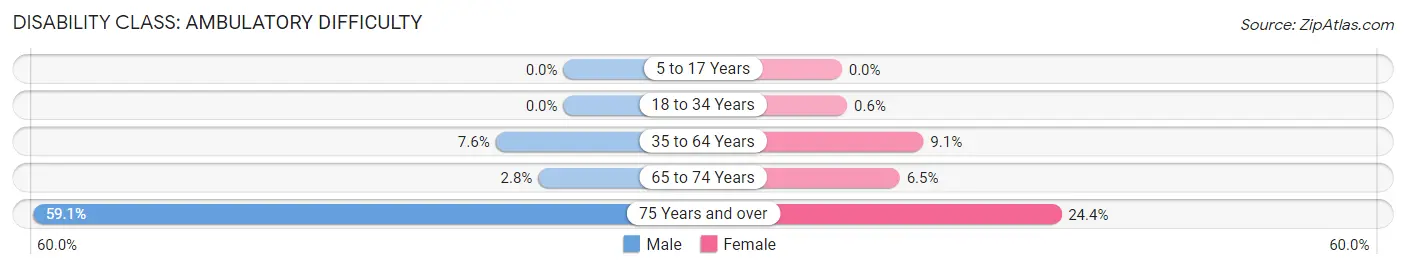
| Age Bracket | Male | Female |
| 5 to 17 Years | 0 (0.0%) | 0 (0.0%) |
| 18 to 34 Years | 0 (0.0%) | 1 (0.6%) |
| 35 to 64 Years | 17 (7.6%) | 22 (9.1%) |
| 65 to 74 Years | 3 (2.8%) | 6 (6.5%) |
| 75 Years and over | 39 (59.1%) | 22 (24.4%) |
Disability Class: Self-Care Difficulty
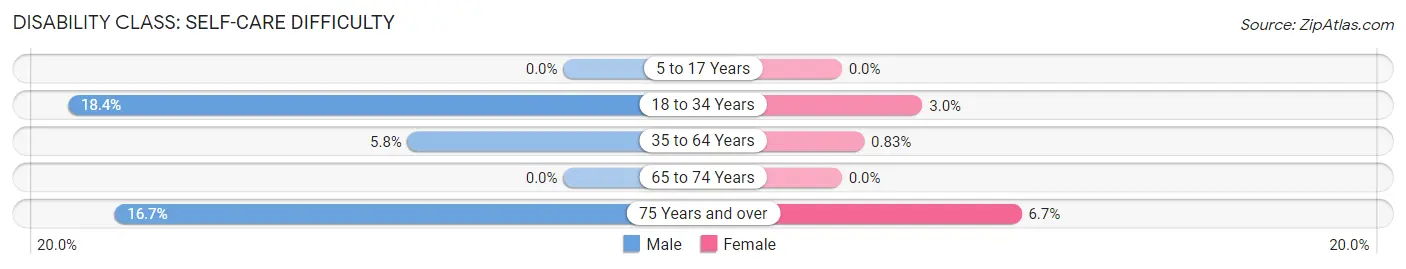
| Age Bracket | Male | Female |
| 5 to 17 Years | 0 (0.0%) | 0 (0.0%) |
| 18 to 34 Years | 71 (18.4%) | 5 (3.0%) |
| 35 to 64 Years | 13 (5.8%) | 2 (0.8%) |
| 65 to 74 Years | 0 (0.0%) | 0 (0.0%) |
| 75 Years and over | 11 (16.7%) | 6 (6.7%) |
Technology Access in Bristol
Computing Device Access in Bristol
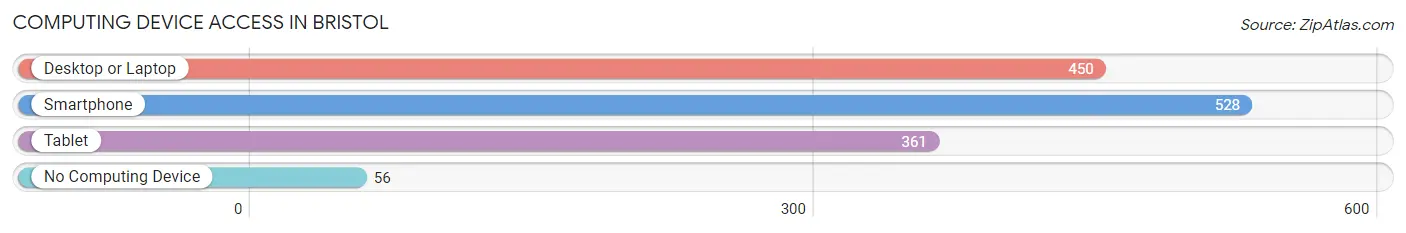
| Device Type | # Households | % Households |
| Desktop or Laptop | 450 | 70.6% |
| Smartphone | 528 | 82.9% |
| Tablet | 361 | 56.7% |
| No Computing Device | 56 | 8.8% |
| Total | 637 | 100.0% |
Internet Access in Bristol
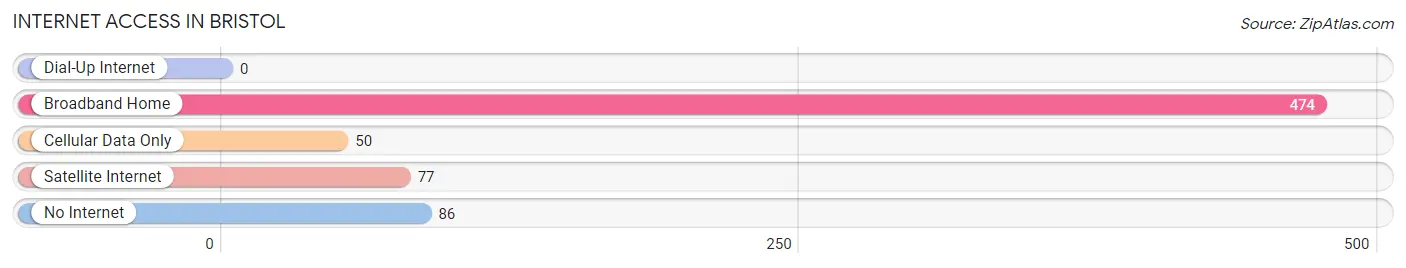
| Internet Type | # Households | % Households |
| Dial-Up Internet | 0 | 0.0% |
| Broadband Home | 474 | 74.4% |
| Cellular Data Only | 50 | 7.9% |
| Satellite Internet | 77 | 12.1% |
| No Internet | 86 | 13.5% |
| Total | 637 | 100.0% |
Bristol Summary
Bristol, Indiana is a small town located in Elkhart County, Indiana. It is situated in the northern part of the state, about 20 miles east of South Bend and about 40 miles west of Fort Wayne. The town has a population of approximately 2,000 people and is part of the Elkhart-Goshen Metropolitan Statistical Area.
History
Bristol was founded in 1836 by a group of settlers from New York. The town was named after Bristol, England, and was originally known as “Bristol Station”. The town was incorporated in 1867 and was the first town in Elkhart County to be incorporated.
The town was originally a farming community, but in the late 19th century, it became a manufacturing center. The first factory in Bristol was a sawmill, which was built in 1867. Other factories followed, including a furniture factory, a wagon factory, and a brickyard.
In the early 20th century, Bristol was a popular tourist destination. The town was home to several resorts, including the Bristol Hotel, which was built in 1891. The hotel was a popular destination for wealthy tourists from Chicago and other cities.
Geography
Bristol is located in northern Indiana, about 20 miles east of South Bend and about 40 miles west of Fort Wayne. The town is situated in Elkhart County, which is part of the Michiana region. The town is located on the banks of the Elkhart River, which flows through the town.
The town has a total area of 1.3 square miles, all of which is land. The town is located in a flat, open area, with no major hills or mountains. The climate in Bristol is humid continental, with hot summers and cold winters.
Economy
Bristol’s economy is largely based on manufacturing. The town is home to several factories, including a furniture factory, a wagon factory, and a brickyard. The town is also home to several small businesses, including restaurants, shops, and other services.
The town is also home to several large employers, including the Elkhart County government, the Elkhart County School Corporation, and the Elkhart County Hospital.
Demographics
As of the 2010 census, the population of Bristol was 2,000. The town has a population density of 1,521 people per square mile. The median age in Bristol is 38.7 years, and the median household income is $41,250.
The racial makeup of Bristol is 94.2% White, 1.2% African American, 0.2% Native American, 0.2% Asian, 0.2% Pacific Islander, 1.2% from other races, and 2.2% from two or more races. The town is also home to a large Hispanic population, with 8.2% of the population being of Hispanic or Latino origin.
Conclusion
Bristol, Indiana is a small town located in Elkhart County, Indiana. It is situated in the northern part of the state, about 20 miles east of South Bend and about 40 miles west of Fort Wayne. The town has a population of approximately 2,000 people and is part of the Elkhart-Goshen Metropolitan Statistical Area. The town’s economy is largely based on manufacturing, and it is home to several large employers. The town is also home to a large Hispanic population, with 8.2% of the population being of Hispanic or Latino origin.
Common Questions
What is Per Capita Income in Bristol?
Per Capita income in Bristol is $29,811.
What is the Median Family Income in Bristol?
Median Family Income in Bristol is $82,625.
What is the Median Household income in Bristol?
Median Household Income in Bristol is $75,046.
What is Income or Wage Gap in Bristol?
Income or Wage Gap in Bristol is 17.5%.
Women in Bristol earn 82.5 cents for every dollar earned by a man.
What is Inequality or Gini Index in Bristol?
Inequality or Gini Index in Bristol is 0.38.
What is the Total Population of Bristol?
Total Population of Bristol is 1,862.
What is the Total Male Population of Bristol?
Total Male Population of Bristol is 1,039.
What is the Total Female Population of Bristol?
Total Female Population of Bristol is 823.
What is the Ratio of Males per 100 Females in Bristol?
There are 126.25 Males per 100 Females in Bristol.
What is the Ratio of Females per 100 Males in Bristol?
There are 79.21 Females per 100 Males in Bristol.
What is the Median Population Age in Bristol?
Median Population Age in Bristol is 30.1 Years.
What is the Average Family Size in Bristol
Average Family Size in Bristol is 3.8 People.
What is the Average Household Size in Bristol
Average Household Size in Bristol is 2.9 People.
How Large is the Labor Force in Bristol?
There are 927 People in the Labor Forcein in Bristol.
What is the Percentage of People in the Labor Force in Bristol?
65.3% of People are in the Labor Force in Bristol.
What is the Unemployment Rate in Bristol?
Unemployment Rate in Bristol is 0.3%.