Bremen, IN Map & Demographics
Bremen Map
Bremen Overview
$28,211
PER CAPITA INCOME
$87,739
AVG FAMILY INCOME
$63,179
AVG HOUSEHOLD INCOME
6.7%
WAGE / INCOME GAP [ % ]
93.3¢/ $1
WAGE / INCOME GAP [ $ ]
0.39
INEQUALITY / GINI INDEX
4,667
TOTAL POPULATION
2,253
MALE POPULATION
2,414
FEMALE POPULATION
93.33
MALES / 100 FEMALES
107.15
FEMALES / 100 MALES
38.0
MEDIAN AGE
3.5
AVG FAMILY SIZE
2.6
AVG HOUSEHOLD SIZE
2,235
LABOR FORCE [ PEOPLE ]
62.5%
PERCENT IN LABOR FORCE
Bremen Zip Codes
Bremen Area Codes
Income in Bremen
Income Overview in Bremen
Per Capita Income in Bremen is $28,211, while median incomes of families and households are $87,739 and $63,179 respectively.
| Characteristic | Number | Measure |
| Per Capita Income | 4,667 | $28,211 |
| Median Family Income | 1,065 | $87,739 |
| Mean Family Income | 1,065 | $89,718 |
| Median Household Income | 1,771 | $63,179 |
| Mean Household Income | 1,771 | $72,793 |
| Income Deficit | 1,065 | $0 |
| Wage / Income Gap (%) | 4,667 | 6.70% |
| Wage / Income Gap ($) | 4,667 | 93.30¢ per $1 |
| Gini / Inequality Index | 4,667 | 0.39 |
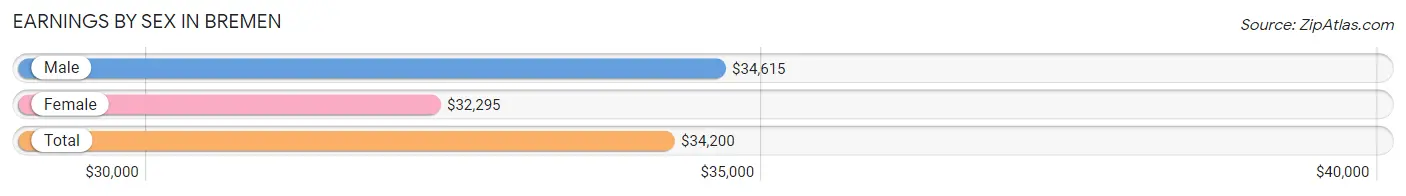
Earnings by Sex in Bremen
Average Earnings in Bremen are $34,200, $34,615 for men and $32,295 for women, a difference of 6.7%.
| Sex | Number | Average Earnings |
| Male | 1,281 (52.2%) | $34,615 |
| Female | 1,172 (47.8%) | $32,295 |
| Total | 2,453 (100.0%) | $34,200 |
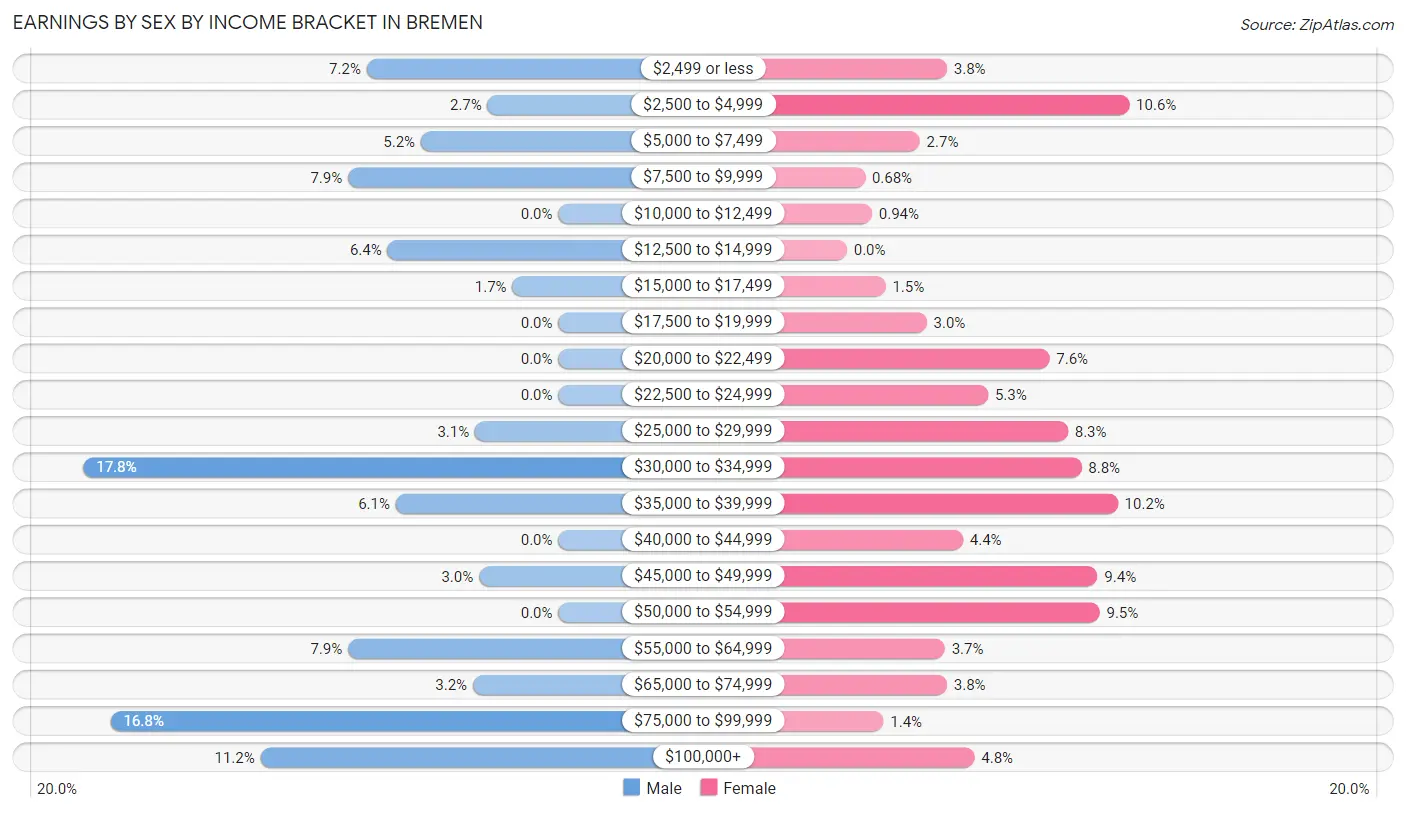
Earnings by Sex by Income Bracket in Bremen
The most common earnings brackets in Bremen are $30,000 to $34,999 for men (228 | 17.8%) and $2,500 to $4,999 for women (124 | 10.6%).
| Income | Male | Female |
| $2,499 or less | 92 (7.2%) | 44 (3.7%) |
| $2,500 to $4,999 | 34 (2.6%) | 124 (10.6%) |
| $5,000 to $7,499 | 66 (5.1%) | 32 (2.7%) |
| $7,500 to $9,999 | 101 (7.9%) | 8 (0.7%) |
| $10,000 to $12,499 | 0 (0.0%) | 11 (0.9%) |
| $12,500 to $14,999 | 82 (6.4%) | 0 (0.0%) |
| $15,000 to $17,499 | 22 (1.7%) | 17 (1.5%) |
| $17,500 to $19,999 | 0 (0.0%) | 35 (3.0%) |
| $20,000 to $22,499 | 0 (0.0%) | 89 (7.6%) |
| $22,500 to $24,999 | 0 (0.0%) | 62 (5.3%) |
| $25,000 to $29,999 | 40 (3.1%) | 97 (8.3%) |
| $30,000 to $34,999 | 228 (17.8%) | 103 (8.8%) |
| $35,000 to $39,999 | 78 (6.1%) | 119 (10.2%) |
| $40,000 to $44,999 | 0 (0.0%) | 51 (4.3%) |
| $45,000 to $49,999 | 38 (3.0%) | 110 (9.4%) |
| $50,000 to $54,999 | 0 (0.0%) | 111 (9.5%) |
| $55,000 to $64,999 | 101 (7.9%) | 43 (3.7%) |
| $65,000 to $74,999 | 41 (3.2%) | 44 (3.7%) |
| $75,000 to $99,999 | 215 (16.8%) | 16 (1.4%) |
| $100,000+ | 143 (11.2%) | 56 (4.8%) |
| Total | 1,281 (100.0%) | 1,172 (100.0%) |
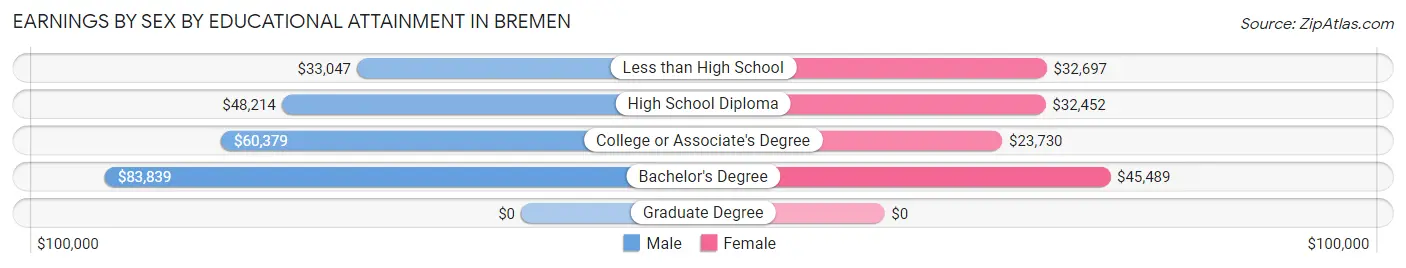
Earnings by Sex by Educational Attainment in Bremen
Average earnings in Bremen are $38,221 for men and $37,784 for women, a difference of 1.1%. Men with an educational attainment of bachelor's degree enjoy the highest average annual earnings of $83,839, while those with less than high school education earn the least with $33,047. Women with an educational attainment of bachelor's degree earn the most with the average annual earnings of $45,489, while those with college or associate's degree education have the smallest earnings of $23,730.
| Educational Attainment | Male Income | Female Income |
| Less than High School | $33,047 | $32,697 |
| High School Diploma | $48,214 | $32,452 |
| College or Associate's Degree | $60,379 | $23,730 |
| Bachelor's Degree | $83,839 | $45,489 |
| Graduate Degree | - | - |
| Total | $38,221 | $37,784 |
Family Income in Bremen
Family Income Brackets in Bremen
According to the Bremen family income data, there are 304 families falling into the $100,000 to $149,999 income range, which is the most common income bracket and makes up 28.5% of all families.
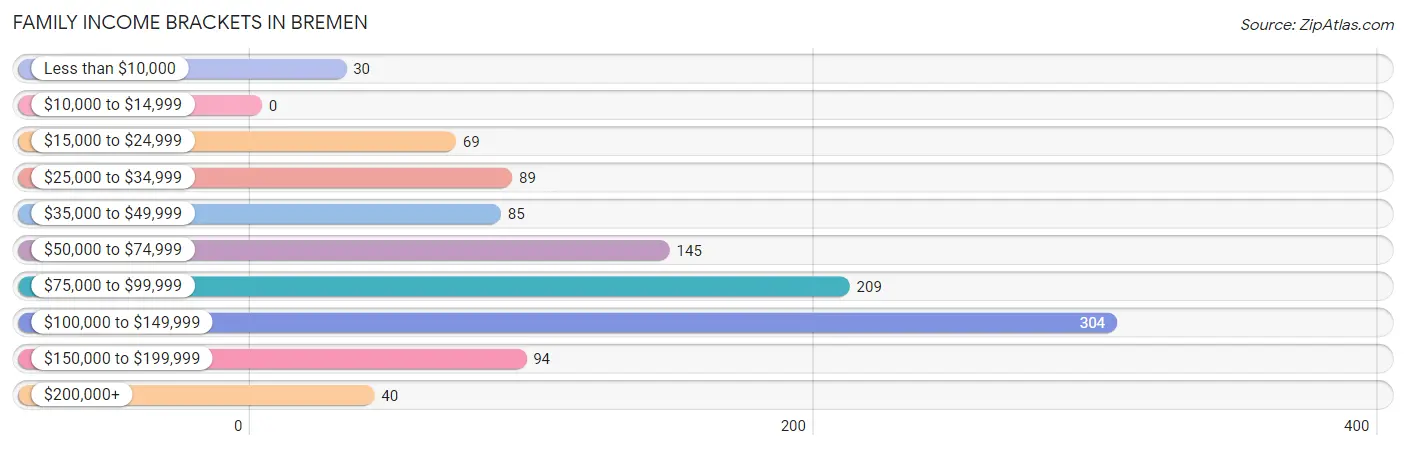
| Income Bracket | # Families | % Families |
| Less than $10,000 | 30 | 2.8% |
| $10,000 to $14,999 | 0 | 0.0% |
| $15,000 to $24,999 | 69 | 6.5% |
| $25,000 to $34,999 | 89 | 8.4% |
| $35,000 to $49,999 | 85 | 8.0% |
| $50,000 to $74,999 | 145 | 13.6% |
| $75,000 to $99,999 | 209 | 19.6% |
| $100,000 to $149,999 | 304 | 28.5% |
| $150,000 to $199,999 | 94 | 8.8% |
| $200,000+ | 40 | 3.8% |
Family Income by Famaliy Size in Bremen
3-person families (254 | 23.8%) account for the highest median family income in Bremen with $104,405 per family, while 2-person families (370 | 34.7%) have the highest median income of $41,786 per family member.
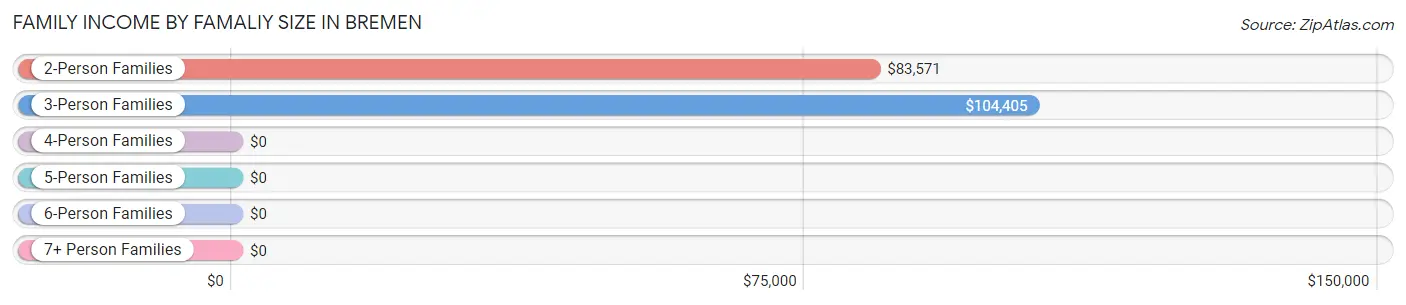
| Income Bracket | # Families | Median Income |
| 2-Person Families | 370 (34.7%) | $83,571 |
| 3-Person Families | 254 (23.8%) | $104,405 |
| 4-Person Families | 252 (23.7%) | $0 |
| 5-Person Families | 101 (9.5%) | $0 |
| 6-Person Families | 19 (1.8%) | $0 |
| 7+ Person Families | 69 (6.5%) | $0 |
| Total | 1,065 (100.0%) | $87,739 |
Family Income by Number of Earners in Bremen
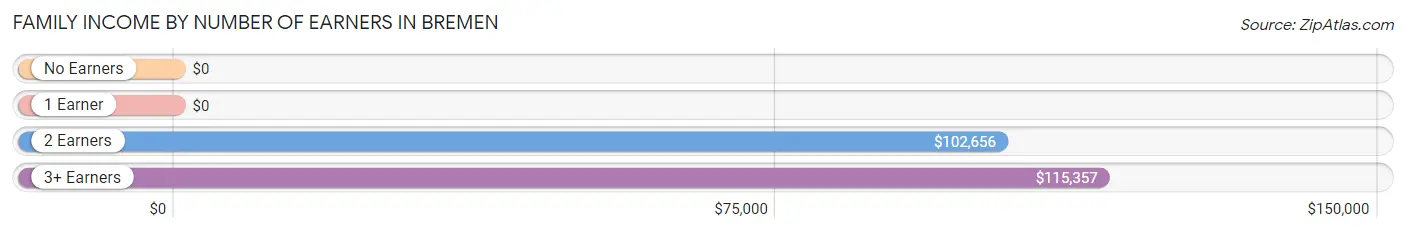
| Number of Earners | # Families | Median Income |
| No Earners | 106 (10.0%) | $0 |
| 1 Earner | 224 (21.0%) | $0 |
| 2 Earners | 571 (53.6%) | $102,656 |
| 3+ Earners | 164 (15.4%) | $115,357 |
| Total | 1,065 (100.0%) | $87,739 |
Household Income in Bremen
Household Income Brackets in Bremen
With 305 households falling in the category, the $100,000 to $149,999 income range is the most frequent in Bremen, accounting for 17.2% of all households.
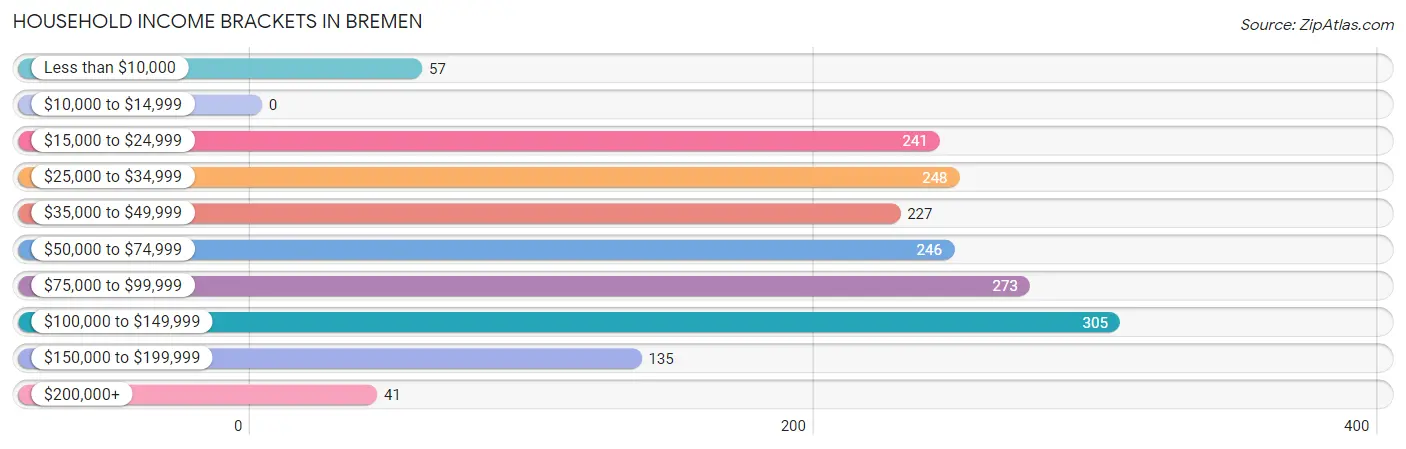
| Income Bracket | # Households | % Households |
| Less than $10,000 | 57 | 3.2% |
| $10,000 to $14,999 | 0 | 0.0% |
| $15,000 to $24,999 | 241 | 13.6% |
| $25,000 to $34,999 | 248 | 14.0% |
| $35,000 to $49,999 | 227 | 12.8% |
| $50,000 to $74,999 | 246 | 13.9% |
| $75,000 to $99,999 | 273 | 15.4% |
| $100,000 to $149,999 | 305 | 17.2% |
| $150,000 to $199,999 | 135 | 7.6% |
| $200,000+ | 41 | 2.3% |
Household Income by Householder Age in Bremen
The median household income in Bremen is $63,179, with the highest median household income of $85,152 found in the 25 to 44 years age bracket for the primary householder. A total of 640 households (36.1%) fall into this category. Meanwhile, the 15 to 24 years age bracket for the primary householder has the lowest median household income of $0, with 55 households (3.1%) in this group.
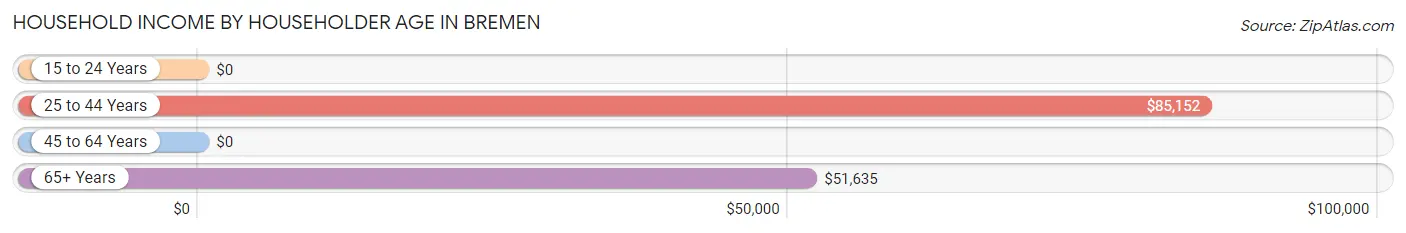
| Income Bracket | # Households | Median Income |
| 15 to 24 Years | 55 (3.1%) | $0 |
| 25 to 44 Years | 640 (36.1%) | $85,152 |
| 45 to 64 Years | 613 (34.6%) | $0 |
| 65+ Years | 463 (26.1%) | $51,635 |
| Total | 1,771 (100.0%) | $63,179 |
Poverty in Bremen
Income Below Poverty by Sex and Age in Bremen
With 17.9% poverty level for males and 13.8% for females among the residents of Bremen, under 5 year old males and 16 and 17 year old females are the most vulnerable to poverty, with 122 males (67.4%) and 50 females (79.4%) in their respective age groups living below the poverty level.
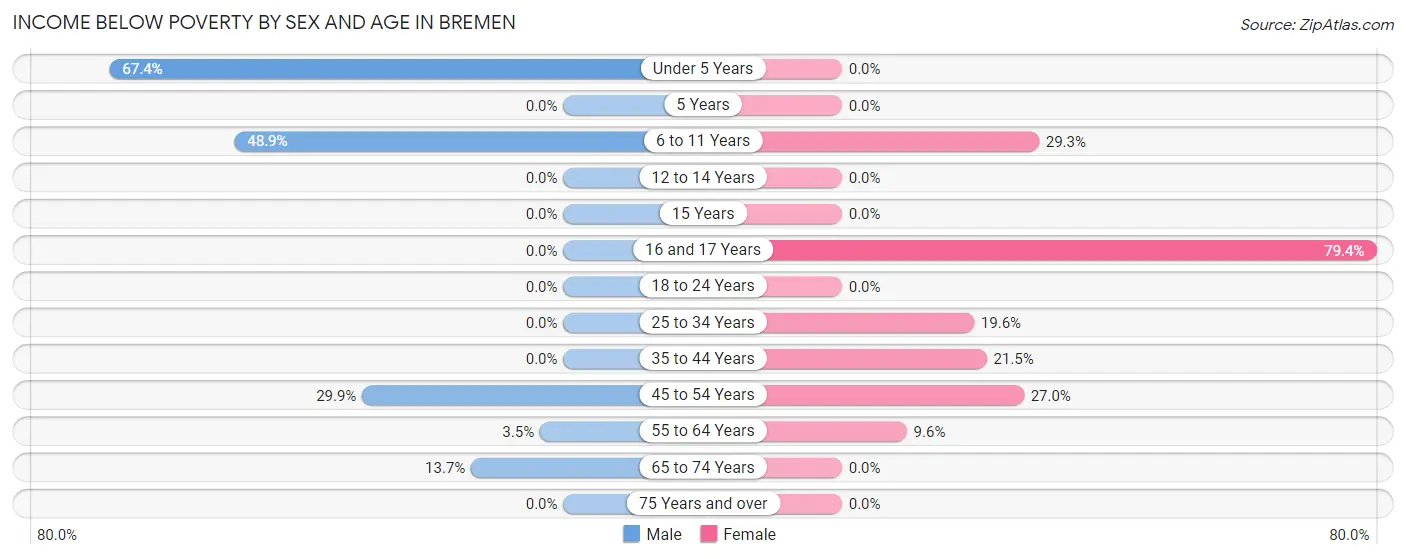
| Age Bracket | Male | Female |
| Under 5 Years | 122 (67.4%) | 0 (0.0%) |
| 5 Years | 0 (0.0%) | 0 (0.0%) |
| 6 to 11 Years | 170 (48.8%) | 74 (29.2%) |
| 12 to 14 Years | 0 (0.0%) | 0 (0.0%) |
| 15 Years | 0 (0.0%) | 0 (0.0%) |
| 16 and 17 Years | 0 (0.0%) | 50 (79.4%) |
| 18 to 24 Years | 0 (0.0%) | 0 (0.0%) |
| 25 to 34 Years | 0 (0.0%) | 52 (19.6%) |
| 35 to 44 Years | 0 (0.0%) | 69 (21.5%) |
| 45 to 54 Years | 69 (29.9%) | 47 (27.0%) |
| 55 to 64 Years | 7 (3.5%) | 39 (9.6%) |
| 65 to 74 Years | 33 (13.7%) | 0 (0.0%) |
| 75 Years and over | 0 (0.0%) | 0 (0.0%) |
| Total | 401 (17.9%) | 331 (13.8%) |
Income Above Poverty by Sex and Age in Bremen
According to the poverty statistics in Bremen, males aged 5 years and females aged under 5 years are the age groups that are most secure financially, with 100.0% of males and 100.0% of females in these age groups living above the poverty line.
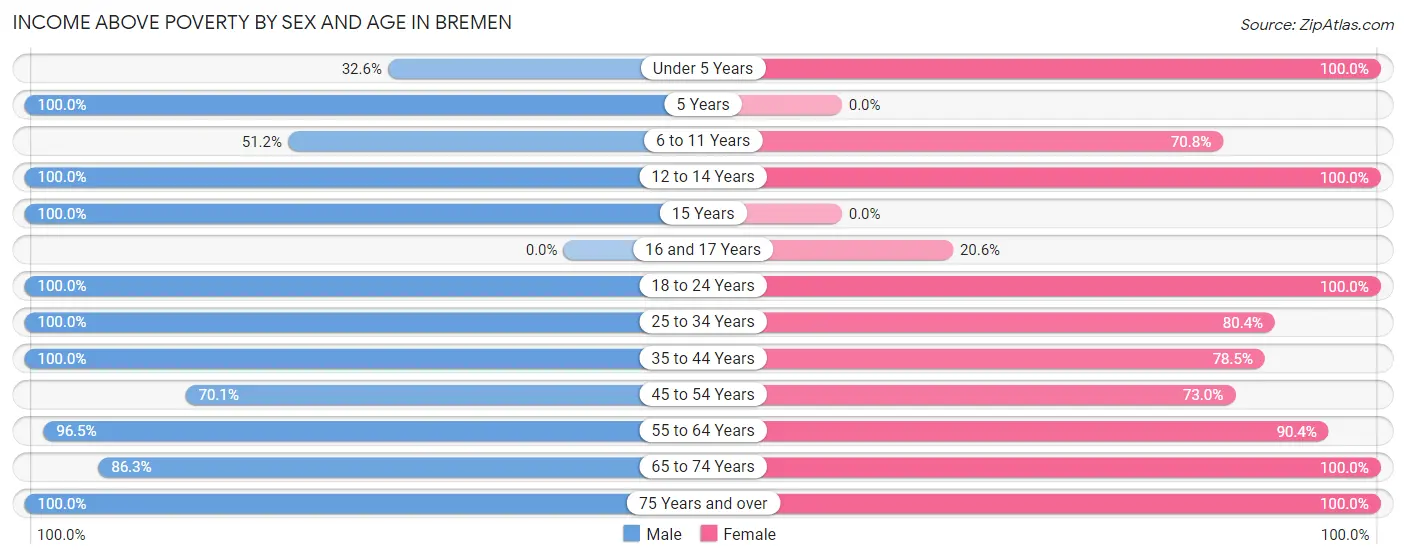
| Age Bracket | Male | Female |
| Under 5 Years | 59 (32.6%) | 19 (100.0%) |
| 5 Years | 7 (100.0%) | 0 (0.0%) |
| 6 to 11 Years | 178 (51.1%) | 179 (70.8%) |
| 12 to 14 Years | 42 (100.0%) | 211 (100.0%) |
| 15 Years | 30 (100.0%) | 0 (0.0%) |
| 16 and 17 Years | 0 (0.0%) | 13 (20.6%) |
| 18 to 24 Years | 207 (100.0%) | 260 (100.0%) |
| 25 to 34 Years | 338 (100.0%) | 213 (80.4%) |
| 35 to 44 Years | 310 (100.0%) | 252 (78.5%) |
| 45 to 54 Years | 162 (70.1%) | 127 (73.0%) |
| 55 to 64 Years | 195 (96.5%) | 366 (90.4%) |
| 65 to 74 Years | 208 (86.3%) | 227 (100.0%) |
| 75 Years and over | 103 (100.0%) | 193 (100.0%) |
| Total | 1,839 (82.1%) | 2,060 (86.2%) |
Income Below Poverty Among Married-Couple Families in Bremen
The poverty statistics for married-couple families in Bremen show that 7.8% or 69 of the total 881 families live below the poverty line. Families with 5 or more children have the highest poverty rate of 100.0%, comprising of 69 families. On the other hand, families with no children have the lowest poverty rate of 0.0%, which includes 0 families.
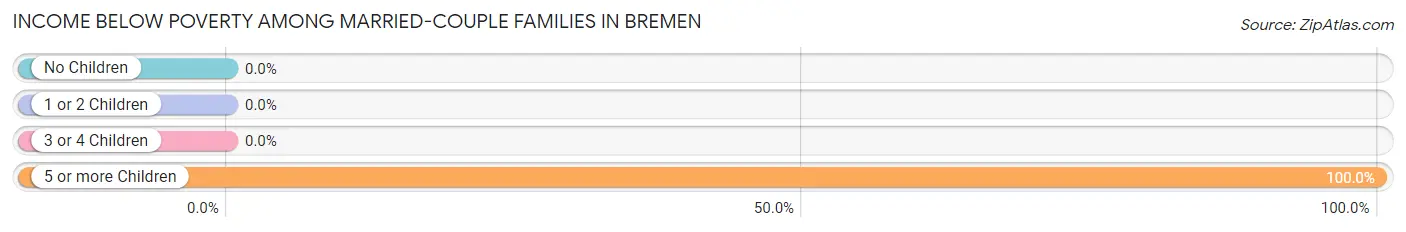
| Children | Above Poverty | Below Poverty |
| No Children | 392 (100.0%) | 0 (0.0%) |
| 1 or 2 Children | 390 (100.0%) | 0 (0.0%) |
| 3 or 4 Children | 30 (100.0%) | 0 (0.0%) |
| 5 or more Children | 0 (0.0%) | 69 (100.0%) |
| Total | 812 (92.2%) | 69 (7.8%) |
Income Below Poverty Among Single-Parent Households in Bremen
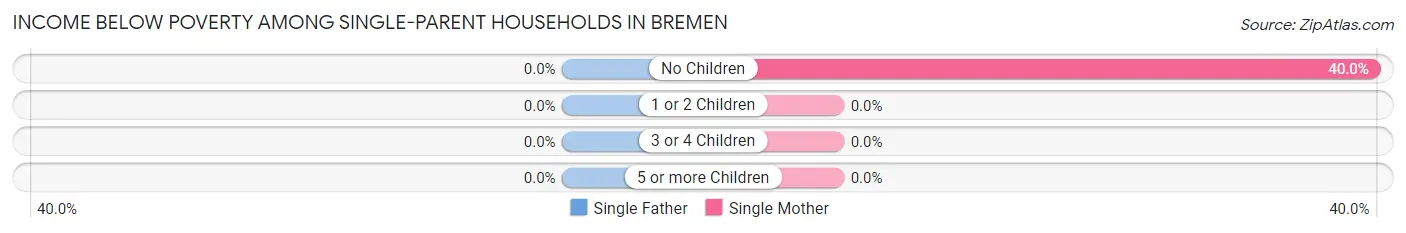
| Children | Single Father | Single Mother |
| No Children | 0 (0.0%) | 30 (40.0%) |
| 1 or 2 Children | 0 (0.0%) | 0 (0.0%) |
| 3 or 4 Children | 0 (0.0%) | 0 (0.0%) |
| 5 or more Children | 0 (0.0%) | 0 (0.0%) |
| Total | 0 (0.0%) | 30 (24.4%) |
Income Below Poverty Among Married-Couple vs Single-Parent Households in Bremen
The poverty data for Bremen shows that 69 of the married-couple family households (7.8%) and 30 of the single-parent households (16.3%) are living below the poverty level. Within the married-couple family households, those with 5 or more children have the highest poverty rate, with 69 households (100.0%) falling below the poverty line. Among the single-parent households, those with no children have the highest poverty rate, with 30 household (24.6%) living below poverty.
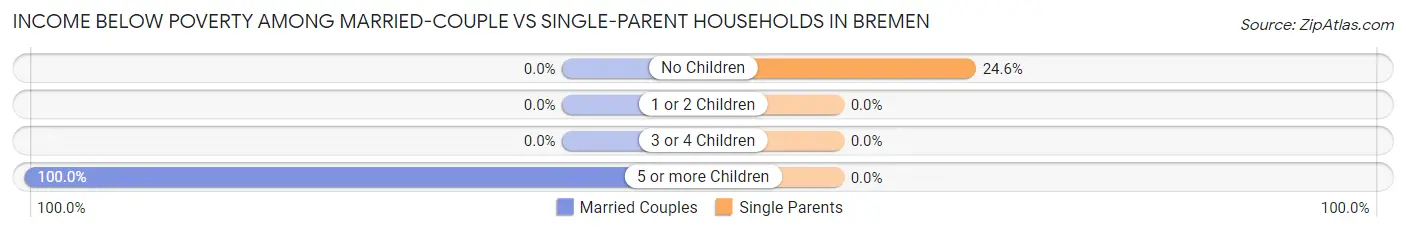
| Children | Married-Couple Families | Single-Parent Households |
| No Children | 0 (0.0%) | 30 (24.6%) |
| 1 or 2 Children | 0 (0.0%) | 0 (0.0%) |
| 3 or 4 Children | 0 (0.0%) | 0 (0.0%) |
| 5 or more Children | 69 (100.0%) | 0 (0.0%) |
| Total | 69 (7.8%) | 30 (16.3%) |
Race in Bremen
The most populous races in Bremen are White / Caucasian (3,824 | 81.9%), Hispanic or Latino (982 | 21.0%), and Two or more Races (563 | 12.1%).
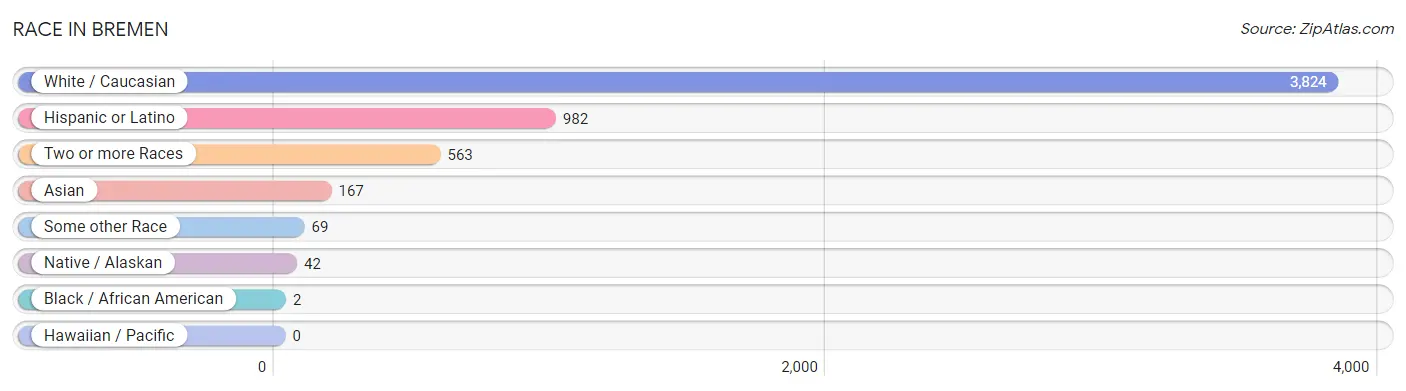
| Race | # Population | % Population |
| Asian | 167 | 3.6% |
| Black / African American | 2 | 0.0% |
| Hawaiian / Pacific | 0 | 0.0% |
| Hispanic or Latino | 982 | 21.0% |
| Native / Alaskan | 42 | 0.9% |
| White / Caucasian | 3,824 | 81.9% |
| Two or more Races | 563 | 12.1% |
| Some other Race | 69 | 1.5% |
| Total | 4,667 | 100.0% |
Ancestry in Bremen
The most populous ancestries reported in Bremen are German (1,290 | 27.6%), Mexican (982 | 21.0%), Irish (506 | 10.8%), English (465 | 10.0%), and Italian (201 | 4.3%), together accounting for 73.8% of all Bremen residents.
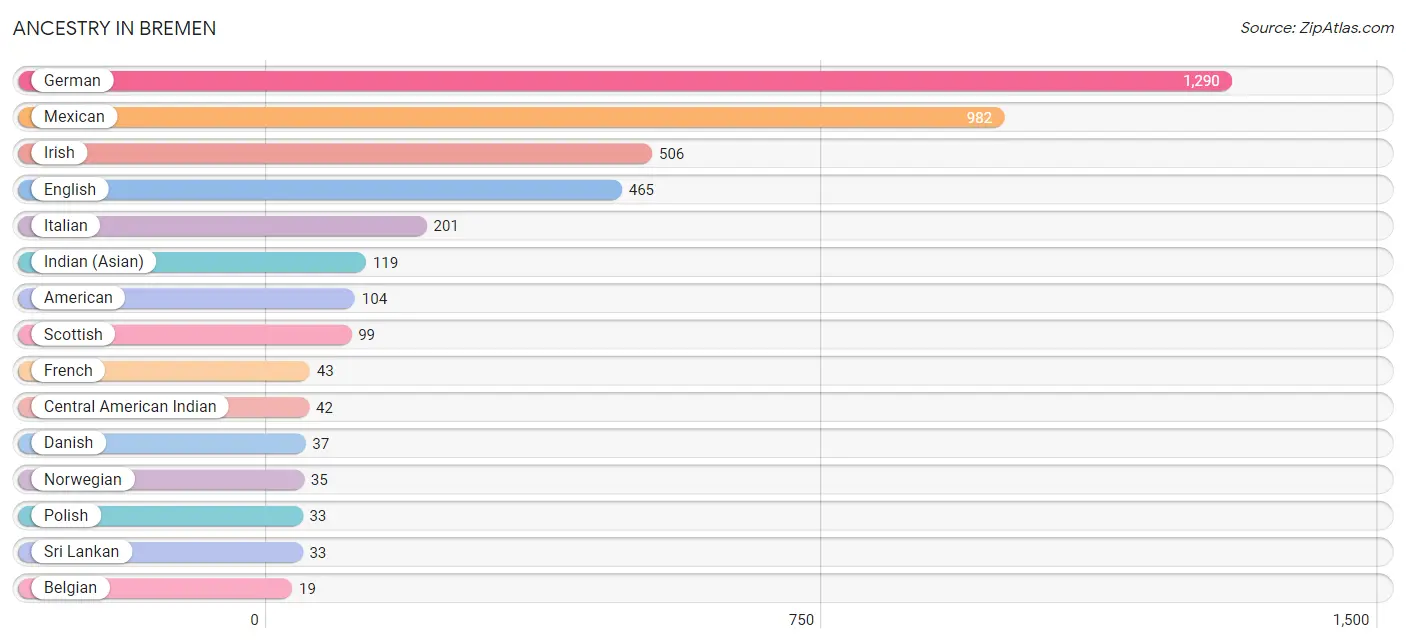
| Ancestry | # Population | % Population |
| American | 104 | 2.2% |
| Belgian | 19 | 0.4% |
| Burmese | 15 | 0.3% |
| Central American Indian | 42 | 0.9% |
| Cherokee | 9 | 0.2% |
| Croatian | 2 | 0.0% |
| Danish | 37 | 0.8% |
| English | 465 | 10.0% |
| European | 17 | 0.4% |
| French | 43 | 0.9% |
| German | 1,290 | 27.6% |
| Indian (Asian) | 119 | 2.5% |
| Irish | 506 | 10.8% |
| Italian | 201 | 4.3% |
| Mexican | 982 | 21.0% |
| Norwegian | 35 | 0.7% |
| Polish | 33 | 0.7% |
| Scottish | 99 | 2.1% |
| Sri Lankan | 33 | 0.7% | View All 19 Rows |
Immigrants in Bremen
The most numerous immigrant groups reported in Bremen came from Latin America (333 | 7.1%), Central America (264 | 5.7%), Mexico (264 | 5.7%), Asia (167 | 3.6%), and Eastern Asia (87 | 1.9%), together accounting for 23.9% of all Bremen residents.
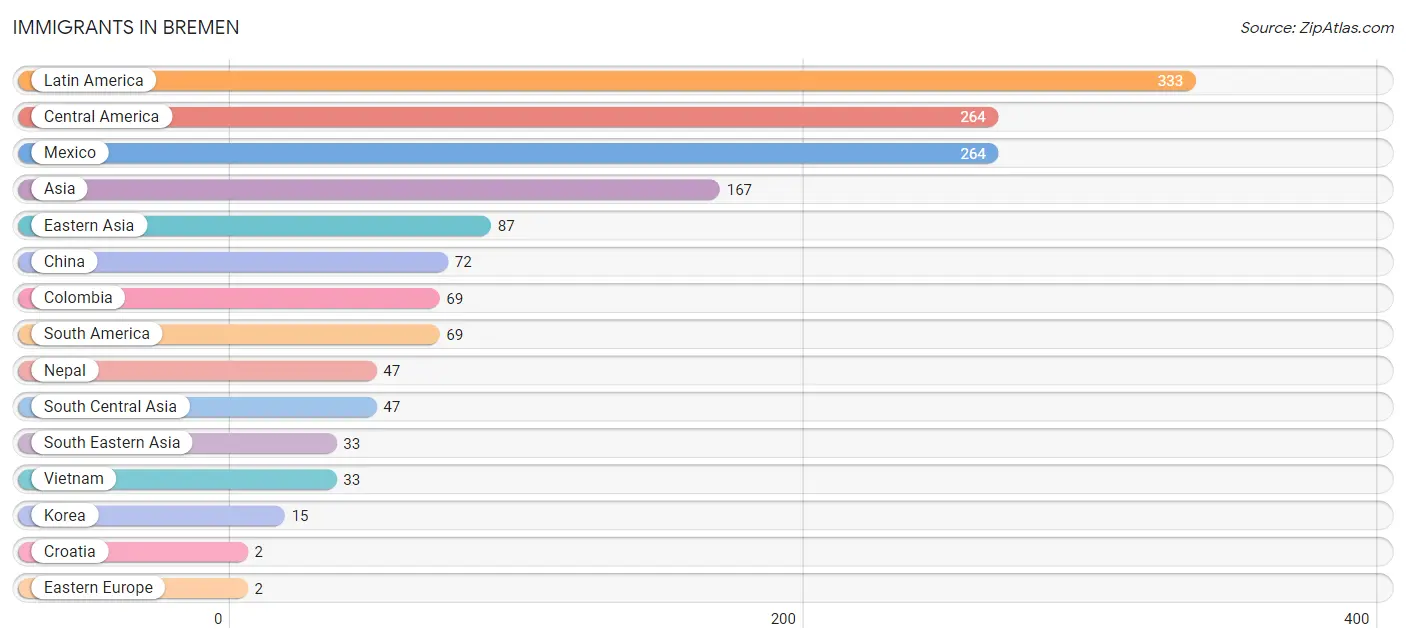
| Immigration Origin | # Population | % Population |
| Asia | 167 | 3.6% |
| Central America | 264 | 5.7% |
| China | 72 | 1.5% |
| Colombia | 69 | 1.5% |
| Croatia | 2 | 0.0% |
| Eastern Asia | 87 | 1.9% |
| Eastern Europe | 2 | 0.0% |
| Europe | 2 | 0.0% |
| Korea | 15 | 0.3% |
| Latin America | 333 | 7.1% |
| Mexico | 264 | 5.7% |
| Nepal | 47 | 1.0% |
| South America | 69 | 1.5% |
| South Central Asia | 47 | 1.0% |
| South Eastern Asia | 33 | 0.7% |
| Vietnam | 33 | 0.7% | View All 16 Rows |
Sex and Age in Bremen
Sex and Age in Bremen
The most populous age groups in Bremen are 5 to 9 Years (237 | 10.5%) for men and 10 to 14 Years (288 | 11.9%) for women.
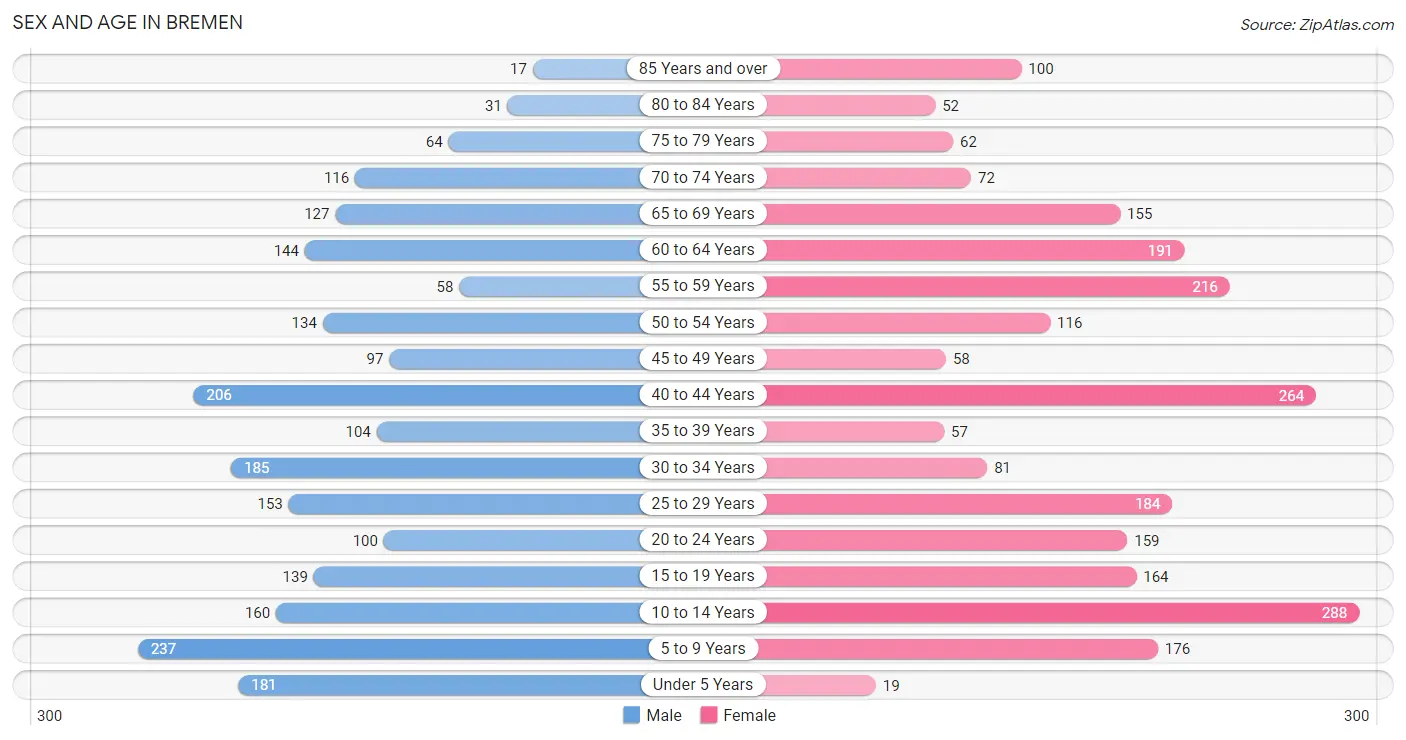
| Age Bracket | Male | Female |
| Under 5 Years | 181 (8.0%) | 19 (0.8%) |
| 5 to 9 Years | 237 (10.5%) | 176 (7.3%) |
| 10 to 14 Years | 160 (7.1%) | 288 (11.9%) |
| 15 to 19 Years | 139 (6.2%) | 164 (6.8%) |
| 20 to 24 Years | 100 (4.4%) | 159 (6.6%) |
| 25 to 29 Years | 153 (6.8%) | 184 (7.6%) |
| 30 to 34 Years | 185 (8.2%) | 81 (3.4%) |
| 35 to 39 Years | 104 (4.6%) | 57 (2.4%) |
| 40 to 44 Years | 206 (9.1%) | 264 (10.9%) |
| 45 to 49 Years | 97 (4.3%) | 58 (2.4%) |
| 50 to 54 Years | 134 (5.9%) | 116 (4.8%) |
| 55 to 59 Years | 58 (2.6%) | 216 (8.9%) |
| 60 to 64 Years | 144 (6.4%) | 191 (7.9%) |
| 65 to 69 Years | 127 (5.6%) | 155 (6.4%) |
| 70 to 74 Years | 116 (5.1%) | 72 (3.0%) |
| 75 to 79 Years | 64 (2.8%) | 62 (2.6%) |
| 80 to 84 Years | 31 (1.4%) | 52 (2.1%) |
| 85 Years and over | 17 (0.7%) | 100 (4.1%) |
| Total | 2,253 (100.0%) | 2,414 (100.0%) |
Families and Households in Bremen
Median Family Size in Bremen
The median family size in Bremen is 3.51 persons per family, with single female/mother families (123 | 11.6%) accounting for the largest median family size of 4.03 persons per family. On the other hand, single male/father families (61 | 5.7%) represent the smallest median family size with 2.43 persons per family.
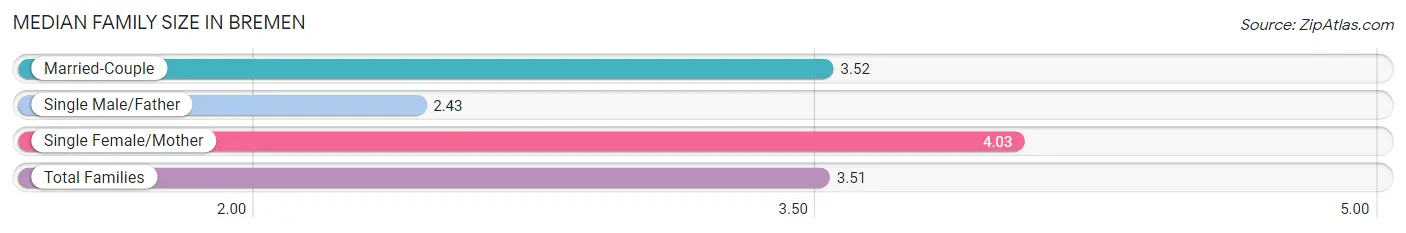
| Family Type | # Families | Family Size |
| Married-Couple | 881 (82.7%) | 3.52 |
| Single Male/Father | 61 (5.7%) | 2.43 |
| Single Female/Mother | 123 (11.6%) | 4.03 |
| Total Families | 1,065 (100.0%) | 3.51 |
Median Household Size in Bremen
The median household size in Bremen is 2.57 persons per household, with single female/mother households (123 | 7.0%) accounting for the largest median household size of 4.53 persons per household. non-family households (706 | 39.9%) represent the smallest median household size with 1.07 persons per household.
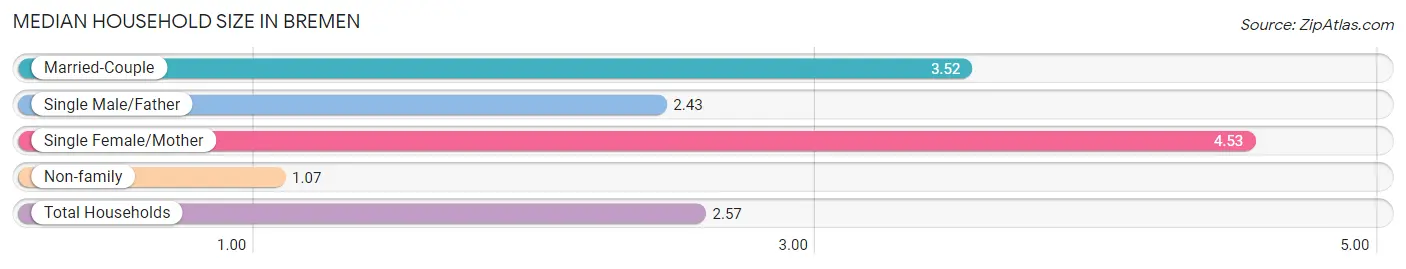
| Household Type | # Households | Household Size |
| Married-Couple | 881 (49.7%) | 3.52 |
| Single Male/Father | 61 (3.4%) | 2.43 |
| Single Female/Mother | 123 (7.0%) | 4.53 |
| Non-family | 706 (39.9%) | 1.07 |
| Total Households | 1,771 (100.0%) | 2.57 |
Household Size by Marriage Status in Bremen
Out of a total of 1,771 households in Bremen, 1,065 (60.1%) are family households, while 706 (39.9%) are nonfamily households. The most numerous type of family households are 2-person households, comprising 339, and the most common type of nonfamily households are 1-person households, comprising 662.
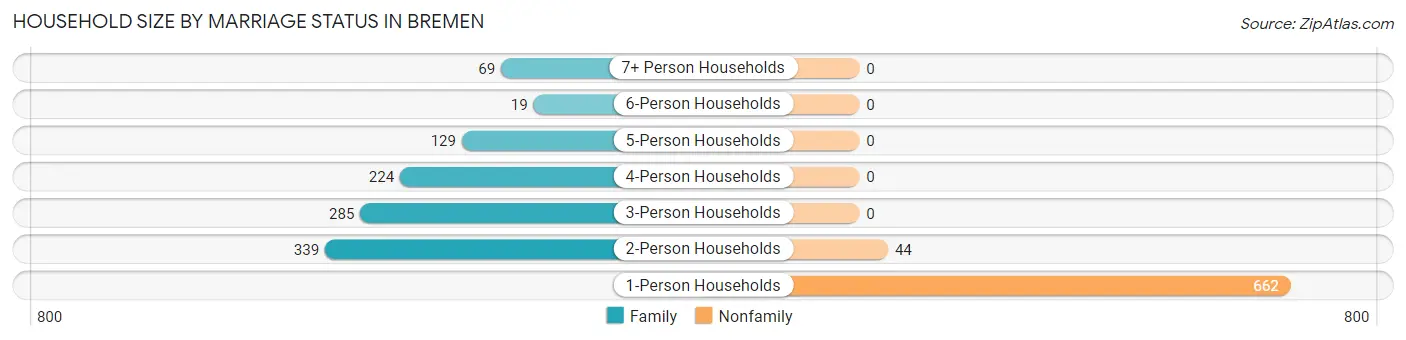
| Household Size | Family Households | Nonfamily Households |
| 1-Person Households | - | 662 (37.4%) |
| 2-Person Households | 339 (19.1%) | 44 (2.5%) |
| 3-Person Households | 285 (16.1%) | 0 (0.0%) |
| 4-Person Households | 224 (12.7%) | 0 (0.0%) |
| 5-Person Households | 129 (7.3%) | 0 (0.0%) |
| 6-Person Households | 19 (1.1%) | 0 (0.0%) |
| 7+ Person Households | 69 (3.9%) | 0 (0.0%) |
| Total | 1,065 (60.1%) | 706 (39.9%) |
Female Fertility in Bremen
Fertility by Age in Bremen
Average fertility rate in Bremen is 21.0 births per 1,000 women. Women in the age bracket of 20 to 34 years have the highest fertility rate with 50.0 births per 1,000 women. Women in the age bracket of 20 to 34 years acount for 100.0% of all women with births.
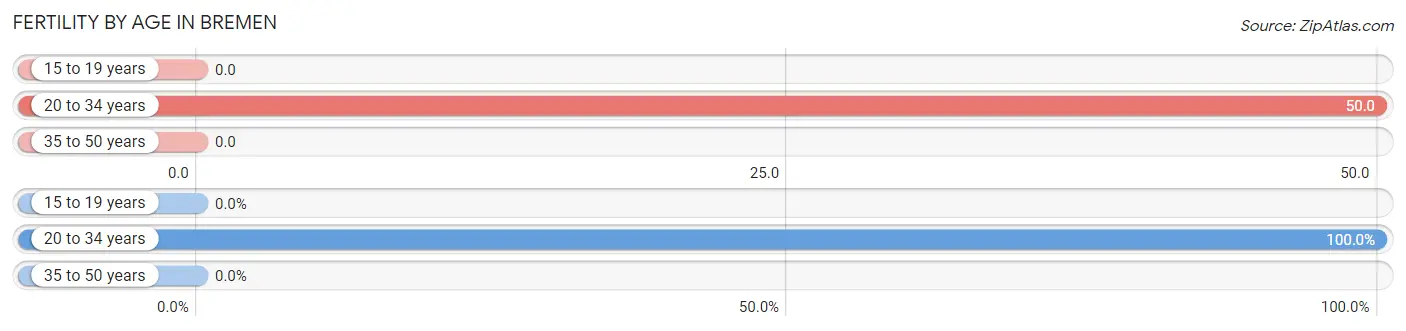
| Age Bracket | Women with Births | Births / 1,000 Women |
| 15 to 19 years | 0 (0.0%) | 0.0 |
| 20 to 34 years | 21 (100.0%) | 50.0 |
| 35 to 50 years | 0 (0.0%) | 0.0 |
| Total | 21 (100.0%) | 21.0 |
Fertility by Age by Marriage Status in Bremen
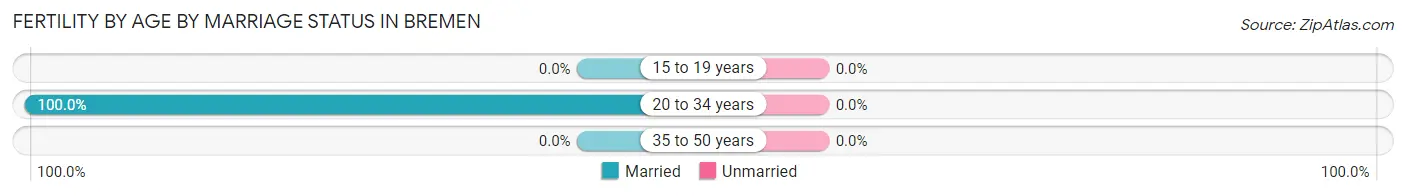
| Age Bracket | Married | Unmarried |
| 15 to 19 years | 0 (0.0%) | 0 (0.0%) |
| 20 to 34 years | 21 (100.0%) | 0 (0.0%) |
| 35 to 50 years | 0 (0.0%) | 0 (0.0%) |
| Total | 21 (100.0%) | 0 (0.0%) |
Fertility by Education in Bremen
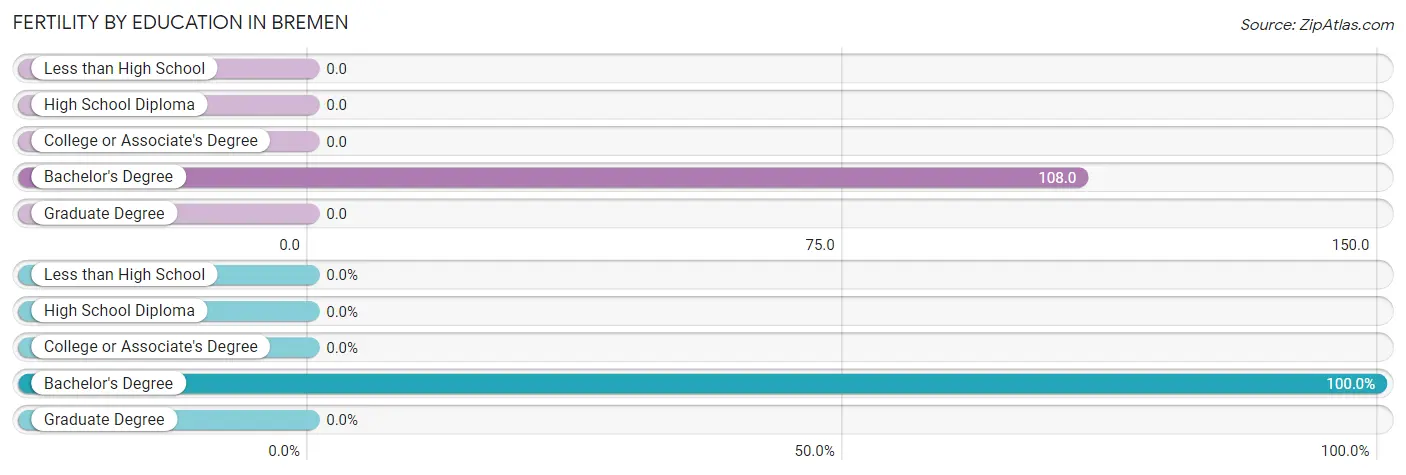
| Educational Attainment | Women with Births | Births / 1,000 Women |
| Less than High School | 0 (0.0%) | 0.0 |
| High School Diploma | 0 (0.0%) | 0.0 |
| College or Associate's Degree | 0 (0.0%) | 0.0 |
| Bachelor's Degree | 21 (100.0%) | 108.0 |
| Graduate Degree | 0 (0.0%) | 0.0 |
| Total | 21 (100.0%) | 21.0 |
Fertility by Education by Marriage Status in Bremen
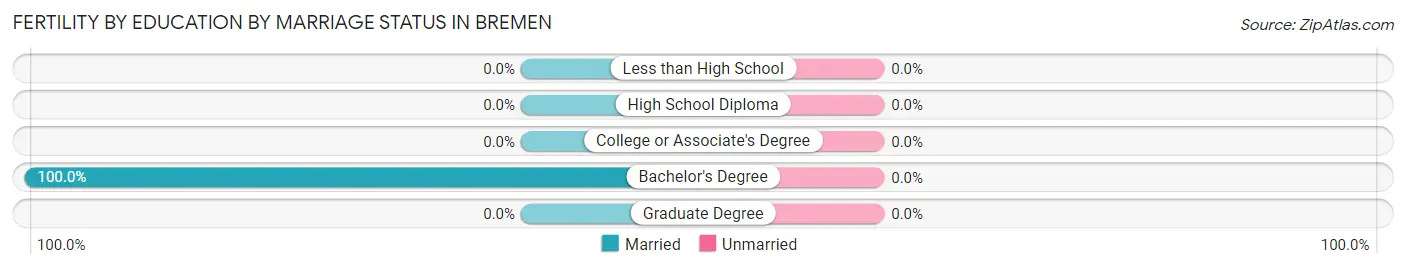
| Educational Attainment | Married | Unmarried |
| Less than High School | 0 (0.0%) | 0 (0.0%) |
| High School Diploma | 0 (0.0%) | 0 (0.0%) |
| College or Associate's Degree | 0 (0.0%) | 0 (0.0%) |
| Bachelor's Degree | 21 (100.0%) | 0 (0.0%) |
| Graduate Degree | 0 (0.0%) | 0 (0.0%) |
| Total | 21 (100.0%) | 0 (0.0%) |
Employment Characteristics in Bremen
Employment by Class of Employer in Bremen
Among the 2,236 employed individuals in Bremen, private company employees (1,585 | 70.9%), not-for-profit organizations (274 | 12.2%), and self-employed (not incorporated) (131 | 5.9%) make up the most common classes of employment.
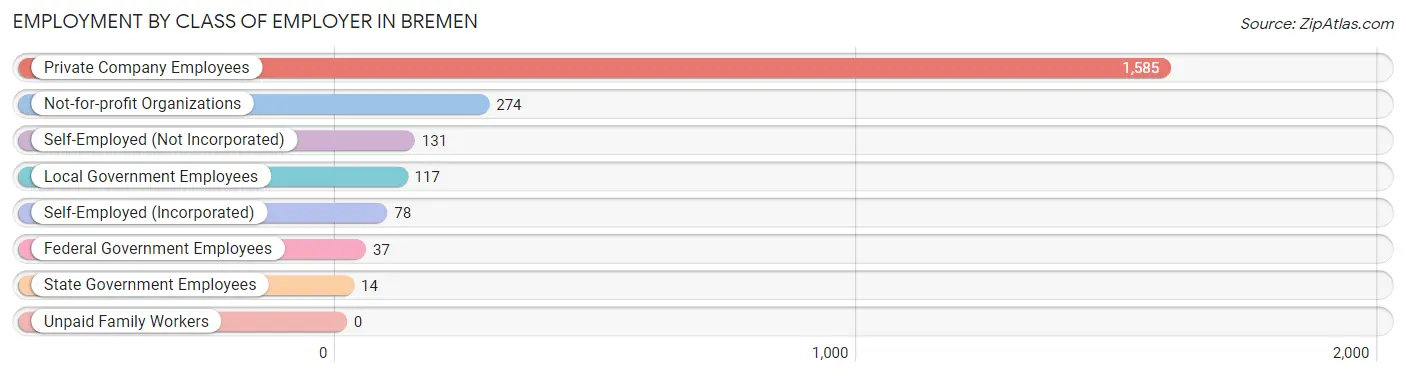
| Employer Class | # Employees | % Employees |
| Private Company Employees | 1,585 | 70.9% |
| Self-Employed (Incorporated) | 78 | 3.5% |
| Self-Employed (Not Incorporated) | 131 | 5.9% |
| Not-for-profit Organizations | 274 | 12.2% |
| Local Government Employees | 117 | 5.2% |
| State Government Employees | 14 | 0.6% |
| Federal Government Employees | 37 | 1.7% |
| Unpaid Family Workers | 0 | 0.0% |
| Total | 2,236 | 100.0% |
Employment Status by Age in Bremen
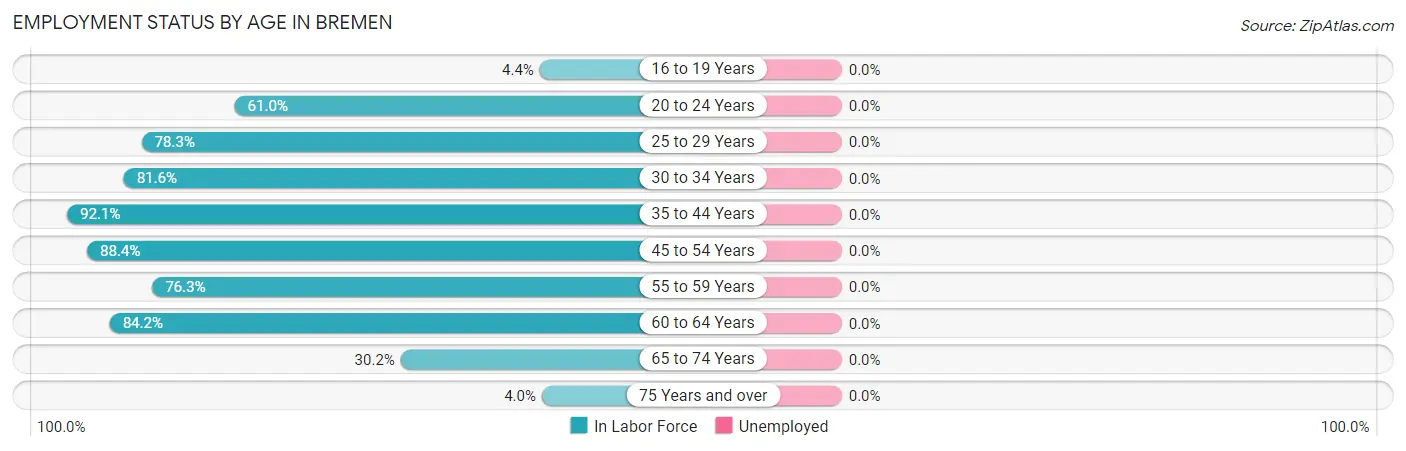
| Age Bracket | In Labor Force | Unemployed |
| 16 to 19 Years | 12 (4.4%) | 0 (0.0%) |
| 20 to 24 Years | 158 (61.0%) | 0 (0.0%) |
| 25 to 29 Years | 264 (78.3%) | 0 (0.0%) |
| 30 to 34 Years | 217 (81.6%) | 0 (0.0%) |
| 35 to 44 Years | 581 (92.1%) | 0 (0.0%) |
| 45 to 54 Years | 358 (88.4%) | 0 (0.0%) |
| 55 to 59 Years | 209 (76.3%) | 0 (0.0%) |
| 60 to 64 Years | 282 (84.2%) | 0 (0.0%) |
| 65 to 74 Years | 142 (30.2%) | 0 (0.0%) |
| 75 Years and over | 13 (4.0%) | 0 (0.0%) |
| Total | 2,235 (62.5%) | 0 (0.0%) |
Employment Status by Educational Attainment in Bremen
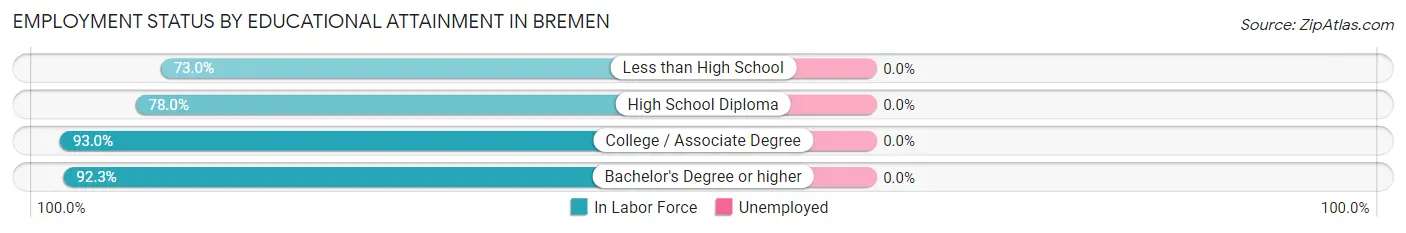
| Educational Attainment | In Labor Force | Unemployed |
| Less than High School | 327 (73.0%) | 0 (0.0%) |
| High School Diploma | 442 (78.0%) | 0 (0.0%) |
| College / Associate Degree | 556 (93.0%) | 0 (0.0%) |
| Bachelor's Degree or higher | 586 (92.3%) | 0 (0.0%) |
| Total | 1,911 (85.0%) | 0 (0.0%) |
Employment Occupations by Sex in Bremen
Management, Business, Science and Arts Occupations
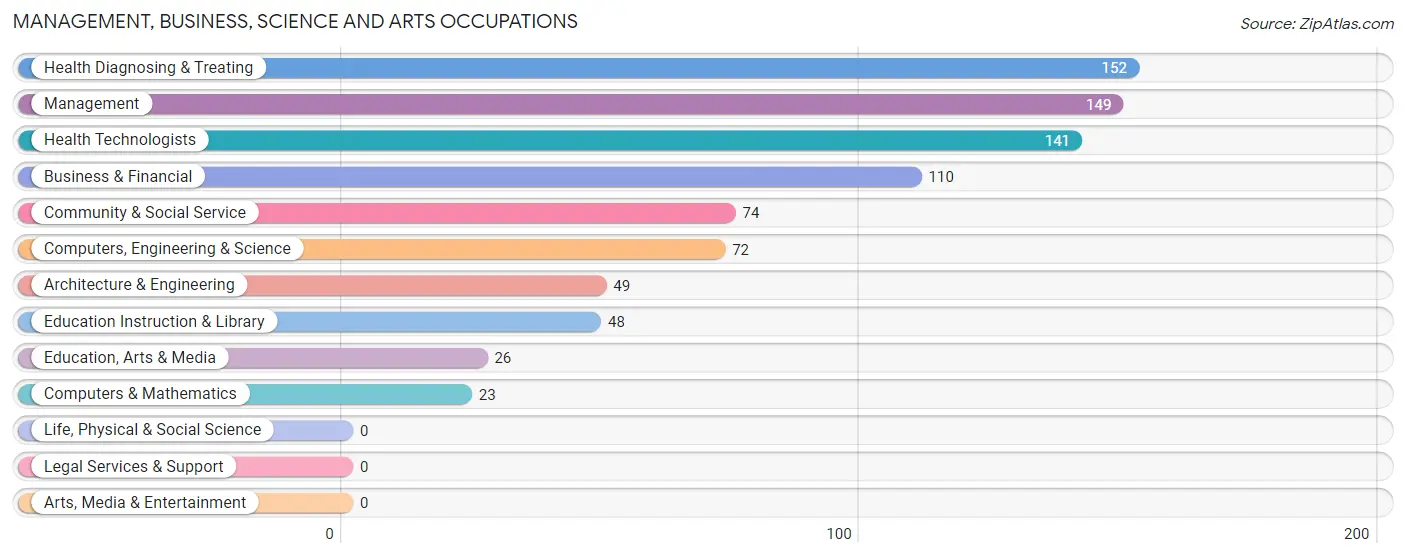
The most common Management, Business, Science and Arts occupations in Bremen are Health Diagnosing & Treating (152 | 6.9%), Management (149 | 6.7%), Health Technologists (141 | 6.4%), Business & Financial (110 | 5.0%), and Community & Social Service (74 | 3.3%).
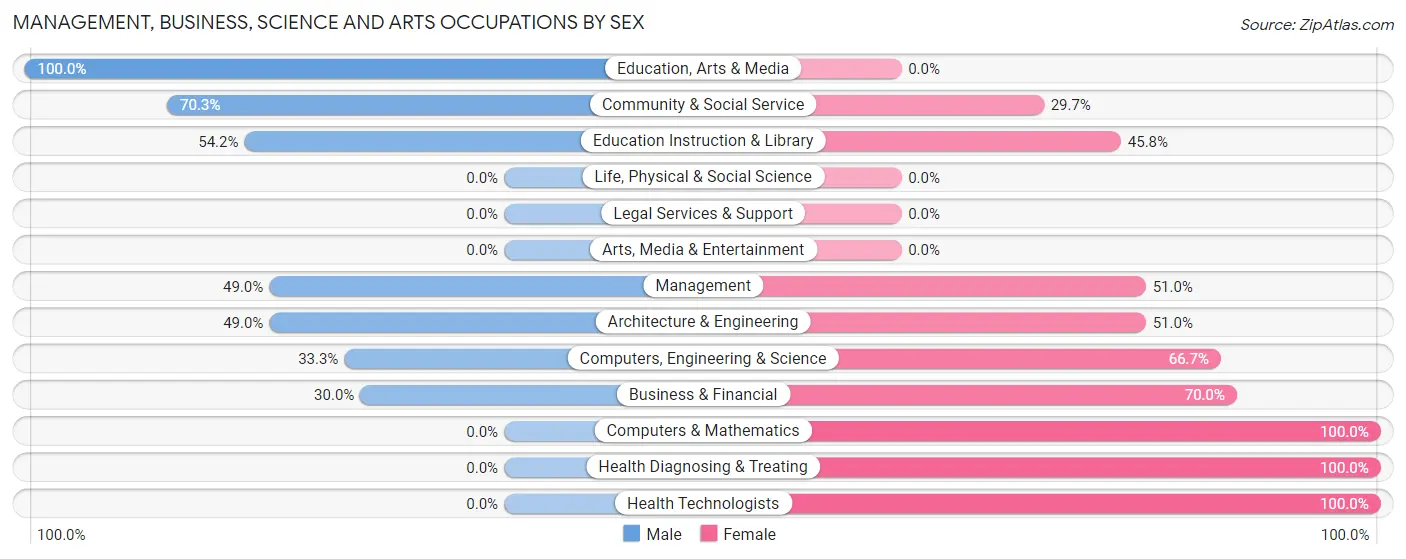
Management, Business, Science and Arts Occupations by Sex
Within the Management, Business, Science and Arts occupations in Bremen, the most male-oriented occupations are Education, Arts & Media (100.0%), Community & Social Service (70.3%), and Education Instruction & Library (54.2%), while the most female-oriented occupations are Computers & Mathematics (100.0%), Health Diagnosing & Treating (100.0%), and Health Technologists (100.0%).
| Occupation | Male | Female |
| Management | 73 (49.0%) | 76 (51.0%) |
| Business & Financial | 33 (30.0%) | 77 (70.0%) |
| Computers, Engineering & Science | 24 (33.3%) | 48 (66.7%) |
| Computers & Mathematics | 0 (0.0%) | 23 (100.0%) |
| Architecture & Engineering | 24 (49.0%) | 25 (51.0%) |
| Life, Physical & Social Science | 0 (0.0%) | 0 (0.0%) |
| Community & Social Service | 52 (70.3%) | 22 (29.7%) |
| Education, Arts & Media | 26 (100.0%) | 0 (0.0%) |
| Legal Services & Support | 0 (0.0%) | 0 (0.0%) |
| Education Instruction & Library | 26 (54.2%) | 22 (45.8%) |
| Arts, Media & Entertainment | 0 (0.0%) | 0 (0.0%) |
| Health Diagnosing & Treating | 0 (0.0%) | 152 (100.0%) |
| Health Technologists | 0 (0.0%) | 141 (100.0%) |
| Total (Category) | 182 (32.7%) | 375 (67.3%) |
| Total (Overall) | 1,176 (53.1%) | 1,039 (46.9%) |
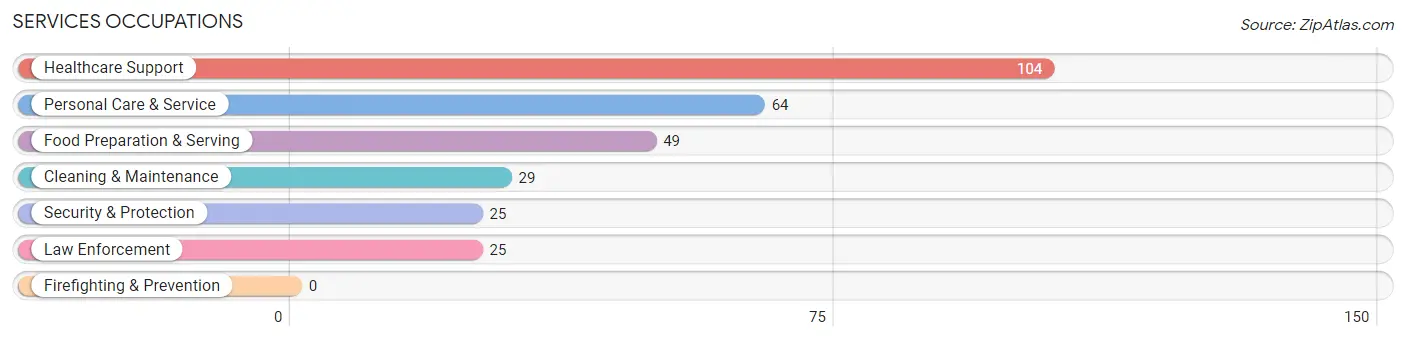
Services Occupations
The most common Services occupations in Bremen are Healthcare Support (104 | 4.7%), Personal Care & Service (64 | 2.9%), Food Preparation & Serving (49 | 2.2%), Cleaning & Maintenance (29 | 1.3%), and Security & Protection (25 | 1.1%).
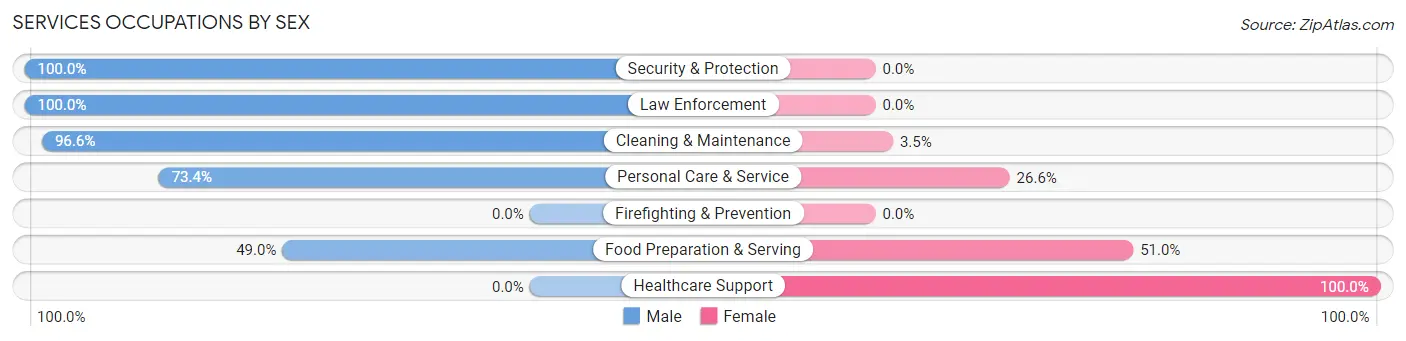
Services Occupations by Sex
Within the Services occupations in Bremen, the most male-oriented occupations are Security & Protection (100.0%), Law Enforcement (100.0%), and Cleaning & Maintenance (96.6%), while the most female-oriented occupations are Healthcare Support (100.0%), Food Preparation & Serving (51.0%), and Personal Care & Service (26.6%).
| Occupation | Male | Female |
| Healthcare Support | 0 (0.0%) | 104 (100.0%) |
| Security & Protection | 25 (100.0%) | 0 (0.0%) |
| Firefighting & Prevention | 0 (0.0%) | 0 (0.0%) |
| Law Enforcement | 25 (100.0%) | 0 (0.0%) |
| Food Preparation & Serving | 24 (49.0%) | 25 (51.0%) |
| Cleaning & Maintenance | 28 (96.6%) | 1 (3.5%) |
| Personal Care & Service | 47 (73.4%) | 17 (26.6%) |
| Total (Category) | 124 (45.8%) | 147 (54.2%) |
| Total (Overall) | 1,176 (53.1%) | 1,039 (46.9%) |
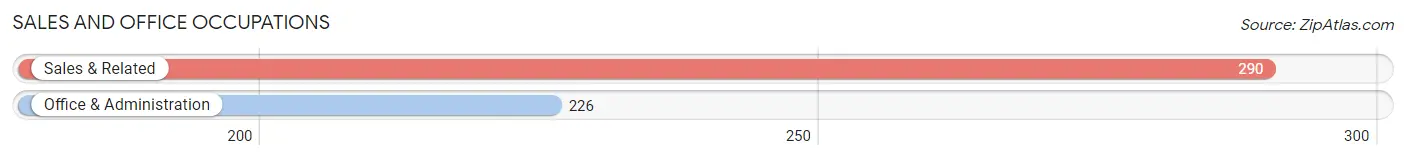
Sales and Office Occupations
The most common Sales and Office occupations in Bremen are Sales & Related (290 | 13.1%), and Office & Administration (226 | 10.2%).
Sales and Office Occupations by Sex
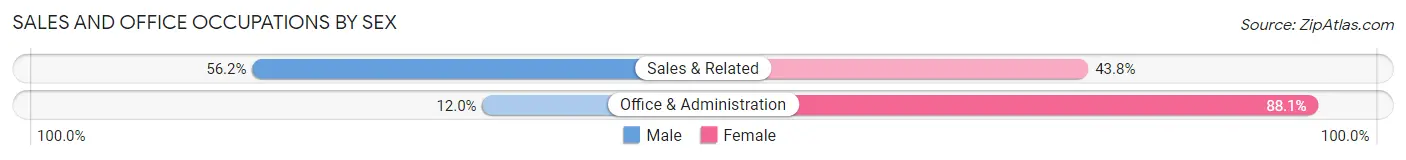
| Occupation | Male | Female |
| Sales & Related | 163 (56.2%) | 127 (43.8%) |
| Office & Administration | 27 (11.9%) | 199 (88.0%) |
| Total (Category) | 190 (36.8%) | 326 (63.2%) |
| Total (Overall) | 1,176 (53.1%) | 1,039 (46.9%) |
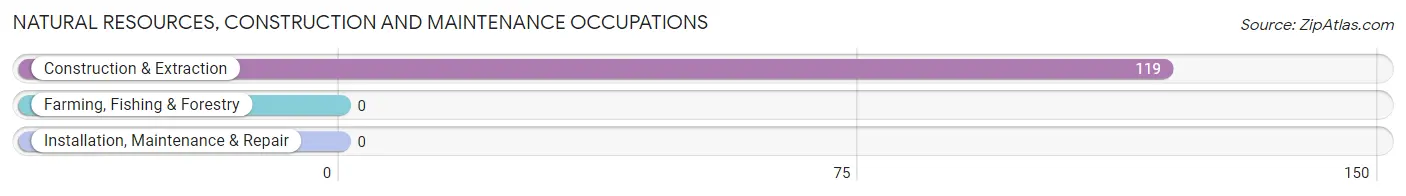
Natural Resources, Construction and Maintenance Occupations
The most common Natural Resources, Construction and Maintenance occupations in Bremen are , and Construction & Extraction (119 | 5.4%).
Natural Resources, Construction and Maintenance Occupations by Sex
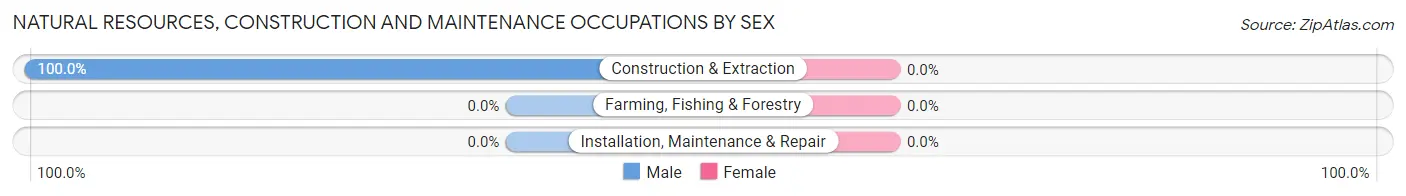
| Occupation | Male | Female |
| Farming, Fishing & Forestry | 0 (0.0%) | 0 (0.0%) |
| Construction & Extraction | 119 (100.0%) | 0 (0.0%) |
| Installation, Maintenance & Repair | 0 (0.0%) | 0 (0.0%) |
| Total (Category) | 119 (100.0%) | 0 (0.0%) |
| Total (Overall) | 1,176 (53.1%) | 1,039 (46.9%) |
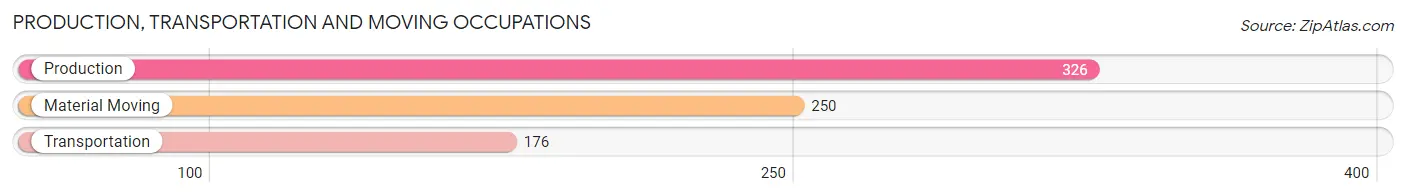
Production, Transportation and Moving Occupations
The most common Production, Transportation and Moving occupations in Bremen are Production (326 | 14.7%), Material Moving (250 | 11.3%), and Transportation (176 | 8.0%).
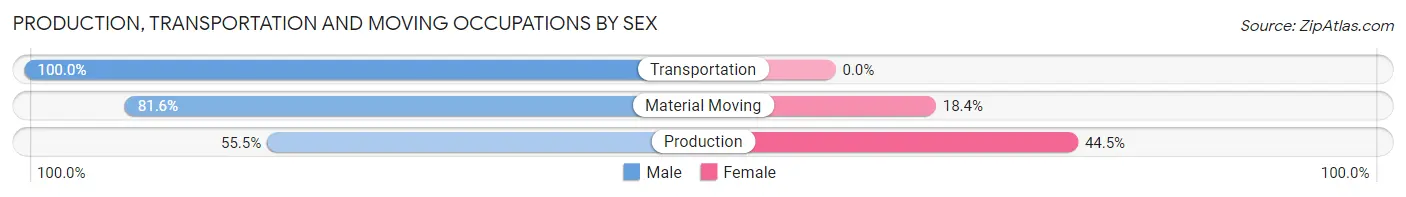
Production, Transportation and Moving Occupations by Sex
| Occupation | Male | Female |
| Production | 181 (55.5%) | 145 (44.5%) |
| Transportation | 176 (100.0%) | 0 (0.0%) |
| Material Moving | 204 (81.6%) | 46 (18.4%) |
| Total (Category) | 561 (74.6%) | 191 (25.4%) |
| Total (Overall) | 1,176 (53.1%) | 1,039 (46.9%) |
Employment Industries by Sex in Bremen
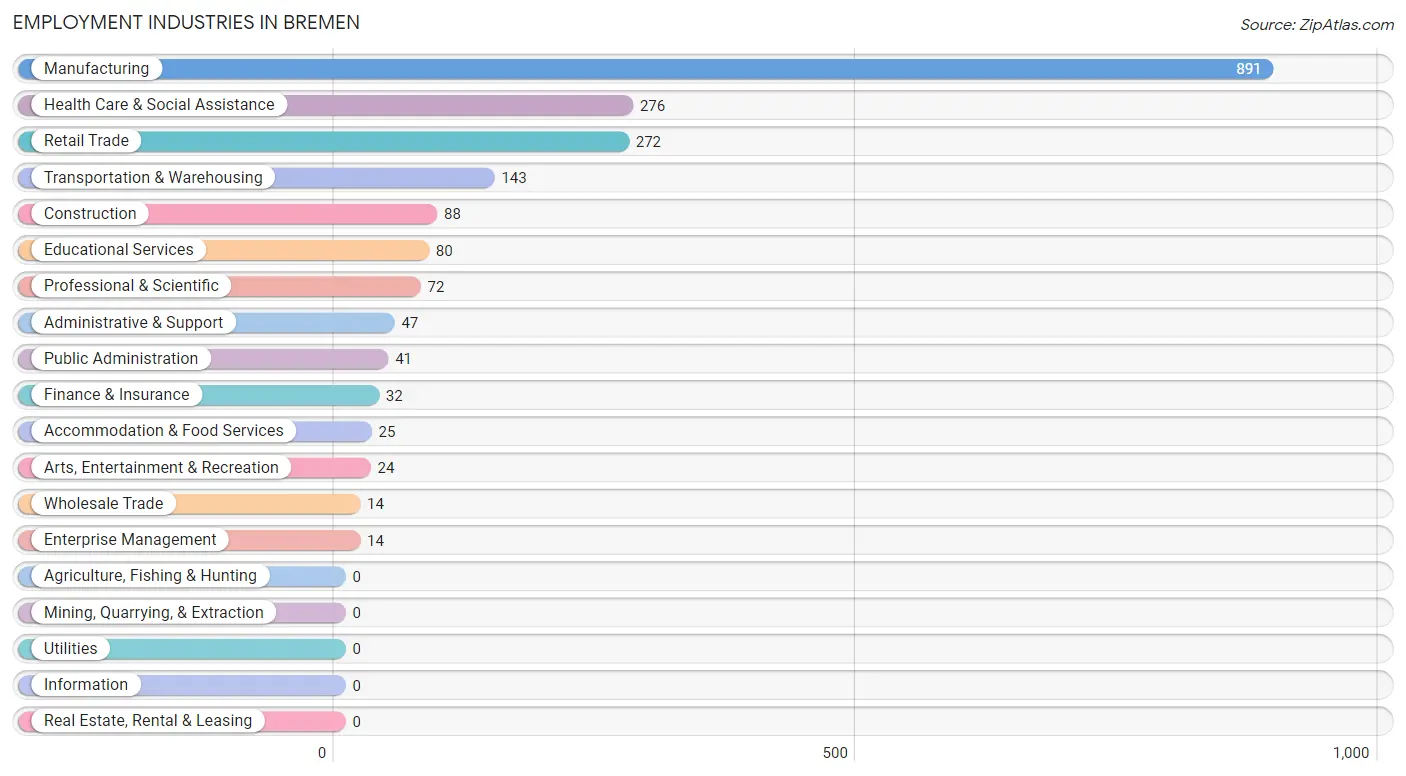
Employment Industries in Bremen
The major employment industries in Bremen include Manufacturing (891 | 40.2%), Health Care & Social Assistance (276 | 12.5%), Retail Trade (272 | 12.3%), Transportation & Warehousing (143 | 6.5%), and Construction (88 | 4.0%).
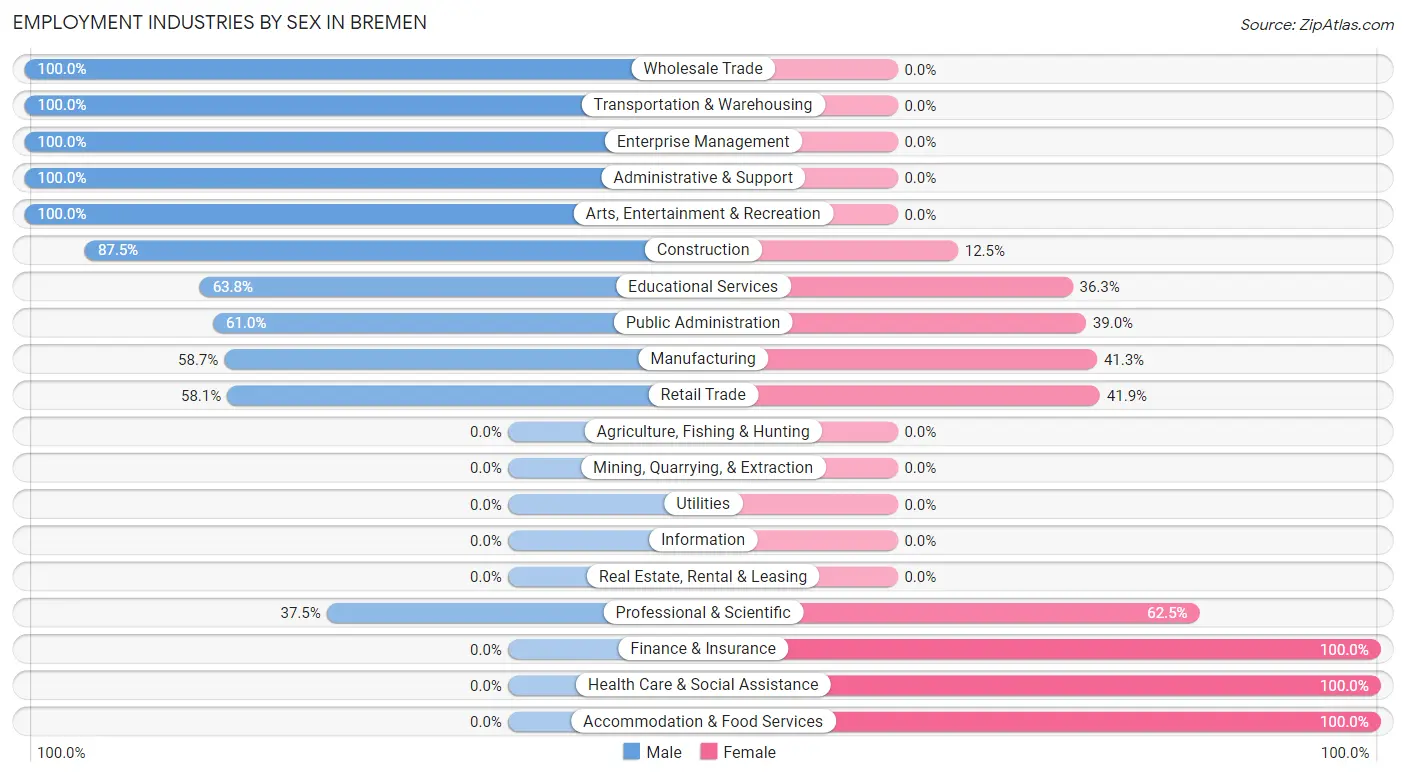
Employment Industries by Sex in Bremen
The Bremen industries that see more men than women are Wholesale Trade (100.0%), Transportation & Warehousing (100.0%), and Enterprise Management (100.0%), whereas the industries that tend to have a higher number of women are Finance & Insurance (100.0%), Health Care & Social Assistance (100.0%), and Accommodation & Food Services (100.0%).
| Industry | Male | Female |
| Agriculture, Fishing & Hunting | 0 (0.0%) | 0 (0.0%) |
| Mining, Quarrying, & Extraction | 0 (0.0%) | 0 (0.0%) |
| Construction | 77 (87.5%) | 11 (12.5%) |
| Manufacturing | 523 (58.7%) | 368 (41.3%) |
| Wholesale Trade | 14 (100.0%) | 0 (0.0%) |
| Retail Trade | 158 (58.1%) | 114 (41.9%) |
| Transportation & Warehousing | 143 (100.0%) | 0 (0.0%) |
| Utilities | 0 (0.0%) | 0 (0.0%) |
| Information | 0 (0.0%) | 0 (0.0%) |
| Finance & Insurance | 0 (0.0%) | 32 (100.0%) |
| Real Estate, Rental & Leasing | 0 (0.0%) | 0 (0.0%) |
| Professional & Scientific | 27 (37.5%) | 45 (62.5%) |
| Enterprise Management | 14 (100.0%) | 0 (0.0%) |
| Administrative & Support | 47 (100.0%) | 0 (0.0%) |
| Educational Services | 51 (63.7%) | 29 (36.2%) |
| Health Care & Social Assistance | 0 (0.0%) | 276 (100.0%) |
| Arts, Entertainment & Recreation | 24 (100.0%) | 0 (0.0%) |
| Accommodation & Food Services | 0 (0.0%) | 25 (100.0%) |
| Public Administration | 25 (61.0%) | 16 (39.0%) |
| Total | 1,176 (53.1%) | 1,039 (46.9%) |
Education in Bremen
School Enrollment in Bremen
The most common levels of schooling among the 1,308 students in Bremen are middle school (430 | 32.9%), elementary school (351 | 26.8%), and college / undergraduate (189 | 14.4%).
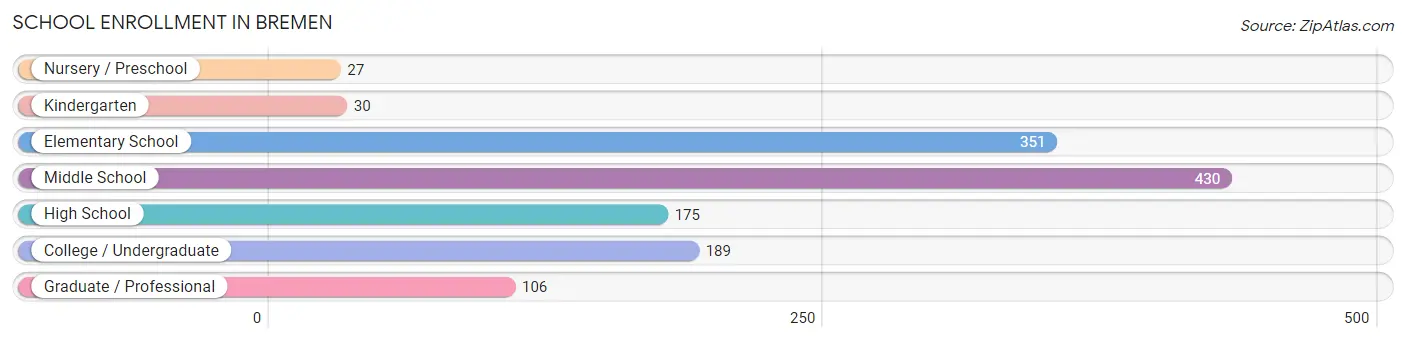
| School Level | # Students | % Students |
| Nursery / Preschool | 27 | 2.1% |
| Kindergarten | 30 | 2.3% |
| Elementary School | 351 | 26.8% |
| Middle School | 430 | 32.9% |
| High School | 175 | 13.4% |
| College / Undergraduate | 189 | 14.4% |
| Graduate / Professional | 106 | 8.1% |
| Total | 1,308 | 100.0% |
School Enrollment by Age by Funding Source in Bremen
Out of a total of 1,308 students who are enrolled in schools in Bremen, 320 (24.5%) attend a private institution, while the remaining 988 (75.5%) are enrolled in public schools. The age group of 20 to 24 year olds has the highest likelihood of being enrolled in private schools, with 35 (100.0% in the age bracket) enrolled. Conversely, the age group of 3 to 4 year olds has the lowest likelihood of being enrolled in a private school, with 20 (100.0% in the age bracket) attending a public institution.
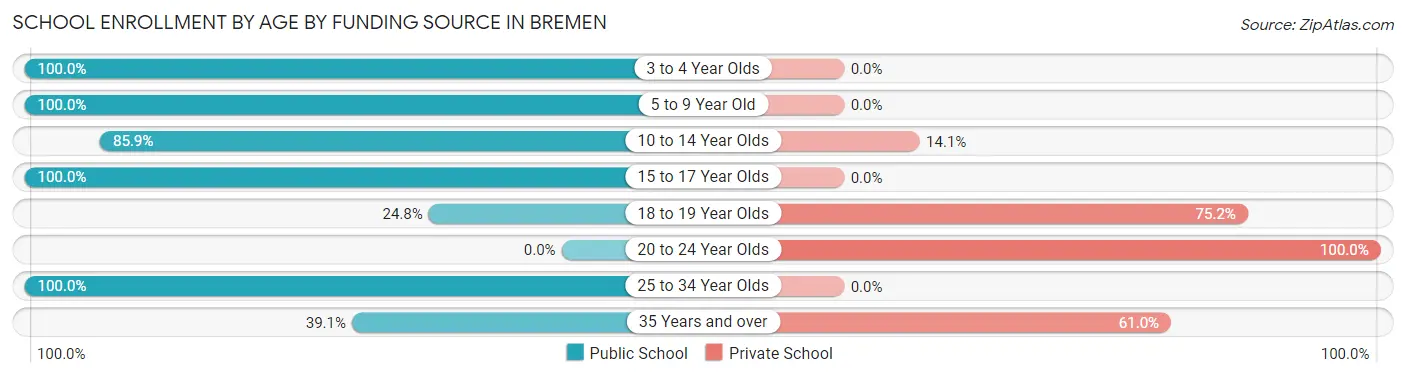
| Age Bracket | Public School | Private School |
| 3 to 4 Year Olds | 20 (100.0%) | 0 (0.0%) |
| 5 to 9 Year Old | 355 (100.0%) | 0 (0.0%) |
| 10 to 14 Year Olds | 385 (85.9%) | 63 (14.1%) |
| 15 to 17 Year Olds | 93 (100.0%) | 0 (0.0%) |
| 18 to 19 Year Olds | 52 (24.8%) | 158 (75.2%) |
| 20 to 24 Year Olds | 0 (0.0%) | 35 (100.0%) |
| 25 to 34 Year Olds | 42 (100.0%) | 0 (0.0%) |
| 35 Years and over | 41 (39.1%) | 64 (61.0%) |
| Total | 988 (75.5%) | 320 (24.5%) |
Educational Attainment by Field of Study in Bremen
Business (313 | 35.4%), liberal arts & history (174 | 19.7%), science & technology (117 | 13.2%), education (115 | 13.0%), and bio, nature & agricultural (69 | 7.8%) are the most common fields of study among 885 individuals in Bremen who have obtained a bachelor's degree or higher.
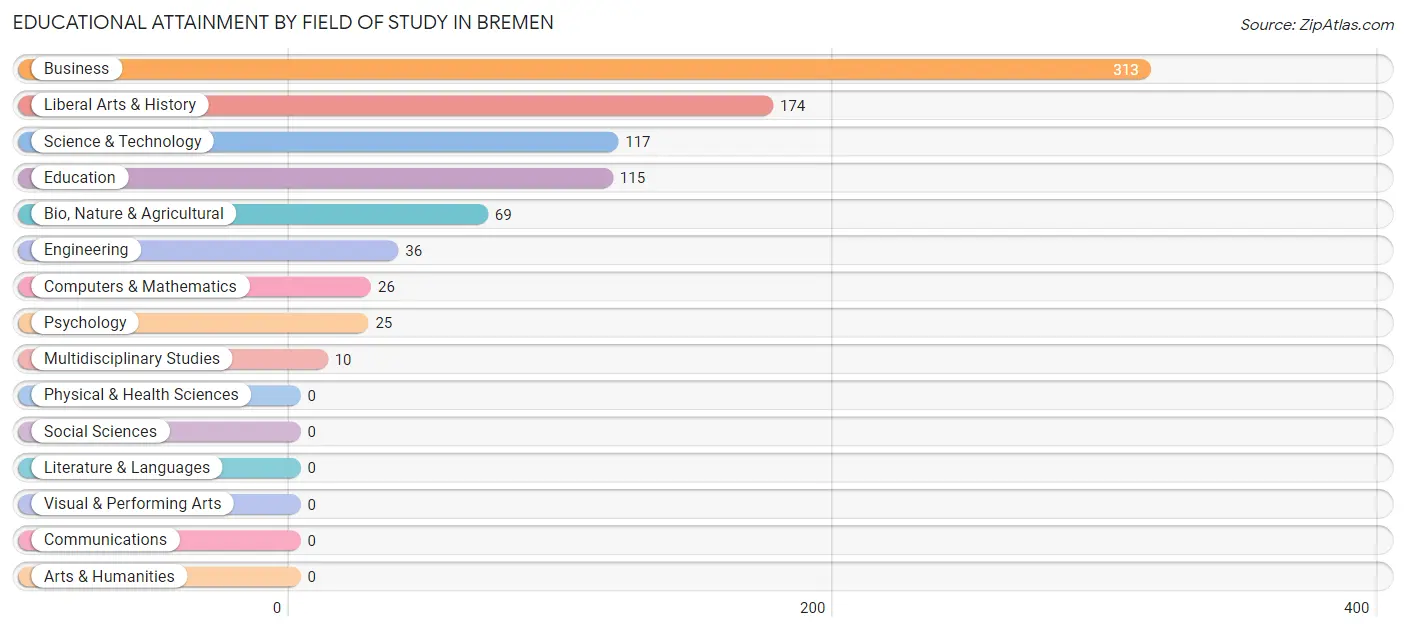
| Field of Study | # Graduates | % Graduates |
| Computers & Mathematics | 26 | 2.9% |
| Bio, Nature & Agricultural | 69 | 7.8% |
| Physical & Health Sciences | 0 | 0.0% |
| Psychology | 25 | 2.8% |
| Social Sciences | 0 | 0.0% |
| Engineering | 36 | 4.1% |
| Multidisciplinary Studies | 10 | 1.1% |
| Science & Technology | 117 | 13.2% |
| Business | 313 | 35.4% |
| Education | 115 | 13.0% |
| Literature & Languages | 0 | 0.0% |
| Liberal Arts & History | 174 | 19.7% |
| Visual & Performing Arts | 0 | 0.0% |
| Communications | 0 | 0.0% |
| Arts & Humanities | 0 | 0.0% |
| Total | 885 | 100.0% |
Transportation & Commute in Bremen
Vehicle Availability by Sex in Bremen
The most prevalent vehicle ownership categories in Bremen are males with 2 vehicles (493, accounting for 41.2%) and females with 2 vehicles (402, making up 47.4%).
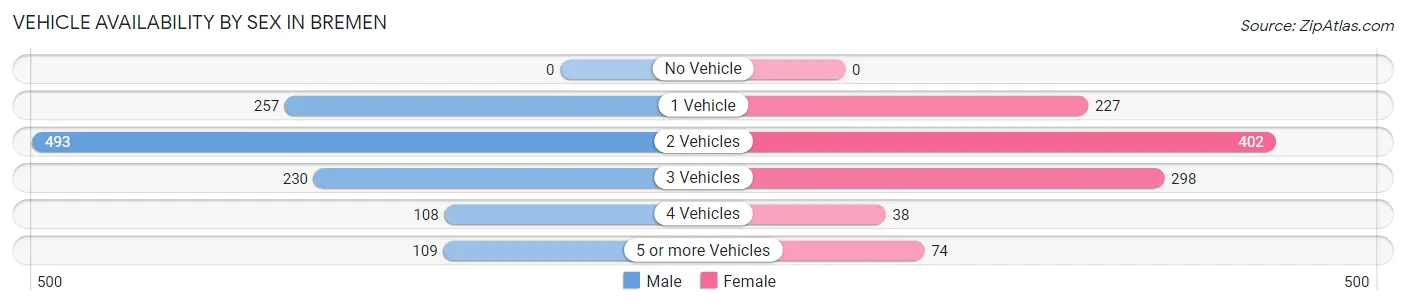
| Vehicles Available | Male | Female |
| No Vehicle | 0 (0.0%) | 0 (0.0%) |
| 1 Vehicle | 257 (21.5%) | 227 (21.8%) |
| 2 Vehicles | 493 (41.2%) | 402 (38.7%) |
| 3 Vehicles | 230 (19.2%) | 298 (28.7%) |
| 4 Vehicles | 108 (9.0%) | 38 (3.7%) |
| 5 or more Vehicles | 109 (9.1%) | 74 (7.1%) |
| Total | 1,197 (100.0%) | 1,039 (100.0%) |
Commute Time in Bremen
The most frequently occuring commute durations in Bremen are 5 to 9 minutes (648 commuters, 30.2%), less than 5 minutes (479 commuters, 22.3%), and 30 to 34 minutes (295 commuters, 13.8%).
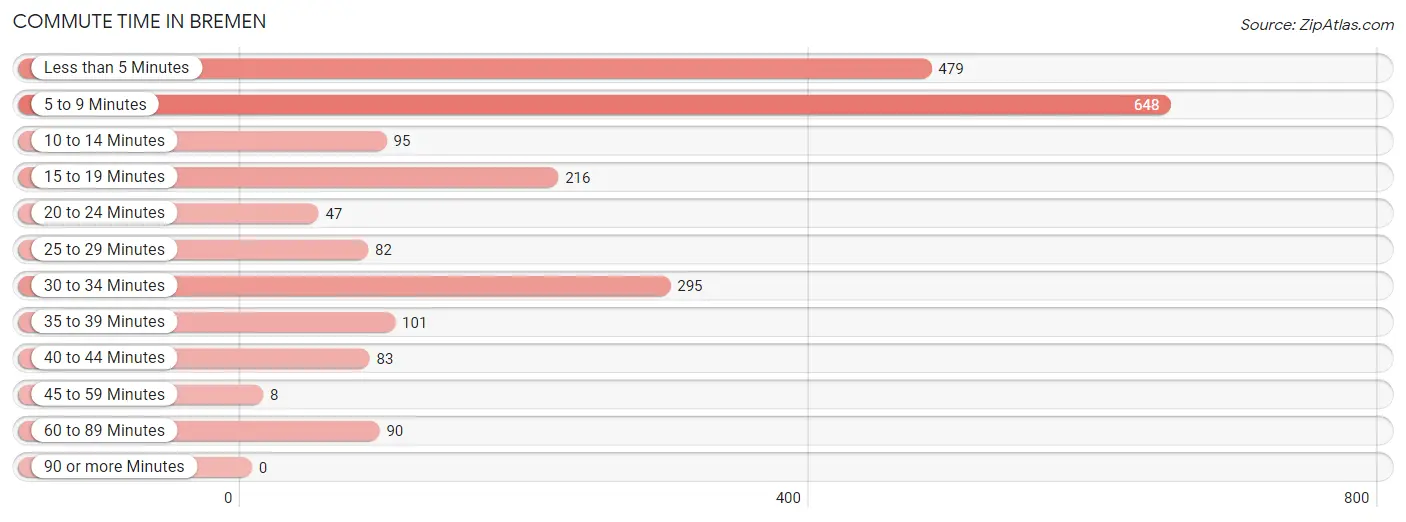
| Commute Time | # Commuters | % Commuters |
| Less than 5 Minutes | 479 | 22.3% |
| 5 to 9 Minutes | 648 | 30.2% |
| 10 to 14 Minutes | 95 | 4.4% |
| 15 to 19 Minutes | 216 | 10.1% |
| 20 to 24 Minutes | 47 | 2.2% |
| 25 to 29 Minutes | 82 | 3.8% |
| 30 to 34 Minutes | 295 | 13.8% |
| 35 to 39 Minutes | 101 | 4.7% |
| 40 to 44 Minutes | 83 | 3.9% |
| 45 to 59 Minutes | 8 | 0.4% |
| 60 to 89 Minutes | 90 | 4.2% |
| 90 or more Minutes | 0 | 0.0% |
Commute Time by Sex in Bremen
The most common commute times in Bremen are 5 to 9 minutes (317 commuters, 27.6%) for males and 5 to 9 minutes (331 commuters, 33.2%) for females.
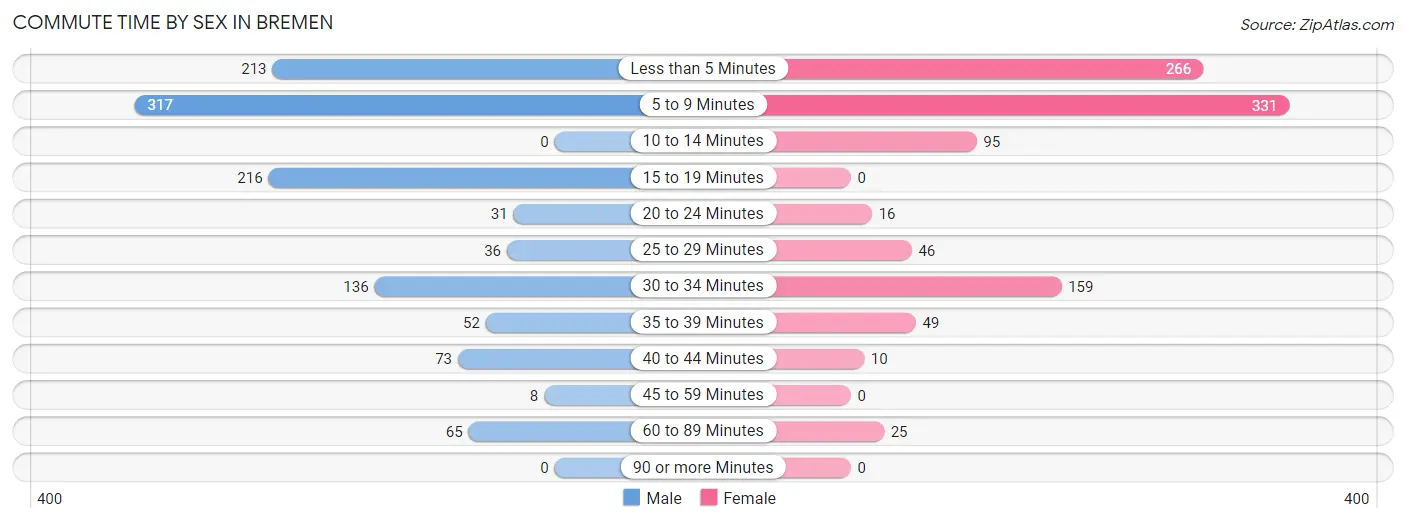
| Commute Time | Male | Female |
| Less than 5 Minutes | 213 (18.6%) | 266 (26.7%) |
| 5 to 9 Minutes | 317 (27.6%) | 331 (33.2%) |
| 10 to 14 Minutes | 0 (0.0%) | 95 (9.5%) |
| 15 to 19 Minutes | 216 (18.8%) | 0 (0.0%) |
| 20 to 24 Minutes | 31 (2.7%) | 16 (1.6%) |
| 25 to 29 Minutes | 36 (3.1%) | 46 (4.6%) |
| 30 to 34 Minutes | 136 (11.9%) | 159 (16.0%) |
| 35 to 39 Minutes | 52 (4.5%) | 49 (4.9%) |
| 40 to 44 Minutes | 73 (6.4%) | 10 (1.0%) |
| 45 to 59 Minutes | 8 (0.7%) | 0 (0.0%) |
| 60 to 89 Minutes | 65 (5.7%) | 25 (2.5%) |
| 90 or more Minutes | 0 (0.0%) | 0 (0.0%) |
Time of Departure to Work by Sex in Bremen
The most frequent times of departure to work in Bremen are 12:00 AM to 4:59 AM (392, 34.2%) for males and 7:30 AM to 7:59 AM (214, 21.5%) for females.
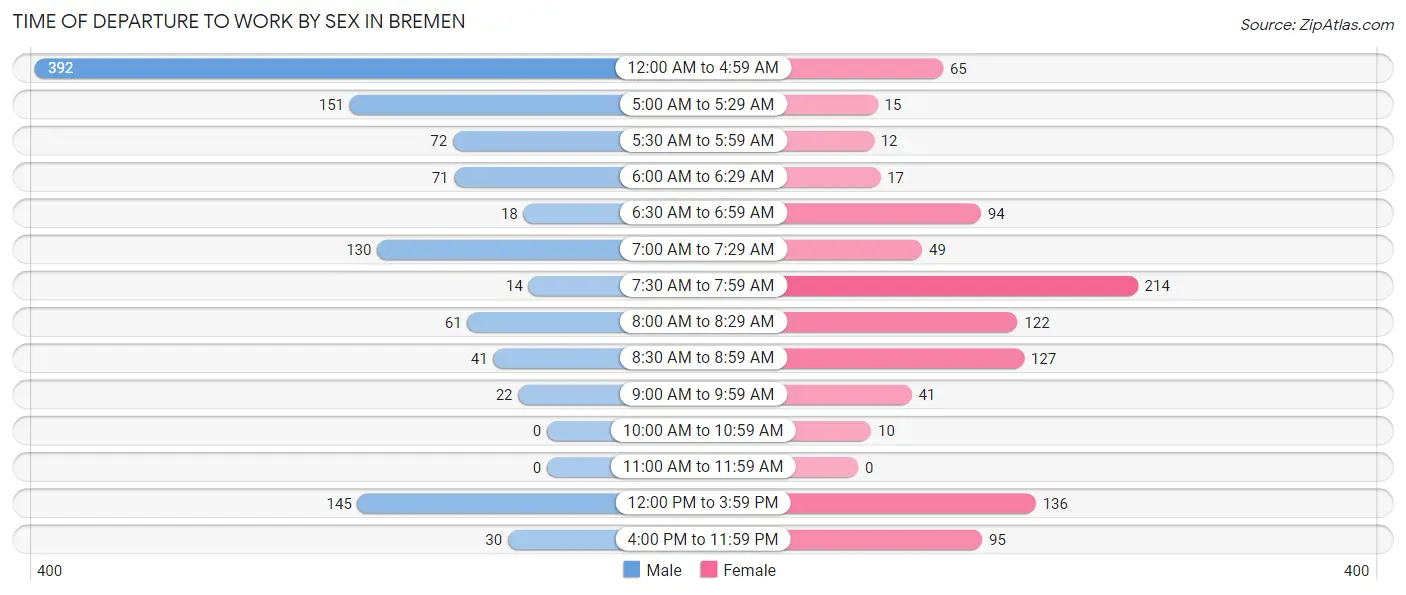
| Time of Departure | Male | Female |
| 12:00 AM to 4:59 AM | 392 (34.2%) | 65 (6.5%) |
| 5:00 AM to 5:29 AM | 151 (13.2%) | 15 (1.5%) |
| 5:30 AM to 5:59 AM | 72 (6.3%) | 12 (1.2%) |
| 6:00 AM to 6:29 AM | 71 (6.2%) | 17 (1.7%) |
| 6:30 AM to 6:59 AM | 18 (1.6%) | 94 (9.4%) |
| 7:00 AM to 7:29 AM | 130 (11.3%) | 49 (4.9%) |
| 7:30 AM to 7:59 AM | 14 (1.2%) | 214 (21.5%) |
| 8:00 AM to 8:29 AM | 61 (5.3%) | 122 (12.2%) |
| 8:30 AM to 8:59 AM | 41 (3.6%) | 127 (12.7%) |
| 9:00 AM to 9:59 AM | 22 (1.9%) | 41 (4.1%) |
| 10:00 AM to 10:59 AM | 0 (0.0%) | 10 (1.0%) |
| 11:00 AM to 11:59 AM | 0 (0.0%) | 0 (0.0%) |
| 12:00 PM to 3:59 PM | 145 (12.6%) | 136 (13.6%) |
| 4:00 PM to 11:59 PM | 30 (2.6%) | 95 (9.5%) |
| Total | 1,147 (100.0%) | 997 (100.0%) |
Housing Occupancy in Bremen
Occupancy by Ownership in Bremen
Of the total 1,771 dwellings in Bremen, owner-occupied units account for 1,093 (61.7%), while renter-occupied units make up 678 (38.3%).
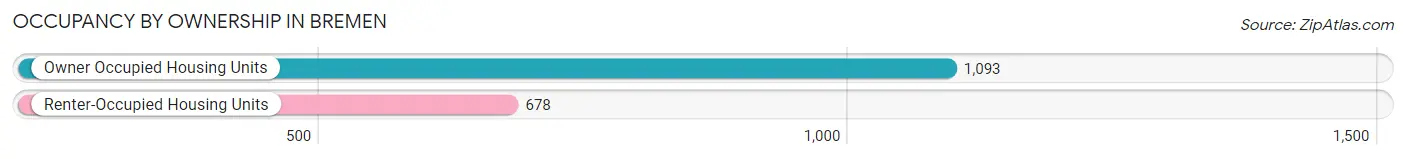
| Occupancy | # Housing Units | % Housing Units |
| Owner Occupied Housing Units | 1,093 | 61.7% |
| Renter-Occupied Housing Units | 678 | 38.3% |
| Total Occupied Housing Units | 1,771 | 100.0% |
Occupancy by Household Size in Bremen
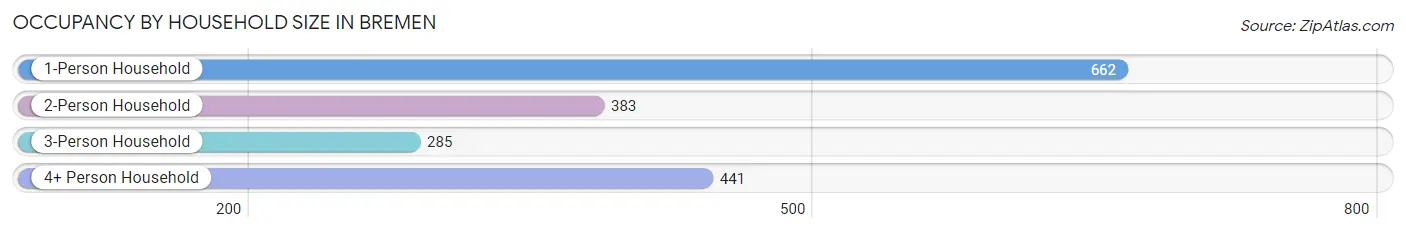
| Household Size | # Housing Units | % Housing Units |
| 1-Person Household | 662 | 37.4% |
| 2-Person Household | 383 | 21.6% |
| 3-Person Household | 285 | 16.1% |
| 4+ Person Household | 441 | 24.9% |
| Total Housing Units | 1,771 | 100.0% |
Occupancy by Ownership by Household Size in Bremen
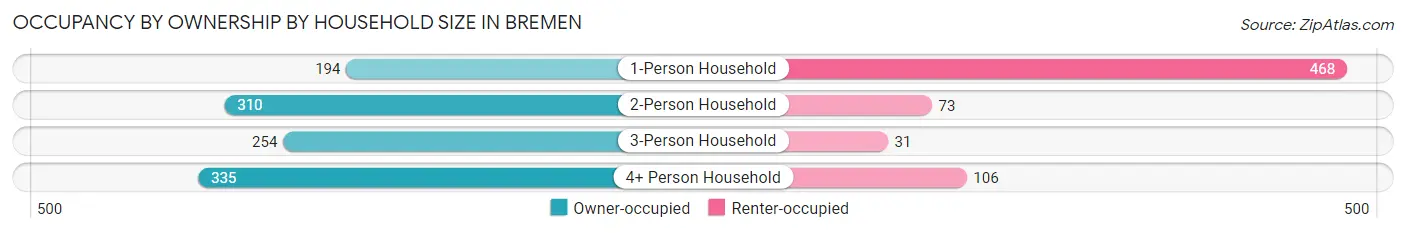
| Household Size | Owner-occupied | Renter-occupied |
| 1-Person Household | 194 (29.3%) | 468 (70.7%) |
| 2-Person Household | 310 (80.9%) | 73 (19.1%) |
| 3-Person Household | 254 (89.1%) | 31 (10.9%) |
| 4+ Person Household | 335 (76.0%) | 106 (24.0%) |
| Total Housing Units | 1,093 (61.7%) | 678 (38.3%) |
Occupancy by Educational Attainment in Bremen
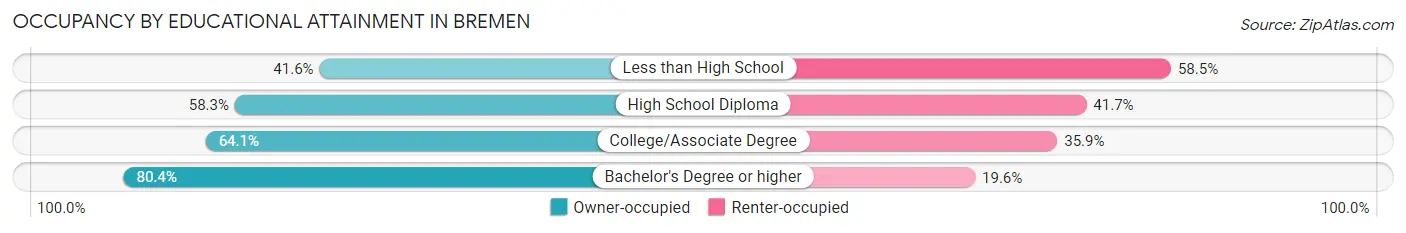
| Household Size | Owner-occupied | Renter-occupied |
| Less than High School | 145 (41.5%) | 204 (58.5%) |
| High School Diploma | 326 (58.3%) | 233 (41.7%) |
| College/Associate Degree | 282 (64.1%) | 158 (35.9%) |
| Bachelor's Degree or higher | 340 (80.4%) | 83 (19.6%) |
Occupancy by Age of Householder in Bremen
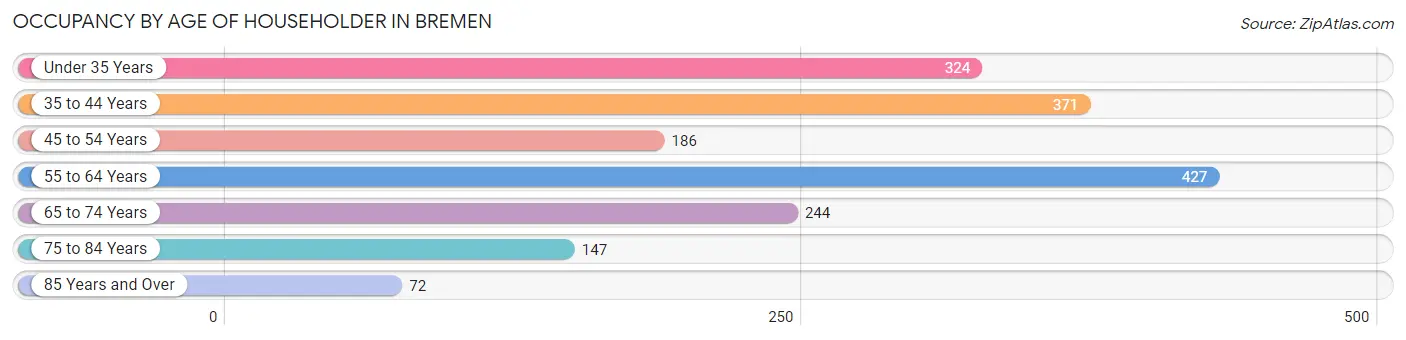
| Age Bracket | # Households | % Households |
| Under 35 Years | 324 | 18.3% |
| 35 to 44 Years | 371 | 20.9% |
| 45 to 54 Years | 186 | 10.5% |
| 55 to 64 Years | 427 | 24.1% |
| 65 to 74 Years | 244 | 13.8% |
| 75 to 84 Years | 147 | 8.3% |
| 85 Years and Over | 72 | 4.1% |
| Total | 1,771 | 100.0% |
Housing Finances in Bremen
Median Income by Occupancy in Bremen
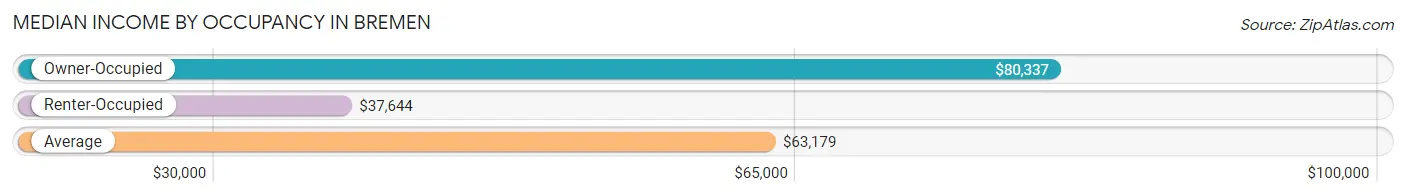
| Occupancy Type | # Households | Median Income |
| Owner-Occupied | 1,093 (61.7%) | $80,337 |
| Renter-Occupied | 678 (38.3%) | $37,644 |
| Average | 1,771 (100.0%) | $63,179 |
Occupancy by Householder Income Bracket in Bremen
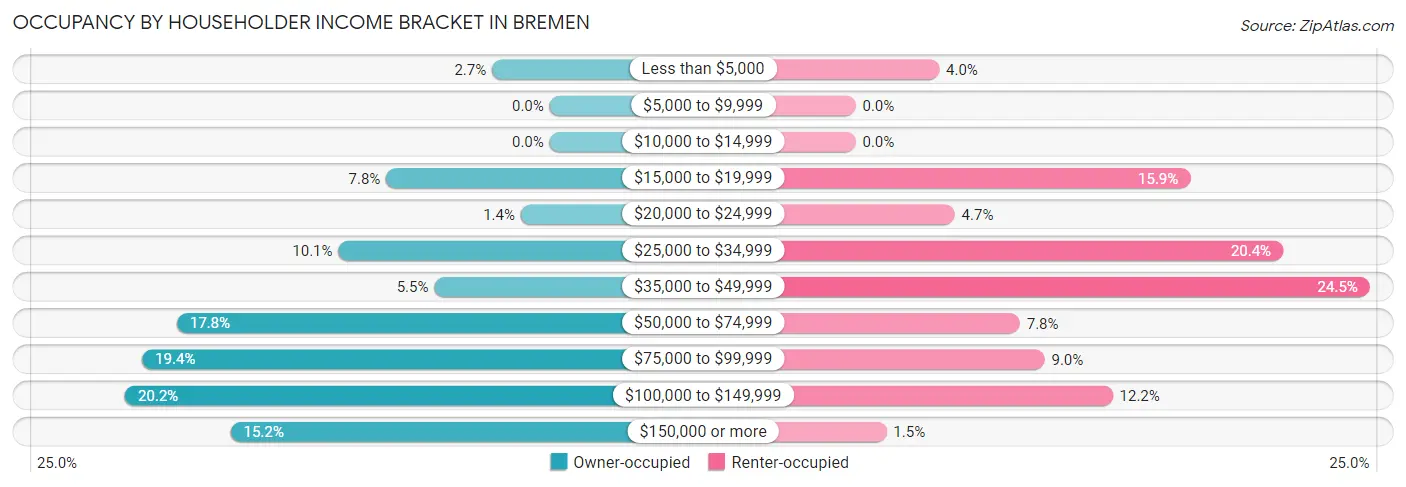
| Income Bracket | Owner-occupied | Renter-occupied |
| Less than $5,000 | 30 (2.7%) | 27 (4.0%) |
| $5,000 to $9,999 | 0 (0.0%) | 0 (0.0%) |
| $10,000 to $14,999 | 0 (0.0%) | 0 (0.0%) |
| $15,000 to $19,999 | 85 (7.8%) | 108 (15.9%) |
| $20,000 to $24,999 | 15 (1.4%) | 32 (4.7%) |
| $25,000 to $34,999 | 110 (10.1%) | 138 (20.3%) |
| $35,000 to $49,999 | 60 (5.5%) | 166 (24.5%) |
| $50,000 to $74,999 | 194 (17.7%) | 53 (7.8%) |
| $75,000 to $99,999 | 212 (19.4%) | 61 (9.0%) |
| $100,000 to $149,999 | 221 (20.2%) | 83 (12.2%) |
| $150,000 or more | 166 (15.2%) | 10 (1.5%) |
| Total | 1,093 (100.0%) | 678 (100.0%) |
Monthly Housing Cost Tiers in Bremen
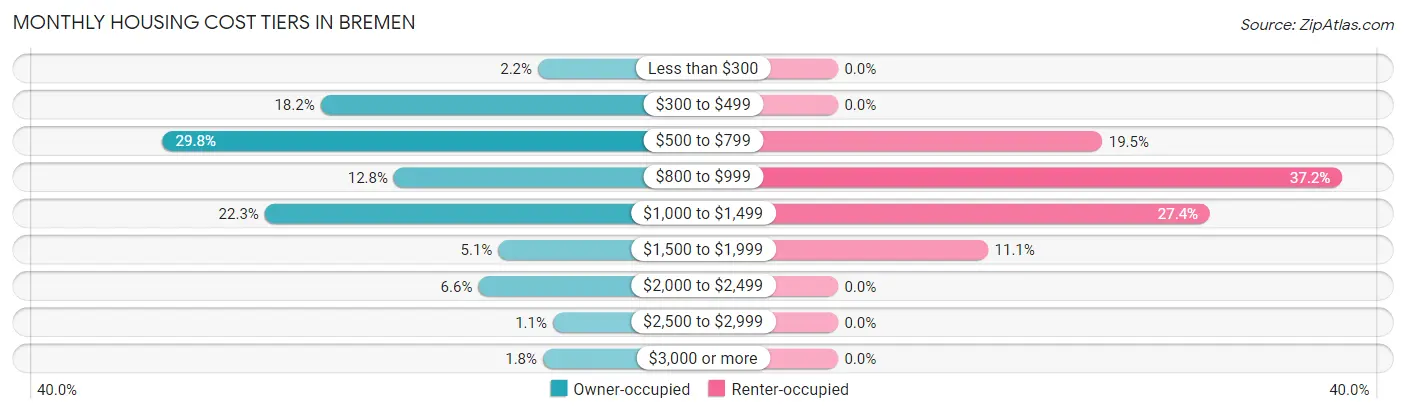
| Monthly Cost | Owner-occupied | Renter-occupied |
| Less than $300 | 24 (2.2%) | 0 (0.0%) |
| $300 to $499 | 199 (18.2%) | 0 (0.0%) |
| $500 to $799 | 326 (29.8%) | 132 (19.5%) |
| $800 to $999 | 140 (12.8%) | 252 (37.2%) |
| $1,000 to $1,499 | 244 (22.3%) | 186 (27.4%) |
| $1,500 to $1,999 | 56 (5.1%) | 75 (11.1%) |
| $2,000 to $2,499 | 72 (6.6%) | 0 (0.0%) |
| $2,500 to $2,999 | 12 (1.1%) | 0 (0.0%) |
| $3,000 or more | 20 (1.8%) | 0 (0.0%) |
| Total | 1,093 (100.0%) | 678 (100.0%) |
Physical Housing Characteristics in Bremen
Housing Structures in Bremen
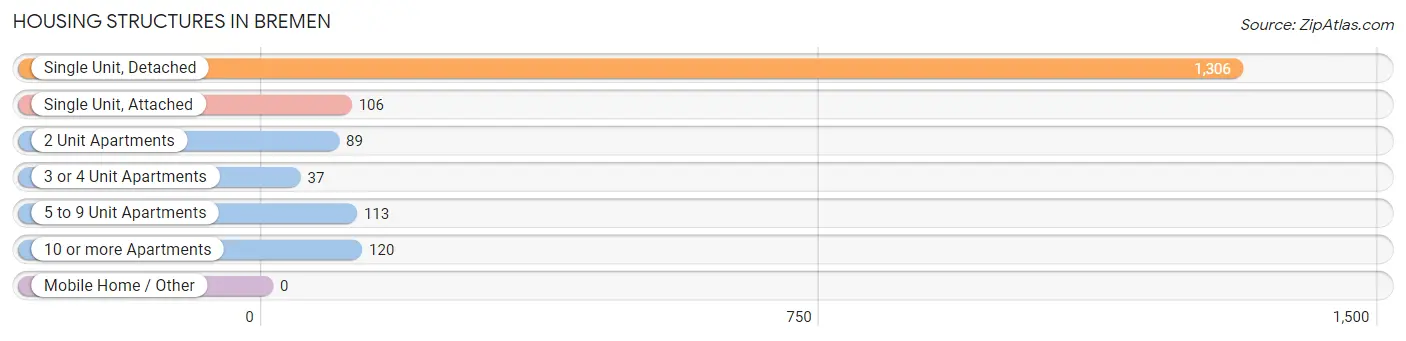
| Structure Type | # Housing Units | % Housing Units |
| Single Unit, Detached | 1,306 | 73.7% |
| Single Unit, Attached | 106 | 6.0% |
| 2 Unit Apartments | 89 | 5.0% |
| 3 or 4 Unit Apartments | 37 | 2.1% |
| 5 to 9 Unit Apartments | 113 | 6.4% |
| 10 or more Apartments | 120 | 6.8% |
| Mobile Home / Other | 0 | 0.0% |
| Total | 1,771 | 100.0% |
Housing Structures by Occupancy in Bremen
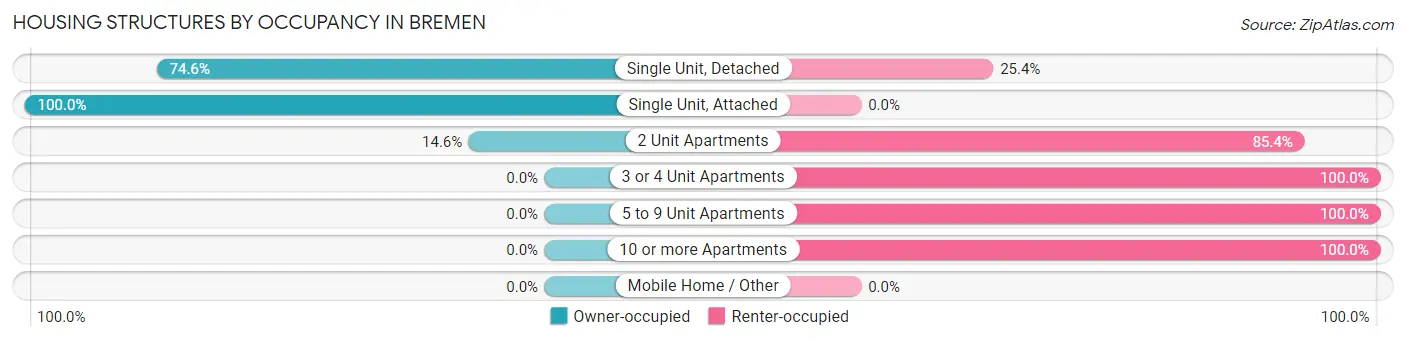
| Structure Type | Owner-occupied | Renter-occupied |
| Single Unit, Detached | 974 (74.6%) | 332 (25.4%) |
| Single Unit, Attached | 106 (100.0%) | 0 (0.0%) |
| 2 Unit Apartments | 13 (14.6%) | 76 (85.4%) |
| 3 or 4 Unit Apartments | 0 (0.0%) | 37 (100.0%) |
| 5 to 9 Unit Apartments | 0 (0.0%) | 113 (100.0%) |
| 10 or more Apartments | 0 (0.0%) | 120 (100.0%) |
| Mobile Home / Other | 0 (0.0%) | 0 (0.0%) |
| Total | 1,093 (61.7%) | 678 (38.3%) |
Housing Structures by Number of Rooms in Bremen
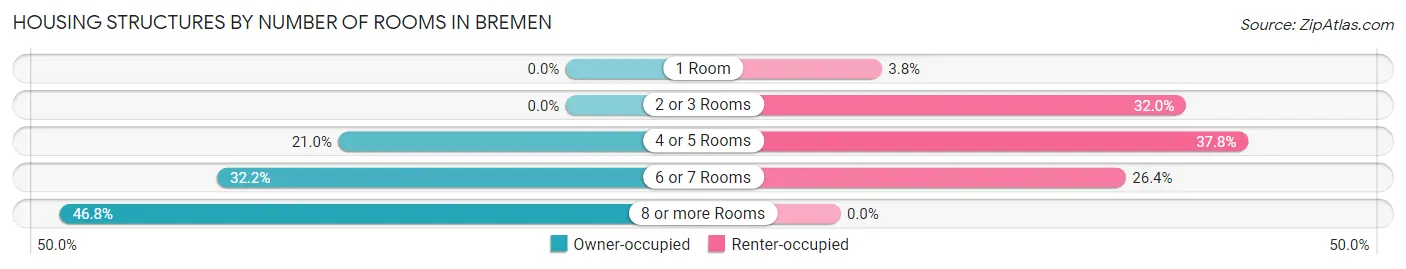
| Number of Rooms | Owner-occupied | Renter-occupied |
| 1 Room | 0 (0.0%) | 26 (3.8%) |
| 2 or 3 Rooms | 0 (0.0%) | 217 (32.0%) |
| 4 or 5 Rooms | 230 (21.0%) | 256 (37.8%) |
| 6 or 7 Rooms | 352 (32.2%) | 179 (26.4%) |
| 8 or more Rooms | 511 (46.8%) | 0 (0.0%) |
| Total | 1,093 (100.0%) | 678 (100.0%) |
Housing Structure by Heating Type in Bremen
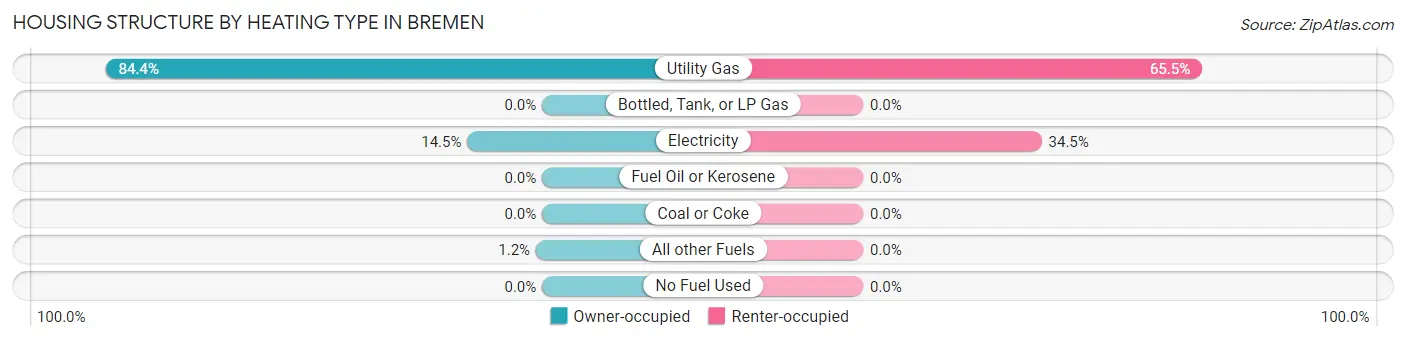
| Heating Type | Owner-occupied | Renter-occupied |
| Utility Gas | 922 (84.4%) | 444 (65.5%) |
| Bottled, Tank, or LP Gas | 0 (0.0%) | 0 (0.0%) |
| Electricity | 158 (14.5%) | 234 (34.5%) |
| Fuel Oil or Kerosene | 0 (0.0%) | 0 (0.0%) |
| Coal or Coke | 0 (0.0%) | 0 (0.0%) |
| All other Fuels | 13 (1.2%) | 0 (0.0%) |
| No Fuel Used | 0 (0.0%) | 0 (0.0%) |
| Total | 1,093 (100.0%) | 678 (100.0%) |
Household Vehicle Usage in Bremen
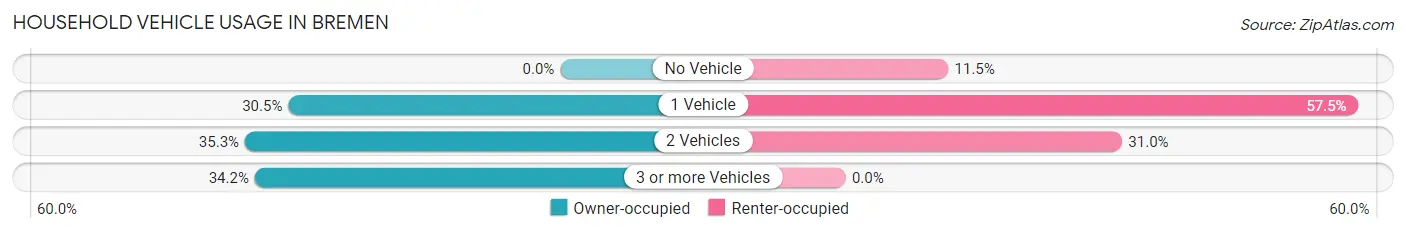
| Vehicles per Household | Owner-occupied | Renter-occupied |
| No Vehicle | 0 (0.0%) | 78 (11.5%) |
| 1 Vehicle | 333 (30.5%) | 390 (57.5%) |
| 2 Vehicles | 386 (35.3%) | 210 (31.0%) |
| 3 or more Vehicles | 374 (34.2%) | 0 (0.0%) |
| Total | 1,093 (100.0%) | 678 (100.0%) |
Real Estate & Mortgages in Bremen
Real Estate and Mortgage Overview in Bremen
| Characteristic | Without Mortgage | With Mortgage |
| Housing Units | 447 | 646 |
| Median Property Value | $178,900 | $166,800 |
| Median Household Income | $63,393 | $94 |
| Monthly Housing Costs | $500 | $20 |
| Real Estate Taxes | $1,636 | $20 |
Property Value by Mortgage Status in Bremen
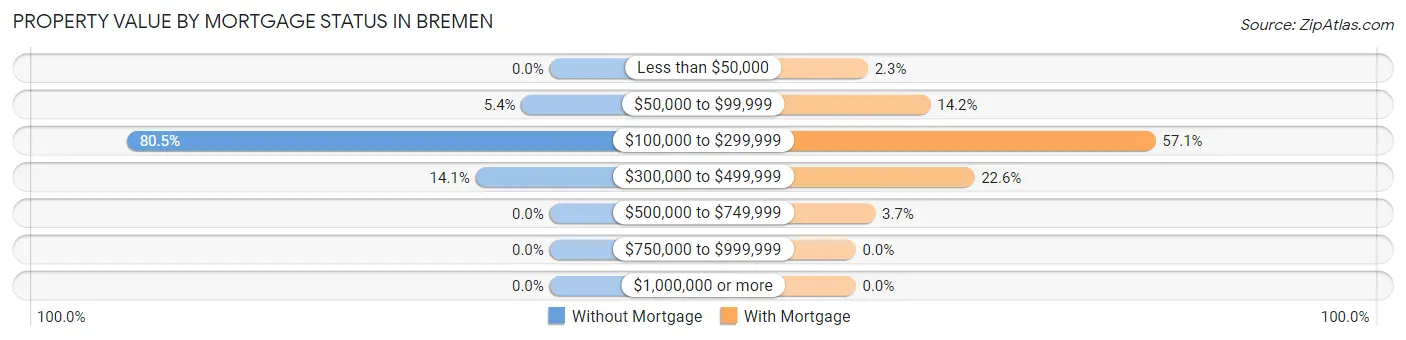
| Property Value | Without Mortgage | With Mortgage |
| Less than $50,000 | 0 (0.0%) | 15 (2.3%) |
| $50,000 to $99,999 | 24 (5.4%) | 92 (14.2%) |
| $100,000 to $299,999 | 360 (80.5%) | 369 (57.1%) |
| $300,000 to $499,999 | 63 (14.1%) | 146 (22.6%) |
| $500,000 to $749,999 | 0 (0.0%) | 24 (3.7%) |
| $750,000 to $999,999 | 0 (0.0%) | 0 (0.0%) |
| $1,000,000 or more | 0 (0.0%) | 0 (0.0%) |
| Total | 447 (100.0%) | 646 (100.0%) |
Household Income by Mortgage Status in Bremen
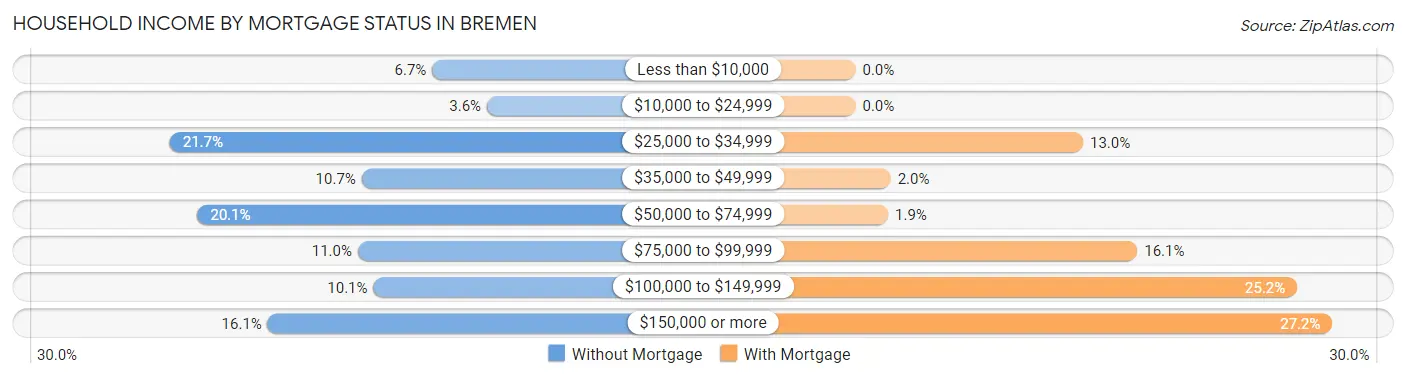
| Household Income | Without Mortgage | With Mortgage |
| Less than $10,000 | 30 (6.7%) | 0 (0.0%) |
| $10,000 to $24,999 | 16 (3.6%) | 0 (0.0%) |
| $25,000 to $34,999 | 97 (21.7%) | 84 (13.0%) |
| $35,000 to $49,999 | 48 (10.7%) | 13 (2.0%) |
| $50,000 to $74,999 | 90 (20.1%) | 12 (1.9%) |
| $75,000 to $99,999 | 49 (11.0%) | 104 (16.1%) |
| $100,000 to $149,999 | 45 (10.1%) | 163 (25.2%) |
| $150,000 or more | 72 (16.1%) | 176 (27.2%) |
| Total | 447 (100.0%) | 646 (100.0%) |
Property Value to Household Income Ratio in Bremen
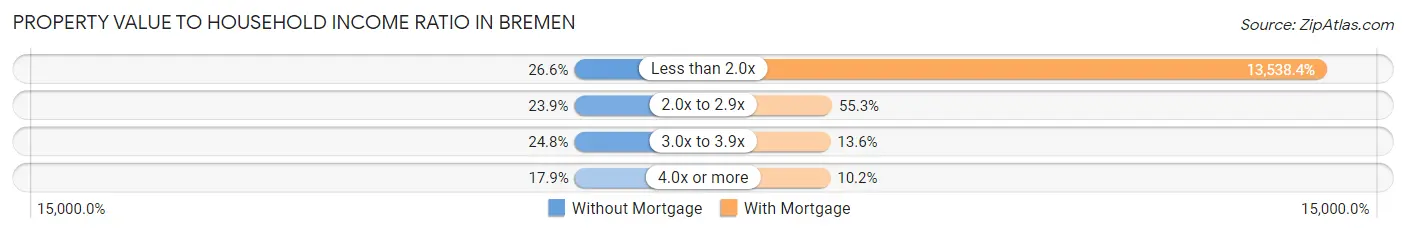
| Value-to-Income Ratio | Without Mortgage | With Mortgage |
| Less than 2.0x | 119 (26.6%) | 87,458 (13,538.4%) |
| 2.0x to 2.9x | 107 (23.9%) | 357 (55.3%) |
| 3.0x to 3.9x | 111 (24.8%) | 88 (13.6%) |
| 4.0x or more | 80 (17.9%) | 66 (10.2%) |
| Total | 447 (100.0%) | 646 (100.0%) |
Real Estate Taxes by Mortgage Status in Bremen
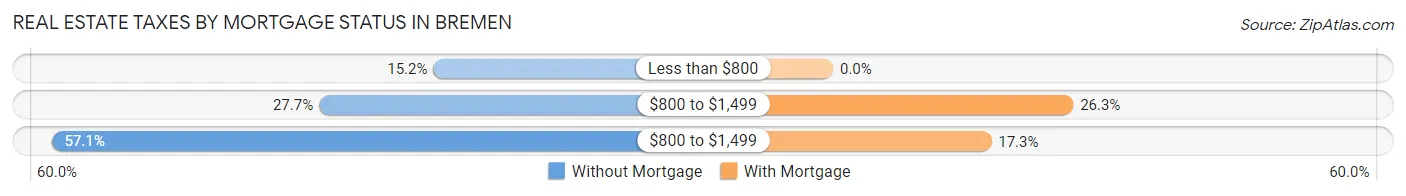
| Property Taxes | Without Mortgage | With Mortgage |
| Less than $800 | 68 (15.2%) | 0 (0.0%) |
| $800 to $1,499 | 124 (27.7%) | 170 (26.3%) |
| $800 to $1,499 | 255 (57.1%) | 112 (17.3%) |
| Total | 447 (100.0%) | 646 (100.0%) |
Health & Disability in Bremen
Health Insurance Coverage by Age in Bremen
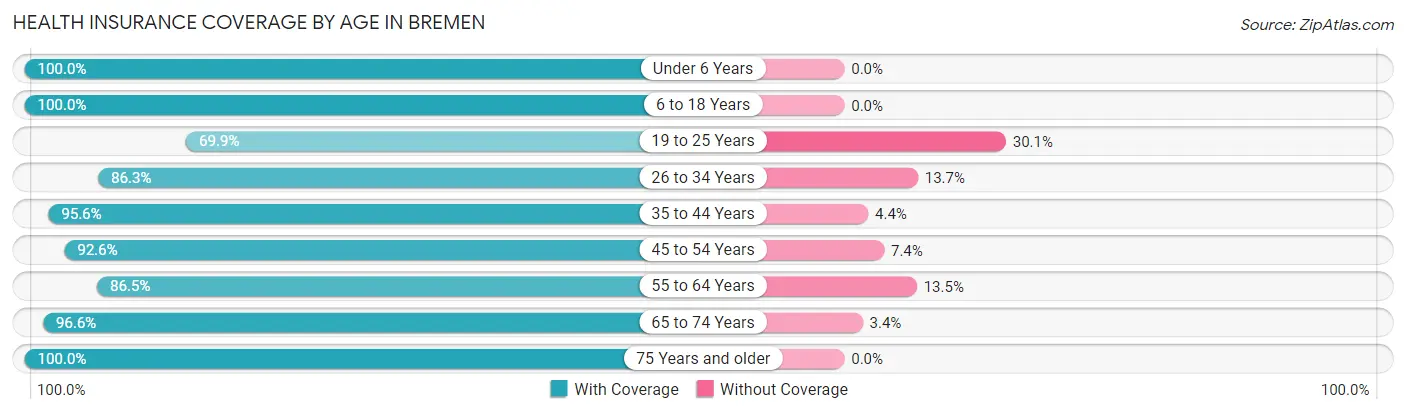
| Age Bracket | With Coverage | Without Coverage |
| Under 6 Years | 207 (100.0%) | 0 (0.0%) |
| 6 to 18 Years | 1,133 (100.0%) | 0 (0.0%) |
| 19 to 25 Years | 246 (69.9%) | 106 (30.1%) |
| 26 to 34 Years | 441 (86.3%) | 70 (13.7%) |
| 35 to 44 Years | 603 (95.6%) | 28 (4.4%) |
| 45 to 54 Years | 375 (92.6%) | 30 (7.4%) |
| 55 to 64 Years | 525 (86.5%) | 82 (13.5%) |
| 65 to 74 Years | 452 (96.6%) | 16 (3.4%) |
| 75 Years and older | 296 (100.0%) | 0 (0.0%) |
| Total | 4,278 (92.8%) | 332 (7.2%) |
Health Insurance Coverage by Citizenship Status in Bremen
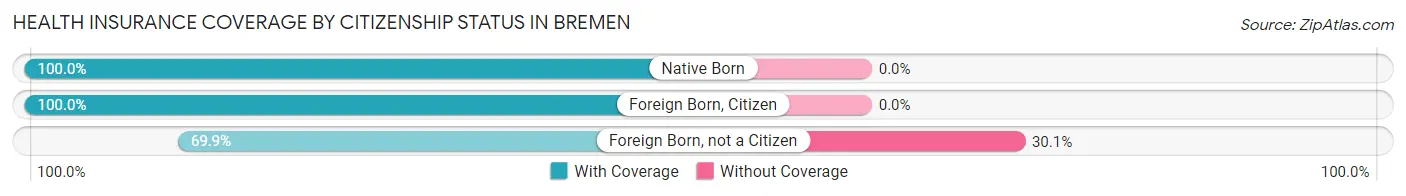
| Citizenship Status | With Coverage | Without Coverage |
| Native Born | 207 (100.0%) | 0 (0.0%) |
| Foreign Born, Citizen | 1,133 (100.0%) | 0 (0.0%) |
| Foreign Born, not a Citizen | 246 (69.9%) | 106 (30.1%) |
Health Insurance Coverage by Household Income in Bremen
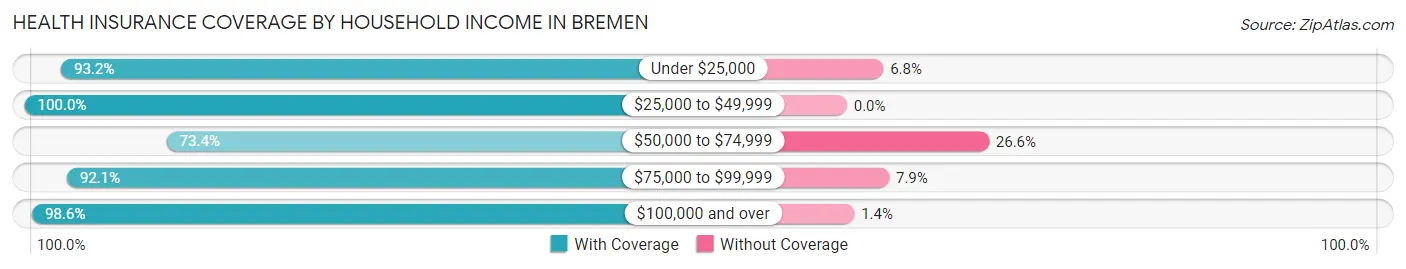
| Household Income | With Coverage | Without Coverage |
| Under $25,000 | 777 (93.2%) | 57 (6.8%) |
| $25,000 to $49,999 | 748 (100.0%) | 0 (0.0%) |
| $50,000 to $74,999 | 521 (73.4%) | 189 (26.6%) |
| $75,000 to $99,999 | 547 (92.1%) | 47 (7.9%) |
| $100,000 and over | 1,627 (98.6%) | 23 (1.4%) |
Public vs Private Health Insurance Coverage by Age in Bremen
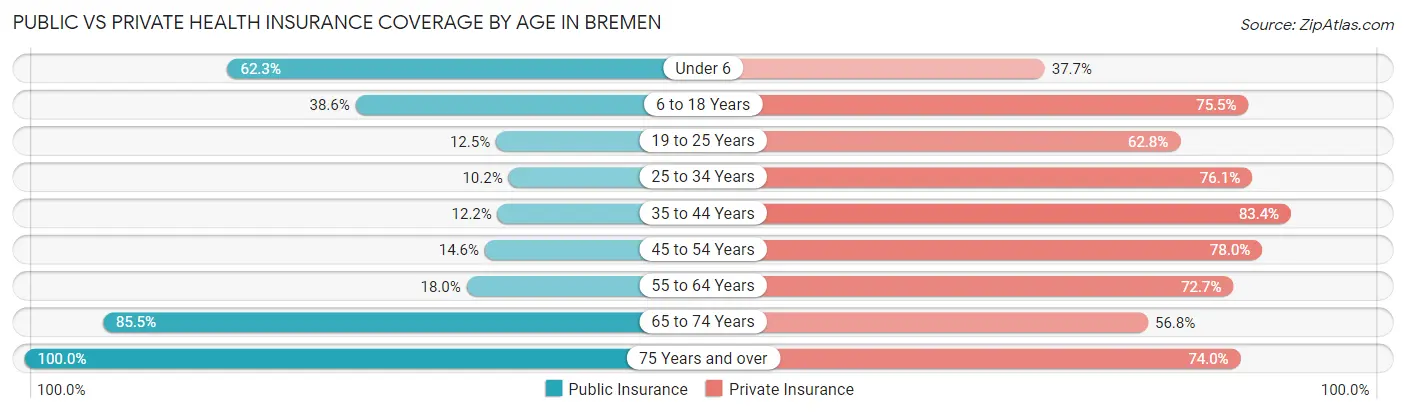
| Age Bracket | Public Insurance | Private Insurance |
| Under 6 | 129 (62.3%) | 78 (37.7%) |
| 6 to 18 Years | 437 (38.6%) | 855 (75.5%) |
| 19 to 25 Years | 44 (12.5%) | 221 (62.8%) |
| 25 to 34 Years | 52 (10.2%) | 389 (76.1%) |
| 35 to 44 Years | 77 (12.2%) | 526 (83.4%) |
| 45 to 54 Years | 59 (14.6%) | 316 (78.0%) |
| 55 to 64 Years | 109 (18.0%) | 441 (72.7%) |
| 65 to 74 Years | 400 (85.5%) | 266 (56.8%) |
| 75 Years and over | 296 (100.0%) | 219 (74.0%) |
| Total | 1,603 (34.8%) | 3,311 (71.8%) |
Disability Status by Sex by Age in Bremen
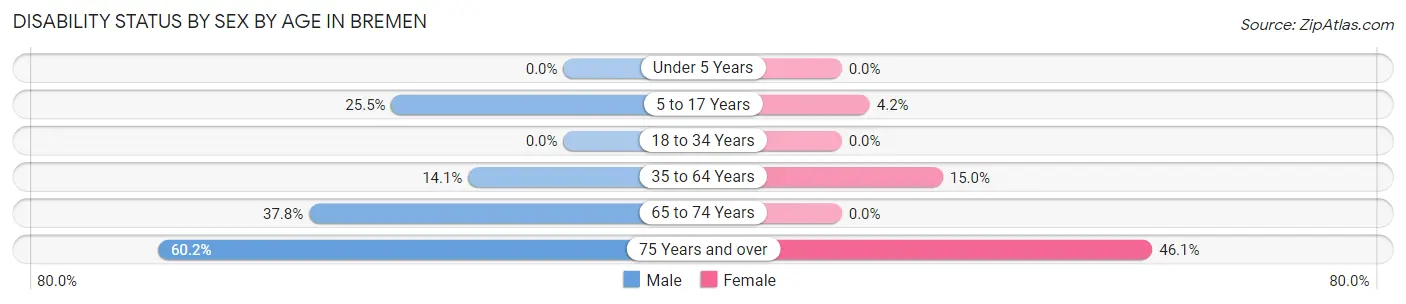
| Age Bracket | Male | Female |
| Under 5 Years | 0 (0.0%) | 0 (0.0%) |
| 5 to 17 Years | 109 (25.5%) | 22 (4.2%) |
| 18 to 34 Years | 0 (0.0%) | 0 (0.0%) |
| 35 to 64 Years | 105 (14.1%) | 135 (15.0%) |
| 65 to 74 Years | 91 (37.8%) | 0 (0.0%) |
| 75 Years and over | 62 (60.2%) | 89 (46.1%) |
Disability Class by Sex by Age in Bremen
Disability Class: Hearing Difficulty
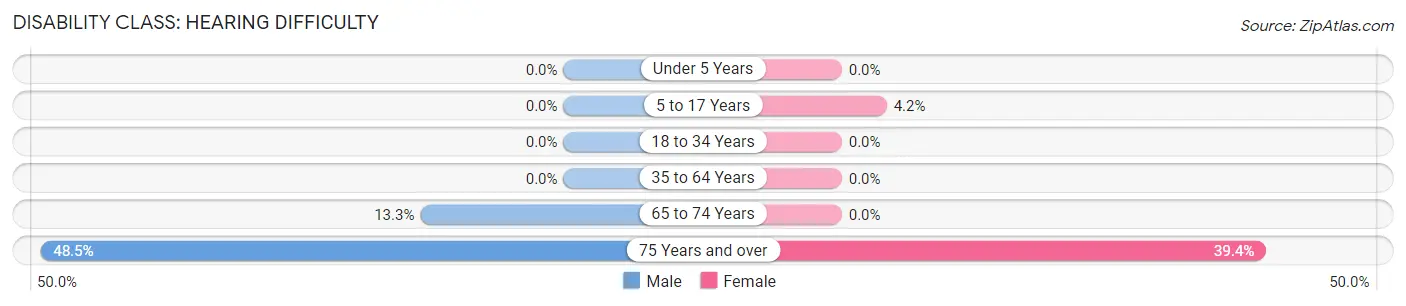
| Age Bracket | Male | Female |
| Under 5 Years | 0 (0.0%) | 0 (0.0%) |
| 5 to 17 Years | 0 (0.0%) | 22 (4.2%) |
| 18 to 34 Years | 0 (0.0%) | 0 (0.0%) |
| 35 to 64 Years | 0 (0.0%) | 0 (0.0%) |
| 65 to 74 Years | 32 (13.3%) | 0 (0.0%) |
| 75 Years and over | 50 (48.5%) | 76 (39.4%) |
Disability Class: Vision Difficulty
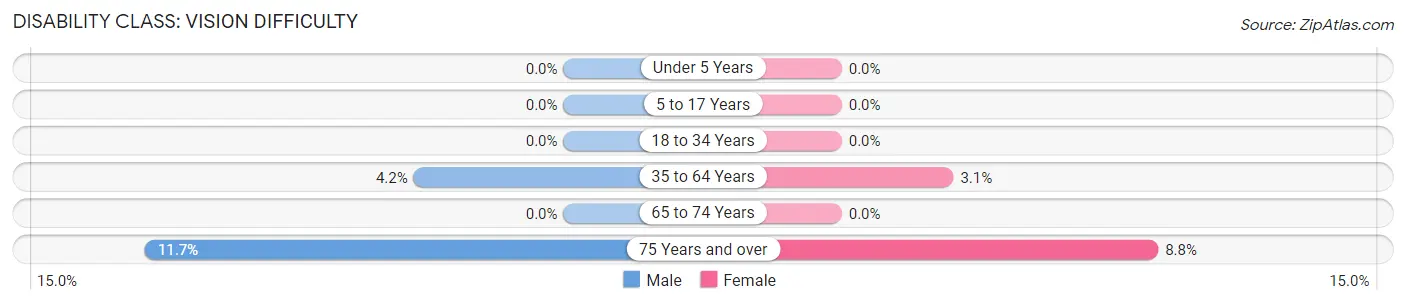
| Age Bracket | Male | Female |
| Under 5 Years | 0 (0.0%) | 0 (0.0%) |
| 5 to 17 Years | 0 (0.0%) | 0 (0.0%) |
| 18 to 34 Years | 0 (0.0%) | 0 (0.0%) |
| 35 to 64 Years | 31 (4.2%) | 28 (3.1%) |
| 65 to 74 Years | 0 (0.0%) | 0 (0.0%) |
| 75 Years and over | 12 (11.7%) | 17 (8.8%) |
Disability Class: Cognitive Difficulty
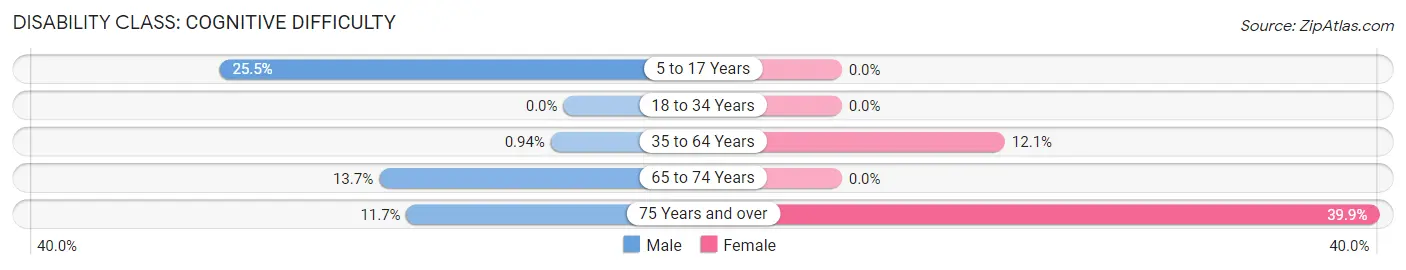
| Age Bracket | Male | Female |
| 5 to 17 Years | 109 (25.5%) | 0 (0.0%) |
| 18 to 34 Years | 0 (0.0%) | 0 (0.0%) |
| 35 to 64 Years | 7 (0.9%) | 109 (12.1%) |
| 65 to 74 Years | 33 (13.7%) | 0 (0.0%) |
| 75 Years and over | 12 (11.7%) | 77 (39.9%) |
Disability Class: Ambulatory Difficulty
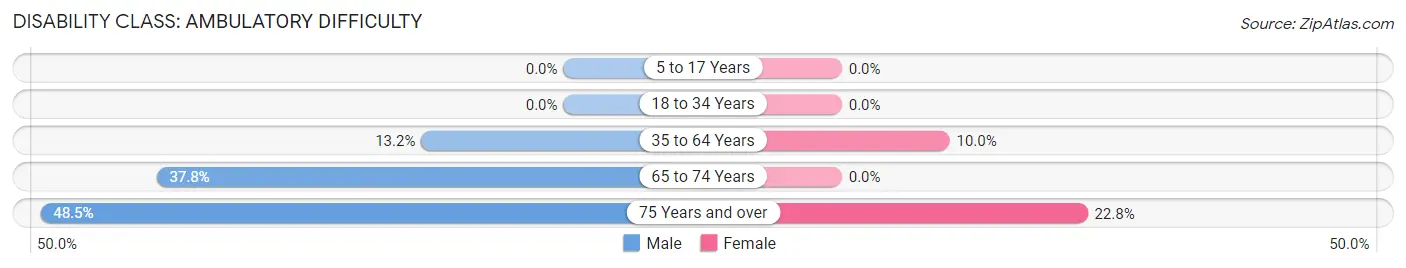
| Age Bracket | Male | Female |
| 5 to 17 Years | 0 (0.0%) | 0 (0.0%) |
| 18 to 34 Years | 0 (0.0%) | 0 (0.0%) |
| 35 to 64 Years | 98 (13.2%) | 90 (10.0%) |
| 65 to 74 Years | 91 (37.8%) | 0 (0.0%) |
| 75 Years and over | 50 (48.5%) | 44 (22.8%) |
Disability Class: Self-Care Difficulty
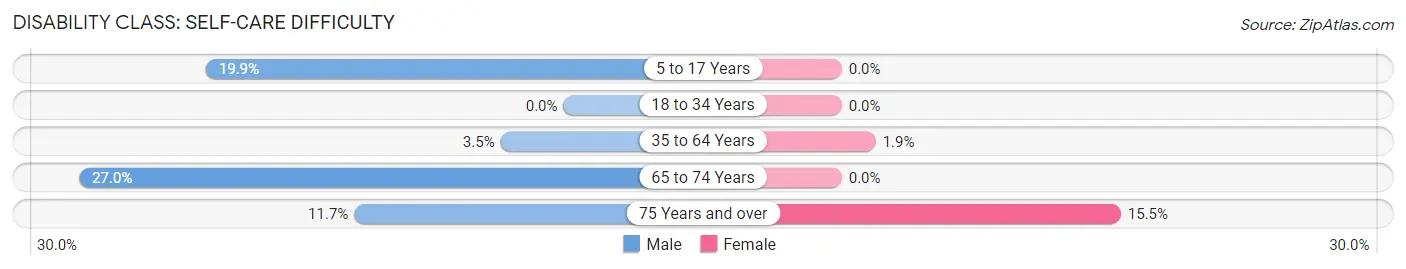
| Age Bracket | Male | Female |
| 5 to 17 Years | 85 (19.9%) | 0 (0.0%) |
| 18 to 34 Years | 0 (0.0%) | 0 (0.0%) |
| 35 to 64 Years | 26 (3.5%) | 17 (1.9%) |
| 65 to 74 Years | 65 (27.0%) | 0 (0.0%) |
| 75 Years and over | 12 (11.7%) | 30 (15.5%) |
Technology Access in Bremen
Computing Device Access in Bremen
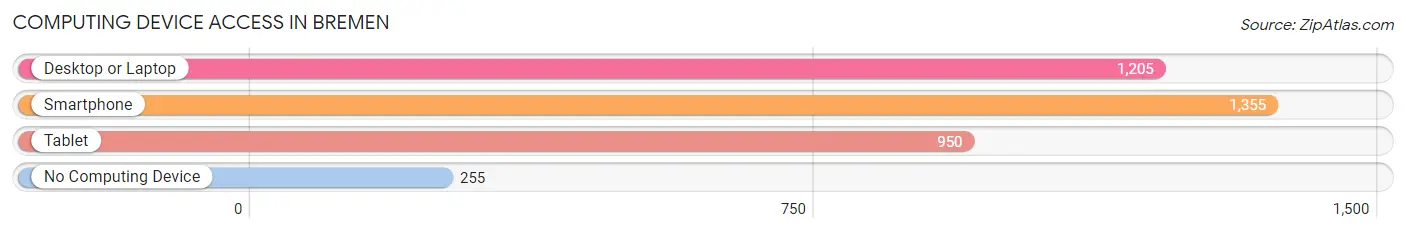
| Device Type | # Households | % Households |
| Desktop or Laptop | 1,205 | 68.0% |
| Smartphone | 1,355 | 76.5% |
| Tablet | 950 | 53.6% |
| No Computing Device | 255 | 14.4% |
| Total | 1,771 | 100.0% |
Internet Access in Bremen
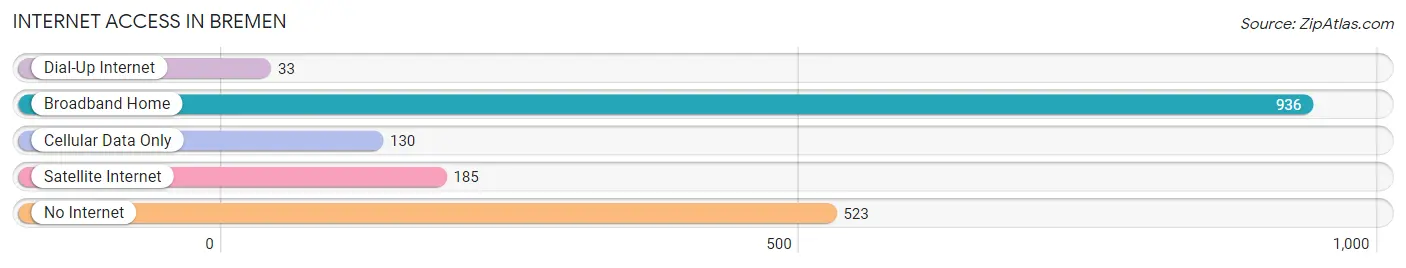
| Internet Type | # Households | % Households |
| Dial-Up Internet | 33 | 1.9% |
| Broadband Home | 936 | 52.8% |
| Cellular Data Only | 130 | 7.3% |
| Satellite Internet | 185 | 10.4% |
| No Internet | 523 | 29.5% |
| Total | 1,771 | 100.0% |
Bremen Summary
Bremen is a small town located in Marshall County, Indiana, United States. It is situated in the northern part of the state, about 25 miles south of South Bend and about 50 miles east of Chicago. The population of Bremen was estimated to be 3,717 in 2019.
Geography
Bremen is located at 41°14'N 86°14'W (41.23, -86.23). It is situated in the northern part of Indiana, about 25 miles south of South Bend and about 50 miles east of Chicago. The town is located in the Tippecanoe River Valley, which is part of the Kankakee River watershed. The town is surrounded by farmland and is bordered by the towns of Bourbon, La Paz, and Lakeville.
History
Bremen was founded in 1851 by German immigrants who named the town after the city of Bremen in Germany. The town was originally a farming community, but it soon developed into a manufacturing center. The first industry in Bremen was a sawmill, which was built in 1853. Other industries soon followed, including a flour mill, a woolen mill, a furniture factory, and a brickyard.
The town was incorporated in 1871 and the first mayor was elected in 1872. The town continued to grow and by the early 1900s, it had become a major industrial center. The town was home to several factories, including the Bremen Foundry and Machine Company, the Bremen Manufacturing Company, and the Bremen Automobile Company.
Economy
Bremen’s economy is largely based on manufacturing. The town is home to several factories, including the Bremen Foundry and Machine Company, the Bremen Manufacturing Company, and the Bremen Automobile Company. The town is also home to several small businesses, including restaurants, retail stores, and service providers.
Demographics
As of the 2019 census, the population of Bremen was estimated to be 3,717. The racial makeup of the town was 94.3% White, 1.2% African American, 0.3% Native American, 0.7% Asian, 0.1% Pacific Islander, 1.7% from other races, and 1.9% from two or more races. Hispanic or Latino of any race were 4.2% of the population.
The median household income in Bremen was $45,945 in 2019. The median age of the town was 40.7 years. The town had a poverty rate of 11.3%.
Conclusion
Bremen is a small town located in Marshall County, Indiana, United States. It is situated in the northern part of the state, about 25 miles south of South Bend and about 50 miles east of Chicago. The population of Bremen was estimated to be 3,717 in 2019. The town’s economy is largely based on manufacturing and it is home to several factories and small businesses. The racial makeup of the town was 94.3% White, 1.2% African American, 0.3% Native American, 0.7% Asian, 0.1% Pacific Islander, 1.7% from other races, and 1.9% from two or more races. The median household income in Bremen was $45,945 in 2019.
Common Questions
What is Per Capita Income in Bremen?
Per Capita income in Bremen is $28,211.
What is the Median Family Income in Bremen?
Median Family Income in Bremen is $87,739.
What is the Median Household income in Bremen?
Median Household Income in Bremen is $63,179.
What is Income or Wage Gap in Bremen?
Income or Wage Gap in Bremen is 6.7%.
Women in Bremen earn 93.3 cents for every dollar earned by a man.
What is Inequality or Gini Index in Bremen?
Inequality or Gini Index in Bremen is 0.39.
What is the Total Population of Bremen?
Total Population of Bremen is 4,667.
What is the Total Male Population of Bremen?
Total Male Population of Bremen is 2,253.
What is the Total Female Population of Bremen?
Total Female Population of Bremen is 2,414.
What is the Ratio of Males per 100 Females in Bremen?
There are 93.33 Males per 100 Females in Bremen.
What is the Ratio of Females per 100 Males in Bremen?
There are 107.15 Females per 100 Males in Bremen.
What is the Median Population Age in Bremen?
Median Population Age in Bremen is 38.0 Years.
What is the Average Family Size in Bremen
Average Family Size in Bremen is 3.5 People.
What is the Average Household Size in Bremen
Average Household Size in Bremen is 2.6 People.
How Large is the Labor Force in Bremen?
There are 2,235 People in the Labor Forcein in Bremen.
What is the Percentage of People in the Labor Force in Bremen?
62.5% of People are in the Labor Force in Bremen.