Brazil, IN Map & Demographics
Brazil Map
Brazil Overview
$27,358
PER CAPITA INCOME
$61,361
AVG FAMILY INCOME
$50,153
AVG HOUSEHOLD INCOME
43.5%
WAGE / INCOME GAP [ % ]
56.5¢/ $1
WAGE / INCOME GAP [ $ ]
$11,745
FAMILY INCOME DEFICIT
0.43
INEQUALITY / GINI INDEX
8,114
TOTAL POPULATION
3,911
MALE POPULATION
4,203
FEMALE POPULATION
93.05
MALES / 100 FEMALES
107.47
FEMALES / 100 MALES
40.2
MEDIAN AGE
2.8
AVG FAMILY SIZE
2.3
AVG HOUSEHOLD SIZE
3,277
LABOR FORCE [ PEOPLE ]
50.5%
PERCENT IN LABOR FORCE
6.3%
UNEMPLOYMENT RATE
Brazil Zip Codes
Brazil Area Codes
Income in Brazil
Income Overview in Brazil
Per Capita Income in Brazil is $27,358, while median incomes of families and households are $61,361 and $50,153 respectively.
| Characteristic | Number | Measure |
| Per Capita Income | 8,114 | $27,358 |
| Median Family Income | 2,185 | $61,361 |
| Mean Family Income | 2,185 | $77,650 |
| Median Household Income | 3,324 | $50,153 |
| Mean Household Income | 3,324 | $67,755 |
| Income Deficit | 2,185 | $11,745 |
| Wage / Income Gap (%) | 8,114 | 43.53% |
| Wage / Income Gap ($) | 8,114 | 56.47¢ per $1 |
| Gini / Inequality Index | 8,114 | 0.43 |
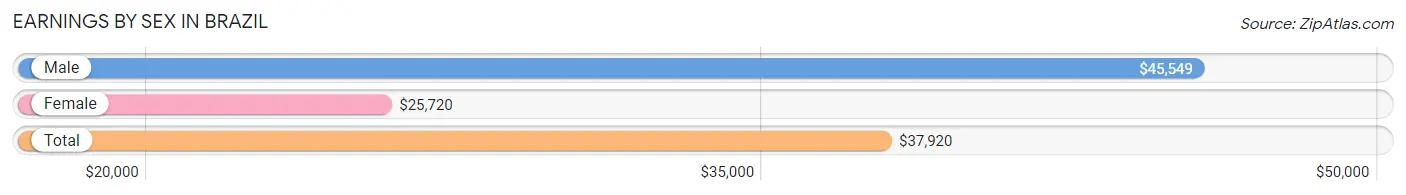
Earnings by Sex in Brazil
Average Earnings in Brazil are $37,920, $45,549 for men and $25,720 for women, a difference of 43.5%.
| Sex | Number | Average Earnings |
| Male | 2,039 (58.8%) | $45,549 |
| Female | 1,427 (41.2%) | $25,720 |
| Total | 3,466 (100.0%) | $37,920 |
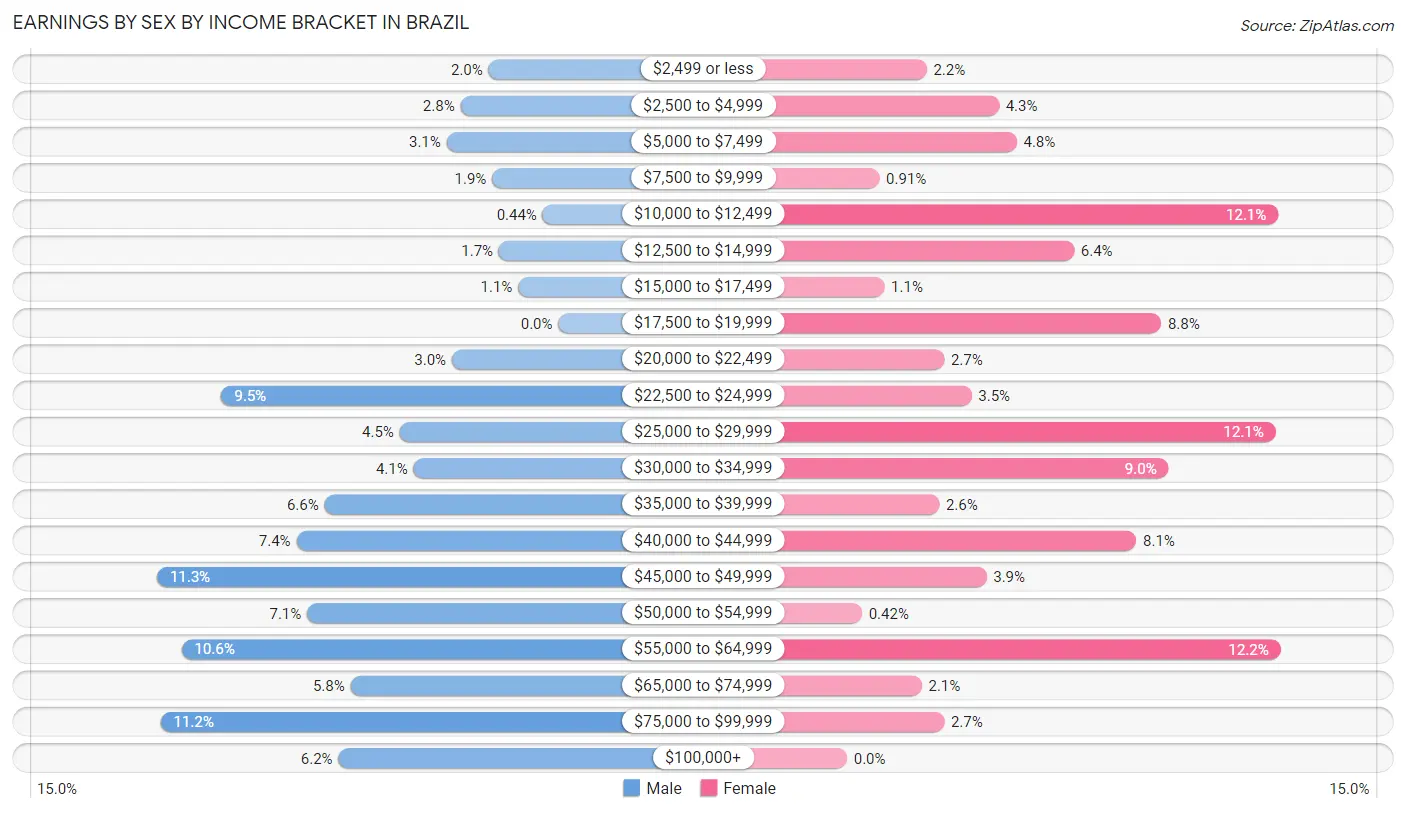
Earnings by Sex by Income Bracket in Brazil
The most common earnings brackets in Brazil are $45,000 to $49,999 for men (230 | 11.3%) and $55,000 to $64,999 for women (174 | 12.2%).
| Income | Male | Female |
| $2,499 or less | 40 (2.0%) | 32 (2.2%) |
| $2,500 to $4,999 | 56 (2.8%) | 61 (4.3%) |
| $5,000 to $7,499 | 64 (3.1%) | 68 (4.8%) |
| $7,500 to $9,999 | 38 (1.9%) | 13 (0.9%) |
| $10,000 to $12,499 | 9 (0.4%) | 173 (12.1%) |
| $12,500 to $14,999 | 34 (1.7%) | 91 (6.4%) |
| $15,000 to $17,499 | 23 (1.1%) | 15 (1.1%) |
| $17,500 to $19,999 | 0 (0.0%) | 126 (8.8%) |
| $20,000 to $22,499 | 61 (3.0%) | 39 (2.7%) |
| $22,500 to $24,999 | 193 (9.5%) | 50 (3.5%) |
| $25,000 to $29,999 | 91 (4.5%) | 172 (12.0%) |
| $30,000 to $34,999 | 83 (4.1%) | 129 (9.0%) |
| $35,000 to $39,999 | 134 (6.6%) | 37 (2.6%) |
| $40,000 to $44,999 | 150 (7.4%) | 116 (8.1%) |
| $45,000 to $49,999 | 230 (11.3%) | 56 (3.9%) |
| $50,000 to $54,999 | 144 (7.1%) | 6 (0.4%) |
| $55,000 to $64,999 | 216 (10.6%) | 174 (12.2%) |
| $65,000 to $74,999 | 119 (5.8%) | 30 (2.1%) |
| $75,000 to $99,999 | 228 (11.2%) | 39 (2.7%) |
| $100,000+ | 126 (6.2%) | 0 (0.0%) |
| Total | 2,039 (100.0%) | 1,427 (100.0%) |
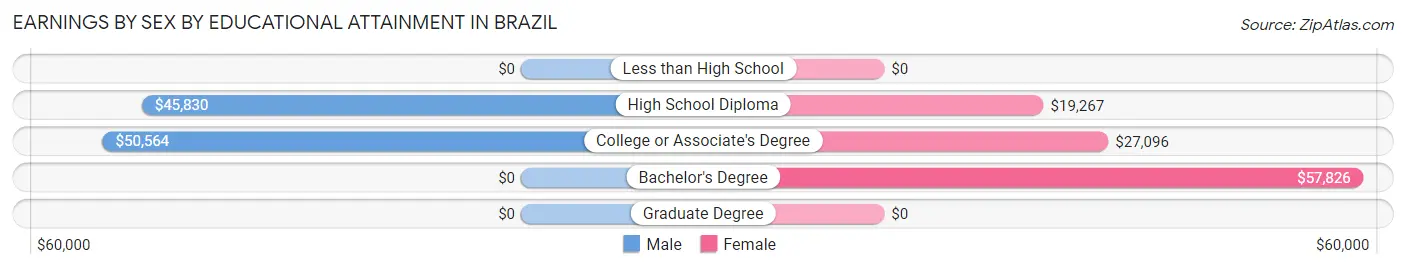
Earnings by Sex by Educational Attainment in Brazil
Average earnings in Brazil are $46,471 for men and $25,949 for women, a difference of 44.2%. Men with an educational attainment of college or associate's degree enjoy the highest average annual earnings of $50,564, while those with high school diploma education earn the least with $45,830. Women with an educational attainment of bachelor's degree earn the most with the average annual earnings of $57,826, while those with high school diploma education have the smallest earnings of $19,267.
| Educational Attainment | Male Income | Female Income |
| Less than High School | - | - |
| High School Diploma | $45,830 | $19,267 |
| College or Associate's Degree | $50,564 | $27,096 |
| Bachelor's Degree | - | - |
| Graduate Degree | - | - |
| Total | $46,471 | $25,949 |
Family Income in Brazil
Family Income Brackets in Brazil
According to the Brazil family income data, there are 457 families falling into the $35,000 to $49,999 income range, which is the most common income bracket and makes up 20.9% of all families. Conversely, the $10,000 to $14,999 income bracket is the least frequent group with only 55 families (2.5%) belonging to this category.
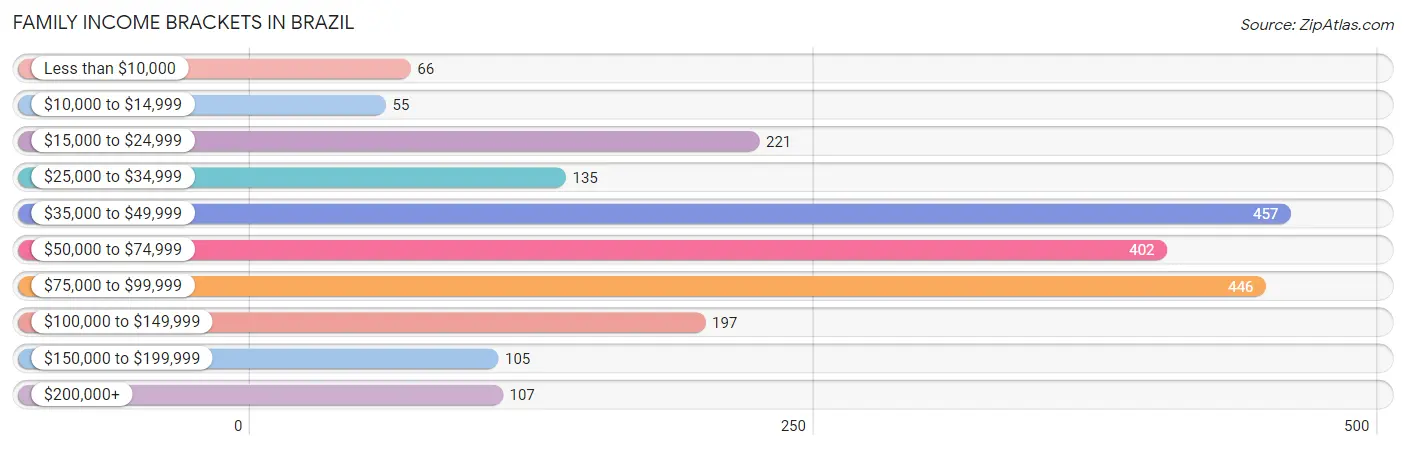
| Income Bracket | # Families | % Families |
| Less than $10,000 | 66 | 3.0% |
| $10,000 to $14,999 | 55 | 2.5% |
| $15,000 to $24,999 | 221 | 10.1% |
| $25,000 to $34,999 | 135 | 6.2% |
| $35,000 to $49,999 | 457 | 20.9% |
| $50,000 to $74,999 | 402 | 18.4% |
| $75,000 to $99,999 | 446 | 20.4% |
| $100,000 to $149,999 | 197 | 9.0% |
| $150,000 to $199,999 | 105 | 4.8% |
| $200,000+ | 107 | 4.9% |
Family Income by Famaliy Size in Brazil
4-person families (427 | 19.5%) account for the highest median family income in Brazil with $69,738 per family, while 2-person families (1,155 | 52.9%) have the highest median income of $30,586 per family member.
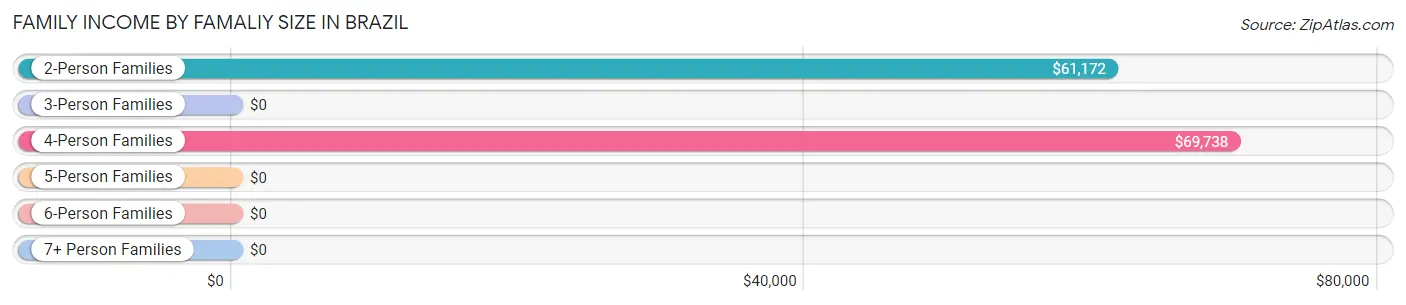
| Income Bracket | # Families | Median Income |
| 2-Person Families | 1,155 (52.9%) | $61,172 |
| 3-Person Families | 405 (18.5%) | $0 |
| 4-Person Families | 427 (19.5%) | $69,738 |
| 5-Person Families | 100 (4.6%) | $0 |
| 6-Person Families | 17 (0.8%) | $0 |
| 7+ Person Families | 81 (3.7%) | $0 |
| Total | 2,185 (100.0%) | $61,361 |
Family Income by Number of Earners in Brazil
The median family income in Brazil is $61,361, with families comprising 3+ earners (144) having the highest median family income of $116,750, while families with no earners (471) have the lowest median family income of $38,393, accounting for 6.6% and 21.6% of families, respectively.
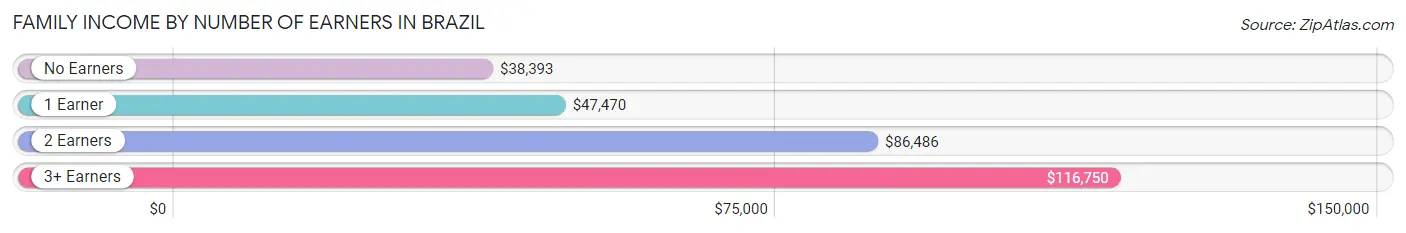
| Number of Earners | # Families | Median Income |
| No Earners | 471 (21.6%) | $38,393 |
| 1 Earner | 900 (41.2%) | $47,470 |
| 2 Earners | 670 (30.7%) | $86,486 |
| 3+ Earners | 144 (6.6%) | $116,750 |
| Total | 2,185 (100.0%) | $61,361 |
Household Income in Brazil
Household Income Brackets in Brazil
With 642 households falling in the category, the $35,000 to $49,999 income range is the most frequent in Brazil, accounting for 19.3% of all households. In contrast, only 96 households (2.9%) fall into the less than $10,000 income bracket, making it the least populous group.
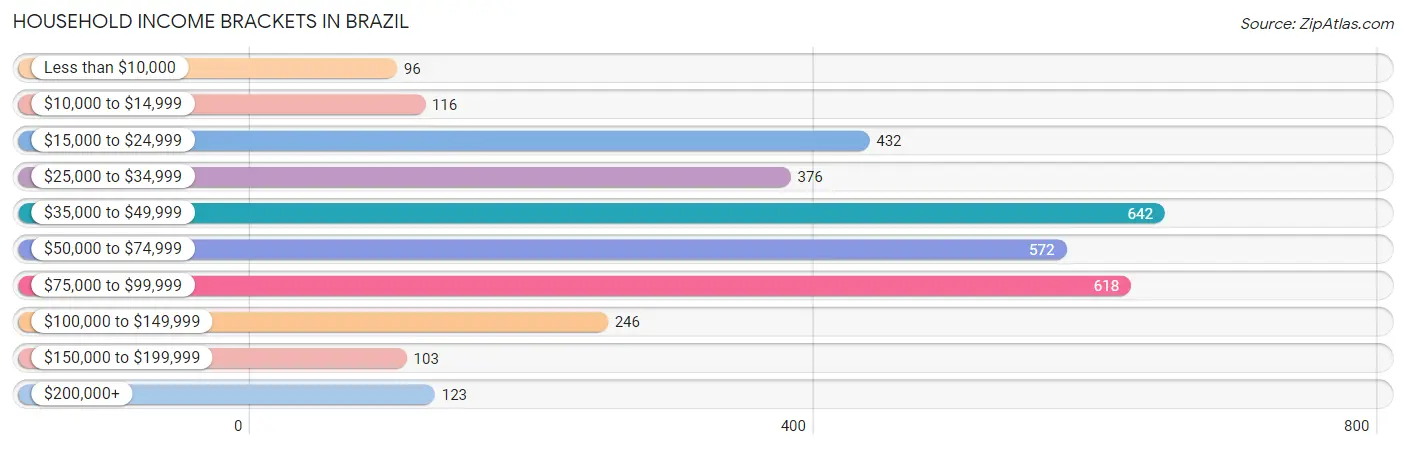
| Income Bracket | # Households | % Households |
| Less than $10,000 | 96 | 2.9% |
| $10,000 to $14,999 | 116 | 3.5% |
| $15,000 to $24,999 | 432 | 13.0% |
| $25,000 to $34,999 | 376 | 11.3% |
| $35,000 to $49,999 | 642 | 19.3% |
| $50,000 to $74,999 | 572 | 17.2% |
| $75,000 to $99,999 | 618 | 18.6% |
| $100,000 to $149,999 | 246 | 7.4% |
| $150,000 to $199,999 | 103 | 3.1% |
| $200,000+ | 123 | 3.7% |
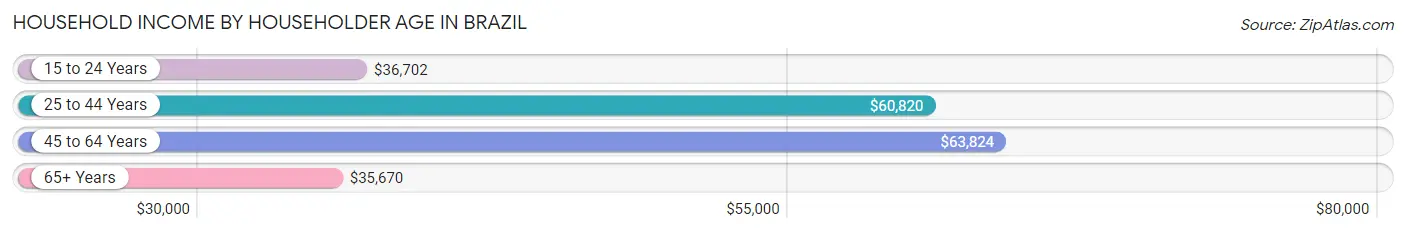
Household Income by Householder Age in Brazil
The median household income in Brazil is $50,153, with the highest median household income of $63,824 found in the 45 to 64 years age bracket for the primary householder. A total of 1,082 households (32.6%) fall into this category. Meanwhile, the 65+ years age bracket for the primary householder has the lowest median household income of $35,670, with 989 households (29.7%) in this group.
| Income Bracket | # Households | Median Income |
| 15 to 24 Years | 140 (4.2%) | $36,702 |
| 25 to 44 Years | 1,113 (33.5%) | $60,820 |
| 45 to 64 Years | 1,082 (32.6%) | $63,824 |
| 65+ Years | 989 (29.7%) | $35,670 |
| Total | 3,324 (100.0%) | $50,153 |
Poverty in Brazil
Income Below Poverty by Sex and Age in Brazil
With 12.8% poverty level for males and 17.2% for females among the residents of Brazil, 12 to 14 year old males and 16 and 17 year old females are the most vulnerable to poverty, with 73 males (52.1%) and 27 females (36.0%) in their respective age groups living below the poverty level.
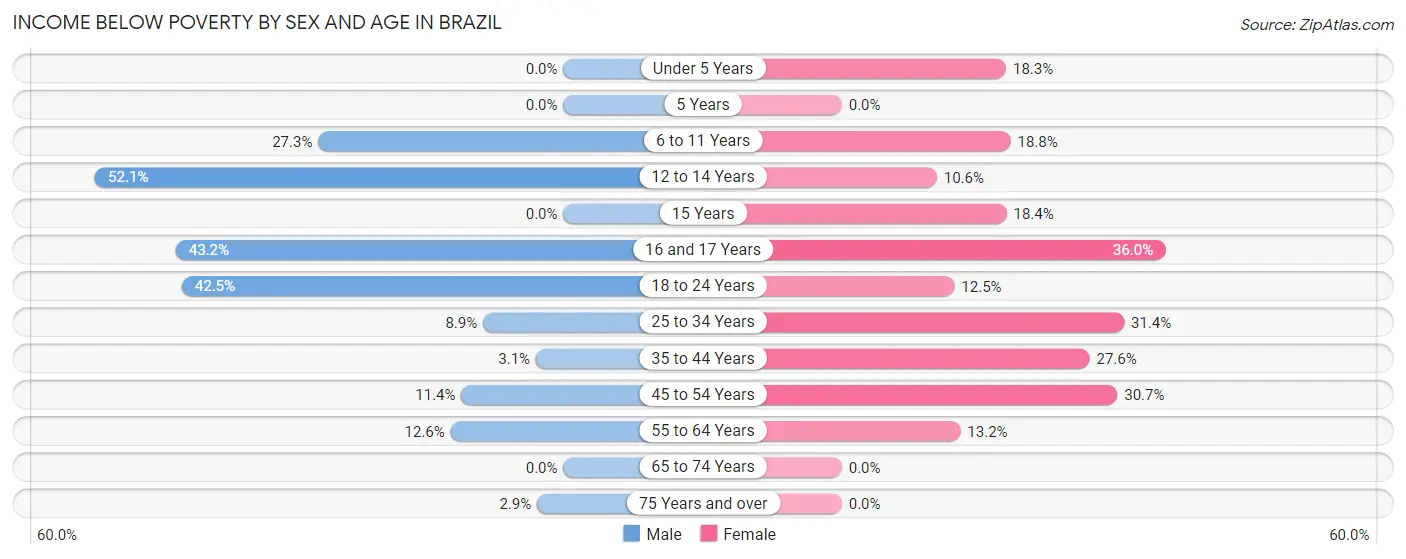
| Age Bracket | Male | Female |
| Under 5 Years | 0 (0.0%) | 64 (18.3%) |
| 5 Years | 0 (0.0%) | 0 (0.0%) |
| 6 to 11 Years | 86 (27.3%) | 59 (18.8%) |
| 12 to 14 Years | 73 (52.1%) | 20 (10.6%) |
| 15 Years | 0 (0.0%) | 20 (18.3%) |
| 16 and 17 Years | 41 (43.2%) | 27 (36.0%) |
| 18 to 24 Years | 65 (42.5%) | 36 (12.5%) |
| 25 to 34 Years | 59 (8.9%) | 183 (31.4%) |
| 35 to 44 Years | 16 (3.0%) | 96 (27.6%) |
| 45 to 54 Years | 70 (11.4%) | 131 (30.7%) |
| 55 to 64 Years | 54 (12.6%) | 72 (13.2%) |
| 65 to 74 Years | 0 (0.0%) | 0 (0.0%) |
| 75 Years and over | 6 (2.9%) | 0 (0.0%) |
| Total | 470 (12.8%) | 708 (17.2%) |
Income Above Poverty by Sex and Age in Brazil
According to the poverty statistics in Brazil, males aged under 5 years and females aged 5 years are the age groups that are most secure financially, with 100.0% of males and 100.0% of females in these age groups living above the poverty line.
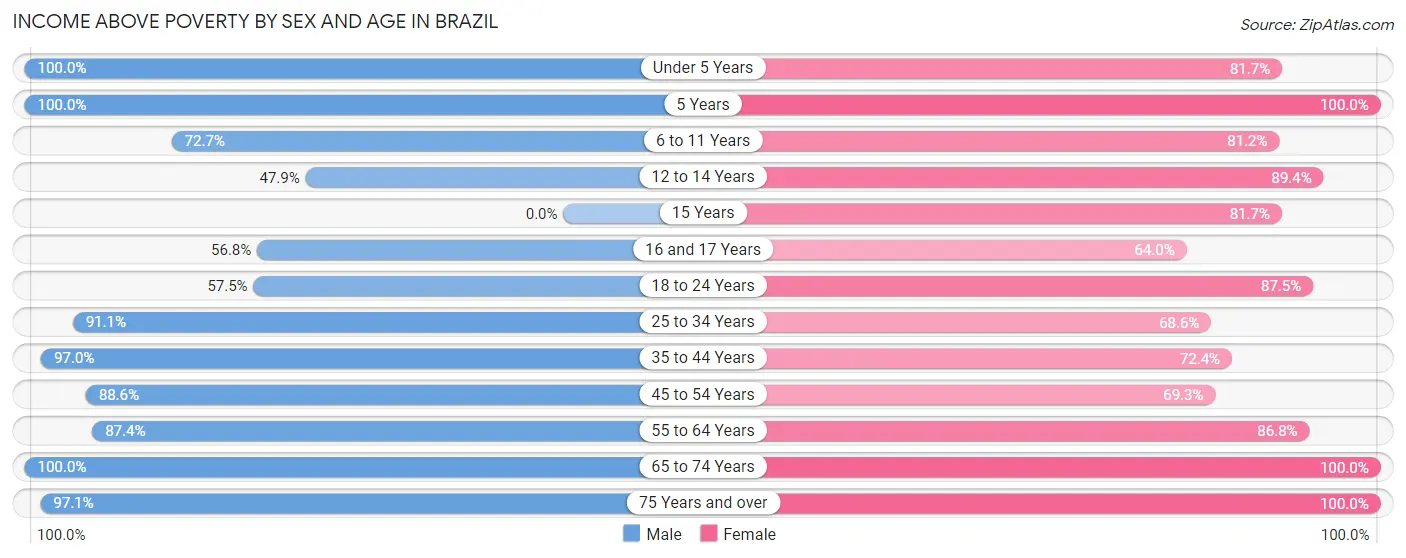
| Age Bracket | Male | Female |
| Under 5 Years | 166 (100.0%) | 286 (81.7%) |
| 5 Years | 30 (100.0%) | 12 (100.0%) |
| 6 to 11 Years | 229 (72.7%) | 255 (81.2%) |
| 12 to 14 Years | 67 (47.9%) | 169 (89.4%) |
| 15 Years | 0 (0.0%) | 89 (81.7%) |
| 16 and 17 Years | 54 (56.8%) | 48 (64.0%) |
| 18 to 24 Years | 88 (57.5%) | 251 (87.5%) |
| 25 to 34 Years | 601 (91.1%) | 399 (68.6%) |
| 35 to 44 Years | 509 (97.0%) | 252 (72.4%) |
| 45 to 54 Years | 546 (88.6%) | 296 (69.3%) |
| 55 to 64 Years | 376 (87.4%) | 473 (86.8%) |
| 65 to 74 Years | 333 (100.0%) | 393 (100.0%) |
| 75 Years and over | 199 (97.1%) | 480 (100.0%) |
| Total | 3,198 (87.2%) | 3,403 (82.8%) |
Income Below Poverty Among Married-Couple Families in Brazil
The poverty statistics for married-couple families in Brazil show that 6.2% or 74 of the total 1,187 families live below the poverty line. Families with 1 or 2 children have the highest poverty rate of 9.3%, comprising of 39 families. On the other hand, families with 3 or 4 children have the lowest poverty rate of 0.0%, which includes 0 families.
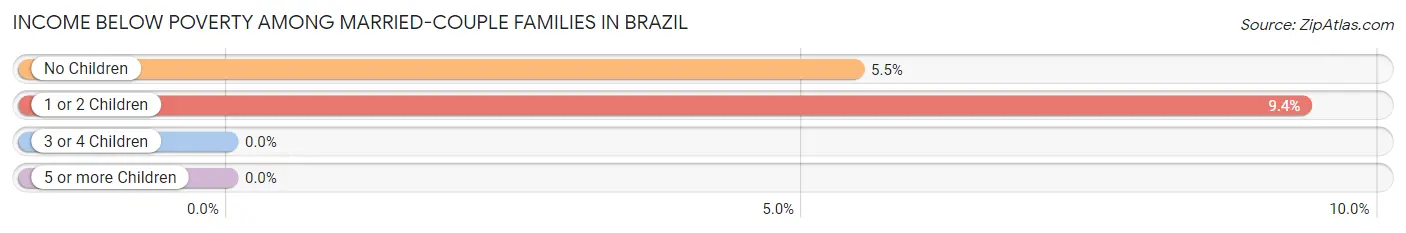
| Children | Above Poverty | Below Poverty |
| No Children | 607 (94.6%) | 35 (5.4%) |
| 1 or 2 Children | 378 (90.6%) | 39 (9.3%) |
| 3 or 4 Children | 96 (100.0%) | 0 (0.0%) |
| 5 or more Children | 32 (100.0%) | 0 (0.0%) |
| Total | 1,113 (93.8%) | 74 (6.2%) |
Income Below Poverty Among Single-Parent Households in Brazil
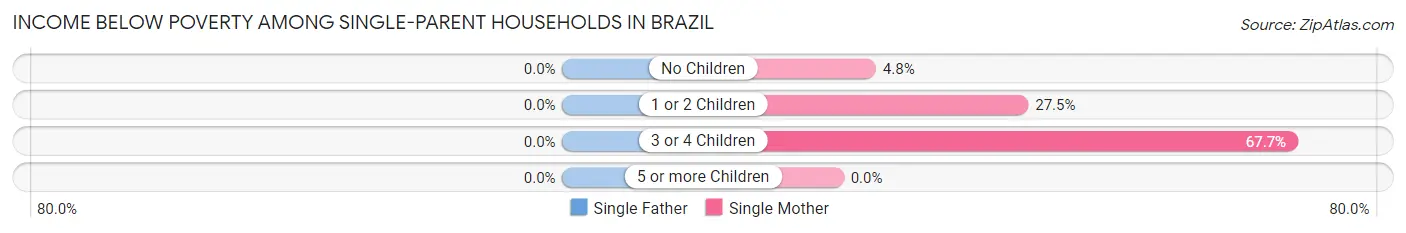
| Children | Single Father | Single Mother |
| No Children | 0 (0.0%) | 13 (4.8%) |
| 1 or 2 Children | 0 (0.0%) | 93 (27.5%) |
| 3 or 4 Children | 0 (0.0%) | 67 (67.7%) |
| 5 or more Children | 0 (0.0%) | 0 (0.0%) |
| Total | 0 (0.0%) | 173 (24.4%) |
Income Below Poverty Among Married-Couple vs Single-Parent Households in Brazil
The poverty data for Brazil shows that 74 of the married-couple family households (6.2%) and 173 of the single-parent households (17.3%) are living below the poverty level. Within the married-couple family households, those with 1 or 2 children have the highest poverty rate, with 39 households (9.3%) falling below the poverty line. Among the single-parent households, those with 3 or 4 children have the highest poverty rate, with 67 household (67.7%) living below poverty.
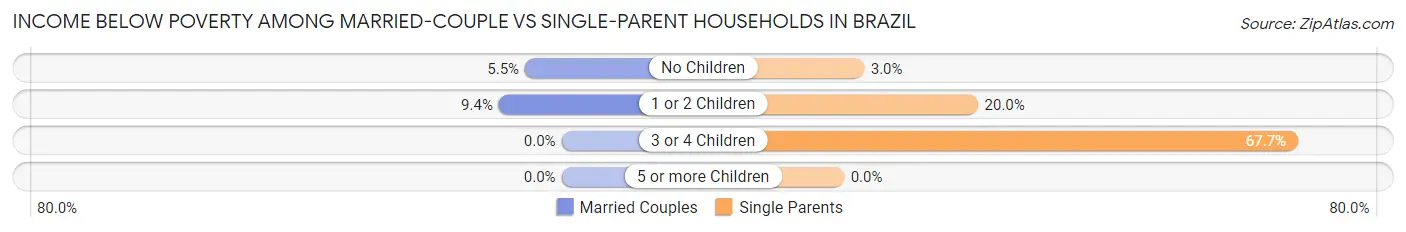
| Children | Married-Couple Families | Single-Parent Households |
| No Children | 35 (5.4%) | 13 (3.0%) |
| 1 or 2 Children | 39 (9.3%) | 93 (20.0%) |
| 3 or 4 Children | 0 (0.0%) | 67 (67.7%) |
| 5 or more Children | 0 (0.0%) | 0 (0.0%) |
| Total | 74 (6.2%) | 173 (17.3%) |
Race in Brazil
The most populous races in Brazil are White / Caucasian (7,628 | 94.0%), Two or more Races (351 | 4.3%), and Hispanic or Latino (129 | 1.6%).
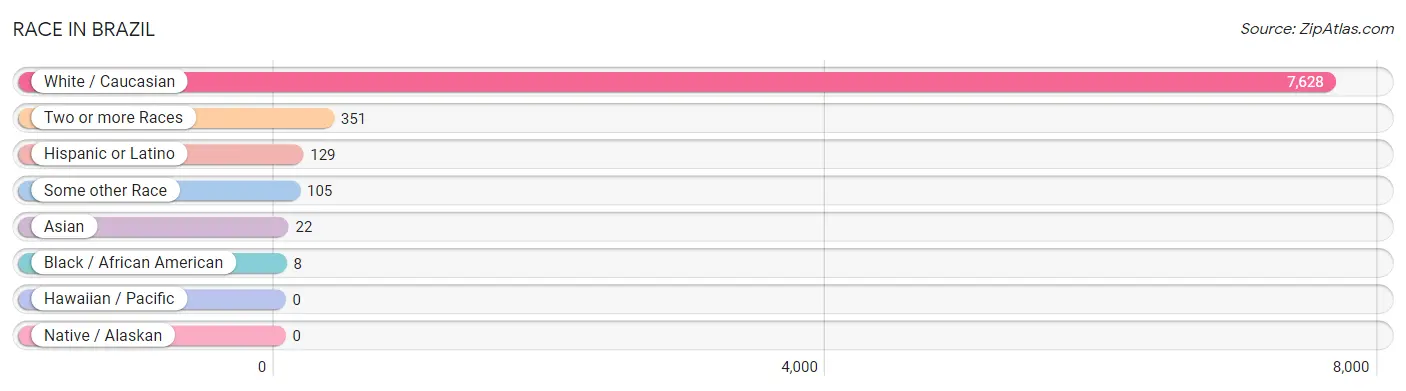
| Race | # Population | % Population |
| Asian | 22 | 0.3% |
| Black / African American | 8 | 0.1% |
| Hawaiian / Pacific | 0 | 0.0% |
| Hispanic or Latino | 129 | 1.6% |
| Native / Alaskan | 0 | 0.0% |
| White / Caucasian | 7,628 | 94.0% |
| Two or more Races | 351 | 4.3% |
| Some other Race | 105 | 1.3% |
| Total | 8,114 | 100.0% |
Ancestry in Brazil
The most populous ancestries reported in Brazil are German (1,257 | 15.5%), Irish (823 | 10.1%), English (736 | 9.1%), American (511 | 6.3%), and Italian (193 | 2.4%), together accounting for 43.4% of all Brazil residents.
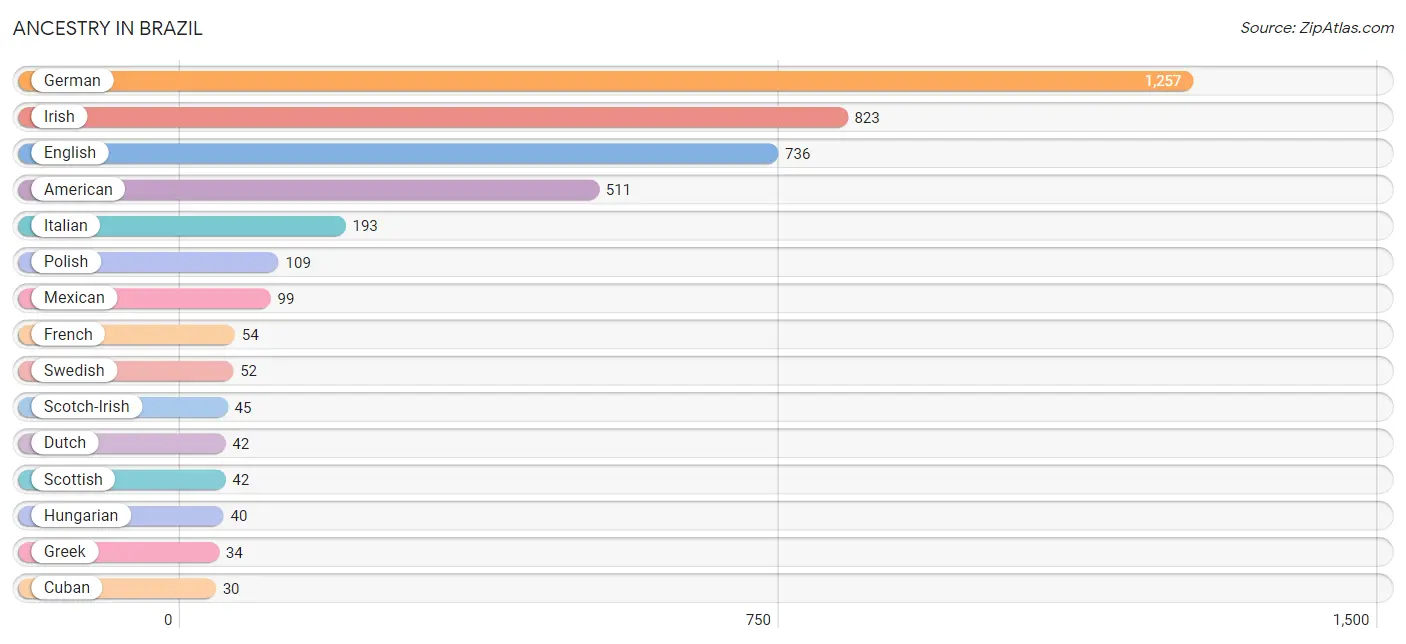
| Ancestry | # Population | % Population |
| African | 3 | 0.0% |
| American | 511 | 6.3% |
| Blackfeet | 12 | 0.2% |
| Cuban | 30 | 0.4% |
| Dutch | 42 | 0.5% |
| Eastern European | 23 | 0.3% |
| English | 736 | 9.1% |
| Ethiopian | 2 | 0.0% |
| European | 21 | 0.3% |
| French | 54 | 0.7% |
| German | 1,257 | 15.5% |
| Greek | 34 | 0.4% |
| Hungarian | 40 | 0.5% |
| Irish | 823 | 10.1% |
| Italian | 193 | 2.4% |
| Jamaican | 3 | 0.0% |
| Korean | 22 | 0.3% |
| Mexican | 99 | 1.2% |
| Polish | 109 | 1.3% |
| Scotch-Irish | 45 | 0.5% |
| Scottish | 42 | 0.5% |
| Subsaharan African | 5 | 0.1% |
| Swedish | 52 | 0.6% | View All 23 Rows |
Immigrants in Brazil
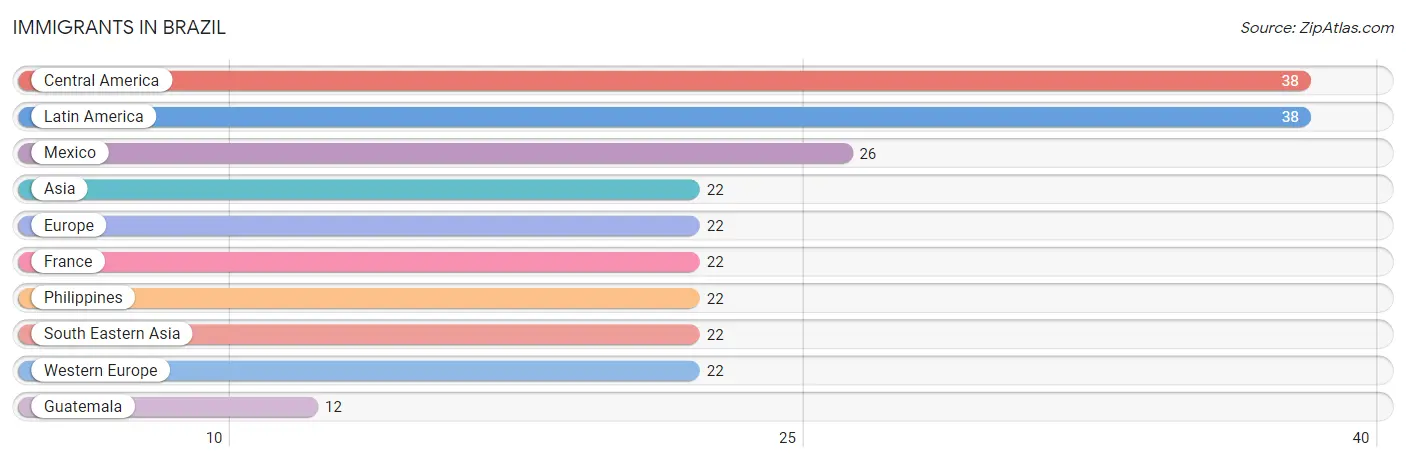
The most numerous immigrant groups reported in Brazil came from Central America (38 | 0.5%), Latin America (38 | 0.5%), Mexico (26 | 0.3%), Asia (22 | 0.3%), and Europe (22 | 0.3%), together accounting for 1.8% of all Brazil residents.
| Immigration Origin | # Population | % Population |
| Asia | 22 | 0.3% |
| Central America | 38 | 0.5% |
| Europe | 22 | 0.3% |
| France | 22 | 0.3% |
| Guatemala | 12 | 0.2% |
| Latin America | 38 | 0.5% |
| Mexico | 26 | 0.3% |
| Philippines | 22 | 0.3% |
| South Eastern Asia | 22 | 0.3% |
| Western Europe | 22 | 0.3% | View All 10 Rows |
Sex and Age in Brazil
Sex and Age in Brazil
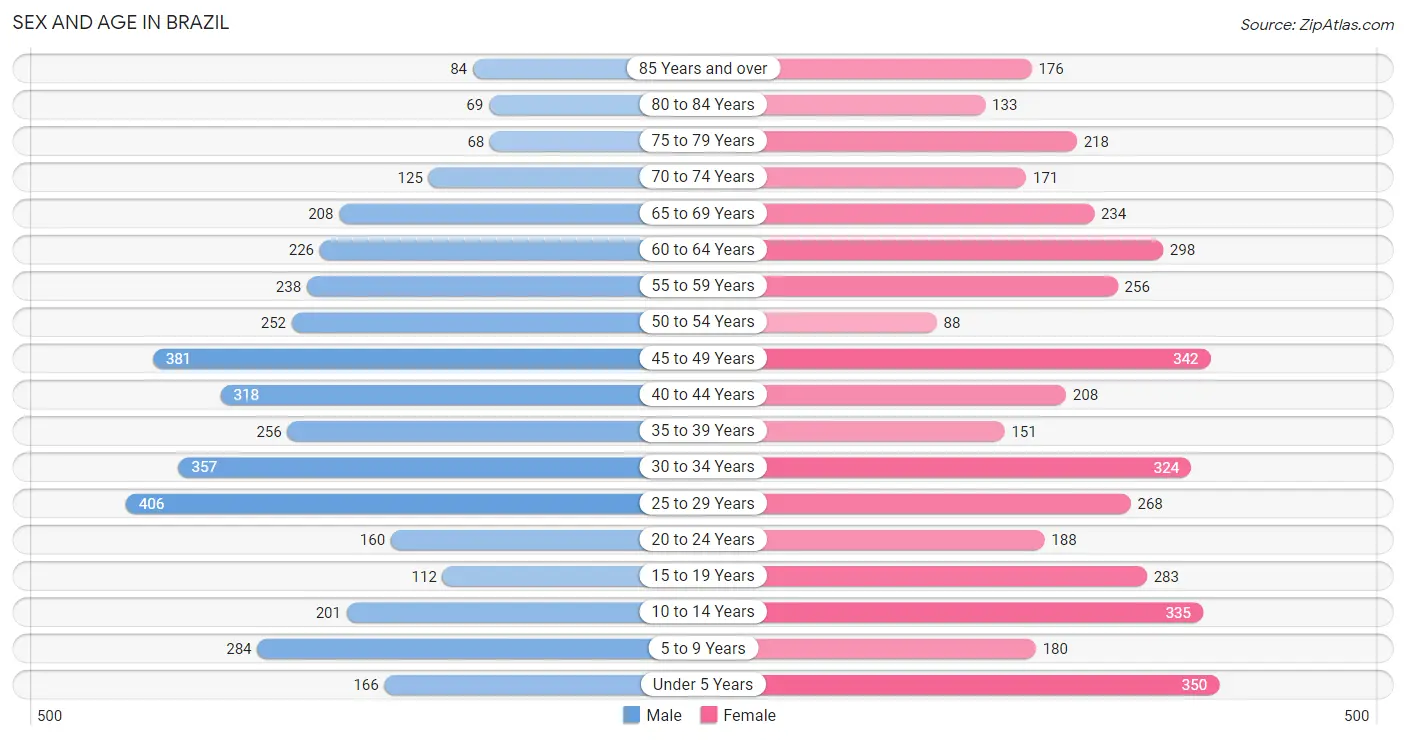
The most populous age groups in Brazil are 25 to 29 Years (406 | 10.4%) for men and Under 5 Years (350 | 8.3%) for women.
| Age Bracket | Male | Female |
| Under 5 Years | 166 (4.2%) | 350 (8.3%) |
| 5 to 9 Years | 284 (7.3%) | 180 (4.3%) |
| 10 to 14 Years | 201 (5.1%) | 335 (8.0%) |
| 15 to 19 Years | 112 (2.9%) | 283 (6.7%) |
| 20 to 24 Years | 160 (4.1%) | 188 (4.5%) |
| 25 to 29 Years | 406 (10.4%) | 268 (6.4%) |
| 30 to 34 Years | 357 (9.1%) | 324 (7.7%) |
| 35 to 39 Years | 256 (6.6%) | 151 (3.6%) |
| 40 to 44 Years | 318 (8.1%) | 208 (5.0%) |
| 45 to 49 Years | 381 (9.7%) | 342 (8.1%) |
| 50 to 54 Years | 252 (6.4%) | 88 (2.1%) |
| 55 to 59 Years | 238 (6.1%) | 256 (6.1%) |
| 60 to 64 Years | 226 (5.8%) | 298 (7.1%) |
| 65 to 69 Years | 208 (5.3%) | 234 (5.6%) |
| 70 to 74 Years | 125 (3.2%) | 171 (4.1%) |
| 75 to 79 Years | 68 (1.7%) | 218 (5.2%) |
| 80 to 84 Years | 69 (1.8%) | 133 (3.2%) |
| 85 Years and over | 84 (2.1%) | 176 (4.2%) |
| Total | 3,911 (100.0%) | 4,203 (100.0%) |
Families and Households in Brazil
Median Family Size in Brazil
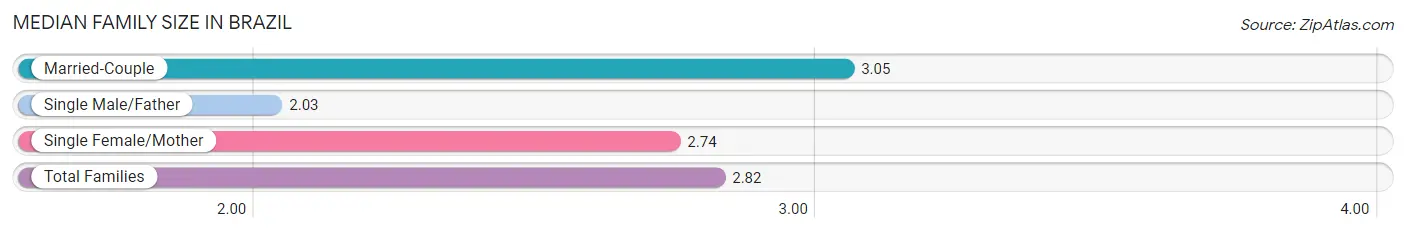
The median family size in Brazil is 2.82 persons per family, with married-couple families (1,187 | 54.3%) accounting for the largest median family size of 3.05 persons per family. On the other hand, single male/father families (290 | 13.3%) represent the smallest median family size with 2.03 persons per family.
| Family Type | # Families | Family Size |
| Married-Couple | 1,187 (54.3%) | 3.05 |
| Single Male/Father | 290 (13.3%) | 2.03 |
| Single Female/Mother | 708 (32.4%) | 2.74 |
| Total Families | 2,185 (100.0%) | 2.82 |
Median Household Size in Brazil
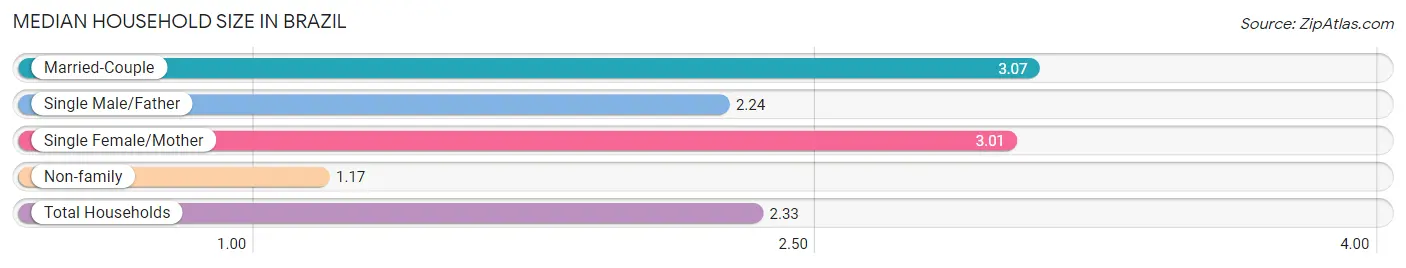
The median household size in Brazil is 2.33 persons per household, with married-couple households (1,187 | 35.7%) accounting for the largest median household size of 3.07 persons per household. non-family households (1,139 | 34.3%) represent the smallest median household size with 1.17 persons per household.
| Household Type | # Households | Household Size |
| Married-Couple | 1,187 (35.7%) | 3.07 |
| Single Male/Father | 290 (8.7%) | 2.24 |
| Single Female/Mother | 708 (21.3%) | 3.01 |
| Non-family | 1,139 (34.3%) | 1.17 |
| Total Households | 3,324 (100.0%) | 2.33 |
Household Size by Marriage Status in Brazil
Out of a total of 3,324 households in Brazil, 2,185 (65.7%) are family households, while 1,139 (34.3%) are nonfamily households. The most numerous type of family households are 2-person households, comprising 1,061, and the most common type of nonfamily households are 1-person households, comprising 988.
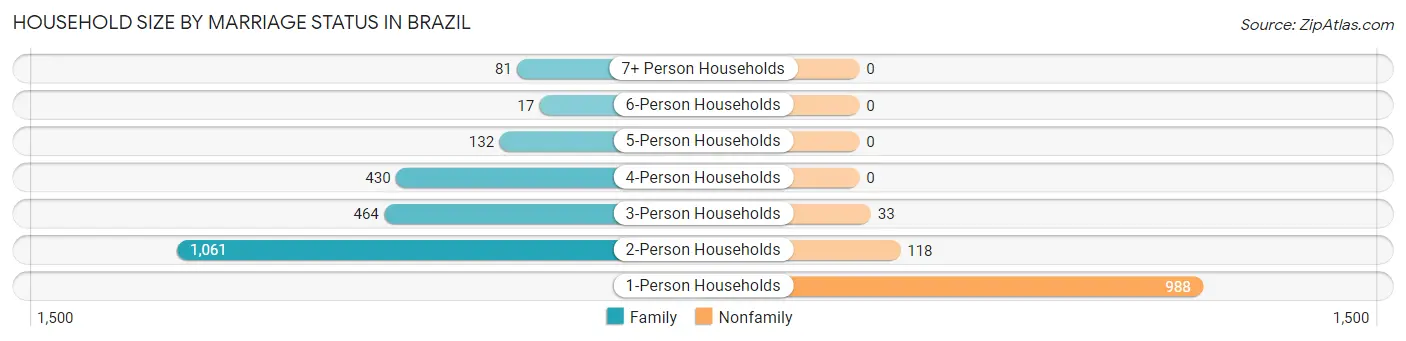
| Household Size | Family Households | Nonfamily Households |
| 1-Person Households | - | 988 (29.7%) |
| 2-Person Households | 1,061 (31.9%) | 118 (3.5%) |
| 3-Person Households | 464 (14.0%) | 33 (1.0%) |
| 4-Person Households | 430 (12.9%) | 0 (0.0%) |
| 5-Person Households | 132 (4.0%) | 0 (0.0%) |
| 6-Person Households | 17 (0.5%) | 0 (0.0%) |
| 7+ Person Households | 81 (2.4%) | 0 (0.0%) |
| Total | 2,185 (65.7%) | 1,139 (34.3%) |
Female Fertility in Brazil
Fertility by Age in Brazil
Average fertility rate in Brazil is 26.0 births per 1,000 women. Women in the age bracket of 20 to 34 years have the highest fertility rate with 58.0 births per 1,000 women. Women in the age bracket of 20 to 34 years acount for 100.0% of all women with births.
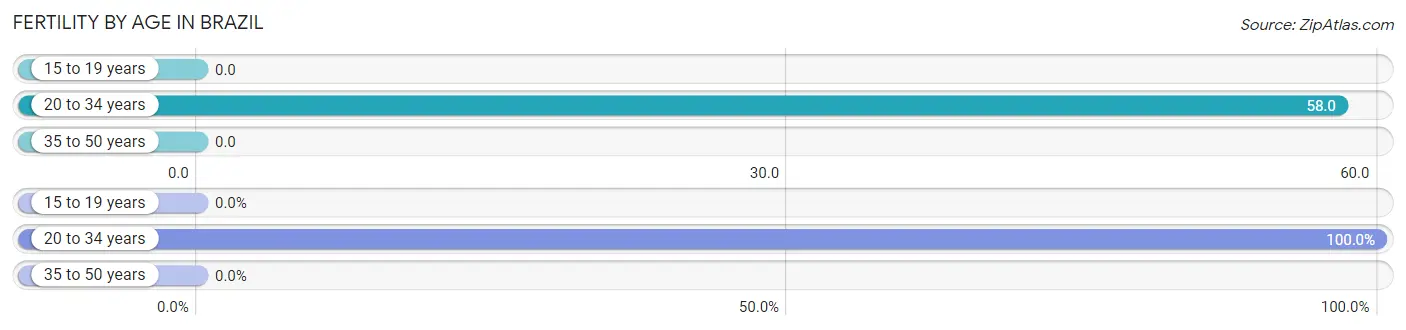
| Age Bracket | Women with Births | Births / 1,000 Women |
| 15 to 19 years | 0 (0.0%) | 0.0 |
| 20 to 34 years | 45 (100.0%) | 58.0 |
| 35 to 50 years | 0 (0.0%) | 0.0 |
| Total | 45 (100.0%) | 26.0 |
Fertility by Age by Marriage Status in Brazil
68.9% of women with births (45) in Brazil are married. The highest percentage of unmarried women with births falls into 20 to 34 years age bracket with 31.1% of them unmarried at the time of birth, while the lowest percentage of unmarried women with births belong to 20 to 34 years age bracket with 31.1% of them unmarried.
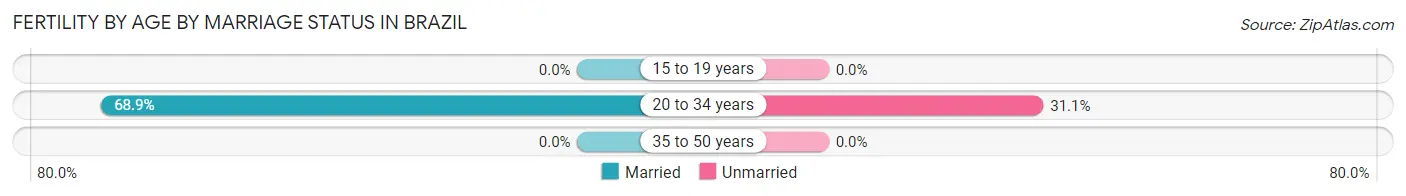
| Age Bracket | Married | Unmarried |
| 15 to 19 years | 0 (0.0%) | 0 (0.0%) |
| 20 to 34 years | 31 (68.9%) | 14 (31.1%) |
| 35 to 50 years | 0 (0.0%) | 0 (0.0%) |
| Total | 31 (68.9%) | 14 (31.1%) |
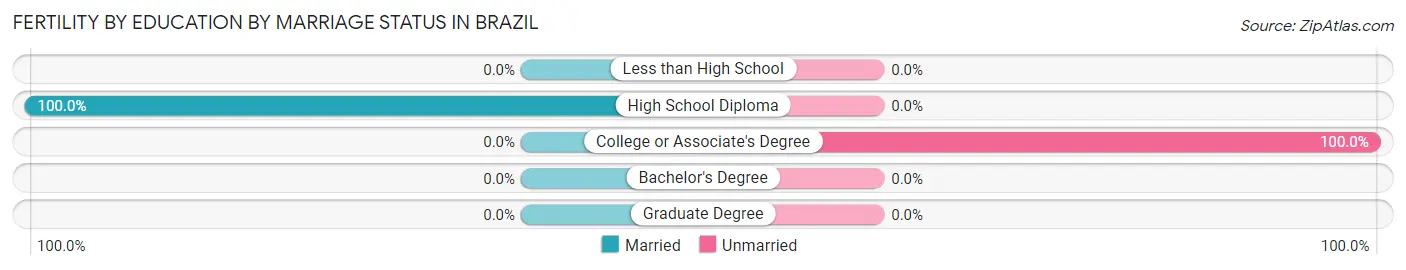
Fertility by Education in Brazil
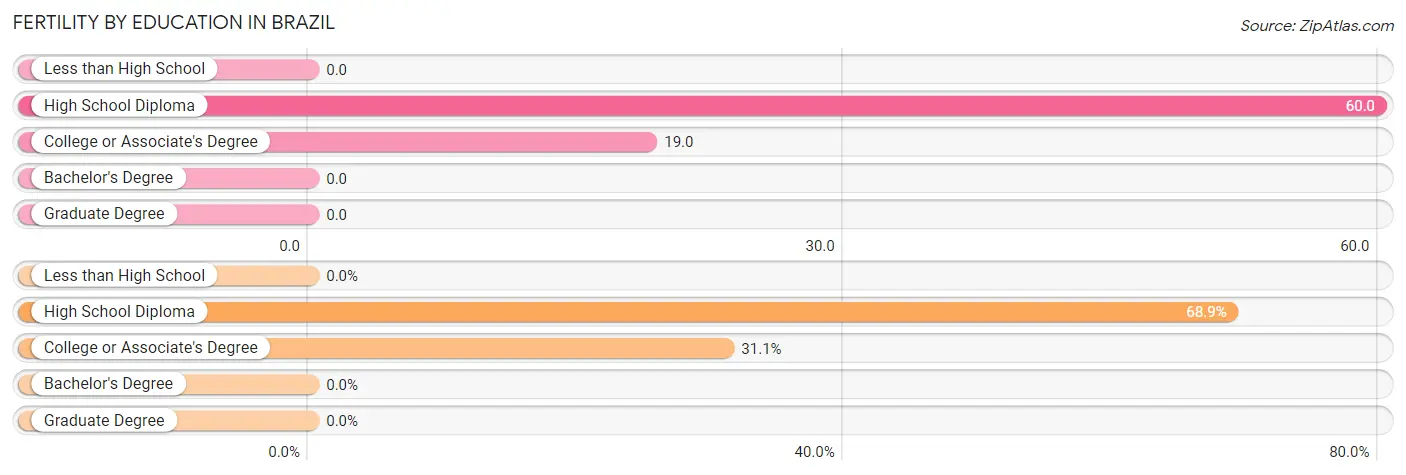
| Educational Attainment | Women with Births | Births / 1,000 Women |
| Less than High School | 0 (0.0%) | 0.0 |
| High School Diploma | 31 (68.9%) | 60.0 |
| College or Associate's Degree | 14 (31.1%) | 19.0 |
| Bachelor's Degree | 0 (0.0%) | 0.0 |
| Graduate Degree | 0 (0.0%) | 0.0 |
| Total | 45 (100.0%) | 26.0 |
Fertility by Education by Marriage Status in Brazil
31.1% of women with births in Brazil are unmarried. Women with the educational attainment of high school diploma are most likely to be married with 100.0% of them married at childbirth, while women with the educational attainment of college or associate's degree are least likely to be married with 100.0% of them unmarried at childbirth.
| Educational Attainment | Married | Unmarried |
| Less than High School | 0 (0.0%) | 0 (0.0%) |
| High School Diploma | 31 (100.0%) | 0 (0.0%) |
| College or Associate's Degree | 0 (0.0%) | 14 (100.0%) |
| Bachelor's Degree | 0 (0.0%) | 0 (0.0%) |
| Graduate Degree | 0 (0.0%) | 0 (0.0%) |
| Total | 31 (68.9%) | 14 (31.1%) |
Employment Characteristics in Brazil
Employment by Class of Employer in Brazil
Among the 3,042 employed individuals in Brazil, private company employees (2,296 | 75.5%), not-for-profit organizations (336 | 11.1%), and local government employees (161 | 5.3%) make up the most common classes of employment.
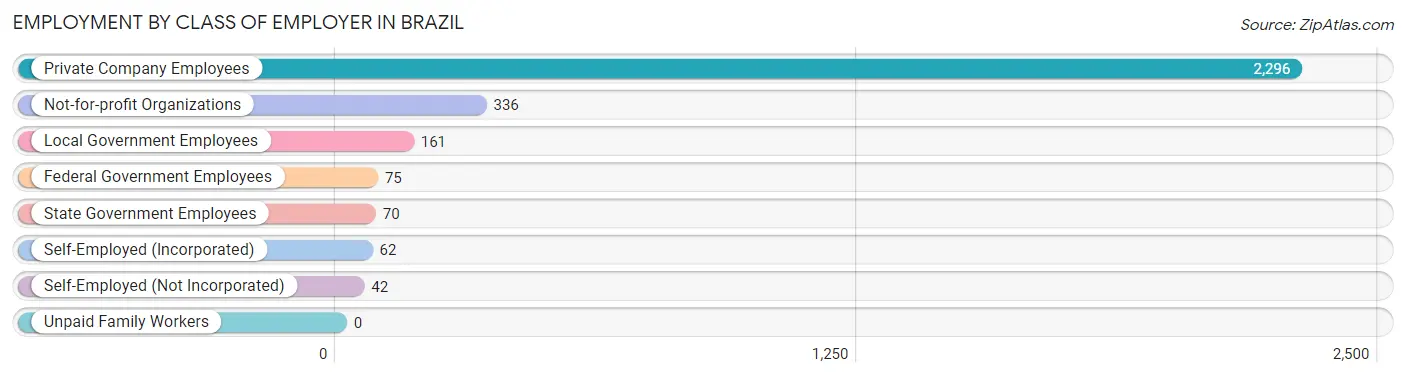
| Employer Class | # Employees | % Employees |
| Private Company Employees | 2,296 | 75.5% |
| Self-Employed (Incorporated) | 62 | 2.0% |
| Self-Employed (Not Incorporated) | 42 | 1.4% |
| Not-for-profit Organizations | 336 | 11.1% |
| Local Government Employees | 161 | 5.3% |
| State Government Employees | 70 | 2.3% |
| Federal Government Employees | 75 | 2.5% |
| Unpaid Family Workers | 0 | 0.0% |
| Total | 3,042 | 100.0% |
Employment Status by Age in Brazil
According to the labor force statistics for Brazil, out of the total population over 16 years of age (6,489), 50.5% or 3,277 individuals are in the labor force, with 6.3% or 206 of them unemployed. The age group with the highest labor force participation rate is 35 to 44 years, with 77.7% or 725 individuals in the labor force. Within the labor force, the 20 to 24 years age range has the highest percentage of unemployed individuals, with 26.7% or 63 of them being unemployed.
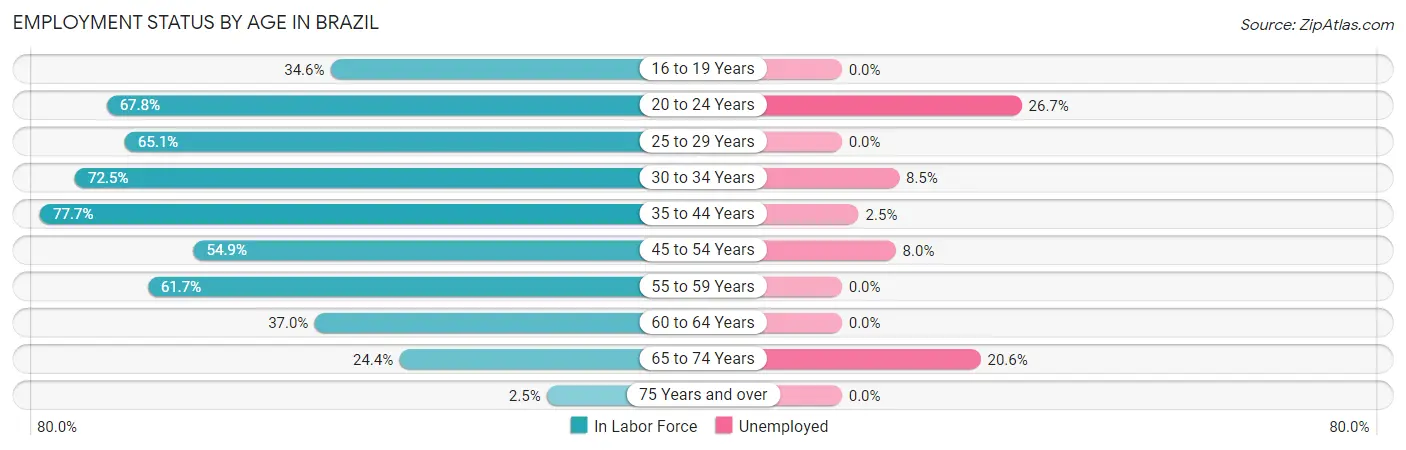
| Age Bracket | In Labor Force | Unemployed |
| 16 to 19 Years | 99 (34.6%) | 0 (0.0%) |
| 20 to 24 Years | 236 (67.8%) | 63 (26.7%) |
| 25 to 29 Years | 439 (65.1%) | 0 (0.0%) |
| 30 to 34 Years | 494 (72.5%) | 42 (8.5%) |
| 35 to 44 Years | 725 (77.7%) | 18 (2.5%) |
| 45 to 54 Years | 584 (54.9%) | 47 (8.0%) |
| 55 to 59 Years | 305 (61.7%) | 0 (0.0%) |
| 60 to 64 Years | 194 (37.0%) | 0 (0.0%) |
| 65 to 74 Years | 180 (24.4%) | 37 (20.6%) |
| 75 Years and over | 19 (2.5%) | 0 (0.0%) |
| Total | 3,277 (50.5%) | 206 (6.3%) |
Employment Status by Educational Attainment in Brazil
According to labor force statistics for Brazil, 62.7% of individuals (2,739) out of the total population between 25 and 64 years of age (4,369) are in the labor force, with 3.9% or 107 of them being unemployed. The group with the highest labor force participation rate are those with the educational attainment of bachelor's degree or higher, with 82.9% or 247 individuals in the labor force. Within the labor force, individuals with bachelor's degree or higher education have the highest percentage of unemployment, with 14.2% or 35 of them being unemployed.
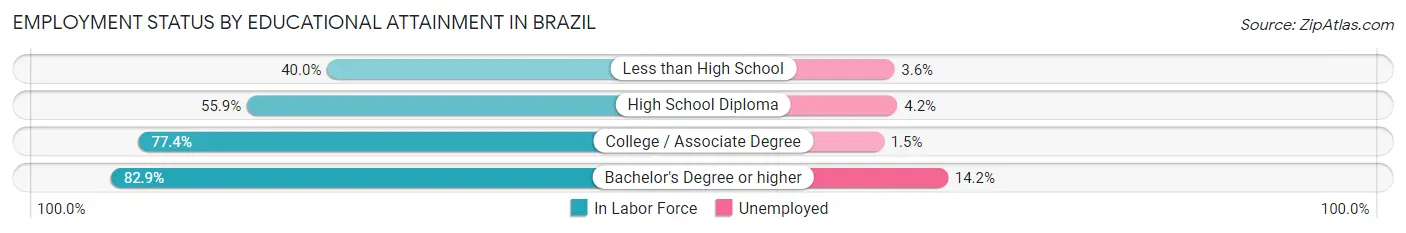
| Educational Attainment | In Labor Force | Unemployed |
| Less than High School | 275 (40.0%) | 25 (3.6%) |
| High School Diploma | 1,038 (55.9%) | 78 (4.2%) |
| College / Associate Degree | 1,182 (77.4%) | 23 (1.5%) |
| Bachelor's Degree or higher | 247 (82.9%) | 42 (14.2%) |
| Total | 2,739 (62.7%) | 170 (3.9%) |
Employment Occupations by Sex in Brazil
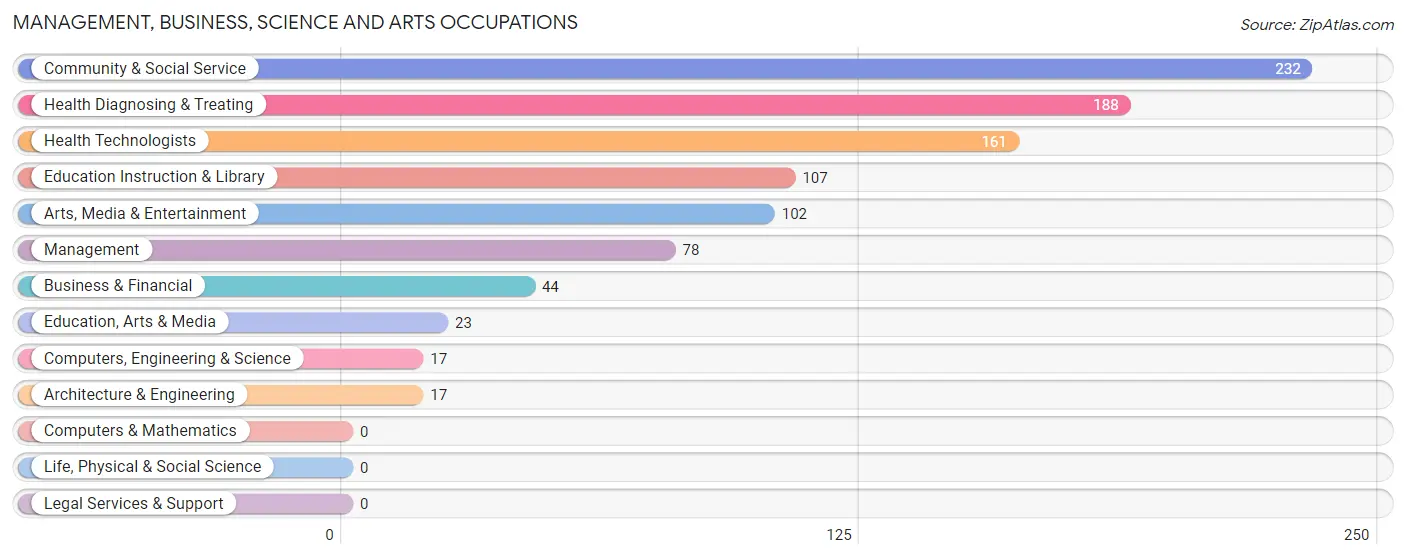
Management, Business, Science and Arts Occupations
The most common Management, Business, Science and Arts occupations in Brazil are Community & Social Service (232 | 7.6%), Health Diagnosing & Treating (188 | 6.1%), Health Technologists (161 | 5.2%), Education Instruction & Library (107 | 3.5%), and Arts, Media & Entertainment (102 | 3.3%).
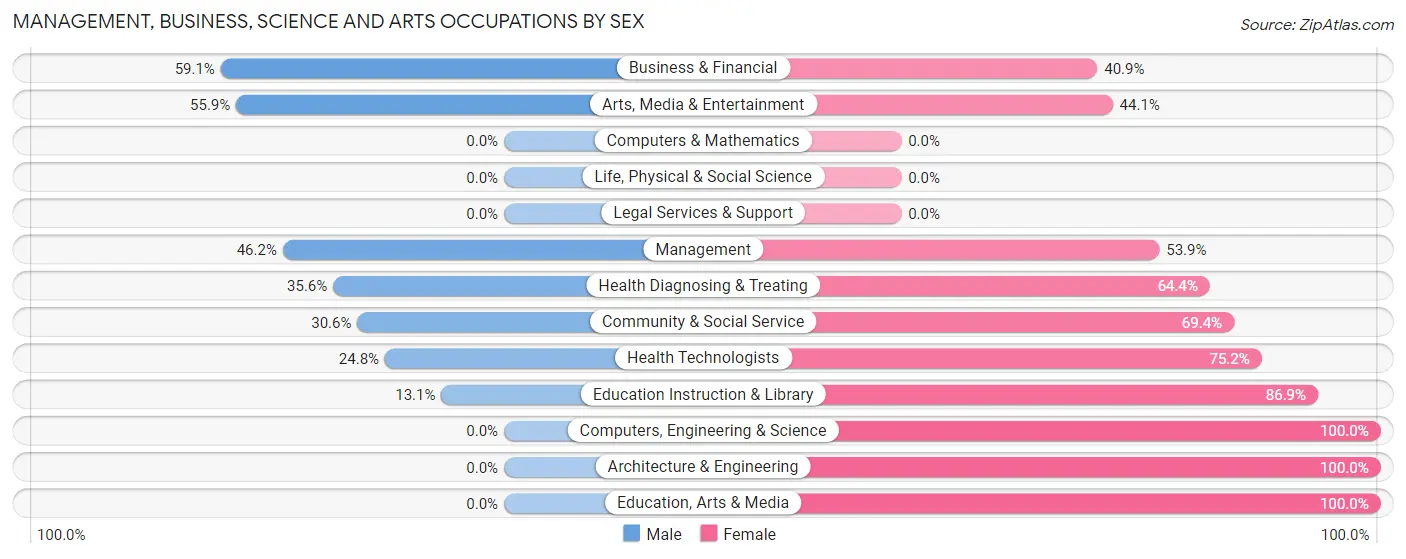
Management, Business, Science and Arts Occupations by Sex
Within the Management, Business, Science and Arts occupations in Brazil, the most male-oriented occupations are Business & Financial (59.1%), Arts, Media & Entertainment (55.9%), and Management (46.2%), while the most female-oriented occupations are Computers, Engineering & Science (100.0%), Architecture & Engineering (100.0%), and Education, Arts & Media (100.0%).
| Occupation | Male | Female |
| Management | 36 (46.2%) | 42 (53.8%) |
| Business & Financial | 26 (59.1%) | 18 (40.9%) |
| Computers, Engineering & Science | 0 (0.0%) | 17 (100.0%) |
| Computers & Mathematics | 0 (0.0%) | 0 (0.0%) |
| Architecture & Engineering | 0 (0.0%) | 17 (100.0%) |
| Life, Physical & Social Science | 0 (0.0%) | 0 (0.0%) |
| Community & Social Service | 71 (30.6%) | 161 (69.4%) |
| Education, Arts & Media | 0 (0.0%) | 23 (100.0%) |
| Legal Services & Support | 0 (0.0%) | 0 (0.0%) |
| Education Instruction & Library | 14 (13.1%) | 93 (86.9%) |
| Arts, Media & Entertainment | 57 (55.9%) | 45 (44.1%) |
| Health Diagnosing & Treating | 67 (35.6%) | 121 (64.4%) |
| Health Technologists | 40 (24.8%) | 121 (75.2%) |
| Total (Category) | 200 (35.8%) | 359 (64.2%) |
| Total (Overall) | 1,838 (59.9%) | 1,230 (40.1%) |
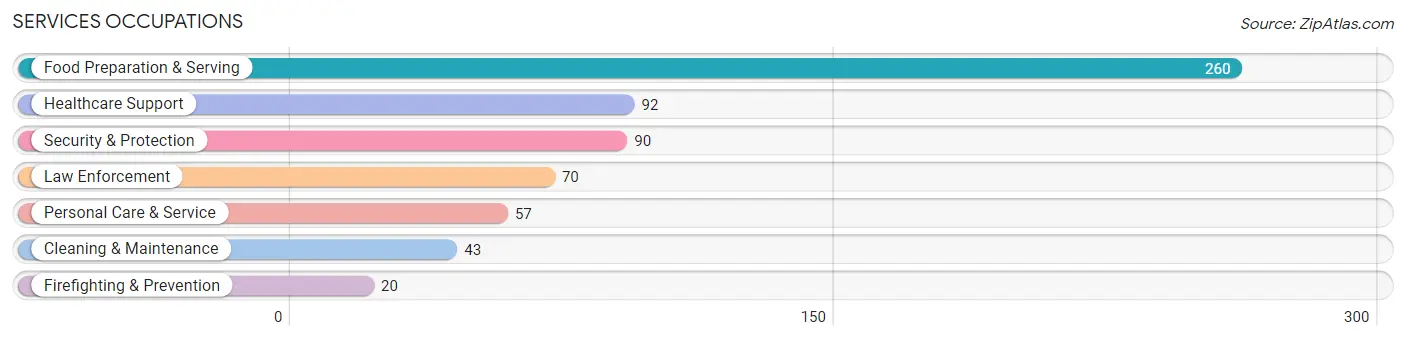
Services Occupations
The most common Services occupations in Brazil are Food Preparation & Serving (260 | 8.5%), Healthcare Support (92 | 3.0%), Security & Protection (90 | 2.9%), Law Enforcement (70 | 2.3%), and Personal Care & Service (57 | 1.9%).
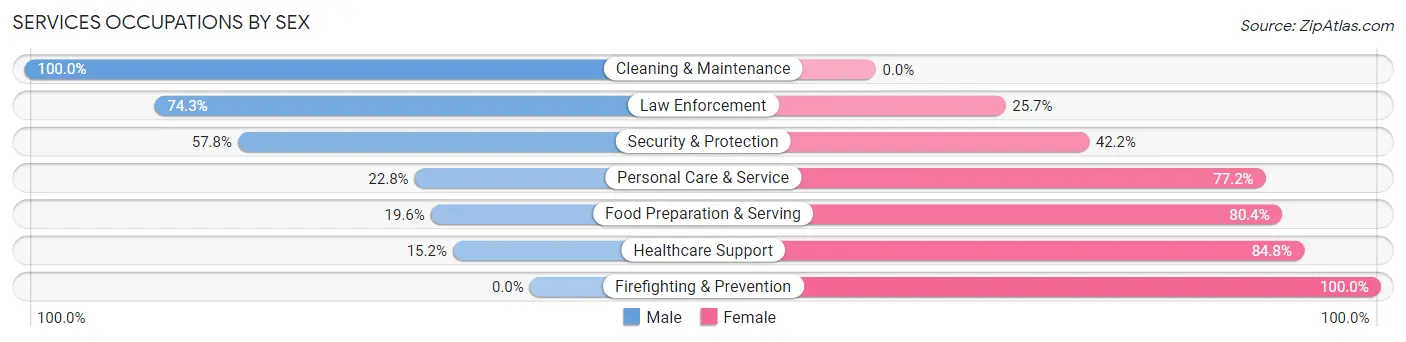
Services Occupations by Sex
Within the Services occupations in Brazil, the most male-oriented occupations are Cleaning & Maintenance (100.0%), Law Enforcement (74.3%), and Security & Protection (57.8%), while the most female-oriented occupations are Firefighting & Prevention (100.0%), Healthcare Support (84.8%), and Food Preparation & Serving (80.4%).
| Occupation | Male | Female |
| Healthcare Support | 14 (15.2%) | 78 (84.8%) |
| Security & Protection | 52 (57.8%) | 38 (42.2%) |
| Firefighting & Prevention | 0 (0.0%) | 20 (100.0%) |
| Law Enforcement | 52 (74.3%) | 18 (25.7%) |
| Food Preparation & Serving | 51 (19.6%) | 209 (80.4%) |
| Cleaning & Maintenance | 43 (100.0%) | 0 (0.0%) |
| Personal Care & Service | 13 (22.8%) | 44 (77.2%) |
| Total (Category) | 173 (31.9%) | 369 (68.1%) |
| Total (Overall) | 1,838 (59.9%) | 1,230 (40.1%) |
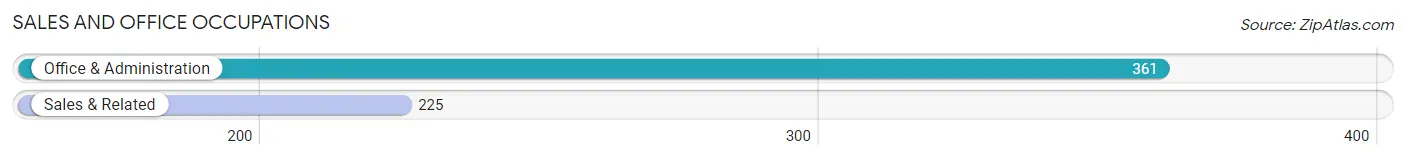
Sales and Office Occupations
The most common Sales and Office occupations in Brazil are Office & Administration (361 | 11.8%), and Sales & Related (225 | 7.3%).
Sales and Office Occupations by Sex
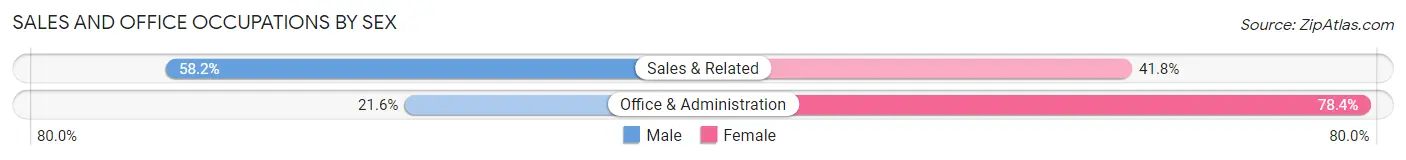
| Occupation | Male | Female |
| Sales & Related | 131 (58.2%) | 94 (41.8%) |
| Office & Administration | 78 (21.6%) | 283 (78.4%) |
| Total (Category) | 209 (35.7%) | 377 (64.3%) |
| Total (Overall) | 1,838 (59.9%) | 1,230 (40.1%) |
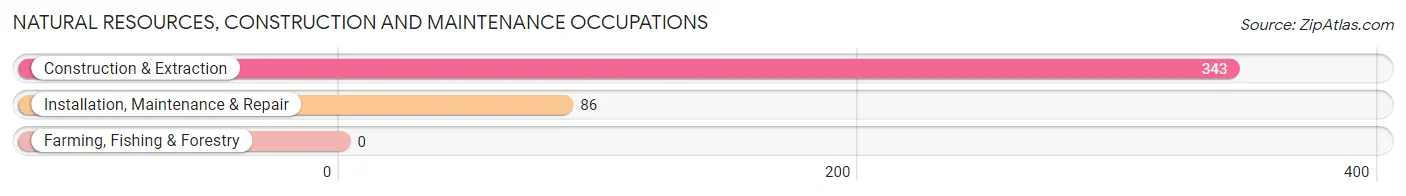
Natural Resources, Construction and Maintenance Occupations
The most common Natural Resources, Construction and Maintenance occupations in Brazil are Construction & Extraction (343 | 11.2%), and Installation, Maintenance & Repair (86 | 2.8%).
Natural Resources, Construction and Maintenance Occupations by Sex
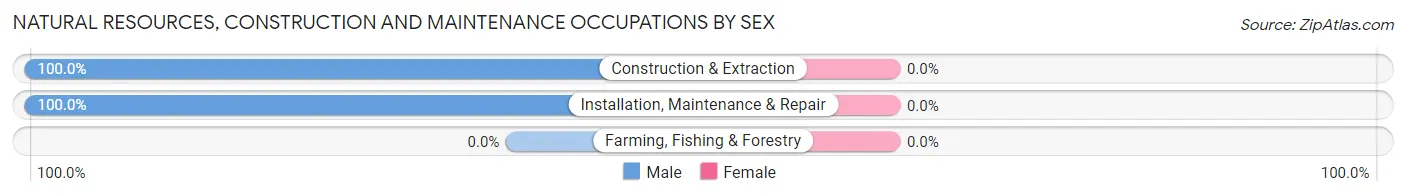
| Occupation | Male | Female |
| Farming, Fishing & Forestry | 0 (0.0%) | 0 (0.0%) |
| Construction & Extraction | 343 (100.0%) | 0 (0.0%) |
| Installation, Maintenance & Repair | 86 (100.0%) | 0 (0.0%) |
| Total (Category) | 429 (100.0%) | 0 (0.0%) |
| Total (Overall) | 1,838 (59.9%) | 1,230 (40.1%) |
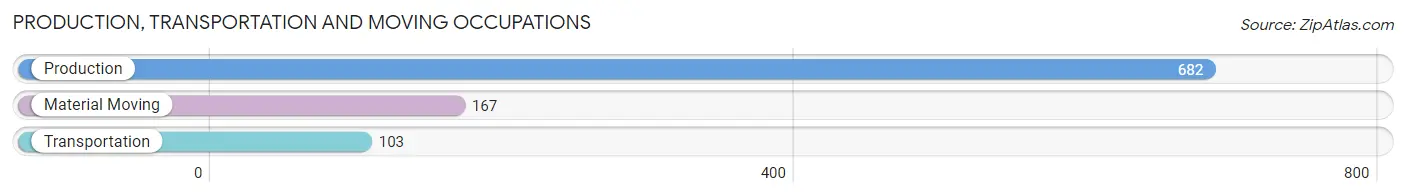
Production, Transportation and Moving Occupations
The most common Production, Transportation and Moving occupations in Brazil are Production (682 | 22.2%), Material Moving (167 | 5.4%), and Transportation (103 | 3.4%).
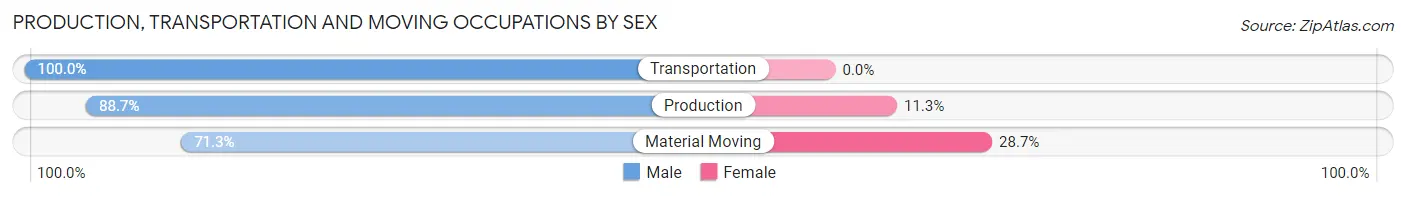
Production, Transportation and Moving Occupations by Sex
| Occupation | Male | Female |
| Production | 605 (88.7%) | 77 (11.3%) |
| Transportation | 103 (100.0%) | 0 (0.0%) |
| Material Moving | 119 (71.3%) | 48 (28.7%) |
| Total (Category) | 827 (86.9%) | 125 (13.1%) |
| Total (Overall) | 1,838 (59.9%) | 1,230 (40.1%) |
Employment Industries by Sex in Brazil
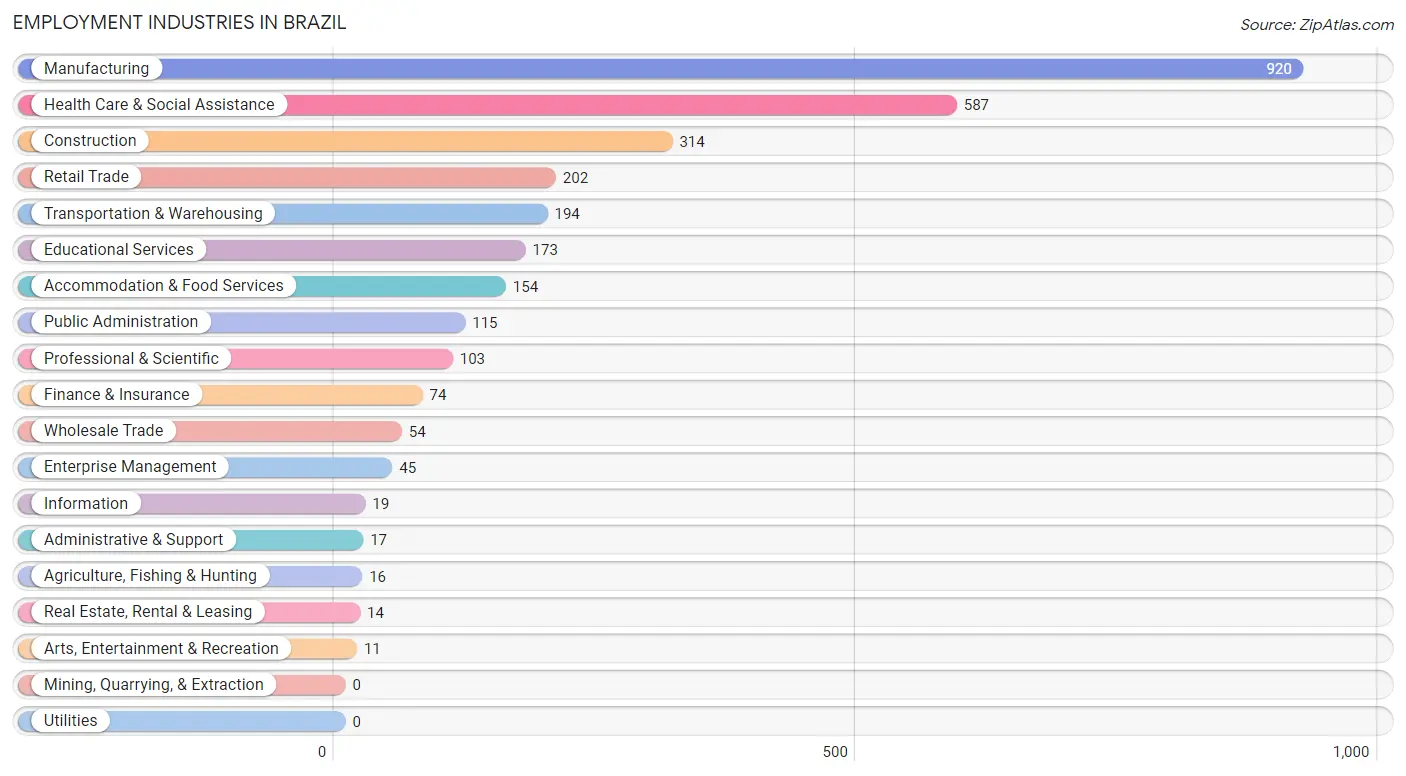
Employment Industries in Brazil
The major employment industries in Brazil include Manufacturing (920 | 30.0%), Health Care & Social Assistance (587 | 19.1%), Construction (314 | 10.2%), Retail Trade (202 | 6.6%), and Transportation & Warehousing (194 | 6.3%).
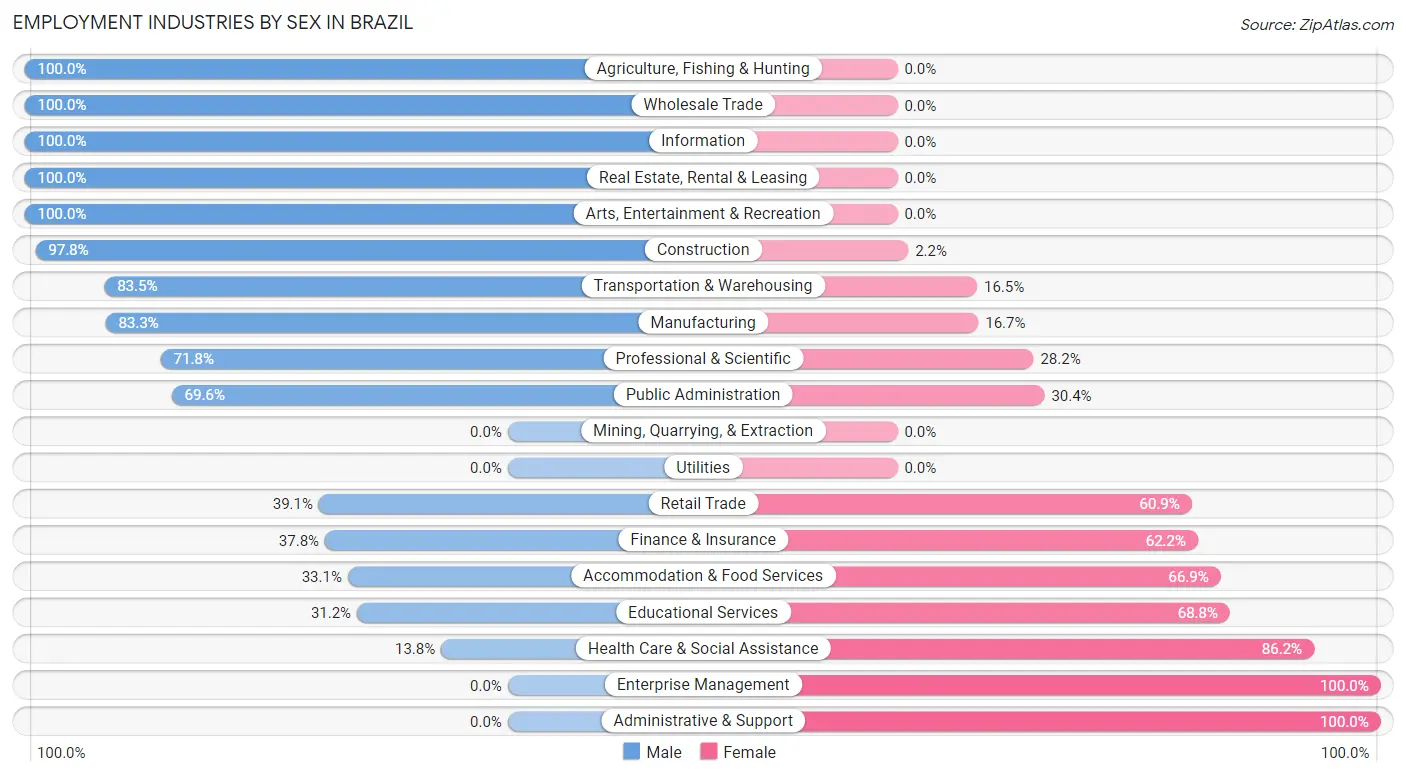
Employment Industries by Sex in Brazil
The Brazil industries that see more men than women are Agriculture, Fishing & Hunting (100.0%), Wholesale Trade (100.0%), and Information (100.0%), whereas the industries that tend to have a higher number of women are Enterprise Management (100.0%), Administrative & Support (100.0%), and Health Care & Social Assistance (86.2%).
| Industry | Male | Female |
| Agriculture, Fishing & Hunting | 16 (100.0%) | 0 (0.0%) |
| Mining, Quarrying, & Extraction | 0 (0.0%) | 0 (0.0%) |
| Construction | 307 (97.8%) | 7 (2.2%) |
| Manufacturing | 766 (83.3%) | 154 (16.7%) |
| Wholesale Trade | 54 (100.0%) | 0 (0.0%) |
| Retail Trade | 79 (39.1%) | 123 (60.9%) |
| Transportation & Warehousing | 162 (83.5%) | 32 (16.5%) |
| Utilities | 0 (0.0%) | 0 (0.0%) |
| Information | 19 (100.0%) | 0 (0.0%) |
| Finance & Insurance | 28 (37.8%) | 46 (62.2%) |
| Real Estate, Rental & Leasing | 14 (100.0%) | 0 (0.0%) |
| Professional & Scientific | 74 (71.8%) | 29 (28.2%) |
| Enterprise Management | 0 (0.0%) | 45 (100.0%) |
| Administrative & Support | 0 (0.0%) | 17 (100.0%) |
| Educational Services | 54 (31.2%) | 119 (68.8%) |
| Health Care & Social Assistance | 81 (13.8%) | 506 (86.2%) |
| Arts, Entertainment & Recreation | 11 (100.0%) | 0 (0.0%) |
| Accommodation & Food Services | 51 (33.1%) | 103 (66.9%) |
| Public Administration | 80 (69.6%) | 35 (30.4%) |
| Total | 1,838 (59.9%) | 1,230 (40.1%) |
Education in Brazil
School Enrollment in Brazil
The most common levels of schooling among the 1,538 students in Brazil are middle school (523 | 34.0%), elementary school (385 | 25.0%), and high school (378 | 24.6%).
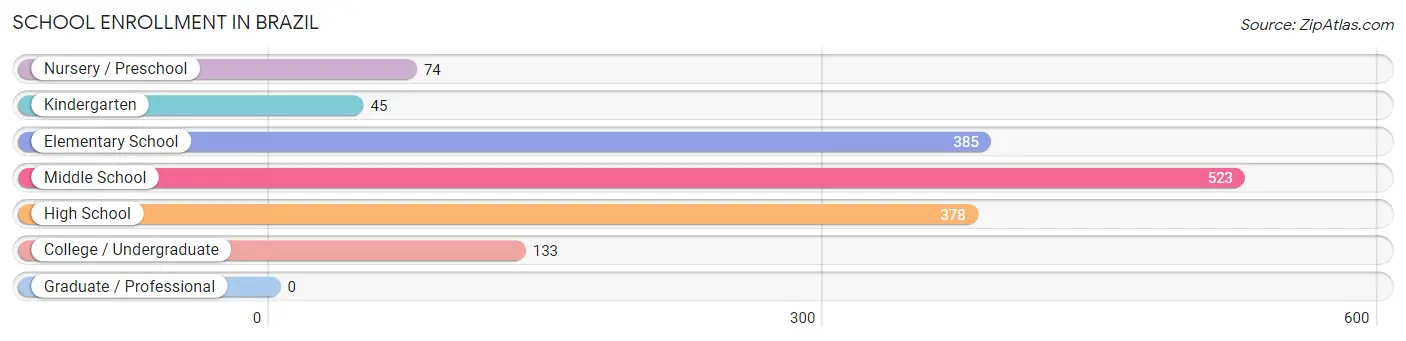
| School Level | # Students | % Students |
| Nursery / Preschool | 74 | 4.8% |
| Kindergarten | 45 | 2.9% |
| Elementary School | 385 | 25.0% |
| Middle School | 523 | 34.0% |
| High School | 378 | 24.6% |
| College / Undergraduate | 133 | 8.6% |
| Graduate / Professional | 0 | 0.0% |
| Total | 1,538 | 100.0% |
School Enrollment by Age by Funding Source in Brazil
Out of a total of 1,538 students who are enrolled in schools in Brazil, 131 (8.5%) attend a private institution, while the remaining 1,407 (91.5%) are enrolled in public schools. The age group of 25 to 34 year olds has the highest likelihood of being enrolled in private schools, with 20 (18.3% in the age bracket) enrolled. Conversely, the age group of 3 to 4 year olds has the lowest likelihood of being enrolled in a private school, with 62 (100.0% in the age bracket) attending a public institution.
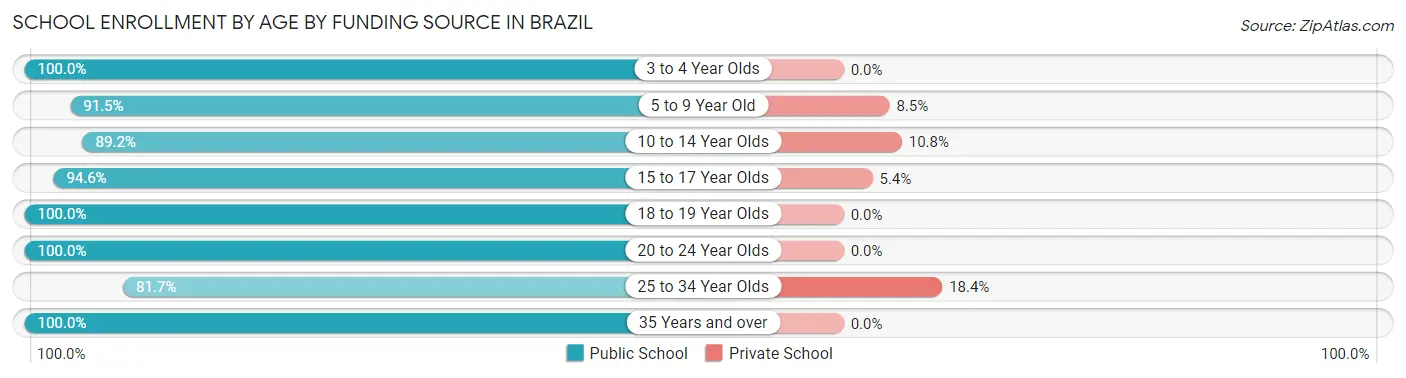
| Age Bracket | Public School | Private School |
| 3 to 4 Year Olds | 62 (100.0%) | 0 (0.0%) |
| 5 to 9 Year Old | 397 (91.5%) | 37 (8.5%) |
| 10 to 14 Year Olds | 478 (89.2%) | 58 (10.8%) |
| 15 to 17 Year Olds | 264 (94.6%) | 15 (5.4%) |
| 18 to 19 Year Olds | 74 (100.0%) | 0 (0.0%) |
| 20 to 24 Year Olds | 26 (100.0%) | 0 (0.0%) |
| 25 to 34 Year Olds | 89 (81.7%) | 20 (18.3%) |
| 35 Years and over | 18 (100.0%) | 0 (0.0%) |
| Total | 1,407 (91.5%) | 131 (8.5%) |
Educational Attainment by Field of Study in Brazil
Education (128 | 25.5%), business (126 | 25.1%), psychology (46 | 9.1%), social sciences (44 | 8.7%), and arts & humanities (44 | 8.7%) are the most common fields of study among 503 individuals in Brazil who have obtained a bachelor's degree or higher.
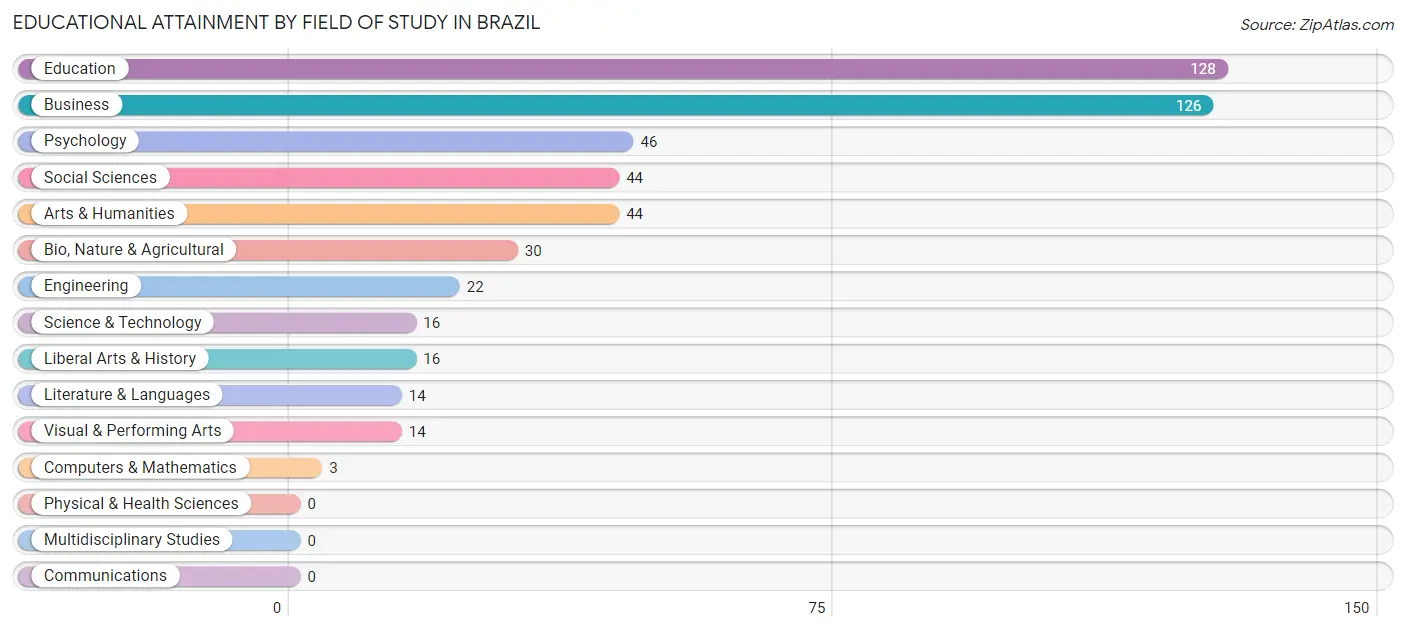
| Field of Study | # Graduates | % Graduates |
| Computers & Mathematics | 3 | 0.6% |
| Bio, Nature & Agricultural | 30 | 6.0% |
| Physical & Health Sciences | 0 | 0.0% |
| Psychology | 46 | 9.1% |
| Social Sciences | 44 | 8.7% |
| Engineering | 22 | 4.4% |
| Multidisciplinary Studies | 0 | 0.0% |
| Science & Technology | 16 | 3.2% |
| Business | 126 | 25.1% |
| Education | 128 | 25.5% |
| Literature & Languages | 14 | 2.8% |
| Liberal Arts & History | 16 | 3.2% |
| Visual & Performing Arts | 14 | 2.8% |
| Communications | 0 | 0.0% |
| Arts & Humanities | 44 | 8.7% |
| Total | 503 | 100.0% |
Transportation & Commute in Brazil
Vehicle Availability by Sex in Brazil
The most prevalent vehicle ownership categories in Brazil are males with 2 vehicles (799, accounting for 43.5%) and females with 2 vehicles (481, making up 66.4%).
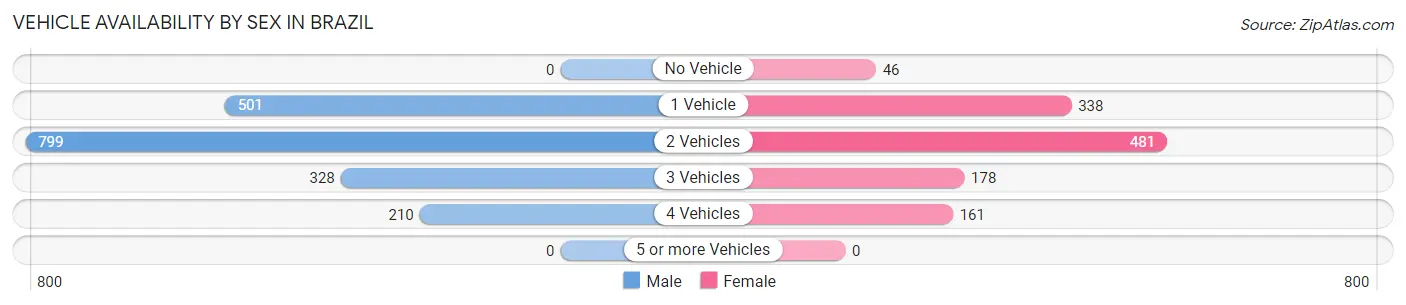
| Vehicles Available | Male | Female |
| No Vehicle | 0 (0.0%) | 46 (3.8%) |
| 1 Vehicle | 501 (27.3%) | 338 (28.1%) |
| 2 Vehicles | 799 (43.5%) | 481 (40.0%) |
| 3 Vehicles | 328 (17.8%) | 178 (14.8%) |
| 4 Vehicles | 210 (11.4%) | 161 (13.4%) |
| 5 or more Vehicles | 0 (0.0%) | 0 (0.0%) |
| Total | 1,838 (100.0%) | 1,204 (100.0%) |
Commute Time in Brazil
The most frequently occuring commute durations in Brazil are 25 to 29 minutes (523 commuters, 17.3%), 30 to 34 minutes (509 commuters, 16.9%), and 5 to 9 minutes (404 commuters, 13.4%).
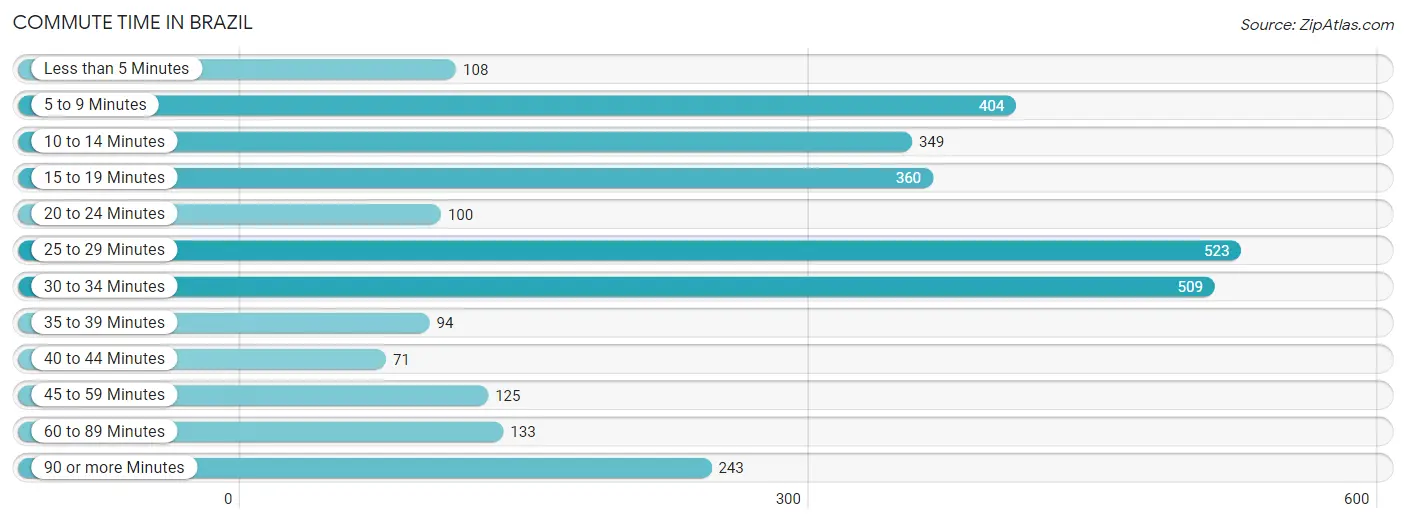
| Commute Time | # Commuters | % Commuters |
| Less than 5 Minutes | 108 | 3.6% |
| 5 to 9 Minutes | 404 | 13.4% |
| 10 to 14 Minutes | 349 | 11.6% |
| 15 to 19 Minutes | 360 | 11.9% |
| 20 to 24 Minutes | 100 | 3.3% |
| 25 to 29 Minutes | 523 | 17.3% |
| 30 to 34 Minutes | 509 | 16.9% |
| 35 to 39 Minutes | 94 | 3.1% |
| 40 to 44 Minutes | 71 | 2.4% |
| 45 to 59 Minutes | 125 | 4.1% |
| 60 to 89 Minutes | 133 | 4.4% |
| 90 or more Minutes | 243 | 8.1% |
Commute Time by Sex in Brazil
The most common commute times in Brazil are 25 to 29 minutes (426 commuters, 23.2%) for males and 30 to 34 minutes (310 commuters, 26.3%) for females.
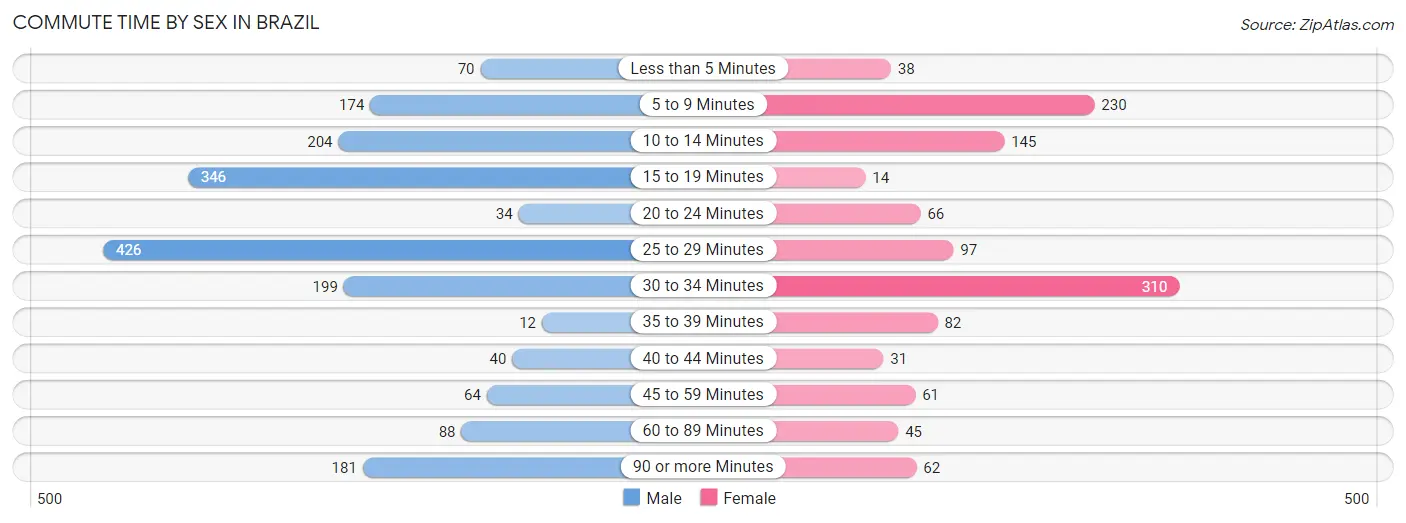
| Commute Time | Male | Female |
| Less than 5 Minutes | 70 (3.8%) | 38 (3.2%) |
| 5 to 9 Minutes | 174 (9.5%) | 230 (19.5%) |
| 10 to 14 Minutes | 204 (11.1%) | 145 (12.3%) |
| 15 to 19 Minutes | 346 (18.8%) | 14 (1.2%) |
| 20 to 24 Minutes | 34 (1.8%) | 66 (5.6%) |
| 25 to 29 Minutes | 426 (23.2%) | 97 (8.2%) |
| 30 to 34 Minutes | 199 (10.8%) | 310 (26.3%) |
| 35 to 39 Minutes | 12 (0.6%) | 82 (6.9%) |
| 40 to 44 Minutes | 40 (2.2%) | 31 (2.6%) |
| 45 to 59 Minutes | 64 (3.5%) | 61 (5.2%) |
| 60 to 89 Minutes | 88 (4.8%) | 45 (3.8%) |
| 90 or more Minutes | 181 (9.9%) | 62 (5.2%) |
Time of Departure to Work by Sex in Brazil
The most frequent times of departure to work in Brazil are 12:00 AM to 4:59 AM (342, 18.6%) for males and 4:00 PM to 11:59 PM (220, 18.6%) for females.
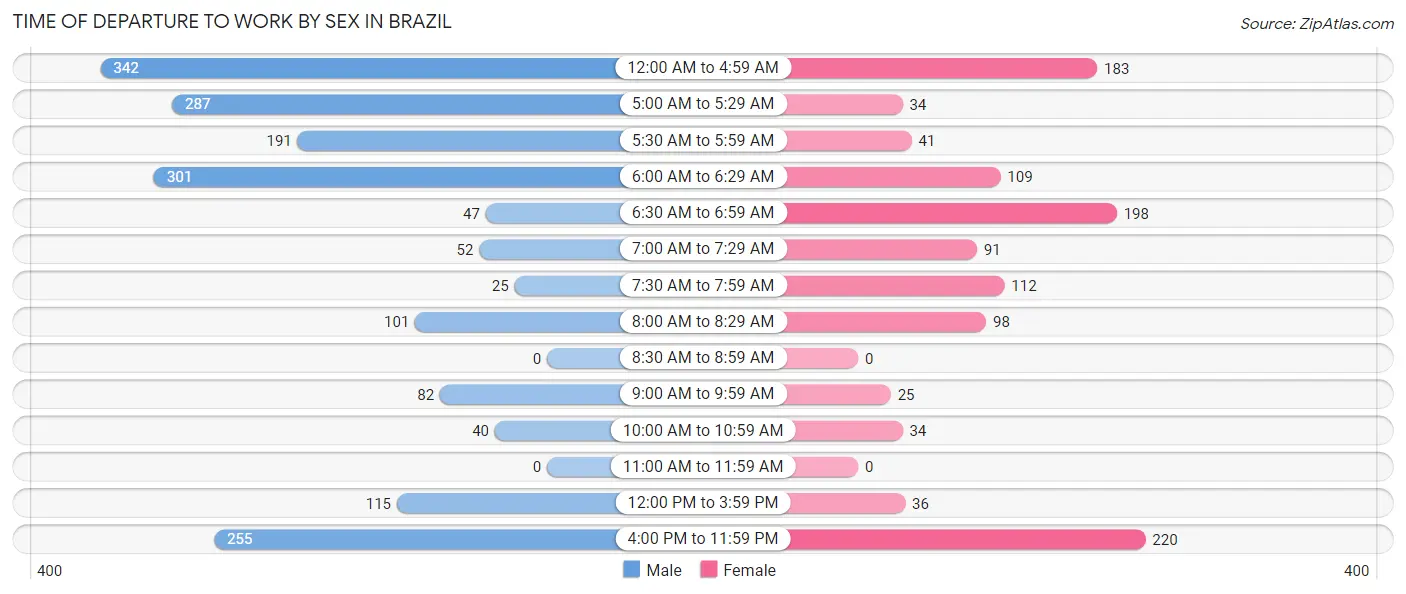
| Time of Departure | Male | Female |
| 12:00 AM to 4:59 AM | 342 (18.6%) | 183 (15.5%) |
| 5:00 AM to 5:29 AM | 287 (15.6%) | 34 (2.9%) |
| 5:30 AM to 5:59 AM | 191 (10.4%) | 41 (3.5%) |
| 6:00 AM to 6:29 AM | 301 (16.4%) | 109 (9.2%) |
| 6:30 AM to 6:59 AM | 47 (2.6%) | 198 (16.8%) |
| 7:00 AM to 7:29 AM | 52 (2.8%) | 91 (7.7%) |
| 7:30 AM to 7:59 AM | 25 (1.4%) | 112 (9.5%) |
| 8:00 AM to 8:29 AM | 101 (5.5%) | 98 (8.3%) |
| 8:30 AM to 8:59 AM | 0 (0.0%) | 0 (0.0%) |
| 9:00 AM to 9:59 AM | 82 (4.5%) | 25 (2.1%) |
| 10:00 AM to 10:59 AM | 40 (2.2%) | 34 (2.9%) |
| 11:00 AM to 11:59 AM | 0 (0.0%) | 0 (0.0%) |
| 12:00 PM to 3:59 PM | 115 (6.3%) | 36 (3.0%) |
| 4:00 PM to 11:59 PM | 255 (13.9%) | 220 (18.6%) |
| Total | 1,838 (100.0%) | 1,181 (100.0%) |
Housing Occupancy in Brazil
Occupancy by Ownership in Brazil
Of the total 3,324 dwellings in Brazil, owner-occupied units account for 2,141 (64.4%), while renter-occupied units make up 1,183 (35.6%).
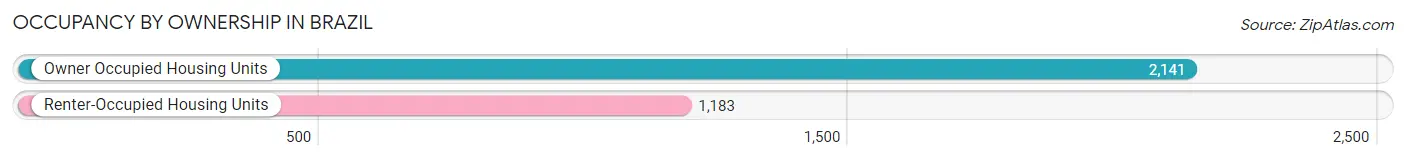
| Occupancy | # Housing Units | % Housing Units |
| Owner Occupied Housing Units | 2,141 | 64.4% |
| Renter-Occupied Housing Units | 1,183 | 35.6% |
| Total Occupied Housing Units | 3,324 | 100.0% |
Occupancy by Household Size in Brazil
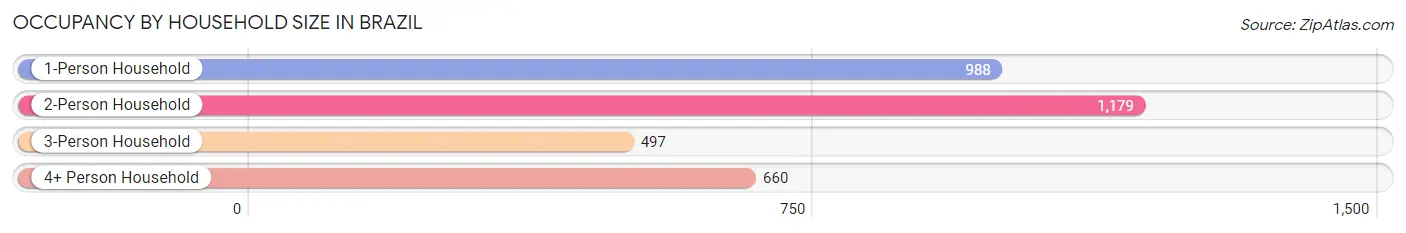
| Household Size | # Housing Units | % Housing Units |
| 1-Person Household | 988 | 29.7% |
| 2-Person Household | 1,179 | 35.5% |
| 3-Person Household | 497 | 14.9% |
| 4+ Person Household | 660 | 19.9% |
| Total Housing Units | 3,324 | 100.0% |
Occupancy by Ownership by Household Size in Brazil
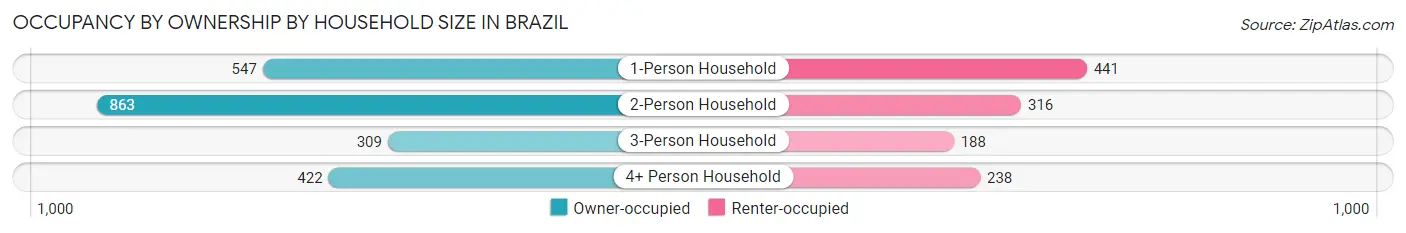
| Household Size | Owner-occupied | Renter-occupied |
| 1-Person Household | 547 (55.4%) | 441 (44.6%) |
| 2-Person Household | 863 (73.2%) | 316 (26.8%) |
| 3-Person Household | 309 (62.2%) | 188 (37.8%) |
| 4+ Person Household | 422 (63.9%) | 238 (36.1%) |
| Total Housing Units | 2,141 (64.4%) | 1,183 (35.6%) |
Occupancy by Educational Attainment in Brazil
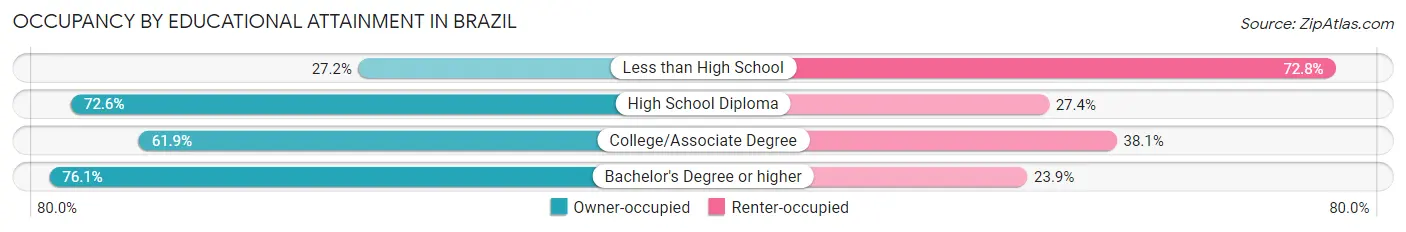
| Household Size | Owner-occupied | Renter-occupied |
| Less than High School | 85 (27.2%) | 228 (72.8%) |
| High School Diploma | 987 (72.6%) | 372 (27.4%) |
| College/Associate Degree | 818 (61.9%) | 504 (38.1%) |
| Bachelor's Degree or higher | 251 (76.1%) | 79 (23.9%) |
Occupancy by Age of Householder in Brazil
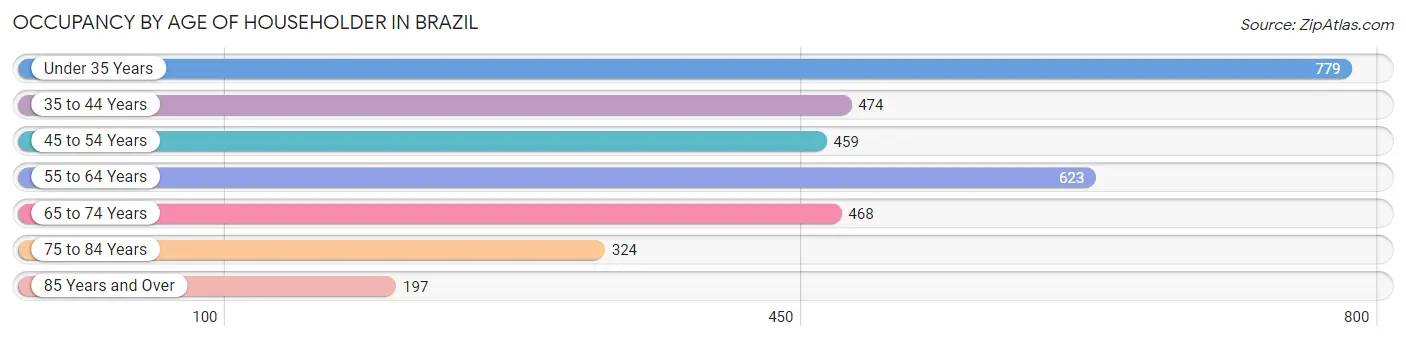
| Age Bracket | # Households | % Households |
| Under 35 Years | 779 | 23.4% |
| 35 to 44 Years | 474 | 14.3% |
| 45 to 54 Years | 459 | 13.8% |
| 55 to 64 Years | 623 | 18.7% |
| 65 to 74 Years | 468 | 14.1% |
| 75 to 84 Years | 324 | 9.8% |
| 85 Years and Over | 197 | 5.9% |
| Total | 3,324 | 100.0% |
Housing Finances in Brazil
Median Income by Occupancy in Brazil
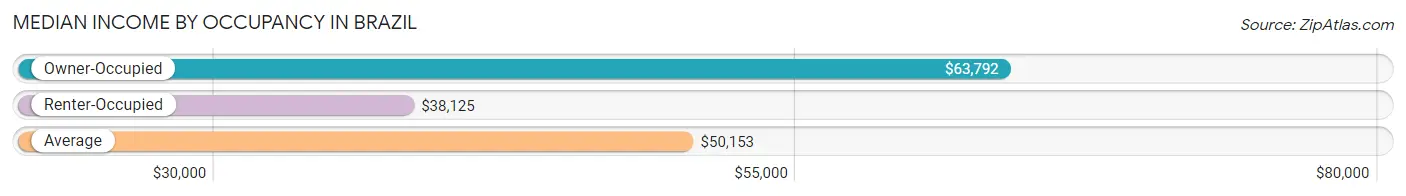
| Occupancy Type | # Households | Median Income |
| Owner-Occupied | 2,141 (64.4%) | $63,792 |
| Renter-Occupied | 1,183 (35.6%) | $38,125 |
| Average | 3,324 (100.0%) | $50,153 |
Occupancy by Householder Income Bracket in Brazil
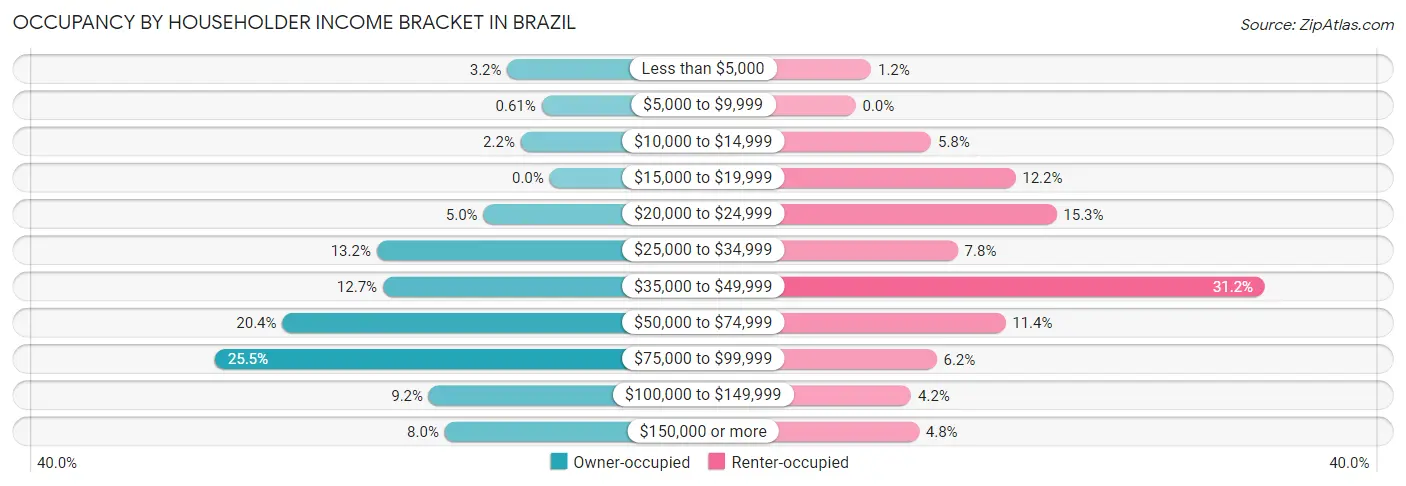
| Income Bracket | Owner-occupied | Renter-occupied |
| Less than $5,000 | 69 (3.2%) | 14 (1.2%) |
| $5,000 to $9,999 | 13 (0.6%) | 0 (0.0%) |
| $10,000 to $14,999 | 47 (2.2%) | 68 (5.8%) |
| $15,000 to $19,999 | 0 (0.0%) | 144 (12.2%) |
| $20,000 to $24,999 | 108 (5.0%) | 181 (15.3%) |
| $25,000 to $34,999 | 282 (13.2%) | 92 (7.8%) |
| $35,000 to $49,999 | 272 (12.7%) | 369 (31.2%) |
| $50,000 to $74,999 | 436 (20.4%) | 135 (11.4%) |
| $75,000 to $99,999 | 546 (25.5%) | 73 (6.2%) |
| $100,000 to $149,999 | 197 (9.2%) | 50 (4.2%) |
| $150,000 or more | 171 (8.0%) | 57 (4.8%) |
| Total | 2,141 (100.0%) | 1,183 (100.0%) |
Monthly Housing Cost Tiers in Brazil
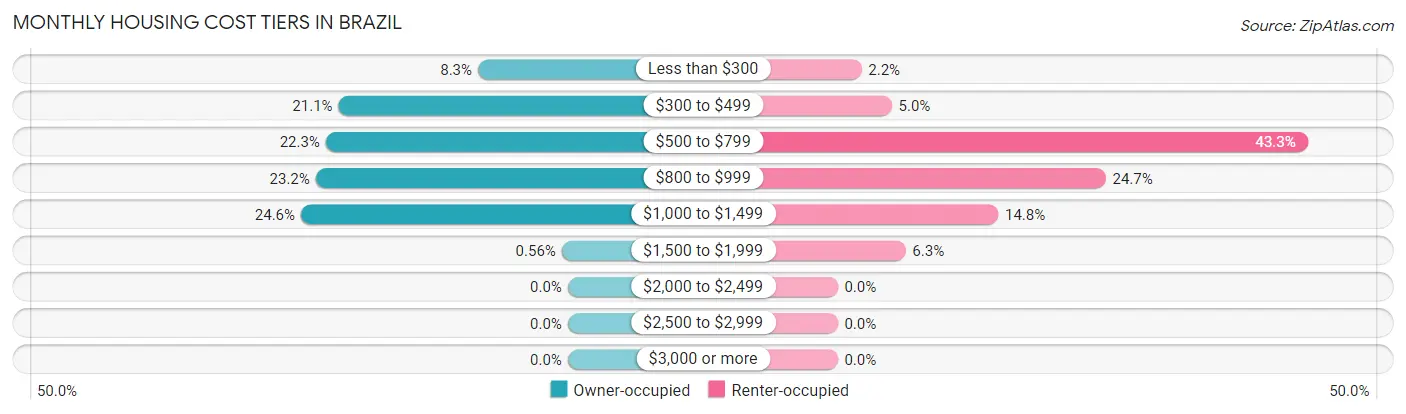
| Monthly Cost | Owner-occupied | Renter-occupied |
| Less than $300 | 177 (8.3%) | 26 (2.2%) |
| $300 to $499 | 452 (21.1%) | 59 (5.0%) |
| $500 to $799 | 477 (22.3%) | 512 (43.3%) |
| $800 to $999 | 497 (23.2%) | 292 (24.7%) |
| $1,000 to $1,499 | 526 (24.6%) | 175 (14.8%) |
| $1,500 to $1,999 | 12 (0.6%) | 74 (6.3%) |
| $2,000 to $2,499 | 0 (0.0%) | 0 (0.0%) |
| $2,500 to $2,999 | 0 (0.0%) | 0 (0.0%) |
| $3,000 or more | 0 (0.0%) | 0 (0.0%) |
| Total | 2,141 (100.0%) | 1,183 (100.0%) |
Physical Housing Characteristics in Brazil
Housing Structures in Brazil
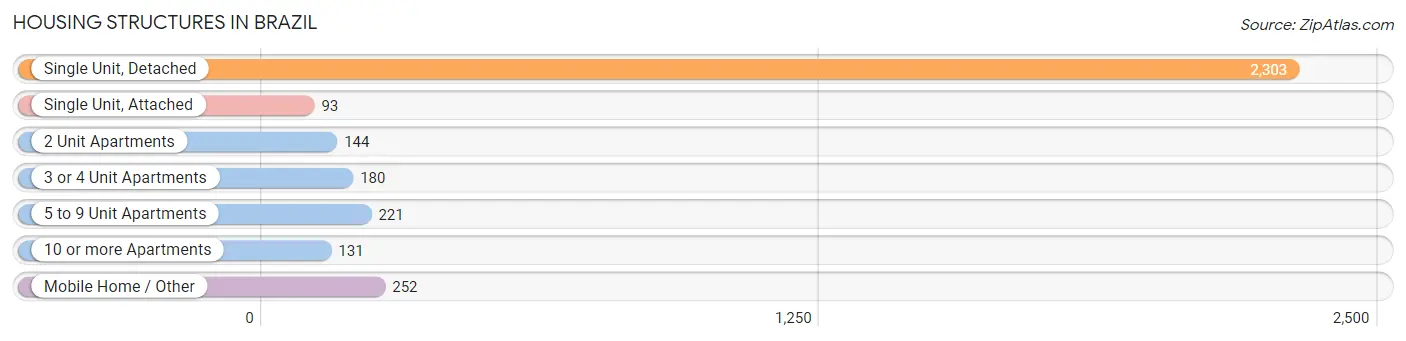
| Structure Type | # Housing Units | % Housing Units |
| Single Unit, Detached | 2,303 | 69.3% |
| Single Unit, Attached | 93 | 2.8% |
| 2 Unit Apartments | 144 | 4.3% |
| 3 or 4 Unit Apartments | 180 | 5.4% |
| 5 to 9 Unit Apartments | 221 | 6.7% |
| 10 or more Apartments | 131 | 3.9% |
| Mobile Home / Other | 252 | 7.6% |
| Total | 3,324 | 100.0% |
Housing Structures by Occupancy in Brazil
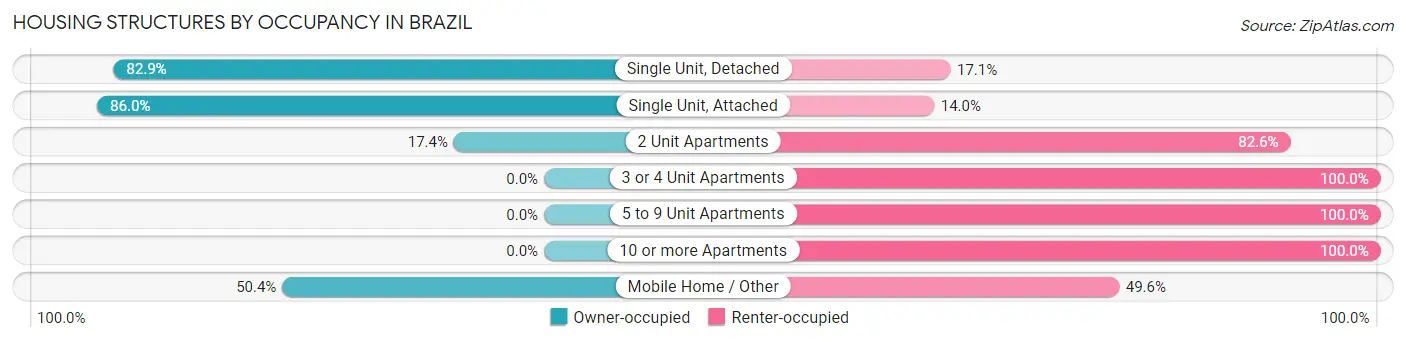
| Structure Type | Owner-occupied | Renter-occupied |
| Single Unit, Detached | 1,909 (82.9%) | 394 (17.1%) |
| Single Unit, Attached | 80 (86.0%) | 13 (14.0%) |
| 2 Unit Apartments | 25 (17.4%) | 119 (82.6%) |
| 3 or 4 Unit Apartments | 0 (0.0%) | 180 (100.0%) |
| 5 to 9 Unit Apartments | 0 (0.0%) | 221 (100.0%) |
| 10 or more Apartments | 0 (0.0%) | 131 (100.0%) |
| Mobile Home / Other | 127 (50.4%) | 125 (49.6%) |
| Total | 2,141 (64.4%) | 1,183 (35.6%) |
Housing Structures by Number of Rooms in Brazil
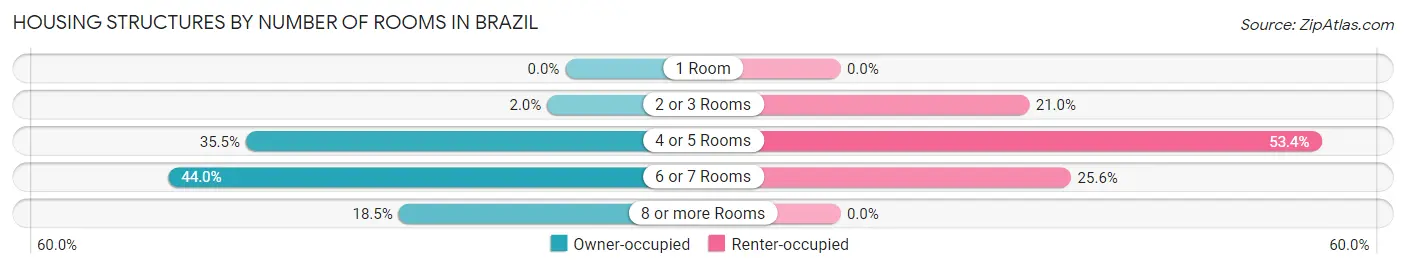
| Number of Rooms | Owner-occupied | Renter-occupied |
| 1 Room | 0 (0.0%) | 0 (0.0%) |
| 2 or 3 Rooms | 43 (2.0%) | 248 (21.0%) |
| 4 or 5 Rooms | 759 (35.4%) | 632 (53.4%) |
| 6 or 7 Rooms | 943 (44.0%) | 303 (25.6%) |
| 8 or more Rooms | 396 (18.5%) | 0 (0.0%) |
| Total | 2,141 (100.0%) | 1,183 (100.0%) |
Housing Structure by Heating Type in Brazil
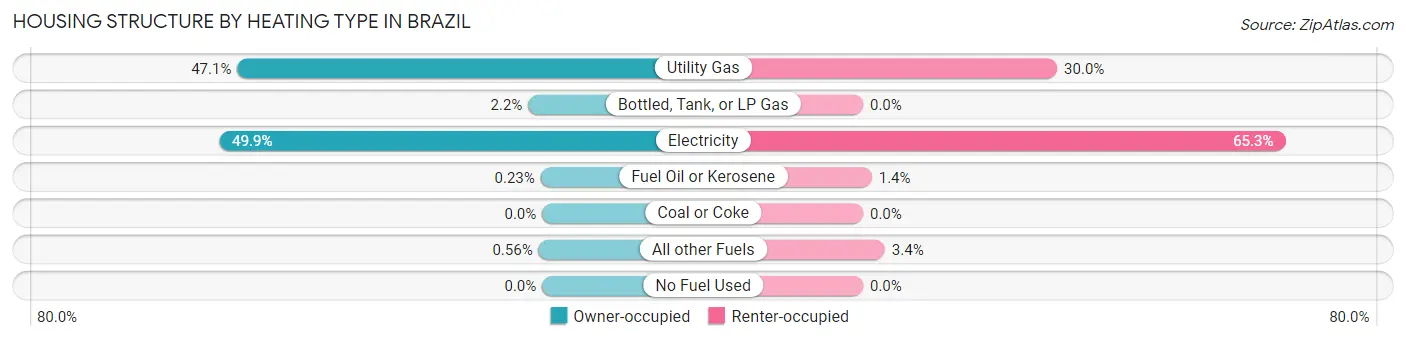
| Heating Type | Owner-occupied | Renter-occupied |
| Utility Gas | 1,009 (47.1%) | 355 (30.0%) |
| Bottled, Tank, or LP Gas | 46 (2.1%) | 0 (0.0%) |
| Electricity | 1,069 (49.9%) | 772 (65.3%) |
| Fuel Oil or Kerosene | 5 (0.2%) | 16 (1.3%) |
| Coal or Coke | 0 (0.0%) | 0 (0.0%) |
| All other Fuels | 12 (0.6%) | 40 (3.4%) |
| No Fuel Used | 0 (0.0%) | 0 (0.0%) |
| Total | 2,141 (100.0%) | 1,183 (100.0%) |
Household Vehicle Usage in Brazil
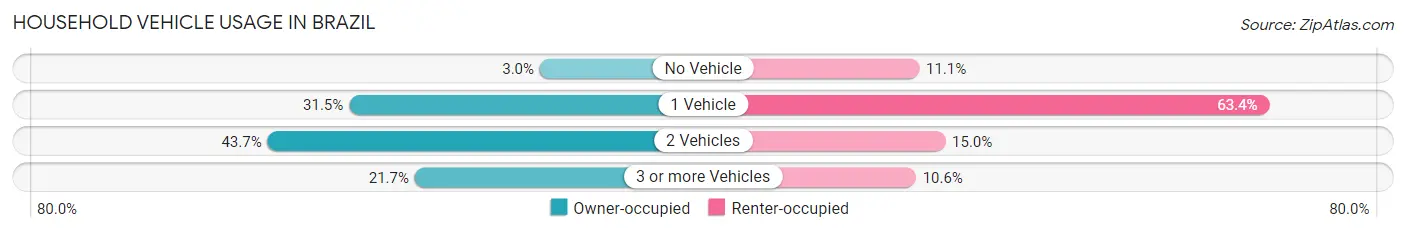
| Vehicles per Household | Owner-occupied | Renter-occupied |
| No Vehicle | 65 (3.0%) | 131 (11.1%) |
| 1 Vehicle | 675 (31.5%) | 750 (63.4%) |
| 2 Vehicles | 936 (43.7%) | 177 (15.0%) |
| 3 or more Vehicles | 465 (21.7%) | 125 (10.6%) |
| Total | 2,141 (100.0%) | 1,183 (100.0%) |
Real Estate & Mortgages in Brazil
Real Estate and Mortgage Overview in Brazil
| Characteristic | Without Mortgage | With Mortgage |
| Housing Units | 851 | 1,290 |
| Median Property Value | $86,100 | $115,500 |
| Median Household Income | $51,215 | $119 |
| Monthly Housing Costs | $398 | $0 |
| Real Estate Taxes | $430 | $117 |
Property Value by Mortgage Status in Brazil
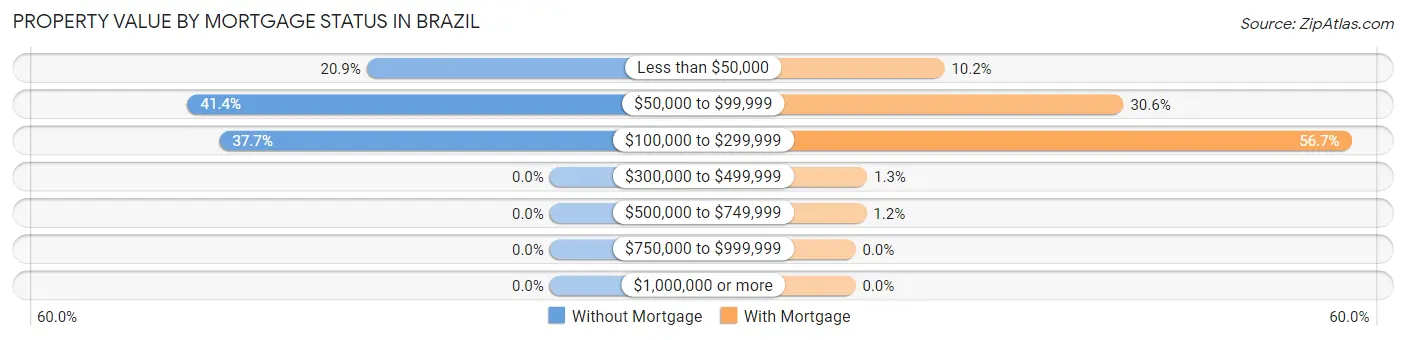
| Property Value | Without Mortgage | With Mortgage |
| Less than $50,000 | 178 (20.9%) | 131 (10.2%) |
| $50,000 to $99,999 | 352 (41.4%) | 395 (30.6%) |
| $100,000 to $299,999 | 321 (37.7%) | 731 (56.7%) |
| $300,000 to $499,999 | 0 (0.0%) | 17 (1.3%) |
| $500,000 to $749,999 | 0 (0.0%) | 16 (1.2%) |
| $750,000 to $999,999 | 0 (0.0%) | 0 (0.0%) |
| $1,000,000 or more | 0 (0.0%) | 0 (0.0%) |
| Total | 851 (100.0%) | 1,290 (100.0%) |
Household Income by Mortgage Status in Brazil
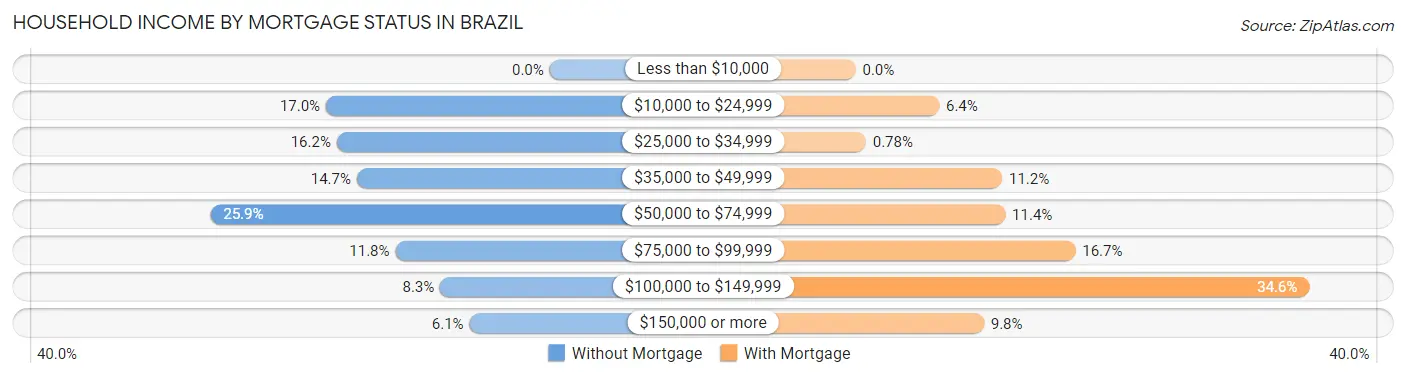
| Household Income | Without Mortgage | With Mortgage |
| Less than $10,000 | 0 (0.0%) | 0 (0.0%) |
| $10,000 to $24,999 | 145 (17.0%) | 82 (6.4%) |
| $25,000 to $34,999 | 138 (16.2%) | 10 (0.8%) |
| $35,000 to $49,999 | 125 (14.7%) | 144 (11.2%) |
| $50,000 to $74,999 | 220 (25.9%) | 147 (11.4%) |
| $75,000 to $99,999 | 100 (11.7%) | 216 (16.7%) |
| $100,000 to $149,999 | 71 (8.3%) | 446 (34.6%) |
| $150,000 or more | 52 (6.1%) | 126 (9.8%) |
| Total | 851 (100.0%) | 1,290 (100.0%) |
Property Value to Household Income Ratio in Brazil
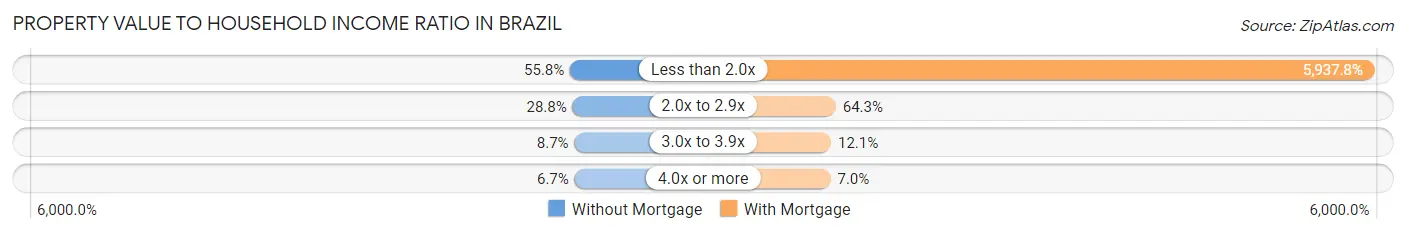
| Value-to-Income Ratio | Without Mortgage | With Mortgage |
| Less than 2.0x | 475 (55.8%) | 76,597 (5,937.7%) |
| 2.0x to 2.9x | 245 (28.8%) | 829 (64.3%) |
| 3.0x to 3.9x | 74 (8.7%) | 156 (12.1%) |
| 4.0x or more | 57 (6.7%) | 90 (7.0%) |
| Total | 851 (100.0%) | 1,290 (100.0%) |
Real Estate Taxes by Mortgage Status in Brazil
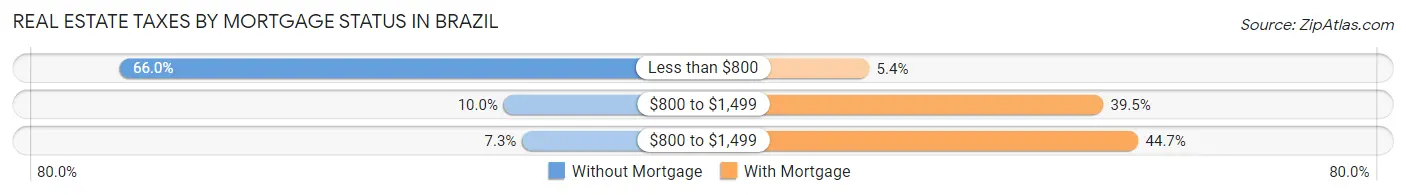
| Property Taxes | Without Mortgage | With Mortgage |
| Less than $800 | 562 (66.0%) | 69 (5.3%) |
| $800 to $1,499 | 85 (10.0%) | 510 (39.5%) |
| $800 to $1,499 | 62 (7.3%) | 576 (44.7%) |
| Total | 851 (100.0%) | 1,290 (100.0%) |
Health & Disability in Brazil
Health Insurance Coverage by Age in Brazil
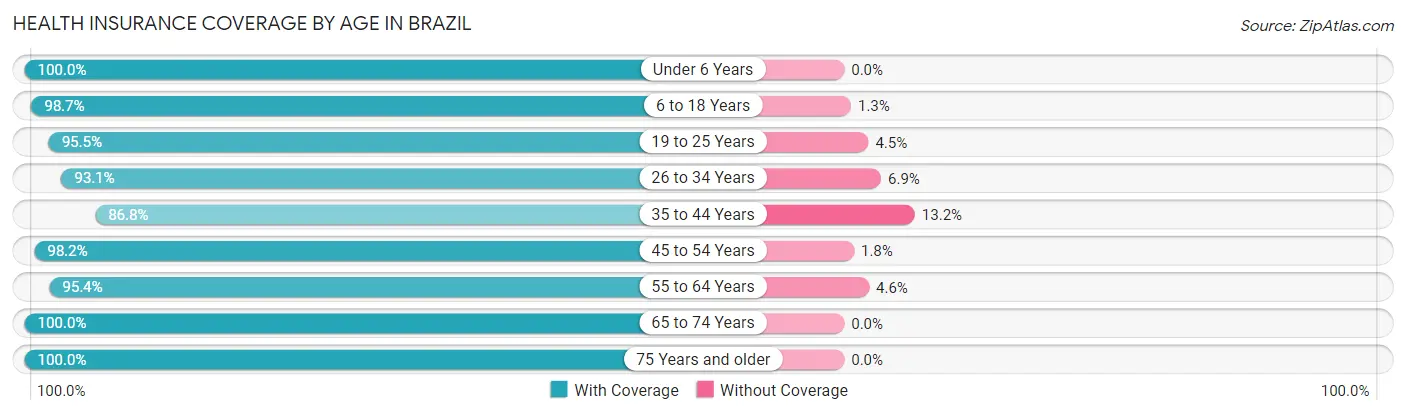
| Age Bracket | With Coverage | Without Coverage |
| Under 6 Years | 558 (100.0%) | 0 (0.0%) |
| 6 to 18 Years | 1,249 (98.7%) | 16 (1.3%) |
| 19 to 25 Years | 550 (95.5%) | 26 (4.5%) |
| 26 to 34 Years | 1,004 (93.1%) | 74 (6.9%) |
| 35 to 44 Years | 758 (86.8%) | 115 (13.2%) |
| 45 to 54 Years | 1,024 (98.2%) | 19 (1.8%) |
| 55 to 64 Years | 930 (95.4%) | 45 (4.6%) |
| 65 to 74 Years | 726 (100.0%) | 0 (0.0%) |
| 75 Years and older | 685 (100.0%) | 0 (0.0%) |
| Total | 7,484 (96.2%) | 295 (3.8%) |
Health Insurance Coverage by Citizenship Status in Brazil
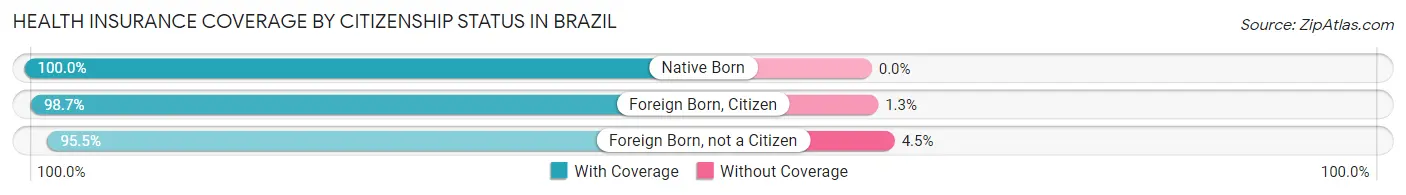
| Citizenship Status | With Coverage | Without Coverage |
| Native Born | 558 (100.0%) | 0 (0.0%) |
| Foreign Born, Citizen | 1,249 (98.7%) | 16 (1.3%) |
| Foreign Born, not a Citizen | 550 (95.5%) | 26 (4.5%) |
Health Insurance Coverage by Household Income in Brazil
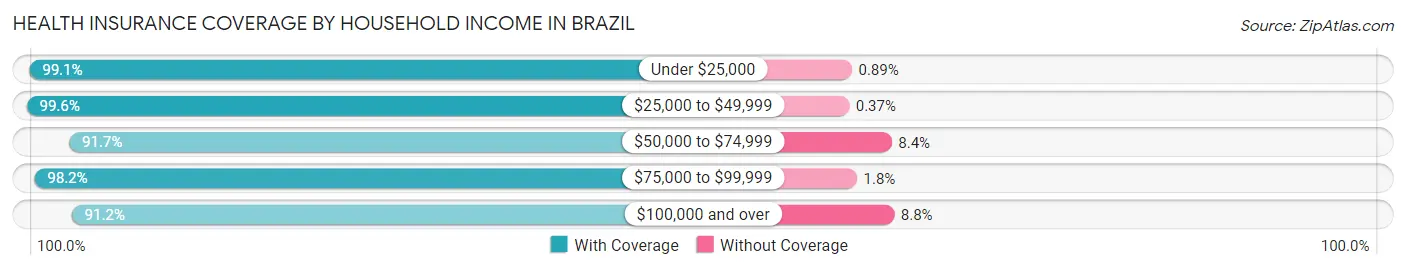
| Household Income | With Coverage | Without Coverage |
| Under $25,000 | 1,330 (99.1%) | 12 (0.9%) |
| $25,000 to $49,999 | 1,897 (99.6%) | 7 (0.4%) |
| $50,000 to $74,999 | 1,394 (91.6%) | 127 (8.4%) |
| $75,000 to $99,999 | 1,611 (98.2%) | 30 (1.8%) |
| $100,000 and over | 1,232 (91.2%) | 119 (8.8%) |
Public vs Private Health Insurance Coverage by Age in Brazil
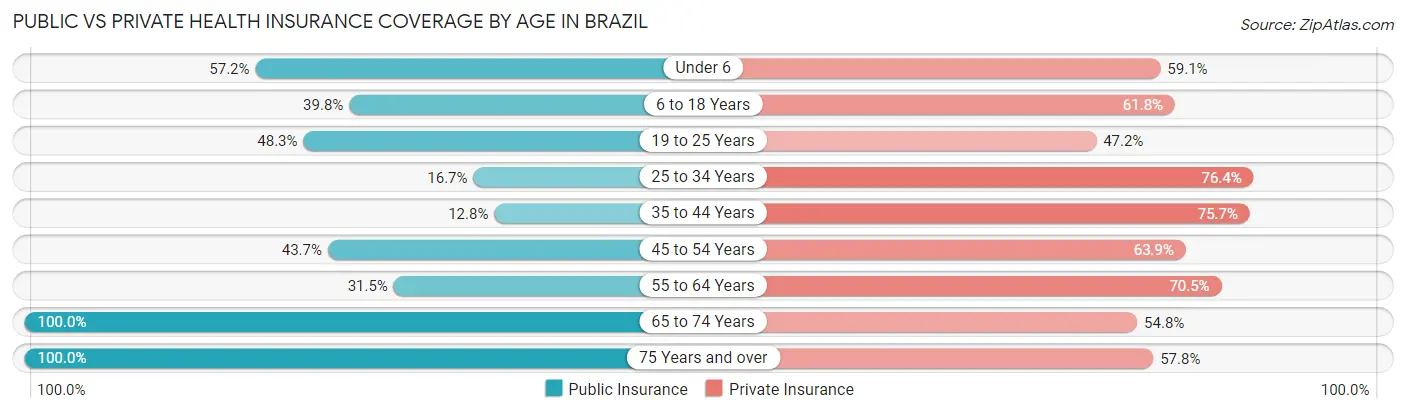
| Age Bracket | Public Insurance | Private Insurance |
| Under 6 | 319 (57.2%) | 330 (59.1%) |
| 6 to 18 Years | 503 (39.8%) | 782 (61.8%) |
| 19 to 25 Years | 278 (48.3%) | 272 (47.2%) |
| 25 to 34 Years | 180 (16.7%) | 824 (76.4%) |
| 35 to 44 Years | 112 (12.8%) | 661 (75.7%) |
| 45 to 54 Years | 456 (43.7%) | 666 (63.8%) |
| 55 to 64 Years | 307 (31.5%) | 687 (70.5%) |
| 65 to 74 Years | 726 (100.0%) | 398 (54.8%) |
| 75 Years and over | 685 (100.0%) | 396 (57.8%) |
| Total | 3,566 (45.8%) | 5,016 (64.5%) |
Disability Status by Sex by Age in Brazil
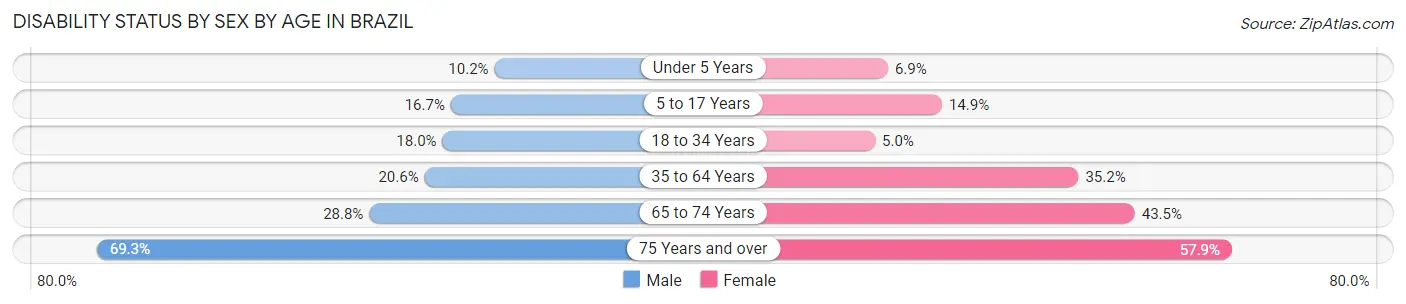
| Age Bracket | Male | Female |
| Under 5 Years | 17 (10.2%) | 24 (6.9%) |
| 5 to 17 Years | 97 (16.7%) | 104 (14.9%) |
| 18 to 34 Years | 146 (18.0%) | 43 (5.0%) |
| 35 to 64 Years | 324 (20.6%) | 464 (35.1%) |
| 65 to 74 Years | 96 (28.8%) | 171 (43.5%) |
| 75 Years and over | 142 (69.3%) | 278 (57.9%) |
Disability Class by Sex by Age in Brazil
Disability Class: Hearing Difficulty
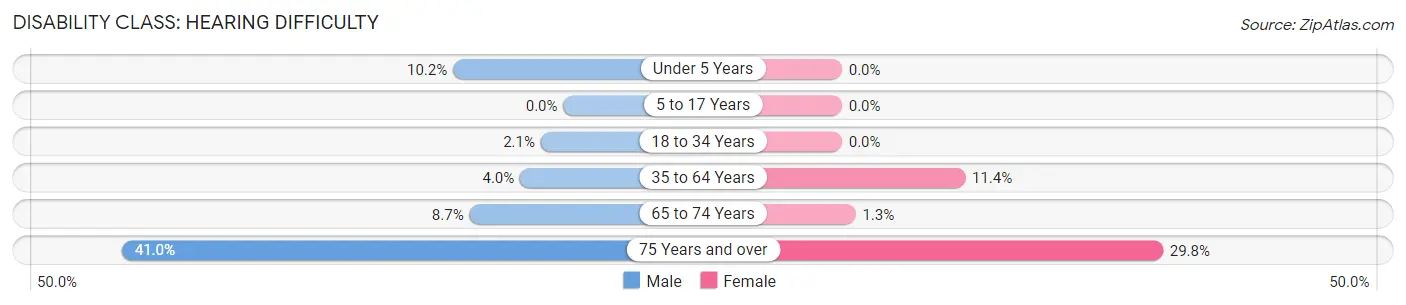
| Age Bracket | Male | Female |
| Under 5 Years | 17 (10.2%) | 0 (0.0%) |
| 5 to 17 Years | 0 (0.0%) | 0 (0.0%) |
| 18 to 34 Years | 17 (2.1%) | 0 (0.0%) |
| 35 to 64 Years | 63 (4.0%) | 151 (11.4%) |
| 65 to 74 Years | 29 (8.7%) | 5 (1.3%) |
| 75 Years and over | 84 (41.0%) | 143 (29.8%) |
Disability Class: Vision Difficulty
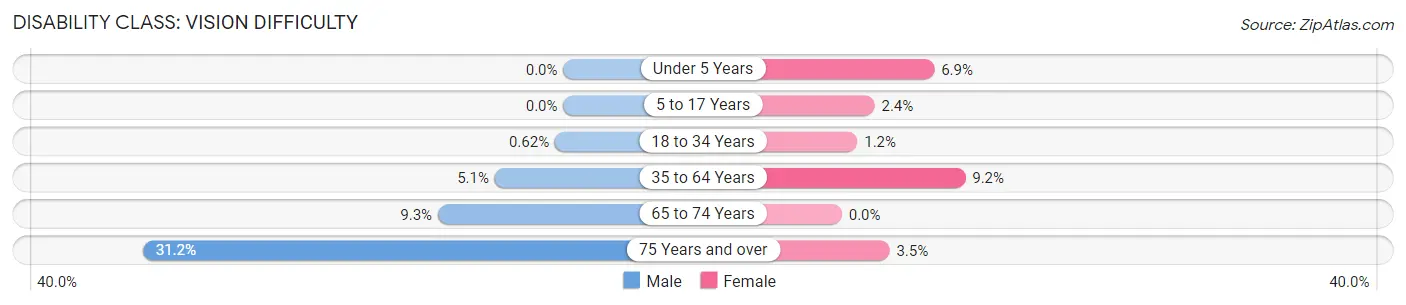
| Age Bracket | Male | Female |
| Under 5 Years | 0 (0.0%) | 24 (6.9%) |
| 5 to 17 Years | 0 (0.0%) | 17 (2.4%) |
| 18 to 34 Years | 5 (0.6%) | 10 (1.1%) |
| 35 to 64 Years | 80 (5.1%) | 121 (9.2%) |
| 65 to 74 Years | 31 (9.3%) | 0 (0.0%) |
| 75 Years and over | 64 (31.2%) | 17 (3.5%) |
Disability Class: Cognitive Difficulty
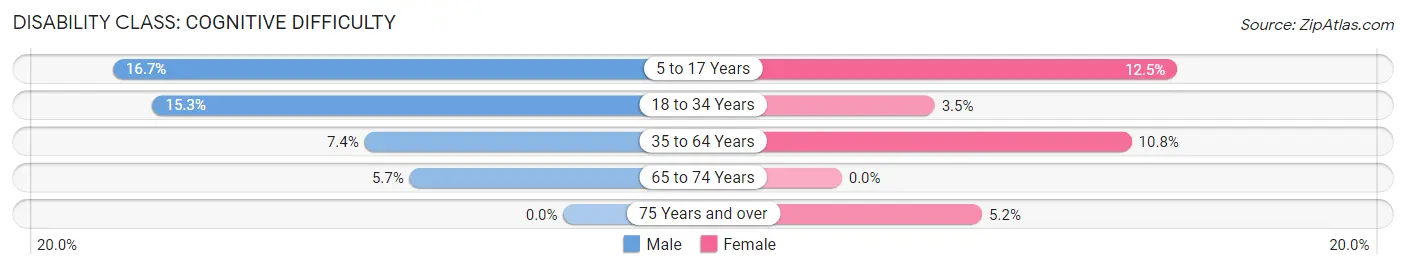
| Age Bracket | Male | Female |
| 5 to 17 Years | 97 (16.7%) | 87 (12.4%) |
| 18 to 34 Years | 124 (15.2%) | 30 (3.5%) |
| 35 to 64 Years | 116 (7.4%) | 142 (10.8%) |
| 65 to 74 Years | 19 (5.7%) | 0 (0.0%) |
| 75 Years and over | 0 (0.0%) | 25 (5.2%) |
Disability Class: Ambulatory Difficulty
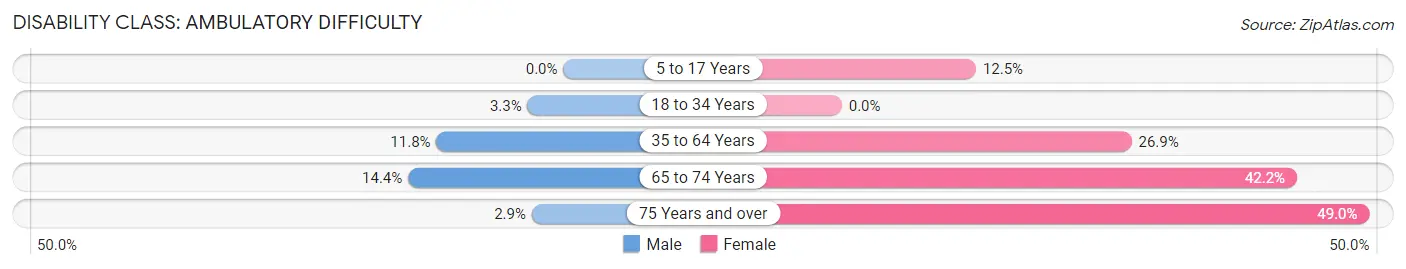
| Age Bracket | Male | Female |
| 5 to 17 Years | 0 (0.0%) | 87 (12.4%) |
| 18 to 34 Years | 27 (3.3%) | 0 (0.0%) |
| 35 to 64 Years | 185 (11.8%) | 355 (26.9%) |
| 65 to 74 Years | 48 (14.4%) | 166 (42.2%) |
| 75 Years and over | 6 (2.9%) | 235 (49.0%) |
Disability Class: Self-Care Difficulty
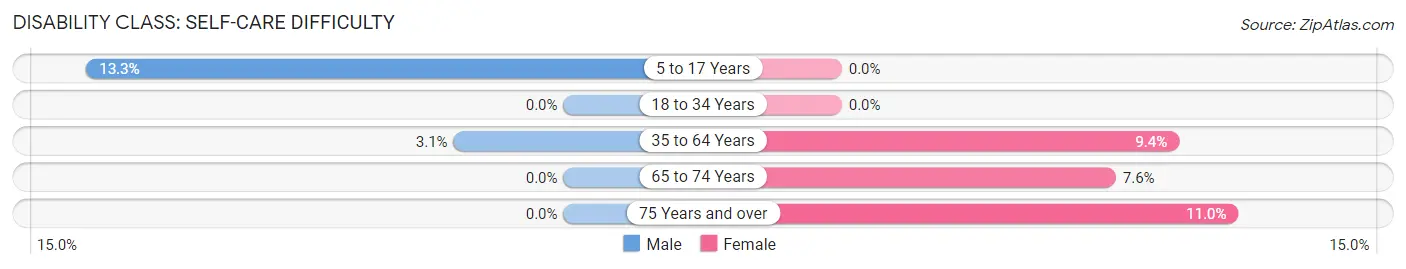
| Age Bracket | Male | Female |
| 5 to 17 Years | 77 (13.3%) | 0 (0.0%) |
| 18 to 34 Years | 0 (0.0%) | 0 (0.0%) |
| 35 to 64 Years | 48 (3.1%) | 124 (9.4%) |
| 65 to 74 Years | 0 (0.0%) | 30 (7.6%) |
| 75 Years and over | 0 (0.0%) | 53 (11.0%) |
Technology Access in Brazil
Computing Device Access in Brazil
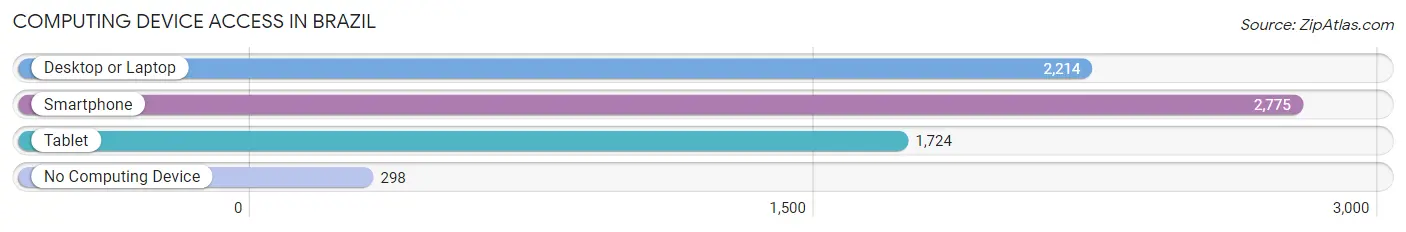
| Device Type | # Households | % Households |
| Desktop or Laptop | 2,214 | 66.6% |
| Smartphone | 2,775 | 83.5% |
| Tablet | 1,724 | 51.9% |
| No Computing Device | 298 | 9.0% |
| Total | 3,324 | 100.0% |
Internet Access in Brazil
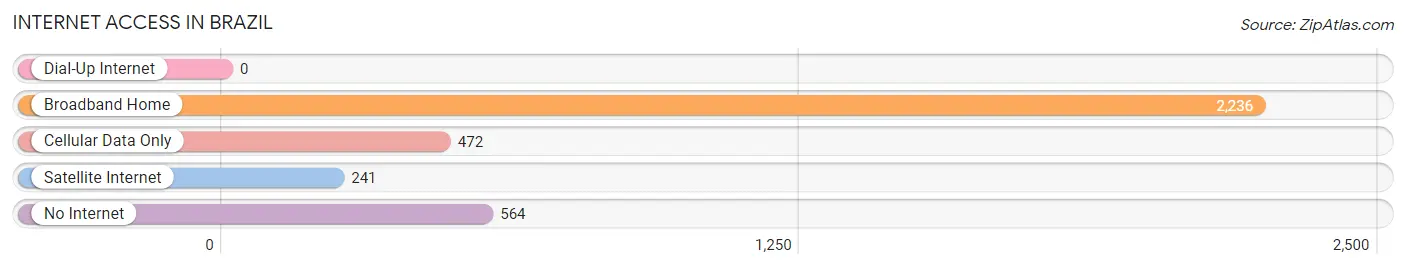
| Internet Type | # Households | % Households |
| Dial-Up Internet | 0 | 0.0% |
| Broadband Home | 2,236 | 67.3% |
| Cellular Data Only | 472 | 14.2% |
| Satellite Internet | 241 | 7.2% |
| No Internet | 564 | 17.0% |
| Total | 3,324 | 100.0% |
Brazil Summary
Brazil is the largest country in South America and the fifth largest country in the world. It is bordered by the Atlantic Ocean to the east, Venezuela, Guyana, Suriname, and French Guiana to the north, Colombia to the northwest, Bolivia and Peru to the west, and Argentina and Paraguay to the south. Brazil is the only Portuguese-speaking country in the Americas and the largest Portuguese-speaking country in the world.
Geography
Brazil is the fifth largest country in the world, covering an area of 8,515,767 square kilometers. It is the largest country in South America and the only Portuguese-speaking country in the Americas. Brazil is divided into five regions: North, Northeast, Central-West, Southeast, and South. The country is home to the Amazon Rainforest, the world’s largest tropical rainforest, which covers more than half of the country. Brazil also has a large coastline, with more than 7,400 kilometers of coastline along the Atlantic Ocean.
The country is home to a variety of landscapes, including mountains, plains, and plateaus. The highest point in Brazil is Pico da Neblina, which is located in the Amazon Rainforest and is 2,994 meters above sea level. The lowest point is the Atlantic Ocean, which is at sea level.
Economy
Brazil has a mixed economy, with both private and public sectors. The country is the largest economy in South America and the ninth largest economy in the world. The country’s main exports include soybeans, iron ore, coffee, and sugar. Brazil is also a major producer of oil and natural gas.
The country’s main industries include agriculture, mining, manufacturing, and services. The agricultural sector is the largest employer in the country, accounting for more than 25% of the workforce. The manufacturing sector is the second largest employer, accounting for more than 20% of the workforce.
Demographics
Brazil has a population of more than 209 million people, making it the sixth most populous country in the world. The population is made up of a variety of ethnic groups, including European, African, and Indigenous. The majority of the population is of European descent, with more than 50% of the population being of Portuguese descent.
The official language of Brazil is Portuguese, and it is spoken by more than 90% of the population. Other languages spoken in the country include Spanish, English, German, and French. The majority of the population is Roman Catholic, with more than 65% of the population identifying as Catholic.
Conclusion
Brazil is the largest country in South America and the fifth largest country in the world. It is bordered by the Atlantic Ocean to the east, Venezuela, Guyana, Suriname, and French Guiana to the north, Colombia to the northwest, Bolivia and Peru to the west, and Argentina and Paraguay to the south. Brazil is the only Portuguese-speaking country in the Americas and the largest Portuguese-speaking country in the world. The country has a mixed economy, with both private and public sectors. The population is made up of a variety of ethnic groups, with the majority of the population being of European descent. The official language of Brazil is Portuguese, and it is spoken by more than 90% of the population. The majority of the population is Roman Catholic, with more than 65% of the population identifying as Catholic.
Common Questions
What is Per Capita Income in Brazil?
Per Capita income in Brazil is $27,358.
What is the Median Family Income in Brazil?
Median Family Income in Brazil is $61,361.
What is the Median Household income in Brazil?
Median Household Income in Brazil is $50,153.
What is Income or Wage Gap in Brazil?
Income or Wage Gap in Brazil is 43.5%.
Women in Brazil earn 56.5 cents for every dollar earned by a man.
What is Family Income Deficit in Brazil?
Family Income Deficit in Brazil is $11,745.
Families that are below poverty line in Brazil earn $11,745 less on average than the poverty threshold level.
What is Inequality or Gini Index in Brazil?
Inequality or Gini Index in Brazil is 0.43.
What is the Total Population of Brazil?
Total Population of Brazil is 8,114.
What is the Total Male Population of Brazil?
Total Male Population of Brazil is 3,911.
What is the Total Female Population of Brazil?
Total Female Population of Brazil is 4,203.
What is the Ratio of Males per 100 Females in Brazil?
There are 93.05 Males per 100 Females in Brazil.
What is the Ratio of Females per 100 Males in Brazil?
There are 107.47 Females per 100 Males in Brazil.
What is the Median Population Age in Brazil?
Median Population Age in Brazil is 40.2 Years.
What is the Average Family Size in Brazil
Average Family Size in Brazil is 2.8 People.
What is the Average Household Size in Brazil
Average Household Size in Brazil is 2.3 People.
How Large is the Labor Force in Brazil?
There are 3,277 People in the Labor Forcein in Brazil.
What is the Percentage of People in the Labor Force in Brazil?
50.5% of People are in the Labor Force in Brazil.
What is the Unemployment Rate in Brazil?
Unemployment Rate in Brazil is 6.3%.